Embed Size (px)
Citation preview
Prepared for the Foundation of the American College of Healthcare Executives
Session 59 Energy Initiatives: Improving
Bottom Lines and Communities
Presented by: Walt Vernon Cindy T. Nuesslein, FACHE

1
Energy Initiatives: Improving Bottom Lines and Communities
Disclosure of RelevantFinancial RelationshipsThe following faculty of this continuing education activity has no relevant financial relationships with commercial interests to disclose:
Cindy Nuesslein
Walt Vernon
2
2
Faculty
Cindy Nuesslein, RN, MBA, FACHE
Walt Vernon, PE, LEED AP, EDAC, FASHE, MBA
3
Learning Objectives
• The learner will be able to describe the steps for creating a culture of energy sustainability and the key components to a comprehensive process.
• The learner will be able to describe at least three energy financing methods including articulating the pros and cons of each.
4
3
Agenda• Participant Poll
• Climate Change Law
• Why Focus on Energy?
• Climate Change – Just the Facts
• Creating a Culture of Sustainability
• Energy Behavior
• Financing Methods
• Energy Procurement
• Emerging Energy Technologies
• Renewables
• Energy Resources
5

4

5
Climate Change LawClimate
Change Law
9
How to avoid missteps and use it to your advantage
CLIMATE CHANGE LAW 10

6
Agenda
CLIMATE CHANGE LAW 11
CLIMATE CHANGE LAW
We need to be VAGUELY aware of international agreements.
12
7
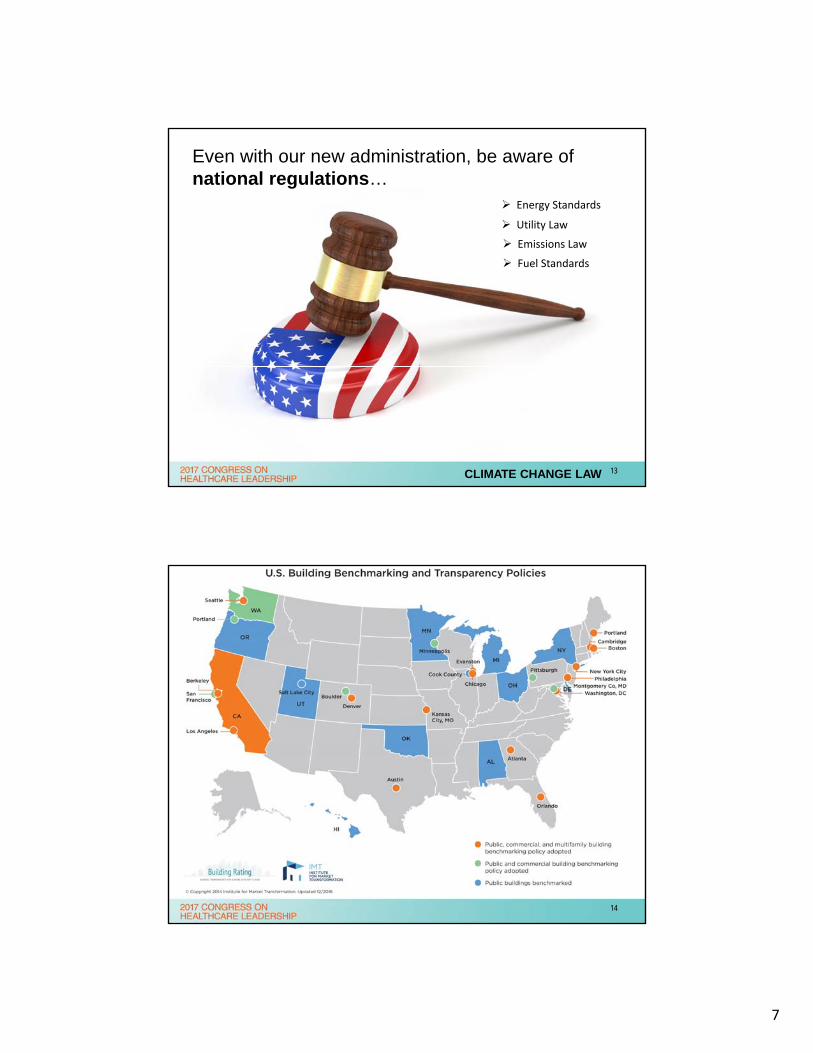
Even with our new administration, be aware of national regulations…
CLIMATE CHANGE LAW
Energy Standards
Utility Law
Emissions Law
Fuel Standards
13
14

8
Take advantage of regional agreements where they help.
CLIMATE CHANGE LAW 15
State action is where opportunities lie…
CLIMATE CHANGE LAW 16
9
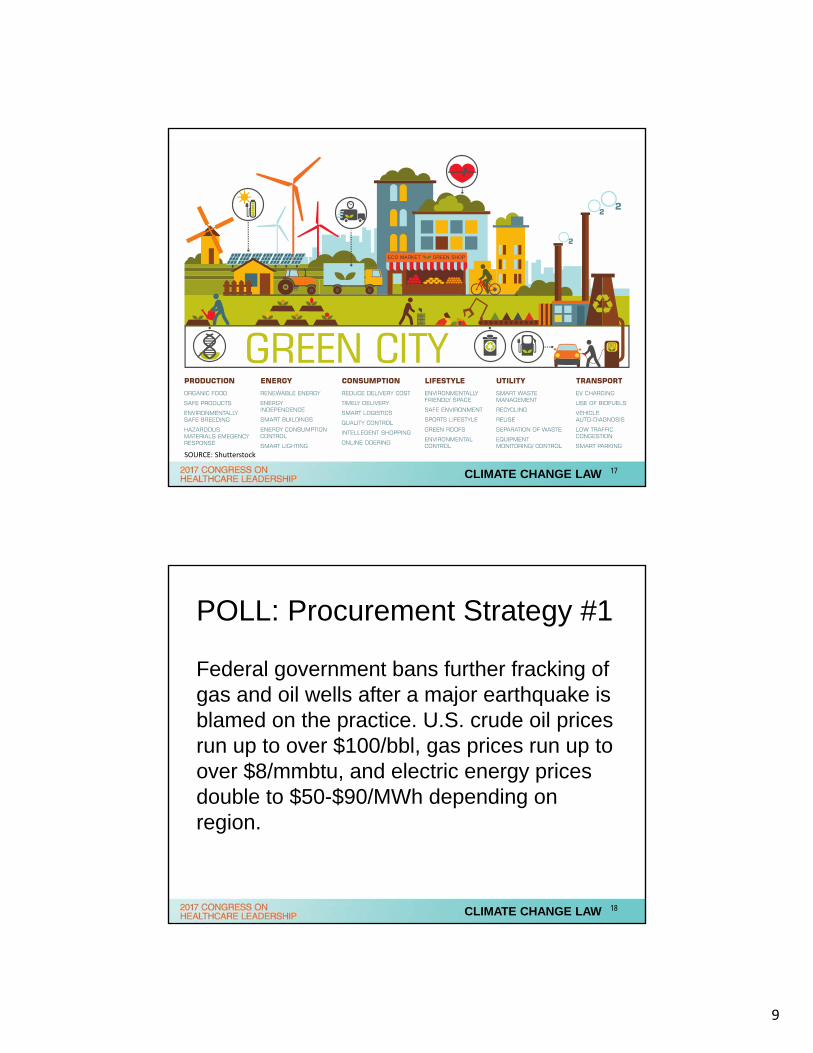
Cities taking the lead
CLIMATE CHANGE LAW
SOURCE: Shutterstock
17
POLL: Procurement Strategy #1
Federal government bans further fracking of gas and oil wells after a major earthquake is blamed on the practice. U.S. crude oil prices run up to over $100/bbl, gas prices run up to over $8/mmbtu, and electric energy prices double to $50-$90/MWh depending on region.
CLIMATE CHANGE LAW 18
10
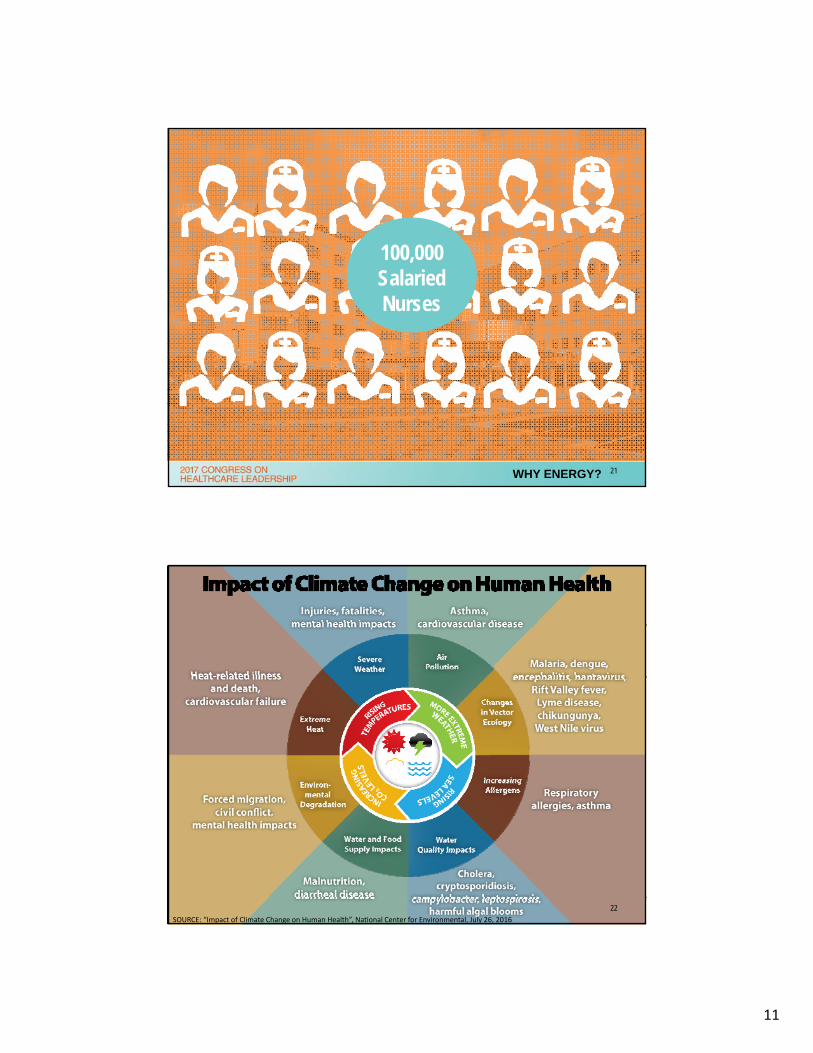
Why Focus on Energy?
19
$8 BILLION
WHY ENERGY? 20
11
100,000 Salaried Nurses
WHY ENERGY? 21
SOURCE: “Impact of Climate Change on Human Health”, National Center for Environmental, July 26, 2016
22

12
WHY ENERGY? 23
Conserves fiscal resourcesWHY ENERGY? 24

13
WHY ENERGY? 25
Respects natural resourcesWHY ENERGY? 26

14
Resiliency
&
Adaptation
WHY ENERGY? 27
WHY ENERGY?
Improve brand image &
reputation
28

15
Increase employee satisfaction and retention
WHY ENERGY? 29
Manage risk and regulatory compliance
WHY ENERGY? 30
16
Improve facility operations and pursue performance excellence
WHY ENERGY? 31
Demonstrate corporate social
responsibility
WHY ENERGY? 32
17
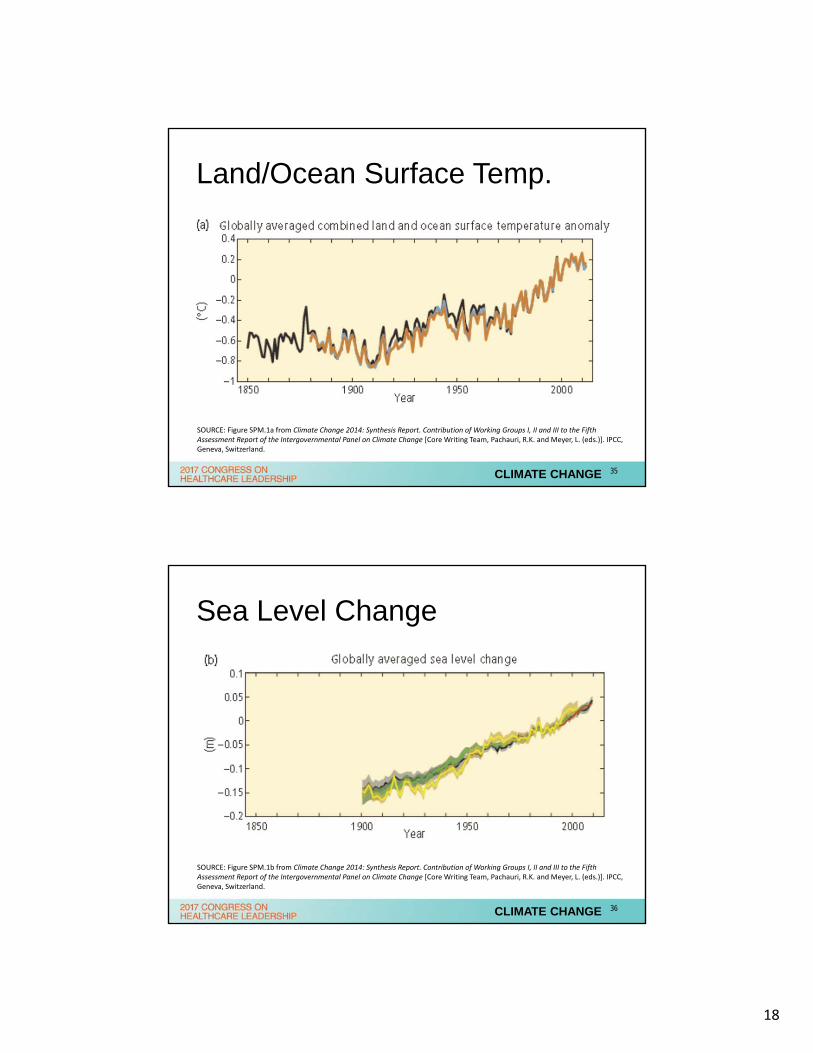
Climate Change – Just the Facts
33
CLIMATE CHANGE
Video Credits: Scientific Visualization Studio/Goddard Space Flight Center
34
18
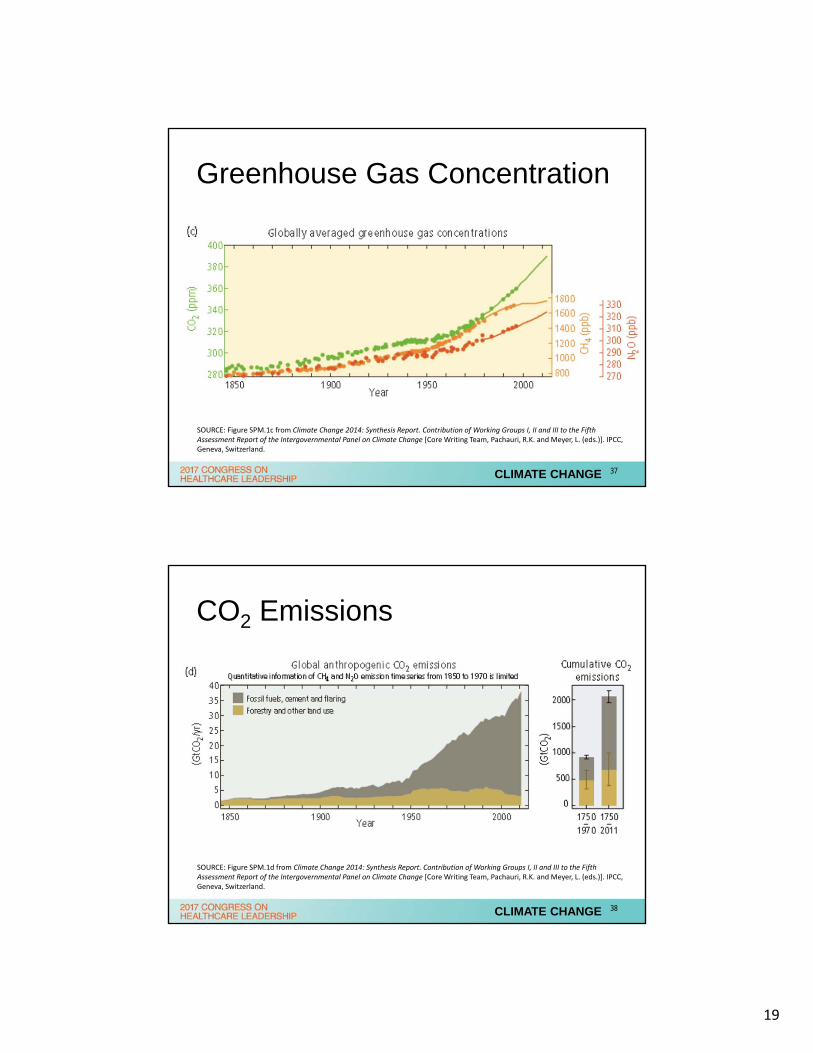
Land/Ocean Surface Temp.
CLIMATE CHANGE
SOURCE: Figure SPM.1a from Climate Change 2014: Synthesis Report. Contribution of Working Groups I, II and III to the Fifth Assessment Report of the Intergovernmental Panel on Climate Change [Core Writing Team, Pachauri, R.K. and Meyer, L. (eds.)]. IPCC, Geneva, Switzerland.
35
Sea Level Change
CLIMATE CHANGE
SOURCE: Figure SPM.1b from Climate Change 2014: Synthesis Report. Contribution of Working Groups I, II and III to the Fifth Assessment Report of the Intergovernmental Panel on Climate Change [Core Writing Team, Pachauri, R.K. and Meyer, L. (eds.)]. IPCC, Geneva, Switzerland.
36
19
Greenhouse Gas Concentration
CLIMATE CHANGE
SOURCE: Figure SPM.1c from Climate Change 2014: Synthesis Report. Contribution of Working Groups I, II and III to the Fifth Assessment Report of the Intergovernmental Panel on Climate Change [Core Writing Team, Pachauri, R.K. and Meyer, L. (eds.)]. IPCC, Geneva, Switzerland.
37
CO2 Emissions
CLIMATE CHANGE
SOURCE: Figure SPM.1d from Climate Change 2014: Synthesis Report. Contribution of Working Groups I, II and III to the Fifth Assessment Report of the Intergovernmental Panel on Climate Change [Core Writing Team, Pachauri, R.K. and Meyer, L. (eds.)]. IPCC, Geneva, Switzerland.
38
20
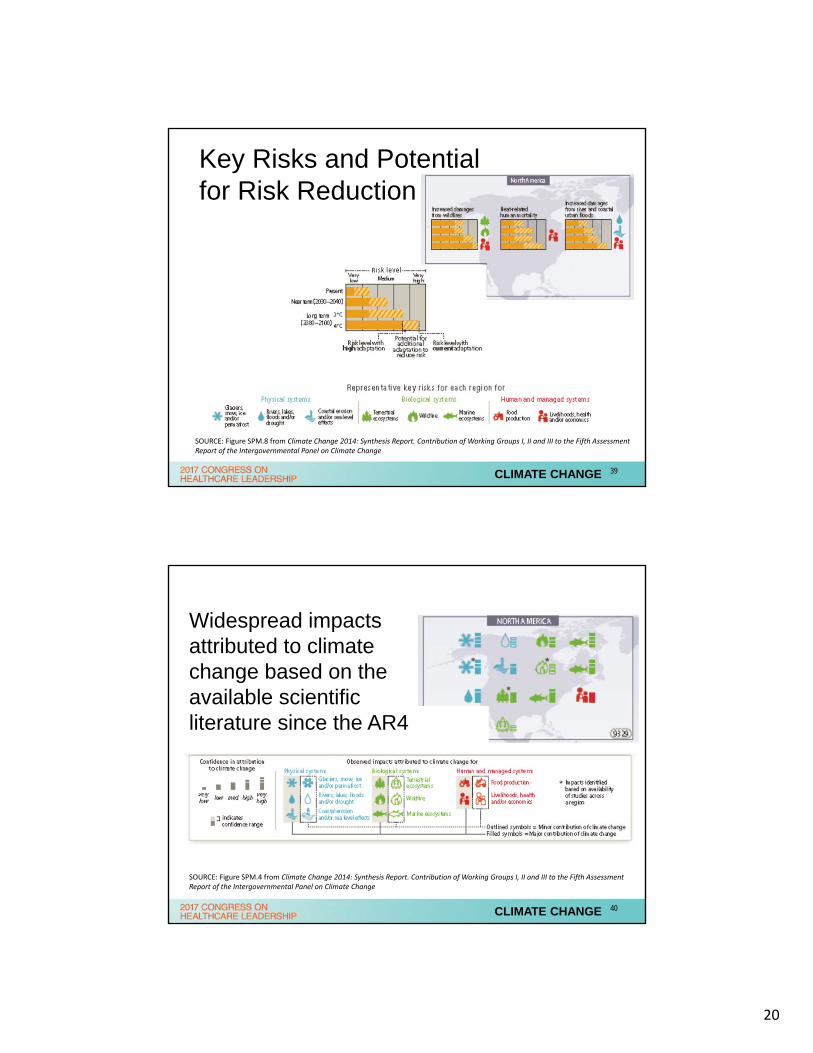
Key Risks and Potential for Risk Reduction
CLIMATE CHANGE
SOURCE: Figure SPM.8 from Climate Change 2014: Synthesis Report. Contribution of Working Groups I, II and III to the Fifth Assessment Report of the Intergovernmental Panel on Climate Change
39
CLIMATE CHANGE
SOURCE: Figure SPM.4 from Climate Change 2014: Synthesis Report. Contribution of Working Groups I, II and III to the Fifth Assessment Report of the Intergovernmental Panel on Climate Change
Widespread impacts attributed to climate change based on the available scientific literature since the AR4
40
21
CLIMATE CHANGE
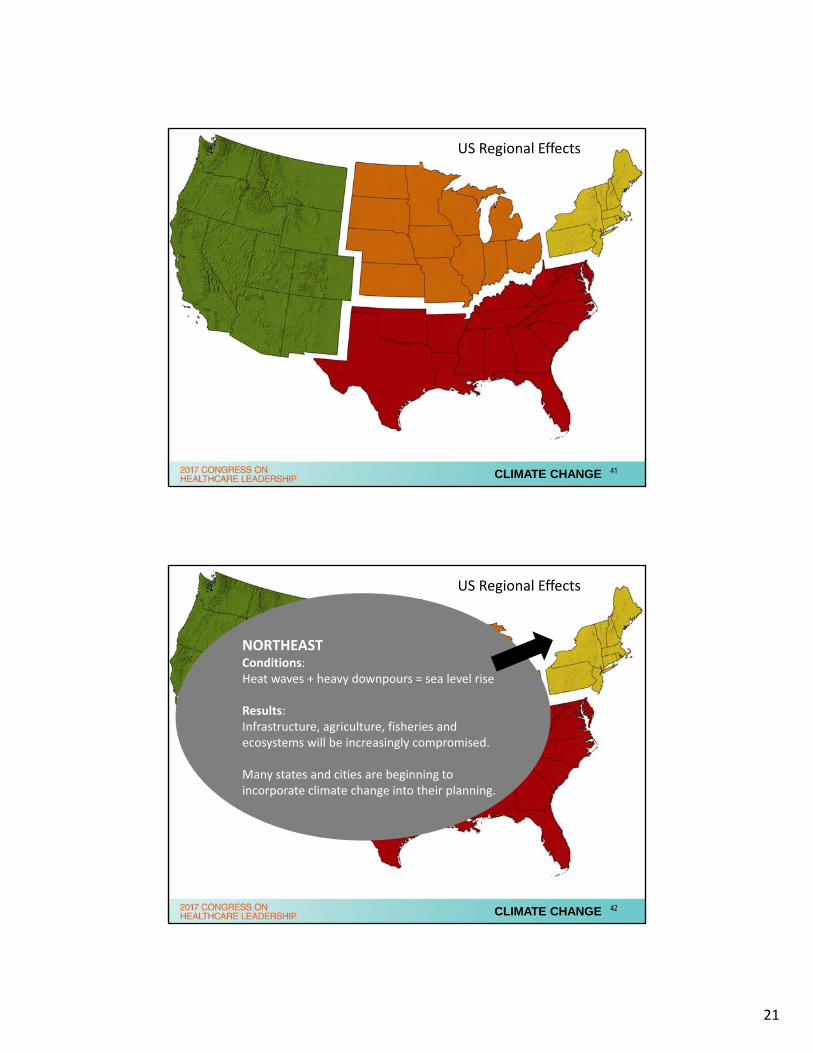
US Regional Effects
41
CLIMATE CHANGE
US Regional Effects
NORTHEASTConditions:Heat waves + heavy downpours = sea level rise
Results: Infrastructure, agriculture, fisheries and ecosystems will be increasingly compromised.
Many states and cities are beginning to incorporate climate change into their planning.
42
22
CLIMATE CHANGE
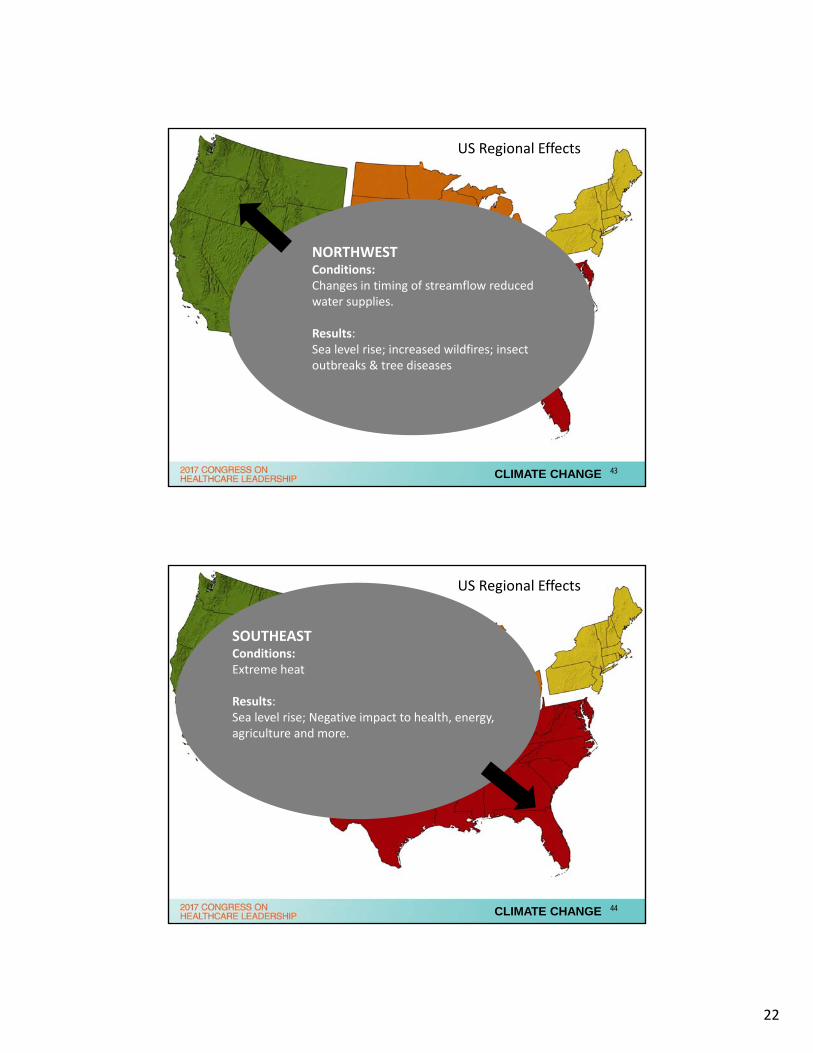
US Regional Effects
NORTHWESTConditions:Changes in timing of streamflow reduced water supplies.
Results: Sea level rise; increased wildfires; insect outbreaks & tree diseases
43
CLIMATE CHANGE
US Regional Effects
SOUTHEASTConditions:Extreme heat
Results: Sea level rise; Negative impact to health, energy, agriculture and more.
44
23
CLIMATE CHANGE
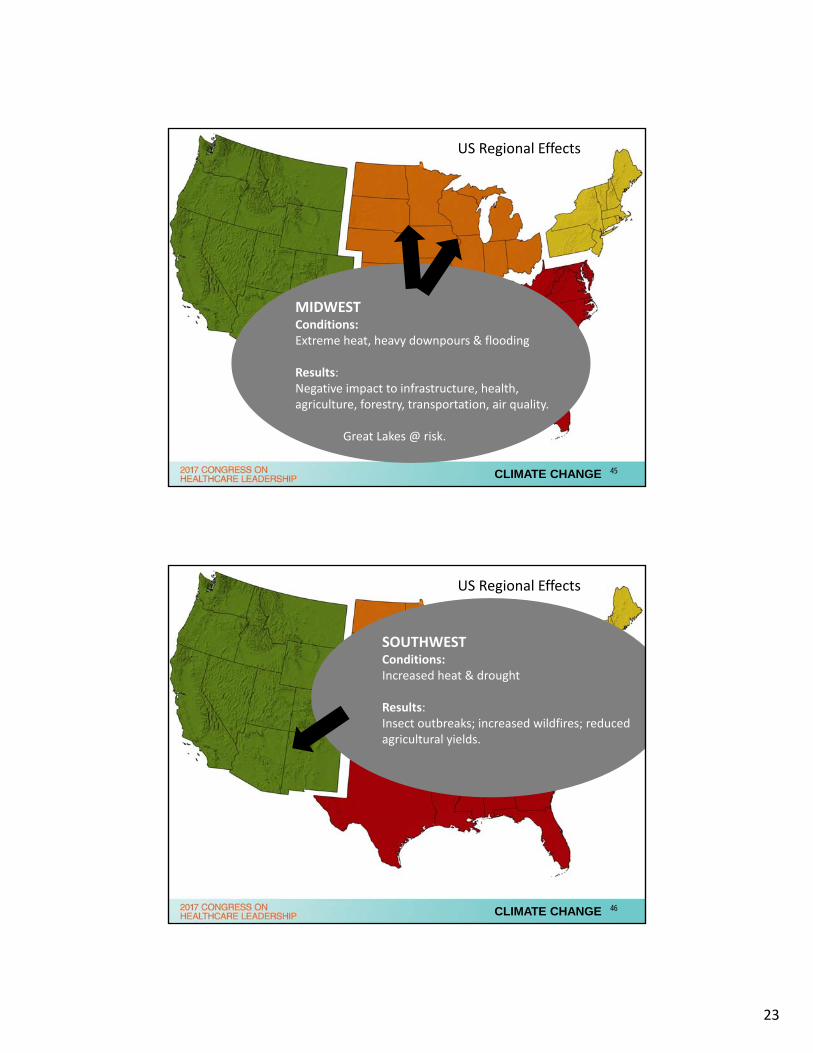
US Regional Effects
MIDWESTConditions:Extreme heat, heavy downpours & flooding
Results: Negative impact to infrastructure, health, agriculture, forestry, transportation, air quality.
Great Lakes @ risk.
45
CLIMATE CHANGE
US Regional Effects
SOUTHWESTConditions:Increased heat & drought
Results: Insect outbreaks; increased wildfires; reduced agricultural yields.
46
24
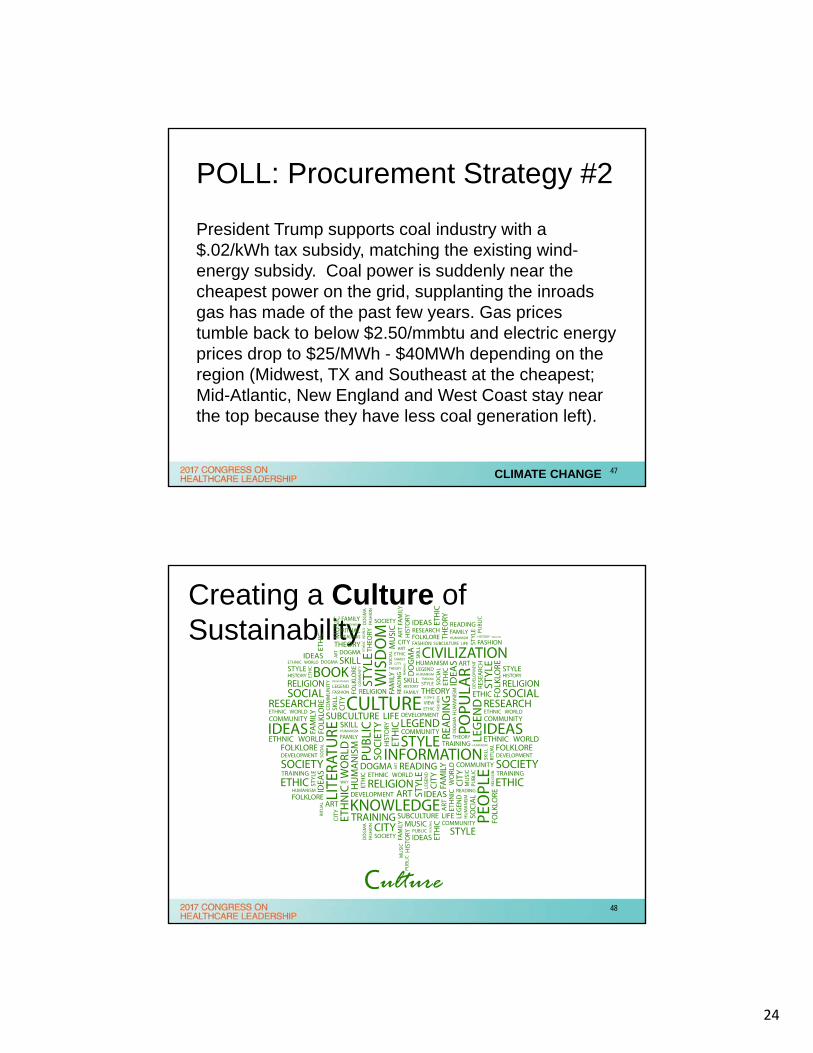
POLL: Procurement Strategy #2
President Trump supports coal industry with a $.02/kWh tax subsidy, matching the existing wind-energy subsidy. Coal power is suddenly near the cheapest power on the grid, supplanting the inroads gas has made of the past few years. Gas prices tumble back to below $2.50/mmbtu and electric energy prices drop to $25/MWh - $40MWh depending on the region (Midwest, TX and Southeast at the cheapest; Mid-Atlantic, New England and West Coast stay near the top because they have less coal generation left).
CLIMATE CHANGE 47
Creating a Culture of Sustainability
48

25
‐ Peter Drucker
CREATING A CULTURE OF SUSTAINABILITY 49
Commitment
CREATING A CULTURE OF SUSTAINABILITY 50

26
Comprehensive Organization Assessment
CREATING A CULTURE OF SUSTAINABILITY 51
Written Plan
CREATING A CULTURE OF SUSTAINABILITY 52
27
Designated CapitalCREATING A CULTURE OF SUSTAINABILITY 53
Creating a Culture of Sustainability
Monitor, Measure, Verify
CREATING A CULTURE OF SUSTAINABILITY 54
28
CREATING A CULTURE OF SUSTAINABILITY 55
Energy Champion
CREATING A CULTURE OF SUSTAINABILITY 56
29
Encourage Innovation
CREATING A CULTURE OF SUSTAINABILITY 57
Celebrate SuccessCREATING A CULTURE OF SUSTAINABILITY 58
30
CREATING A CULTURE OF SUSTAINABILITY 59
POLL: Procurement Strategy #3
Federal government approves several more LNG export terminals and provides tax subsidies to encourage more exports. No near-term impact to prices, but gas futures for 2020 delivery and beyond move up to $4/mmbtu (from $3 currently) and electric futures move to $40 - $70/MWh (from $30 -$45 currently) depending on region.
CREATING A CULTURE OF SUSTAINABILITY 60
31
ENERGY BEHAVIOR
61
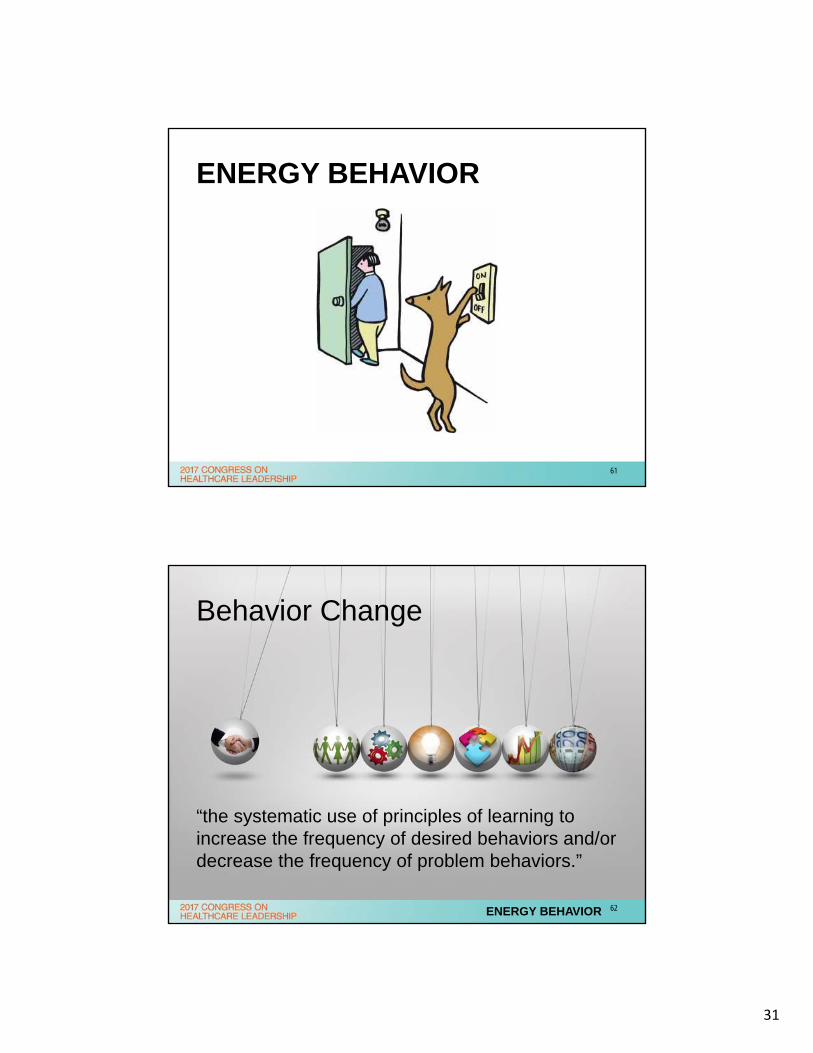
Behavior Change
“the systematic use of principles of learning to increase the frequency of desired behaviors and/or decrease the frequency of problem behaviors.”
ENERGY BEHAVIOR 62
32
ENERGY BEHAVIOR 63
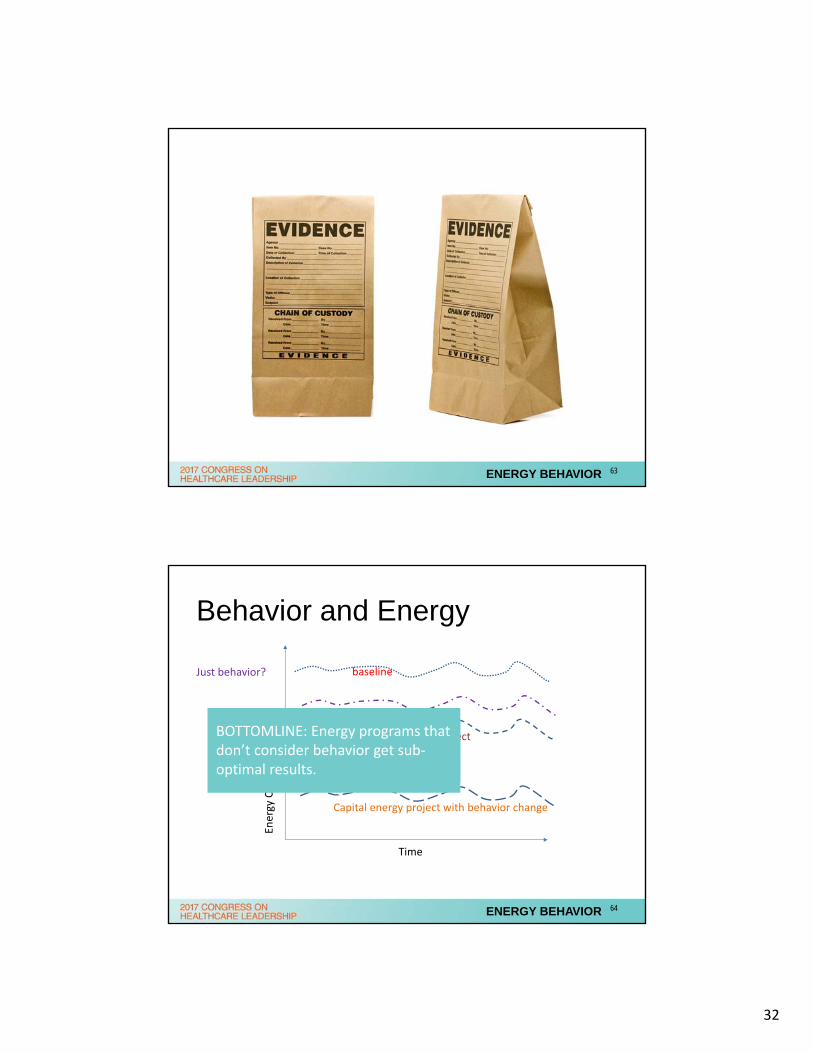
Behavior and Energy
Energy Consumption
Time
baseline
With capital energy project
Capital energy project with behavior change
Just behavior?
ENERGY BEHAVIOR
BOTTOMLINE: Energy programs that don’t consider behavior get sub‐optimal results.
64
33
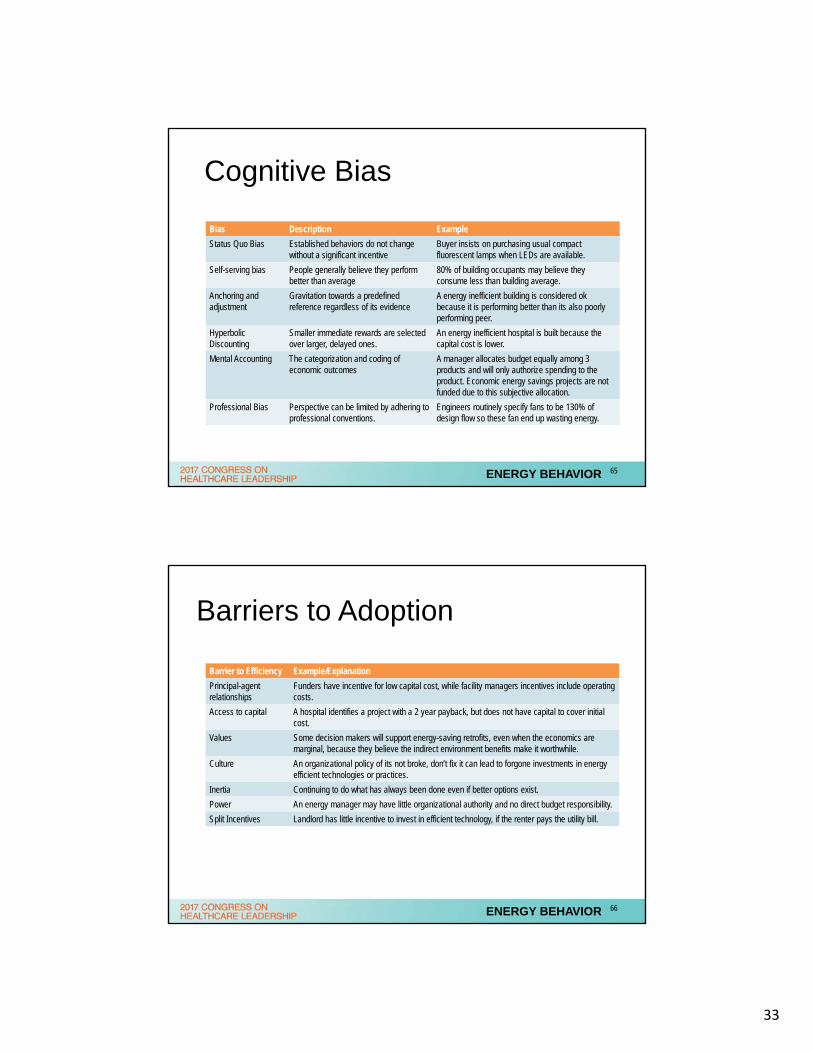
Cognitive Bias
Bias Description Example
Status Quo Bias Established behaviors do not change without a significant incentive
Buyer insists on purchasing usual compact fluorescent lamps when LEDs are available.
Self-serving bias People generally believe they perform better than average
80% of building occupants may believe they consume less than building average.
Anchoring and adjustment
Gravitation towards a predefined reference regardless of its evidence
A energy inefficient building is considered ok because it is performing better than its also poorly performing peer.
Hyperbolic Discounting
Smaller immediate rewards are selected over larger, delayed ones.
An energy inefficient hospital is built because the capital cost is lower.
Mental Accounting The categorization and coding of economic outcomes
A manager allocates budget equally among 3 products and will only authorize spending to the product. Economic energy savings projects are not funded due to this subjective allocation.
Professional Bias Perspective can be limited by adhering to professional conventions.
Engineers routinely specify fans to be 130% of design flow so these fan end up wasting energy.
ENERGY BEHAVIOR 65
Barriers to Adoption
Barrier to Efficiency Example/Explanation
Principal-agent relationships
Funders have incentive for low capital cost, while facility managers incentives include operating costs.
Access to capital A hospital identifies a project with a 2 year payback, but does not have capital to cover initial cost.
Values Some decision makers will support energy-saving retrofits, even when the economics are marginal, because they believe the indirect environment benefits make it worthwhile.
Culture An organizational policy of its not broke, don’t fix it can lead to forgone investments in energy efficient technologies or practices.
Inertia Continuing to do what has always been done even if better options exist.
Power An energy manager may have little organizational authority and no direct budget responsibility.
Split Incentives Landlord has little incentive to invest in efficient technology, if the renter pays the utility bill.
ENERGY BEHAVIOR 66
34
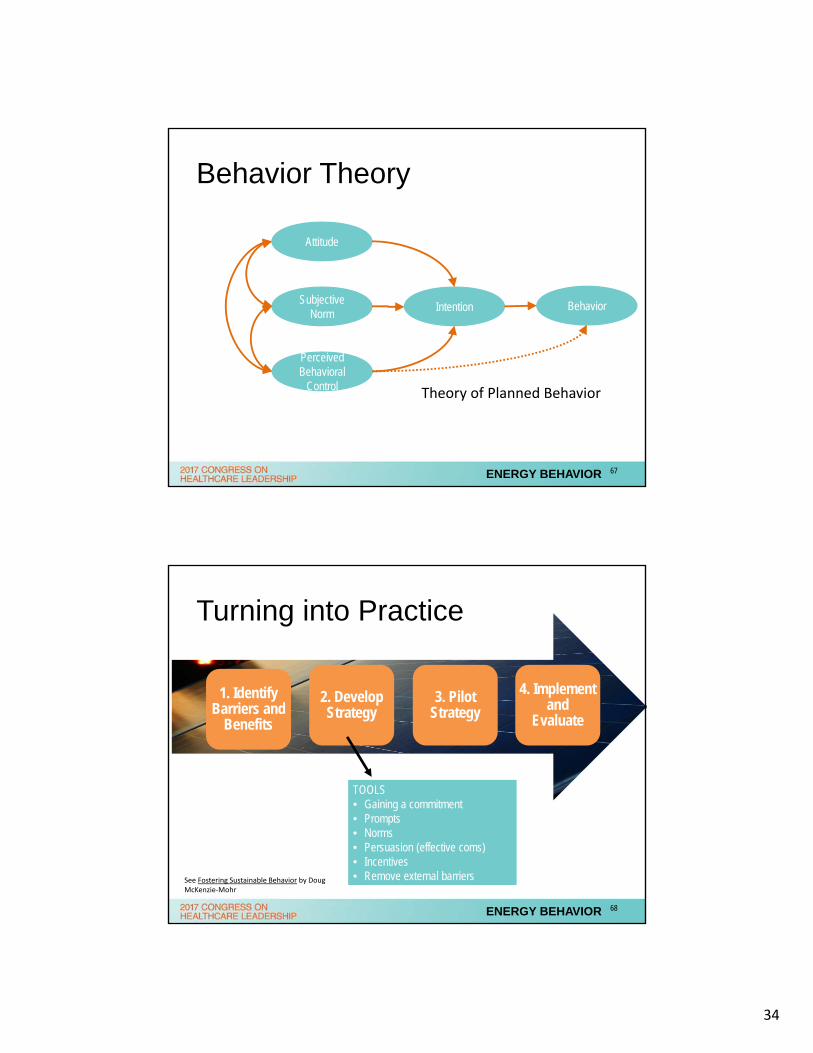
Behavior Theory
Attitude
Subjective Norm
Perceived Behavioral
Control
Intention Behavior
Theory of Planned Behavior
ENERGY BEHAVIOR 67
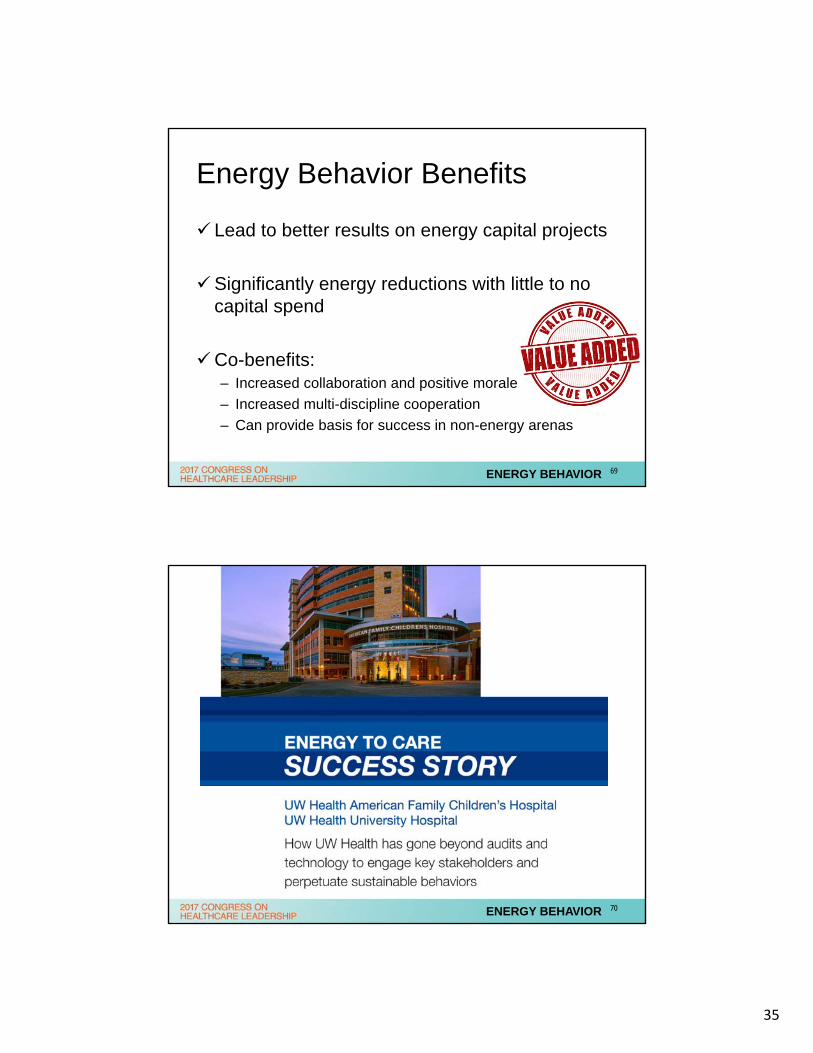
Turning into Practice
4. Implement and
Evaluate
3. Pilot Strategy
2. Develop Strategy
1. Identify Barriers and
Benefits
TOOLS• Gaining a commitment• Prompts• Norms• Persuasion (effective coms)• Incentives• Remove external barriersSee Fostering Sustainable Behavior by Doug
McKenzie‐Mohr
ENERGY BEHAVIOR 68
35
Energy Behavior Benefits
Lead to better results on energy capital projects
Significantly energy reductions with little to no capital spend
Co-benefits:– Increased collaboration and positive morale
– Increased multi-discipline cooperation
– Can provide basis for success in non-energy arenas
ENERGY BEHAVIOR 69
ENERGY BEHAVIOR 70
36
Financing Methods
71
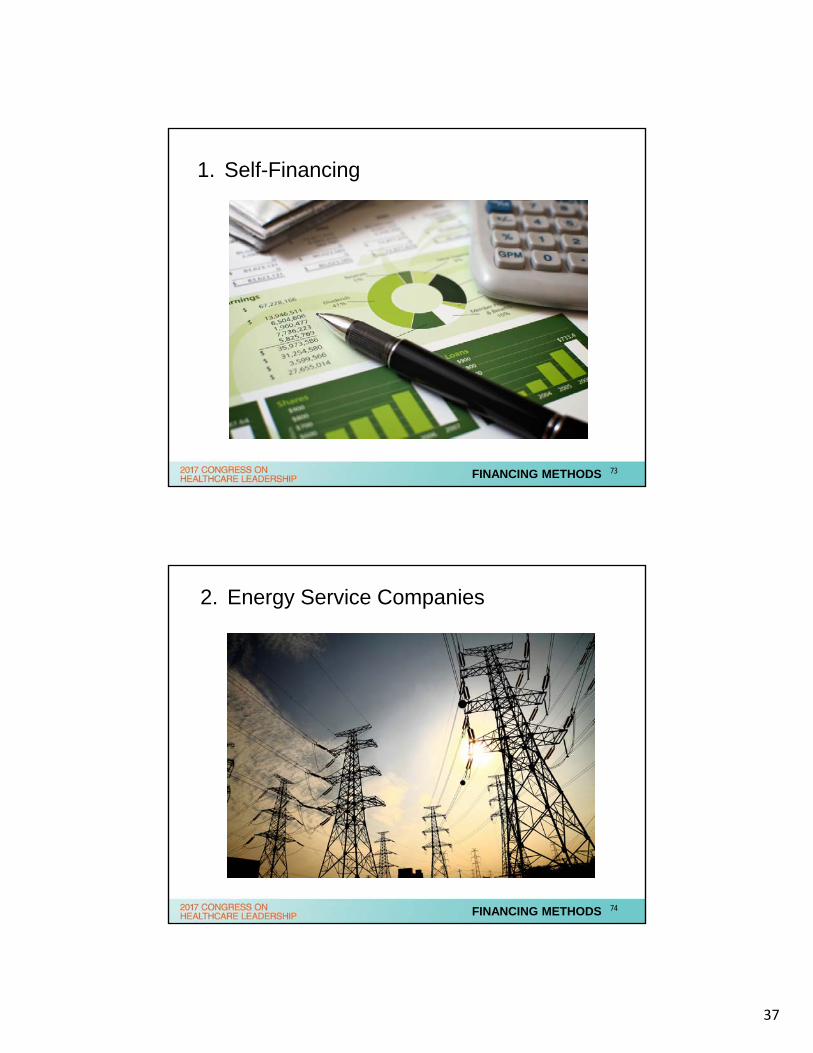
Financing Methods
SOLE PARTNERSHIP
ESCO
PACE ON-BILL
GRANTS/ REBATES
Internally Owned ESCO
Externally Owned ESCO
CARBON OFFSETS
FINANCING METHODS 72
37
1. Self-Financing
FINANCING METHODS 73
2. Energy Service Companies
FINANCING METHODS 74
38
3. Commercial Property Assessed Clean Energy (PACE)
FINANCING METHODS 75
4. On-bill Finance and On-bill Repayment
FINANCING METHODS 76
39
Carbon Off-sets
FINANCING METHODS 7977
POLL: Procurement Strategy #4
New Federal energy policy favors micro-grids to improve reliability and resiliency of the electric grid. Hospitals get targeted with grant funding to participate in community micro-grids and install on-site generation (CHP and renewables) as the heart of community micro-grids.
FINANCING METHODS 78
40
Energy Procurement
79
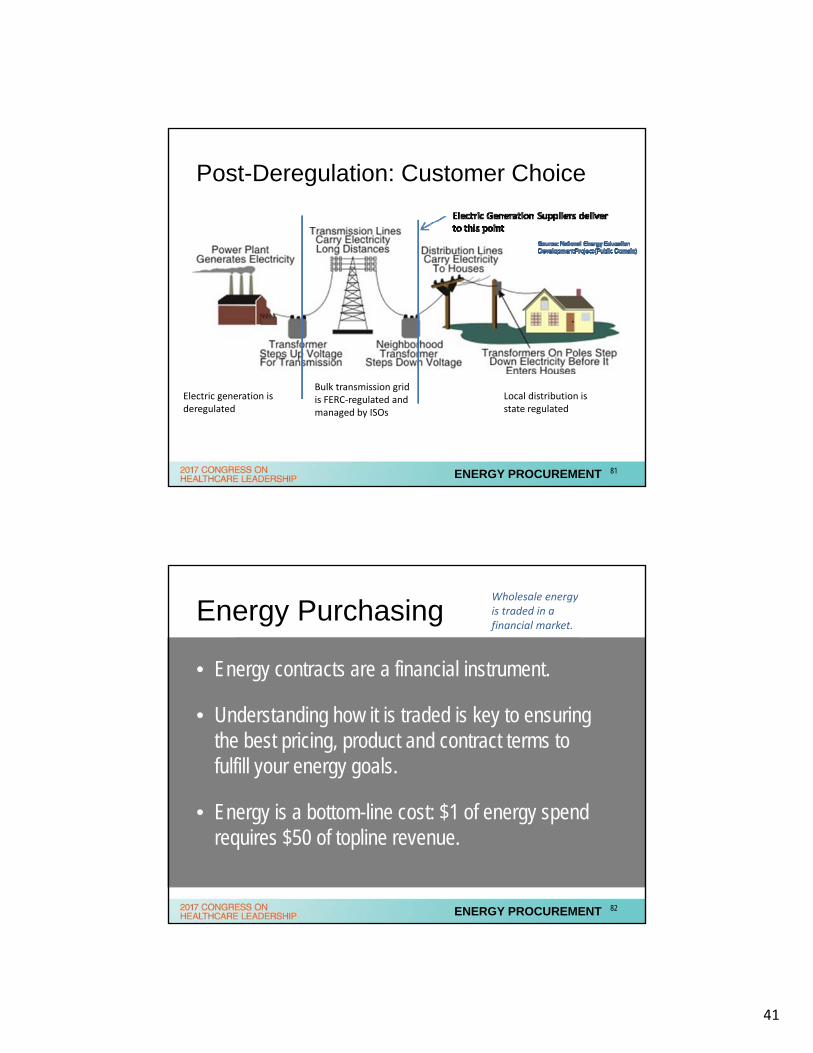
Where?
Electric USA and Canada = AB, CA*, CT, D.C., DE, IL, MA, ME, MI*, MD, NH, NJ, NV**, NY, OH, ON, OR**, PA, RI, TX, VA**
*CA and MI cap the number of customers that may participate.**OR, NV and VA allow competition for large customers only.
ENERGY PROCUREMENT 80
41
Post-Deregulation: Customer Choice
Electric generation isderegulated
Bulk transmission grid is FERC‐regulated andmanaged by ISOs
Local distribution isstate regulated
ENERGY PROCUREMENT 81
Energy Purchasing
ENERGY PROCUREMENT
Wholesale energy is traded in a financial market.
• Energy contracts are a financial instrument.
• Understanding how it is traded is key to ensuring the best pricing, product and contract terms to fulfill your energy goals.
• Energy is a bottom-line cost: $1 of energy spend requires $50 of topline revenue.
82
42
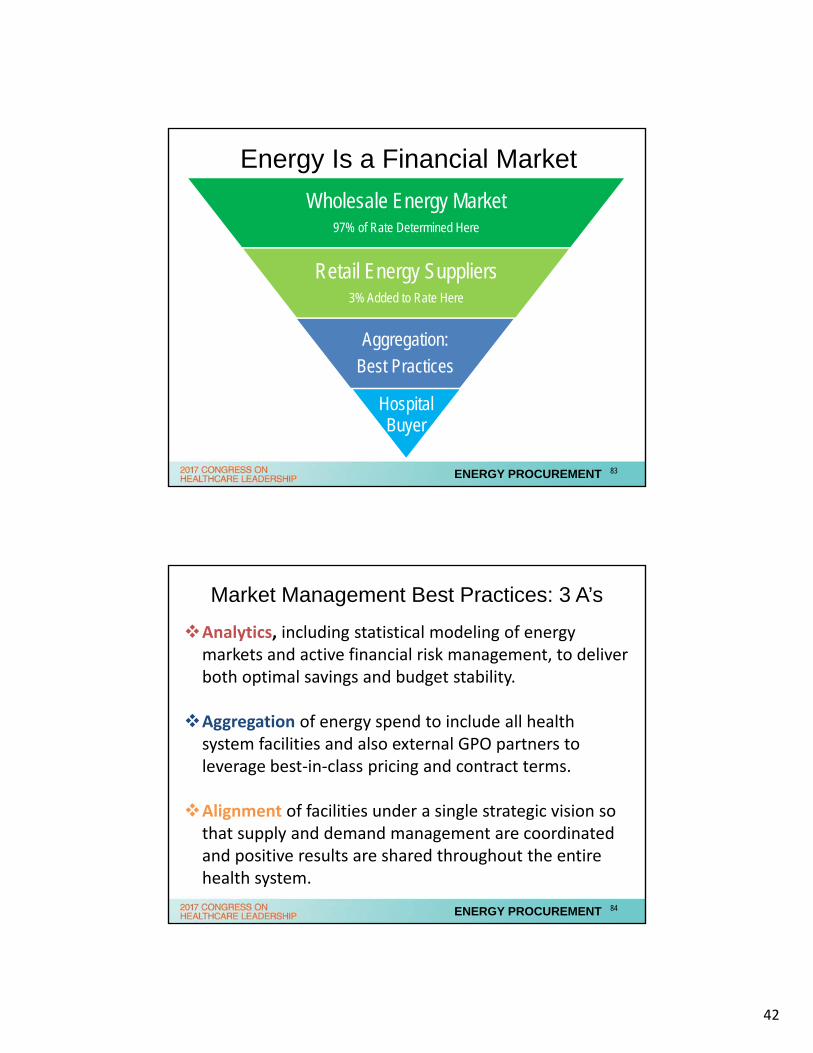
Energy Is a Financial Market
Wholesale Energy Market97% of Rate Determined Here
Retail Energy Suppliers3% Added to Rate Here
Aggregation:
Best Practices
Hospital Buyer
ENERGY PROCUREMENT 83
Market Management Best Practices: 3 A’s
Analytics, including statistical modeling of energy markets and active financial risk management, to deliver both optimal savings and budget stability.
Aggregation of energy spend to include all health system facilities and also external GPO partners to leverage best‐in‐class pricing and contract terms.
Alignment of facilities under a single strategic vision so that supply and demand management are coordinated and positive results are shared throughout the entire health system.
ENERGY PROCUREMENT 84
43
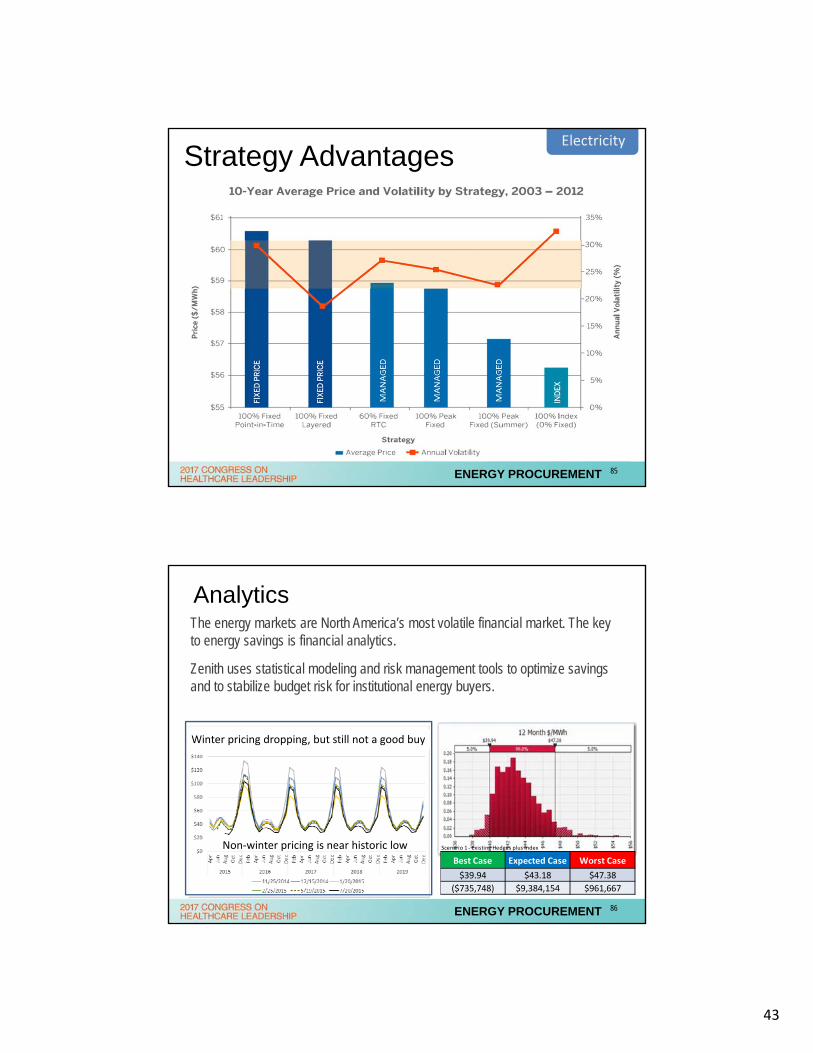
Strategy AdvantagesElectricity
ENERGY PROCUREMENT 85
AnalyticsThe energy markets are North America’s most volatile financial market. The key to energy savings is financial analytics.
Zenith uses statistical modeling and risk management tools to optimize savings and to stabilize budget risk for institutional energy buyers.
Scenario 1 ‐ Existing Hedges plus Index
Best Case Expected Case Worst Case
$39.94 $43.18 $47.38
($735,748) $9,384,154 $961,667
Non‐winter pricing is near historic low
Winter pricing dropping, but still not a good buy
ENERGY PROCUREMENT 86
44
AlignmentFacilities should be aligned around a single energy management strategy to:• Implement financial controls; and • Eliminate conflicting facility strategies
Align energy strategy and implementation:• Across all facilities• Manage using a cross-functional team that includes: engineering, facilities management, supply chain, and finance
“While $2.9 million in savings is important, I think the process Hospital/Zenith Energy helped create and implement is even more vital. It led to a cultural change for SSM Health in which facilities and finance aligned around a single corporate strategy”
Michael Malewicz, Treasurer and Chief Investment Officer, SSM Health, St Louis
ENERGY PROCUREMENT 87
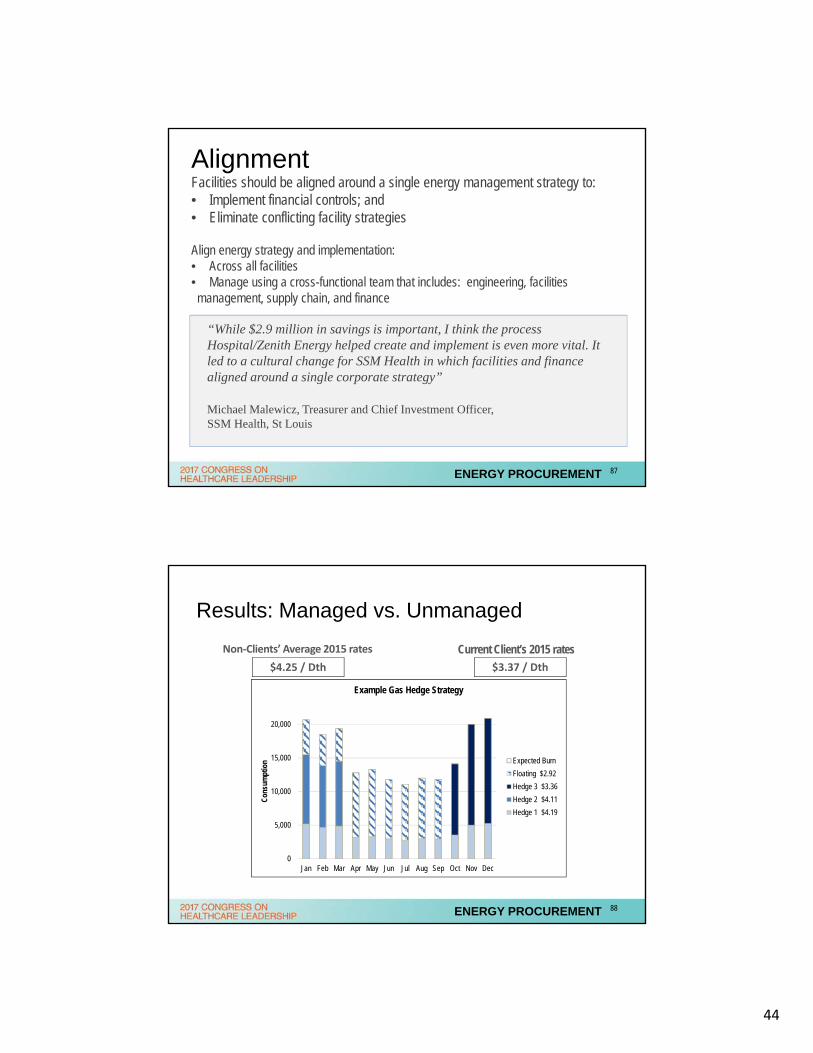
Results: Managed vs. Unmanaged
$4.25 / Dth
Non‐Clients’ Average 2015 rates Current Client’s 2015 rates
$3.37 / Dth
0
5,000
10,000
15,000
20,000
Jan Feb Mar Apr May Jun Jul Aug Sep Oct Nov Dec
Con
sum
ptio
n
Example Gas Hedge Strategy
Expected Burn
Floating $2.92
Hedge 3 $3.36
Hedge 2 $4.11
Hedge 1 $4.19
ENERGY PROCUREMENT 88

45
Reducing Market Costs From Two Sides
Demand Reduction Impacts
Purchasing StrategyImpacts
ENERGY PROCUREMENT 89
Savings Opportunities Centralize common strategy and procurement methodology
Consolidate spend under suppliers chosen through a rigorous, competitive process
Drive hedge vs index decisions using financial probability modeling
Quarterly review of financial positions by internal multi-disciplinary team (which may include Facilities, Purchasing, and Finance) working with Hospital Energy
Coterminous agreements to aggregate spend among owned facilities
Aggregate spend with other owned facilities and Hospital Energy clients regionally to leverage best price and contract terms
Savings of 10% have been consistently documented by our members.
ENERGY PROCUREMENT 90
46
POLL: Procurement Strategy #5
President Trump slashes regulations and red-tape on new gas and oil pipelines and expansions and adds tax subsidies for their construction. The industry quickly responds with new pipelines to bring gas and oil from the new shale plays in places like North Dakota and Pennsylvania to bring the fuels to markets. Oil prices slide back toward $40 and gas prices back toward $2.50, with greater local gas price decreases in constrained areas like NY and New England. Electric energy prices have lower reactions and remain in the $30-$40/MWh range, but winter price premiums are reduced in the Northeast.
ENERGY PROCUREMENT 91
Emerging Energy Technologies
92

47
Fuel Cells
EMERGING TECHNOLOGIES 93
Energy Information Systems
EMERGING TECHNOLOGIES 94
48
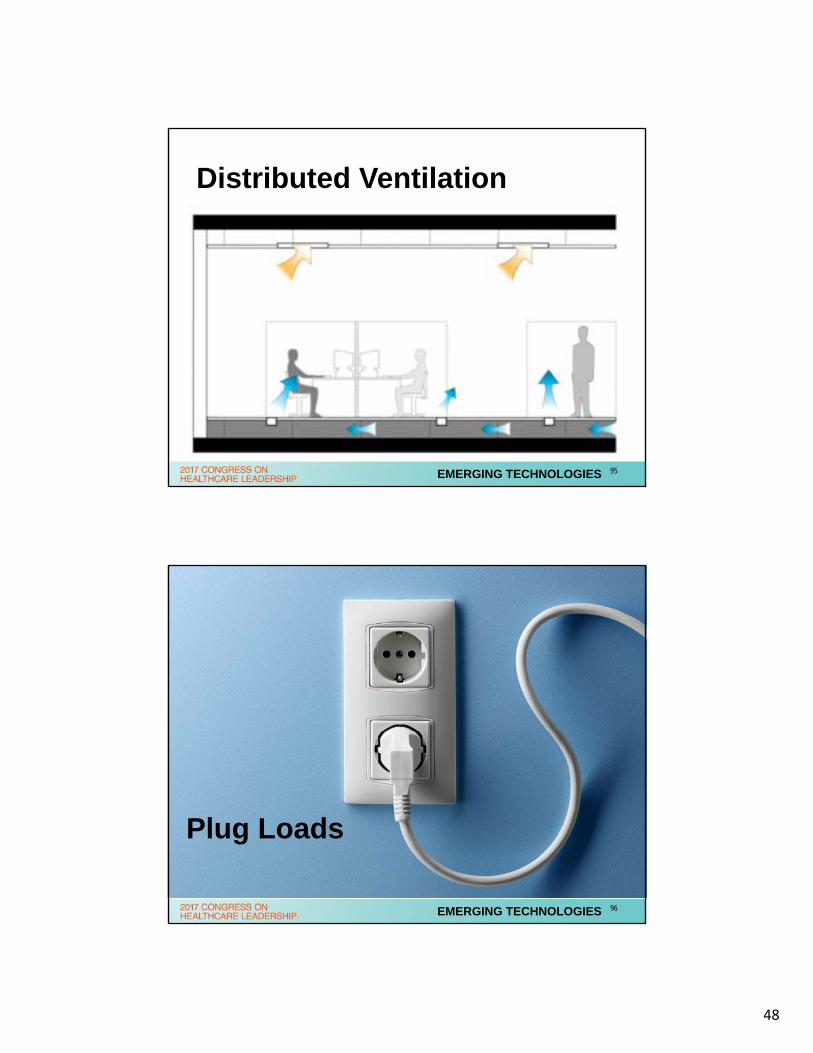
Distributed Ventilation
EMERGING TECHNOLOGIES 95
Plug Loads
EMERGING TECHNOLOGIES 96

49
EMERGING TECHNOLOGIES
EHR & BAS Linkage
97
The Future
EMERGING TECHNOLOGIES 98

50
Renewables
99
The Reality
RENEWABLES 100
51
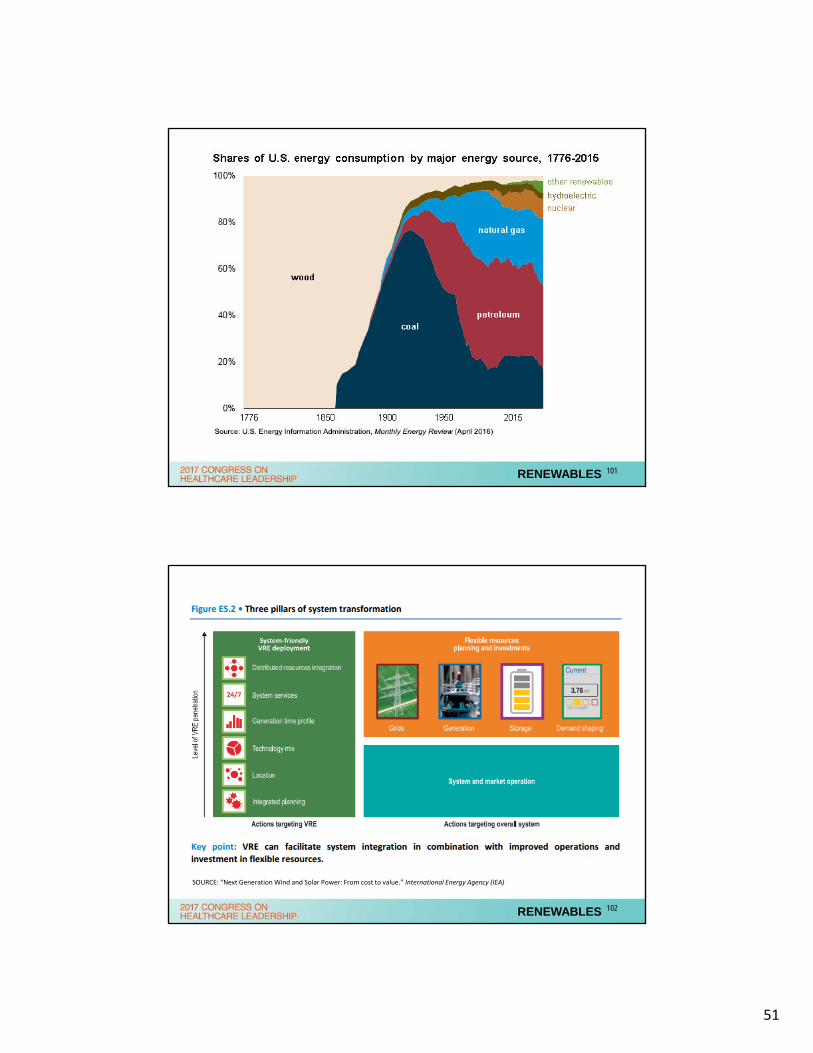
RENEWABLES 101
RENEWABLES
SOURCE: “Next Generation Wind and Solar Power: From cost to value.” International Energy Agency (IEA)
102
52
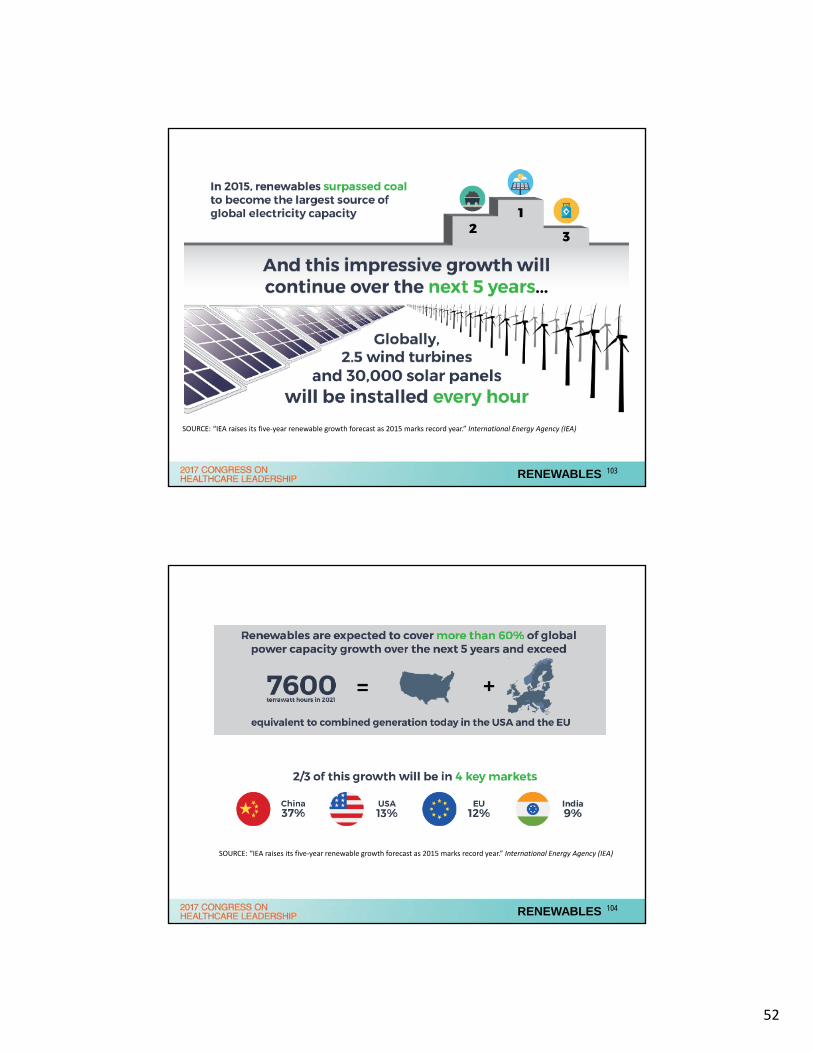
RENEWABLES
SOURCE: “IEA raises its five‐year renewable growth forecast as 2015 marks record year.” International Energy Agency (IEA)
103
RENEWABLES
SOURCE: “IEA raises its five‐year renewable growth forecast as 2015 marks record year.” International Energy Agency (IEA)
104

53
RENEWABLES
SOURCE: “IEA raises its five‐year renewable growth forecast as 2015 marks record year.” International Energy Agency (IEA)
105
Hydropower
RENEWABLES
Source: U.S. Department of Energy
106
54
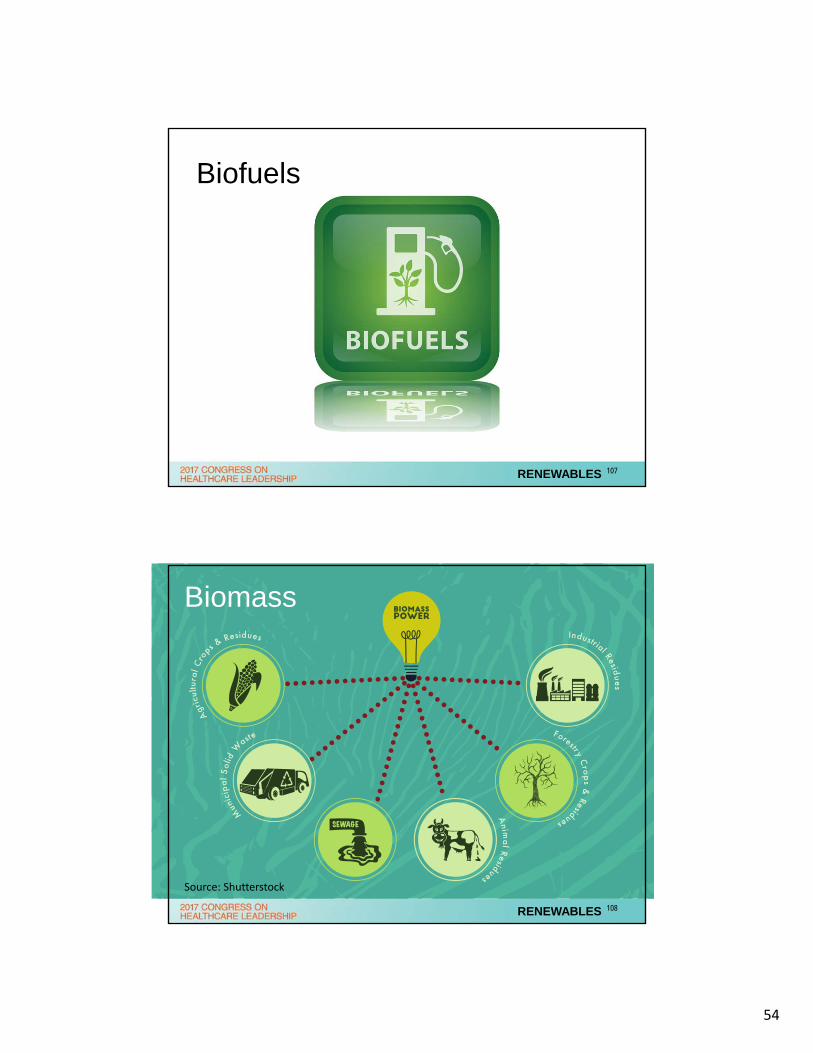
Biofuels
RENEWABLES 107
RENEWABLES
Biomass
Source: Shutterstock
108
55
Wind
RENEWABLES 109
Geothermal
RENEWABLES 110
56
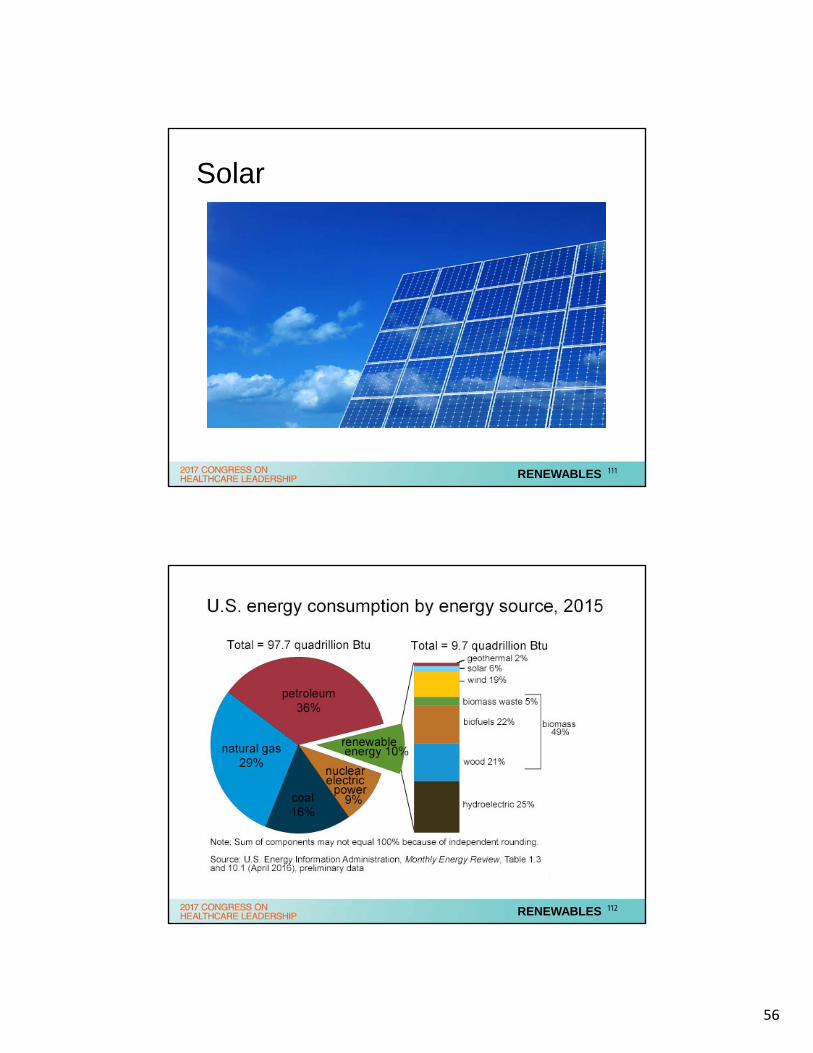
Solar
RENEWABLES 111
RENEWABLES 112
57
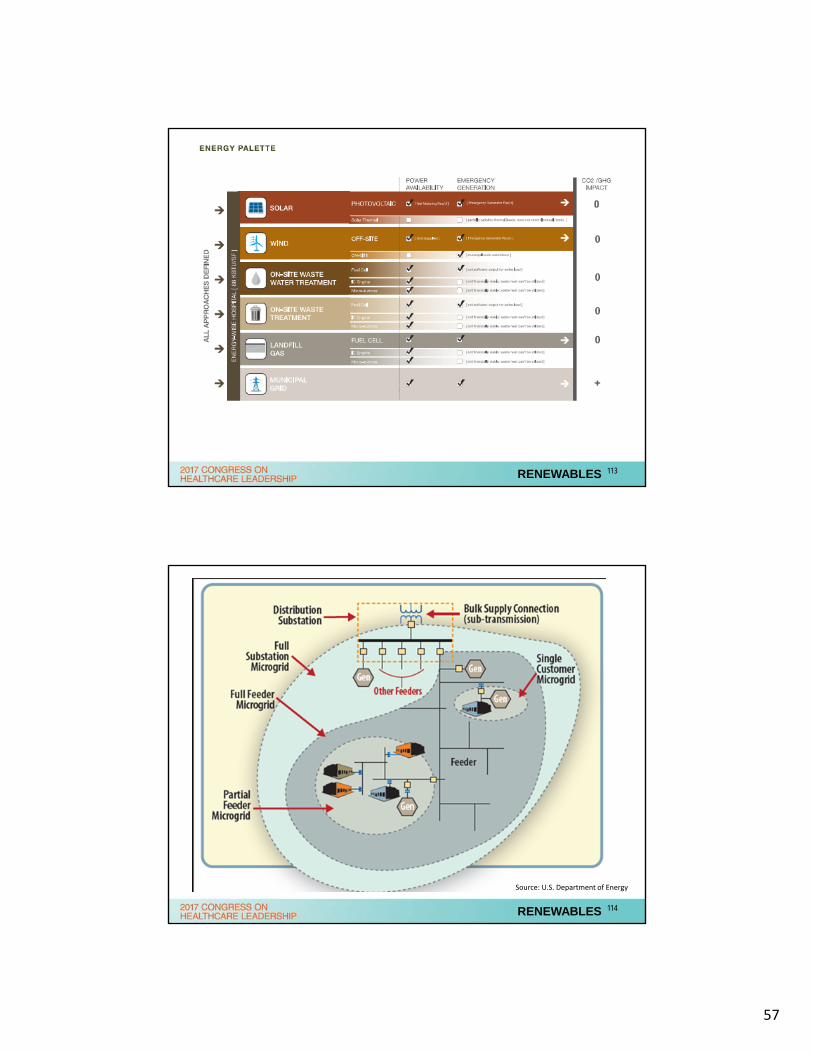
RENEWABLES 113
RENEWABLES
Source: U.S. Department of Energy
114
58
POLL: Procurement Strategy #6
Economic expansion picks up with GDP growing at over a 4% rate for several years. Electric and gas demand increase. Gas pricing returns to $4/mmbtu level and power prices to a range of $40 - $75/MWh, depending on region.
RENEWABLES 115
Energy Resources
116
59
RESOURCES 117
What is the Sustainability Roadmap?
• Energy
• Water
• Supply Chain
• Waste
• Chemicals
RESOURCES 118
60
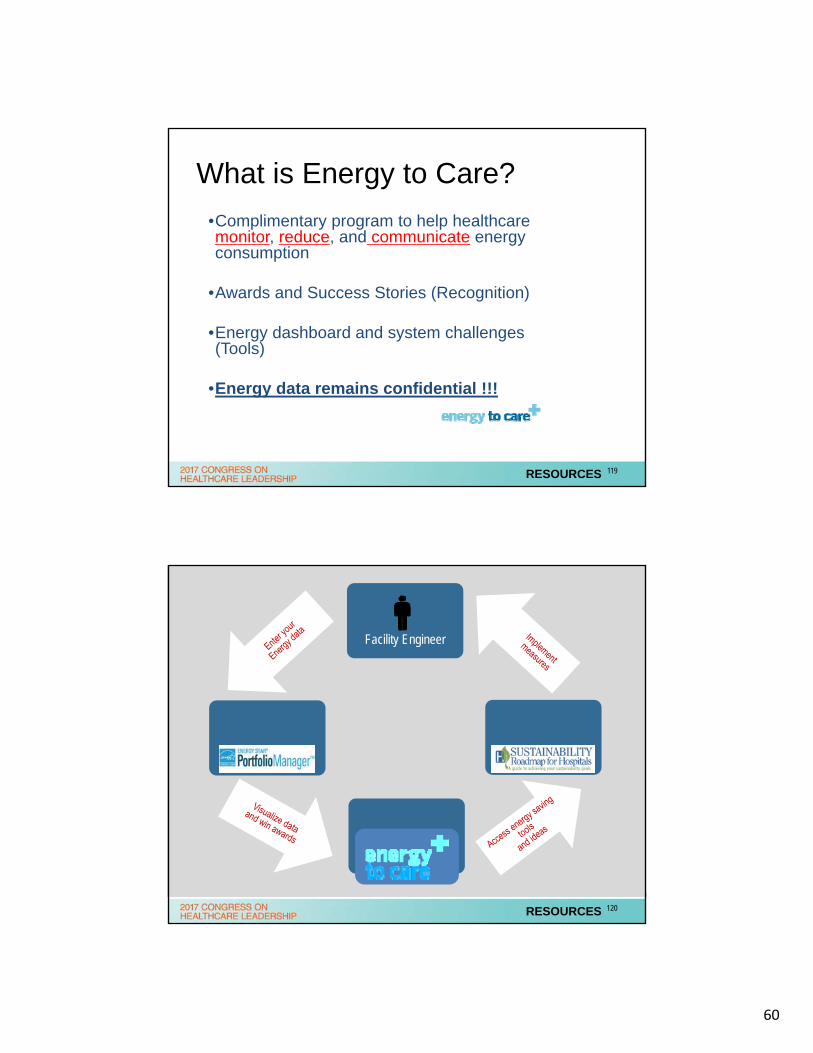
What is Energy to Care?
•Complimentary program to help healthcare monitor, reduce, and communicate energy consumption
•Awards and Success Stories (Recognition)
•Energy dashboard and system challenges (Tools)
•Energy data remains confidential !!!
RESOURCES 119
Facility Engineer
RESOURCES 120
61
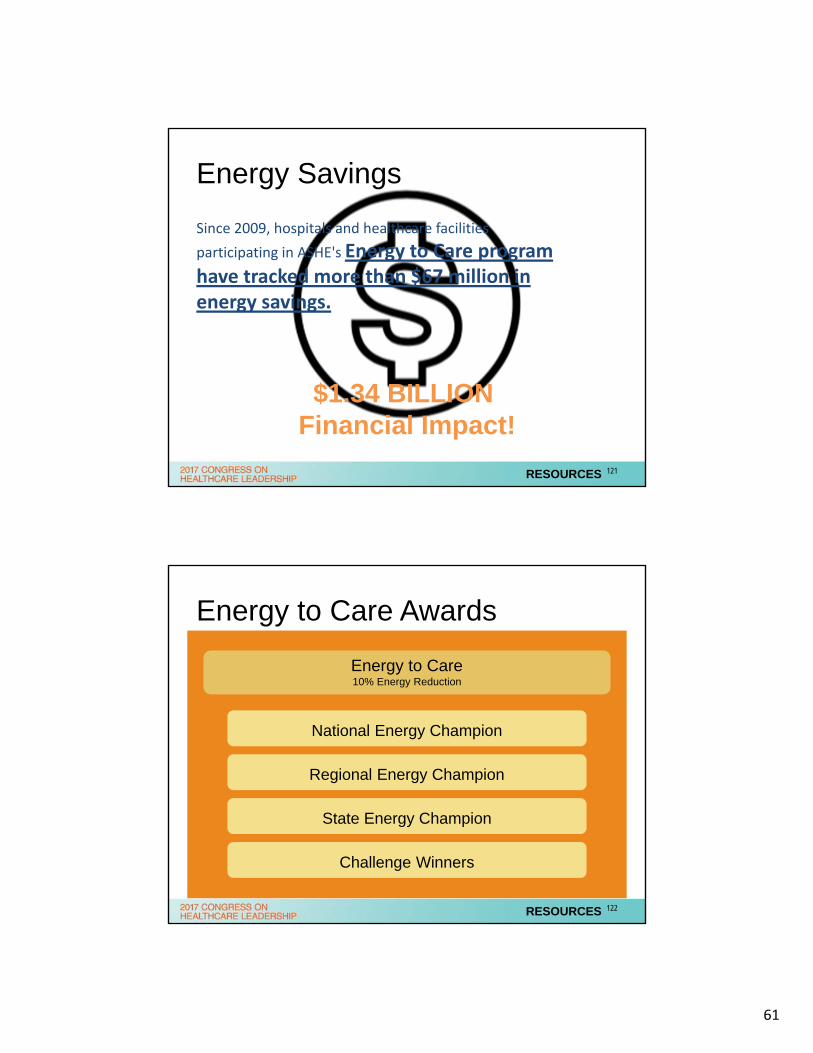
Energy Savings
Since 2009, hospitals and healthcare facilities
participating in ASHE's Energy to Care program have tracked more than $67 million in energy savings.
$1.34 BILLION Financial Impact!
RESOURCES 121
Energy to Care Awards
Energy to Care10% Energy Reduction
National Energy Champion
Regional Energy Champion
State Energy Champion
Challenge Winners
RESOURCES 122
62
RESOURCES 123
RESOURCES 124
63
RESOURCES 125
• Small energy cost savings create a large positive financial impact
• Energy to Care and Sustainability Roadmap help hospitals continually improve efficiency and sustainability
• Programs are designed to be:Low cost Easy to implement and maintain
• Patients and staff expect hospitals to be efficient and deliver cost effective patient care
Summary
RESOURCES 126
64
Energy to Care Icon Video
RESOURCES 127
POLL: Procurement Strategy #7
Severe winter weather followed by severely hot summer. Another severely cold winter like that of 2014 and 2015 deplete gas storage inventories to record low levels heading into the summer. This raises gas prices to the $5/dth range. Further, an extremely hot summer requires record amounts of gas burn for power despite the high prices. The high gas burn for power gen prevents gas storage inventories to replenish in time for the next winter. We begin winter at a record low level of storage. Gas further increases into the $7 range. Power prices move into the $65-$100/MWh range, depending on the region.
RESOURCES 128
65
Cindy Nuesslein, R.N., MBA, FACHE Mazzetti Principal
With over 35 years of healthcare experience, Cindy Nuesslein has serve in a wide variety of roles from humble beginnings as a nursing assistant to the CEO of a complex academic medical center with a Level 1 Trauma Center serving two schools of medicine. While in these various roles she has acquired significant experience and expertise in performance improvement including accreditations and certifications, facilities management, master planning through programming and design to construction management, emergency management, market research and healthcare program development, and clinical and non-clinical departmental operations.
• Company: Mazzetti
• 504.495.3747
129
Walt Vernon, PE, LEED AP, EDAC, FASHE, MBA Mazzetti CEO
Walt has been working with—partnering, consulting, advising---healthcare clients for more than 30 years. Walt serves on and is the former chair for the NFPA99 Electrical Systems Technical Committee. He is the former Electrical Engineer for the California Hospital Building Safety Board. He also served as one of the three co-coordinators for the Green Guide for Healthcare, the nation's first Green Healthcare rating system. Walt co-authored the IEEE/ANSI White Book, the international standard for Electrical Systems in Healthcare Facilities. He co-chairs the ASHRAE 189.3 committee, which is currently writing a model national green building code for healthcare facilities. Walt chairs the Research and Development Committee for the Facilities Guideline Institute (FGI), the body that writes the Guidelines for Healthcare Construction, which is the model licensing code for most states in the US. He represents the US to the International Federation of Healthcare Engineering.
• Company: Mazzetti
• 415.364.7222
130

66
Bibliography/References1. “The Global Environment; Institutions, Law, and Policy,” Regina S. Axelrod, Stacy D. Vendeveer, and David Leonard
Downie, ed. 2011
2. Hospital Energy
3. “Climate Change and the Law,” Chris Wold, David Hunter, Melissa Powers, 2009.
4. “The Law of Adaptation to Climate Change, U.S. and International Aspects,” Michael B. Gerrard, Katrina Fischer Kuh, ed. 2012.
5. “Global Climate Change and U.S. Law,” Michael B. Gerrard, Ed., 2008.
6. “Climate Change Synthesis Report Summary for Policymakers”, ed. 2014
7. “Energy Efficiency Financing for Hospitals” ACEEE, Healthcare Without Harm, Practice Greenhealth, March 2016
8. “Environmental Sustainability in Hospitals: The Value of Efficiency”, American Hospital Association, ASHE, HRET, May 2014
9. “Guide to Energy Management”, 8th Edition by Capehart, Turner & Kennedy.
10. Ajzen, I. (1991). The theory of planned behavior. Organizational Behavior and Human Decision Processes, 50, 179-211.
11. “Lazard’s Levelized Cost of Energy Analysis” – Version 8.0, September 2014
12. U.S. Energy Information Administration, Monthly Energy Review, April 2016
13. http://www.iea.org/publications/freepublications/publication/Next_Generation_Windand_Solar_PowerFrom_Cost_to_ValueFull_Report.pdf
14. http://www.eia.gov/energyexplained/?page=renewable_home
15. Next-Generation Wind and Solar Power: From Cost to Value © OECD/IEA 2016
16. IEA: Renewables – Medium-Term Market Forecast 2016
17. California Energy Commission, http://www.energy.ca.gov/
18. NASA & NOAA - https://www.nasa.gov/press-release/nasa-noaa-analyses-reveal-record-shattering-global-warm-temperatures-in-2015Scientific Visualization Studio/Goddard Space Flight Center
19. U.S. Department of Energy - https://energy.gov/oe/services/technology-development/smart-grid/role-microgrids-helping-advance-nation-s-energy-system
20. U.S. Department of Energy - https://energy.gov/eere/water/how-hydropower-works
21. ”U.S. Building Benchmarking and Transparency Policies” Decembmer 2016, Institute for Market Transformation
131