Embed Size (px)
Citation preview
SESSION ONE:
DEBT CAPACITY AND AFFORDABILITY
Danny Kim, Partner, Norton Rose Fulbright US LLP
Nikolai J. Sklaroff, Director – West Region, Public Finance, Wells Fargo Securities
March 18, 2015 Debt 2: Accessing the Market Riverside, California
Debt Capacity and Affordability
Two Components of Debt Capacity
• Revenue Source and Predictability • Debt Service (Inverse Relationship between
Principal and Interest)
Sources of Restrictions
• Restrictions Imposed by Law • Restrictions Imposed by Contract • Restrictions Imposed by Policy Makers
Restrictions Imposed by Law
• Proposition 13 (1978) • Proposition 218 (1996) • Proposition 26 (2010)
Restrictions Imposed by Contract
• Additional Bonds Test (ABT) • Also known as coverage requirement • Restrictions on senior lien obligations • Typically, no restrictions on subordinate lien
obligations • Determined by Investors, Rating Agencies,
Bond Insurers
Restrictions Imposed by Policy Makers
• Reserve Policy • Investment Policy (will determine rate of
return on investments) • Maximum Tax Level (i.e. Goals and Policies for
Community Facilities District)
General Obligations Bonds
• California – Voter Approved (No Limitation on Levy Amount)
• Direct and Overlapping Debt • Total Effective Tax Rate
Lease Revenue Bonds/COPs
• General fund obligation subject to abatement • Surplus is needed for taking on additional
obligations unless existing obligation is about to expire
• Otherwise, need additional revenue sources (i.e. sales tax measure/parcel tax)
• Asset Transfer
Revenue Bonds
• Enterprise • Special Tax Revenues (Mello-Roos/CFD)
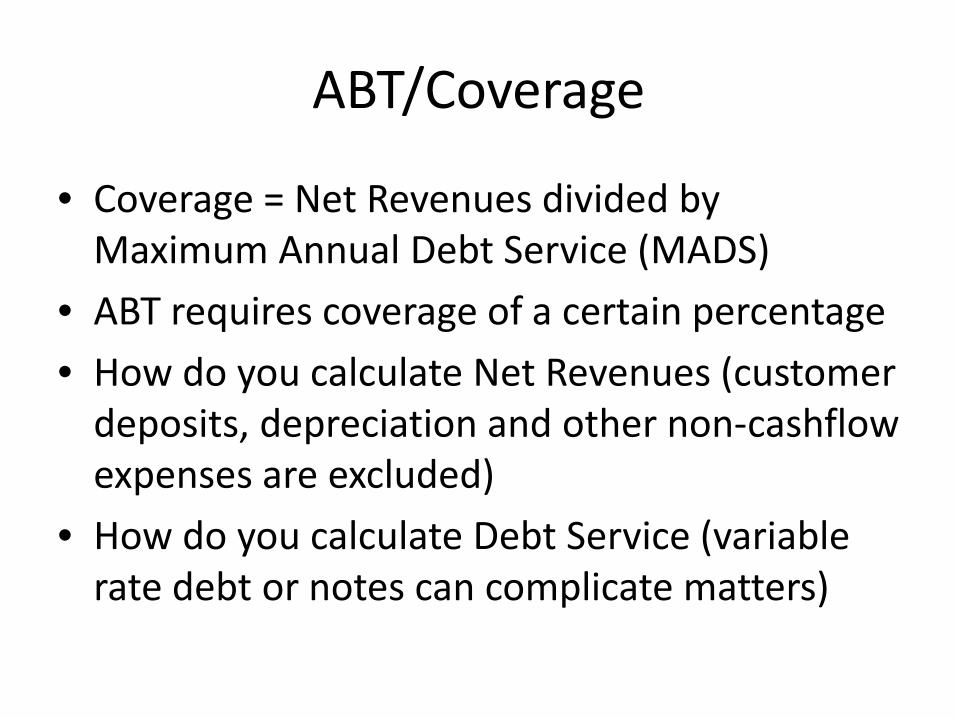
ABT/Coverage
• Coverage = Net Revenues divided by Maximum Annual Debt Service (MADS)
• ABT requires coverage of a certain percentage
• How do you calculate Net Revenues (customer deposits, depreciation and other non-cashflow expenses are excluded)
• How do you calculate Debt Service (variable rate debt or notes can complicate matters)
DEBT CAPACITY AND AFFORDABILITY:
THE MARKET PERSPECTIVE
Nikolai J. Sklaroff
Public Finance Investment Banker
Wells Fargo Securities
March 18, 2015
Riverside, California
Debt 2: Accessing the
Market
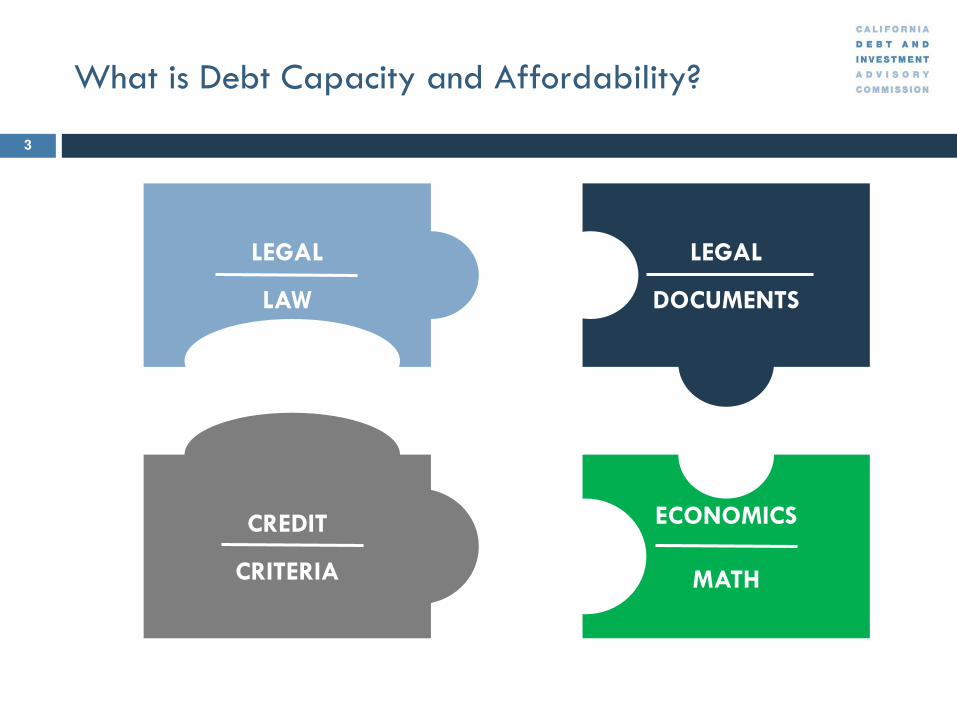
What is Debt Capacity and Affordability?
LEGAL
LAW
LEGAL
DOCUMENTS
CREDIT
CRITERIA
ECONOMICS
MATH
3
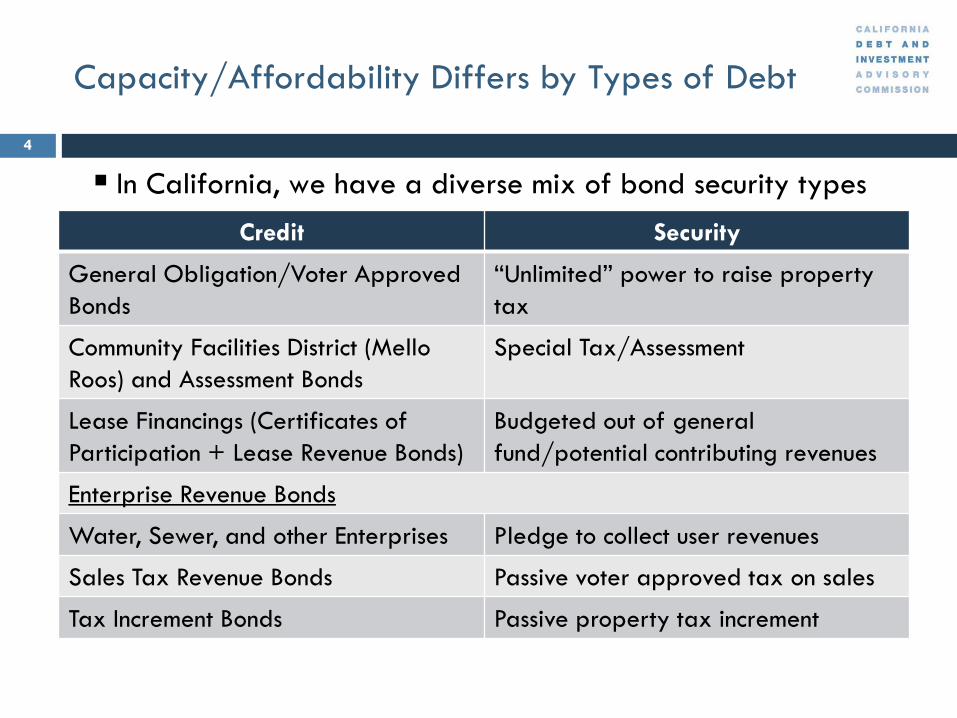
Capacity/Affordability Differs by Types of Debt
4
In California, we have a diverse mix of bond security types
Credit Security
General Obligation/Voter Approved
Bonds
“Unlimited” power to raise property
tax
Community Facilities District (Mello
Roos) and Assessment Bonds
Special Tax/Assessment
Lease Financings (Certificates of
Participation + Lease Revenue Bonds)
Budgeted out of general
fund/potential contributing revenues
Enterprise Revenue Bonds
Water, Sewer, and other Enterprises Pledge to collect user revenues
Sales Tax Revenue Bonds Passive voter approved tax on sales
Tax Increment Bonds Passive property tax increment
General Obligation Bonds
5
Voters may approve a General Obligation Bond up to a specified par amount
Voters may be ‘promised’ tax impact
Difference between
• Legal Limit
• Debt Capacity
• Affordability
A General Obligation Bond Example
6
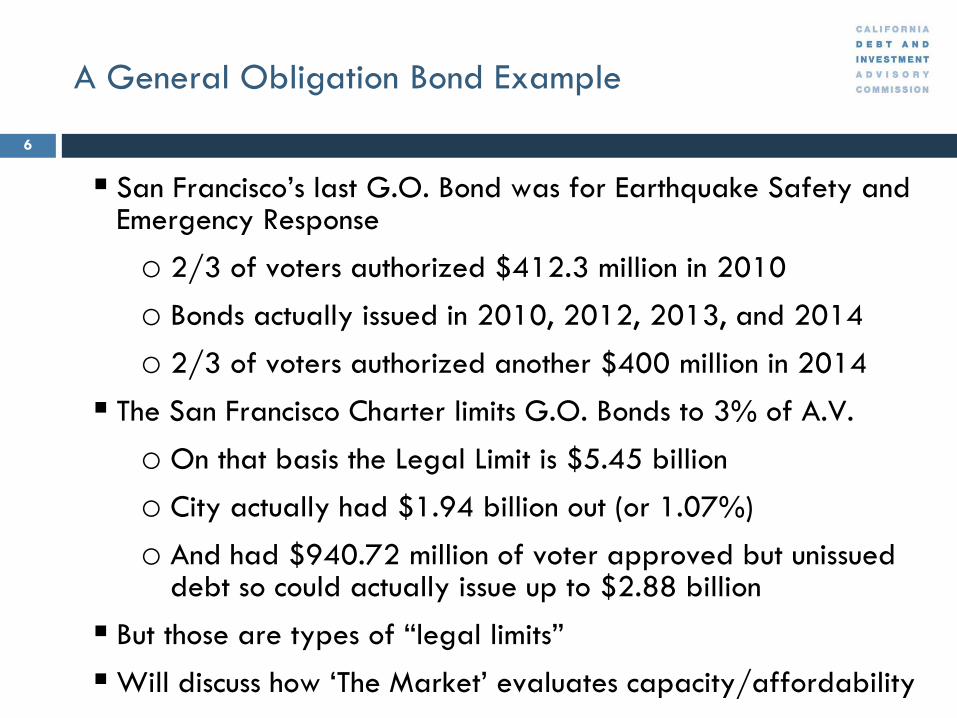
San Francisco’s last G.O. Bond was for Earthquake Safety and Emergency Response
o 2/3 of voters authorized $412.3 million in 2010
o Bonds actually issued in 2010, 2012, 2013, and 2014
o 2/3 of voters authorized another $400 million in 2014
The San Francisco Charter limits G.O. Bonds to 3% of A.V.
o On that basis the Legal Limit is $5.45 billion
o City actually had $1.94 billion out (or 1.07%)
o And had $940.72 million of voter approved but unissued debt so could actually issue up to $2.88 billion
But those are types of “legal limits”
Will discuss how ‘The Market’ evaluates capacity/affordability
Real World: Market Considerations
7
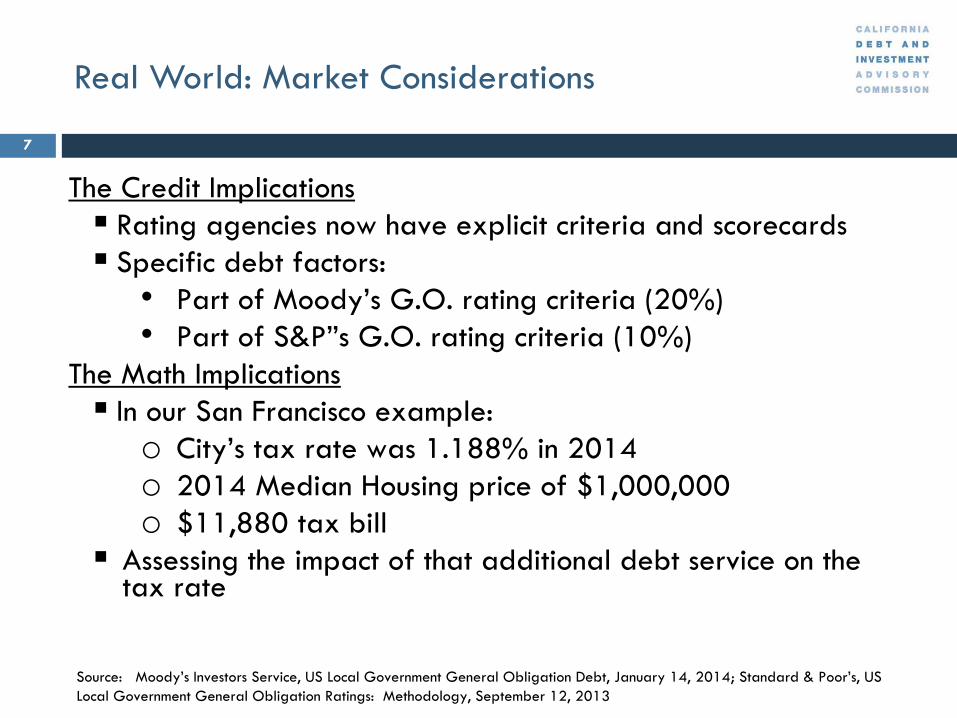
The Credit Implications
Rating agencies now have explicit criteria and scorecards Specific debt factors:
• Part of Moody’s G.O. rating criteria (20%)
• Part of S&P”s G.O. rating criteria (10%)
The Math Implications
In our San Francisco example:
o City’s tax rate was 1.188% in 2014 o 2014 Median Housing price of $1,000,000
o $11,880 tax bill
Assessing the impact of that additional debt service on the tax rate
Source: Moody’s Investors Service, US Local Government General Obligation Debt, January 14, 2014; Standard & Poor’s, US
Local Government General Obligation Ratings: Methodology, September 12, 2013
Real World: Practical Considerations
8
The Practical Implications
Realities of property tax rate changes affected by
o Layering in each series of new debt for each program of G.O. bonds
o Term and rate of debt
o Assumed tax base growth
o Old debt rolling off or being refunded
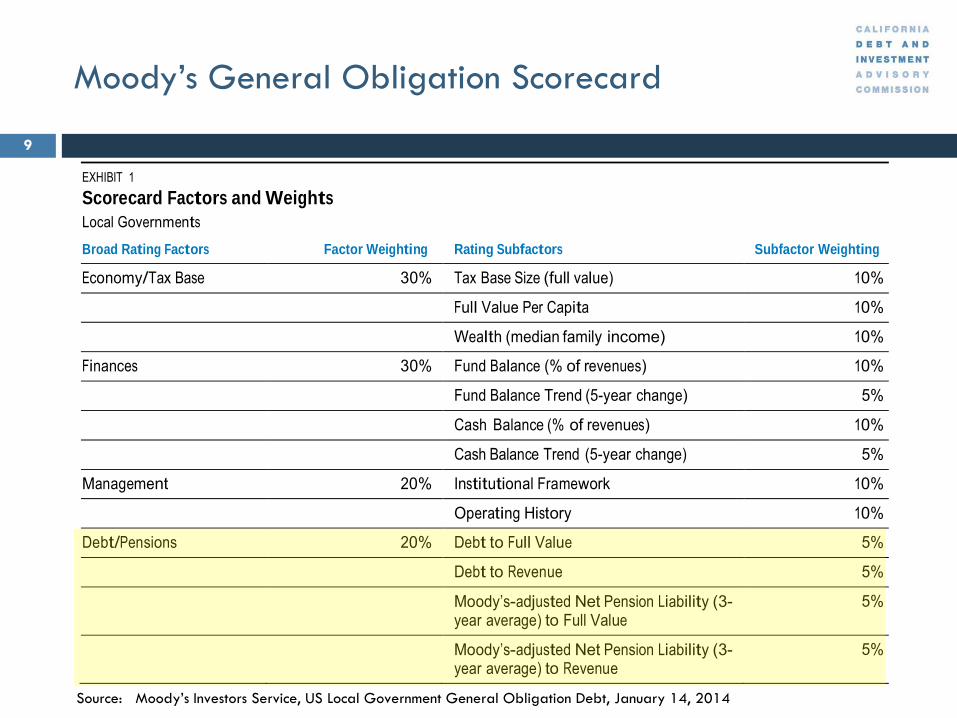
Moody’s General Obligation Scorecard
9
EXHIBIT 1 Scorecard Factors and Weights Local Governments
Broad Rating Factors Factor Weighting Rating Subfactors Subfactor Weighting
Economy/Tax Base 30% Tax Base Size (full value) 10%
Full Value Per Capita 10%
Wealth (median family income) 10%
Finances 30% Fund Balance (% of revenues) 10%
Fund Balance Trend (5-year change) 5%
Cash Balance (% of revenues) 10%
Cash Balance Trend (5-year change) 5%
Management 20% Institutional Framework 10%
Operating History 10%
Debt/Pensions 20% Debt to Full Value 5%
Debt to Revenue 5%
Moody’s-adjusted Net Pension Liability (3- year average) to Full Value
5%
Moody’s-adjusted Net Pension Liability (3- year average) to Revenue
5%
Source: Moody’s Investors Service, US Local Government General Obligation Debt, January 14, 2014
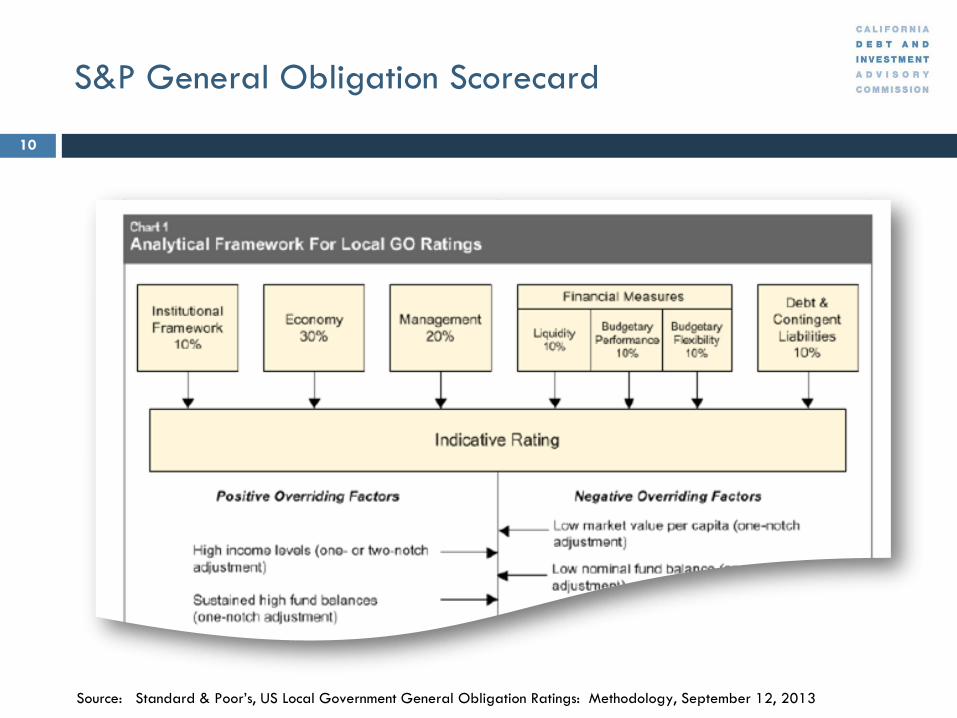
S&P General Obligation Scorecard
10
Source: Standard & Poor’s, US Local Government General Obligation Ratings: Methodology, September 12, 2013
Lease Revenue Obligations
11
Unlike tax backed obligations or utility backed obligations, lease obligation may not come with another revenue stream (“zero sum”)
• With multiple leases, there may be the same layering of obligations, except now the spikes and dips impact the governmental budget, not the users budget
If other revenue streams exist, what are the dynamics of that stream (secure?, variability?)
Do costs need to be allocated to other departments?
“Lease Burden” relative to General Fund Revenues
Unique aspects of lease financings affecting capacity
• Useful life of asset
• Limited to paying rent with ‘beneficial use and occupancy’ of the asset
• Potential need for Capitalized Interest, Reserves, Insurance
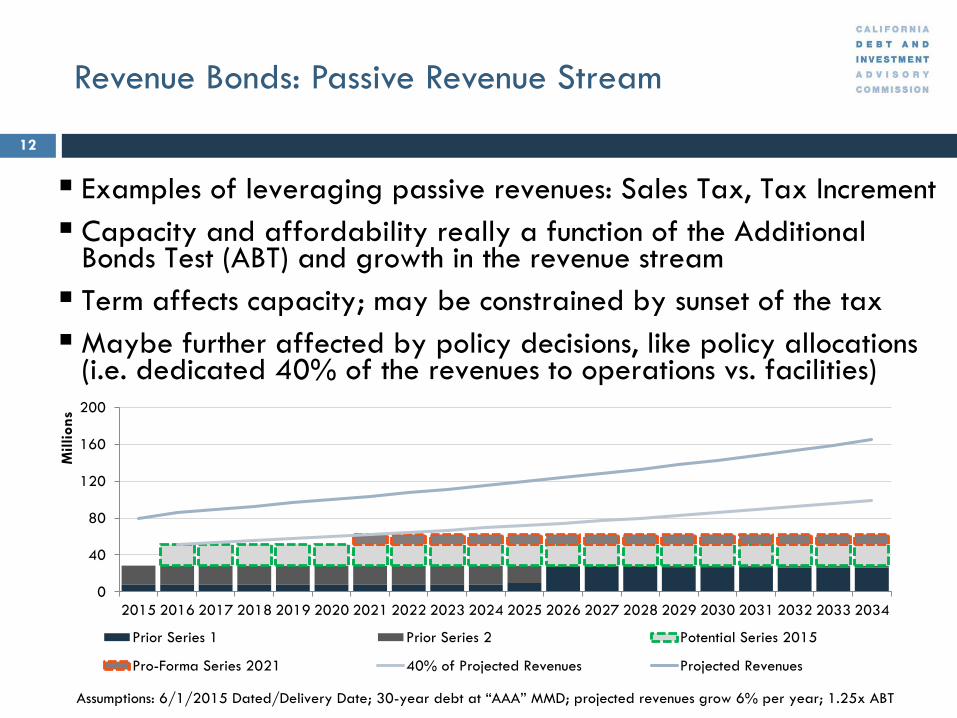
Revenue Bonds: Passive Revenue Stream
12
Examples of leveraging passive revenues: Sales Tax, Tax Increment Capacity and affordability really a function of the Additional
Bonds Test (ABT) and growth in the revenue stream
Term affects capacity; may be constrained by sunset of the tax
Maybe further affected by policy decisions, like policy allocations (i.e. dedicated 40% of the revenues to operations vs. facilities)
Millions 200
160
120
80
40
0
Prior Series 1 Prior Series 2 Potential Series 2015
Pro-Forma Series 2021 40% of Projected Revenues Projected Revenues
2015 2016 2017 2018 2019 2020 2021 2022 2023 2024 2025 2026 2027 2028 2029 2030 2031 2032 2033 2034
Assumptions: 6/1/2015 Dated/Delivery Date; 30-year debt at “AAA” MMD; projected revenues grow 6% per year; 1.25x ABT
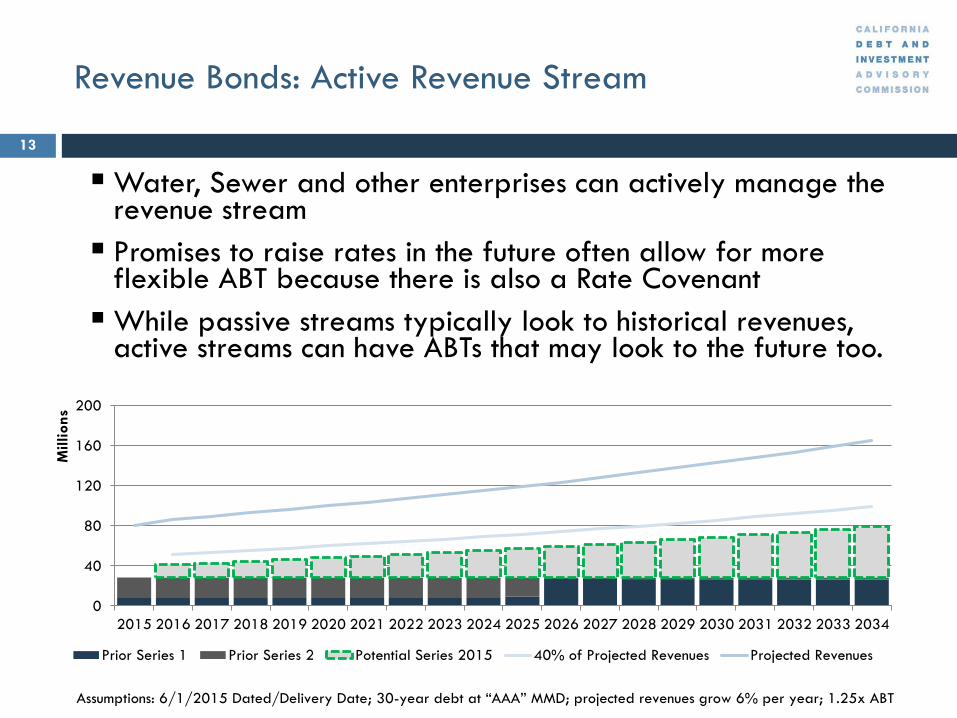
Revenue Bonds: Active Revenue Stream
13
Water, Sewer and other enterprises can actively manage the revenue stream
Promises to raise rates in the future often allow for more flexible ABT because there is also a Rate Covenant
While passive streams typically look to historical revenues, active streams can have ABTs that may look to the future too.
200
160
120
80
40
0
2015 2016 2017 2018 2019 2020 2021 2022 2023 2024 2025 2026 2027 2028 2029 2030 2031 2032 2033 2034
Millions
Prior Series 1 Prior Series 2 Potential Series 2015 40% of Projected Revenues Projected Revenues
Assumptions: 6/1/2015 Dated/Delivery Date; 30-year debt at “AAA” MMD; projected revenues grow 6% per year; 1.25x ABT
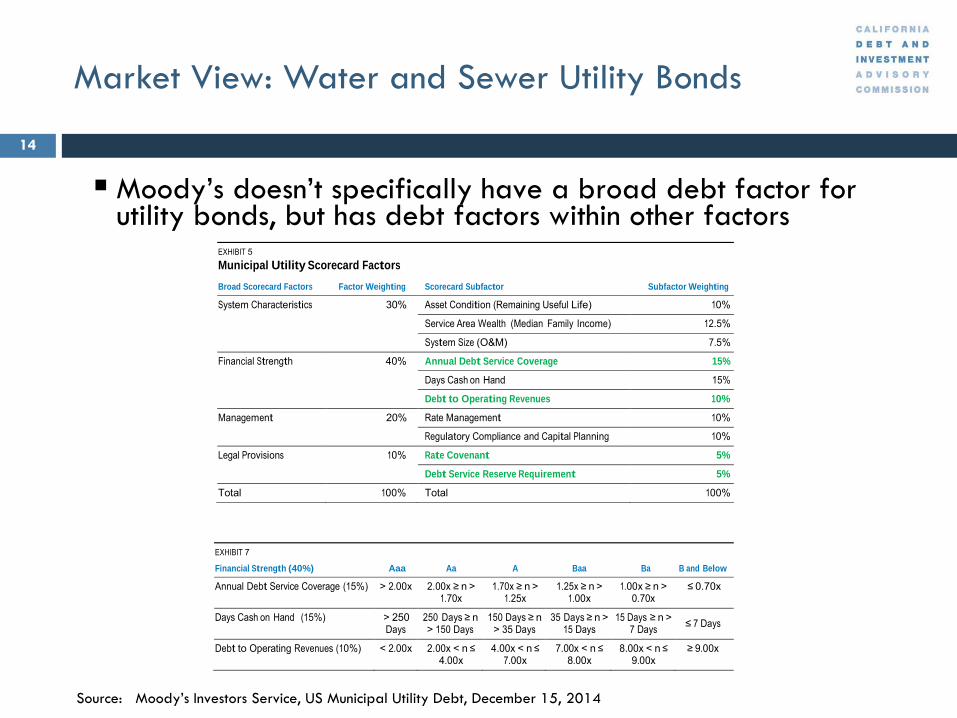
EXHIBIT 7
Financial Strength (40%) Aaa Aa A Baa Ba B and Below
Annual Debt Service Coverage (15%) > 2.00x 2.00x ≥ n > 1.70x
1.70x ≥ n > 1.25x
1.25x ≥ n > 1.00x
1.00x ≥ n > 0.70x
≤ 0.70x
Days Cash on Hand (15%) > 250 Days
250 Days ≥ n > 150 Days
150 Days ≥ n > 35 Days
35 Days ≥ n > 15 Days
15 Days ≥ n > 7 Days
≤ 7 Days
Debt to Operating Revenues (10%) < 2.00x 2.00x < n ≤ 4.00x
4.00x < n ≤ 7.00x
7.00x < n ≤ 8.00x
8.00x < n ≤ 9.00x
≥ 9.00x
Market View: Water and Sewer Utility Bonds
14
Moody’s doesn’t specifically have a broad debt factor forutility bonds, but has debt factors within other factors
EXHIBIT 5
Municipal Utility Scorecard Factors
Broad Scorecard Factors Factor Weighting Scorecard Subfactor Subfactor Weighting
System Characteristics 30% Asset Condition (Remaining Useful Life) 10%
Service Area Wealth (Median Family Income) 12.5%
System Size (O&M) 7.5%
Financial Strength 40% Annual Debt Service Coverage 15%
Days Cash on Hand 15%
Debt to Operating Revenues 10%
Management 20% Rate Management 10%
Regulatory Compliance and Capital Planning 10%
Legal Provisions 10% Rate Covenant 5%
Debt Service Reserve Requirement 5%
Total 100% Total 100%
Source: Moody’s Investors Service, US Municipal Utility Debt, December 15, 2014
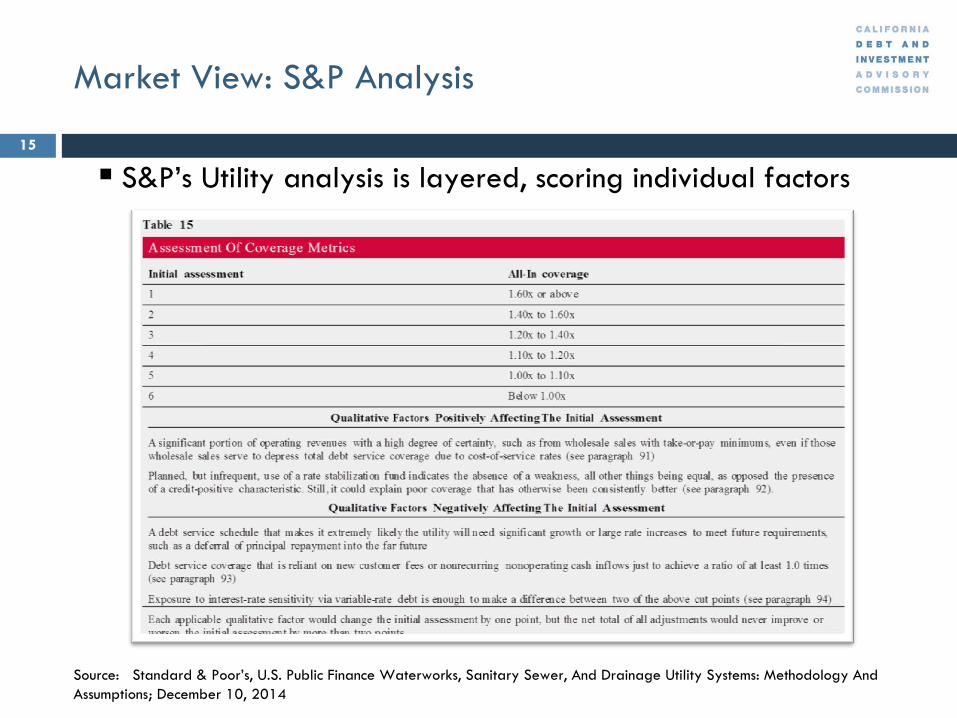
Market View: S&P Analysis
15
S&P’s Utility analysis is layered, scoring individual factors
Source: Standard & Poor’s, U.S. Public Finance Waterworks, Sanitary Sewer, And Drainage Utility Systems: Methodology And
Assumptions; December 10, 2014
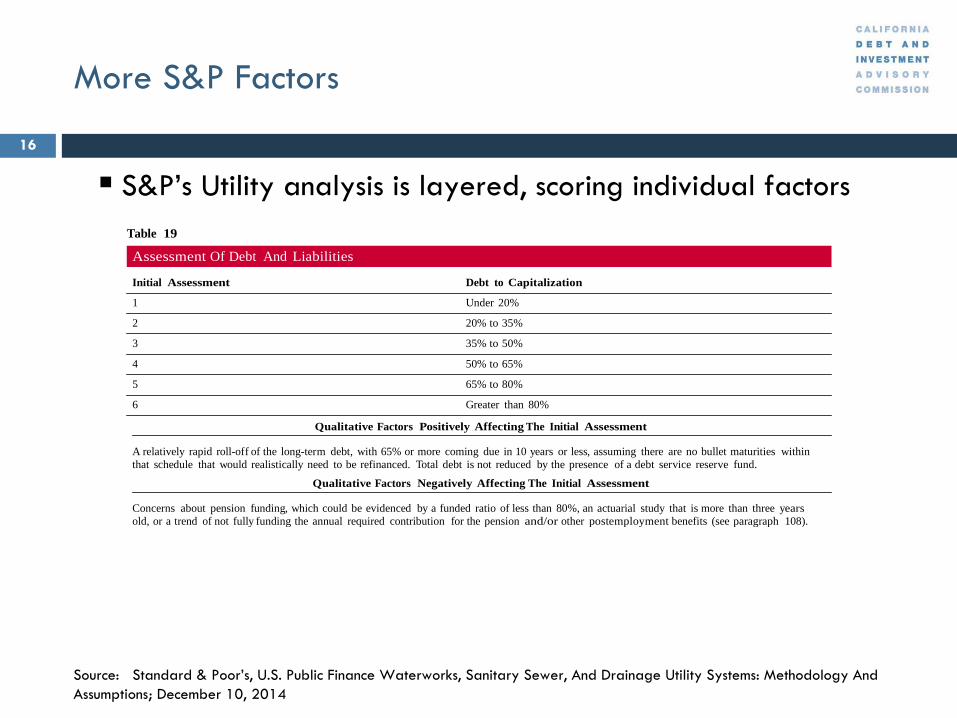
More S&P Factors
16
S&P’s Utility analysis is layered, scoring individual factorsTable 19
Assessment Of Debt And Liabilities
Initial Assessment Debt to Capitalization
1 Under 20%
2 20% to 35%
3 35% to 50%
4 50% to 65%
5 65% to 80%
6 Greater than 80%
Qualitative Factors Positively Affecting The Initial Assessment
A relatively rapid roll-off of the long-term debt, with 65% or more coming due in 10 years or less, assuming there are no bullet maturities within
that schedule that would realistically need to be refinanced. Total debt is not reduced by the presence of a debt service reserve fund.
Qualitative Factors Negatively Affecting The Initial Assessment
Concerns about pension funding, which could be evidenced by a funded ratio of less than 80%, an actuarial study that is more than three years
old, or a trend of not fully funding the annual required contribution for the pension and/or other postemployment benefits (see paragraph 108).
Source: Standard & Poor’s, U.S. Public Finance Waterworks, Sanitary Sewer, And Drainage Utility Systems: Methodology And
Assumptions; December 10, 2014
Issues that can Affect Capacity
17
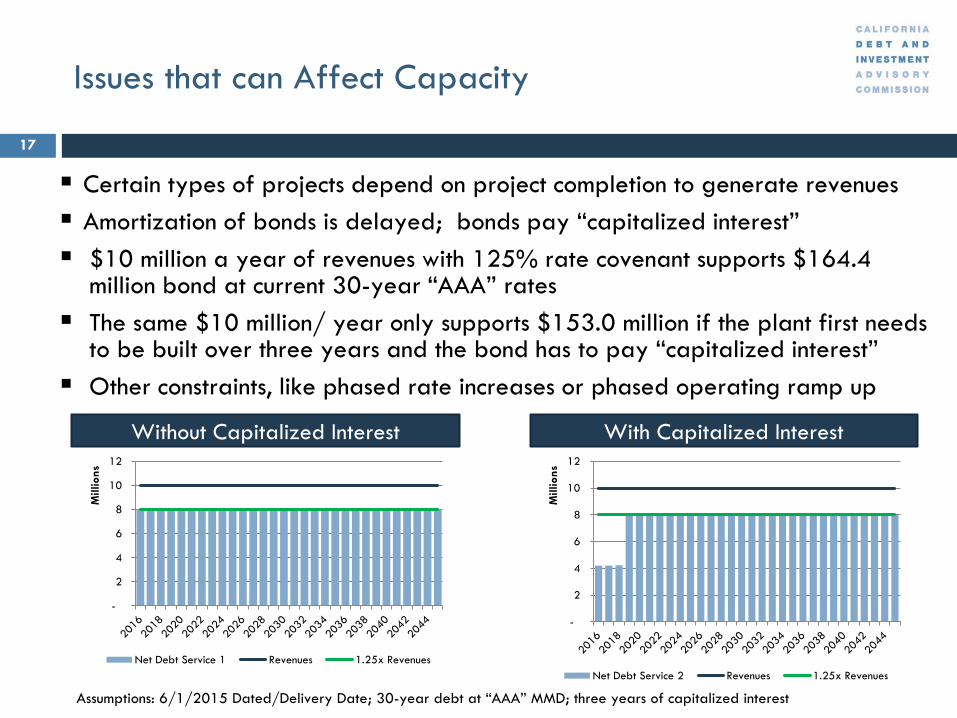
Certain types of projects depend on project completion to generate revenues
Amortization of bonds is delayed; bonds pay “capitalized interest”
$10 million a year of revenues with 125% rate covenant supports $164.4 million bond at current 30-year “AAA” rates
The same $10 million/ year only supports $153.0 million if the plant first needs to be built over three years and the bond has to pay “capitalized interest”
Other constraints, like phased rate increases or phased operating ramp up
Without Capitalized Interest With Capitalized Interest12 12
Million
s
Million
s
10 10
8 8
6 6
4 4
2
2 -
-
Net Debt Service 1 Revenues 1.25x Revenues
Net Debt Service 2 Revenues 1.25x Revenues
Assumptions: 6/1/2015 Dated/Delivery Date; 30-year debt at “AAA” MMD; three years of capitalized interest
Trends affecting Capacity/Affordability
18
Debt Service Reserve Funds • Historically about 10% of most bonds, other than G.O.s, was dedicated to a “Debt Service Reserve Fund”
• Legal Limit: Lesser of 10%, Maximum Annual Debt Service, or 125% of average annual debt service
• To the extent the market is not requiring reserve funds for highly rated utility, sales tax ,and even some lease financings, that frees up ~10% of proceeds for projects
New approaches
• Reassessing necessity on highly-rated utilities, sales tax bonds with strong coverage, even strong general fund leases
• Surety substitutes
Other Trends affecting Capacity/Affordability
19
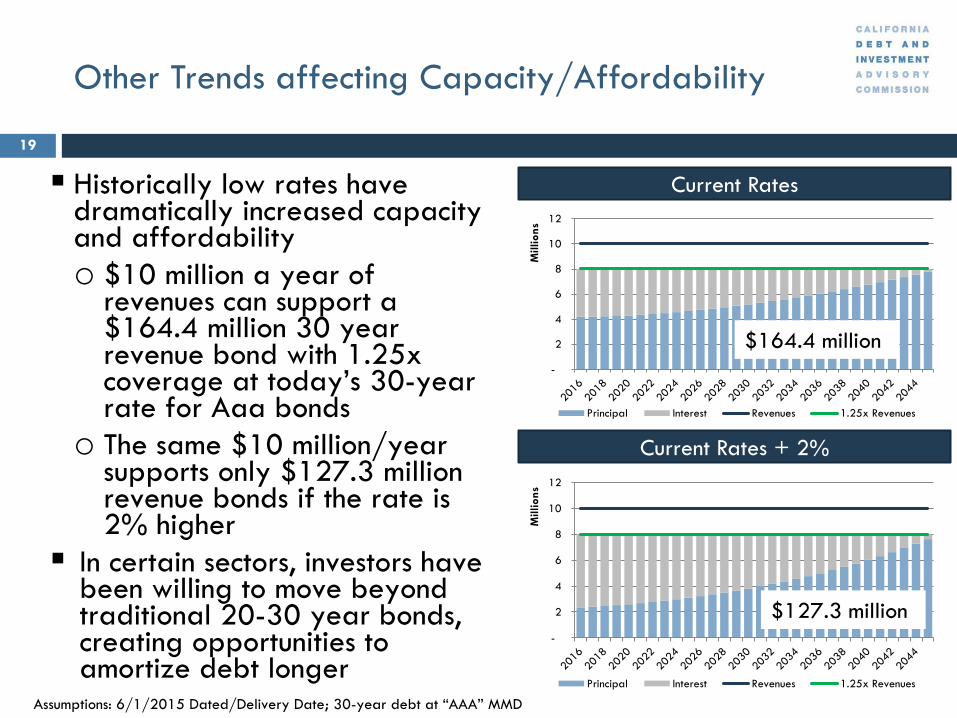
Current Rates Historically low rates have dramatically increased capacity and affordability o $10 million a year of
12
$164.4 million
Million
s M
illion
s
10
8
revenues can support a 6
$164.4 million 30 year 4
revenue bond with 1.25x 2
coverage at today’s 30-year -
Principal Interest Revenues 1.25x Revenues rate for Aaa bonds
o The same $10 million/year Current Rates + 2%supports only $127.3 million
12
$127.3 million
revenue bonds if the rate is 2% higher
10
8
6 In certain sectors, investors have 4been willing to move beyond 2traditional 20-30 year bonds,
-creating opportunities to amortize debt longer
Principal Interest Revenues 1.25x Revenues
Assumptions: 6/1/2015 Dated/Delivery Date; 30-year debt at “AAA” MMD
20
Factors in Finding More Debt Capacity
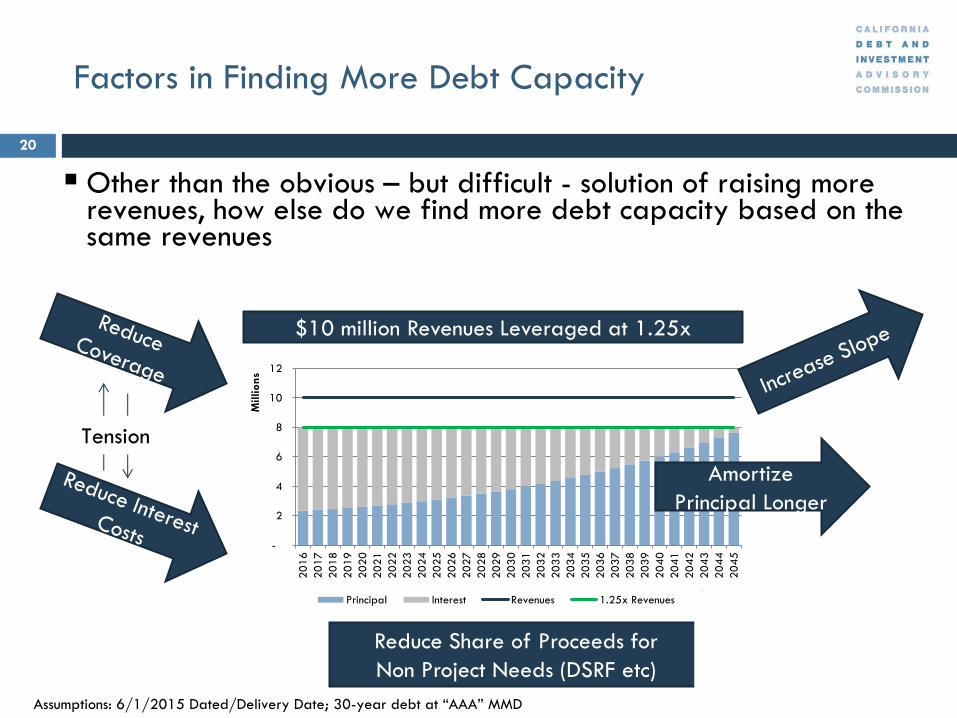
Other than the obvious – but difficult - solution of raising more revenues, how else do we find more debt capacity based on the same revenues
Tension
Million
s
$10 million Revenues Leveraged at 1.25x
-
2
4
6
8
10
12
Amortize
Principal Longer
20
16
20
17
20
18
20
19
20
20
20
21
20
22
20
23
20
24
20
25
20
26
20
27
20
28
20
29
20
30
20
31
20
32
20
33
20
34
20
35
20
36
20
37
20
38
20
39
20
40
20
41
20
42
20
43
20
44
20
45
Principal Interest Revenues 1.25x Revenues
Reduce Share of Proceeds for
Non Project Needs (DSRF etc)
Assumptions: 6/1/2015 Dated/Delivery Date; 30-year debt at “AAA” MMD
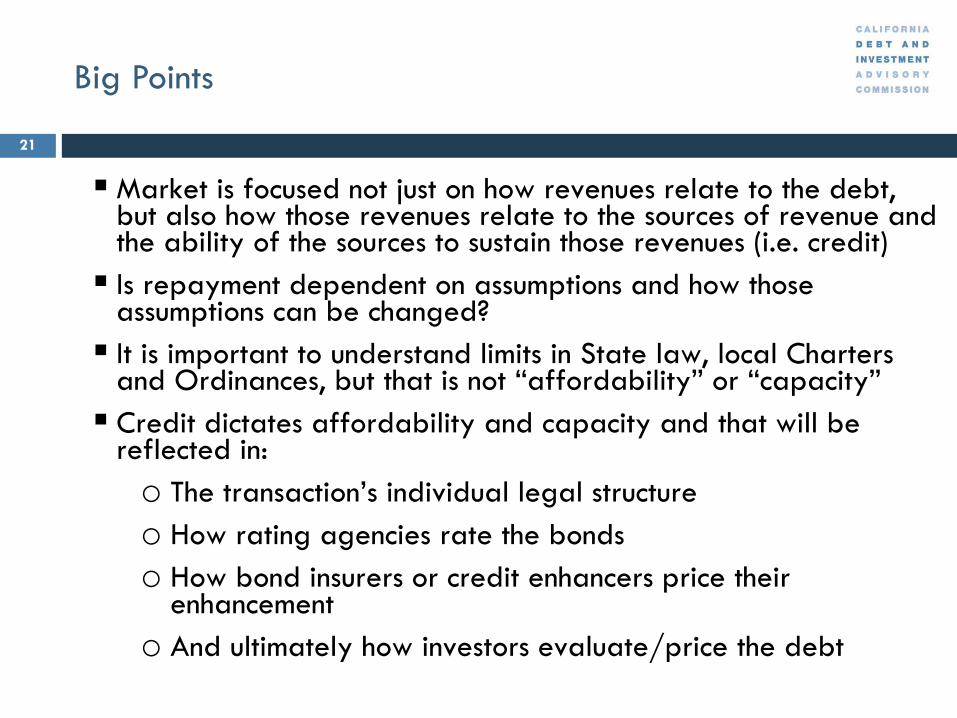
Big Points
21
Market is focused not just on how revenues relate to the debt, but also how those revenues relate to the sources of revenue and the ability of the sources to sustain those revenues (i.e. credit)
Is repayment dependent on assumptions and how those assumptions can be changed?
It is important to understand limits in State law, local Charters and Ordinances, but that is not “affordability” or “capacity”
Credit dictates affordability and capacity and that will be reflected in:
o The transaction’s individual legal structure o How rating agencies rate the bonds
o How bond insurers or credit enhancers price their enhancement
o And ultimately how investors evaluate/price the debt
Questions and Follow Up
22
Nikolai J. Sklaroff
Public Finance Investment Banker
Wells Fargo Securities
333 Market Street, Suit 1500
MAC A0109-154
San Francisco, CA 94105
415-371-2648 Direct
Important Disclosure
This communication is for informational purposes only, is not an offer, solicitation, recommendation or commitment for any tr ansaction or to buy or sell any
security or other financial product; and is not intended as investment. The information contained herein is ( i) derived from sources that Wells Fargo Securities
("WFS") in good faith considers reliable, however WFS does not guarantee the accuracy, reliability or completeness of this in formation and makes no
warranty, express or implied, with respect thereto; and is (ii) subject to change without notice. WFS accepts no liability fo r its use or to update or keep it
current. Products shown are subject to change and availability. Wells Fargo Securities is the trade name for certain securities-related capital markets and
investment banking services of Wells Fargo & Company and its subsidiaries, including Wells Fargo Securities, LLC, member NYSE , FINRA, NFA, and SIPC,
and Wells Fargo Bank, N.A. (“WFBNA”). Municipal Derivatives solutions are provided by WFBNA. This communication is not intend ed to provide, and must
not be relied on for, accounting, legal, regulatory, tax, business, financial or related advice or investment recommendations and does not constitute advice
within the meaning of Section 15B of the Securities Exchange Act of 1934. You must consult with your own advisors as to the l egal, regulatory, tax, business,
financial, investment, and other aspects of this communication. Neither WFS nor any person providing this communication is ac ting as a municipal advisor or
fiduciary with respect to any transaction described or contemplated therein unless expressly agreed to in a written financial advisory or similar agreement.