Embed Size (px)
Citation preview
LISA
William Joseph Weber
Dipartimento di Fisica, Università di Trento
LISA / LISA Pathfinder ProjectLISA / LISA Pathfinder Project
5th VESF School on Gravitational Waves
Sesto Dolomiti
30 July 2010

Laser Interferometer Space Antenna
NASA / ESA Mission, to be launched in 2020
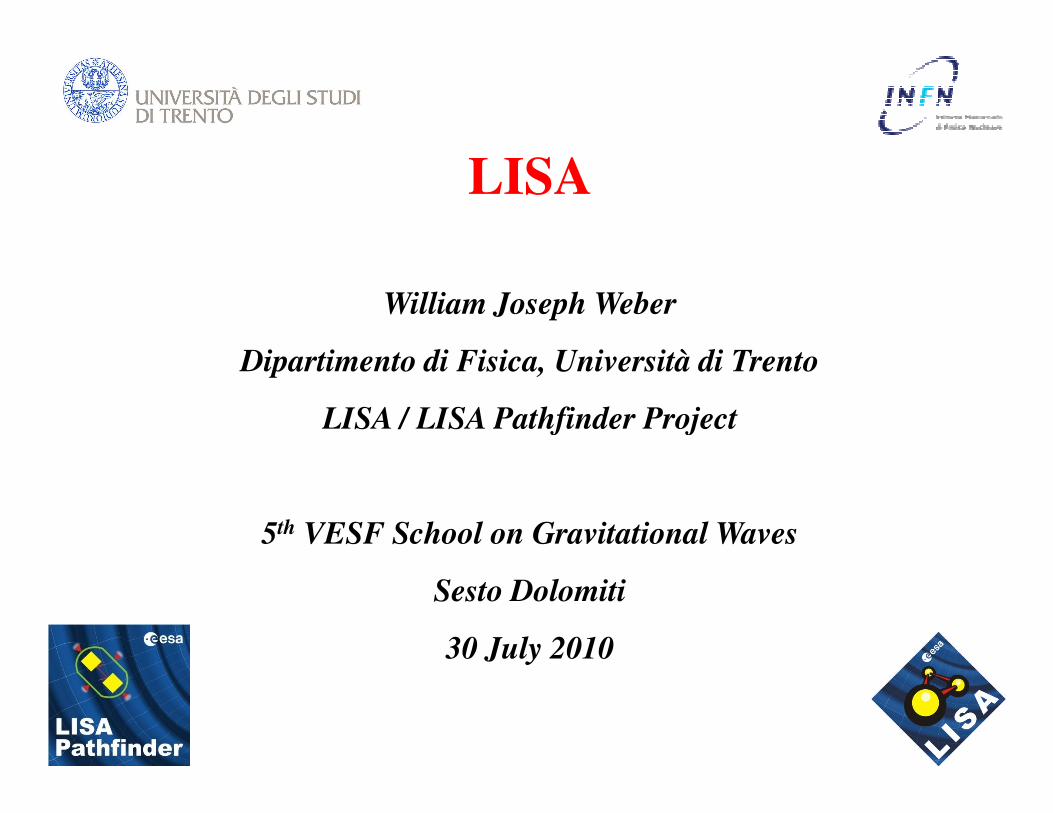
• 2 semi-independent 5 106 km Michelson
interferometers with laser transponders
(measurement noise 40 pm/Hz1/2)
• 3 pairs of “free falling” test masses in 3
“Drag-Free” spacecraft shields
( acceleration noise < 3 10-15 m/s2/Hz1/2)
LISA: Laser Interferometer Space Antenna
( acceleration noise < 3 10-15 m/s2/Hz1/2)
LISA goals:
GW Band: 0.1 mHz – 1 Hz
Sensitivity: Sh1/2 ~ 10-20 Hz-1/2 at 1 mHz
∆∆∆∆(h) ~ 2 10-24 for 1 year integration
5 106 km

LISA Constellation
• 5 million km equilateral triangle
• 60°tilt with respect to ecliptic
• 1 AU from sun, 20°behind earth

Ground and Space GW Observatories Complementary

LISA Signals: mass, separation, chirp time, and distance
Keplerian orbit
frequency ( x 2)
[equal mass
binaries with
circular orbits]
( ) rf
ch~
GW 22τπ
Product of measured strain and measured
decay time gives distance to source!
Black hole
merger
Energy
decay
time τ
( )3
22
a
GMf TOT=π

LISA Gravitational Wave Astronomy:
Compact Object Mergers
Astronomers tell us ...
Most stars are in binary systems
Many stars “collapse” to compact
relativistic stars:
Neutron stars, White dwarfs, black holes
... but they are hard to ... but they are hard to
“see” electromagnetically
Only 5 merging NS-NS systems have been found
(need to be lucky to see the pulsar)
Only roughly 50 ultra-compact binaries observed (mostly WD-
WD)

LISA and Galaxial Binaries
• Known “calibration” signals
Signal “guaranteed” for a functioning LISA!
Verification of GR predictions for GW strain

Recent binary neutron star discovery
PSR J0737-3039
• 2 neutron stars (MTOT ~ 2.8 M◉ )
• 2.4 hour orbital period
• 3 times faster than HT, doubles
strain signal, easier detection at
higher frequency .25 mHz
• 2006 � orbital decay detected,
confirms GR at 1 % level
• possibly detectable by LISA (strain of order 10-21 at 0.25 mHz)?
• important for estimate of galaxial NS-NS binary merger rates (nearest system)
1 / 5000 years in our galaxy � 200 with τ < 1 million years (f > 2 mHz)
• LISA should provide a real measurement of populations of galactic binaries
• “only” 2000 light years away
• several times closer than HT

Stochastic GW noise: galaxial binaries and primordial backgrounds
1 year measurement: µHz 03.
year 1
1≈≈∆f
• 105 frequency bins up to 3 mHz
• many galactic white dwarf binaries (perhaps 108 ), lots per
frequency bin below 3 mHz, produces “noisy” background

Discrimination of noisy confusion limited galactic binary
“foreground”
• Sagnac variable to characterize instrument noise from noisy gravitational
foreground
• Annual modulation of noisy from galactic center
Sample data with instrument noise

Gravitational Wave Astronomy:
Massive Black Hole Mergers
Astronomers tell us ...
Many galaxies have massive black
hole at core
Most galaxies merge
... but we can’t “see” them... but we can’t “see” them
Our Milky Way appears to have
a 3 106 M◉ black hole at its core
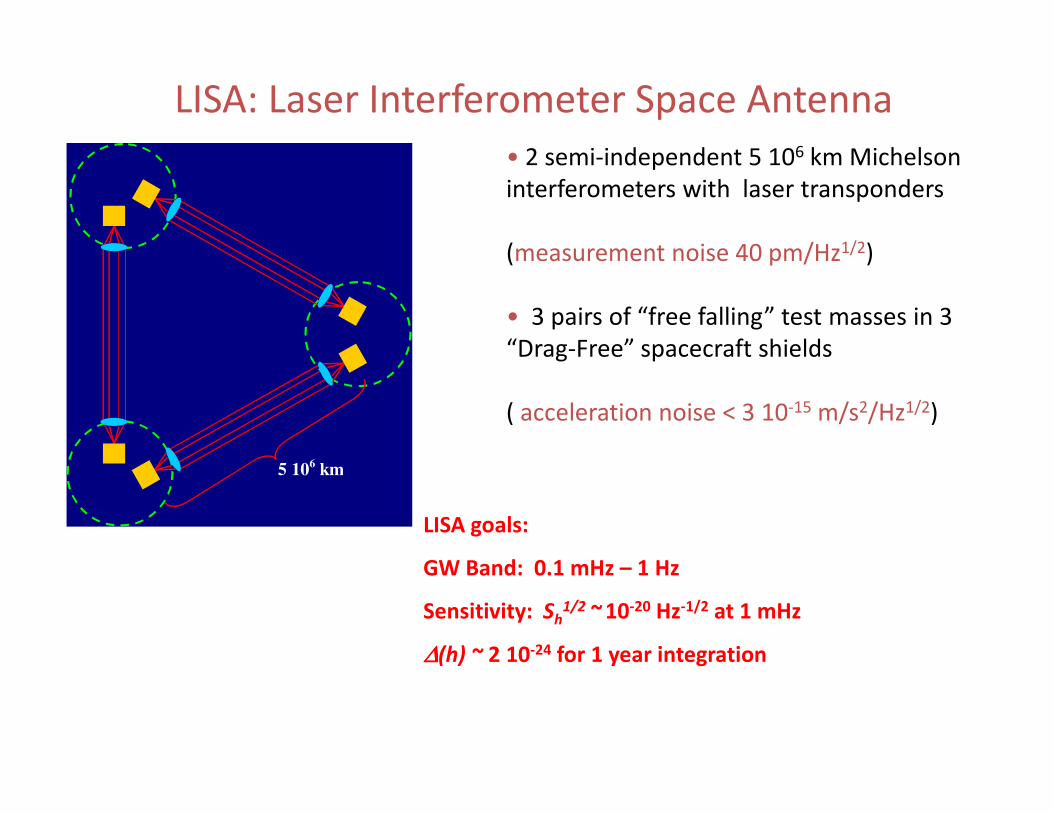
Valtonen et al, Nature, 2008
• Observation of quasi-periodic (12 year) quasar light bursts since 1913, occuring in pairs
Quasar OJ287: gravitational radiation in a massive black hole system
Valtonen et al, Nature, 2008
September 2007 burst � without gravitational
radiation, burst would arrive 20 days later!
10 %-level validation of general relativity
description of gravitational radiation
• Optical bursts from an orbiting object
penetrating accretion disk of a massive black hole
• Mass – 18 109 M◉ — determined by geodesic
precession of eccentricity, 39°/ orbit
• orbit apogee roughly 10 RBH
The next major periodic outburst is expected in early January 2016, by which
time there may be methods to measure the gravitational waves directly.
-- Valtonen, et al, Nature, 2008

• Massive black hole binaries from cores of
merging galaxies (104 -108 M◉ )
• expect to see tens in a 5 year mission
• SNR up to 2000 in one year at z ≈1 – 3 �
observable anywhere in the universe
• visibility up to one year before merger
• chirp rate and amplitude combine to give
Coalescence of Massive Black Hole Pairs
• chirp rate and amplitude combine to give
the luminosity distance (0.2 % -1%
uncertainties)
• frequency and amplitude modulation
combine to give angular resolution (to within a
square degree)
�well calibrated source distances
� formation of MBH as function of
redshift
� with optical counterpart, measure
distance – redshift relationship
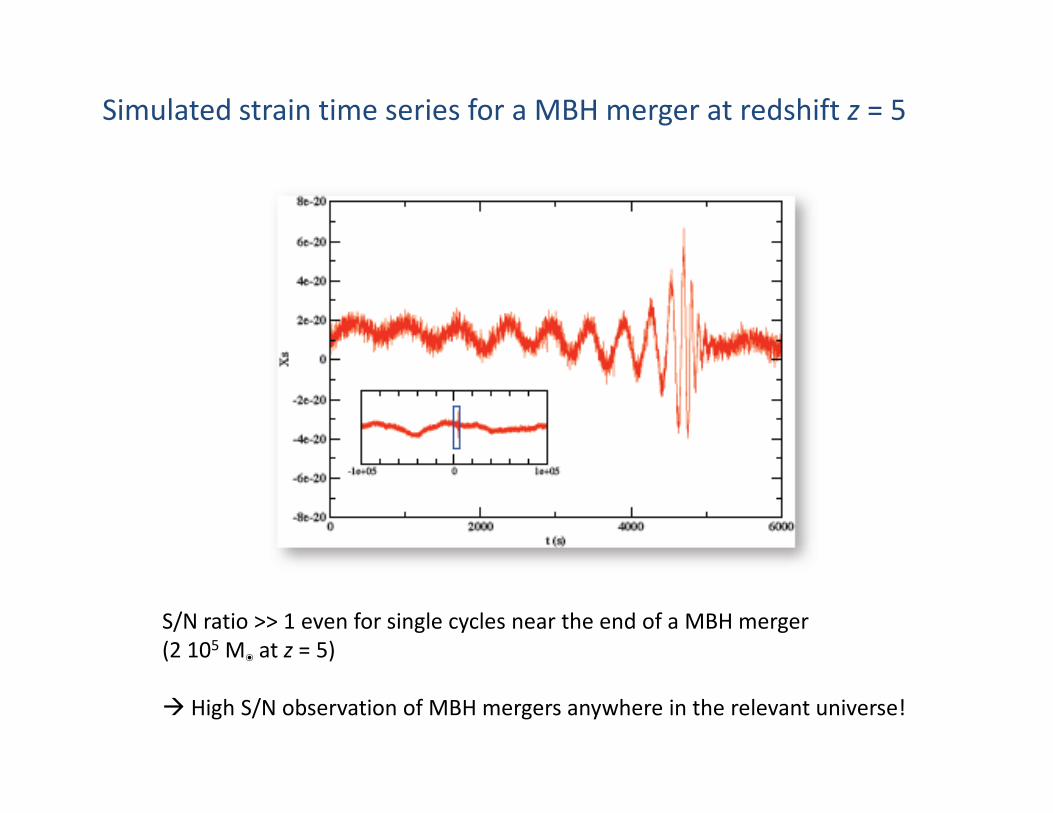
Simulated strain time series for a MBH merger at redshift z = 5
S/N ratio >> 1 even for single cycles near the end of a MBH merger
(2 105 M◉ at z = 5)
� High S/N observation of MBH mergers anywhere in the relevant universe!

Gravitational waves physics
• Gravitational wave observation (phase, polarization, amplitudes)
can probe general relativity in limit of strong gravitational fields,
near black hole event horizons
• Gravitational waves drive dynamics in such systems
• need compact “test particle” – NS or BH – not tidally disrupted
near MBH
Example: small “test
particle” black hole falling
into a massive black hole

LISA Sensitivity Curve
Sensitivity curve for 1 year integration and S/N=5
Photon shot
noise
Test mass
acceleration
noise
Decreased
interferometer
response

SEND
1 W
RECEIVE
~200 pW (< 100 pW final)
Telescope
D ~ 30 cmArriving Beam
~20 km
LISA Interferometry
Laser divergence:
YAG 1.06 µm
L1 L23 5 million km arms: 33 sec 2-way light time
(1st interferometry null at 30 mHz)
1 W ~200 pW (< 100 pW final)
1/2
4
222/1 pm/Hz 10
42≈==
D
L
P
c
P
cS
sentreceived
L
λ
η
λ
π
λ
πδ
hh
Goal: keep all optical path errors within 40 pm/Hz1/2
Shot Noise:
Laser transponding: outgoing light phase locked to incoming beam
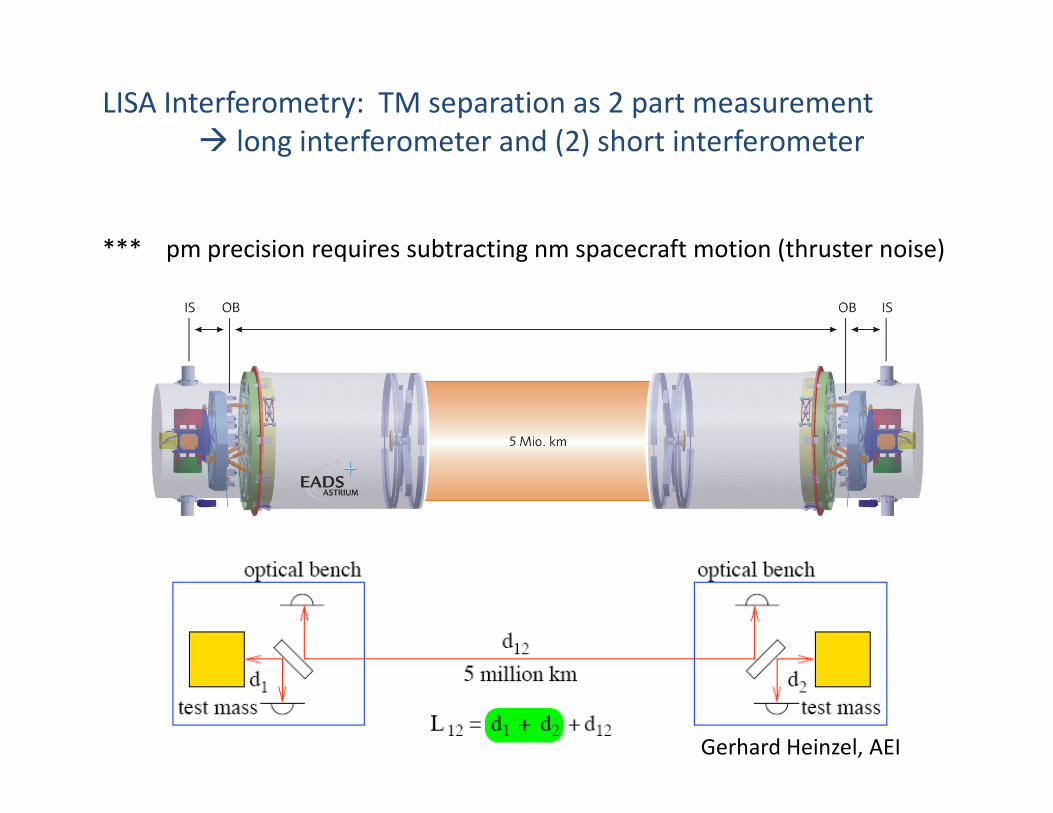
LISA Interferometry: TM separation as 2 part measurement
� long interferometer and (2) short interferometer
*** pm precision requires subtracting nm spacecraft motion (thruster noise)
Gerhard Heinzel, AEI


LISA Optical Bench
� Astrium Germany design, ESA study
Light from 2 lasers
L1 � to remote SC (1 W), local TM
L2 (beam for 2nd arm) � local oscillator
for incoming beam and TM readout
3 interferometers
TM readout (L1, L2 as LO)
Remote beam readout (far laser, L2 as LO)
L1 – L2 measurement of relative phase noise

LISA Low Frequency Sensitivity:
Importance of free-fall
2
2/1
minmin
1
ωm
S
TLL
Lh
f≈
∆≈
Stray acceleration
noise (1/f2 ) for flat
spectrum
hmin ~ 10-23 at 1 mHz (S/N=5) requires Sf1/2/m ~ 3 10 -15 m/s2 / Hz1/2

Purity of free-fall critical to LISA science
Example: massive black hole (MBH) mergers
Integrated SNR at 1 week intervals for year before merger
Assuming LISA goal:
Sa1/2 < 3 fm/s2/Hz1/2
at 0.1 mHzat 0.1 mHz
Acceleration noise at and below 0.1 mHz determines how well, how far,
and how early we will see the most massive black hole mergers.
� do we see the merger for long enough to use orbital
modulation to pinpoint it? To search with optical telescopes?

LISA “differential accelerometry” performanceMeasurement of tidal accelerations between 2 or more
geodesic reference test masses
2
ha Lhω∆ ≈
2
measure na xω∆ ≈
f∆
effective “GW
acceleration”
distance
measurement noise
Stray force noise �
• LISA differential accelerometry represents a large leap in performance
� requires significant design changes
� requires experimental verification
• Free-fall at low frequencies difficult to test on ground
� Dedicated geodesic motion flight mission � LISA Pathfinder
force
fa
m
∆∆ ≈
Stray force noise �
imperfect geodesic
motion

Spacecraft shield
(mass M)
Stray forces and drag-free control
µNewton Thrusters
“Drag Free” loop gain
MωDF2
• Solar radiation pressure would give
10 nm / s2 acceleration to 1 kg test
mass
Springlike coupling to spacecraft
motion (“stiffness”) mωp2
“internal” stray forces fstr
Relative position
measurement xm
m
motion (“stiffness”) mωp
external forces on
satellite Fstr
Common problem for several precision space experiments: LISA,
GPB, STEP ...

++=
2
2
DF
strnp
strres
M
Fx
m
fa
ωω
Residual acceleration noise:
Relative spacecraft – TM
LISA Drag-free Control
Role of LISA drag-free control is to reduce test mass acceleration noise, with
respect to distant test mass
NOT to minimize relative spacecraft motion
NOT to produce most precise spacecraft orbit
Relative spacecraft – TM
motion
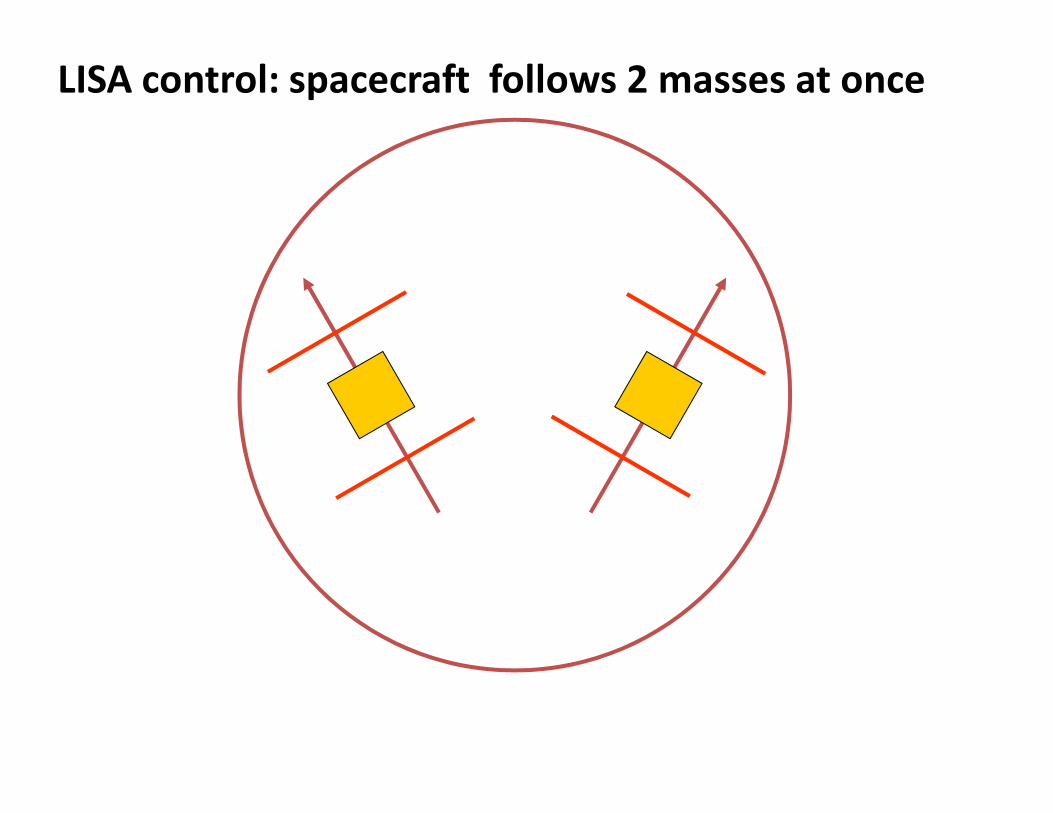
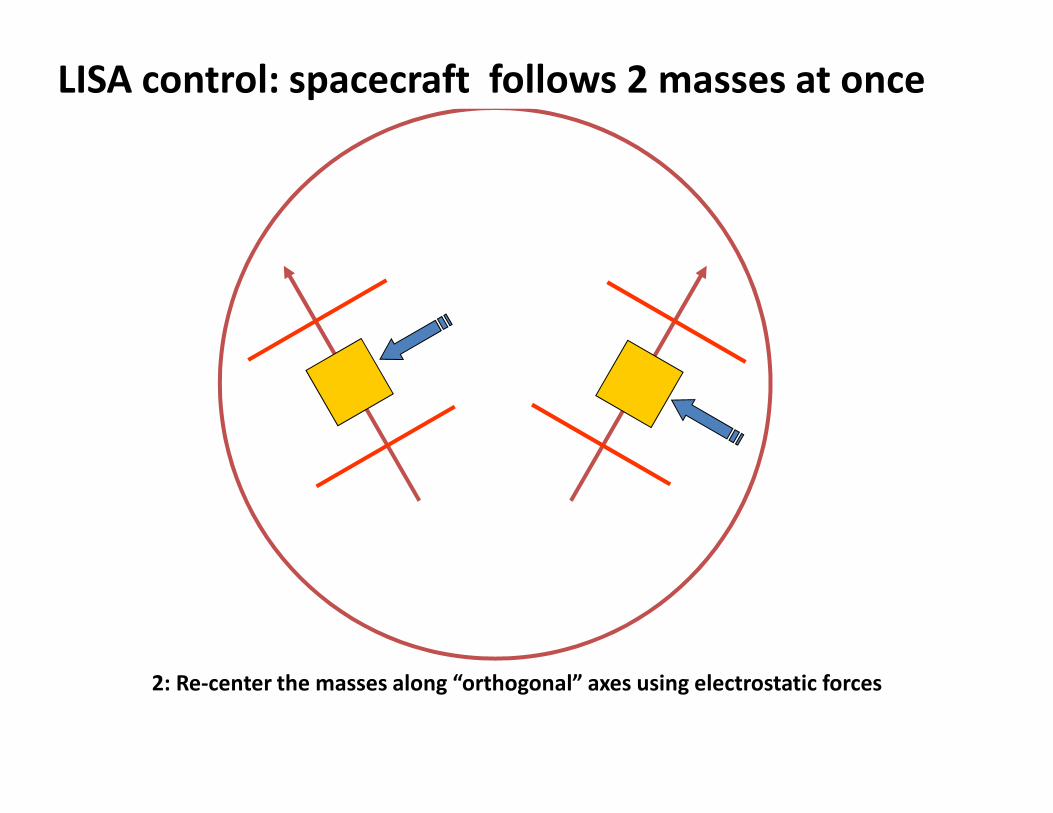
LISA control: spacecraft follows 2 masses at once

LISA control: spacecraft follows 2 masses at once

LISA control: spacecraft follows 2 masses at once

LISA control: spacecraft follows 2 masses at once
1: Move the spacecraft and centre the masses along laser beams

LISA control: spacecraft follows 2 masses at once
1: Move the spacecraft and centre the masses along laser beams

LISA control: spacecraft follows 2 masses at once
1: Move the spacecraft and centre the masses along laser beams

LISA control: spacecraft follows 2 masses at once
1: Move the spacecraft and centre the masses along laser beams

LISA control: spacecraft follows 2 masses at once
2: Re-center the masses along “orthogonal” axes using electrostatic forces

LISA control: spacecraft follows 2 masses at once
2: Re-center the masses along “orthogonal” axes using electrostatic forces
LISA control: spacecraft follows 2 masses at once
2: Re-center the masses along “orthogonal” axes using electrostatic forces

LISA control: spacecraft follows 2 masses at once
Need to sense all 6 degrees of freedom of the test mass
Need to apply (electrostatic) actuation forces on non-interferometry degrees of
freedom

Key LISA test mass acceleration noise sources
dx
Residual acceleration noise:
Springlike coupling to spacecraft:sensor readout stiffness (ωp
2xn ~ d)gravity gradients
10-6 N/m
External forces on
SC, finite control
loop bandwidth
Gap
++=
2
2
DF
strnp
strres
M
Fx
m
fa
ωω
gas damping
magnetic noise
readout back action (~ d-2)
Stray electric fields + charge/dielectric noise (~ d-1 ,d-2 )
∆T� radiation pressure, radiometric, outgassing effects
Local gravitational noise
Control force noise (leakage)
6 fN/Hz1/2
Sensor noise
Low frequency stability!
2.5 nm/Hz1/2

Gravitational Reference Sensor Design
• 46 mm cubic Au / Pt test mass (1-2 kg)
• 6 DOF “gap sensing” capacitive sensor
• Contact free sensing bias injection
• Resonant inductive bridge readout (100 kHz)
• Defines TM environment
• Provide nm/Hz1/2 measurement on all axes
• Provides electrostatic voltages (force, measurement)
VACT1
VACT2
VM
Cs1
Cs2
VAC
100 kHz L
L
Cp
Cp
• Resonant inductive bridge readout (100 kHz)
• ~ 1 nm/Hz1/2 thermal noise floor
• Audio frequency electrostatic force actuation
�avoid DC voltages
• Large gaps (2 – 4 mm)
� limit electrostatic disturbances
• High thermal conductivity metal (Mo) / sapphire
construction
� limit thermal gradients

Completing the GRS• Caging (2000 N load during launch)
• UV light photoelectric TM discharge system
• Vacuum chamber + getter pumps (10-5 Pa)
• Optical windows for IFO readout

What do we know about LISA free-fall performance ?
� experimental verification• LISA differential accelerometry represents a large
leap in performance
� requires significant design changes
� requires experimental verification
Two approaches ...
�Torsion pendulum small force testing
(Low frequency free-fall difficult to test on ground)
� Dedicated geodesic motion flight mission �
LISA Pathfinder
LISA
LPF is a single interferometry arm of LISA squeezed into a single spacecraft
LPF

LISA Pathfinder (2012): Einstein’s Geodesic Explorer
Mostly ESA test mission for free-
fall in LISA and other future
precision space missions
Shrink 1 LISA arm from 5 million km to 30 cm
Flight test of LISA free-fall at 30 fm/s2/Hz1/2 level at 1 mHz
Flight test of LISA local interferometry measurement at 10 pm/Hz1/2 level

Testing free-fall for LISA Measure differential acceleration between 2 free-falling TM
2TM in 2 spacecraft
(basically LISA)
2TM in 1 spacecraft
(LISA Pathfinder)
LISA
LPF is a single interferometry arm of LISA squeezed into a single spacecraft
LPF
(LISA Pathfinder)

LISA Pathfinder Mission• Launch 2012
• Roughly 2 month journey to Lagrange point 1
• Commissioning + 3 months LTP (ESA), 3 months DRS (NASA)
VEGA Launcher

Free-fall flight test: LISA Pathfinder
x
Xbase
~ 30 cm
TM1 TM2
drag-free
electrostatically
suspended
∆x12≡x2 - x1
• Compare relative noise in orbits of two “free-falling” test masses
• 1 spacecraft, 1 measurement axis (30 cm baseline)
• Relative displacement ∆x12 measured with interferometer to probe drag-free
performance
Optical interferometer Differential displacement ∆x12
LTP Goal: demonstrate ares < 30 10-15 m/s2/Hz1/2 for f > 1 mHz
(relaxed from LISA by factor 10 in both acceleration noise and frequency)

LPF primary measurement: stray force noise fstr
TM1 TM2
∆x12
• Satellite follows TM1 with sensor x1 and µN thrusters
• TM2 forced to follow TM1, using differential x1 – x2 IFO
and sensor 2 electrostatic actuation
• Open-loop differential acceleration in differential IFO
signal (calibrate transfer function)
21 2 2 22 ω2 2 , 22 2 2 ω
f∆x ω δxω x ω
IFO p p n opt pmω ω ω
ω
− = + + − − + − − +
Ff2str1 x
n1 1p2M
Baseline stability
(Zerodur)
Differential
force noise
++=
2
2
DF
strnp
strres
M
Fx
m
fa
ωωLISA
2
1
2 2 22 ω2 2 , 2LPF
f∆a x ω δxω x ω
p p n opt pmω
− = + ∆ − − + −
f211p
2 2 , 22 2 2 ω2
IFO p p n opt pmω ω ω
p ES
− +
n1 1p2MDF
Satellite coupling (can be
tuned to zero)IFO readout noise
LPF

LISA Pathfinder differential accelerometer “instrument performance”
LPF
LISA
• Not shown (order 0.1 fm/s2/Hz1/2): baseline thermal distortion and stiffness terms
• Actuation noise: order 6 ppm/Hz1/2 at 1 mHz (1/f in power), 0.65 nm/s2 DC acceleration
• Readout 9 pm/Hz1/2, relaxed as 1/f2 below 3 mHzLISA Symposium, Stanford, 29 June 2010
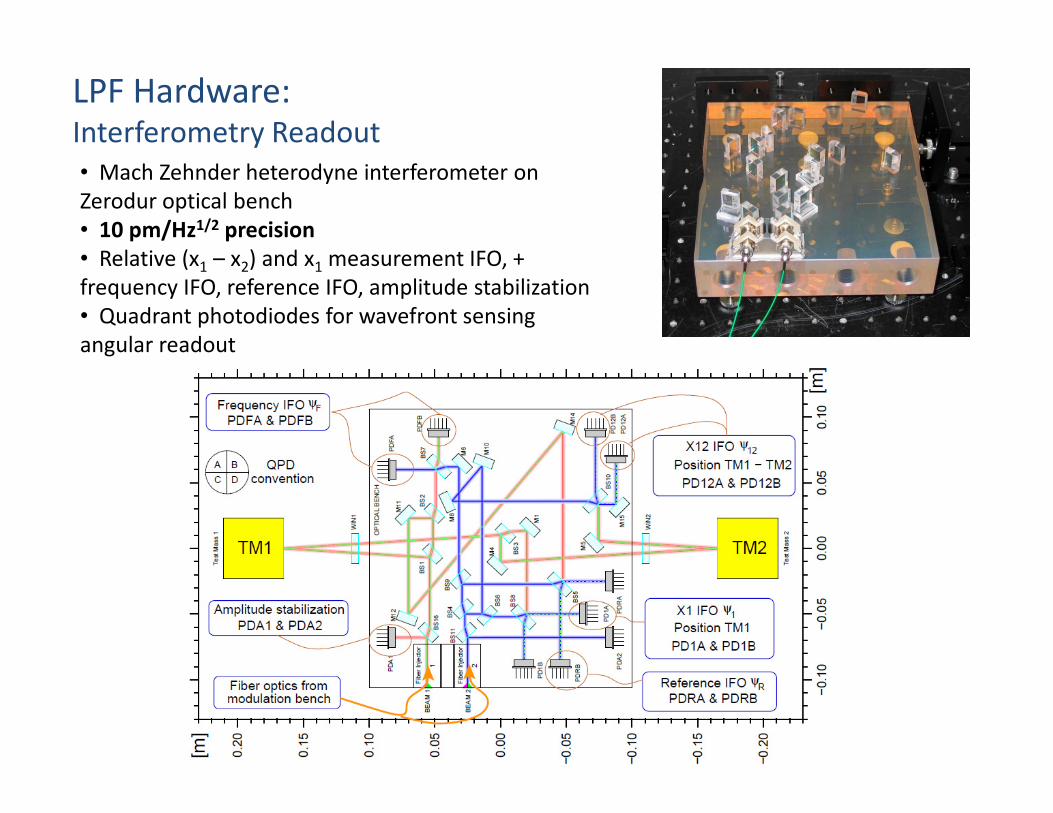
LPF Hardware: Interferometry Readout
• Mach Zehnder heterodyne interferometer on
Zerodur optical bench
• 10 pm/Hz1/2 precision
• Relative (x1 – x2) and x1 measurement IFO, +
frequency IFO, reference IFO, amplitude stabilization
• Quadrant photodiodes for wavefront sensing
angular readout

Testing LPF optical metrology: Overall performance test
+×
2
1/2 mHz 31pm/Hz 6
f
OMS performance achieved across entire LPF band• Performance achieved in harsher conditions – longer fiberlinks and pathlength differences, sub-optimum use of detector dynamic range LISA Symposium, Stanford, 29 June 2010

LISA Pathfinder: performance limited by 2 TM in 1 SC
� gravitational balancing and applied forces
• SC can only follow 1 TM along x (2 TM, 1 sensitive axis)
(UNLIKE LISA!!)
• Any differential DC acceleration must be balanced by
applied (electrostatic) forces
• Noise in applied voltage gives noisy force
g1g2
2
1/ 2 1/ 22
F V
S FS
∝
=
21.3 nm/sg∆ <
GRS compensation masses �
reduce 30 nm/s2 to 0.1 nm/s2
Modelling accuracy, positioning
1/ 2 1/ 2
/
1/ 2 1/ 2
/
2
2
F V V
a DC V V
S FS
S g S
δ
δ
=
= ∆1/ 2 6 1/2
/ 2 10 /HzV VSδ−< ×

2
1/ 2 1/ 2
/
1/ 2 1/ 2
/
2
2
F V V
a DC V V
F V
S FS
S a S
δ
δ
∝
=
= ∆
2
1/ 2 6 1/2
/
1.3 nm/s
2 10 /HzV V
g
Sδ−
∆ <
< ×
LISA Pathfinder: performance limited by 2 TM in 1 SC
� gravitational balancing and applied forces
• Actuation voltage carrier
amplitude measured to be stable to 3
roughly 8 ppm/Hz1/2 at 1 mHz
�Less than 10 fm/s2/Hz1/2
acceleration noise
(electronics Contraves Space,
test U. Trento / ETH Zurich)

LISA Pathfinder: avoiding actuation instabilities with free-fall mode
compensate average DC force imbalance by applying a large impulse
followed by free-fall (parabolic flight!)
x
Grynagier, CQG 26 (2009) 094007
• Example: Apply 300 x average needed force for 1s, followed by 300 s free-fall
• Keep displacement to 10 micron range
• Analyze force spectrum, without applied actuation forces, even to lower
frequencies, with windowed spectrum estimation
Grynagier, CQG 26 (2009) 094007

LPF stray force measurement:Given instrumental noise limit, what do we know aboutsources of test mass acceleration noise ?
Instrument limit
LISA Symposium, Stanford, 29 June 2010

Mo / Shapal EM
(4 mm gaps,
LPF geometry)
Mo / Sapphire LPF EM
UTN test campaign: free-fall inside LISA / LPF GRS prototypes
LPF FM-replica +
ELM electronics
1-mass torsion
pendulum
(torques)
4-mass torsion pendulum
(direct force sensitivity)
Lightweight TM � test surface forces
Bulk forces (gravitational, magnetic) tested
separately and with LISA PF
LISA Symposium, Stanford, 29 June 2010

• With flight model-replica electronics
• Flight model TM polishing and coating
Torsion pendulum IS testing in Trento Hardware under test: Electrode Housing REPLICA

Torsion pendulum ground testing of LISA Free-fall
Measure stray surfaces forces as
deflections of pendulum angular
Light-weight test mass suspended as
inertial member of a low frequency
torsion pendulum, surrounded by
sensor housing
deflections of pendulum angular
rotation
to within < 100 LISAgoal
<10 LTP goal
Precision coherent measurement of
known disturbances

Multiple degree of freedom torsion pendulum for testing free-fall
Sensitive force measurements on (at least) 2 TM
degrees of freedom
• Can we achieve femto-g free fall in one axis
while actively controlling another TM along
another axis?
• How does control along some axes leak into
forces and force gradients along other axes?
Can we perform pm measurements with a TM • Can we perform pm measurements with a TM
that is moving in all 6 degrees of freedom?
PETER (pendolo roto-traslazionale)
In development at U. Firenze and U. Roma
Tor Vergata
“soft” torsional and translational degrees of
freedom

Single mass torsion pendulum for
LISA ground testing
• 110 gm TM + mirror (hollow Al, Au coated)
• 25 µm, 1 m long W fiber � 2 mHz
resonant frequency, Q ≈3000
Fused silica fiber, Q ≈ 800000 (τE ≈ 2 years)
• Passive magnetic damping of swing mode
(τ 100 s for swing mode)(τ 100 s for swing mode)
• Autocollimator and capacitive readouts
• On demand electrostatic damping
/actuation of swing mode
• Turbo vacuum pump 10-7 mB
• Thermally controlled foam room (50 mK
long term stability)

Sensor OFF
stray stiffness
Sensing
electrostatic
stiffness
Measure force gradient for satellite coupling
2strres p
fa x
mω= + ∆
Total LISA stiffness budget: ~ 1000 nN / m
Measured “stray” stiffness (sensor OFF) ~ 5 nN / m (DC bias? δVRMS ~ 90 mV)
• Unexpected stiffness likely not an issue for LISA (4 mm gaps!)
• LISA Pathfinder will perform full stiffness measurement (including gravity gradients)
Sensor stiffness (modeled): ~ 100 nN / m
LPF sensor bias

Order of magnitude estimate:
[ ]
2
0
0
2 0
imbalance thermal
rate of impacts momentum
x
B
B
F
k Tn L V m
m
mpL V V
k Tβ
≈ ×
≈ − ×
≈ − ≡ −
F⊥
x
Brownian force noise from residual gas damping
4F BS k T β= Viscous gas damping coefficient
F⊥
x
F⊥
x
2
04 4F B B
S k T pL m k Tβ= ≈⊥
||F
More accurate (normal + shear forces,
correlated incoming + reemission :
2
0
5121
8F B
S pL m k Tπ
π
= +
⊥
Enclosure inside sensor amplifies force noise
• Correlations between impulses from repeated impacts of
same molecule � slower averaging out of force noise
• Flow impedance of small channels around TM cause pressure
build-up with TM motion
⊥
||F

Brownian force noise from gas
damping: Numerical simulation• Maxwell-Boltzmann velocity distribution
• inelastic collisions, random cosine-law reemission
• calculation of force and torque spectra from
mean square momentum transfer
z
y x

Equal gaps
Actual sensor: dx = 4 mm, dy =
2.9 mm, dz = 3.5 mm, holes
Factor 13
increase in
Brownian acceleration noise: estimates for LISA
Infinite gap model
increase in
noise power
1/ 41/ 2
1/ 2 2 0
55 fm/s
10 Pa 30a
mpS
−
≈ × ×
Acceleration noise for LISA / LPF
� Need to improve to 10-6 Pa pressure with LISA

Gas damping: experimental results
Differential measurement (with and
without GRS)31
31
43 nm s
49 2 nm s
SIM
TM
EXP
TM
d
dp
d
dp
β
β
=
= ±
34
34
4.6 m s
5.7 0.3 m s
SIM
TM
EXP
TM
d
dp
d
dp
βµ
βµ
∆=
∆= ±
Simulation and experimental results consistent at 15% level
(pressure gauge calibration level)

Noise source: Brownian noise from residual gas
Gas damping
LISA
LPF
Instrument
• Depends on pressure (p1/2)
• 10-5 Pa for LPF (getter pumps)
• 10-6 Pa needed for LISA (vent to space)
• White noise, uncorrelated with any other external variable
• Possibility of identifying noise source (in case of excess) with DT measurement
LISA
LISA Symposium, Stanford, 29 June 2010

Thermal gradient-induced forces
PRD, 76 102003 (2007)
38
3
27 pN/K
rad press RP
RP
ATF T
c
σκ
κ
= ∆ ×
≈ ×
4
18 pN/K
radiom RAD
RAD
TF AP
Tκ
κ
∆= ×
≈ ×1.25
RADκ ≈
0.3 ( =95%)RP
rκ ≈
T∆
radiometric
radiation
pressure
outgassingNumerical
2 ???outgas outgas
TF Q
T
∆∝ Θoutgassing
Numerical
simulations for
“finite size”
calculations
• dF/d∆T ~ 100 pN / K
� need S∆T1/2 < 10 µK / Hz1/2
• outgassing hard to predict � need a measurement

Thermal gradient-induced forces
� Direct measurement of force coupling dFx/d∆T
relevant to LISA force noise
� Much easier analysis of temperature distribution
Preliminary results:
• Verify radiometric model (10%)
309 K
298 K
• Verify radiometric model (10%)
• Outgassing observed (pre-bake)
� Zero pressure data
increase faster than
radiation pressure’s T3
• Measure roughly 100 pN/K at
10-5 Pa / 25 C
LISA pressure
10-5 Pa
LISA goal (100 pN / K)
• Looks OK for LISA
• Experiment to be repeated on LPF
• Will characterize thermal environment on-board

Noise source: Thermal gradient fluctuations
Thermal gradient
LISA
LPFInstrument
• Thermal analysis gives (worst case) 4 mK/Hz1/2 at 1 mHz
� certainly worse at lower frequency!
• Experimentally measured dF/dDT ≈ 100 pN / K (≈ half outgassing)
• LPF – in-flight calibration of dF/dDT (probe of gas pressure – gas damping)
• LPF – in-flight monitoring of noise in T, DT � verify thermal modelling for LISALISA Symposium, Stanford, 29 June 2010

q
(VM)
∆x / 2
δV1 δV2
xx
TOT
ii
TOT
x
C
C
q
Vx
C
C
qF
∆∂
∂≡
∂
∂= ∑ δ
TM charge Q
Stray electrostatic potentials δδδδV
Noise source: interaction between TM charge and stray electrostatic field
×
×
∆
×≈
∆∂
∂=
fN/Hz 7
2
2/1
1/2
2
2/1
f
x
C
C
eS
EFFx
x
T
EFF
F
λ
ω
λ Random charge noise
mixing with DC bias (Dx)
×
×
×≈mHz 1.0 /s300mV 100
fN/Hz 7
• Budget assumes 2000 e/s and 100 mV imbalance (uncompensated)
• compensation to <1 mV demonstrated, drift to order 5 mV in 1 month
×
×≈
∂
∂=
∆
∆
1/2
2/1
7
1/2
2/12/1
V/Hz 100 10fN/Hz 6.1
µx
x
S
e
q
Sx
C
C
qS
T
F
Noisy average “DC” bias (SDx)
mixing with mean charge
• non-stationary as charge drifts (2 106 -- 107 charge in one day)
• 100 mV / Hz1/2 current measurement resolutionLISA Symposium, Stanford, 29 June 2010

Experimental verification of stray potential compensation
δV1Α
δV2Α
δV1Β
δV2Β
V∆+VCOMP
+VCOMP
-VCOMP
-VCOMP
• Measurement (and FEE resolution) allow sub-mV compensation of Dx
• Modulation technique does not measure exact combination of DC bias relevant to TM
charging
o Observed to cause error of order 10 mV � possible need to verify
compensation with controlled TM charge variation
o Observed drifts small (order several mV in 1 month) � infrequent
compensation needed
δV2Β-VCOMP
LISA Symposium, Stanford, 29 June 2010
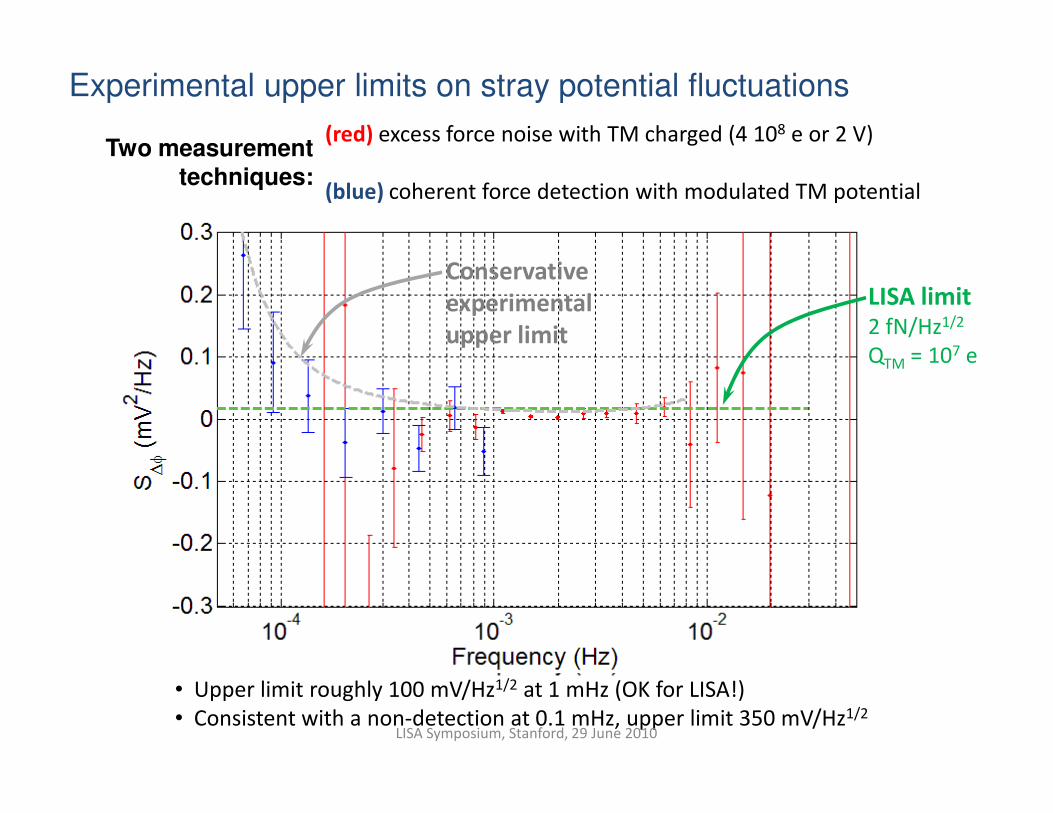
LISA limit2 fN/Hz1/2
QTM = 107 e
Conservative
experimental
upper limit
Experimental upper limits on stray potential fluctuations
Two measurement
techniques:
(red) excess force noise with TM charged (4 108 e or 2 V)
(blue) coherent force detection with modulated TM potential
• Upper limit roughly 100 mV/Hz1/2 at 1 mHz (OK for LISA!)
• Consistent with a non-detection at 0.1 mHz, upper limit 350 mV/Hz1/2
LISA Symposium, Stanford, 29 June 2010

Noise source: electrostatic noise
Fluctuations in ∆∆∆∆x
LISA
LPFInstrument
• Stray voltage fluctuations: upper limit 100 µV/Hz1/2 at 0.1 mHz
• random charge: assume balancing to 10 mV, effective charge rate 300 e/s
Random charging
LISA Symposium, Stanford, 29 June 2010

Bx
mFx
rr
∂
∂= .
0
0µ
χ BVmm
rrr
+=
• Fluctuations in magnetic field:
• Fluctuations in gradient:
2/10i SVB
m
+χ
x
BS
V iBi ∂
∂ 02/1
0µ
χ
Force noise source: interaction of magnetic moment and B field
• Down conversion of field / gradient interaction:
(χ frequency dependent, Faraday and skin effect)
2/1
/
0
00 xB
ii i
SVB
m ∂∂
+
µ
χ
( ) ( ) ( ) ( ) ( )x
BB
i
is
x
tBtVBt ii
ii
∂
−∂
+−≈
∂
∂ ''
'1
'
0
3
0
ωωω
τω
τω
µµ
χ
( ) Hz 45024
22
1
0
21
≈
≈≈
−
− σµππτ
sfON
Onset (“superconductor limit”)
Shielding cutoff from
surrounding metal:kHz 1≈CUTfLISA Symposium, Stanford, 29 June 2010

LISA Pathfinder Test MassAu/Pt alloy for low susceptibility, low residual moment
TM Requirements: -5
8 2
0
10
10 Amm
χ−
<
<r
Field requirements:
T/m 5
T 1
0
0
<∂
<
B
B
r
r
µ
µ
Measured EM TM properties
Key noise sources:
• Fluctuating induced moment
(interplanetary field) interacting with
stable (spacecraft) field gradient
• AC Eddy current downconversion
kHz 1 tonT/Hz
T/m 5
1/2
0
<
<∂
∂
RMSACB
x
B
r
µ
5
2
0
102
nAm 20
−×≈
≈
χ
mr
LISA Symposium, Stanford, 29 June 2010

Noise source: magnetic noise
AC Magnetic
(down conversion)
LISA
LPFInstrument
Interplanetary B fluctuations in band
• down-conversion of AC magnetic field (white)
� magnetic field of 0.2 nT RMS up to 1 kHz cutoff
� based on spacecraft AC magnetic field measurement
• assume field gradient of 12 mT/m, measured interplanetary fluctuations of 55 nT/Hz1/2
• in-flight measurement of static moment + susceptibility planned B fluctuations
(down conversion)
LISA Symposium, Stanford, 29 June 2010

Torsion pendulum upper limits on GRS force noise:
Mo / sapphire sensor + EM FEE, 1TM pendulum
Angular deflection measurement with two readouts (GRS and autocollimator)
� distinguish true torque noise floor from background readout noise
{ },AC SN N NS S= ℜ
Recent upgrade of
torsion fiber from
Tungsten (Q =3000)
to Fused Silica (Q =
700000)

Upper limits on GRS force noise:
conversion from torque � force (acceleration)
• rule out large class of TM surface disturbances at level of 50 fm/s2/Hz1/2 at 1 mHz
• within factor 2 of LPF goal
• achieving similar acceleration noise levels with LISA would allow observation
of galactic binaries

Detecting force noise excess under different conditions:
Measurement resolutionLISA Pathfinder requirement
Noise difference between two groups of nominally identical noise runs
(roughly 30 25000 s cuts each) is zero to within the LPF noise goal
� can detect force noise excess of order LPF resolution
Examples: w / wo TM charge, w/wo sensor turned on, w/wo sensorLISA Symposium, Stanford, 29 June 2010


This
docum
en
t is
the p
rop
ert
y o
f A
str
ium
. It s
hall
not
be c
om
mun
icate
d t
o t
hird p
art
ies w
ithou
t prior
written a
gre
em
en
t. I
ts c
onte
nt
shall
not
be d
isclo
sed.
Astrium Satellites
This
docum
en
t is
the p
rop
ert
y o
f A
str
ium
. It s
hall
not
be c
om
mun
icate
d t
o t
hird p
art
ies w
ithou
t prior
written a
gre
em
en
t. I
ts
LTP Progress Meeting #12, ASD, 23/24 April 2008 p80
81

ESA LTP
Collaboration
Trento LISA Team
Stefano Vitale (LPF PI)
Federica Antonucci, Matteo Benedetti, Daniele
Bortoluzzi, Antonella Cavalleri, Rita Dolesi,
Mauro Hueller, Daniele Nicolodi, Antonio
Perreca, Bill Weber