Embed Size (px)
Citation preview

2014ANNUAL REPORT
Setting a New Standard
OIL AND GAS MEDICAL
Corporate Profile
Highlights 2014
Interventional Cardiology – FFR
Oil and Gas and Industrial
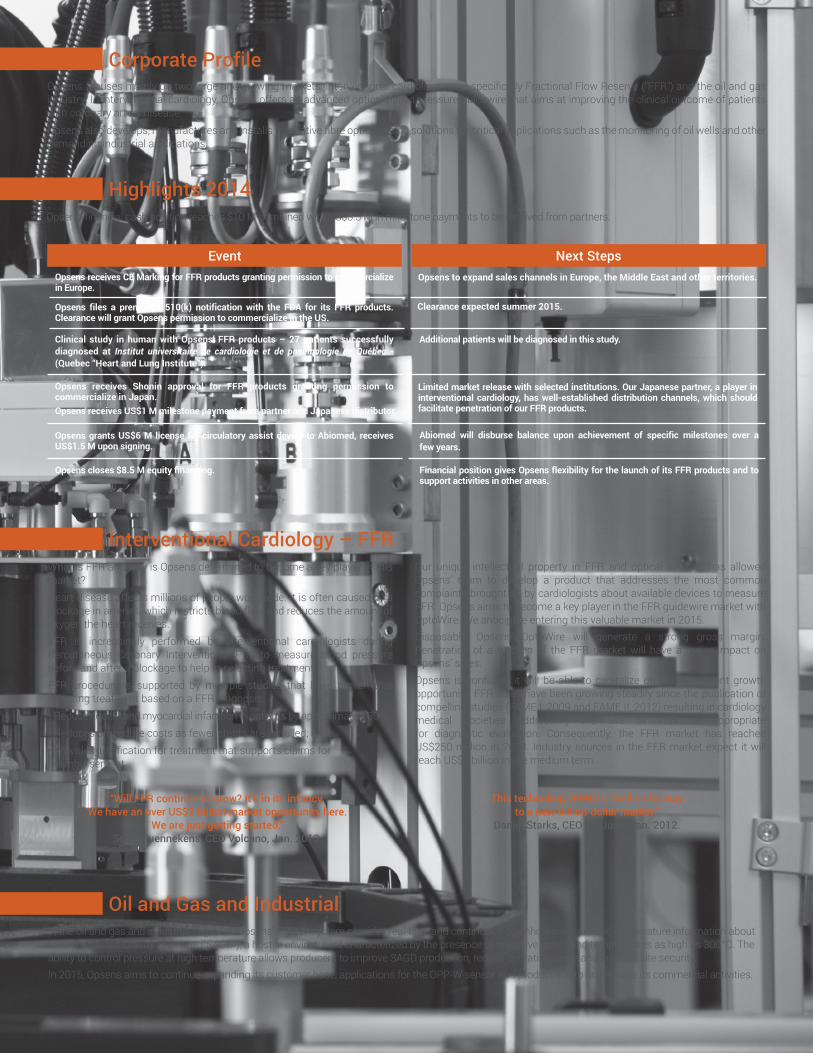
Opsens focuses mainly on two large and growing markets: interventional cardiology more specifically Fractional Flow Reserve ("FFR") and the oil and gas industry. In interventional cardiology, Opsens offers an advanced optical based pressure guidewire that aims at improving the clinical outcome of patients with coronary artery disease.
Opsens also develops, manufactures and installs innovative fibre optic sensing solutions for critical applications such as the monitoring of oil wells and other demanding industrial applications.
Opsens’ financial cash position reaches $10 M combined with US$5.5 M in milestone payments to be received from partners.
Opsens receives CE Marking for FFR products granting permission to commercialize in Europe.
Opsens to expand sales channels in Europe, the Middle East and other territories.
Opsens files a premarket 510(k) notification with the FDA for its FFR products. Clearance will grant Opsens permission to commercialize in the US.
Clearance expected summer 2015.
Clinical study in human with Opsens’ FFR products – 27 patients successfully diagnosed at Institut universitaire de cardiologie et de pneumologie de Québec - (Quebec “Heart and Lung Institute”).
Additional patients will be diagnosed in this study.
Opsens grants US$6 M license for circulatory assist device to Abiomed, receives US$1.5 M upon signing.
Abiomed will disburse balance upon achievement of specific milestones over a few years.
Opsens closes $8.5 M equity financing. Financial position gives Opsens flexibility for the launch of its FFR products and to support activities in other areas.
Opsens receives Shonin approval for FFR products granting permission to commercialize in Japan.Opsens receives US$1 M milestone payment from partner and Japanese distributor.
Limited market release with selected institutions. Our Japanese partner, a player in interventional cardiology, has well-established distribution channels, which should facilitate penetration of our FFR products.
In the oil and gas and industrial segment, Opsens' OPP-W system provides real-time and continuous downhole pressure and temperature information about Steam Assisted Gravity Drainage ("SAGD"), a hostile environment characterized by the presence of corrosive gases and temperatures as high as 300°C. The ability to control pressure at high temperature allows producers to improve SAGD production, reduce operating costs and improve site security. In 2015, Opsens aims to continue expanding its customer base, applications for the OPP-W sensor and product line to accentuate its commercial activities.
Event Next Steps
“Will FFR continue to grow? It’s in its infancy. We have an over US$2 billion market opportunity here.
We are just getting started.” Scott Huennekens, CEO Volcano, Jan. 2013.
This technology [FFR] is “well on its way to a new billion-dollar market.”
Daniel Starks, CEO St. Jude, Jan. 2012.
Our unique intellectual property in FFR and optical sensing has allowed Opsens’ team to develop a product that addresses the most common complaints brought on by cardiologists about available devices to measure FFR. Opsens aims to become a key player in the FFR guidewire market with OptoWire. We anticipate entering this valuable market in 2015.Disposable, Opsens’ OptoWire will generate a strong gross margin. Penetration of a fraction of the FFR market will have a major impact on Opsens’ sales.Opsens is confident it will be able to capitalize on this significant growth opportunity. FFR sales have been growing steadily since the publication of compelling studies (FAME I, 2009 and FAME II, 2012) resulting in cardiology medical societies addressing the use of FFR as appropriate for diagnostic evaluation. Consequently, the FFR market has reached US$250 million in 2013. Industry sources in the FFR market expect it will reach US$1 billion in the medium term.
What is FFR and why is Opsens determined to become a key player in this market?Heart disease affects millions of people worldwide. It is often caused by a blockage in arteries, which restricts blood flow and reduces the amount of oxygen the heart receives.FFR is increasingly performed by interventional cardiologists during Percutaneous Coronary Interventions (PCI) to measure blood pressure before and after a blockage to help in selecting treatment. FFR procedure is supported by multiple studies that have proven that selecting treatment based on a FFR diagnosis: • Reduces death and myocardial infarction in patients by approximately 30%;• Reduces procedure costs as fewer stents are installed; and,• Provides justification for treatment that supports claims for reimbursement.

LETTER TO SHAREHOLDERS
We entered fiscal year 2015 with great excitement. Over past years, we have laid out the foundation for a business plan aimed at creating value for our shareholders through the development of our activities in interventional cardiology, oil and gas and other industrial activities. In 2015, the focus of our marketing efforts will be to put forward the competitive advantages of our products.
Strengthened Financial PositionFrom a financial standpoint, Opsens significantly strengthened its financial position in 2014. Opsens completed an $8.5 million equity financing and concluded a licensing agreement for US$6 million with ABIOMED, Inc. This agreement for the granting of the rights to use our miniature optical pressure sensor for applications in circulatory assist devices has enabled Opsens to capitalize on the work with Abiomed in recent years, while concentrating most of our efforts on the FFR market.
As of August 31, 2014, Opsens had $10 million in addition to holding milestone payments receivable from its partners for an amount of US$5.5 million. This strong financial position gives us a flexibility that will allow us to plan the launch of our medical device products and support activities in the other sectors we are pursuing.
FFR – A Growing Market in Interventional CardiologyIn interventional cardiology, Opsens is focused on the FFR market. FFR is an index used to assess the impact of a coronary blockage and to select treatment. This index is calculated from pressure measurements taken before and after a narrowing of the coronary arteries during arteriography. Increasingly used, this approach can help cardiologists diagnose in real time and determine the appropriate treatment to improve blood circulation in the cardiovascular system.
FFR measurement is one of few medical interventions that have beneficial effects at all levels:
■ For patients: Recent studies, namely FAME I and FAME II, have shown that patients whose doctors had used this procedure in the diagnosis and choice of treatment of a coronary artery blockage were less likely to suffer a major cardiac event and to suffer a heart attack or die compared with those whose treatment was based on a standard angiogram.
■ For hospitals and physicians: The measurement of FFR in the diagnosis and optimal treatment of coronary blockages can be used to support the decisions of cardiologists.
■ For insurance companies: The measurement of FFR can be used to justify treatment selection of coronary blockages and may prevent excessive and expensive stent implantation.
All the elements are combined to create a favorable environment for the continued growth of the FFR market, which was estimated at more than US$250 million in 2013. In the coming years, double-digit growth is expected and industry players anticipate that the market will reach US$1 billion annually in the medium term.
Opsens FFR Products – Hitting The Market In 2015Opsens aims to become a key player in the guidewire FFR market with the OptoWire, a nitinol-based optical guidewire for FFR. The OptoWire provides intra-coronary blood pressure measurements with unique, patented optical pressure guidewire technologies. It is immune to adverse effects related to blood contact, and allows easy and reliable connectivity that leads to reliable FFR measurements in extended conditions of usage. The OptoWire is also designed to provide cardiologists with a guidewire delivering optimized performances to navigate coronary arteries and reach blockages with ease.
Regulatory Approval Almost CompletedIn recent months, Opsens has completed regulatory filings in the most important markets, namely the United States, Europe and Japan. Between them, these three markets account for approximately 85% of the global market for FFR products. Opsens has already received Shonin approval in Japan, as well as CE marking in Europe, granting permission to market our products in these regions. The usual approval time for the US Food and Drug Administration allows us to anticipate clearance for summer 2015.
Distribution AgreementsNow that Opsens has filed with regulatory authorities and received two of the three most important approvals for the marketing and sale of its FFR products, commercialization has moved to the top of our list of priorities. Opsens announced the signing of a distribution agreement for Japan, Taiwan and Korea. The signing of new agreements in the territories coveted by Opsens will maximize availability of its products to interventional cardiologists
Oil and Gas and IndustrialIn the oil and gas and industrial segment, Opsens generates most of its revenue from the thermal process of SAGD, widely used in Alberta. SAGD production is characterized by a particularly hostile environment, where intense heat is combined to the presence of hydrogen and corrosive fluids. Thanks to Opsens’ OPP-W sensor, producers can get a measure of pressure and temperature at high temperature that may be used to control the oil wells to ultimately optimize the steam/oil ratio and reduce operating costs.
Alberta’s SAGD production is growing in size and importance, fueled by massive investments made by oil producers. This market is increasingly important. Producers from foreign markets are also increasingly using thermal systems to maximize oil production, which creates a business opportunity for Opsens.
In 2015, Opsens plans to launch a new product to complement its existing range. This pressure sensor will address the needs of high-pressure environments and offer the inherent advantages of optical fiber in terms of reliability and safety. This launch, coupled with efforts made in 2014, should contribute to create value for shareholders.
In closing, I wish to thank everyone who has allowed Opsens to progress, thrive and move toward a promising future. In particular, I think of customers, employees, directors, suppliers and partners. Without a doubt, the expertise and the motivation of our employees and directors have been instrumental in establishing our solid foundation. It serves as the cornerstone of our future growth for the benefit of our shareholders.
(s) Louis Laflamme President and Chief Executive Officier

(1) Opsens FFR Market Calculations based on R. Scott Huennekens, “Volcano’s CEO Hosts NASDAQ Analyst Day” TRANSCRIPT p.5 (2013-03-7) and JOHN T. DAHLDORF, “Volcano’s Annual Report
2012” ).
MANAGEMENT’S DISCUSSION AND ANALYSIS OF FINANCIAL CONDITION AND
RESULTS OF OPERATIONS FOR THE YEAR ENDED AUGUST 31, 2014
The following comments are intended to provide a review and analysis of the results of operations, financial
condition and cash flows of Opsens Inc. for the fourth quarter and year ended August 31, 2014 in comparison with
the corresponding periods ended August 31, 2013. In this Management’s Discussion and Analysis (“MD&A”),
“Opsens”, “the Company”, “we”, “us” and “our” mean Opsens Inc. and its subsidiary. This discussion should be read
and interpreted in conjunction with the information contained in our annual consolidated financial statements for the
years ended August 31, 2014 and 2013, which have been prepared in accordance with International Financial
Reporting Standards (“IFRS”) as issued by the International Accounting Standards Board. This document was
prepared on November 24, 2014. All amounts are in Canadian dollars unless otherwise indicated.
This MD&A contains forward-looking statements with respect to the Company. These forward-looking statements,
by their nature, require the Company to make certain assumptions and necessarily involve known and unknown risks
and uncertainties that could cause actual results to differ materially from those expressed or implied in these forward-
looking statements. Forward-looking statements are not guarantees of performance. These forward-looking
statements, including financial outlooks, may involve, but are not limited to, comments with respect to the
Company’s business or financial objectives, its strategies or future actions, its targets, expectations for financial
condition or outlook for operations and future contingent payments. Words such as “may”, “will”, “would”, “could”,
“expect”, “believe”, “plan”, “anticipate”, “intend”, “estimate”, “continue”, or the negative or comparable
terminology, as well as terms usually used in the future and conditional, are intended to identify forward-looking
statements.
Information contained in forward-looking statements is based upon certain material assumptions that were applied in
drawing a conclusion or making a forecast or projection, including management’s perceptions of historical trends,
current conditions and expected future developments, as well as other considerations that are believed to be
appropriate in the circumstances. The Company considers these assumptions to be reasonable based on information
currently available to it, but cautions the reader that these assumptions regarding future events, many of which are
beyond its control, may ultimately prove to be incorrect since they are subject to risks and uncertainties that affect
the Company and its business. The forward-looking information set forth therein reflects the Company’s
expectations as at November 24, 2014 and is subject to change after such date. The Company disclaims any intention
or obligation to update or revise any forward-looking statements, whether as a result of new information, future
events or otherwise, other than as required by law.
OVERVIEW
The Company focuses mainly on two large and growing markets: the interventional cardiology and the oil and gas
industry. In interventional cardiology, Opsens offers advanced optical based pressure guidewire that aims at
improving the clinical outcome of patients with coronary artery disease. Opsens also develops, manufactures and
installs innovative fibre optic sensing solutions for critical applications such as the monitoring of oil wells and other
demanding industrial applications.
In the medical instrumentation field, Opsens presented, in 2011, the first generations of OptoWire and
OptoMonitor, which provide cardiologists with a pressure guidewire that delivers optimized performance for
navigating in coronary arteries and to reach blockages with ease while also measuring intra-coronary blood pressure.
The medical process involved is referred to as the measurement of Fractional Flow Reserve (“FFR”). According to
management and industry sources(1), the FFR market is expected to grow from US$250 million in 2013 to more than
$US 1 billion in the medium term.
Recently, the Company reached some key milestones. Opsens received regulatory approvals in Europe in November
2014 and for Japan in October 2014 for its FFR products, the second and third largest markets in the world,
respectively. Opsens received the authorization from Health Canada to conduct investigational testing in patients,
pertaining to the conduct of a pilot study. The objectives of the study are to assess the usability, the functionality and
safety of Opsens’ OptoWire and OptoMonitor in patients with ischemic coronary artery disease who are referred for
diagnostic angiography. Among the planned 70 patients to be enrolled, 27 have already been successfully completed.
The Company also filed a premarket 510(k) notification with the U.S. Food and Drug Administration (“FDA”). With
the expected regulatory approval in the U.S. market, the Company will gain access to more than 90% of the total
market for FFR products. The goal is to begin commercializing FFR products in Europe and in Japan in the first half
of calendar year 2015. Commercialization will start with the Japanese market, and is supported by a leading Japanese
medical supplier with whom Opsens signed a long-term partnership agreement in November 2012.
At this stage, Opsens has signed distribution agreements for Japan, Taiwan and Korea. Additional distribution
agreements are being negotiated and will be concluded in upcoming months.
In the oil and gas market, Opsens provides fibre optic sensor systems that provide reliable realtime downhole
pressure and temperature information. This information is especially critical during operations such as Steam
Assisted Gravity Drainage (“SAGD”), a process that recovers bitumen from oil sands. Since 2006, SAGD production
has experienced 12% CAGR. According to 2014 Alberta Energy Regulator’s reserves report, in-situ production is
expected to continue to grow at a rate of approximately 8% annually over the next decade. SAGD is now the primary
technology used in oil sands and is responsible for 81% of production increase between 2012 and 2013.
Opsens holds 9 patents and has 4 patents pending to protect its optical pressure guidewire technologies and
industrial-related applications.
FFR MARKET OPPORTUNITY For the FFR market, Opsens’ OptoWire and OptoMonitor solution assess the significance of arterial narrowing
(stenosis) resulting from coronary artery diseases (“CAD”). CAD remains a leading cause of death in the developed
world and the cost related to the management and treatment of the disease represents a significant burden to society.
In recent years, the prevalence of CAD has been increasing at a rapid rate. According to the American Heart
Association (“AHA”), the number of Americans receiving cardiovascular operations or procedures increased to
approximately 7.6 million patients in 2010.
The benefits of FFR were demonstrated in the 2009 and 2012 FAME I and FAME II studies published in the New
England Journal of Medicine. The FAME I study showed that FFR-guided percutaneous coronary intervention
therapy, compared to angiography-alone procedures, reduces composites rates of death, myocardial infarction, re-
PCI, and coronary artery bypass graft at one year by 30%, In 2011, the American College of Cardiology Foundation
and the AHA established a Class IIA recommendation for the use of FFR during angiograms, indicating that a given
treatment or procedure is beneficial, useful and effective. These developments have helped the market grow to the
2013 market size of approximately US$250 million in worldwide annual sales, based on management estimates.
Management sees potential for the FFR market to grow to approximately US$1 billion worldwide in the medium
term.
OIL AND GAS MARKET OPPORTUNITY
In the oil and gas market, Opsens’ optic-based sensors measure temperature and pressure in oil wells that use SAGD
technology. SAGD is the primary technology used to recover bitumen from oil sands. In SAGD wells, temperature
and pressure distribution are key factors that impact the ability to efficiently recover bitumen and optimize
production costs and margins.
In Canada, SAGD production has increased at a CAGR of 12% since 2006. The Canadian Association of Petroleum
Producers (“CAPP”) projects capital spending on oil sands projects will be approximately US$25 billion in 2014.
Opsens’ management believes it can grow its business in this segment through increased customer adoption and new
customer additions.

BUSINESS STRATEGY
Opsens’ growth strategy is to become a key player in the fields where Opsens has developed competitive advantages
for its core products and technologies. In particular, Opsens leverage in-house expertise and technologies for
addressing unmet needs in the fields of interventional cardiology and oil & gas.
The Company’s FFR growth strategy will be executed by:
Gaining market share in existing FFR markets by entering into this high-growth market. For the first time in
fiscal 2015, Opsens will generate revenues from its FFR offering. Considering the relatively low adoption
rate of FFR in percutaneous coronary intervention (“PCI”) procedures in the U.S., a significant opportunity
lies in expanding usage of FFR by cardiologists. Management believes that approximately 15% of PCI
procedures use FFR, while research analysts suggests that up to 45% of PCI procedures could benefit from
the use of FFR(2). Management intends to pursue a comprehensive market development strategy that
highlights the distinctive features and capabilities of the OptoWire and that addresses the regulatory and
commercialization requirements of OptoWire in order to gain market shares over exisiting players and to
contribute to the expansion of the FFR market. Initially, commercialization will focus on the Japanese, U.S.
and European markets.
Investing in innovation to enhance the existing applications of the Company’s technology. The Company’s
commitment to innovation has been a major driving force behind its success. Opsens is constantly working
to improve its intellectual property portfolio and customer value proposition. In FFR market, OptoWire is
designed to provide:
o Improved measurement reliability and fidelity from OptoWire’s low drift sensing technology,
which is essential to measurement accuracy and reliability; competing FFR sensing technologies
have higher drift levels;
o Improved connectivity, as OptoWire’s connection and measurement accuracy is unaffected by
blood contamination and the guidewire can be reconnected easily with little to no impact on
measurement accuracy.
o Improved mechanical performance from key design attributes and product specifications such as
torquability and steerability;
Developing new applications for the Company’s medical technology. Opsens plans to leverage its
technologies and knowledge in the medical devices field to expand into new markets and increase clinical
applications. As the Company pursues opportunities in these new markets, it plans to develop FFR products
and to explore product development and marketing partnerships with other leading companies in the sector.
Expanding and investing in FFR-focused sales force and distribution channels.
o Distribution agreements: Opsens signed an agreement with a leading Japanese medical supplier
in November 2012, which provides the Japanese company with distribution rights for the
OptoWire in Japan, Korea and Taiwan. In January 2014, this agreement translated into the first
regulatory filing towards the commercialization of Opsens’ FFR product in Japan. In October
2014, the regulatory approval was obtained allowing to start the commercialization process in
Japan. Opsens plans on continuing to expand its worldwide market penetration by pursuing
additional distribution agreements with medical equipment companies globally, thereby
outsourcing part of its distribution operations while increasing its market potential in a cost-
effective manner.
o Sales force: Opsens plans to expand its sales force by hiring additional sales personnel in
preparation for FFR product commercialization. Opsens’ objective is to increase its marketing and
sales market penetration in the North American, European and Asian health care sectors,
particularly amongst cardiologists and hospitals.
(2) D. STARKS, “St Jude Medical 2013 Investor Conference” p.105 (2013-02-01); R. Scott Huennekens, “Volcano NASDAQ Analyst Day” POWERPOINT PRESENTATION p.44 (2013-03-07).

The Company’s Oil and Gas growth strategy will be executed by:
Increasing market share in the oil and gas market. The Company’s oil and gas sensor is currently used by
many of the top SAGD producers in North America. Opsens plans to continue to develop its existing
product line, while improving its ability to respond to customer needs for multiple specifications in the
measurement of pressure and temperature with new products and applications.
Investing in innovation to enhance the existing applications of the Company’s technology. In the oil and gas
market, Opsens’ downhole pressure and temperature sensors provide more reliable measurements at higher
temperatures (up to 300 0C) than traditional sensors and are not affected by electromagnetic interferences.
Opsens is also developing a new high pressure version of its pressure sensor that will open new markets in
the oil and gas field and also in other industries such as aerospace and geotechnical.
NON-IFRS FINANCIAL MEASURE - EBITDAO
The Company quarterly reviews net earnings (loss) and Earnings Before Interest, Taxes, Depreciation, Amortization
and Stock-based compensation costs ("EBITDAO"). EBITDAO has no normalized sense prescribed by IFRS. It is
not very probable that this measure is comparable with measures of the same type presented by other issuers.
EBITDAO is defined by the Company as the addition of net earnings (loss), depreciation and amortization, financial
expenses (revenues), change in fair value of embedded derivative and stock-based compensation costs. The
Company uses EBITDAO for the purposes of evaluating its historical and prospective financial performance. This
measure also helps the Company to plan and forecast for future periods as well as to make operational and strategic
decisions. The Company believes that providing this information to investors, in addition to IFRS measures, allows
them to see the Company’s results through the eyes of management, and to better understand its historical and future
financial performance.
Reconciliation of EBITDAO to net loss
(In thousands of Canadian dollars)
Year Ended
August 31, 2014
Year Ended
August 31, 2013
Year Ended
August 31, 2012
$ $ $
Net loss for the year (3,099) (2,366) (1,930)
Financial expenses (revenues) 114 100 (97)
Change in fair value of embedded derivative 102 (17) -
Depreciation of property, plant, and equipment 346 287 230
Amortization of intangible assets 48 31 35
EBITDA (2,489) (1,965) (1,762)
Stock-based compensation costs 236 126 137
EBITDAO (2,253) (1,839) (1,625)
The negative variance of EBITDAO for fiscal year 2014 when compared with last year is explained by the increase
in the net loss.

SELECTED CONSOLIDATED FINANCIAL DATA
(In thousands of Canadian dollars, except for
information per share)
Year Ended
August 31, 2014
Year Ended
August 31, 2013
Year Ended
August 31, 2012
$ $ $
Revenues 6,788 7,526 8,462
Cost of sales 4,399 4,780 5,722
Gross margin 2,389 2,746 2,740
Gross margin percentage 35% 36% 32%
Administrative expenses 2,398 2,313 2,304
Marketing expenses 1,131 954 929
R&D expenses 1,743 1,762 1,534
Financial expenses (revenues) 114 100 (97)
Change in fair value of embedded derivative 102 (17) -
5,488 5,112 4,670
Net loss and comprehensive loss (3,099) (2,366) (1,930)
Net loss per share - Basic (0.06) (0.05) (0.04)
Net loss per share - Diluted (0.06) (0.05) (0.04)
Revenues
The Company reported revenues of $6,788,000 for the year ended August 31, 2014, compared with revenues of
$7,526,000 a year earlier, a decrease of $738,000 or 10%.
Revenues in the oil and gas sector totalled $4,497,000 for the year ended August 31, 2014 compared with $5,753,000
in fiscal 2013. The decrease in revenues is explained by fewer orders placed during the year by a large customer
partially offset by the installation of sensor systems for the 48-well contract from an oil and gas producer of SAGD
oil sand projects in Alberta.
Revenues in the industrial field totaled $1,469,000 for the year ended August 31, 2014 compared with revenues of
$1,057,000 for the same period in 2013. The increase in revenues in the industrial field is explained by significant
orders placed by two existing customers related to the existing product line.
Given that a proportion of the Company's revenues is generated in U.S. dollars, fluctuations in the exchange rate
affect revenues and net loss. For the year ended August 31, 2014, the average exchange rate was higher than the
previous year, which affected sales positively by $128,400.
Market acceptance of fiber optic sensors is increasing in the Company’s markets. That being said, some sectors, such
as oil and gas, are seeing additional competition. Opsens is addressing the added competition by highlighting the
performance characteristics of its products compared with those of its competitors. For the periods ended August 31,
2014 and 2013, pricing fluctuations and new product launches did not have a significant impact on revenues.
As at August 31, 2014, the backlog amounted to $927,000 ($4,380,000 as at August 31, 2013). Last year, the backlog
included the Company’s largest order in its history. Despite a slowdown of capital expenditures by major oil and gas
producer, significant efforts are being made to increase the backlog and expand the customer base. In the second
quarter of fiscal 2015, we anticipate to receive an order of approximately US$1 million in the industrial market that
will help to mitigate the impact of the lower backlog. In addition, the Company will generate revenues in the medical
field resulting from its right to commercialize in Europe and in Japan.
Gross margin
The gross margin on product sales decreased for the year ended August 31, 2014 when compared with last year, from
$2,747,000 to $2,389,000. The gross margin percentage slightly decreased from 36% for the year ended August 31,

2013 to 35% for the year ended August 31, 2014. The decrease in gross margin and gross margin percentage is the
result of lower revenues, as explained previously.
Administrative expenses
For the years ended August 31, 2014 and 2013, administrative expenses were $2,398,000 and $2,314,000,
respectively. The increase is primarily explained by higher stock-based compensation costs and depreciation of
property, plant and equipment.
Marketing expenses
Sales and marketing expenses were $1,130,000 for the year ended August 31, 2014 compared with $954,000 in fiscal
2013, an increase of $176,000. The increase is primarily explained by higher headcount and higher tradeshows and
travelling expenses when compared with last year.
Research and development expenses
Research and development expenses amounted to $1,743,000 and $1,762,000 for the years ended August 31, 2014
and 2013, respectively. The decrease in the research and development expenses in fiscal 2014 is explained by higher
tax credits for research and development that are accounted for against research and development expenses.
Financial expenses
Financial expenses reached $114,000 for the year ended August 31, 2014 compared with financial expenses of
$100,000 for fiscal year 2013. The increase in the financial expenses during fiscal year 2014 is explained by an
unfavourable change of $58,000 in the foreign exchange loss and by higher interest expense of $15,000 arising from
the issuance of the convertible debenture in November 2012. This was partly offset by higher interest income of
$58,000 related to higher short-term investments considering the public offering completed on February 18, 2014
and the up-front payment received upon the closing of the Abiomed agreement.
Change in fair value of embedded derivative
The change in fair value of embedded derivative comes from the variance of the fair market value of the conversion
option component of the convertible debenture. The convertible debenture contains a cash settlement feature, which
under IAS 32, “Financial Instruments: Presentation”, is accounted for as a compound instrument with a debt
component and a separate embedded derivative representing the conversion option. Both the debt and embedded
derivative components of this compound financial instrument are measured at fair value on initial recognition. The
debt component is subsequently accounted for at amortized cost using the effective interest rate method. The
embedded derivative is subsequently measured at fair value at each reporting date with gains and losses in fair value
recognized through profit or loss. During the year, an expense of $102,000 (revenue of $17,000 for the year ended
August 31, 2013) was recorded in the consolidated statement of loss and comprehensive loss.
Net loss
As a result of the foregoing, net loss for the year ended August 31, 2014 was $3,099,000 compared with $2,366,000
in fiscal 2013.

CONSOLIDATED STATEMENT OF FINANCIAL POSITION DATA
(In thousands of Canadian dollars) As at
August 31,
2014
As at
August 31,
2013
As at
August 31,
2012
$ $ $
Current assets 14,613 8,459 5,895
Total assets 16,789 10,528 7,735
Current liabilities 4,428 2,415 1,595
Long-term liabilities 4,152 4,720 507
Shareholders' equity 8,209 3,393 5,633
Total assets as at August 31, 2014 were $16,789,000 compared with $10,528,000 as at August 31, 2013. The
increase is mainly related to higher cash and cash equivalents explained by net proceeds from the public offering of
$7,536,000, the issuance of shares pursuant to the stock option plan of $144,000 and the amount of $1,647,000
received upon the closing of the Abiomed agreement. This was partly offset by the lower level of inventories when
compared with last year because of delay at the end of last year in the installation of the first OPP-W sensor systems
for the 48-well contract.
Long-term liabilities totalled $4,152,000 as at August 31, 2014 compared with $4,720,000 last year, a decrease of
$568,000. The decrease is explained by the reclassification of deferred revenues of $2,002,000 in the short-term
portion of liabilities after obtaining the CE mark approval on November 19, 2014. This was partly offset by a higher
balance of convertible debenture of $230,000 and by the amount of $1,647,000 (US$1,500,000) received on closing
of the licensing agreement with Abiomed for which an amount of $1,138,000 is recorded in long-term liabilities as at
August 31, 2014.
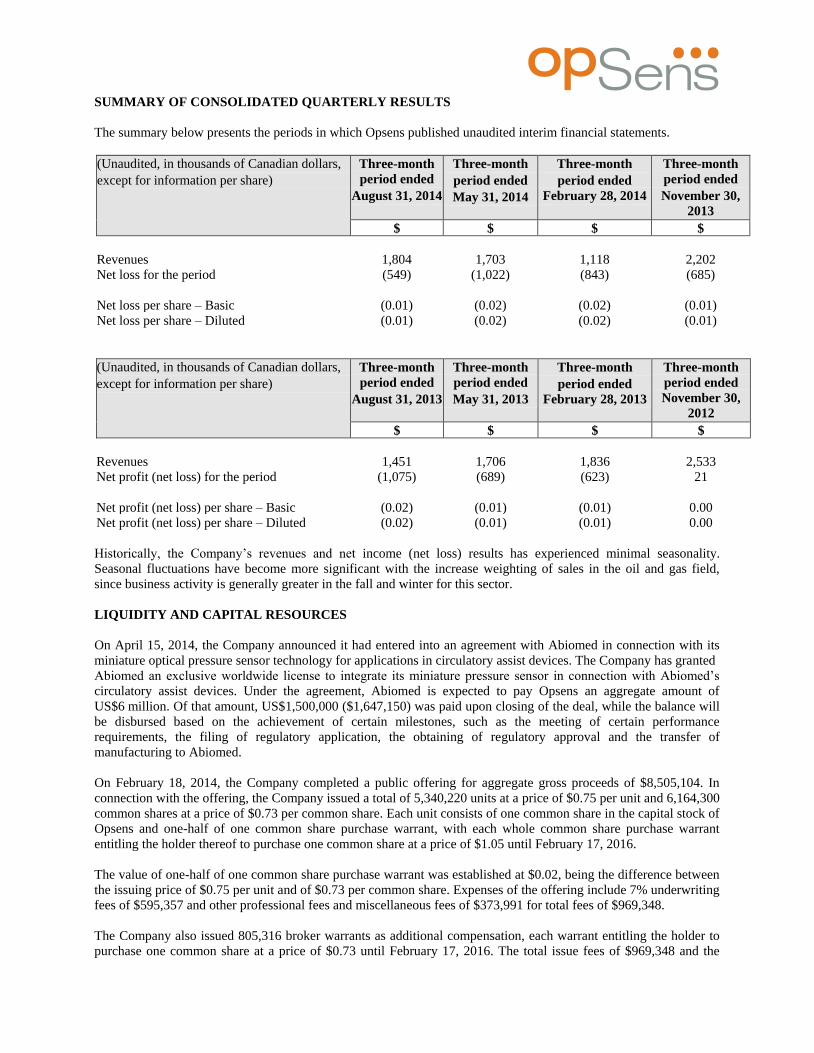
SUMMARY OF CONSOLIDATED QUARTERLY RESULTS
The summary below presents the periods in which Opsens published unaudited interim financial statements.
(Unaudited, in thousands of Canadian dollars,
except for information per share)
Three-month
period ended
August 31, 2014
Three-month
period ended
May 31, 2014
Three-month
period ended
February 28, 2014
Three-month
period ended
November 30,
2013
$ $ $ $
Revenues 1,804 1,703 1,118 2,202
Net loss for the period (549) (1,022) (843) (685)
Net loss per share – Basic (0.01) (0.02) (0.02) (0.01)
Net loss per share – Diluted (0.01) (0.02) (0.02) (0.01)
(Unaudited, in thousands of Canadian dollars,
except for information per share)
Three-month
period ended
August 31, 2013
Three-month
period ended
May 31, 2013
Three-month
period ended
February 28, 2013
Three-month
period ended
November 30,
2012
$ $ $ $
Revenues 1,451 1,706 1,836 2,533
Net profit (net loss) for the period (1,075) (689) (623) 21
Net profit (net loss) per share – Basic (0.02) (0.01) (0.01) 0.00
Net profit (net loss) per share – Diluted (0.02) (0.01) (0.01) 0.00
Historically, the Company’s revenues and net income (net loss) results has experienced minimal seasonality.
Seasonal fluctuations have become more significant with the increase weighting of sales in the oil and gas field,
since business activity is generally greater in the fall and winter for this sector.
LIQUIDITY AND CAPITAL RESOURCES
On April 15, 2014, the Company announced it had entered into an agreement with Abiomed in connection with its
miniature optical pressure sensor technology for applications in circulatory assist devices. The Company has granted
Abiomed an exclusive worldwide license to integrate its miniature pressure sensor in connection with Abiomed’s
circulatory assist devices. Under the agreement, Abiomed is expected to pay Opsens an aggregate amount of
US$6 million. Of that amount, US$1,500,000 ($1,647,150) was paid upon closing of the deal, while the balance will
be disbursed based on the achievement of certain milestones, such as the meeting of certain performance
requirements, the filing of regulatory application, the obtaining of regulatory approval and the transfer of
manufacturing to Abiomed.
On February 18, 2014, the Company completed a public offering for aggregate gross proceeds of $8,505,104. In
connection with the offering, the Company issued a total of 5,340,220 units at a price of $0.75 per unit and 6,164,300
common shares at a price of $0.73 per common share. Each unit consists of one common share in the capital stock of
Opsens and one-half of one common share purchase warrant, with each whole common share purchase warrant
entitling the holder thereof to purchase one common share at a price of $1.05 until February 17, 2016.
The value of one-half of one common share purchase warrant was established at $0.02, being the difference between
the issuing price of $0.75 per unit and of $0.73 per common share. Expenses of the offering include 7% underwriting
fees of $595,357 and other professional fees and miscellaneous fees of $373,991 for total fees of $969,348.
The Company also issued 805,316 broker warrants as additional compensation, each warrant entitling the holder to
purchase one common share at a price of $0.73 until February 17, 2016. The total issue fees of $969,348 and the

broker warrants value of $32,213 have been allocated on a pro-rata basis between share capital and the warrants
reserve, $989,015 and $12,546 respectively, based on the ratio established by their respective values as described
above.
On November 19, 2012, the Company announced the granting of distribution and other rights for OptoWire and
OptoMonitor. Under the terms of the agreement, the Company received:
US$3,000,000 for the distribution rights for Japan, Korea and Taiwan, which consisted of:
a. US$2,000,000 ($2,002,000) at signing;
b. US$1,000,000 with the regulatory approval in Japan;
US$2,000,000 ($2,002,000) in subordinated secured convertible debenture, at signing.
The convertible debenture bears interest at a rate of 2.0% per annum payable at maturity, which is November 19,
2017. At the holder’s option, the convertible debenture may be converted into common shares of the Company at any
time up to the maturity date at a conversion price representing the market price of the shares. However, the
conversion price is subject to a minimum of $0.50 and a maximum of $0.75 per common share (the “conversion
price”).
The convertible debenture is also convertible at the Company’s option at the conversion price if the volume-
weighted average closing price per common share for the twenty trading days immediately preceding the fifth
trading day before such conversion date is at least $1.20 and if a minimum of 50,000 common shares have traded on
the TSX Venture Exchange during each of the twenty trading days taken into account in the calculation of the
conversion price.
To secure the repayment of the convertible debenture, a movable hypothec on certain equipment has been given. As
at August 31, 2014, the net book value of property, plant and equipment pledged as collateral was $32,800 ($66,000
as at August 31, 2013). This hypothec will rank second to certain long-term loans of the Company.
As noted above, the convertible debenture contains a conversion option that will result in an obligation to deliver a
fixed amount of equity in exchange of a variable amount of convertible debenture when translated in the functional
currency of the Company. Consequently, under IAS 32, “Financial Instruments: Presentation”, the convertible
debenture is accounted for as a compound instrument with a debt component and a separate embedded derivative
representing the conversion option. Both the debt and embedded derivative components of this compound financial
instrument are measured at fair value on initial recognition. The debt component is subsequently accounted for at
amortized cost using the effective interest rate method. The embedded derivative is subsequently measured at fair
value at each reporting date with gains and losses in fair value recognized through profit or loss.
The Company has an authorized line of credit for a maximum amount of $200,000, $50,000 of which is available at
all times and does not take into consideration any margining of accounts receivable and inventories. When using the
line of credit in an amount varying from $50,000 and $100,000, the available credit is limited to an amount that is
equal to 75% of Canadian accounts receivable and 65% of foreign accounts receivable plus 50% of inventories of
raw materials and finished goods. If the amount used exceeds $100,000, the credit available is limited to an amount
equal to 75% of Canadian accounts receivable and 90% of insured foreign accounts receivable plus 50% of
inventories of raw materials and finished goods. This line of credit bears interest at the financial institution’s prime
rate plus 2% and is repayable on a weekly basis by $5,000 tranches. It is secured by a first-rank movable hypothec
for an amount of $750,000 on the universality of receivables and inventories.
Under an agreement entered into with Canada Economic Development (“CED”), the Company may receive a
refundable contribution of a maximum amount $300,000, non-interest bearing, to cover expenses related to the
development of its OptoWire product for the FFR market. This contribution is paid out based on the project’s
percentage of completion at the rate of 40% of eligible expenses since February 1, 2013. During the year ended
August 31, 2014, the Company received an amount of $152,000 of which $56,112 was recognized against research

and development expenses.
Under an agreement reached with the Ministère des Finances et de l’Économie, the Company was granted a
refundable contribution of $413,590, non-interest bearing, to cover some of its incurred costs to carry out
development of a portfolio of products for FFR. During the year ended August 31, 2014, the Company received an
amount of $164,200 for which a portion of $59,437 was recognized against research and development expenses.
As at August 31, 2014, the Company had cash and cash equivalents of $10,621,000 compared with $3,662,000 as at
August 31, 2013. Of this amount as at August 31, 2014, $9,835,000 was invested in highly liquid, safe investments.
As at August 31, 2014, Opsens had a working capital of $10,185,000, compared with $6,043,000 for the same period
last year.
Based the cash and cash equivalents position, Opsens has the financial resources necessary to maintain short-term
operations, honour its commitments and support its anticipated growth and development activities. From a medium-
term perspective, Opsens may need to raise additional financing by issuing equity securities and/or debt. From a
long-term perspective, there is uncertainty about obtaining additional financing, given the risks and uncertainties
identified in the Risks and Uncertainties section. Changes in cash and cash equivalents position will largely depend
on the rate of revenue growth in upcoming quarters.
For fiscal year 2015, the Company anticipates additional investments into the working capital of approximately
$750,000.
SUMMARY OF CASH FLOWS
(In thousands of Canadian dollars)
Year Ended
August 31, 2014
Year Ended
August 31, 2013
$ $
Operating activities (477) (319)
Investing activities (403) (548)
Financing activities 7,818 2,044
Net change in cash and cash equivalents 6,938 1,177
Operating activities
Cash flows used by our operating activities for the year ended August 31, 2014 were $477,000 compared with
$319,000 for the same period last year, an increase of $158,000. The increase in the cash flows used by our operating
activities is explained by the higher net loss of $772,000 for the year ended August 31, 2014 when compared with
last year partly offset by the positive impact of the changes in non-cash operating working capital items resulting
from a decrease in inventories. The decrease in inventories reflects investments made by the Company, at the end of
the year ended August 31, 2013, to prepare for the installation of the OPP-W sensors for the 48-well contract.
Investing activities
For the year ended August 31, 2014, cash flows used by our investing activities reached $403,000 and were used for
acquisitions of property, plant and equipment for an amount of $390,000 and of intangible assets for an amount of
$109,000. This was partly offset by interest income received of $96,000. Acquisitions of property, plant and
equipment were made primarily for our oil and gas activities and for our FFR project.
For the year ended August 31, 2013, cash flows used by our investing activities reached $548,000 and were used for
acquisitions of property, plant and equipment for an amount of $473,000 and $75,000 was used for additions to
intangible assets. Acquisitions of property, plant and equipment were made primarily for our oil and gas activities
and for our FFR project.

Financing activities
For the year ended August 31, 2014, cash flows generated by our financing activities reached $7,818,000. The net
proceeds from the issuance of share and units of $7,679,000 and the increase in our long-term debt of $316,000 were
partly offset by the $177,000 payment on the long-term debt.
For the year ended August 31, 2013, cash flows generated by our financing activities reached $2,044,000. The
proceeds from the issuance of the convertible debenture of $2,002,000 and the increase in our long-term debt of
$265,000 were partly offset by the $191,000 payment on the long-term debt and by $32,000 of interest payments.
COMMITMENTS
Leases
The Company leases offices in Québec under operating leases expiring on April 30, 2016. These agreements are
renewable for an additional five-year period. Future rent, without considering the escalation clause, will amount to
$461,700.
The Company leases offices in Alberta under an operating lease expiring on April 30, 2015. This agreement is
renewable for an additional five-year period. Future rent, without considering the escalation clause, will amount to
$88,200.
Opsens Solutions Inc. rents a vehicle under an operating lease expiring in July 2015. Future rent payments will
amount to $9,200.
Future payments for the leases and other commitments, totalling $559,100, required in each of the forthcoming years
are as follows:
$
2015 370,900
2016 188,200

INFORMATION BY REPORTABLE SEGMENTS
Segment’s Information
The Company’s reportable segments are strategic business units managed separately as one is focused on
developing, producing, and supplying fiber optic sensors (Opsens Inc.) and the other (Opsens Solutions Inc.) is
specialized in the commercialization and installation of optical and conventional sensors for the oil and gas industry.
The same accounting policies are used for both reportable segments. Operations are carried out in the normal course
of operations and are measured at the exchange amount, which approximates prevailing prices in the markets.
Years ended August 31,
2014 2013
Opsens Opsens
Opsens Inc. Solutions
Inc.
Total Opsens Inc. Solutions
Inc.
Total
$ $ $ $ $ $
External sales 2,290,654 4,497,083 6,787,737 1,773,715 5,752,707 7,526,422
Internal sales 486,447 - 486,447 1,369,950 - 1,369,950
Depreciation of property,
plant and equipment 212,645 132,916 345,561 168,953 118,516 287,469
Amortization of
intangible assets 38,447 9,333 47,780 25,294 5,709 31,003
Financial expenses
(revenues) (211,342 ) 325,752 114,410 (193,571 ) 293,488 99,917
Net income (net loss) (2,478,047 ) (620,665 ) (3,098,712 ) (2,440,218 ) 74,393 (2,365,825 )
Acquisition of property,
plant and equipment 359,243 30,670 389,913 159,202 313,586 472,788
Additions to
intangible assets 107,499 2,271 109,770 74,639 600 75,239
Segment assets 13,265,042 3,523,578 16,788,620 6,150,782 4,377,345 10,528,127
Segment liabilities 7,756,045 823,346 8,579,391 6,042,685 1,092,264 7,134,949
Geographic sector’s information
* Comprised of revenues generated in countries for which amounts are individually no significant.
Years ended August 31,
2014 2013
$ $
Revenue per geographic sector
Canada 4,725,688 5,825,550
United States 833,802 571,160
Other* 1,228,247 1,129,712
6,787,737 7,526,422

Revenues are attributed to geographic sector based on the clients’ location. Capital assets, which include property,
plant and equipment and intangible assets, are all located in Canada.
During the year ended August 31, 2014, revenues from three clients represented individually more than 10% of the
total revenues of the Company, i.e. approximately 33% (Opsens Solutions Inc.’ reportable segment), 15% (Opsens
Solutions Inc.’ reportable segment) and 11% (Opsens Solutions Inc.’ reportable segment).
During the year ended August 31, 2013, revenues from three clients represented individually more than 10% of the
total revenues of the Company, i.e. approximately 49% (Opsens Solutions Inc.’ reportable segment), 12% (Opsens
Solutions Inc.’ reportable segment) and 10% (Opsens Solutions Inc.’ reportable segment).
Opsens Inc. segment
For the year ended August 31, 2014, revenues from Opsens Inc. segment were $2,777,000 compared with
$3,144,000 in fiscal 2013, a decrease of $367,000. The decrease is explained by lower orders in the oil and gas sector
placed by the wholly-owned subsidiary Opsens Solutions Inc., partly offset by higher revenues in the industrial field
explained by significant orders placed by two existing customers.
Gross margin was $937,000 for the year ended August 31, 2014, compared with $611,000 for fiscal 2013, an
increase of $326,000. The increase in the gross margin is mainly explained by the increase in the gross margin
percentage that increased from 19% for the year ended August 31, 2013 to 34% for the same period in 2014. The
increase in the gross margin percentage reflects a more favourable business mix and revenues from the Abiomed
licensing agreement.
Net loss for the Opsens Inc. segment was $2,478,000 for the year ended August 31, 2014 compared with a net loss of
$2,440,000 for the same period in 2013. The increase in net loss reflects higher administrative and marketing
expenses when compared with last year and by a negative change in fair value of embedded derivative. This was
partly offset by the increase in gross margin as explained above.
The working capital of Opsens Inc. segment as at August 31, 2014 was $8,654,000 compared with $3,994,000 as at
August 31, 2013. The increase of $4,660,000 in the working capital is due to the higher cash and cash equivalent
balance of $6,809,000 with the net proceeds of $7,679,000 from the issuance of shares and units, and also the
$1,647,150 (US$1,500,000) received upon the closing of the agreement with Abiomed, partly offset by higher
deferred revenues of $2,372,000.
Opsens Solutions Inc. segment
For the year ended August 31, 2014, revenues from Opsens Solutions Inc. segment were $4,497,000 compared with
$5,753,000 in 2013, a decrease of $1,256,000. The decrease is explained by fewer orders placed by one of the largest
customer in 2013, partly offset by the installation of OPP-W sensor systems for the 48-well contract.
Gross margin was $1,452,000 for the year ended August 31, 2014 compared with $2,135,000 for the same period in
2013, a decrease of $683,000. Gross margin percentage decreased from 37% for the year ended August 31, 2013 to
32% for the same period in 2014. The decrease in the gross margin and the gross margin percentage is explained by
lower revenues combined with semi-fixed costs not decreasing at the same rate as revenues.
Net loss for the Opsens Solutions Inc. segment was $621,000 in fiscal 2014 compared to a net profit of $74,000 in
fiscal 2013. The increase in the net loss is mainly explained by the decrease in the gross margin as explained
previously.
The working capital of the Opsens Solutions Inc. segment as at August 31, 2014 was $1,531,000 compared with
$2,049,000 as at August 31, 2013. The decrease of $518,000 is explained by a decrease in the inventories level of
$580,000 when compared with last year. Inventories were higher as at August 31, 2013 because of delays in the
installation of the first OPP-W sensor systems for the 48-well contract.

FOURTH QUARTER 2014
Revenues
Revenues totalled $1,804,000 for the quarter ended August 31, 2014 compared to $1,451,000 for the same period last
year. The increase in revenues is mainly explained by higher revenues in the industrial sector.
Gross margin
Gross margin was $748,000 for the three-month period ended August 31, 2014 compared to $321,000 for the same
period last year, an increase of $427,000. Gross margin percentage increased from 22% for the three-month period
ended August 31, 2013 to 41% for the same period in 2014. The increase in gross margin and gross margin
percentage is explained by higher revenues and improved margins on contracts.
Administrative expenses
Administrative expenses were stable at $617,000 and $619,000 for the three-month periods ended August 31, 2014
and 2013, respectively.
Marketing expenses
Marketing expenses totalled $301,000 for the quarter ended August 31, 2014, an increase of $77,000 over the
$224,000 reported for the same period in 2013. The increase is mainly explained by higher headcount and higher
advertising, tradeshows and travelling expenses.
Research and development expenses
Research and development expenses totalled $352,000 for the quarter ended August 31, 2014, a decrease of
$173,000 over the $525,000 reported for the same period in 2013. The decrease is explained by higher tax credits for
research and development that are accounted for against research and development expenses.
Financial expenses
Financial expenses were stable at $27,000 and $29,000 for the three-month periods ended August 31, 2014 and 2013,
respectively,
Change in fair value of embedded derivative
The change in fair value of embedded derivative comes from the variance of the fair market value of the conversion
option component of the convertible debenture. During the fourth quarter, an amount of $5,200 ($18,000 was
recorded as a gain for the three-month period ended August 31, 2013) was recorded as a loss in the consolidated
statement of loss.
Net loss
As a result of the foregoing, net loss for the quarter ended August 31, 2014 was $549,000 or 0.02 cent a share
compared with $1,075,000 or 0.02 cent a share for the same quarter in 2013.

INFORMATION ON SHARE CAPITAL
For the year ended August 31, 2014, the Company granted to some employees and Directors a total of 985,000 stock
options with an average exercise price of $0.71, cancelled 506,667 stock options with an exercise price of $0.32,
60,000 stock options with an exercise price of $0.40 expired and 387,500 stock options with an average exercise
price of $0.37 were exercised.
For the year ended August 31, 2013, the Company granted to some employees and Directors a total of 1,483,667
stock options with an average exercise price of $0.24, cancelled 46,000 stock options with an exercise price of $0.22
and 715,000 stock options with an exercise price of $0.77 expired.
As at November 24, 2014, the following components of shareholders' equity are outstanding:
Common shares 60,098,003 Stock options 4,032,500 Warrants 3,475,426 Convertible debenture 3,143,000
Securities on a fully diluted basis 70,748,929
The number of shares that would be issued upon conversion of the debenture may vary depending on various
parameters such as the exchange rate and the conversion price per share. In the table above, the conversion was
carried out on the assumption that the exchange rate between the U.S. dollar and the Canadian dollar is 1.10 and the
conversion price is equal to $0.70 per share.
No dividend was declared per share for each share class.
RELATED-PARTY TRANSACTIONS
In the normal course of its operations, the Company has entered into transactions with related parties.
Years ended August 31,
2014 2013
$ $
Professional fees paid to a company
controlled by a director 10,035 34,216
10,035 34,216
Fees are incurred for the Company’s FFR activities.
FINANCIAL INSTRUMENTS
Fair Value
The fair value of cash and cash equivalents, trade and other receivables and accounts payable and accrued liabilities
approximates their carrying value due to their short-term maturities.
The fair value of long-term debt is based on the discounted value of future cash flows under the current financial
arrangements at the interest rate the Company expects to currently negotiate for loans with similar terms and
conditions and maturity dates. The fair value of long-term debt approximates its carrying value due to the current
market rates.
The fair value of the convertible debenture is based on the discounted value of future cash flows under the current

financial arrangements at the interest rate the Company expects to currently negotiate for loans with similar terms
and conditions and maturity dates. The fair value of the debt component of the convertible debenture approximates
$1,505,300 as at August 31, 2014 ($1,338,000 as at August 31, 2013) and is classified at level 2 in the fair value
hierarchy.
Valuation Techniques and Assumptions Applied for the Purposes of Measuring Fair Value
The Company must maximize the use of observable inputs and minimize the use of unobservable inputs when
measuring fair value. The Company primarily applies the market approach for recurring fair value measurements.
The three input levels used by the Company to measure fair value are the following:
Level 1 – Unadjusted quoted prices in active markets for identical assets or liabilities. An active market for the asset
or liability is a market in which transactions for the asset or liability occur with sufficient frequency and volume to
provide pricing information on an ongoing basis.
Level 2 – Quoted prices for similar assets or liabilities; quoted prices in markets that are not active; or other inputs
that are observable or can be corroborated by observable market data for substantially the full term of the assets or
liabilities.
Level 3 – Unobservable inputs that are supported by little or no market activity and that are significant to the fair
value of the assets or liabilities.
The following table summarizes the fair value hierarchy under which the Company’s financial instruments are
valued.
As at August 31, 2014
Total Level 1 Level 2 Level 3
$ $ $ $
Financial assets (liabilities) measured at
fair value:
Convertible debenture – embedded
derivative (140,479 ) -
(140,479 ) -
As at August 31, 2013
Total Level 1 Level 2 Level 3
$ $ $ $
Financial assets (liabilities) measured at
fair value:
Convertible debenture – embedded
derivative (34,012 ) -
(34,012 ) -

The convertible debenture contains an embedded derivative that must be measured at fair value at each reporting date
with gains and losses in fair value recognized through profit or loss. One of the most significant assumptions
impacting the Company’s valuation of this embedded derivative is the implied volatility. The fair value of the
convertible debenture was determined using the Black-Scholes pricing model using an implied volatility of 111%
(122% in 2013), a discount rate of 1.35% (1.95% in 2013) and an expected life of 3.2 years (4.2 years in 2013). A
1% change in the implied volatility factor would have changed the fair value of the embedded derivative by $1,740.
Risk Management
The main risks arising from the Company’s financial instruments are credit risk, liquidity risk, interest rate risk and
foreign exchange risk. These risks arise from exposures that occur in the normal course of business and are managed
on a consolidated Company basis.
Credit Risk
Credit risk is the risk of an unexpected loss if a customer or counterparty to a financial instrument fails to meet its
contractual obligations. The Company regularly monitors credit risk exposure and takes steps to mitigate the
likelihood of this exposure resulting in losses. The Company's exposure to credit risk currently relates to cash and
cash equivalents and to trade and other receivables. The Company’s credit risk management policies include the
authorization to carry out investment transactions with recognized financial institutions with credit ratings of at least
A and higher, in either bonds, money market funds or guaranteed investment certificates. Consequently, the
Company manages credit risk by complying with established investment policies.
The credit risk associated with trade and other receivables is generally considered normal since the majority of its
customers are large well-established and financed oil and gas companies. Generally, the Company does not require
collateral or other security from customers for trade accounts receivable; however, credit is extended following an
evaluation of creditworthiness. In addition, the Company performs ongoing credit reviews of all of its customers and
establishes an allowance for doubtful accounts when accounts are determined to be at risk and/or uncollectible. Two
major customers represented 50% of the Company’s total accounts receivable as at August 31, 2014 (64% as at
August 31, 2013).
As at August 31, 2014, 6% (13% as at August 31, 2013) of the accounts receivable were of more than 90 days
whereas 60% (43% as at August 31, 2013) of those were less than 30 days. The maximum exposure to the risk of
credit for receivable corresponded to their book value. As at August 31, 2014, the allowance for doubtful accounts
was established at $3,032 ($21,000 as at August 31, 2013).
Management considers that substantially all receivables are fully collectible as most of our customers are large
corporations with good credit standing and no history of default.

Liquidity Risk
Liquidity risk is the risk that the Company will encounter difficulty in meeting obligations associated with financial
liabilities that are settled in cash and/or another financial asset. The Company’s approach is to ensure it will have
sufficient liquidity to meet operational, capital and regulatory requirements and obligations, under both normal and
stressed circumstances. Cash flow projections are prepared and reviewed quarterly by the Board of Directors to
ensure a sufficient continuity of funding. The funding strategies used to manage this risk include the Company’s
access to capital markets for equity and debt securities issues.
The following are the contractual maturities of the financial liabilities (principal and interest, assuming current
interest rates) as at August 31, 2014 and August 31, 2013:
August 31, 2014 Carrying 0 to 12 12 to 24 After
amount Cash flows months months 24 months
$ $ $ $ $
Accounts payable and
accrued liabilities 1,346,217 1,346,217 1,346,217 - -
Long-term debt 826,834 1,057,301 181,137 256,806 619,358
Convertible debenture 2,359,556 2,392,060 - - 2,392,060
Total 4,532,607 4,795,578 1,527,354 256,806 3,011,418
August 31, 2013 Carrying 0 to 12 12 to 24 After
amount Cash flows months months 24 months
$ $ $ $ $
Accounts payable and
accrued liabilities 2,042,063 2,042,063 2,042,063 - -
Long-term debt 765,104 943,130 201,884 181,137 560,109
Convertible debenture 2,129,811 2,316,600 - - 2,316,600
Total 4,936,978 5,301,793 2,243,947 181,137 2,876,709

Interest Rate Risk
The Company’s exposure to interest rate risk is summarized as follows:
Cash and cash equivalents Fixed interest rates
Trade and other receivables Non-interest bearing
Accounts payable and accrued liabilities Non-interest bearing
Long-term debt Non-interest bearing, fixed and variable interest rates
Convertible debenture Fixed interest rates
Interest Rate Sensitivity Analysis
Interest rate risk exists when interest rate fluctuations modify the cash flows or the fair value of the Company’s
investments and embedded derivative. The Company owns investments with fixed interest rates. As of August 31,
2014, the Company was holding more than 92% (81% as at August 31, 2013) of its cash and cash equivalents in all-
time redeemable term deposits.
Everything else being equal, a hypothetical 1% interest rate increase would have had an unfavourable impact of
$1,717 and $3,697 on the net loss for the year ended August 31, 2014 and 2013, respectively. A hypothetical 1%
interest rate decrease would have had a favourable impact of $1,780 and $3,721 on the net loss for the year ended
August 31, 2014 and 2013, respectively.
Financial expenses (revenues)
Years ended August 31,
2014 2013
$ $
Interest and bank charges 58,183 52,999
Interest on long-term debt 34,906 39,307
Interest and accreted interest on convertible debenture 54,527 40,708
Loss on foreign currency translation 84,941 26,638
Interest income (118,147 ) (59,735 )
114,410 99,117
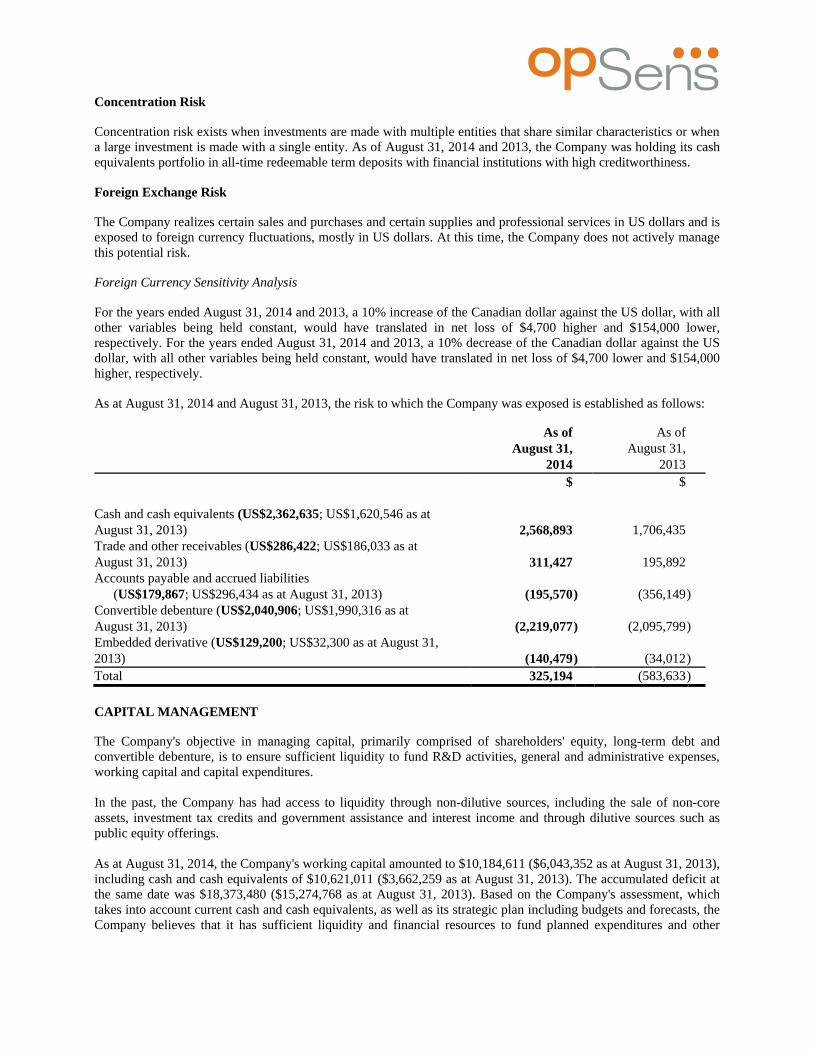
Concentration Risk
Concentration risk exists when investments are made with multiple entities that share similar characteristics or when
a large investment is made with a single entity. As of August 31, 2014 and 2013, the Company was holding its cash
equivalents portfolio in all-time redeemable term deposits with financial institutions with high creditworthiness.
Foreign Exchange Risk
The Company realizes certain sales and purchases and certain supplies and professional services in US dollars and is
exposed to foreign currency fluctuations, mostly in US dollars. At this time, the Company does not actively manage
this potential risk.
Foreign Currency Sensitivity Analysis
For the years ended August 31, 2014 and 2013, a 10% increase of the Canadian dollar against the US dollar, with all
other variables being held constant, would have translated in net loss of $4,700 higher and $154,000 lower,
respectively. For the years ended August 31, 2014 and 2013, a 10% decrease of the Canadian dollar against the US
dollar, with all other variables being held constant, would have translated in net loss of $4,700 lower and $154,000
higher, respectively.
As at August 31, 2014 and August 31, 2013, the risk to which the Company was exposed is established as follows:
As of As of
August 31, August 31,
2014 2013
$ $
Cash and cash equivalents (US$2,362,635; US$1,620,546 as at
August 31, 2013) 2,568,893 1,706,435
Trade and other receivables (US$286,422; US$186,033 as at
August 31, 2013) 311,427 195,892
Accounts payable and accrued liabilities
(US$179,867; US$296,434 as at August 31, 2013) (195,570 ) (356,149 )
Convertible debenture (US$2,040,906; US$1,990,316 as at
August 31, 2013) (2,219,077 ) (2,095,799 )
Embedded derivative (US$129,200; US$32,300 as at August 31,
2013) (140,479 ) (34,012 )
Total 325,194 (583,633 )
CAPITAL MANAGEMENT
The Company's objective in managing capital, primarily comprised of shareholders' equity, long-term debt and
convertible debenture, is to ensure sufficient liquidity to fund R&D activities, general and administrative expenses,
working capital and capital expenditures.
In the past, the Company has had access to liquidity through non-dilutive sources, including the sale of non-core
assets, investment tax credits and government assistance and interest income and through dilutive sources such as
public equity offerings.
As at August 31, 2014, the Company's working capital amounted to $10,184,611 ($6,043,352 as at August 31, 2013),
including cash and cash equivalents of $10,621,011 ($3,662,259 as at August 31, 2013). The accumulated deficit at
the same date was $18,373,480 ($15,274,768 as at August 31, 2013). Based on the Company's assessment, which
takes into account current cash and cash equivalents, as well as its strategic plan including budgets and forecasts, the
Company believes that it has sufficient liquidity and financial resources to fund planned expenditures and other
working capital needs for at least, but not limited to, the 12-month period following the statement of financial
position date of August 31, 2014.
The Company believes that its current liquid assets are sufficient to finance its activities in the short-term.
The Company manages the capital structure and makes adjustments to it in light of changes in economic conditions
and the risk characteristics of the underlying assets. Capital management objectives, policies and procedures have
remained unchanged since the last fiscal year.
For the years ended August 31, 2014 and 2013, the Company has not been in default under any of its obligations
regarding the long-term debt.
SUBSEQUENT EVENTS
Shonin Approval
On October 2, 2014, the Company announced that it received Shonin approval from the Japanese Ministry of Health,
Labor and Welfare to market the OptoWire and the OptoMonitor in Japan. Obtaining Shonin approval was the final
condition for a milestone payment of US$1,000,000 ($1,116,300) from the Japanese distributor. This amount will be
recorded in the statement of loss and comprehensive loss in the first quarter of fiscal 2015.
CE Mark Regulatory Approval
On November 19, 2014, the Company announced it has received CE Mark approval to market in Europe its FFR
products. The CE mark approval, in addition to the Shonin approval obtained on October 2, 2014, allow the
Company to record in the statement of loss under the caption “Distribution rights” the $2,002,000 (US$2,000,000)
upfront license fee it received upon the signature of the agreement. The upfront license fee was previously accounted
for as deferred revenues since the Company had to reimburse the upfront licence upon the occurrence of events
described in note 12 to the consolidated financial statements.
CAPACITY TO PRODUCE RESULTS
As discussed in the section regarding financial position, the Company has the required financial resources for its
short-term operations, to fulfill its commitments, to support its growth plan and for the development of its activities.
On a mid-term perspective, it is possible that additional financing, through the issuance of shares or debt financing or
any other means of financing, might be required.
During the next year, the activity level should require additional investment in working capital of approximately
$750,000. Investments in capital of a few hundreds of thousands of dollars will be needed to respond to Opsens’
operational needs.
From the human resources’ perspective, there are no vacancies in the major executive positions within the Company.
However, additional technical and production personnel will be required in Quebec and Alberta. Taking into account
the employment market in Canada, Opsens is confident in its capacity to recruit qualified human resources in a
timely fashion.
Regarding the strategy on corporate executive remuneration, it is oriented towards creation of long-term value for the
shareholders. Several corporate executives hold an important share and share-purchase option position, with rights to
be acquired over a four-year period in order to align shareholders’ interest with corporate executives’ interest. This
long-term vision stimulates innovation and the development of recurrent revenues.

NEW ACCOUNTING STANDARDS
There are no IFRSs or International Financial Reporting Interpretations Committee ("IFRIC") that are effective for
the first time in 2014 that would be expected to have a material impact on the Company.
Adopted in 2014
IAS 1, Financial Statements Presentation
In June 2011, the IASB amended IAS 1, Financial Statements Presentation, to change the disclosure of items
presented in other comprehensive income (“OCI”), including a requirement to separate items presented in OCI into
two groups on whether or not they may be recycled to net income in the future.
The amendments were adopted effective September 1st, 2013 in accordance with the transition rules of IAS 1. The
Company has concluded that the adoption of IAS 1 did not result in any changes.
IFRS 7 (Revised), Financial Instruments: Disclosures
In December 2011, the IASB and the Financial Accounting Standards Board (“FASB”) issued common disclosure
requirements that are intended to help investors and other users to better assess the effect or potential effect of
offsetting arrangements on a company's financial position. The new requirements are set out in Disclosures-
Offsetting Financial Assets and Financial Liabilities (Amendments to IFRS 7). The IFRS 7 amendments were
adopted retrospectively effective September 1st, 2013. The Company has concluded that the adoption of IFRS 7 did
not result in any changes.
IFRS 10, Consolidated Financial Statements
IFRS 10, Consolidated Financial Statements, builds on existing principles by identifying the concept of control as the
determining factor in whether an entity should be included within the consolidated financial statements of the parent
company. The standard provides additional guidance to assist in the determination of control where this is difficult to
assess. This standard replaces the Standing Interpretations Committee (“SIC”) 12, Consolidation – Special Purpose
Entities and parts of IAS 27, Consolidated and Separate Financial Statements.
IFRS 10 was adopted retrospectively effective September 1st, 2013 in accordance with the transition rules of IFRS
10. The Company has concluded that the adoption of IFRS 10 did not result in any changes.
IFRS 11, Joint Arrangements
IFRS 11, Joint Arrangements, supersedes IAS 31, Interests in Joint Ventures, and requires joint arrangements to be
classified either as joint operations or joint ventures, depending on the contractual rights and obligations of each
investor that jointly control the arrangement. For joint operations, a company recognizes its share of assets,
liabilities, revenues and expenses of the joint operation. An investment in a joint venture is accounted for using the
equity method as set out in IAS 28, Investments in Associates and Joint Ventures (amended in 2011). The other
amendments to IAS 28 did not affect the Company.
IFRS 11 and IAS 28 were adopted retrospectively effective September 1st, 2013 in accordance with the transition
rules of IFRS 11 and IAS 28. The Company has concluded that the adoption of IFRS 11 and IAS 28 (amended in
2011) did not result in any changes.
IFRS 12, Disclosure of Interest in Other Entities
IFRS 12, Disclosure of Interests in Other Entities, is a new and comprehensive standard on disclosure requirements
for all forms of interests in other entities, including joint arrangements, associates, special purpose vehicles and other
off balance sheet vehicles.
IFRS 12 was adopted retrospectively effective September 1st, 2013 in accordance with the transition rules of IFRS
12. The Company assessed its disclosure of interest in other entities and determined that the adoption of IFRS 12 did

not result in additional disclosures.
IFRS 13, Fair Value Measurement
IFRS 13, Fair Value Measurement, provides a single framework for measuring fair value. The measurement of the
fair value of an asset or liability is based on assumptions that market participants would use when pricing the asset
and liability under current market conditions, including assumptions about risk.
IFRS 13 was adopted retrospectively effective September 1st, 2013 in accordance with the transition rules of IFRS
13. Other than additional disclosure which is included in note 26, the adoption of this standard did not require any
adjustments to the valuation techniques used by the Company to measure fair value and did not result in any
measurement adjustments as at September 1, 2013.
Not yet adopted
IFRS 9, Financial Instruments
This new standard replaces the requirements in IAS 39, Financial Instruments: Recognition and Measurement for
classifying and measuring of financial assets and liabilities. IFRS 9 replaces the multiple category and measurement
models in IAS 39, Financial Instruments: Recognition and Measurement, for debt instruments with a new mixed
measurement model having only two categories: amortized cost and fair value through the statement of income
(loss). IFRS 9 also replaces the models for measuring equity instruments. Such instruments are either recognized at
fair value through the statement of income (loss) or at fair value through other comprehensive income. Where equity
instruments are measured at fair value through other comprehensive income, dividends are recognized in the
statement of income (loss) to the extent that they do not clearly represent a return of investment; however, other
gains and losses (including impairments) associated with such instruments remain in accumulated comprehensive
income indefinitely.
Requirements for financial liabilities were added to IFRS 9 and they largely carried forward existing requirements in
IAS 39, except that fair value changes due to credit risk for liabilities designated at fair value through profit and loss
are generally recorded in other comprehensive income. IFRS 9 is applicable to the Company starting on September
1, 2018, on a retrospective basis.
The Company will evaluate in the near term the impact of these future changes.
IAS 32, Financial Instruments: Presentation
In December 2011, amendments to IAS 32, Financial Instruments: Presentation, were issued to clarify the
application of offsetting criteria with regard to offsetting financial assets and financial liabilities. The amendments to
IAS 32 will be effective for fiscal years beginning on or after January 1, 2014 with earlier adoption permitted. The
Company is currently assessing the impact of adopting these new requirements on the consolidated financial
statements.
IAS 36, Impairment of Assets
IAS 36, Impairment of Assets, has been revised to integrate the amendments issued in May 2013. Those amendments
make it possible to better reflect a prior decision to require the recoverable amount of impaired assets to be reported
along with other disclosures regarding the measurement of the recoverable amount of impaired assets in cases where
said recoverable amount is based on fair value less cost of disposal, including the discount rate, when a discounting
technique is used to determine the recoverable amount. Those amendments will be effective for fiscal years
beginning on or after January 1, 2014 with earlier adoption permitted. The Company is currently assessing the
impact of adopting these new requirements on the consolidated financial statements.
IFRIC 21, Levies
IFRIC 21, Levies, which is an interpretation of IAS 37, ‘Provisions, Contingent Liabilities and Contingent Assets’,

applies to the accounting for levies imposed by governments. IAS 37 sets out criteria for the recognition of a
liability, one of which is the requirement for the entity to have a present obligation as a result of a past event
(“obligating event”). IFRIC 21 clarifies that the obligating event that gives rise to a liability to pay a levy is the
activity described in the relevant legislation that triggers the payment of the levy. IFRIC 21 is effective for annual
periods commencing on or after January 1, 2014. The Company is currently evaluating the extent of the impact of
adoption of this standard.
IFRS 15, Revenue from Contracts with Customers
In May 2014, the IASB released IFRS 15, Revenue from Contracts with Customers, which establishes principles for
reporting the nature, amount, timing and uncertainty of revenue and cash flows arising from an entity’s contracts
with customers. It provides a single model in order to depict the transfer of promised goods or services to customers.
The core principle of IFRS 15 is that an entity recognizes revenue to depict the transfer of promised goods or
services to customers in an amount that reflects the consideration to which an entity expects to be entitled in
exchange for those goods and services. IFRS 15 also requires more comprehensive disclosures about the nature,
amount, timing and uncertainty of revenue and cash flows arising from an entity’s contracts with customers.
IFRS 15 supersedes IAS 11, Construction Contracts, IAS 18, Revenue, and a number of revenue-related
interpretations (IFRIC 13, Customer Loyalty Programmes, IFRIC 15, Agreements for the Construction of Real
Estate, IFRIC 18, Transfers of Assets from Customers, and SIC-31, Revenue, Barter Transactions Involving
Advertising Service). IFRS 15 is effective for annual periods beginning on or after January 1, 2017, with earlier
adoption permitted. The Company has not yet assessed the impact of the adoption of this standard on its consolidated
financial statements.
RISK FACTORS AND UNCERTAINTIES
The Company operates in an industry that contains various risks and uncertainties. The risks and uncertainties listed
below are not the only ones to which the Company is subject. Additional risks and uncertainties not presently known
by the Company, or which the Company deems to be currently insignificant, may impede the Company’s
performance. The materialization of one of the following risks could harm the Company’s activities and have
significant negative impacts on its financial situation and its operating results. In that case, the Company’s stock
price could be affected.
In the FFR market, the Company is dependent on the success of the OptoWire, its guidewire measuring FFR and
cannot be certain that it will achieve the broad acceptance necessary to develop a profitable business. Expected
future revenues are primarily derived from sales of the OptoWire. The OptoWire is designed to provide cardiologists
with a pressure guidewire to navigate coronary arteries and reach blockages with ease, while also measuring intra-
coronary blood pressure. The Company expects that sales of its FFR products will account for a majority of its
revenues for the foreseeable future, however it is difficult to predict the penetration and future growth rate or size of
the market for FFR technology. The expansion of the FFR market depends on a number of factors, such as:
physicians accepting the benefits of the use of FFR in conjunction with angiography;
physician experience with FFR products either used alone or jointly used in a single percutaneous coronary
intervention, or PCI;
the availability of training necessary for proficient use of FFR products, as well as willingness by
physicians to participate in such training;
the additional procedure time required for use of FFR compared to the perceived benefits;
the perceived risks generally associated with the use of the Company’s products and procedures, especially
its new products and procedures;
the placement of the Company’s products in treatment guidelines published by leading medical
organizations;
the availability of alternative treatments or procedures that are perceived to be or are more effective, safer,
easier to use or less costly;
hospitals' willingness, and having sufficient budgets, to purchase the Company’s FFR products;
the size and growth rate of the PCI market in the major geographies in which the Company operates;
the availability of adequate reimbursement; and

the success of the Company’s marketing efforts and publicity regarding FFR technology.
Even if FFR technology gains wide market acceptance, the Company’s FFR products may not adequately address
market requirements and may not continue to gain market acceptance among physicians, healthcare payors and the
medical community due to factors such as:
the lack of perceived benefit from information related to pressure characteristics of blood around blockages
available to the physician;
the actual and perceived ease of use of the Company’s FFR products;
the quality of the measurements provided by the Company’s FFR products;
the cost, performance, benefits and reliability of the Company’s FFR products relative to competing
products and services; and
the extent and timing of technological advances.
If FFR technology generally, or the Company’s FFR products specifically, do not gain wide market acceptance, the
Company may not be able to achieve its anticipated growth, revenues or profitability and its results of operations
would suffer.
The risks inherent in the Company’s international operations may adversely impact its revenues, results of
operations and financial condition. The Company anticipates that it will derive a significant portion of its revenues
from operations in Japan, the United States and Europe. As the Company expands internationally, it will need to
retain and train its distributors, hire, train and retain qualified personnel for its direct sales efforts and train other
personnel in countries where language, cultural or regulatory impediments may exist. The Company cannot ensure
that distributors, physicians, regulators or other government agencies outside Canada will accept its products,
services and business practices. Current or future trade, social and environmental regulations or political issues could
restrict the supply of resources used in production or increase its costs. Compliance with such regulations is costly.
Any failure to comply with applicable legal and regulatory obligations could impact the Company in a variety of
ways that include, but are not limited to, significant criminal, civil and administrative penalties, including
imprisonment of individuals, fines and penalties, denial of export privileges, seizure of shipments and restrictions on
certain business activities. Failure to comply with applicable legal and regulatory obligations could result in the
disruption of the Company’s manufacturing, shipping and sales activities. The Company’s international sales
operations expose it and its representatives, agents and distributors to risks inherent in operating in foreign
jurisdictions, including:
the Company’s ability to obtain, and the costs associated with obtaining export licenses and other required
export or import licenses or approvals;
changes in duties and tariffs, taxes, trade restrictions, license obligations and other non-tariff barriers to
trade;
burdens of complying with a wide variety of foreign laws and regulations related to healthcare products;
costs of localizing product and service offerings for foreign markets;
business practices favoring local companies;
longer payment cycles and difficulties collecting receivables through foreign legal systems;
difficulties in enforcing or defending agreements and intellectual property rights;
differing local product preferences, including as a result of differing reimbursement practices;
fluctuations in foreign currency exchange rates and their impact on the Company’s operating results; and
changes in foreign political or economic conditions.
The Company cannot ensure that one or more of these factors will not harm the Company. Inability to expand the
Company’s international operations would adversely impact its revenues, results of operations and financial
condition.
The Company has a limited operating history, and cannot assure you that it achieves and sustains profitability in
future periods. The Company was incorporated in 2006 and has been profitable, on a full year basis, only in 2010.
Net losses for fiscal years ended August 31, 2014 and 2013 were $3,099,000 and $2,366,000, respectively. To the
extent that the Company is able to increase revenues, it expects its operating expenses will also increase as the
Company will be expanded to meet anticipated growing demand for its products and will devote resources to its

sales, marketing and research and development activities. If the Company is unable to reduce its operating expenses,
the Company may not achieve profitability. Additionally, expenses will fluctuate as the Company makes future
investments in research and development, selling and marketing and general and administrative activities, including
as a result of new product introductions. This will cause the Company to experience variability in its reported
earnings and losses in future periods. You should not rely on the Company’s operating results for any prior quarterly
or annual period as an indication of its future operating performance.
Dependence upon a limited number of clients. Although the Company has numerous clients, a relatively small
number of them contribute a significant percentage of the Company’s consolidated revenues. For the year ended
August 31, 2014, revenues from three clients represented individually more than 10% of the total revenues of the
Company, i.e. approximately 33%, 15% and 11%, all these clients being in the oil and gas market. The Company
believes that the degree of dependence will diminish as its sales progress. However, if these clients reduce current or
expected purchases, this could have unfavourable impacts on the Company’s activities, its revenues, its financial
position and its operating results.
The Company faces intense competition and may not be able to keep pace with the rapid technological changes in
the medical devices industry. The medical device market is intensely competitive and is characterized by extensive
research and development and rapid technological change. The Company’s future customers will consider many
factors when choosing suppliers, including product reliability, clinical outcomes, product availability, inventory
consignment, price and product services provided by the manufacturer, and market share can shift as a result of
technological innovation and other business factors. Major shifts in industry market share have occurred in
connection with product problems, physician advisories and safety alerts, reflecting the importance of product
quality in the medical device industry, and any quality problems with the Company’s processes, goods and services
could harm its reputation for producing high-quality products and erode its competitive advantage, sales and
potential market share.
The Company’s competitors will be larger companies which have significantly greater resources and broader product
offerings than the Company, and it anticipates that in the coming years, other technologies or corporations could
enter the FFR market. In addition, the Company expects that competition will intensify with the increased use of
strategies such as consigned inventory, and the Company anticipates increasing price competition as a result of
managed care, consolidation among healthcare providers, increased competition and declining reimbursement rates.
Product introductions or enhancements by competitors which have advanced technology, better features or lower
pricing may make the Company’s products or proposed products obsolete or less competitive. As a result, the
Company will be required to devote continued efforts and financial resources to bring its products under
development to market, enhance its existing products and develop new products for the medical marketplace. If the
Company fails to develop new products, enhance existing products or compete effectively, the Company’s financial
condition and results of operations will be adversely affected.
Failure to innovate may adversely impact the Company’s competitive position and may adversely impact its ability
to drive price increases for its products and its product revenues. The Company’s future success will depend upon
its ability to innovate and introduce enhancements to its existing products in order to address the changing needs of
the marketplace. The Company also relies on product enhancements to attempt to drive price increases for its
products in its markets. Frequently, product development programs require assessments to be made of future clinical
need and commercial feasibility, which are difficult to predict. Customers may forego purchases of its products and
purchase its competitors' products as a result of delays in introduction of its new products and enhancements, failure
to choose correctly among technical alternatives or failure to offer innovative products or enhancements at
competitive prices and in a timely manner. Any delays in product releases may negatively affect the Company.
Delays in planned product introductions may adversely affect the Company and negatively impact future
revenues. The Company is currently developing its FFR products. The Company may in the future experience delays
in various phases of product development and commercial launch, including during research and development,
manufacturing, limited release testing, marketing and customer education efforts. Any delays in the Company’s
product launches may significantly impede its ability to successfully compete in its markets and may reduce its
revenues. The Company and its future collaborators may fail to develop or effectively commercialize products
covered by its future collaborations if:

the Company does not achieve its objectives under its collaboration agreements;
the Company or its collaborators are unable to obtain patent protection for the products or proprietary
technologies the Company develops with its collaborations; or
the Company or its collaborators encounter regulatory hurdles that prevent commercialization of its
products.
If the Company or its collaborators are unable to develop or commercialize products, or if conflicts arise with its
collaborators, the Company will be delayed or prevented from developing and commercializing products, which will
harm the Company and financial results.
Divestitures of any of the Company’s businesses or product lines may materially adversely affect the Company,
results of operations and financial condition. The Company continues to evaluate the performance of all of its
businesses and may sell a business or product line. Any divestitures may result in significant write-offs, including
those related to goodwill and other intangible assets, which could have a material adverse effect on the Company’s
business, results of operations and financial condition. Divestitures could involve additional risks, including
difficulties in the separation of operations, services, products and personnel, the diversion of management's attention
from other business concerns, the disruption of the Company’s business and the potential loss of key employees. The
Company may not be successful in managing these or any other significant risks that it encounters in divesting a
business or product line.
If the Company’s facilities or systems are damaged or destroyed, it may experience delays that could negatively
impact its revenues or have other adverse effects. The Company’s facilities may be affected by natural or man-made
disasters. If one of its facilities were affected by a disaster, the Company would be forced to rely on third-party
manufacturers or to shift production to another manufacturing facility. In such an event, the Company would face
significant delays in manufacturing which would prevent it from being able to sell its products. In addition, the
Company’s insurance may not be sufficient to cover all of the potential losses and may not continue to be available
to it on acceptable terms, or at all. Furthermore, although its computer and communications systems are protected
through physical and software safeguards, they are still vulnerable to fire, storm, flood, power loss, earthquakes,
telecommunications failures, physical or software break-ins, software viruses, and similar events, and any failure of
these systems to perform for any reason and for any period of time could adversely impact the Company’s ability to
operate.
The Company may require significant additional capital to pursue its growth strategy, and its failure to raise
capital when needed could prevent the Company from executing its growth strategy. The Company believes that its
existing cash and cash equivalents will be sufficient to meet its anticipated cash needs for at least the next 24 to 36
months. However, the Company may need to obtain additional financing to pursue its strategy, to respond to new
competitive pressures or to act on opportunities to acquire or invest in complementary businesses, products or
technologies. The timing and amount of the Company’s working capital and capital expenditure requirements may
vary significantly depending on numerous factors, including:
market acceptance of its products;
the revenues generated by its products;
the need to adapt to changing technologies and technical requirements, and the costs related thereto;
the costs associated with expanding its manufacturing, marketing, sales and distribution efforts;
the existence and timing of opportunities for expansion, including acquisitions and strategic transactions;
and
costs and fees associated with defending existing or potential litigation.
If the third-party distributors that the Company will rely on to market and sell its products are not successful, the
Company may be unable to increase or maintain its level of revenues. A portion of its revenue will be generated by
third-party distributors, especially in international markets. If these distributors cease or limit operations or
experience a disruption of their business operations, or are not successful in selling the Company’s products, it may
be unable to increase or maintain its level of revenues, and any such developments could negatively affect its
international sales strategy. Over the long term, the Company intends to grow its business internationally, and to do
so it will need to attract additional distributors to expand the territories in which the Company does not directly sell
its products. The Company’s distributors may not commit the necessary resources to market and sell its products. If

current or future distributors do not continue to distribute the Company’s products or do not perform adequately or if
the Company is unable to locate distributors in particular geographic areas, it may not realize revenue growth
internationally.
If the Company fails to properly manage its anticipated growth, the Company could suffer. Rapid growth of the
Company is likely to place a significant strain on its managerial, operational and financial resources and systems. To
execute the Company’s anticipated growth successfully, it must attract and retain qualified personnel and manage
and train them effectively. The Company anticipates hiring additional distributors and personnel to assist in the
commercialization of its current products and in the development of future products. The Company will be
dependent on its personnel and third parties to effectively market and sell its products to an increasing number of
customers. It will also depend on its personnel to develop and manufacture in anticipated increased volumes its
existing products, as well as new products and product enhancements. Further, the Company anticipated growth will
place additional strain on its suppliers resulting in increased need for it to carefully monitor for quality assurance.
Any failure by the Company to manage its growth effectively could have an adverse effect on its ability to achieve
its development and commercialization goals.
The Company is subject to stringent domestic and foreign medical device regulation and any adverse regulatory
action may materially adversely affect its financial condition and business operations. The Company’s products,
development activities and manufacturing processes are subject to extensive and rigorous regulation by numerous
government agencies. To varying degrees, each of these agencies monitors and enforces the Company’s compliance
with laws and regulations governing the development, testing, manufacturing, labelling, marketing and distribution
of its medical devices. The process of obtaining marketing approval or clearance from these government agencies for
new products, or for enhancements or modifications to existing products, could:
take a significant amount of time;
require the expenditure of substantial resources;
involve rigorous pre-clinical and clinical testing, as well as increased post-market surveillance; and
involve modifications, repairs or replacements of the Company’s products, and result in limitations on the
indicated uses of its products.
The Company cannot be certain that it will receive required approval or clearance from government agencies for new
products or modifications to existing products on a timely basis. The failure to receive approval or clearance for
significant new products or modifications to existing products on a timely basis could have a material adverse effect
on the Company’s financial condition and results of operations.
Foreign governmental regulations have become increasingly stringent and more common, and the Company may
become subject to even more rigorous regulation by foreign governmental authorities in the future. Penalties for a
company's noncompliance with foreign governmental regulation could be severe, including revocation or suspension
of a company's business license and criminal sanctions. Any domestic or foreign governmental medical device law or
regulation imposed in the future may have a material adverse effect on the Company’s financial condition and
business operations.
The FFR procedures and the cardiovascular field in general are continually the subject of clinical trials
conducted by the Company’s competitors or other third parties, the results of which may be unfavorable, or
perceived as unfavorable by the market, and could have a material adverse effect on the Company’s financial
condition and results of operations. Unfavorable or inconsistent clinical data from existing or future clinical trials
conducted by the Company, by its competitors or by third parties, or the market's perception of this clinical data, may
adversely impact its ability to obtain product approvals, the size of the markets in which the Company participates,
its position in, and share of, the markets in which the Company participates and the Company’s financial condition
and results of operations.
If the Company is unable to protect its intellectual property effectively, its financial condition and results of
operations could be adversely affected. Patents and other proprietary rights are essential to the Company and its
ability to compete effectively with other companies is dependent upon the proprietary nature of its technologies. The
Company also relies upon trade secrets, know-how, continuing technological innovations and licensing opportunities
to develop, maintain and strengthen its competitive position. The Company seeks to protect these, in part, through

confidentiality agreements with certain employees, consultants and other parties. The Company pursues a policy of
generally obtaining patent protection in both Canada and in key foreign countries for patentable subject matter in its
proprietary devices and also attempt to review third-party patents and patent applications to the extent publicly
available to develop an effective patent strategy, avoid infringement of third-party patents, and monitor the patent
claims of others.
The Company currently owns numerous Canadian and foreign patents and has patent applications pending. The
Company cannot be certain that any pending or future patent applications will result in issued patents, that any
current or future patents issued will not be challenged, invalidated or circumvented or that the rights granted
thereunder will provide a competitive advantage to it or prevent competitors from entering markets which the
Company currently serves. In addition, the Company may have to take legal action in the future to protect its trade
secrets or know-how or to defend itself against claimed infringement of the rights of others. Any legal action of that
type could be costly and time consuming to the Company despite insurance policies owned by the Company and it
cannot be certain of the outcome. The invalidation of key patents or proprietary rights which the Company owns or
an unsuccessful outcome in lawsuits to protect its intellectual property could have a material adverse effect on its
financial condition and results of operations.
Pending and future patent litigation could be costly and disruptive to the Company and may have an adverse
effect on its financial condition and results of operations. The Company operates in an industry that is susceptible
to significant patent litigation and, in recent years, it has been common for companies in the medical device field to
aggressively challenge the rights of other companies to prevent the marketing of new devices. Companies that obtain
patents for products or processes that are necessary for or are useful to the development of its products may bring
legal actions against the Company claiming infringement. Defending intellectual property litigation is expensive and
complex and outcomes are difficult to predict. Any pending or future patent litigation may result in significant
royalty or other payments or injunctions despite insurance policies owned by the Company that can prevent the sale
of products and may cause a significant diversion of the efforts of the Company’s technical and management
personnel. While the Company intends to defend any such lawsuits vigorously, it cannot be certain that it will be
successful. In the event that the Company’s right to market any of its products is successfully challenged or if the
Company fails to obtain a required license or is unable to design around a patent, the Company’s financial condition
and results of operations could be materially adversely affected.
Any defects or malfunctions in the computer hardware or software the Company utilizes in its products could
cause severe performance failures in such products, which would harm its reputation and adversely affect its
results of operations and financial condition. The Company’s existing and new products depend and will depend on
the continuous, effective and reliable operation of computer hardware and software. Any defect, malfunction or other
failing in the computer hardware or software utilized by the Company’s products, including products it develops in
the future, could result in inaccurate readings, misinterpretations of data, or other performance failures that could
render the Company’s products unreliable or ineffective and could lead to decreased confidence in its products,
damage to its reputation, reduction in its sales and product liability claims, the occurrence of any of which could
have a material adverse effect on the Company’s results of operations and financial condition. Although the
Company updates the computer software utilized in its products on a regular basis, there can be no guarantee that
defects do not or will not in the future exist or that unforeseen malfunctions, whether within the Company’s control
or otherwise, will not occur.
If the Company fails to obtain or maintain, or experience significant delays in obtaining, regulatory clearances or
approvals for its products or product enhancements, the Company’s ability to commercially distribute and market
its products could suffer. The Company’s products are subject to rigorous regulation by federal, provincial, state and
foreign governmental authorities. The Company’s failure to comply with such regulations or to make adequate,
timely corrections, could lead to the imposition of injunctions, suspensions or loss of marketing clearances or
approvals, product recalls, manufacturing cessation, termination of distribution, product seizures, civil penalties, or
some combination of such actions. The process of obtaining regulatory authorizations to market a medical device can
be costly and time consuming, and there can be no assurance that such authorizations will be granted on a timely
basis, if at all. If regulatory clearance or approvals are received, additional delays may occur related to
manufacturing, distribution or product labeling.

The loss of any of the Company’s sole-source suppliers or an increase in the price of inventory supplied to it could
have an adverse effect on the Company’s financial condition and results of operations. The Company purchases
certain supplies used in its manufacturing processes from single sources due to quality considerations, costs or
constraints resulting from regulatory requirements. Agreements with certain suppliers are terminable by either party
upon short notice and the Company has been advised periodically by some suppliers that in an effort to reduce their
potential product liability exposure, they may terminate sales of products to customers that manufacture implantable
medical devices, and the Company may not be able to establish additional or replacement suppliers for certain
components or materials quickly. In addition, the Company may lose a sole-source supplier due to, among other
things, the acquisition of such a supplier by a competitor (which may cause the supplier to stop selling its products to
it) or the bankruptcy of such a supplier, which may cause the supplier to cease operations. A reduction or interruption
by a sole-source supplier of the supply of materials or key components used in the manufacturing of the Company’s
products or an increase in the price of those materials or components could adversely affect the Company’s financial
condition and results of operations.
Cost containment pressures and domestic and foreign legislative or administrative reforms resulting in restrictive
reimbursement practices of third-party payors or preferences for alternate therapies could decrease the demand
for products purchased by the Company’s customers, the prices which they are willing to pay for those products
and the number of procedures using its devices. FFR products will be purchased principally by healthcare providers
that typically bill various third-party payors, such as governmental, private insurance plans and managed care plans,
for the healthcare services provided to their patients. The ability of customers to obtain appropriate reimbursement
for their services and the products they provide from government and third-party payors is critical to the success of
medical technology companies. The availability of reimbursement affects which products customers purchase and
the prices they are willing to pay. Reimbursement varies from country to country and can significantly impact the
acceptance of new technology. After the Company develops a promising new product, it may find limited demand
for the product unless reimbursement approval is obtained from private and governmental third-party payors.
Major third-party payors for healthcare provider services continue to work to contain healthcare costs. The
introduction of cost containment incentives, combined with closer scrutiny of healthcare expenditures by both private
health insurers and employers, has resulted in increased discounts and contractual adjustments to healthcare provider
charges for services performed and in the shifting of services between inpatient and outpatient settings. Initiatives to
limit the growth of healthcare costs, including price regulation, are also underway in several countries in which the
Company will do business. Implementation of healthcare reforms in the United States and in significant overseas
markets such as Germany, Japan and other countries may limit the price or the level at which reimbursement is
provided for the Company’s products and adversely affect both its pricing flexibility and the demand for its products.
Healthcare providers may respond to such cost-containment pressures by substituting lower cost products or other
therapies for the Company’s products.
Consolidation in the healthcare industry could lead to demands for price concessions or limit or eliminate the
Company’s ability to sell to certain of its significant market segments. The cost of healthcare has risen significantly
over the past decade and numerous initiatives and reforms initiated by legislators, regulators and third-party payors
to curb these costs have resulted in a consolidation trend in the medical device industry as well as among the
Company’s future customers, including healthcare providers. This in turn has resulted in greater pricing pressures
and limitations on the Company’s ability to sell to important market segments, as group purchasing organizations,
independent delivery networks and large single accounts. The Company expects that market demand, government
regulation, third-party reimbursement policies and societal pressures will continue to change the worldwide
healthcare industry, resulting in further business consolidations and alliances which may exert further downward
pressure on the prices of its products and adversely impact the Company’s financial condition and results of
operations.
The success of the OptoWire depends upon strong relationships with physicians and other healthcare
professionals. If the Company fails to build working relationships with physicians and other healthcare
professionals, many of its products may not be developed and marketed in line with the needs and expectations of the
professionals who support its products. The research, development, marketing and sales of many of its new and
improved products is dependent upon the Company maintaining working relationships with physicians as well as
other healthcare professionals, who are becoming increasingly instrumental in making purchasing decisions for its
products. The Company relies on these professionals to provide it with considerable knowledge and experience

regarding its products and the marketing and sale of its products. Physicians also assist the Company as researchers,
marketing consultants, product consultants, inventors and as public speakers. If the Company is unable to maintain
its strong relationships with these professionals and continue to receive their advice and input, the development and
marketing and sales of its products could suffer, which could have a material adverse effect on its financial condition
and results of operations. The Company’s relationships with physicians and other healthcare professionals and other
providers that use its products are regulated under various laws. In addition, the Company has in place and is
continuously improving its internal business integrity and compliance program and policies. Failure to comply with
the United States federal anti kickback law or similar state or foreign law could result in criminal or civil penalties.
Instability in international markets or foreign currency fluctuations could adversely affect the Company’s results
of operations. The Company’s products will be marketed in many countries, with its largest geographic markets
being Japan, Europe, and the United States. As a result, the Company’s faces currency and other risks associated
with its international sales. The Company is exposed to foreign currency exchange rate fluctuations due to
transactions denominated primarily in United States dollars, Euros and Japanese Yen, which may potentially reduce
the Canadian dollars the Company receives for sales denominated in any of these foreign currencies and/or increase
the Canadian dollars the Company reports as expenses in these currencies, thereby affecting its reported consolidated
revenues, profit margins and results of operations. Fluctuations between the currencies in which the Company does
business will cause foreign currency transaction gains and losses. The Company cannot predict the effects of
currency exchange rate fluctuations upon its future operating results because of the number of currencies involved,
the variability of currency exposures and the volatility of currency exchange rates.
In addition to foreign currency exchange rate fluctuations, there are a number of additional risks associated with the
Company’s international operations, including those related to:
the imposition of or increase in import or export duties, surtaxes, tariffs or customs duties;
the imposition of import or export quotas or other trade restrictions;
foreign tax laws and potential increased costs associated with overlapping tax structures;
compliance with import/export laws;
longer accounts receivable cycles in certain foreign countries, whether due to cultural, economic or other
factors;
changes in medical reimbursement programs and regulatory requirements in international markets in which
the Company operates; and
economic and political instability in foreign countries, including concerns over excessive levels of
sovereign debt and budget deficits in countries where the Company markets its products that could result in
an inability to pay or timely pay outstanding payables.
OTHER INFORMATION
Updated information on the Company can be found on the SEDAR Web site at http://www.sedar.com.
On behalf of management,
Chief Financial Officer and Corporate Secretary
(s) Thierry Dumas
_______________
November 24, 2014


Consolidated Financial Statements
Opsens Inc. Years ended August 31, 2014 and 2013

Opsens Inc. Years ended August 31, 2014 and 2013 Table of contents Independent Auditor’s Report ............................................................................................................................ 1-2
Consolidated Statements of Loss and Comprehensive Loss ................................................................................ 3
Consolidated Statements of Changes in Equity ................................................................................................. 4-5
Consolidated Statements of Financial Position ..................................................................................................... 6
Consolidated Statements of Cash Flows .............................................................................................................. 7
Notes to Consolidated Financial Statements ................................................................................................... 8-46

Deloitte LLP 925 Grande Allée West Suite 400 Québec QC G1S 4Z4 Canada Tel.: 418-624-3333 Fax. : 418-624-0414 www.deloitte.ca
Independent auditor’s report To the Shareholders of Opsens Inc. We have audited the accompanying consolidated financial statements of Opsens Inc., which comprise the consolidated statements of financial position as at August 31, 2014 and 2013, and the consolidated statements of loss and comprehensive loss, consolidated statements of changes in equity and consolidated statements of cash flows for the years then ended, and a summary of significant accounting policies and other explanatory information. Management's Responsibility for the Consolidated Financial Statements Management is responsible for the preparation and fair presentation of these consolidated financial statements in accordance with International Financial Reporting Standards, and for such internal control as management determines is necessary to enable the preparation of consolidated financial statements that are free from material misstatement, whether due to fraud or error. Auditor's Responsibility Our responsibility is to express an opinion on these consolidated financial statements based on our audits. We conducted our audits in accordance with Canadian generally accepted auditing standards. Those standards require that we comply with ethical requirements and plan and perform the audit to obtain reasonable assurance about whether the consolidated financial statements are free from material misstatement. An audit involves performing procedures to obtain audit evidence about the amounts and disclosures in the consolidated financial statements. The procedures selected depend on the auditor's judgment, including the assessment of the risks of material misstatement of the consolidated financial statements, whether due to fraud or error. In making those risk assessments, the auditor considers internal control relevant to the entity's preparation and fair presentation of the consolidated financial statements in order to design audit procedures that are appropriate in the circumstances, but not for the purpose of expressing an opinion on the effectiveness of the entity's internal control. An audit also includes evaluating the appropriateness of accounting policies used and the reasonableness of accounting estimates made by management, as well as evaluating the overall presentation of the consolidated financial statements.

We believe that the audit evidence we have obtained in our audits is sufficient and appropriate to provide a basis for our audit opinion. Opinion In our opinion, the consolidated financial statements present fairly, in all material respects, the financial position of Opsens Inc. as at August 31, 2014 and 2013, and its financial performance and its cash flows for the years then ended in accordance with International Financial Reporting Standards.
November 24, 2014 1 CPA auditor, CA, public accountancy permit No. A112991

Opsens Inc. Consolidated Statements of Loss and Comprehensive Loss Years ended August 31, 2014 and 2013
2014 2013
$ $
Revenues
Sales 6,649,205 7,526,422
Licensing (note 12) 138,532 -
6,787,737 7,526,422
Cost of sales 4,398,321 4,779,824
Gross margin 2,389,416 2,746,598
Expenses (revenues) (note 25)
Administrative 2,397,909 2,313,634
Marketing 1,130,462 953,716
Research and development 1,743,407 1,762,161
Financial expenses (note 26) 114,410 99,917
Change in fair value of embedded derivative (note 14) 101,940 (17,005)
5,488,128 5,112,423
Net loss and comprehensive loss (3,098,712 ) (2,365,825)
Net loss per share (note 16)
Basic (0.06 ) (0.05)
Diluted (0.06 ) (0.05)
The accompanying notes are an integral part of the consolidated financial statements.
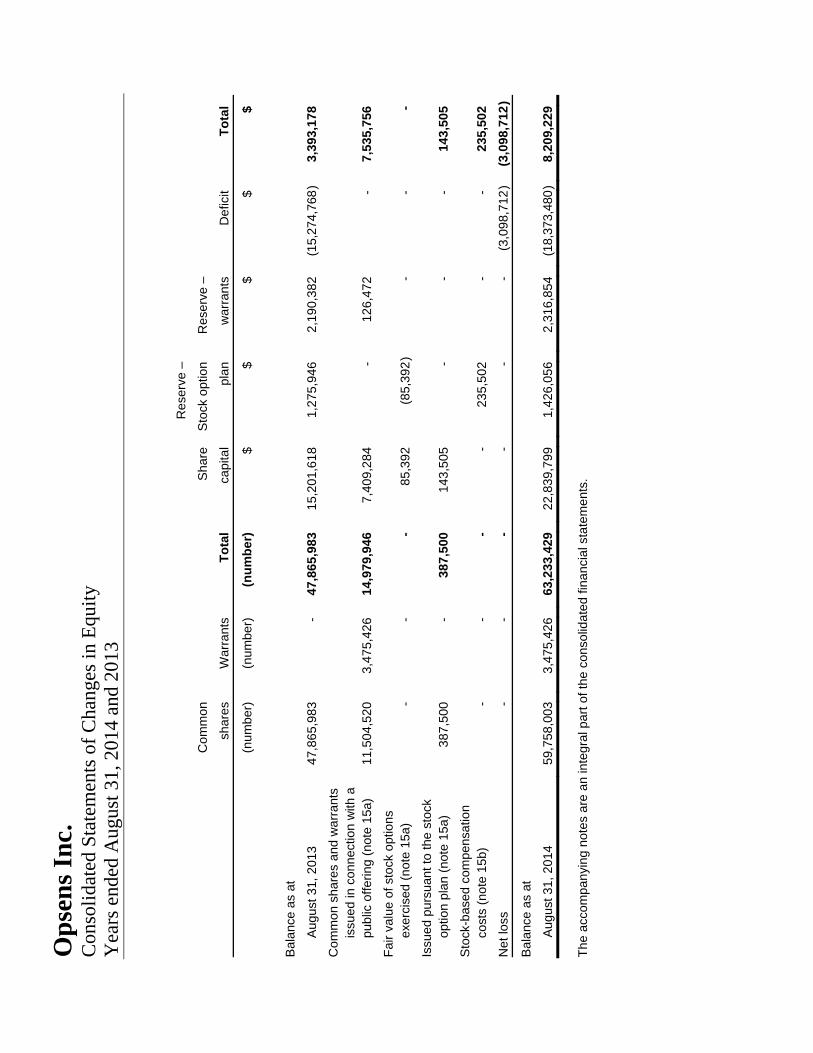
Op
sen
s In
c.
Con
soli
date
d S
tate
men
ts o
f C
hang
es in
Equ
ity
Yea
rs e
nded
Aug
ust 3
1, 2
014
and
2013
R
eser
ve –
C
omm
on
Sha
re
Sto
ck o
ptio
n
Res
erve
–
sh
ares
W
arra
nts
T
ota
l ca
pita
l pl
an
war
rant
s
Def
icit
T
ota
l
(n
umbe
r)
(num
ber)
(n
um
be
r)
$
$
$
$
$
Bal
ance
as
at
A
ugus
t 31,
201
3 47
,865
,983
-
47,8
65,9
83
15,2
01,6
18
1,27
5,94
6
2,19
0,38
2
(15,
274,
768
)3,
393,
178
Com
mon
sha
res
and
war
rant
s
issu
ed in
con
nect
ion
with
a
pu
blic
offe
ring
(not
e 15
a)
11,5
04,5
20
3,47
5,42
6
14,9
79,9
46
7,40
9,28
4
-
126,
472
-
7,53
5,75
6
Fai
r va
lue
of s
tock
opt
ions
exer
cise
d (n
ote
15a)
-
- -
85,3
92
(85,
392
)-
- -
Issu
ed p
ursu
ant t
o th
e st
ock
op
tion
plan
(no
te 1
5a)
387,
500
-
387,
500
14
3,50
5
- -
- 14
3,50
5
Sto
ck-b
ased
com
pens
atio
n
cost
s (n
ote
15b)
-
- -
- 23
5,50
2
- -
235,
502
Net
loss
-
- -
- -
- (3
,098
,712
)(3
,098
,712
)
Bal
ance
as
at
A
ugus
t 31,
201
4 59
,758
,003
3,
475,
426
63
,233
,429
22
,839
,799
1,
426,
056
2,
316,
854
(1
8,37
3,48
0)
8,20
9,22
9
The
acc
ompa
nyin
g no
tes
are
an in
tegr
al p
art o
f the
con
solid
ated
fina
ncia
l sta
tem
ents
.

Op
sen
s In
c.
Con
soli
date
d S
tate
men
ts o
f C
hang
es in
Equ
ity
(con
tinu
ed)
Yea
rs e
nded
Aug
ust 3
1, 2
014
and
2013
R
eser
ve –
C
omm
on
Sha
re
Sto
ck o
ptio
n
Res
erve
–
sh
ares
W
arra
nts
T
ota
l ca
pita
l pl
an
war
rant
s
Def
icit
T
ota
l
(n
umbe
r)
(num
ber)
(n
um
be
r)
$
$
$
$
$
Bal
ance
as
at
A
ugus
t 31,
201
2 47
,865
,983
-
47,8
65,9
83
15,2
01,6
18
1,15
0,42
4
2,19
0,38
2
(12,
908,
943
)5,
633,
481
Sto
ck-b
ased
com
pens
atio
n
co
sts
(not
e 15
b)
- -
- -
125,
522
-
- 12
5,52
2
Net
loss
-
- -
- -
- (2
,365
,825
)(2
,365
,825
)
Bal
ance
as
at
A
ugus
t 31,
201
3 47
,865
,983
-
47,8
65,9
83
15,2
01,6
18
1,27
5,94
6
2,19
0,38
2
(15,
274,
768
)3,
393,
178
The
acc
ompa
nyin
g no
tes
are
an in
tegr
al p
art o
f the
con
solid
ated
fina
ncia
l sta
tem
ents
.
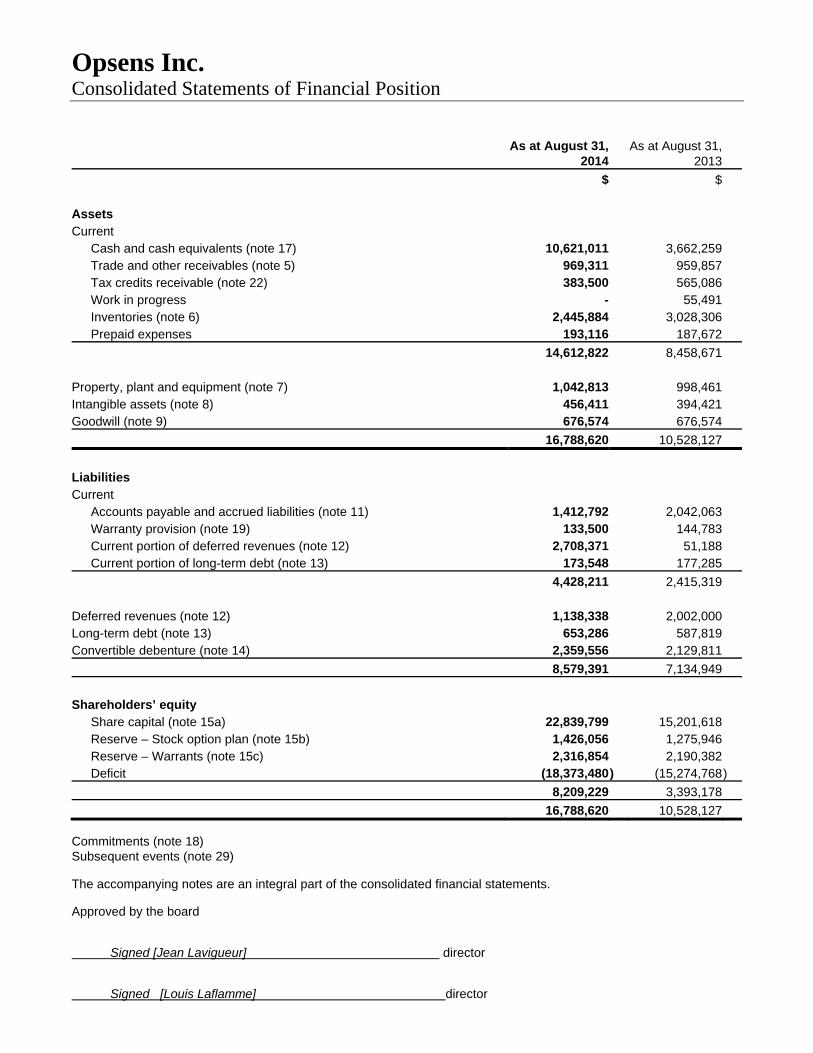
Opsens Inc. Consolidated Statements of Financial Position
As at August 31, 2014
As at August 31, 2013
$ $ Assets Current Cash and cash equivalents (note 17) 10,621,011 3,662,259 Trade and other receivables (note 5) 969,311 959,857 Tax credits receivable (note 22) 383,500 565,086 Work in progress - 55,491 Inventories (note 6) 2,445,884 3,028,306 Prepaid expenses 193,116 187,672
14,612,822 8,458,671 Property, plant and equipment (note 7) 1,042,813 998,461 Intangible assets (note 8) 456,411 394,421 Goodwill (note 9) 676,574 676,574
16,788,620 10,528,127
Liabilities Current Accounts payable and accrued liabilities (note 11) 1,412,792 2,042,063 Warranty provision (note 19) 133,500 144,783 Current portion of deferred revenues (note 12) 2,708,371 51,188 Current portion of long-term debt (note 13) 173,548 177,285
4,428,211 2,415,319 Deferred revenues (note 12) 1,138,338 2,002,000 Long-term debt (note 13) 653,286 587,819 Convertible debenture (note 14) 2,359,556 2,129,811
8,579,391 7,134,949
Shareholders’ equity Share capital (note 15a) 22,839,799 15,201,618 Reserve – Stock option plan (note 15b) 1,426,056 1,275,946 Reserve – Warrants (note 15c) 2,316,854 2,190,382 Deficit (18,373,480 ) (15,274,768)
8,209,229 3,393,178
16,788,620 10,528,127 Commitments (note 18) Subsequent events (note 29) The accompanying notes are an integral part of the consolidated financial statements. Approved by the board Signed [Jean Lavigueur] director Signed [Louis Laflamme] director

Opsens Inc. Consolidated Statements of Cash Flows Years ended August 31, 2014 and 2013
2014 2013
$ $
Operating activities
Net loss (3,098,712 ) (2,365,825)
Adjustments for:
Depreciation of property, plant and equipment 345,561 287,469
Amortization of intangible assets 47,780 31,003
Stock-based compensation costs 235,502 125,522
Change in fair value of embedded derivative 101,940 (17,005)
Interest expense 5,254 90,324
Effect of foreign exchange rate changes on cash and cash equivalents (20,578 ) 91,116
Unrealized foreign exchange gain 71,811 104,105
Government grants on long-term debt (122,730 ) -
Changes in non-cash operating working capital items (note 17) 1,957,568 1,333,996
(476,604 ) (319,295)
Investing activities
Acquisition of property, plant and equipment (389,913 ) (472,788)
Additions to intangible assets (109,770 ) (75,239)
Interest received 96,426 -
(403,257 ) (548,027)
Financing activities
Increase in long-term debt 316,055 265,222
Reimbursement of long-term debt (177,281 ) (191,025)
Proceeds from the issuance of the convertible debenture - 2,002,000
Proceeds from the issuance of shares and warrants (note 15a) 8,648,609 -
Share and warrants issue costs (note 15a) (969,348 ) -
Interest paid - (32,086)
7,818,035 2,044,111
Effect of foreign exchange rate changes on cash
and cash equivalents 20,578 (91,116)
Increase in cash and cash equivalents 6,958,752 1,085,673
Cash and cash equivalents – Beginning of year 3,662,259 2,576,586
Cash and cash equivalents – End of year 10,621,011 3,662,259
The accompanying notes are an integral part of the consolidated financial statements. Additional information on the consolidated statements of cash flows is presented in note 17.

Opsens Inc. Notes to Consolidated Financial Statements Years ended August 31, 2014 and 2013
1. Incorporation and Description of Business Opsens Inc. (“Opsens” or the “Company”) is incorporated under the Business Corporations Act (Quebec). The Company is focusing on two main growth markets, Fractional Flow Reserve (“FFR”) and oil and gas. The Company is also involved in industrial activities. Opsens develops, manufactures, supplies and installs systems for measuring a number of parameters, including pressure and temperature, using fiber optics sensing technologies. These systems are designed around patented technologies that are effective and durable in extreme conditions. The Company’s head office is located at 125-2014, Cyrille-Duquet, Québec, Québec, Canada, G1N 4N6.
2. Summary of Significant Accounting Policies The significant accounting policies used in the preparation of the consolidated financial statements are as follows: Basis of Measurement The consolidated financial statements have been prepared under the historical cost convention, except for the embedded derivative, which is measured at fair value. Basis of Preparation The consolidated financial statements have been prepared in accordance with Part 1 of the CPA Canada Handbook referred to as International Financial Reporting Standards (“IFRS”), as issued by the International Accounting Standards Board (“IASB”). The Company has consistently applied the accounting policies throughout all years presented. The preparation of consolidated financial statements in conformity with IFRS requires the use of certain critical accounting estimates. It also requires management to exercise its judgement in the process of applying the Company's accounting policies. The areas involving a higher degree of judgement or complexity, or areas where assumptions and estimates are significant to the consolidated financial statements are disclosed in note 3. Principles of Consolidation The consolidated financial statements include the accounts of the Company and those of its wholly-owned subsidiary, Opsens Solutions Inc. All intra-group transactions, balances, revenues and expenses are eliminated in full on consolidation until they are realized with a third party. Subsidiaries Subsidiaries are all entities controlled by the Company. The Company controls an entity when it is exposed to, or has rights to variable returns from its involvement with the entity and has the ability to affect those returns through its power over the entity. Subsidiaries are fully consolidated from the date control is obtained and they are no longer consolidated at the date control ceases. Changes in the parent company’s ownership interest in subsidiaries that do not result in a loss of control are accounted for as equity transactions.

Opsens Inc. Notes to Consolidated Financial Statements Years ended August 31, 2014 and 2013
2. Summary of Significant Accounting Policies (continued) Revenue Recognition Opsens Inc. reportable segment revenues related to the sales of products are measured at the fair value of the consideration received or receivable upon shipment of the product and when the risks and rewards of ownership have been transferred to the customer, when there is no continuing managerial involvement to the degree usually associated with ownership nor effective control over the goods sold, when the amount of revenue can be measured reliably and when the recovery of the consideration is probable and the associated costs and possible return of goods can be measured. Opsens Solutions Inc. reportable segment revenues related to the sale of products and sensor installation services are recognized when persuasive evidence of an arrangement exists, on-site installation has occurred, the price to the buyer is fixed or determinable and collection is reasonably assured. For contract revenues earned over a long period, revenues are recorded using the percentage-of-completion method. Therefore, these revenues are recognized proportionately with the degree of completion of the work. The Company uses the efforts expended method to calculate the degree of completion of work based on the number of hours incurred as at the balance sheet date compared to the estimated total number of hours. Work in progress is valued by taking into consideration the number of hours worked and contract costs incurred but not yet invoiced and the payments received. For contracts where billings exceed contract costs incurred to date plus recognized profits less recognized losses, the excess is shown on the consolidated statement of financial position as deferred revenues. Losses are recorded as soon as they become apparent. Reporting Currency and Foreign Currency Transactions The consolidated financial statements are presented in Canadian dollars, which is also the functional currency of the Company, as this is the principal currency of the economic environment in which it operates. Foreign currency transactions are translated into Canadian dollars as follows: monetary assets and liabilities are translated at the exchange rate in effect at the consolidated statements of financial position date, non-monetary assets and liabilities are translated at historical rates, revenues and expenses are translated at the exchange rates in effect at the time of the transaction and exchange gains and losses resulting from translation are reflected in the consolidated statements of loss. Research and Development Costs Research costs are expensed as incurred. Development costs are expensed as incurred except for those which meet generally accepted criteria for deferral, in which case, the costs are capitalized and amortized to operations over the estimated period of benefit. No costs have been deferred during any of the years presented. Research and Development Refundable Tax Credits and Government Assistance Refundable research and development (“R&D”) tax credits and government assistance are accounted for using the cost reduction method. Accordingly, refundable R&D tax credits and government assistance are recorded as a reduction of the related expenses or capital expenditures in the period the expenses are incurred, provided that the Company has reasonable assurance the refundable R&D tax credits or government assistance will be realized.

Opsens Inc. Notes to Consolidated Financial Statements Years ended August 31, 2014 and 2013
2. Summary of Significant Accounting Policies (continued) Equity Share capital represents the value of shares that have been issued. Any transaction costs associated with the issuing of shares are deducted from share capital. From time to time the Company issues units consisting of common shares and common share purchase warrants. The Company estimates the fair value of the common shares based on their market price on the date of the issuance of the units. The residual difference, if any, between the unit price and the fair value of each common share represents the fair value attributable to each warrant. Any transaction costs associated with the issuance of units are apportioned between the common shares and warrants based on their relative fair values. Share-based Payments The Company offers a stock option plan described in note 15, which is determined as an equity-settled plan. The Company uses the fair value-based method to assess the fair value of stock options as at their date of allocation. The fair value is determined using the Black-Scholes option pricing model and is recognized in the consolidated statements of loss as a compensation expense and credited to the stock option plan reserve, using a graded vesting schedule over the vesting period, based on the Company’s estimate of the number of shares that will eventually vest. At the end of each reporting period, the Company revises its estimate of the number of equity instruments expected to vest. The impact of the revision of original estimates, if any, is recognized in the consolidated statements of loss such that the cumulative compensation expense reflects the revised estimate, with a corresponding adjustment to the stock option plan reserve. Any consideration received by the Company upon the exercise of stock options is credited to share capital, and the stock option plan reserve component resulting from stock-based compensation is transferred to share capital upon the issuance of the shares. Cash and Cash Equivalents Cash and cash equivalents include cash and short-term investments redeemable anytime or with a maturity of three months or less beginning on the acquisition date. Inventories Inventories are valued at the lower of cost and net realizable value. Cost is essentially determined using the weighted average cost. The cost of work in progress and finished goods comprises the cost of raw materials, direct labor costs and an allocation of fixed and variable manufacturing overhead, including applicable depreciation of property, plant and equipment based on normal production capability. Net realizable value is the estimated selling price in the ordinary course of business, less the estimated costs of completion and selling expenses. Inventories are written down to net realizable value when the cost of inventories is determined not to be recoverable. When the circumstances that previously caused the inventories to be written down below cost no longer exist or when there is clear evidence of an increase in net realizable value because of changed economic circumstances, the amount of the write-down is reversed. The reversal is limited to the amount of the original write-down. Property, Plant and Equipment Property, plant and equipment are recorded at cost, less accumulated depreciation and accumulated impairment losses, if any. The cost of property, plant and equipment includes the purchase price and the directly attributable costs of acquisition.

Opsens Inc. Notes to Consolidated Financial Statements Years ended August 31, 2014 and 2013
2. Summary of Significant Accounting Policies (continued) Property, Plant and Equipment (continued) Depreciation is recorded using the straight-line method based on estimated useful lives, taking into account any residual value, as follows: Office furniture and equipment 10 yearsProduction equipment 7 yearsAutomotive equipment 7 yearsResearch and development equipment 7 yearsResearch and development computer equipment 3 yearsComputer equipment 3 yearsLeasehold improvements Remaining lease terms between
eight and twenty months Depreciation methods, residual values and useful lives of property, plant and equipment are reviewed annually. Any change is accounted for prospectively as a change in accounting estimates. Intangible Assets Intangible assets with finite useful lives consist of patents and software. They are recorded at cost and amortization is recorded using the straight-line method based on estimated useful lives taking into account any residual values, as follows: Patents Term of underlying patent, 5 to 20 years Software 3 years The Company’s indefinite-life intangible assets consist of trademarks resulting from a business combination and are not amortized. Goodwill Goodwill represents the excess of the purchase price of an acquisition over the fair value of the Company’s share of the identifiable net assets of acquired businesses at the date of acquisition. Goodwill is carried at cost less any accumulated impairment losses. Goodwill is allocated to each Cash Generating Unit (“CGU”) or group of CGUs that is expected to benefit from the related business combination. A CGU is the smallest identifiable group of assets that generates cash inflows that are largely independent of cash inflows from other assets or group of assets. Gains and losses on the disposal of an entity include the carrying amount of goodwill related to the entity sold. Impairment of Non-financial Assets Goodwill and Indefinite-Life Intangible Assets The carrying values of identifiable intangible assets with indefinite life and goodwill are tested annually for impairment. Goodwill and indefinite-life intangible assets are allocated to CGUs for the purpose of impairment testing based on the level at which management monitors it, which is not higher than an operating segment. The allocation is made to those CGUs that are expected to benefit from the business combination in which goodwill arose. The Company has elected to carry its annual impairment test during the last quarter of each year or at any time if an indicator of impairment exist.

Opsens Inc. Notes to Consolidated Financial Statements Years ended August 31, 2014 and 2013
2. Summary of Significant Accounting Policies (continued) Impairment of Non-financial Assets (continued) Non-Financial Assets with Definite Useful Life The carrying values of non-financial assets with definite useful life, such as property, plant and equipment and intangible assets with definite useful life, are assessed for impairment whenever events or changes in circumstances indicate that their carrying amounts may not be recoverable. If any such indication exists, the recoverable amount of the asset must be determined. Such assets are impaired if their recoverable amount is lower than their carrying amount. If it is not possible to estimate the recoverable amount of an individual asset, the recoverable amount of the CGU to which the asset belongs is tested for impairment. Recognition of Impairment Charge The recoverable amount is the higher of an asset’s fair value less costs to sell or its value in use. If the recoverable amount of an asset or CGU is estimated to be less than its carrying amount, the carrying amount of the asset or CGU is reduced to its recoverable amount. The resulting impairment loss is recognized in the consolidated statements of loss. Impairment losses recognized in prior periods are determined at each reporting date for any indications that the loss has decreased or no longer exists. When an impairment loss is subsequently reversed, the carrying amount of the asset or CGU is increased to the revised estimate of its recoverable amount so that the increased carrying amount does not exceed the carrying amount that would have been recorded had no impairment losses been recognized for the asset or CGU in prior years. An impairment loss recognized for goodwill cannot be reversed. Leases Leases are classified as either operating or finance, based on the substance of the transaction at the inception of the lease. The Company leases certain office premises and equipment in which a significant portion of the risks and rewards of ownership are retained by the lessor. These are classified as operating leases. Payments made under these leases (net of any incentives received from the lessor) are charged to the consolidated statements of loss on a straight-line basis over the period of the lease. Finance leases which transfer to the Company substantially all the risks and benefits of ownership of the asset are capitalized at the inception of the lease at the fair value of the leased asset or at the present value of the minimum lease payments. Finance expenses are charged to the consolidated statements of loss over the period of the agreement. Obligations under finance leases are included in financial liabilities net of finance costs allocated to future periods. Capitalized leased assets are depreciated over the shorter of the estimated life of the asset or the lease term. Warranty Provision The Company offers a standard 12-month warranty for surface materials. For downhole materials, the Company guarantees that the downhole materials shall be free from defects but given that the downhole environmental conditions are not exactly known, the Company does not guarantee the performance of the downhole materials once they have entered the wellbore. The estimated cost of the warranty is based on the history of defective products and accessories, the probability that these defects will arise and the costs to repair them. Income Taxes Income tax expenses comprise current and deferred income taxes. Income taxes are recognized in the consolidated statements of loss except to the extent that it relates to items recognized directly in equity, in which case the income taxes are also recognized directly in equity.

Opsens Inc. Notes to Consolidated Financial Statements Years ended August 31, 2014 and 2013
2. Summary of Significant Accounting Policies (continued) Income Taxes (continued) Current Income Taxes The current income tax assets and liabilities for the current and prior periods are measured at the amount expected to be paid to or recovered from the taxation authorities. The income tax rates used to calculate the amount are those that are enacted or substantively enacted at the consolidated statements of financial position date in the tax jurisdiction where the Company and its subsidiary generate taxable income/loss. Deferred Income Taxes The Company provides for deferred income taxes using the liability method. Under this method, deferred income tax assets and liabilities are determined based on deductible or taxable temporary differences between carrying values and tax values of assets and liabilities as well as the carryforward of unused tax losses and deductions, using enacted or substantively enacted income tax rates expected to be in effect for the years in which the assets are expected to be realized or the liabilities settled. Deferred income tax assets are recognized only to the extent that it is probable that taxable profits will be available against which the deductible temporary differences can be utilized. The carrying amount of deferred tax assets is reviewed at each statement of financial position date and reduced to the extent that it is no longer probable that sufficient taxable profits will be available to allow all or part of the asset to be recovered. Deferred tax liabilities are generally recognized for all taxable temporary differences and for taxable temporary differences arising on investments in subsidiaries, except where the reversal of the temporary differences can be controlled and it is probable that the differences will not reverse in the foreseeable future. However, deferred tax is not recognized if it arises from the initial recognition of goodwill or the initial recognition of an asset or liability in a transaction other than a business combination that, at the time of the transaction, affects neither accounting nor taxable profit or loss. Deferred tax assets and liabilities are offset when there is a legally enforceable right to offset current tax assets against current tax liabilities and when the deferred tax assets and liabilities relate to income taxes levied by the same taxation authority on either the same taxable entity or different taxable entities where there is an intention to settle the balances on a net basis. Deferred income tax assets and liabilities are presented as non-current in the consolidated statements of financial position. Loss per Share Basic net loss per share is calculated by dividing the net loss for the year attributable to equity owners of the Company by the weighted-average number of common shares outstanding during the year. Diluted net loss per share is calculated by dividing the net loss for the year attributable to equity owners of the Company adjusted for the interests on the convertible debenture, net of tax, and for the change in fair value of embedded derivative, net of tax, by the weighted-average number of common shares outstanding during the year, plus the effects of dilutive common share equivalents. This method requires that diluted net loss per share be calculated using the treasury stock method, as if all dilutive potential common share equivalents had been exercised at the beginning of the reporting period, or period of issuance, as the case may be, and that the funds obtained thereby be used to purchase common shares of the Company at the fair value of the common shares during the period.

Opsens Inc. Notes to Consolidated Financial Statements Years ended August 31, 2014 and 2013
2. Summary of Significant Accounting Policies (continued) Financial Instruments a) Classification
Financial assets and liabilities are recognized when the Company becomes a party to the contractual provisions of the instrument. Financial assets are derecognized when the rights to receive cash flows from the assets have expired or have been transferred and the Company has transferred substantially all risks and rewards of ownership. Financial assets and liabilities are offset and the net amount reported in the consolidated statements of financial position when there is a legally enforceable right to offset the recognized amounts and there is an intention to settle on a net basis, or realize the assets and settle the liability simultaneously. At initial recognition, the Company classifies its financial instruments in the following categories, depending on the purpose for which the instruments are required:
Loans and receivables: Loans and receivables are non-derivative financial assets with fixed or
determinable payments that are not quoted in an active market. The Company’s loans and receivables are comprised of cash and cash equivalents and trade and other receivables and are included in the current assets due to their short-term nature. Loans and receivables are initially recognized at fair value plus transaction costs. Subsequently, loans and receivables are measured at amortized cost using the effective interest method, which generally corresponds to the nominal amount due to their short-term maturity, less a provision for impairment.
Financial liabilities at amortized cost: Financial liabilities at amortized cost include accounts payable
and accrued liabilities, long-term debt and the debt component of the convertible debenture. They are initially recognized at fair value less transaction costs. Subsequently, they are measured at amortized cost using the effective interest rate method. Financial liabilities are classified as current liabilities if payment is due within twelve months. Otherwise, they are presented as non-current liabilities.
Derivative financial instruments: Derivative financial instruments are comprised of the embedded
derivative representing the conversion option of the convertible debenture. The embedded derivative is measured at fair value at each reporting date. The embedded derivative has been classified as held-for-trading and is included in the consolidated statement of financial position within the convertible debenture. It is classified as non-current based on the contractual terms specific to the instrument. Gains and losses on re-measurement of the embedded derivative are recognized in the consolidated statements of loss.
b) Impairment of financial assets
A financial asset is impaired if objective evidence indicates that a loss event has occurred after the initial recognition of the asset, and that the loss event had a negative effect on the estimated future cash flows of that asset that can be estimated reliably. Objective evidence that financial assets are impaired can include default or delinquency by a debtor and indications that a debtor or issuer will enter bankruptcy.

Opsens Inc. Notes to Consolidated Financial Statements Years ended August 31, 2014 and 2013
2. Summary of Significant Accounting Policies (continued) Financial Instruments (continued)
c) Compound Financial Instrument
The compound financial instrument issued by the Company consists of the convertible debenture that can be converted into common shares of the Company at the option of the holder. Since the debenture is convertible into shares and contains a cash settlement feature, as described in note 14, it is accounted for as a compound instrument with a debt component and a separate embedded derivative representing the conversion option also classified as a liability. Both the debt and embedded derivative components of this compound financial instrument are measured at fair value on initial recognition. The debt component is subsequently accounted for at amortized cost using the effective interest rate method. The embedded derivative is subsequently measured at fair value at each reporting date, with gains and losses in fair value recognized in the consolidated statements of loss.
3. Critical Accounting Estimates, Assumptions and Judgments The preparation of the Company’s consolidated financial statements requires management to make judgments, estimates and assumptions that affect the reported amounts of revenues, expenses, assets and liabilities and the disclosure of contingent liabilities. Uncertainty about these assumptions and estimates could result in a material adjustment to the carrying value of the asset or liability affected. The estimates, assumptions and judgments that have a risk of causing a material adjustment to the carrying amounts of assets and liabilities within the next financial year are addressed below:
Inventories The Company states its inventories at the lower of cost, determined with the weighted average cost basis method, and net realizable value, and provides reserves for excess and obsolete inventories. The Company determines its reserves for excess and obsolete inventories based on the quantities on hand at the reporting dates, compared to foreseeable needs over the next twelve months, taking into account changes in demand, technology or market. Useful Life of Depreciable Assets Management reviews the useful life of depreciable assets at each reporting date. As at August 31, 2014, management assesses that the useful lives represent the expected utility of the assets to the Company. The carrying amounts are presented in notes 7 and 8. Actual results, however, may vary due to technical obsolescence or changes in the market, particularly for computer equipment and software. Impairment of Goodwill The Company performs an annual test for goodwill impairment, or when there is any indication that goodwill has suffered impairment, in accordance with the accounting policy stated in the summary of significant accounting policies of the consolidated financial statements. The recoverable amounts of CGUs have been determined based on fair value less costs to sell calculations using the discounted future cash flows method and the market-based method. These calculations require the use of estimates, such as assumptions and judgments, and determination of CGUs. Information on goodwill is presented in note 9.

Opsens Inc. Notes to Consolidated Financial Statements Years ended August 31, 2014 and 2013
3. Critical Accounting Estimates, Assumptions and Judgments (continued) Government Assistance and Research and Development Tax Credits Government assistance and research and development tax credits are recorded in the consolidated financial statements when there is reasonable assurance that the Company has complied with, and will continue to comply with, all of the conditions necessary to obtain the government assistance and research and development tax credits.
Warranty Provision
The Company estimated warranty provision based on the history of defective products and the probability that these defects will arise, as well as the related costs.
Revenue Recognition
Delivery generally occurs when the product is handed over to a transporter for shipment. At the time of the transaction, the Company assesses whether the price associated with its revenue transaction is fixed or determinable and whether or not collection is reasonably assured. The Company assesses collection based on a number of factors, including past transaction history and the creditworthiness of the customer.
Stock-based Compensation The Company uses judgment in assessing expected life, volatility, risk-free interest rate, as well as the estimated number of options that will ultimately vest.
For all these items, relevant accounting policies are discussed in the other parts of note 2. The estimates and underlying assumptions are reviewed on an ongoing basis. Revisions to accounting estimates are recognized in the period in which the estimates are revised if the revision affects only that period or in the period of the revision and future periods, if the revision affects both the current and future periods.
4. Changes in Accounting Policies
New and amended standards adopted by the Company IAS 1, Financial Statements Presentation In June 2011, the IASB amended IAS 1, Financial Statements Presentation, to change the disclosure of items presented in other comprehensive income (“OCI”), including a requirement to separate items presented in OCI into two groups on whether or not they may be recycled to net income in the future. The amendments were adopted effective September 1st, 2013 in accordance with the transition rules of IAS 1. The Company has concluded that the adoption of IAS 1 did not result in any changes. IFRS 7 (Revised), Financial Instruments: Disclosures In December 2011, the IASB and the Financial Accounting Standards Board (“FASB”) issued common disclosure requirements that are intended to help investors and other users to better assess the effect or potential effect of offsetting arrangements on a company's financial position. The new requirements are set out in Disclosures-Offsetting Financial Assets and Financial Liabilities (Amendments to IFRS 7). The IFRS 7 amendments were adopted retrospectively effective September 1st, 2013. The Company has concluded that the adoption of IFRS 7 did not result in any changes.

Opsens Inc. Notes to Consolidated Financial Statements Years ended August 31, 2014 and 2013
4. Changes in Accounting Policies (continued)
New and amended standards adopted by the Company (continued) IFRS 10, Consolidated Financial Statements IFRS 10, Consolidated Financial Statements, builds on existing principles by identifying the concept of control as the determining factor in whether an entity should be included within the consolidated financial statements of the parent company. The standard provides additional guidance to assist in the determination of control where this is difficult to assess. This standard replaces the Standing Interpretations Committee (“SIC”) 12, Consolidation – Special Purpose Entities and parts of IAS 27, Consolidated and Separate Financial Statements. IFRS 10 was adopted retrospectively effective September 1st, 2013 in accordance with the transition rules of IFRS 10. The Company has concluded that the adoption of IFRS 10 did not result in any changes. IFRS 11, Joint Arrangements IFRS 11, Joint Arrangements, supersedes IAS 31, Interests in Joint Ventures, and requires joint arrangements to be classified either as joint operations or joint ventures, depending on the contractual rights and obligations of each investor that jointly control the arrangement. For joint operations, a company recognizes its share of assets, liabilities, revenues and expenses of the joint operation. An investment in a joint venture is accounted for using the equity method as set out in IAS 28, Investments in Associates and Joint Ventures (amended in 2011). The other amendments to IAS 28 did not affect the Company. IFRS 11 and IAS 28 were adopted retrospectively effective September 1st, 2013 in accordance with the transition rules of IFRS 11 and IAS 28. The Company has concluded that the adoption of IFRS 11 and IAS 28 (amended in 2011) did not result in any changes. IFRS 12, Disclosure of Interests in Other Entities IFRS 12, Disclosure of Interests in Other Entities, is a new and comprehensive standard on disclosure requirements for all forms of interests in other entities, including joint arrangements, associates, special purpose vehicles and other off balance sheet vehicles. IFRS 12 was adopted retrospectively effective September 1st, 2013 in accordance with the transition rules of IFRS 12. The Company assessed its disclosure of interests in other entities and determined that the adoption of IFRS 12 did not result in additional disclosures. IFRS 13, Fair Value Measurement IFRS 13, Fair Value Measurement, provides a single framework for measuring fair value. The measurement of the fair value of an asset or liability is based on assumptions that market participants would use when pricing the asset and liability under current market conditions, including assumptions about risk. IFRS 13 was adopted retrospectively effective September 1st, 2013 in accordance with the transition rules of IFRS 13. Other than additional disclosure which is included in note 26, the adoption of this standard did not require any adjustments to the valuation techniques used by the Company to measure fair value and did not result in any measurement adjustments as at September 1, 2013.

Opsens Inc. Notes to Consolidated Financial Statements Years ended August 31, 2014 and 2013
4. Changes in Accounting Policies (continued)
New and amended standards issued but not yet effective IFRS 9, Financial Instruments This new standard replaces the requirements in IAS 39, Financial Instruments: Recognition and Measurement for classifying and measuring of financial assets and liabilities. IFRS 9 replaces the multiple category and measurement models in IAS 39, Financial Instruments: Recognition and Measurement, for debt instruments with a new mixed measurement model having only two categories: amortized cost and fair value through the statement of income (loss). IFRS 9 also replaces the models for measuring equity instruments. Such instruments are either recognized at fair value through the statement of income (loss) or at fair value through other comprehensive income. Where equity instruments are measured at fair value through other comprehensive income, dividends are recognized in the statement of income (loss) to the extent that they do not clearly represent a return of investment; however, other gains and losses (including impairments) associated with such instruments remain in accumulated comprehensive income indefinitely. Requirements for financial liabilities were added to IFRS 9 and they largely carried forward existing requirements in IAS 39, except that fair value changes due to credit risk for liabilities designated at fair value through profit and loss are generally recorded in other comprehensive income. IFRS 9 is applicable to the Company starting on September 1, 2018, on a retrospective basis. The Company will evaluate in the near term the impact of these future changes. IAS 32, Financial Instruments: Presentation In December 2011, amendments to IAS 32, Financial Instruments: Presentation, were issued to clarify the application of offsetting criteria with regard to offsetting financial assets and financial liabilities. The amendments to IAS 32 will be effective for fiscal years beginning on or after January 1, 2014 with earlier adoption permitted. The Company is currently assessing the impact of adopting these new requirements on the consolidated financial statements. IAS 36, Impairment of Assets IAS 36, Impairment of Assets, has been revised to integrate the amendments issued in May 2013. Those amendments make it possible to better reflect a prior decision to require the recoverable amount of impaired assets to be reported along with other disclosures regarding the measurement of the recoverable amount of impaired assets in cases where said recoverable amount is based on fair value less cost of disposal, including the discount rate, when a discounting technique is used to determine the recoverable amount. Those amendments will be effective for fiscal years beginning on or after January 1, 2014 with earlier adoption permitted. The Company is currently assessing the impact of adopting these new requirements on the consolidated financial statements. IFRIC 21, Levies IFRIC 21, Levies, which is an interpretation of IAS 37, ‘Provisions, Contingent Liabilities and Contingent Assets’, applies to the accounting for levies imposed by governments. IAS 37 sets out criteria for the recognition of a liability, one of which is the requirement for the entity to have a present obligation as a result of a past event (“obligating event”). IFRIC 21 clarifies that the obligating event that gives rise to a liability to pay a levy is the activity described in the relevant legislation that triggers the payment of the levy. IFRIC 21 is effective for annual periods commencing on or after January 1, 2014. The Company is currently evaluating the extent of the impact of adoption of this standard.

Opsens Inc. Notes to Consolidated Financial Statements Years ended August 31, 2014 and 2013
4. Changes in Accounting Policies (continued)
New and amended standards issued but not yet effective (continued) IFRS 15, Revenue from Contracts with Customers In May 2014, the IASB released IFRS 15, Revenue from Contracts with Customers, which establishes principles for reporting the nature, amount, timing and uncertainty of revenue and cash flows arising from an entity’s contracts with customers. It provides a single model in order to depict the transfer of promised goods or services to customers. The core principle of IFRS 15 is that an entity recognizes revenue to depict the transfer of promised goods or services to customers in an amount that reflects the consideration to which an entity expects to be entitled in exchange for those goods and services. IFRS 15 also requires more comprehensive disclosures about the nature, amount, timing and uncertainty of revenue and cash flows arising from an entity’s contracts with customers. IFRS 15 supersedes IAS 11, Construction Contracts, IAS 18, Revenue, and a number of revenue-related interpretations (IFRIC 13, Customer Loyalty Programmes, IFRIC 15, Agreements for the Construction of Real Estate, IFRIC 18, Transfers of Assets from Customers, and SIC-31, Revenue, Barter Transactions Involving Advertising Service). IFRS 15 is effective for annual periods beginning on or after January 1, 2017, with earlier adoption permitted. The Company has not yet assessed the impact of the adoption of this standard on its consolidated financial statements.
5. Trade and other receivables
As of As of August 31, August 31, 2014 2013
$ $ Trade 745,835 836,570 Allowance for doubtful accounts (3,032 ) (21,000) Sales taxes receivable 204,631 40,041 Government assistance receivable 21,877 104,246
Total 969,311 959,857
Allowance for doubtful accounts variation Years ended August 31,
2014 2013
$ $ Balance – Beginning of year (21,000 ) (21,861) Unused amounts reversed during the year 13,954 861 Amounts written off during the year 4,014 -
Balance – End of year (3,032 ) (21,000)

Opsens Inc. Notes to Consolidated Financial Statements Years ended August 31, 2014 and 2013
6. Inventories
As of As of August 31, August 31, 2014 2013
$ $ Raw materials 1,245,914 1,234,566 Finished goods 1,199,970 1,793,740
Total 2,445,884 3,028,306
For the year ended August 31, 2014, $2,257,128 of inventories were expensed in the consolidated statements of loss and comprehensive loss and presented in cost of sales ($2,507,896 for the year ended August 31, 2013).

Op
sen
s In
c.
Not
es to
Con
soli
date
d F
inan
cial
Sta
tem
ents
Y
ears
end
ed A
ugus
t 31,
201
4 an
d 20
13
7.
Pro
pe
rty,
Pla
nt
an
d E
qu
ipm
en
t
Res
earc
h a
nd
dev
elo
pm
ent
Res
earc
h a
nd
eq
uip
me
nt,
d
eve
lop
me
nt
ne
t o
f co
mp
ute
r
Lea
sed
inco
me
tax
eq
uip
men
t,
O
ffic
e
off
ice
cred
its
and
n
et o
f
fu
rnit
ure
fu
rnit
ure
Lea
sed
go
vern
men
t in
com
e ta
x
an
d
and
Pro
du
ctio
nau
tom
oti
veas
sist
ance
of
cred
its
of
Co
mp
ute
rL
ease
ho
ld
eq
uip
men
t eq
uip
men
teq
uip
men
teq
uip
men
t$5
5,30
3
$3,0
78eq
uip
men
tim
pro
vem
ents
To
tal
$
$
$$
$
$$
$$
Co
st
Bal
ance
as
at A
ugus
t 31,
201
3 10
7,43
8
8,32
693
6,28
159
,028
973,
879
37
,564
217,
201
128,
652
2,46
8,36
9
Add
ition
s 44
,609
-
61,6
59-
51,9
51
6,09
37,
575
218,
026
389,
913
Bal
ance
as
at A
ugus
t 31,
201
4 15
2,04
7
8,32
699
7,94
059
,028
1,02
5,83
0
43,6
5722
4,77
634
6,67
82,
858,
282
Acc
um
ula
ted
dep
reci
atio
n
Bal
ance
as
at A
ugus
t 31,
201
3 65
,196
7,
904
280,
243
50,9
7574
2,24
8
32,0
5518
8,07
010
3,21
71,
469,
908
Dep
reci
atio
n 10
,541
42
213
2,25
27,
026
94,7
14
3,87
515
,192
81,5
3934
5,56
1
Bal
ance
as
at A
ugus
t 31,
201
4 75
,737
8,
326
412,
495
58,0
0183
6,96
2
35,9
3020
3,26
218
4,75
61,
815,
469
Net
bo
ok
valu
e
as
at
Au
gu
st 3
1, 2
014
76,3
10
-58
5,44
51,
027
188,
868
7,
727
21,5
1416
1,92
21,
042,
813

Op
sen
s In
c.
Not
es to
Con
soli
date
d F
inan
cial
Sta
tem
ents
Y
ears
end
ed A
ugus
t 31,
201
4 an
d 20
13
7.
Pro
pe
rty,
Pla
nt
an
d E
qu
ipm
en
t (c
on
tin
ue
d)
Res
earc
h an
d
deve
lopm
ent
Res
earc
h an
d
equi
pmen
t,
deve
lopm
ent
net o
f co
mpu
ter
Leas
edin
com
e ta
x eq
uipm
ent,
O
ffice
of
fice
cred
its a
nd
net o
f
fu
rnitu
re
furn
iture
Leas
edgo
vern
men
t in
com
e ta
x
an
d
and
Pro
duct
ion
auto
mot
ive
assi
stan
ce o
f cr
edits
of
Com
pute
rLe
aseh
old
eq
uipm
ent
equi
pmen
teq
uipm
ent
equi
pmen
t$5
5,30
3
$3,0
78eq
uipm
ent
impr
ovem
ents
Tot
al
$
$
$$
$
$$
$$
Co
st
Bal
ance
as
at A
ugus
t 31,
201
2 10
3,40
7
8,32
660
7,24
559
,028
889,
852
30
,979
185,
653
111,
091
1,99
5,58
1
Add
ition
s 4,
031
-
329,
036
-84
,027
6,
585
31,5
4817
,561
472,
788
Bal
ance
as
at A
ugus
t 31,
201
3 10
7,43
8
8,32
693
6,28
159
,028
973,
879
37
,564
217,
201
128,
652
2,46
8,36
9
Acc
um
ula
ted
dep
reci
atio
n
Bal
ance
as
at A
ugus
t 31,
201
2 57
,118
7,
071
165,
456
42,5
4264
7,30
8
29,5
8517
3,07
660
,283
1,18
2,43
9
Dep
reci
atio
n 8,
078
83
311
4,78
78,
433
94,9
40
2,47
014
,994
42,9
3428
7,46
9
Bal
ance
as
at A
ugus
t 31,
201
3 65
,196
7,
904
280,
243
50,9
7574
2,24
8
32,0
5518
8,07
010
3,21
71,
469,
908
Net
bo
ok
valu
e
as
at
Au
gu
st 3
1, 2
013
42,2
42
422
656,
038
8,05
323
1,63
1
5,50
929
,131
25,4
3599
8,46
1

Opsens Inc. Notes to Consolidated Financial Statements Years ended August 31, 2014 and 2013
8. Intangible Assets
Limited lives – Internally
software, developed
net of
Indefinite Limited income tax Limited
lives – lives – credits of lives –
Trademarks Patents $1,518 Patents Total
$ $ $ $ $
Cost
Balance as at August 31, 2013 200 30,000 67,645 491,720 589,565
Additions - - 18,078 91,692 109,770
Balance as at August 31, 2014 200 30,000 85,723 583,412 699,335
Accumulated amortization
Balance as at August 31, 2013 - - 55,223 139,921 195,144
Amortization - 3,174 10,630 33,976 47,780
Balance as at August 31, 2014 - 3,174 65,853 173,897 242,924
Net book value
as at August 31, 2014 200 26,826 19,870 409,515 456,411
Limited lives – Internally
software, developed
net of
Indefinite Limited income tax Limited
lives – lives – credits of lives –
Trademarks Patents $1,518 Patents Total
$ $ $ $ $
Cost
Balance as at August 31, 2012 200 30,000 61,056 423,070 514,326
Additions - - 6,589 68,650 75,239
Balance as at August 31, 2013 200 30,000 67,645 491,720 589,565
Accumulated amortization
Balance as at August 31, 2012 - - 49,439 114,702 164,141
Amortization - - 5,784 25,219 31,003
Balance as at August 31, 2013 - - 55,223 139,921 195,144
Net book value
as at August 31, 2013 200 30,000 12,422 351,799 394,421
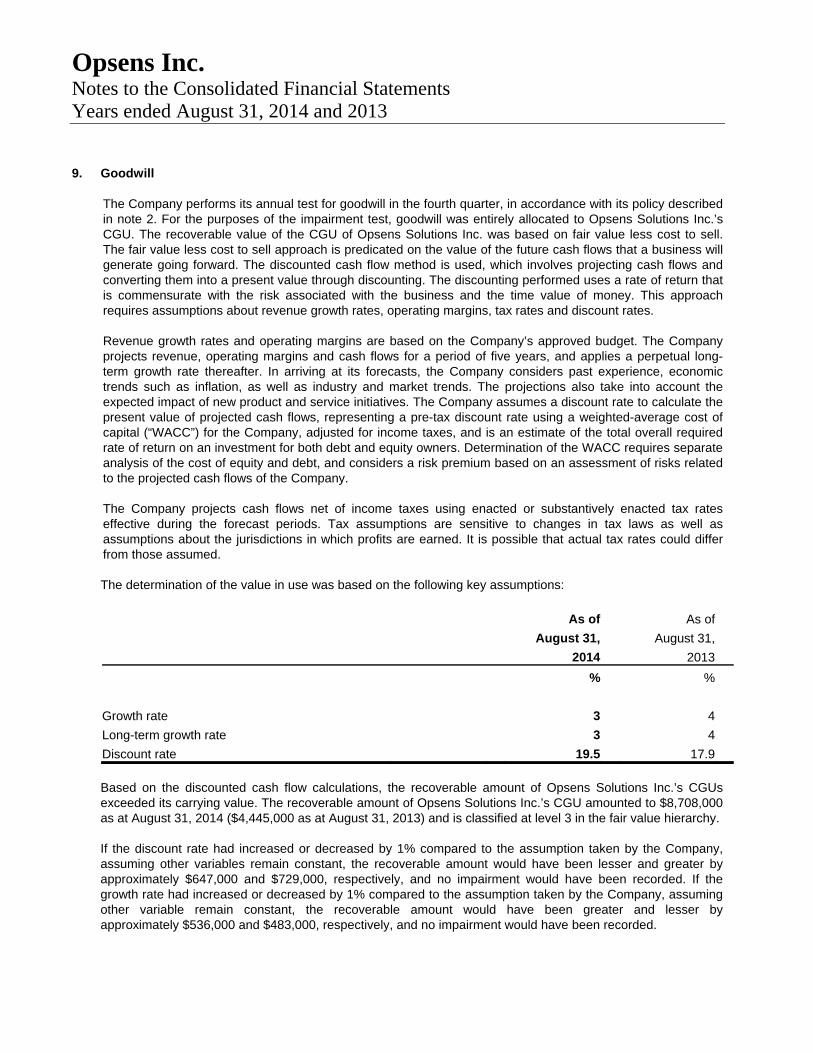
Opsens Inc. Notes to the Consolidated Financial Statements Years ended August 31, 2014 and 2013
9. Goodwill The Company performs its annual test for goodwill in the fourth quarter, in accordance with its policy described in note 2. For the purposes of the impairment test, goodwill was entirely allocated to Opsens Solutions Inc.’s CGU. The recoverable value of the CGU of Opsens Solutions Inc. was based on fair value less cost to sell. The fair value less cost to sell approach is predicated on the value of the future cash flows that a business will generate going forward. The discounted cash flow method is used, which involves projecting cash flows and converting them into a present value through discounting. The discounting performed uses a rate of return that is commensurate with the risk associated with the business and the time value of money. This approach requires assumptions about revenue growth rates, operating margins, tax rates and discount rates.
Revenue growth rates and operating margins are based on the Company’s approved budget. The Company projects revenue, operating margins and cash flows for a period of five years, and applies a perpetual long-term growth rate thereafter. In arriving at its forecasts, the Company considers past experience, economic trends such as inflation, as well as industry and market trends. The projections also take into account the expected impact of new product and service initiatives. The Company assumes a discount rate to calculate the present value of projected cash flows, representing a pre-tax discount rate using a weighted-average cost of capital (“WACC”) for the Company, adjusted for income taxes, and is an estimate of the total overall required rate of return on an investment for both debt and equity owners. Determination of the WACC requires separate analysis of the cost of equity and debt, and considers a risk premium based on an assessment of risks related to the projected cash flows of the Company.
The Company projects cash flows net of income taxes using enacted or substantively enacted tax rates effective during the forecast periods. Tax assumptions are sensitive to changes in tax laws as well as assumptions about the jurisdictions in which profits are earned. It is possible that actual tax rates could differ from those assumed.
The determination of the value in use was based on the following key assumptions:
As of As of
August 31, August 31,
2014 2013
% %
Growth rate 3 4
Long-term growth rate 3 4
Discount rate 19.5 17.9
Based on the discounted cash flow calculations, the recoverable amount of Opsens Solutions Inc.’s CGUs exceeded its carrying value. The recoverable amount of Opsens Solutions Inc.’s CGU amounted to $8,708,000 as at August 31, 2014 ($4,445,000 as at August 31, 2013) and is classified at level 3 in the fair value hierarchy. If the discount rate had increased or decreased by 1% compared to the assumption taken by the Company, assuming other variables remain constant, the recoverable amount would have been lesser and greater by approximately $647,000 and $729,000, respectively, and no impairment would have been recorded. If the growth rate had increased or decreased by 1% compared to the assumption taken by the Company, assuming other variable remain constant, the recoverable amount would have been greater and lesser by approximately $536,000 and $483,000, respectively, and no impairment would have been recorded.

Opsens Inc. Notes to the Consolidated Financial Statements Years ended August 31, 2014 and 2013
10. Authorized Line of Credit The Company has an authorized line of credit for a maximum amount of $200,000, $50,000 of which is available at all times and does not take into consideration the margining. When using the line of credit in an amount varying from $50,000 and $100,000, the available credit is limited to an amount that is equal to 75% of Canadian accounts receivable and 65% of foreign accounts receivable plus 50% of inventories of raw materials and finished goods. If the amount used exceeds $100,000, the credit available is limited to an amount equal to 75% of Canadian accounts receivable and 90% of insured foreign accounts receivable plus 50% of inventories of raw materials and finished goods. This line of credit bears interest at the financial institution’s prime rate plus 2% and is repayable on a weekly basis by $5,000 tranches. It is secured by a first-rank movable hypothec for an amount of $750,000 on the universality of receivables and inventories. The credit line was not used as at August 31, 2014 and 2013. The Company also has credit cards for a maximum of $85,000 to finance its current operations. The balance used on these credit cards bears interest at the financial institution’s prime rate plus 7%.
11. Accounts payable and accrued liabilities
As of As of
August 31, August 31,
2014 2013
$ $
Suppliers 448,280 982,136
Salaries, employee benefits and others 396,327 375,681
Other liabilities 568,185 684,246
Total 1,412,792 2,042,063
12. Deferred Revenues a) Distribution and Other Rights Agreement On November 19, 2012, the Company announced the granting of distribution and other rights for OptoWire and OptoMonitor, Opsens’ products for measuring FFR. Under the terms of the agreement, the Company received: US$3 million for the distribution rights for its FFR products for Japan, Korea and Taiwan, which includes:
a. US$2 million at signing (“upfront license fee”);
b. US$1 million once Opsens gets regulatory approval for its FFR devices in Japan (“milestone
payment”);
US$2 million in convertible debenture, at signing, as described in note 14 of these consolidated financial statements.
Opsens Inc. Notes to the Consolidated Financial Statements Years ended August 31, 2014 and 2013
12. Deferred Revenues (continued) a) Distribution and Other Rights Agreement (continued)
The Company shall reimburse the upfront license fee upon the occurrence of any of the following events:
a. The Company fails to obtain regulatory approval for the OptoWire and the OptoMonitor within five
years of the agreement date for all the following geographic regions: Canada, European Union and the United States;
b. The Company abandons the development of the OptoWire and OptoMonitor before obtaining the
milestone payment; c. The Company materially breaches any terms of the agreement or is subject to bankruptcy.
Because the Company doesn’t have regulatory approvals, it has recorded the $2,002,000 (US$2,000,000) upfront license fee as deferred revenues. The Company received regulatory approval for the OptoWire and the OptoMonitor in Europe on November 19, 2014 (note 29). Consequently, the deferred revenues have been recorded in the short-term liabilities section of the consolidated statements of financial position.
b) Licensing Agreement
On April 15, 2014, the Company announced it had entered into an agreement with Abiomed, Inc. (“Abiomed”) in connection with its miniature optical pressure sensor technology for applications in circulatory assist devices. The Company has granted Abiomed an exclusive worldwide license to integrate its miniature pressure sensor in connection with Abiomed’s circulatory assist devices. Under the agreement, Abiomed will pay Opsens an aggregate amount of US$6,000,000. US$1,500,000 has been paid on closing, while the balance will be disbursed based on the achievement of certain milestones. The Company will apply the principles of IAS 18, Revenue, to record revenues arising from the agreement with Abiomed. Therefore, the amount of $1,647,000 (US$1,500,000) paid on closing will be recognized over the term of the agreement. Revenues from milestone payments will be limited to costs incurred as long as the milestones are not achieved. Upon the achievement of a milestone, the unrecognized portion of the milestone will be recorded as revenues. During the year ended August 31, 2014, an amount of $138,532 related to the Abiomed agreement has been recognized as licensing revenues in the consolidated statements of loss and comprehensive loss.
c) Other Deferred Revenues
Deferred revenues also comprise contracts where billings exceed contract costs incurred to date plus recognized profits less recognized losses or when the Company receives payments in advance of meeting the revenue recognition criteria.

Opsens Inc. Notes to the Consolidated Financial Statements Years ended August 31, 2014 and 2013
13. Long-term Debt
As of As of August 31, August 31, 2014 2013
$ $
Desjardins Loan, bearing interest at prime rate plus 2.4%, payable in monthly instalments of $10,905 and a final payment of $9,286, maturing in February 2016 194,667 325,524
Contributions repayable to Ministère des Finances et de l’Économie (MFE), without interest (effective rate of 9%), repayable in five equal and consecutive annual instalments of $82,718, maturing in February 2020
Debt balance 413,590 249,377
Imputed interest (108,942 ) (74,863)
304,648 174,514
Term loans, bearing interest at rates varying from 5.69% to 6.79%, payable in monthly instalments of $3,161, including interest, maturing from October to December 2017 110,989 140,718
Contributions repayable to Canada Economic Development, without
interest (effective rate of 13.5%), repayable in twenty equal and consecutive quarterly instalments of $15,000, maturing in August 2020
Debt balance 300,000 148,158 Imputed interest (107,259 ) (64,293)
192,741 83,865
Capital lease, bearing interest at 7.25%, payable in monthly instalments
of $1,029, including interest, and a final payment of $1,029, maturing in September 2016 23,789 34,011
Capital lease, bearing interest at 9.7%, payable in monthly instalments
of $837, including interest, and a final payment of $837, maturedin April 2014 - 6,472
826,834 765,104 Current portion 173,548 177,285
653,286 587,819

Opsens Inc. Notes to the Consolidated Financial Statements Years ended August 31, 2014 and 2013
13. Long-term Debt (continued) Principal payments required over the next five years are as follows:
Debt and
principal portion
Other of capital
Obligations – Capital lease debts lease
Total Imputed Principal
payments interest payments
$ $ $ $ $
2015 12,350 1,362 10,988 162,560 173,548
2016 12,350 535 11,815 219,168 230,983
2017 992 6 986 145,784 146,770
2018 - - - 108,569 108,569
2019 - - - 89,553 89,553
Under the terms and conditions of the agreement on long-term debt with its financial institution, the Company is subject to certain covenants with respect to maintaining minimum financial ratios. As at August 31, 2014 and 2013, these financial ratios were met by the Company.
14. Convertible Debenture
As of As of
August 31, August 31,
2014 2013
$ $
Debt component reported as long-term liability (US$2,040,906; US$1,990,316 as at August 31, 2013) 2,219,077 2,095,799
Embedded derivative reported as long-term liability (US$129,200; US$32,300 as at August 31, 2013) 140,479 34,012
Total 2,359,556 2,129,811
On November 19, 2012, the Company issued a US$2,000,000 ($2,002,000) subordinated secured convertible debenture maturing November 19, 2017. The convertible debenture bears interest at a rate of 2.0% per annum, payable at maturity. At the holder’s option, the convertible debenture may be converted into common shares of the Company at any time up to the maturity date, at a conversion price representing the market price of the shares. However, the conversion price is subject to a minimum of $0.50 and a maximum of $0.75 per common share (the “conversion price”). The convertible debenture is also convertible at the Company’s option at the conversion price if the volume-weighted average closing price per common share for the twenty trading days immediately preceding the fifth trading day before such conversion date is at least $1.20 and if a minimum of 50,000 common shares have traded on the TSX Venture Exchange during each of the twenty trading days taken into account in the calculation of the conversion price.

Opsens Inc. Notes to the Consolidated Financial Statements Years ended August 31, 2014 and 2013
14. Convertible Debenture (continued) To secure the repayment of the convertible debenture, a movable hypothec on certain equipment has been given. As at August 31, 2014, the net book value of property, plant and equipment pledged as collateral was $32,800 ($66,000 as at August 31, 2013). This hypothec will rank second to certain long-term loans of the Company. As noted above, the convertible debenture contains a conversion option that will result in an obligation to deliver a fixed amount of equity in exchange of a variable amount of convertible debenture when translated in the functional currency of the Company. Consequently, under IAS 32, “Financial Instruments: Presentation”, the convertible debenture is accounted for as a compound instrument with a debt component and a separate embedded derivative representing the conversion option. Both the debt and embedded derivative components of this compound financial instrument are measured at fair value on initial recognition. The debt component is subsequently accounted for at amortized cost using the effective interest rate method. The embedded derivative is subsequently measured at fair value at each reporting date, with gains and losses in fair value recognized through profit or loss. Expenses (revenues) associated with the debenture consist of:
Years ended August 31,
2014 2013
$ $
Interest expense 44,119 33,069
Accreted interest 10,408 7,639
Change in fair value of embedded derivative 101,940 (17,005)
Total 156,467 23,703
As at August 31, 2014, the debt component of the convertible debenture has a fair value of $1,505,300 ($1,338,000 as at August 31, 2013).
15. Share Capital, Stock-Options and Warrants a) Share capital
The Company has authorized an unlimited number of common shares (being voting and participating shares) with no par value. On February 18, 2014, the Company completed a public offering for aggregate gross proceeds of $8,505,104. In connection with the offering, the Company issued a total of 5,340,220 units at a price of $0.75 per unit and 6,164,300 common shares at a price of $0.73 per common share. Each unit consists of one common share in the capital stock of Opsens and one-half of one common share purchase warrant, with each whole common share purchase warrant entitling the holder thereof to purchase one common share at a price of $1.05 until February 18, 2016. The value of one-half of one common share purchase warrant was established at $0.02, being the difference between the issuing price of $0.75 per unit and of $0.73 per common share. Expenses of the offering include 7% underwriting fees of $595,357 and other professional fees and miscellaneous fees of $373,991 for total fees of $969,348.

Opsens Inc. Notes to the Consolidated Financial Statements Years ended August 31, 2014 and 2013
15. Share Capital, Stock-Options and Warrants (continued) a) Share capital (continued)
The Company also issued 805,316 broker warrants as additional compensation, each warrant entitling the holder to purchase one common share at a price of $0.73 until February 18, 2016. The total fees of $969,348 and the broker warrants value of $32,213 have been allocated on a prorata basis between share capital and the warrants reserve, $989,015 and $12,546 respectively, based on the ratio established by their respective values as described above. During the year ended August 31, 2014, following the exercise of stock options, the Company issued 387,500 common shares for a cash consideration of $143,505. The fair value of the stock options exercised was $85,392.
b) Stock options
The Shareholders approved the stock option plan on January 20, 2014 because, according to the policies of the TSX Venture Exchange, the stock option plan must be approved by the Company’s shareholders every year. The number of common shares reserved by the Board of Directors for options granted under the plan shall not exceed 10% of the issued and outstanding common shares of the Company. The plan is available to the Company’s directors, consultants, officers and employees. The stock option plan stipulates that the terms of the options and the option price shall be fixed by the directors subject to the price restrictions and other requirements imposed by the TSX Venture Exchange. The exercise period cannot exceed five years, beginning on the grant date. These options generally vest over a four-year period, except for 830,000 outstanding stock options granted (580,000 stock options granted as at August 31, 2013), which were completely vested at grant date. The exercise price of the options is the closing price of the shares of the Company on the TSX Venture on the trading day immediately preceding the date of grant. The compensation expense in regards to the stock option plan for the year ended August 31, 2014 is $235,502 ($125,522 for the year ended August 31, 2013). The fair value of options granted in 2014 was determined using the Black-Scholes option pricing model with the following assumptions:
Years ended August 31,
2014 2013
Risk-free interest rate Between 1.05% and 1.52% Between 1.20% and 1.72%
Volatility Between 110% and 139% Between 89% and 134%
Dividend yield on shares Nil Nil
Expected life 5 years 5 years
Weighted share price $0.71 $0.24
Weighted fair value per option at the grant date $0.33 $0.15 In addition, option valuation models require the input of highly-subjective assumptions, including the expected stock price volatility. Any changes in the subjective input assumptions can affect the fair value estimate. The expected volatility is based on the historical volatility of the underlying share price for a period equivalent to the expected life of the options.

Opsens Inc. Notes to the Consolidated Financial Statements Years ended August 31, 2014 and 2013
15. Share Capital, Stock-Options and Warrants (continued) b) Stock options (continued)
The situation of the outstanding stock option plan and the changes that took place between August 31, 2012 and August 31, 2014 are as follows:
Weighted- average Number of exercise options price
$ Outstanding as at August 31, 2012 3,419,000 0.39 Options granted 1,483,667 0.24 Options forfeited (715,000 ) 0.77 Options cancelled (46,000 ) 0.22
Outstanding as at August 31, 2013 4,141,667 0.27 Options granted 985,000 0.71 Options exercised (387,500 ) 0.37 Options forfeited (60,000 ) 0.40 Options cancelled (506,667 ) 0.32
Outstanding as at August 31, 2014 4,172,500 0.36
Options exercisable as at August 31, 2014 1,862,813 0.32
The table below provides information on the outstanding stock options as at August 31, 2014:
Weighted-average Number of outstanding stock Number of exercisable stock remaining contractual life
Exercise price options options (years)
$ 0.20 747,000 411,000 2.850.21 250,000 62,500 3.360.23 795,000 447,500 2.210.24 80,000 80,000 3.240.25 923,500 230,875 3.390.35 74,250 65,688 1.840.36 57,750 57,750 0.840.38 250,000 237,500 1.080.44 100,000 100,000 4.130.66 200,000 - 4.930.75 545,000 100,000 4.660.85 140,000 60,000 4.241.15 10,000 10,000 0.21
4,172,500 1,862,813 3.14

Opsens Inc. Notes to the Consolidated Financial Statements Years ended August 31, 2014 and 2013
15. Share Capital, Stock-Options and Warrants (continued) c) Warrants
The situation of the outstanding warrants and the changes that took place between August 31, 2012 and August 31, 2014 are as follows:
Weighted-
average
Number of exercise
warrants price
$
Outstanding as at August 31, 2012 2,443,049 1.11
Expired (2,443,049 ) 1.11
Outstanding as at August 31, 2013 - -
Issued with units (note 15a) 2,670,110 1.05
Issued to brokers (note 15a) 805,316 0.73
Outstanding as at August 31, 2014 3,475,426 0.98
Warrants exercisable as at August 31, 2014 3,475,426 0.98
16. Net Loss per Share
The table below presents a reconciliation between the basic net loss and the diluted net loss per share:
Years ended August 31,
2014 2013
$ $
Net loss attributable to shareholders
Basic and diluted (3,098,712 ) (2,365,825)
Number of shares
Basic and diluted weighted-average number of shares outstanding 54,177,457 47,865,983
Amount per share
Net loss per share
Basic (0.06 ) (0.05)
Diluted (0.06 ) (0.05)

Opsens Inc. Notes to the Consolidated Financial Statements Years ended August 31, 2014 and 2013
16. Net Loss per Share (continued)
Stock options and warrants are excluded from the calculation of the diluted weighted-average number of shares outstanding when their exercise price is greater than the average market price of common shares. The number of such stock options and warrants is presented below:
Years ended August 31,
2014 2013
Stock options 695,000 1,025,000 Warrants 3,475,426 - For the years ended August 31, 2014 and 2013, the diluted amount per share was the same amount as the basic amount per share, since the dilutive effect of the stock options, warrants and convertible debenture was not included in the calculation; otherwise, the effect would have been antidilutive. Accordingly, the diluted amount per share for these years was calculated using the basic weighted average number of shares outstanding.
17. Additional Information on the Statements of Cash Flows
Years ended August 31, 2014 2013
$ $ Changes in non-cash operating working capital items Trade and other receivables (9,454 ) (58,546) Tax credits receivable 181,586 (265,691) Work in progress 55,491 (55,491) Inventories 582,422 (1,049,233) Prepaid expenses (5,444 ) (48,899) Accounts payable and accrued liabilities (629,271 ) 698,158 Warranty provision (11,283 ) 60,510 Deferred revenues 1,793,521 2,053,188
1,957,568 1,333,996
As of As of August 31, August 31, 2014 2013
$ $ Cash and cash equivalents Cash 785,907 687,881 Short-term investments 9,835,104 2,974,378
10,621,011 3,662,259

Opsens Inc. Notes to the Consolidated Financial Statements Years ended August 31, 2014 and 2013
18. Commitments
Leases The Company leases offices in Québec under operating leases expiring on April 30, 2016. These agreements are renewable for an additional five-year period. Future rent, without considering the escalation clause, will amount to $461,700. The Company leases offices in Alberta under an operating lease expiring on April 30, 2015. This agreement is renewable for an additional five-year period. Future rent, without considering the escalation clause, will amount to $88,200. Opsens Solutions Inc. rents a vehicle under an operating lease expiring in July 2015. Future rent payments will amount to $9,200. Future payments for the leases and other commitments, totalling $559,100, required in each of the forthcoming years are as follows:
$ 2015 370,900 2016 188,200
In 2014, the offices lease expense is $337,696 ($294,626 in 2013).
19. Contractual Guarantees During the normal course of business, the Company replaces defective parts under warranties offered at the sale of the products. The term of the warranties is generally 12 months. During the year ended August 31, 2014, the Company reversed an amount of $2,783 (provisions of $158,470 recognized for the year ended August 31, 2013) for guarantees. A provision of $133,500 is recorded for guarantees as of August 31, 2014 ($144,783 as at August 31, 2013). The following table summarizes changes in warranty provision:
Years ended August 31,
2014 2013
$ $
Balance – Beginning of year 144,783 84,273
Provisions recognized (reversed) (2,783 ) 158,470
Amounts used during the year (8,500 ) (97,960)
Balance – End of year 133,500 144,783
This provision estimate is based on past experience. The actual costs that the Company may incur, as well as the moment when the parts should be replaced, can differ from the estimated amount.

Opsens Inc. Notes to the Consolidated Financial Statements Years ended August 31, 2014 and 2013
20. Government Assistance Under an agreement entered into with Canada Economic Development (CED), the Company may receive a refundable contribution of a maximum amount of $300,000, non-interest bearing, to cover expenses related to the development of its OptoWire product for the Fractional Flow Reserve market. This contribution is paid out based on the project’s percentage of completion at the rate of 40% of eligible expenses since February 1, 2013. During the year ended August 31, 2014, the Company recognized for this refundable contribution an amount of $56,112 ($57,554 for the year ended August 31, 2013) against research and development expenses. Under an agreement reached with the National Research Council Canada with respect to the Industrial Research Assistance Program (IRAP), the Company may receive a non-refundable contribution for a maximum amount of $349,500 to cover some of its incurred costs to develop a new product. During the year ended August 31, 2014, the Company recorded contributions totalling $140,094 ($183,486 for the year ended August 31, 2013) which were accounted for against research and development expenses. Under an agreement reached with the Ministère des Finances et de l’Économie, the Company was granted a refundable contribution of $413,590, non-interest bearing, to cover some of its incurred costs to carry out development of the OptoWire for Fractional Flow Reserve. For the year ended August 31, 2014, the Company recorded for this refundable contribution an amount of $59,437 ($78,717 for the year ended August 31, 2013) against research and development expenses.
21. Income Taxes The reconciliation of the income tax provision calculated using the combined Canadian federal and provincial statutory income tax rate with the income tax provision in the financial statements is as follows:
Years ended August 31,
2014 2013
$ $
Income tax payable using the combined federal and provincial
statutory tax rate (26.9%; 26.9% in 2013) (833,553 ) (637,820)
Non-deductible expenses 657,611 444,611
Deductible financing fees (76,610 ) (28,995)
Taxable income 221,501 269,269
Non-taxable income tax credits (154,519 ) (86,953)
Losses carried forward 185,570 39,888
Income tax using effective income tax rate - -

Opsens Inc. Notes to the Consolidated Financial Statements Years ended August 31, 2014 and 2013
21. Income Taxes (continued) As at August 31, 2014, the Company has tax losses of approximately $9,098,400 for federal purposes and $8,820,400 for provincial purposes that can be used to reduce future taxable income. These losses expire as follows:
Federal Provincial
$ $
2024 515,000 463,000
2025 42,000 40,000
2026 400 400
2027 1,552,000 1,509,000
2028 716,000 692,000
2029 1,404,000 1,214,000
2030 500,000 500,000
2031 2,123,000 2,146,000
2032 1,285,000 1,280,000
2033 237,000 239,000
2034 724,000 737,000
9,098,400 8,820,400
The Company also has undeducted research and development expenses of $6,035,000 ($4,825,000 as at August 31, 2013) for federal purposes and $8,699,000 ($7,266,000 as at August 31, 2013) for provincial purposes that are deferred over an undetermined period. Deferred income tax assets related to unclaimed tax losses, financing costs and research and development expenses as well as non-refundable scientific research tax credits adding up to approximately $6,523,000 ($5,488,000 as at August 31, 2013) were entirely provisioned due to the uncertainty concerning the Company’s ability to generate taxable income. In addition, deferred tax liabilities of approximately $364,700 ($391,400 as at August 31, 2013) related to federal investment tax credits on property, plant and equipment were recognized and offset by a deferred income tax asset.
22. Tax Credits for Scientific Research and Experimental Development For tax purposes, research and development expenses are detailed as follows:
Years ended August 31,
2014 2013
$ $
Federal 1,690,790 1,122,674
Provincial 1,690,790 1,122,674

Opsens Inc. Notes to the Consolidated Financial Statements Years ended August 31, 2014 and 2013
22. Tax Credits for Scientific Research and Experimental Development (continued) These expenses have enabled the Company to become eligible for scientific research and experimental development tax credits reimbursable for the following amounts:
Years ended August 31,
2014 2013
$ $
Federal - -
Provincial 383,500 265,691
383,500 265,691
These credits were recorded in research and development expenses in the consolidated statements of loss and comprehensive loss. Reimbursable scientific research and experimental development income tax credits earned for the year ended August 31, 2014 and 2013 have not yet been reviewed by the taxation authorities, and the amounts granted could differ from those that have been recorded. Over the years, the Company qualified for federal income tax credits for scientific research and experimental development, which were non-refundable and could be used against Part I Company tax. The accumulated credits for the year ended August 31, 2014 are about $1,970,255 ($1,607,749 as at August 31, 2013) and expire over a period of 10 to 20 years beginning in 2014.
23. Segmented Information Sector’s Information The Company’s reportable segments are strategic business units managed separately as one is focused on developing, producing, and supplying fiber optic sensors (Opsens Inc.) and the other (Opsens Solutions Inc.) is specialized in the commercialization and the installation of optical and conventional sensors for the oil and gas industry.
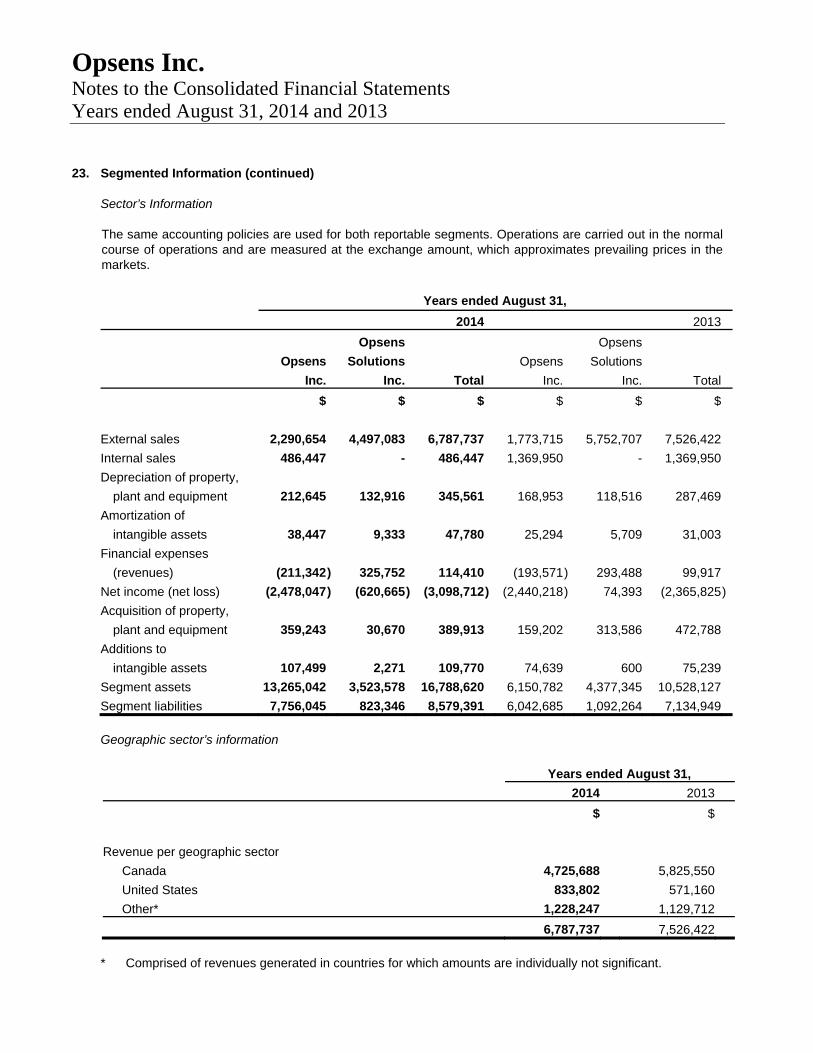
Opsens Inc. Notes to the Consolidated Financial Statements Years ended August 31, 2014 and 2013
23. Segmented Information (continued) Sector’s Information The same accounting policies are used for both reportable segments. Operations are carried out in the normal course of operations and are measured at the exchange amount, which approximates prevailing prices in the markets.
Years ended August 31,
2014 2013
Opsens Opsens
Opsens Solutions Opsens Solutions
Inc. Inc. Total Inc. Inc. Total
$ $ $ $ $ $
External sales 2,290,654 4,497,083 6,787,737 1,773,715 5,752,707 7,526,422
Internal sales 486,447 - 486,447 1,369,950 - 1,369,950
Depreciation of property,
plant and equipment 212,645 132,916 345,561 168,953 118,516 287,469
Amortization of
intangible assets 38,447 9,333 47,780 25,294 5,709 31,003
Financial expenses
(revenues) (211,342 ) 325,752 114,410 (193,571) 293,488 99,917
Net income (net loss) (2,478,047 ) (620,665) (3,098,712) (2,440,218) 74,393 (2,365,825)
Acquisition of property,
plant and equipment 359,243 30,670 389,913 159,202 313,586 472,788
Additions to
intangible assets 107,499 2,271 109,770 74,639 600 75,239
Segment assets 13,265,042 3,523,578 16,788,620 6,150,782 4,377,345 10,528,127
Segment liabilities 7,756,045 823,346 8,579,391 6,042,685 1,092,264 7,134,949
Geographic sector’s information
Years ended August 31,
2014 2013
$ $
Revenue per geographic sector
Canada 4,725,688 5,825,550
United States 833,802 571,160
Other* 1,228,247 1,129,712
6,787,737 7,526,422
* Comprised of revenues generated in countries for which amounts are individually not significant.

Opsens Inc. Notes to the Consolidated Financial Statements Years ended August 31, 2014 and 2013
23. Segmented Information (continued) Geographic sector’s information Revenues are attributed to the geographic sector based on the clients’ location. Capital assets, which include property, plant and equipment and intangible assets, are all located in Canada. During the year ended August 31, 2014, revenues from three clients represented individually more than 10% of the total revenues of the Company, i.e. approximately 33% (Opsens Solutions Inc.’s reportable segment), 15% (Opsens Solutions Inc.’s reportable segment) and 11% (Opsens Solutions Inc.’s reportable segment). During the year ended August 31, 2013, revenues from three clients represented individually more than 10% of the total revenues of the Company, i.e. approximately 49% (Opsens Solutions Inc.’s reportable segment), 12% (Opsens Solutions Inc.’s reportable segment) and 10% (Opsens Solutions Inc.’s reportable segment).
24. Related-party Transactions In the normal course of its operations, the Company has entered into transactions with related parties.
Years ended August 31,
2014 2013
$ $
Professional fees paid to a company
controlled by a director 10,035 34,216
10,035 34,216
Fees are incurred for the Company’s Fractional Flow Reserve (FFR) activities. Key management personnel, having authority and responsibility for planning, directing and controlling the activities of the Company, comprise the Chief Executive Officer, the Chief Financial Officer, the President of Opsens Solutions Inc. and other vice presidents. Compensation of key management personnel during the year was as follows:
Years ended August 31,
2014 2013
$ $
Short-term salaries and other benefits 1,023,600 885,879
Option-based awards 55,250 154,348
1,078,850 1,040,227
The compensation of key executives is determined by the Human Resources Committee, taking into consideration individual performance and market trends.

Opsens Inc. Notes to the Consolidated Financial Statements Years ended August 31, 2014 and 2013
25. Additional Information to the Statements of Loss and Comprehensive Loss
Years ended August 31,
Expenses (revenues) included in functions 2014 2013
$ $
Salaries & Other Benefits 4,831,238 4,816,921
Cost of sales
Administrative
Marketing
Research and development
Depreciation of Property, Plant and Equipment 345,561 287,469
Cost of sales
Administrative
Research and development
Amortization of Intangible Assets 47,780 31,003
Administrative
Research and development
Government Assistance (255,643 ) (241,040)
Research and development
Income tax credits for research and development (613,431 ) (265,691)
Research and development
26. Financial Instruments Fair Value The fair value of cash and cash equivalents, trade and other receivables and accounts payable and accrued liabilities approximates their carrying value due to their short-term maturities. The fair value of long-term debt is based on the discounted value of future cash flows under the current financial arrangements at the interest rate the Company expects to currently negotiate for loans with similar terms and conditions and maturity dates. The fair value of long-term debt approximates its carrying value due to the current market rates. The fair value of the convertible debenture is based on the discounted value of future cash flows under the current financial arrangements at the interest rate the Company expects to currently negotiate for loans with similar terms and conditions and maturity dates. The fair value of the debt component of the convertible debenture approximates $1,505,300 as at August 31, 2014 ($1,338,000 as at August 31, 2013) and is classified at level 2 in the fair value hierarchy.

Opsens Inc. Notes to the Consolidated Financial Statements Years ended August 31, 2014 and 2013
26. Financial Instruments (continued) Fair Value (suite) Valuation Techniques and Assumptions Applied for the Purposes of Measuring Fair Value The Company must maximize the use of observable inputs and minimize the use of unobservable inputs when measuring fair value. The Company primarily applies the market approach for recurring fair value measurements. The three input levels used by the Company to measure fair value are the following: Level 1 – Unadjusted quoted prices in active markets for identical assets or liabilities. An active market for the
asset or liability is a market in which transactions for the asset or liability occur with sufficient frequency and volume to provide pricing information on an ongoing basis.
Level 2 – Quoted prices for similar assets or liabilities; quoted prices in markets that are not active; or other
inputs that are observable or can be corroborated by observable market data for substantially the full term of the assets or liabilities.
Level 3 – Unobservable inputs that are supported by little or no market activity and that are significant to the fair
value of the assets or liabilities. The following table summarizes the fair value hierarchy under which the Company’s financial instruments are valued.
As at August 31, 2014
Total Level 1 Level 2 Level 3
$ $ $ $
Financial assets (liabilities) measured at fair value:
Convertible debenture – embedded derivative (140,479) -
(140,479 ) -
As at August 31, 2013
Total Level 1 Level 2 Level 3
$ $ $ $
Financial assets (liabilities) measured at fair value:
Convertible debenture – embedded derivative (34,012) -
(34,012 ) -
As explained in note 14, the convertible debentures contains an embedded derivative that must be measured at fair value at each reporting date with gains and losses in fair value recognized through profit or loss. One of the most significant assumptions impacting the Company’s valuation of these embedded derivatives is the implied volatility. The fair value of the embedded derivative included in the convertible debenture was determined using the Black-Scholes pricing model using an implied volatility of 111% (122% in 2013), a discount rate of 1.35% (1.95% in 2013) and an expected life of 3.2 years (4.2 years in 2013). A 1% change in the implied volatility factor would have changed the fair value of the embedded derivative by $1,740.
Opsens Inc. Notes to the Consolidated Financial Statements Years ended August 31, 2014 and 2013
26. Financial Instruments (continued) Risk Management The main risks arising from the Company’s financial instruments are credit risk, liquidity risk, interest rate risk and foreign exchange risk. These risks arise from exposures that occur in the normal course of business and are managed on a consolidated Company basis. Credit Risk Credit risk is the risk of an unexpected loss if a customer or counterparty to a financial instrument fails to meet its contractual obligations. The Company regularly monitors credit risk exposure and takes steps to mitigate the likelihood of this exposure resulting in losses. The Company's exposure to credit risk currently relates to cash and cash equivalents and to trade and other receivables. The Company’s credit risk management policies include the authorization to carry out investment transactions with recognized financial institutions with credit ratings of at least A and higher, in either bonds, money market funds or guaranteed investment certificates. Consequently, the Company manages credit risk by complying with established investment policies. The credit risk associated with trade and other receivables is generally considered normal since the majority of its customers are well-established and financed oil and gas companies. Generally, the Company does not require collateral or other security from customers for trade accounts receivable; however, credit is extended following an evaluation of creditworthiness. In addition, the Company performs ongoing credit reviews of all of its customers and establishes an allowance for doubtful accounts when accounts are determined to be at risks and/or uncollectible. Two major customers represented 50% of the Company’s total accounts receivable as at August 31, 2014 (64% as at August 31, 2013). As at August 31, 2014, 6% (13% as at August 31, 2013) of the accounts receivable were of more than 90 days whereas 60% (43% as at August 31, 2013) of those were less than 30 days. The maximum exposure to the risk of credit for accounts receivable corresponded to their book value. As at August 31, 2014, the allowance for doubtful accounts was established at $3,032 ($21,000 as at August 31, 2013). Management considers that substantially all receivables are fully collectible as most of our customers are large corporations with good credit standing and no history of default. Liquidity Risk Liquidity risk is the risk that the Company will encounter difficulty in meeting obligations associated with financial liabilities that are settled in cash and/or another financial asset. The Company’s approach is to ensure it will have sufficient liquidity to meet operational, capital and regulatory requirements and obligations, under both normal and stressed circumstances. Cash flow projections are prepared and reviewed quarterly by the Board of Directors to ensure a sufficient continuity of funding. The funding strategies used to manage this risk include the Company’s access to capital markets and debt securities issues.

Opsens Inc. Notes to the Consolidated Financial Statements Years ended August 31, 2014 and 2013
26. Financial Instruments (continued) Liquidity Risk (continued) The following are the contractual maturities of the financial liabilities (principal and interest, assuming current interest rates) as at August 31, 2014 and August 31, 2013:
August 31, 2014 Carrying 0 to 12 12 to 24 After
amount Cash flows months months 24 months
$ $ $ $ $
Accounts payable and
accrued liabilities 1,346,217 1,346,217 1,346,217 - -
Long-term debt 826,834 1,057,301 181,137 256,806 619,358
Convertible debenture 2,359,556 2,392,060 - - 2,392,060
Total 4,532,607 4,795,578 1,527,354 256,806 3,011,418
August 31, 2013 Carrying 0 to 12 12 to 24 After
amount Cash flows months months 24 months
$ $ $ $ $
Accounts payable and
accrued liabilities 2,042,063 2,042,063 2,042,063 - -
Long-term debt 765,104 943,130 201,884 181,137 560,109
Convertible debenture 2,129,811 2,316,600 - - 2,316,600
Total 4,936,978 5,301,793 2,243,947 181,137 2,876,709
Interest Rate Risk The Company’s exposure to interest rate risk is summarized as follows: Cash and cash equivalents Fixed interest rates Trade and other receivables Non-interest bearing Accounts payable and accrued liabilities Non-interest bearing Long-term debt Non-interest bearing, fixed and variable interest rates Convertible debenture Fixed interest rates Interest Rate Sensitivity Analysis Interest rate risk exists when interest rate fluctuations modify the cash flows or the fair value of the Company’s investments and embedded derivative. The Company owns investments with fixed interest rates. As of August 31, 2014, the Company was holding more than 92% (81% as at August 31, 2013) of its cash and cash equivalents in all-time redeemable term deposits. All else being equal, a hypothetical 1% interest rate increase would have had an unfavourable impact of $1,717 on the net loss for the year ended August 31, 2014 (unfavourable impact of $3,697 on the net loss for the year ended August 31, 2013). A hypothetical 1% interest rate decrease would have had a favourable impact of $1,780 on the net loss for the year ended August 31, 2014 (favourable impact of $3,721 for the year ended August 31, 2013).

Opsens Inc. Notes to the Consolidated Financial Statements Years ended August 31, 2014 and 2013
26. Financial Instruments (continued) Financial expenses (revenues)
Years ended August 31,
2014 2013
$ $
Interest and bank charges 58,183 52,999
Interest on long-term debt 34,906 39,307
Interest and accreted interest on convertible debenture (note 14) 54,527 40,708
Loss on foreign currency translation 84,941 26,638
Interest income (118,147 ) (59,735)
114,410 99,917
Concentration Risk Concentration risk exists when investments are made with multiple entities that share similar characteristics or when a large investment is made with a single entity. As of August 31, 2014 and 2013, the Company was holding 100% of its cash equivalents portfolio in all-time redeemable term deposits with financial institutions with high creditworthiness.
Foreign Exchange Risk The Company realizes certain sales and purchases and certain supplies and professional services in US dollars. Therefore, it is exposed to foreign currency fluctuations. The Company does not actively manage this risk. Foreign Currency Sensitivity Analysis For the years ended August 31, 2014 and 2013, if the Canadian dollar had strengthened 10% against the US dollar with all other variables held constant, net loss would have been $4,700 higher for the year ended August 31, 2014 (net loss would have been $154,000 lower for the year ended August 31, 2013). Conversely, if the Canadian dollar had weakened 10% against the US dollar with all other variables held constant, net loss would have been $4,700 lower for the year ended August 31, 2014 (net loss would have been $154,000 higher for the year ended August 31, 2013).
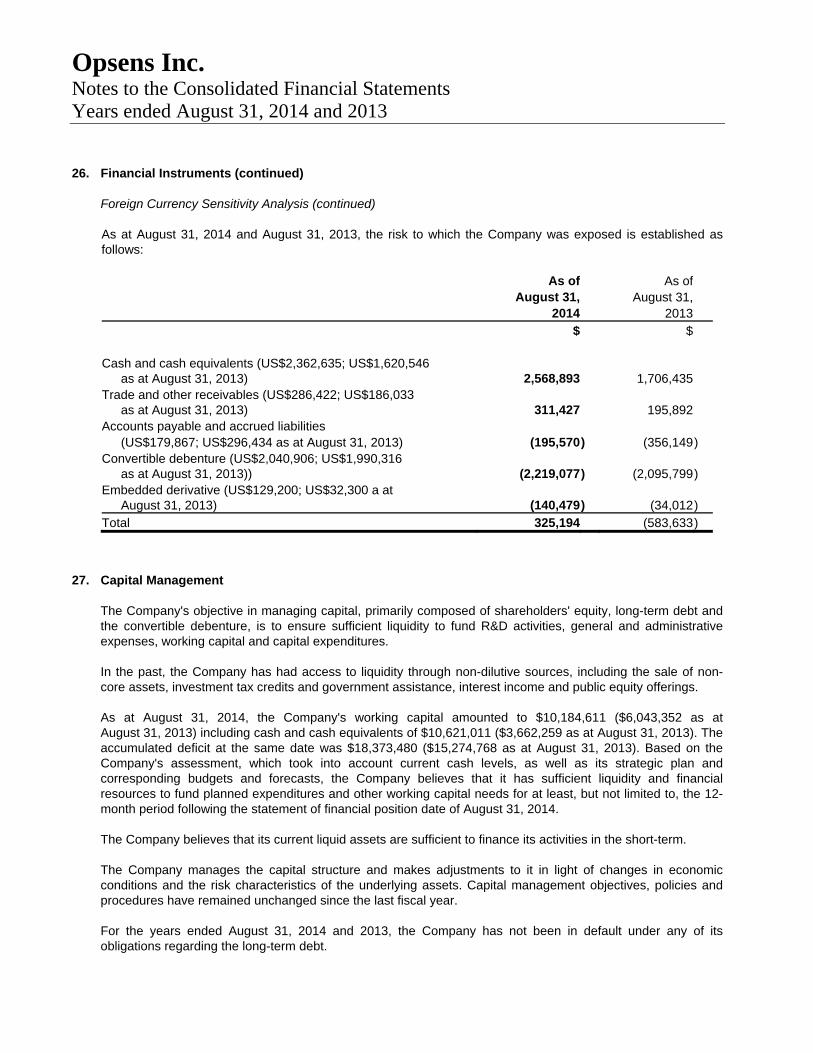
Opsens Inc. Notes to the Consolidated Financial Statements Years ended August 31, 2014 and 2013
26. Financial Instruments (continued) Foreign Currency Sensitivity Analysis (continued) As at August 31, 2014 and August 31, 2013, the risk to which the Company was exposed is established as follows: As of As of August 31, August 31, 2014 2013 $ $ Cash and cash equivalents (US$2,362,635; US$1,620,546 as at August 31, 2013) 2,568,893 1,706,435 Trade and other receivables (US$286,422; US$186,033 as at August 31, 2013) 311,427 195,892 Accounts payable and accrued liabilities (US$179,867; US$296,434 as at August 31, 2013) (195,570 ) (356,149) Convertible debenture (US$2,040,906; US$1,990,316 as at August 31, 2013)) (2,219,077 ) (2,095,799) Embedded derivative (US$129,200; US$32,300 a at August 31, 2013) (140,479 ) (34,012) Total 325,194 (583,633)
27. Capital Management The Company's objective in managing capital, primarily composed of shareholders' equity, long-term debt and the convertible debenture, is to ensure sufficient liquidity to fund R&D activities, general and administrative expenses, working capital and capital expenditures. In the past, the Company has had access to liquidity through non-dilutive sources, including the sale of non-core assets, investment tax credits and government assistance, interest income and public equity offerings. As at August 31, 2014, the Company's working capital amounted to $10,184,611 ($6,043,352 as at August 31, 2013) including cash and cash equivalents of $10,621,011 ($3,662,259 as at August 31, 2013). The accumulated deficit at the same date was $18,373,480 ($15,274,768 as at August 31, 2013). Based on the Company's assessment, which took into account current cash levels, as well as its strategic plan and corresponding budgets and forecasts, the Company believes that it has sufficient liquidity and financial resources to fund planned expenditures and other working capital needs for at least, but not limited to, the 12-month period following the statement of financial position date of August 31, 2014. The Company believes that its current liquid assets are sufficient to finance its activities in the short-term. The Company manages the capital structure and makes adjustments to it in light of changes in economic conditions and the risk characteristics of the underlying assets. Capital management objectives, policies and procedures have remained unchanged since the last fiscal year. For the years ended August 31, 2014 and 2013, the Company has not been in default under any of its obligations regarding the long-term debt.

Opsens Inc. Notes to the Consolidated Financial Statements Years ended August 31, 2014 and 2013
28. Approval of Consolidated Financial Statements The consolidated financial statements were approved by the Board of Directors and authorized for issue on November 24, 2014.
29. Subsequent Events
Shonin approval On October 2, 2014, the Company announced it has received Shonin approval from the Japanese Ministry of Health, Labor and Welfare to market the OptoWire and the OptoMonitor, Opsens’ products that measure FFR in patients with coronary artery disease. Obtaining Shonin approval was the final condition for the release of a milestone payment of US$1,000,000 ($1,116,300). This amount will be recorded in the statement of loss and comprehensive loss. CE mark regulatory approval On November 19, 2014, the Company announced it has received CE Mark approval to market in Europe its FFR products. The CE mark approval, in addition to the Shonin approval obtained on October 2, 2014, allow the Company to record in the statement of loss under the caption “Distribution rights” the $2,002,000 (US$2,000,000) upfront license fee it received upon the signature of the agreement. The upfront license fee was previously accounted for as deferred revenues since the Company had to reimburse the upfront licence upon the occurrence of events described in note 12 to these consolidated financial statements.

GOVERNANCE
DirectorsLouis Laflamme President and Chief Executive Officer
Claude Belleville Vice President, Medical Devices
Gaétan Duplain Vice President, Oil and Gas, Industrial
Steven G. Arless Director
Lucien Goffart Director
Jean Lavigueur Director
Denis M. Sirois Director
OfficersLouis Laflamme, CPA, CA President and Chief Executive Officer
Claude Belleville Vice President, Medical Devices
Gaétan Duplain Vice President Oil and Gas, Industrial
Thierry Dumas, CPA, CA Chief Financial Officer and Corporate Secretary
Allister MacIsaac Opsens Solutions – Business Unit Manager
CORPORATE INFORMATION
Head Office2014 Cyrille-Duquet St., Suite 125 Quebec City, QC G1N 4N6 Phone: 418 682-9996 Fax: 418 682-9939
Opsens Solutions7019 – 68th avenue NW Edmonton, AB T6B 3E3 Phone: 780 930-1777 Fax: 780 930-2077 Website: www.opsens.com
Investor RelationsFor information about Opsens Inc. or to be placed on the mailing list for quarterly reports and news releases, contact Marie-Claude Poitras at the head office or [email protected].
AuditorsDeloitte, s.e.n.c.r.l. Quebec, QC
Stock Exchange ListingToronto Venture Exchange Symbol: OPS Shares outstanding: 59,758,003 (as at August 31, 2014)
Transfer Agent & Registrar Canadian Stock Transfer Company Inc. (CST) 320 Bay Street – B1 Level Banking Hall Toronto, ON M5H 4A6 1-800-387-0825
Annual Meeting Of ShareholdersMonday, January 19, 2015 - 10:30 a.m., Alt Hotel, Quebec, Rochette and Nadeau Rooms, ground floor (Restaurant Le Bistango).
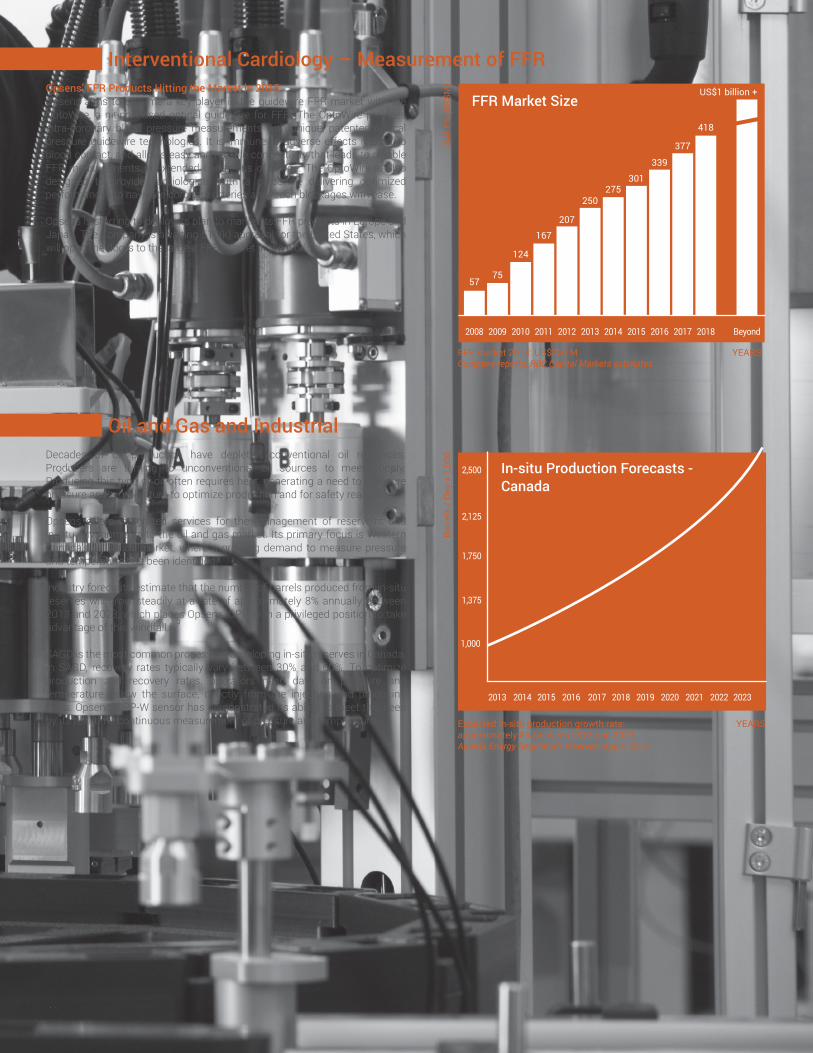
Interventional Cardiology – Measurement of FFR Opsens’ FFR Products Hitting the Market in 2015Opsens aims to become a key player in the guidewire FFR market with the OptoWire, a nitinol-based optical guidewire for FFR. The OptoWire provides intra-coronary blood pressure measurements with unique, patented optical pressure guidewire technologies. It is immune to adverse effects related to blood contact, and allows easy and reliable connectivity that leads to reliable FFR measurements in extended conditions of usage. The OptoWire is also designed to provide cardiologists with a guidewire delivering optimized performances to navigate coronary arteries and reach blockages with ease.
Opsens is starting to deploy its plan to market its FFR products in Europe and Japan. The Company is awaiting 510(k) approval for the United States, which will open the doors to the largest FFR market in the world.
Oil and Gas and IndustrialDecades of oil production have depleted conventional oil resources. Producers are turning to unconventional oil sources to meet supply. Producing this type of oil often requires heat, generating a need to measure pressure and temperature to optimize production and for safety reasons.
Opsens offers integrated services for the management of reservoirs and in-situ environments to the oil and gas market. Its primary focus is Western Canada’s oil sands market, where a growing demand to measure pressure and temperature has been identified.
Industry forecasts estimate that the number of barrels produced from in-situ reserves will grow steadily at a rate of approximately 8% annually between 2013 and 2023, which places Opsens’ OPP-W in a privileged position to take advantage of this windfall.
SAGD is the most common process for developing in-situ reserves in Canada. In SAGD, recovery rates typically vary between 30% and 60%. To optimize production and recovery rates, operators need data on pressure and temperature below the surface, directly from the injecting and producing wells. Opsens’ OPP-W sensor has demonstrated its ability to meet this need by its real-time continuous measurement of pressure and temperature.
FFR market 2013: US$250 MCompany reports, RBC Capital Markets estimates
YEARS
YEARS
2008 2009 2010 2011 2012 2013 2014 2015 2016 2017 2018 Beyond
FFR Market Size
5775
124
167
207
250275
301
339
377
418
US$1 billion +
SALE
S (U
S$M
)Ba
rrel
s / D
ay x
1,0
00
2013
1,000
1,750
2,125
1,375
2,500
2014 2015 2016 2017 2018 2019 2020 2021 2022 2023
Expected in-situ production growth rate: approximately 8% between 2013 and 2023.Alberta Energy Regulator’s reserves report, 2014
In-situ Production Forecasts - Canada

7019 – 68th Avenue NW, Edmonton, AB T6B 3E3 | T• 780.930.1777 | F• 780.930.2077
2014, Cyrille-Duquet Street, Suite 125, Quebec, QC G1N 4N6 | T• 418.682.9996 | F• 418.682.9939
www.opsens.com
OIL & GASOutstanding turnkey sensing solutions with advanced optical sensing technology
INDUSTRIAL APPLICATIONSInnovative fiber optic sensing solutions for industries
AN ADVANCED FFR PRESSURE GUIDEWIRE WITH FIBER OPTIC TECHNOLOGIESInterventional cardiology in a whole new light