Embed Size (px)
Citation preview
Setting ambitious targets for
Energy savings schemes
Australia-wide 2019-2030
Scorecard:
Saving billions economy-wide
ESIA White Paper
3 July 2018
ESIA White Paper: Setting Ambitious Energy Savings Schemes Targets 2019-2030 3 July 2018 ii
www.esia.asn.au
ESIA White Paper: Setting Ambitious Energy Savings Schemes Targets 2019-2030 3 July 2018 iii
Table of Contents
Table of Figures ...................................................................................................................................... iii
Table of Tables ....................................................................................................................................... iii
1. Rationale ......................................................................................................................................... 1
2. Priority Goals - setting ambitious targets 2019-2030 ..................................................................... 2
Achievements shortlist to 2018 - energy savings schemes ............................................................... 2
Scorecard 2018 - energy savings schemes ......................................................................................... 3
Essentials Checklist 2018 - energy savings schemes .......................................................................... 4
3. Appendices ...................................................................................................................................... 5
A Scheme targets and metrics: direct comparison - conversion to MWh .................................... 5
B Scheme targets and metrics: direct comparison - conversion to MWh/capita .......................... 6
C Energy savings schemes can achieve 1/3 of electricity emissions reduction target by 2030 ..... 7
D Electricity emissions reduction scenarios and political party target commitments ................... 8
ESIA Rebrand and Membership ......................................................................................................... 9
More Information - invitation to subscribe ....................................................................................... 9
Table of Figures
Figure 2-1 Complementary targets across Australia: ERTs / RETs / EESs ............................................... 2
Figure 3-1 Emissions from Electricity by 2030 (GEM July 2018) ............................................................. 7
Figure 3-2 Electricity Emissions 2016-2030 (GEM July 2018) ................................................................. 8
Figure 3-3 Federal political party emissions reduction target commitments......................................... 8
Table of Tables
Table 3-1 Energy savings schemes: targets to 2009 to 2029 - metrics conversion to MWh .................. 5
Table 3-2 Populations of jurisdiction in Australia - 31 Mar 2017 ........................................................... 6
Table 3-3 Energy savings schemes: targets 2009 to 2029 - metrics conversion to MWh/capita ........... 6
Energy Savings Industry Association, © 3 July 2018. All rights reserved.
Disclaimer: While reasonable care has been taken to ensure the accuracy of content, no responsibility will be
taken by the ESIA or its contributors and not all information contained in this publication reflects the official
position of the ESIA.
Energy Savings Industry Association (ESIA)
Level 1, 2 Domville Avenue, Hawthorn VIC 3122
esia.asn.au
ABN 52 166 026 766
ESIA White Paper: Setting Ambitious Energy Savings Schemes Targets 2019-2030 3 July 2018 1
1. Rationale
Bi-partisan support needs strengthening
This White Paper is a quick-reference policy-setting guide summarising the case for extending and
expanding existing energy savings schemes in Vic, NSW, SA and the ACT and introducing schemes in Qld,
WA, NT and Tas from 2019 to 2030. Existing schemes have been supported since 2009 for their
strengthening whether it is through:
• increasing the range of energy saving upgrades included under the schemes;
• extension to target end dates; and
• increasing targets.
The sooner energy savings schemes are introduced across Australia and existing targets increased the
sooner and more cost-effectively the multiple benefits of energy efficiency will be delivered, saving billions
economy-wide.
The Energy Savings Industry Association (ESIA) has determined a direct comparison of targets from 2009-
2029 for existing schemes. Based on these assumptions, these schemes:
• will meet combined targets of almost 12 million MWh (12,000 GWh) per annum by 2020
(Appendix A); and
• achieve annual MWh/capita targets of Vic at 0.86, ACT at 0.64, NSW at 0.53 and SA at 0.37.
(Appendix B)
Addressing immediate policy drivers and tailoring to local needs
Energy savings schemes are addressing some of the most pressing policy drivers shared by governments
across Australia:
• energy bill pain from escalating wholesale and retail electricity prices;
• network upgrades wasting resources to meet avoidable surges in peak demand; and
• drastic action needed to meet our commitment under the Paris Agreement to avoid 2OC rise.
Energy savings schemes are tailored to suit local needs and work most effectively as part of a suite of
complementary energy efficiency measures and related targets (eg renewable energy and emission
reduction targets). Energy savings schemes are proven to overcome market failures, provide access to
upfront financial incentives and drive upgrades across key sectors including households, businesses and
governments.
Latest customer experience and economy-wide benefits
The ESIA Energy Savings Schemes Scorecard 2018 provides a ready reckoner of deliverables including
customer experience and economy-wide benefits. The ESIA Energy Savings Schemes Essential Checklist
2018 illustrates the basics for developing scheme deliverables. The latest analysis of customer experience
is provided by the Victorian scheme. In 2018, participating households will save an average of $150 off
their energy bills this year, and businesses will save on average around $4,700 annually on their energy
bills. (DELWP, Vic Govt, 27 June 2018). The net benefit of achieving the VEU targets for 2016 to 2020 is
estimated to be between $1.3 and $3.2 billion. The variation will be determined by the range of activities
included in the near future. (VEET Regulations Regulatory Impact Statement, June 2018, p21)
Latest climate change target policy commitments and role of schemes
If rolled out across Australia by 2030, energy saving schemes could deliver one-third of the emissions
reductions required by the electricity sector to meet our Paris Commitment. (Appendices C&D)
ESIA White Paper: Setting Ambitious Energy Savings Schemes Targets 2019-2030 3 July 2018 2
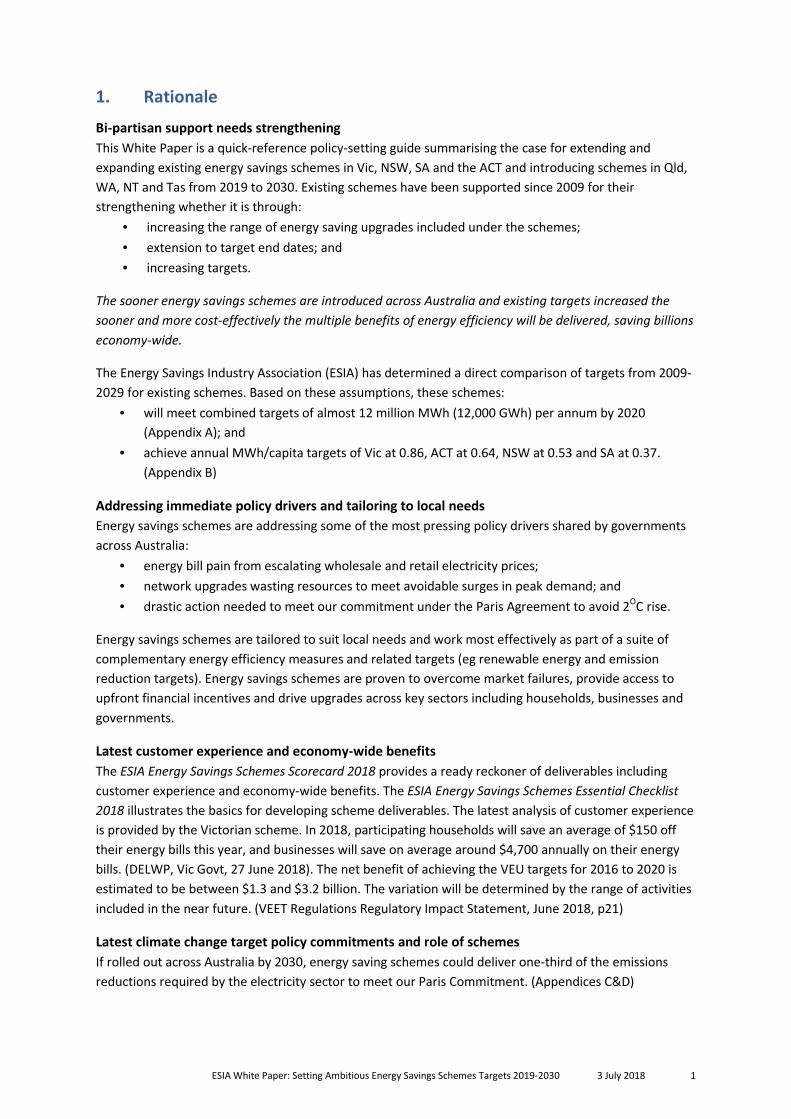
2. Priority Goals - setting ambitious targets 2019-2030
Ambitious targets for energy savings schemes across Australia from 2019-2030 are priority goals for
the ESIA over the next 18 months as governments commence target reviews of existing schemes and
consider establishing new schemes. Energy savings schemes complement other mechanisms making
them easier and more cost-effective to achieve. (See Figure 2-1)
Figure 2-1 Complementary targets across Australia: ERTs / RETs / EESs
Jurisdiction Emissions
Reduction
Target (ERT)
Renewable
Energy Target
(RET)
Energy Savings
Scheme (ESS)
Target
Existing Energy Savings Schemes
Target settings
National ✓ ✓
Vic ✓ ✓ ✓ Set to end of 2020
2021 to 2025 target to be set 2019
2026-2029 to be set in 2025
NSW ✓
✓ Set to end of 2025
SA ✓ ✓ ✓ Set to end of 2020, review 2019
ACT ✓ ✓ ✓ Set to end of 2020, review in progress
2018
Qld ✓ ✓ Considering a scheme during 2018,
potential start 2019
WA Stocktake of energy efficiency initiatives
in progress 2018
NT ✓ ✓ Stocktake of energy efficiency initiatives
in progress 2018
Tas ✓ ✓
Achievements shortlist to 2018 - energy savings schemes
Existing energy savings schemes in Vic, NSW, SA and ACT have delivered an average annual
reduction of total electricity consumption of almost four per cent. Achievements up to end 2017:
> 2.3 million households and businesses have participated
> 5 million energy-saving upgrades so far
> 5 million MWh of electricity saved annually
> 5 million tonnes of greenhouse gas emissions avoided
> 4,000 jobs supported
> $1 billion of customer bill savings annually
Energy savings schemes could do much more if expanded, extended and introduced across Australia.
ESIA White Paper: Setting Ambitious Energy Savings Schemes Targets 2019-2030 3 July 2018 3
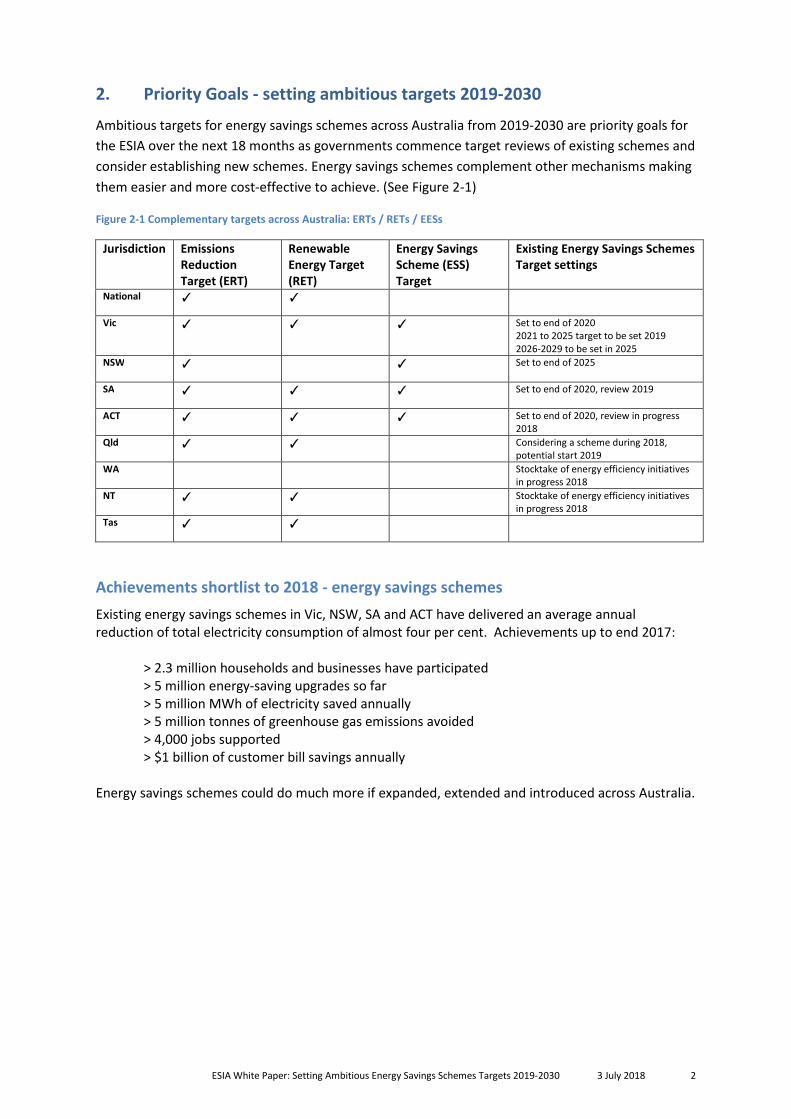
Scorecard 2018 - energy savings schemes
If Schemes Scrapped Afford-
ability
Reliability
& Security
Vote
winner
Upgrades won’t happen as uptake barriers remain, quick energy savings missed ✘ Higher energy costs and bills ✘ Higher economy-wide costs ✘ Jobs in jeopardy ✘
Businesses, hospitals, schools waste time and money with inefficient infrastructure ✘ Households miss out on energy savings, added health and comfort ✘
Energy savings industry stalls: technology innovation, growth, competition suffer ✘
More money than current pass-through costs wasted on expensive, unproven or less
effective alternatives without schemes: education campaigns, energy audits, grants ✘
Blackouts: unreliable coal plant won’t get relief without lower energy demand ✘
Energy Affordability, Reliability, Security: harder to achieve and cost more ✘
Badwill Loser: Australians denied access to AUSTRALIA’S MOST SUCCESSFUL ENERGY
SAVINGS INITIATIVES - saving energy and money every day with local schemes ✘
Energy Savings Schemes
Scorecard 2018
Biggest knowledge gap about energy savings schemes: Customers don’t do energy saving upgrades without financial incentives from energy savings schemes because they
lack the knowledge, time and money: the schemes overcome these hurdles. Repeated independent research shows
this, that’s why these schemes were set up and have been extended and expanded since 2009. They save Australians
energy and money.
Schemes in Vic, NSW, SA and ACT Delivering Afford-
ability
Reliability
& Security
Vote
winner
Empowering customers, very popular, proven: >2.3 million households and
businesses, >5 million upgrades, 21st century infrastructure ✓ ✓ ✓
Reduce electricity consumption on average by almost 4% in states with schemes -
on par with rooftop solar (upgrades deliver energy savings up to 80%) ✓ ✓ ✓
Save much more $ than they cost (a ratio of 1:4 for costs versus savings) ✓ ✓
4000+ 21st century jobs supported, 100+ new innovative businesses ✓ Customers well protected - rigorous, competitive product quality/service standards
✓ ✓
>$1 billion of customer bill savings annually (eg for Vic $150 per year average for
participating households and $4,700 for businesses) ✓ ✓
Upgrading 2 to 6 light bulbs can offset annual household pass-through costs (eg Vic
$11, NSW $10, SA $13, ACT $30) ✓ ✓
Can fill the gap of expensive unreliable coal station closures (Liddell) ✓ ✓ ✓
Much greater energy savings yet to come: new upgrade types in the pipeline ✓ ✓ ✓
Reduces GHG emissions at lowest cost (even less than renewables) ✓ ✓
Other public policy benefits (impacting health & wellbeing, poverty alleviation, local
air pollution, disposable income, asset values, resource management ) ✓ ✓
Goodwill Winner: all current energy savings schemes have been supported under
both Labor and Coalition Governments ✓
ESIA White Paper: Setting Ambitious Energy Savings Schemes Targets 2019-2030 3 July 2018 4
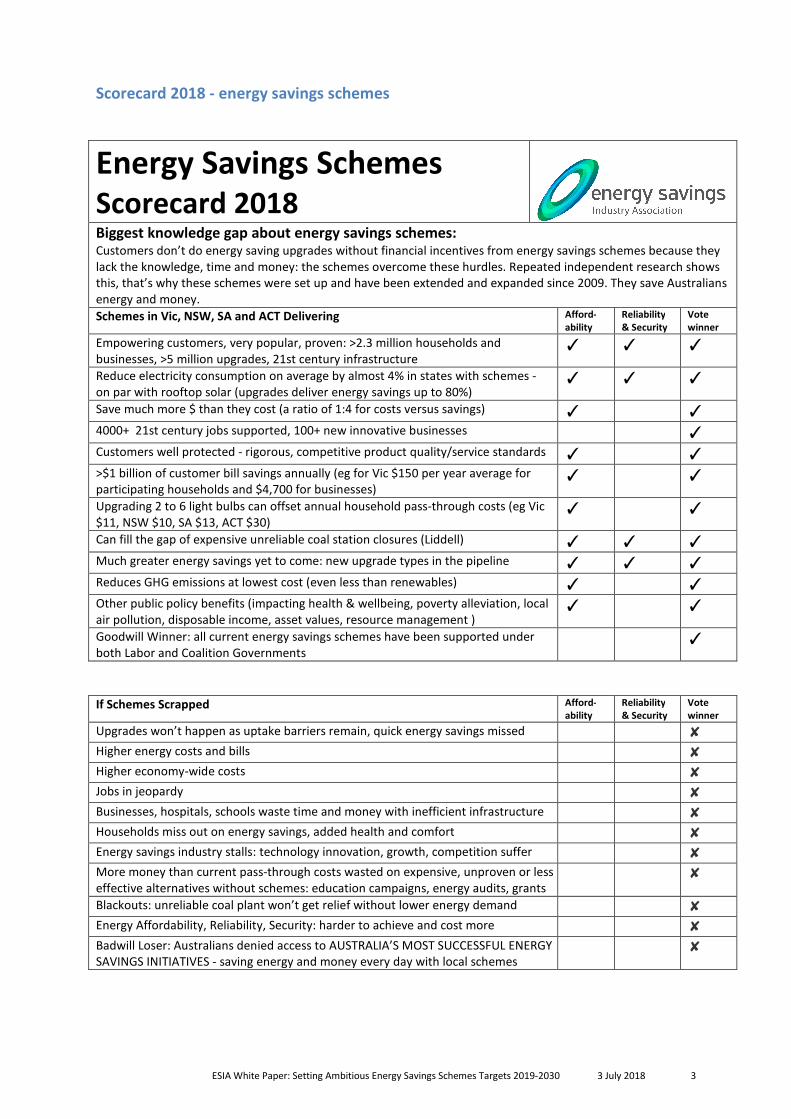
Essentials Checklist 2018 - energy savings schemes
Energy savings schemes are tailored to suit local needs. The ESIA Energy Savings Schemes Essentials
Checklist 2018 highlights typical drivers and complementary measures proven to be effective by
existing schemes.
Energy Savings Schemes
Essentials Checklist 2018
What When How Set targets For 2019-2030 Legislated targets with energy retailers provide a measure that industry can achieve
. Make them ambitious or progress will be slow
. Potentially set predetermined annual increases as this can maintain momentum of
upgrades and provide certainty for industry to invest
Set subset targets For 2019-2030 . Priority Household Target (PHT) to drive uptake for low income and vulnerable
households
. Audit Target to improve understanding and evaluate most appropriate upgrade
potential with key markets
Include all sectors Start with one,
add more
Sectors:
. Household
. Business - SMEs, large commercial and industrial sites
. Government - office buildings, services (hospitals, schools, community facilities),
amenities (street lighting) and spaces (parks and gardens)
Include ‘low hanging
fruit’ activities
Start with one,
add more
Activities:
. Lighting
. Heating Ventilation & Air Conditioning (HVAC)
. Building weather sealing (eg insulation)
. Appliance upgrades - households (fridges, freezers, clothes dryers, pool pumps)
. Appliance upgrades - businesses (refrigerated display cabinet, refrigeration fan
motors)
. Space heating and cooling
. Water heating
. Low flow shower roses
. In-home display units (TVs)
Include effective
methods
Start with one,
add more
Methods:
. Deemed (usually ‘off-the shelf’ product solutions eg lights where energy savings
are determined over a period such as 10 years)
. Project based (where measurement and verification of electricity consumption is
required over time to determine energy savings eg for an HVAC upgrade in a
commercial building, or air conditioning at a gym)
Provide targeted
support
. Grants for more complex projects
. Targeted marketing in low uptake areas
. Provide the market with transparency-of-uptake data to assist with targeting
unsaturated markets
Provide
complementary
initiatives
. Audits for SMEs and Priority households (stand-alone activities or as separate
legislated targets)
. Demand management response for peak demand (eg energy customers commit to
having their appliances turned off at peak times)
. Mandated energy disclosure regulations for all commercial and residential
buildings
. Policies to overcome rental property split incentives (which would assist with
reducing the high percentage of renter utility bill defaulters)
. Mandated phase out of certain products, particularly once schemes have
maximised uptake (eg anticipated Federal Government phase-out of halogens from
2019 has been made possible by the uptake of CFL and LED technologies driven
initially by energy savings schemes prior to the technology becoming more
affordable)
ESIA White Paper: Setting Ambitious Energy Savings Schemes Targets 2019-2030 3 July 2018 5
3. Appendices
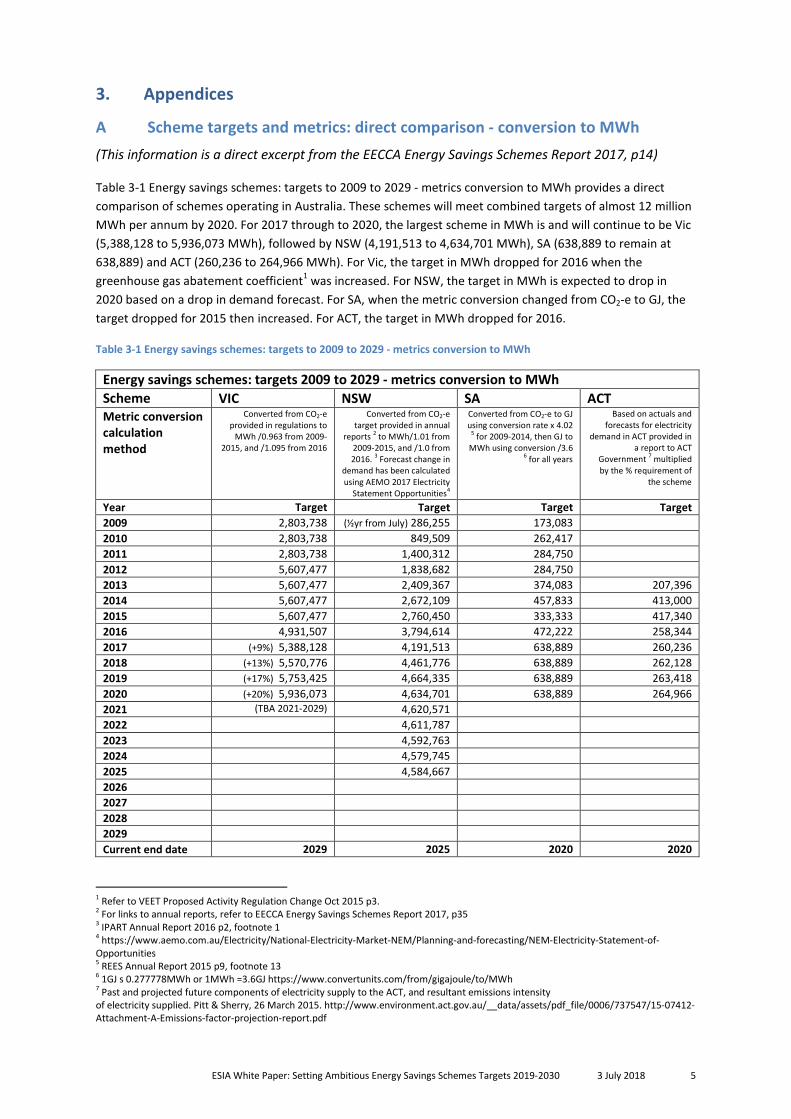
A Scheme targets and metrics: direct comparison - conversion to MWh
(This information is a direct excerpt from the EECCA Energy Savings Schemes Report 2017, p14)
Table 3-1 Energy savings schemes: targets to 2009 to 2029 - metrics conversion to MWh provides a direct
comparison of schemes operating in Australia. These schemes will meet combined targets of almost 12 million
MWh per annum by 2020. For 2017 through to 2020, the largest scheme in MWh is and will continue to be Vic
(5,388,128 to 5,936,073 MWh), followed by NSW (4,191,513 to 4,634,701 MWh), SA (638,889 to remain at
638,889) and ACT (260,236 to 264,966 MWh). For Vic, the target in MWh dropped for 2016 when the
greenhouse gas abatement coefficient1 was increased. For NSW, the target in MWh is expected to drop in
2020 based on a drop in demand forecast. For SA, when the metric conversion changed from CO2-e to GJ, the
target dropped for 2015 then increased. For ACT, the target in MWh dropped for 2016.
Table 3-1 Energy savings schemes: targets to 2009 to 2029 - metrics conversion to MWh
Energy savings schemes: targets 2009 to 2029 - metrics conversion to MWh
Scheme VIC NSW SA ACT
Metric conversion
calculation
method
Converted from CO2-e
provided in regulations to
MWh /0.963 from 2009-
2015, and /1.095 from 2016
Converted from CO2-e
target provided in annual
reports 2 to MWh/1.01 from
2009-2015, and /1.0 from
2016. 3 Forecast change in
demand has been calculated
using AEMO 2017 Electricity
Statement Opportunities4
Converted from CO2-e to GJ
using conversion rate x 4.02 5 for 2009-2014, then GJ to
MWh using conversion /3.6 6 for all years
Based on actuals and
forecasts for electricity
demand in ACT provided in
a report to ACT
Government 7 multiplied
by the % requirement of
the scheme
Year Target Target Target Target
2009 2,803,738 (½yr from July) 286,255 173,083
2010 2,803,738 849,509 262,417
2011 2,803,738 1,400,312 284,750
2012 5,607,477 1,838,682 284,750
2013 5,607,477 2,409,367 374,083 207,396
2014 5,607,477 2,672,109 457,833 413,000
2015 5,607,477 2,760,450 333,333 417,340
2016 4,931,507 3,794,614 472,222 258,344
2017 (+9%) 5,388,128 4,191,513 638,889 260,236
2018 (+13%) 5,570,776 4,461,776 638,889 262,128
2019 (+17%) 5,753,425 4,664,335 638,889 263,418
2020 (+20%) 5,936,073 4,634,701 638,889 264,966
2021 (TBA 2021-2029) 4,620,571
2022 4,611,787
2023 4,592,763
2024 4,579,745
2025 4,584,667
2026
2027
2028
2029
Current end date 2029 2025 2020 2020
1 Refer to VEET Proposed Activity Regulation Change Oct 2015 p3.
2 For links to annual reports, refer to EECCA Energy Savings Schemes Report 2017, p35
3 IPART Annual Report 2016 p2, footnote 1
4 https://www.aemo.com.au/Electricity/National-Electricity-Market-NEM/Planning-and-forecasting/NEM-Electricity-Statement-of-
Opportunities 5 REES Annual Report 2015 p9, footnote 13
6 1GJ s 0.277778MWh or 1MWh =3.6GJ https://www.convertunits.com/from/gigajoule/to/MWh
7 Past and projected future components of electricity supply to the ACT, and resultant emissions intensity
of electricity supplied. Pitt & Sherry, 26 March 2015. http://www.environment.act.gov.au/__data/assets/pdf_file/0006/737547/15-07412-
Attachment-A-Emissions-factor-projection-report.pdf
ESIA White Paper: Setting Ambitious Energy Savings Schemes Targets 2019-2030 3 July 2018 6
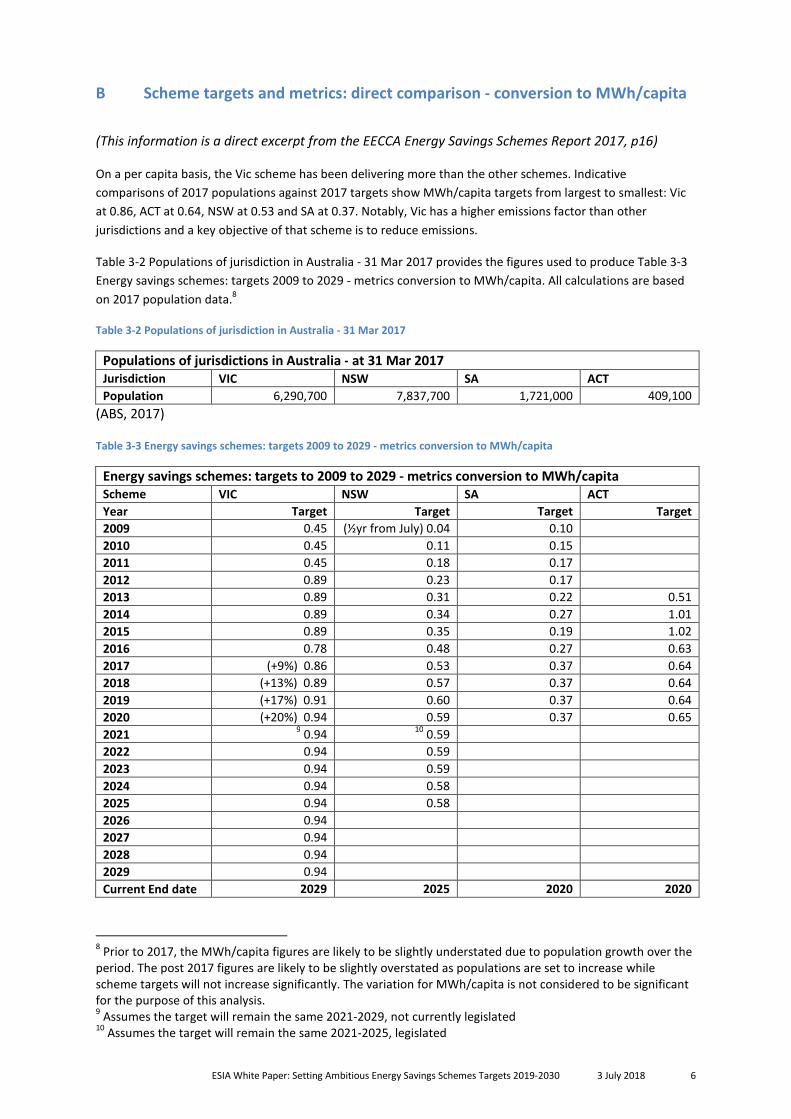
B Scheme targets and metrics: direct comparison - conversion to MWh/capita
(This information is a direct excerpt from the EECCA Energy Savings Schemes Report 2017, p16)
On a per capita basis, the Vic scheme has been delivering more than the other schemes. Indicative
comparisons of 2017 populations against 2017 targets show MWh/capita targets from largest to smallest: Vic
at 0.86, ACT at 0.64, NSW at 0.53 and SA at 0.37. Notably, Vic has a higher emissions factor than other
jurisdictions and a key objective of that scheme is to reduce emissions.
Table 3-2 Populations of jurisdiction in Australia - 31 Mar 2017 provides the figures used to produce Table 3-3
Energy savings schemes: targets 2009 to 2029 - metrics conversion to MWh/capita. All calculations are based
on 2017 population data.8
Table 3-2 Populations of jurisdiction in Australia - 31 Mar 2017
Populations of jurisdictions in Australia - at 31 Mar 2017
Jurisdiction VIC NSW SA ACT
Population 6,290,700 7,837,700 1,721,000 409,100
(ABS, 2017)
Table 3-3 Energy savings schemes: targets 2009 to 2029 - metrics conversion to MWh/capita
Energy savings schemes: targets to 2009 to 2029 - metrics conversion to MWh/capita
Scheme VIC NSW SA ACT
Year Target Target Target Target
2009 0.45 (½yr from July) 0.04 0.10
2010 0.45 0.11 0.15
2011 0.45 0.18 0.17
2012 0.89 0.23 0.17
2013 0.89 0.31 0.22 0.51
2014 0.89 0.34 0.27 1.01
2015 0.89 0.35 0.19 1.02
2016 0.78 0.48 0.27 0.63
2017 (+9%) 0.86 0.53 0.37 0.64
2018 (+13%) 0.89 0.57 0.37 0.64
2019 (+17%) 0.91 0.60 0.37 0.64
2020 (+20%) 0.94 0.59 0.37 0.65
2021 9 0.94
10 0.59
2022 0.94 0.59
2023 0.94 0.59
2024 0.94 0.58
2025 0.94 0.58
2026 0.94
2027 0.94
2028 0.94
2029 0.94
Current End date 2029 2025 2020 2020
8 Prior to 2017, the MWh/capita figures are likely to be slightly understated due to population growth over the
period. The post 2017 figures are likely to be slightly overstated as populations are set to increase while
scheme targets will not increase significantly. The variation for MWh/capita is not considered to be significant
for the purpose of this analysis. 9 Assumes the target will remain the same 2021-2029, not currently legislated
10 Assumes the target will remain the same 2021-2025, legislated
ESIA White Paper: Setting Ambitious Energy Savings Schemes Targets 2019-2030 3 July 2018 7
C Energy savings schemes can achieve 1/3 of electricity emissions reduction
target by 2030
Australia’s Paris Climate Commitment
In order to meets Australia’s Paris Climate Commitment, and stay within a two degrees Celsius
temperature increase, the Climate Change Authority (CCA) recommended that Australia reduce its
greenhouse gas emissions to:
• a 2025 target of 30 per cent below 2000 levels (equivalent to 36 per cent below 2005 levels); and
• further reductions by 2030 of between 40 and 60 per cent below 2000 levels (equivalent to 45 to
63 per cent below 2005 levels) 11
.
Energy sector doing its fair share
Electricity generation accounts for more than one-third of Australia’s emissions, and reductions from this
activity are more cost-effective and readily available than other sectors of the economy such as transport
and agriculture. The CCA recommended that to meet an overall target of 45 per cent reduction by 2030,
emissions from electricity generation should be no more than 60 Mt/a (that is a 69 per cent reduction in
emissions from 2005 levels).
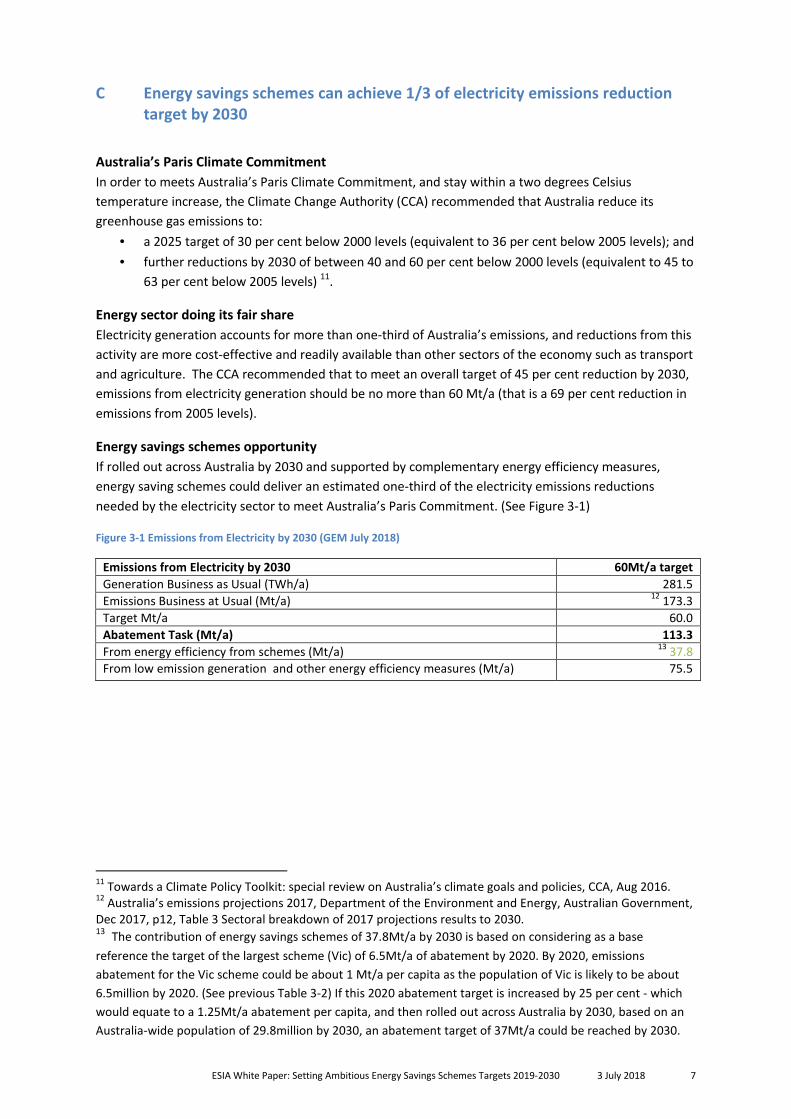
Energy savings schemes opportunity
If rolled out across Australia by 2030 and supported by complementary energy efficiency measures,
energy saving schemes could deliver an estimated one-third of the electricity emissions reductions
needed by the electricity sector to meet Australia’s Paris Commitment. (See Figure 3-1)
Figure 3-1 Emissions from Electricity by 2030 (GEM July 2018)
Emissions from Electricity by 2030 60Mt/a target
Generation Business as Usual (TWh/a) 281.5
Emissions Business at Usual (Mt/a) 12
173.3
Target Mt/a 60.0
Abatement Task (Mt/a) 113.3
From energy efficiency from schemes (Mt/a) 13
37.8
From low emission generation and other energy efficiency measures (Mt/a) 75.5
11
Towards a Climate Policy Toolkit: special review on Australia’s climate goals and policies, CCA, Aug 2016. 12
Australia’s emissions projections 2017, Department of the Environment and Energy, Australian Government,
Dec 2017, p12, Table 3 Sectoral breakdown of 2017 projections results to 2030. 13 The contribution of energy savings schemes of 37.8Mt/a by 2030 is based on considering as a base
reference the target of the largest scheme (Vic) of 6.5Mt/a of abatement by 2020. By 2020, emissions
abatement for the Vic scheme could be about 1 Mt/a per capita as the population of Vic is likely to be about
6.5million by 2020. (See previous Table 3-2) If this 2020 abatement target is increased by 25 per cent - which
would equate to a 1.25Mt/a abatement per capita, and then rolled out across Australia by 2030, based on an
Australia-wide population of 29.8million by 2030, an abatement target of 37Mt/a could be reached by 2030.
ESIA White Paper: Setting Ambitious Energy Savings Schemes Targets 2019-2030 3 July 2018 8
D Electricity emissions reduction scenarios and political party target
commitments
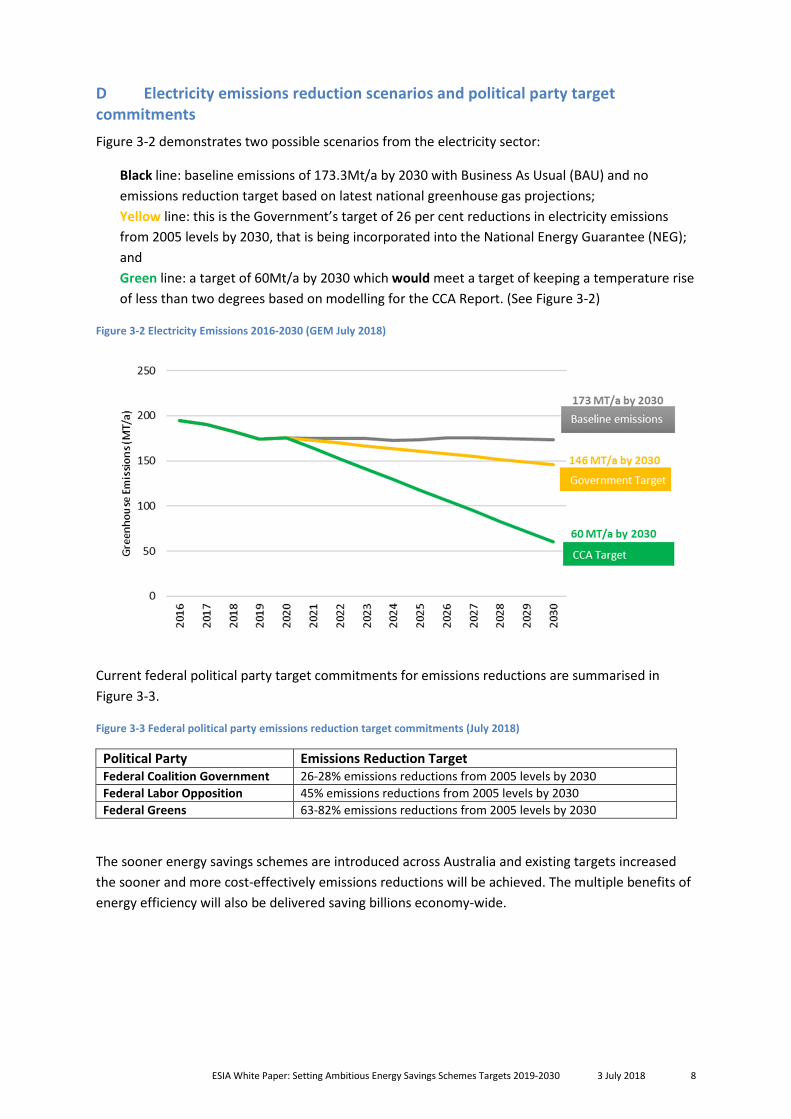
Figure 3-2 demonstrates two possible scenarios from the electricity sector:
Black line: baseline emissions of 173.3Mt/a by 2030 with Business As Usual (BAU) and no
emissions reduction target based on latest national greenhouse gas projections;
Yellow line: this is the Government’s target of 26 per cent reductions in electricity emissions
from 2005 levels by 2030, that is being incorporated into the National Energy Guarantee (NEG);
and
Green line: a target of 60Mt/a by 2030 which would meet a target of keeping a temperature rise
of less than two degrees based on modelling for the CCA Report. (See Figure 3-2)
Figure 3-2 Electricity Emissions 2016-2030 (GEM July 2018)
Current federal political party target commitments for emissions reductions are summarised in
Figure 3-3.
Figure 3-3 Federal political party emissions reduction target commitments (July 2018)
Political Party Emissions Reduction Target
Federal Coalition Government 26-28% emissions reductions from 2005 levels by 2030
Federal Labor Opposition 45% emissions reductions from 2005 levels by 2030
Federal Greens 63-82% emissions reductions from 2005 levels by 2030
The sooner energy savings schemes are introduced across Australia and existing targets increased
the sooner and more cost-effectively emissions reductions will be achieved. The multiple benefits of
energy efficiency will also be delivered saving billions economy-wide.
ESIA White Paper: Setting Ambitious Energy Savings Schemes Targets 2019-2030 3 July 2018 9
ESIA Rebrand and Membership
Why rebrand?
The Energy Savings Industry Association (ESIA) was launched on 3 July 2018 by the formerly named
Energy Efficiency Certificate Creators Association (EECCA). The new name better reflects the
membership which has grown significantly to include product suppliers, service providers and
certificate creators accredited under energy savings schemes and complementary initiatives across
Australia. Members of the founding group in 2009 were all energy efficiency certificate creators.
Members
Corporate: Auspro Group, Demand Manager, Easy Being Green, Echo Group, Eco Light
Up, Ecovantage, Emerald Planet, Energy Mad, Energy Makeovers, Greenbank Environmental, Green
Energy Trading, Haneco Lighting Australia, LEDified, MAC Energy Efficiency Group, National Carbon
Bank of Australia, Outperformers, Shine On, Specialised Lighting Solutions, Sunny Australia
Lighting, The Green Guys Group, Wattly Associate: Cyanergy, Energy and Carbon Solutions, Energy
Conservation, Energy & Management Services, Green Connection Group, Ozwide Group
Code of Conduct
ESIA members signatory to the ESIA Code of Conduct and are entitled to use the logo:
________________________________
More Information - invitation to subscribe
More information about the ESIA, membership and energy savings schemes in Australia is available
at esia.asn.au
Interested parties are invited to receive free ESIA information alerts: Subscribe via the website.
Please direct all queries regarding this publication and the ESIA to [email protected]