Embed Size (px)
Citation preview
Guidance Note Setting Data-Driven Oral Reading Fluency
Benchmarks2018
Guidance Note Setting Data-Driven Oral Reading Fluency Benchmarks
Prepared in consultation with Room to Read by:Matthew Jukes, Chris Cummiskey, and Melissa N. Gargano RTI International3040 Cornwallis Road Post Office Box 12194Research Triangle Park, NC 27709-2194
ForewordRoom to Read is pleased to offer this Guidance Note for Setting Data-Driven Oral Reading Fluency Benchmarks as a contribution to the wide-ranging work in the sector on reading measurement and benchmarking. This Guidance Note stems from the analysis conducted in the Data-Driven Methods for Setting Reading Proficiency Benchmarks report (www.roomtoread.org/FluencyBenchmarkingAnalysisReport2018), consultations with Room to Read’s country offices and partners, and exchanges with sector colleagues during the Technical Forum on Oral Reading Fluency Measurement and Benchmarking that Room to Read hosted in collaboration with the Center for Universal Education at Brookings Institution in November 2017 in Washington, DC.
Reading measurement is a critical element of Room to Read’s Research, Monitoring and Evaluation strategy; providing a key indicator of our Literacy Program effectiveness while advancing organizational learning and accountability. Our investment in nearly one hundred reading assessments across fourteen languages and eleven countries in just the past four years speaks to the importance of this work and the need to continuously evolve and improve our approach.
As for many organizations and countries striving to improve reading outcomes for children, oral reading fluency has emerged as a key focal point, serving as a prevalent proxy measure for the aim of all children reading with comprehension at grade level. Yet questions remain about fluency measurement and benchmarking that warrant further research and discussion. To this end, Room to Read, supported by Pearson Education, has initiated a series of efforts to both produce new evidence and promote new dialogue to address some of the most pressing questions about oral reading fluency measurement and setting appropriate, data-driven benchmarks:
• To what degree are fluency benchmarks useful indicators of comprehension? If so, at which stages of reading development?
• How do different methods of estimating a benchmark compare?
• What factors determine the level and precision of a benchmark estimate?
• Does the recommended approach to benchmarking differ by language? What language charac-teristics affect fluency rates or the fluency-comprehension relationship?
• How do the properties of the assessment instrument influence this work?
• What data collection and data analysis approaches best facilitate accurate benchmark estimates?
• What is the most effective approach for engaging policy makers and setting country-level benchmarks?
We recognize there are many questions beyond those listed here and that there are many individuals, organizations and education ministries contributing significant technical and policy guidance on this issue. It is our hope that this Guidance Note complements those efforts. We will continue our research and would also encourage other organizations to expand their own research to challenge these nascent findings. We hope this collaborative approach will, in the end, advance the art and science of reading measurement and benchmarking.
Christine H. BeggsSenior Director – Research, Monitoring & Evaluation, Room to Read
GUIDANCE NOTE SETTING DATA-DRIVEN ORAL READING FLUENCY BENCHMARKS | i
Table of ContentsIntroduction ....................................................1
Why Oral Reading Fluency Benchmarking? .............................................1Approach to Oral Reading Fluency Benchmarking ............................................... 2
Data Analysis Supporting this Guidance Note ....................................................... 2
Step 1: Define the Goals of Benchmarking ......................................... 51.1 How Is Reading Proficiency Defined? ...............5
1.2 How Will Benchmarks Be Used? ....................... 6
Step 2: Define the Target Population ........................................6
Step 3: Select Assessment Instruments ................................................... 73.1 Selecting Tools to Assess
Fluency and Comprehension ..............................7
3.2 Assess the Difficulty Level of the Passage .............................................. 8
3.3 Ensure Reliable Comprehension Questions .................................................................. 8
3.4 Allow Students to Read to the End of the Passage .........................................9
3.5 Use More Than One Reading Passage to Set Benchmarks .............................. 10
Step 4: Select a Sample ............................. 104.1 Use a Large Enough Sample .............................. 10
4.2 Include a Mixture of High- and Low-Performing Students ......................... 11
4.3 Use More Than One Sample to Set Benchmarks ................................................12
Step 5: Run Pre-Analysis Checks on the Data .....................................135.1 Pre-Analysis Steps ................................................13
5.2 Selecting Sub-Samples for Fluency Benchmarking Analysis .....................14
Step 6: Select an Analysis Method and Estimate Benchmarks .......................156.1 Mean Benchmark .................................................15
6.2 Median Benchmark ..............................................15
6.3 Logistic Regression Benchmark .......................15
Step 7: Evaluate and Compare Benchmarks Methods................................177.1 Is the Benchmark Estimate Plausible? ...........18
7.2 Is the Benchmark Indicative of Comprehension? ..............................................18
7.3 Benchmark Precision .......................................... 19
7.4 Conclusion: Selecting a Benchmark Method ............................................ 19
Step 8: Finalize Benchmarks and Targets ...................................................218.1 Benchmarks and Targets by Grade ..................21
8.2 Benchmarks vs. Targets ...................................... 23
Conclusion and Summary .......................24
References ....................................................26
Annex A. Readability Formulae ............ 27
Annex B. Statistical Methods Guide with Examples and Annotations .................................................28Benchmarking Analysis Approaches ................... 28
Pre-Analysis Steps ............................................................28
Mean Benchmark ...............................................................31
Median Benchmark...........................................................31
Logistic Benchmark .......................................................... 32
Annex C .........................................................36
GUIDANCE NOTE SETTING DATA-DRIVEN ORAL READING FLUENCY BENCHMARKS | ii
List of Figures and TablesFigures
9 Figure 1. Scatter plot of comprehension question reliability (Cronbach’s alpha statistic) and logistic regression benchmark estimates confidence interval width from 72 datasets.
11 Figure 2. Logistic regression method benchmark levels vs. proportion of sample with 80% comprehension.
12 Figure 3. Decision tree for sample selection.
16 Figure 4. Benchmarks set using different predicted probabilities in the logistic regression method.
19 Figure 5. Illustration of sensitivity, specificity, and correct classification, for students who read above 80% comprehension or below 80% comprehension.
22 Figure 6. Logistic regression benchmarks by grade in two example datasets from Laos and Nepal.
25 Figure 7. Checklist of data-driven methods to set fluency benchmarks.
29 Figure B1. Cumulative distributions of ORF and reading comprehension.
30 Figure B2. Itemized reading comprehension score for students with a positive ORF.
31 Figure B3. Mean comprehension % scores for each ORF category.
36 Figure C1. Overview of steps for setting data-driven fluency benchmarks.
Tables
3 Table 1. Datasets used in Analysis Report.
13 Table 2. Checks to conduct before beginning benchmark analyses.
20 Table 3. Comparing strengths and weakness of four approaches to fluency benchmarking.
23 Table 4. Illustration of two alternative approaches to setting benchmarks and targets for the same population.
GUIDANCE NOTE SETTING DATA-DRIVEN ORAL READING FLUENCY BENCHMARKS | iii
Introduction This document provides guidance on how to use data to set benchmarks (standards of proficiency) in oral reading fluency. The guidance addresses the goals of benchmarking, considerations for the design of assessment instruments, recommended sample characteristics, and a discussion about data analysis approaches. These elements are critical inputs into decisions about the level of benchmark and the targets for the proportion of students expected to reach the benchmark in each grade. This guidance note will be useful for technical staff in education ministries and in orga-nizations supporting governments with the process of setting oral reading fluency benchmarks. We anticipate updates to this guidance as more data become available and more analyses are completed.
Why Oral Reading Fluency Benchmarking?
In the early grade reading field, oral reading fluency has become an important and prevalent mea-sure of progress toward improved reading skills, especially in contexts where reading levels are low. There are two key arguments for the widespread use of fluency in this way. First, reading proficiency in the early grades is defined as reading fluently and with comprehension. Thus, fluency itself is a key component of reading proficiency. It also acts as a reasonable proxy for the other component—com-prehension (Abadzi, 2011; Fuchs et al., 2001), which can be difficult to measure directly (Sweet & Snow, 2003). Second, fluency is a more sensitive measure than comprehension for beginner readers, which is particularly relevant for contexts with low levels of reading outcomes where a greater proportion of students are in the early stages of reading development. The Early Grade Reading Assessment (EGRA) includes both an oral reading fluency and a comprehension measure and has become the most preva-lent tool to measure early grade reading outcomes in developing countries.
Tracking progress toward improving oral reading fluency levels has typically involved assessing student fluency against a benchmark, such as reading 40 correct words per minute (cwpm) in Grade 2. This process of benchmark setting gives policy makers an opportunity to define proficiency in fluency by grade, and thus provide a goal for teachers, parents, schools, and the school system as a whole.
Benchmarks also result in a count of the number (or proportion) of students with reading proficiency. Counts are more readily interpreted, especially by non-experts, and can be summed across contexts to measure progress internationally. However, the process of monitoring counts above a benchmark has the disadvantage of losing information. Such monitoring does not provide information on students
GUIDANCE NOTE SETTING DATA-DRIVEN ORAL READING FLUENCY BENCHMARKS | 1
INTRODUCTION | WHY ORAL READING FLUENCY BENCHMARKING?
who have not yet reached the benchmark but are nevertheless making progress with their reading. This is particularly problematic where such students are in the majority because reading achievement is low and/or benchmarks are ambitious.
Approach to Oral Reading Fluency BenchmarkingThe most common approach to fluency benchmarking is to statistically determine the fluency level at which students can read with comprehension. Typically, “reading with comprehension” is defined as being able to correctly answer 80% of comprehension questions about a reading passage (i.e., 4 out of 5 on most EGRAs). This method of setting fluency benchmarks is based on the premise that reading fluently is a prerequisite for reading with comprehension and that there is a strong relation-ship between fluency and comprehension in most languages for which data have been analyzed. This approach to benchmarking fluency against comprehension is the basis of the methods ad-dressed in this guidance note, which examines commonly used benchmarking methods and offers new methods for consideration.
Before describing these methods, we note that other approaches to fluency benchmarking are pos-sible. One such approach involves setting fluency benchmarks at a level that is predictive of later proficiency on reading assessments. This approach would involve collecting longitudinal reading data on a cohort of students and, for example, assessing the levels of fluency in Grades 1 and 2 that are associated with proficient reading with comprehension in Grades 3 and 4. This method is not commonly used because such longitudinal data are rare in many low- and middle-income countries, and it requires multi-year studies.
Another approach is to assess fluency levels in readers judged to be proficient (for example students in a higher grade) and use the median fluency of that sample as the benchmark. A sample of “proficient readers” could include students from a higher grade (e.g., at the end of primary school, where reading fluency of basic passages tends to plateau) whose reading fluency of basic passages is no longer in-creasing significantly. This approach gives an indication of the typical fluency level of a proficient reader in that language, but once again relies on additional data that are not always available. Methods to set such benchmarks have not been widely used or formalized, and we will not address them in this note.
Data Analysis Supporting this Guidance NoteThe guidance offered in this document is based on findings from the report “Data-Driven Methods for Setting Reading Proficiency Benchmarks” (www.roomtoread.org/FluencyBenchmarkingAnalysisReport2018), which used Room to Read and RTI International reading assessment data from nine languages across seven countries. We refer to the report as “the Analysis Report” in this text. In all seven countries, data were collected using the oral passage reading fluency and reading comprehension tasks of EGRAs that were adapted for the following languages: Bangla (Bangladesh), Hindi (India), Khmer (Cambodia), Lao (Laos), Nepali (Nepal), Sepedi (South Africa), Sinhala (Sri Lanka), Tamil (Sri Lanka), and Xitsonga (South Africa). A total of 13 data collection exercises, with parallel administration of multiple passages and
GUIDANCE NOTE SETTING DATA-DRIVEN ORAL READING FLUENCY BENCHMARKS | 2
WHY ORAL READING FLUENCY BENCHMARKING?
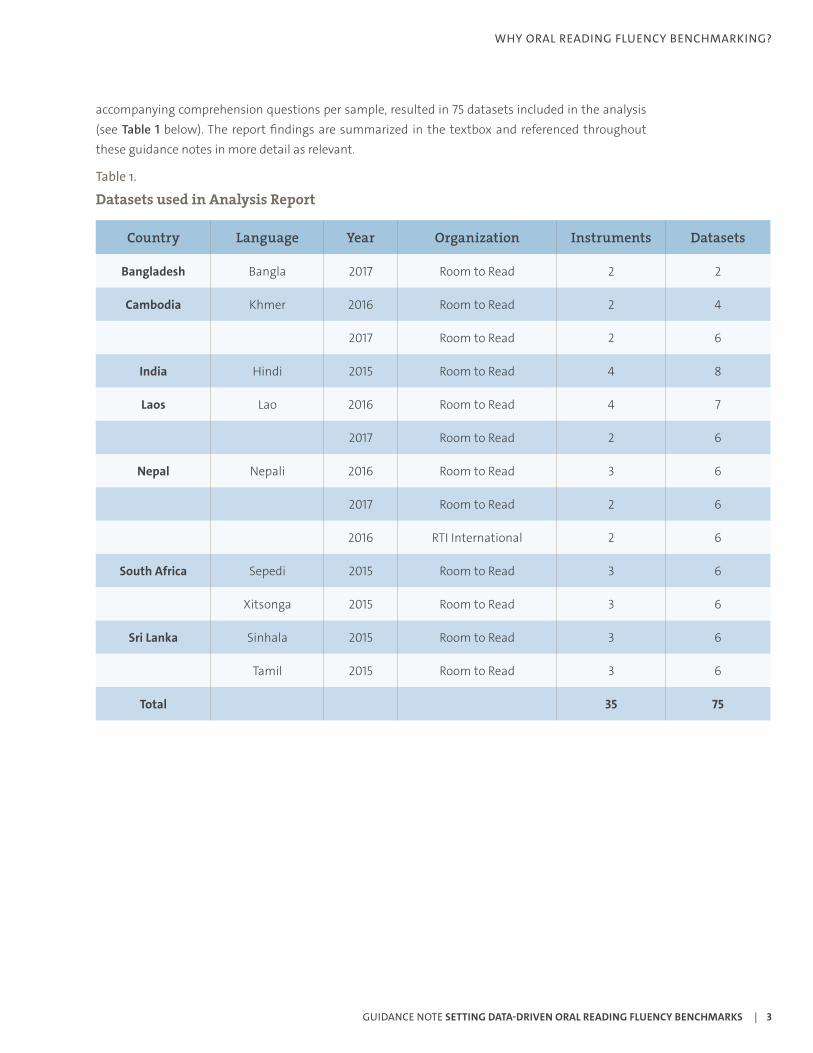
accompanying comprehension questions per sample, resulted in 75 datasets included in the analysis (see Table 1 below). The report findings are summarized in the textbox and referenced throughout these guidance notes in more detail as relevant.
Table 1.
Datasets used in Analysis Report
Country Language Year Organization Instruments Datasets
Bangladesh Bangla 2017 Room to Read 2 2
Cambodia Khmer 2016 Room to Read 2 4
2017 Room to Read 2 6
India Hindi 2015 Room to Read 4 8
Laos Lao 2016 Room to Read 4 7
2017 Room to Read 2 6
Nepal Nepali 2016 Room to Read 3 6
2017 Room to Read 2 6
2016 RTI International 2 6
South Africa Sepedi 2015 Room to Read 3 6
Xitsonga 2015 Room to Read 3 6
Sri Lanka Sinhala 2015 Room to Read 3 6
Tamil 2015 Room to Read 3 6
Total 35 75
GUIDANCE NOTE SETTING DATA-DRIVEN ORAL READING FLUENCY BENCHMARKS | 3
WHY ORAL READING FLUENCY BENCHMARKING?
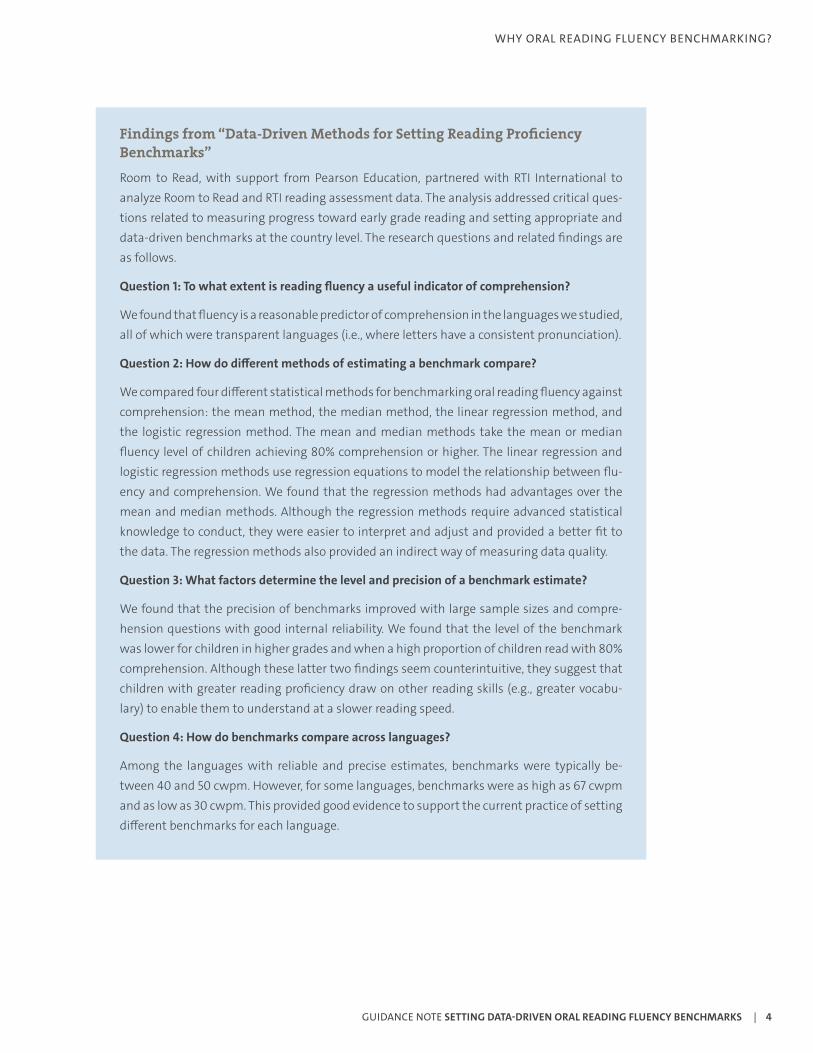
Findings from “Data-Driven Methods for Setting Reading Proficiency Benchmarks”
Room to Read, with support from Pearson Education, partnered with RTI International to analyze Room to Read and RTI reading assessment data. The analysis addressed critical ques-tions related to measuring progress toward early grade reading and setting appropriate and data-driven benchmarks at the country level. The research questions and related findings are as follows.
Question 1: To what extent is reading fluency a useful indicator of comprehension?
We found that fluency is a reasonable predictor of comprehension in the languages we studied, all of which were transparent languages (i.e., where letters have a consistent pronunciation).
Question 2: How do different methods of estimating a benchmark compare?
We compared four different statistical methods for benchmarking oral reading fluency against comprehension: the mean method, the median method, the linear regression method, and the logistic regression method. The mean and median methods take the mean or median fluency level of children achieving 80% comprehension or higher. The linear regression and logistic regression methods use regression equations to model the relationship between flu-ency and comprehension. We found that the regression methods had advantages over the mean and median methods. Although the regression methods require advanced statistical knowledge to conduct, they were easier to interpret and adjust and provided a better fit to the data. The regression methods also provided an indirect way of measuring data quality.
Question 3: What factors determine the level and precision of a benchmark estimate?
We found that the precision of benchmarks improved with large sample sizes and compre-hension questions with good internal reliability. We found that the level of the benchmark was lower for children in higher grades and when a high proportion of children read with 80% comprehension. Although these latter two findings seem counterintuitive, they suggest that children with greater reading proficiency draw on other reading skills (e.g., greater vocabu-lary) to enable them to understand at a slower reading speed.
Question 4: How do benchmarks compare across languages?
Among the languages with reliable and precise estimates, benchmarks were typically be-tween 40 and 50 cwpm. However, for some languages, benchmarks were as high as 67 cwpm and as low as 30 cwpm. This provided good evidence to support the current practice of setting different benchmarks for each language.
GUIDANCE NOTE SETTING DATA-DRIVEN ORAL READING FLUENCY BENCHMARKS | 4
WHY ORAL READING FLUENCY BENCHMARKING?
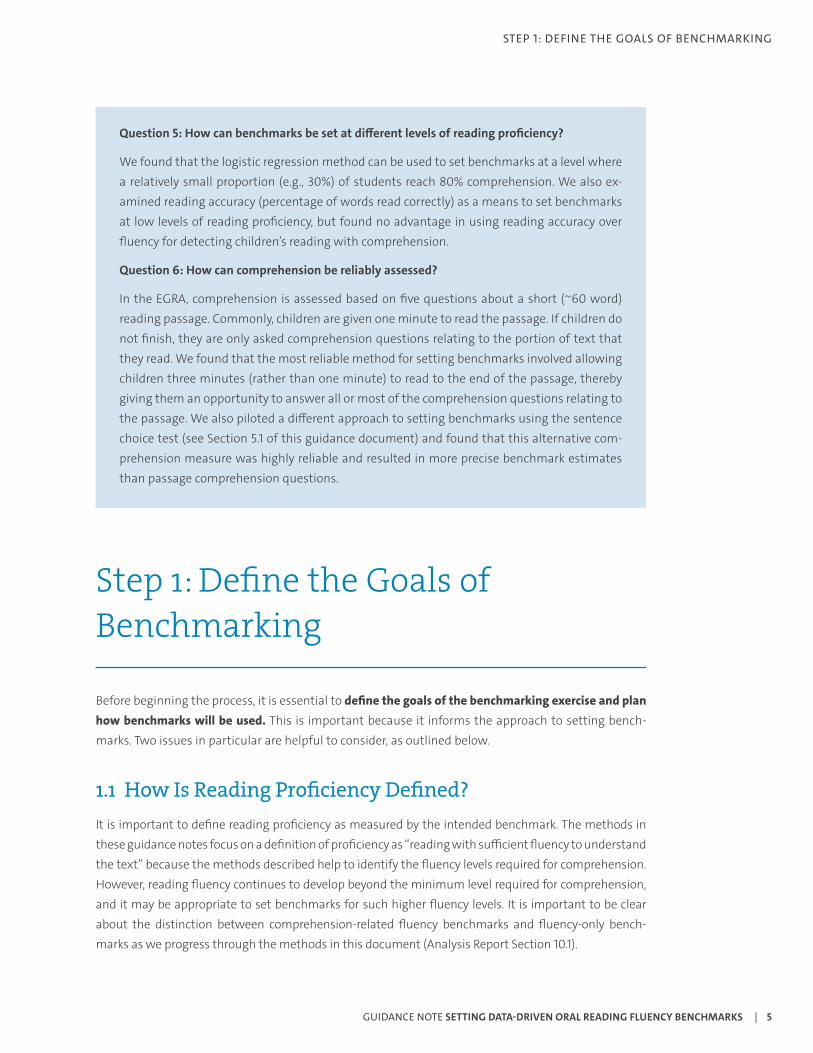
Question 5: How can benchmarks be set at different levels of reading proficiency?
We found that the logistic regression method can be used to set benchmarks at a level where a relatively small proportion (e.g., 30%) of students reach 80% comprehension. We also ex-amined reading accuracy (percentage of words read correctly) as a means to set benchmarks at low levels of reading proficiency, but found no advantage in using reading accuracy over fluency for detecting children’s reading with comprehension.
Question 6: How can comprehension be reliably assessed?
In the EGRA, comprehension is assessed based on five questions about a short (~60 word) reading passage. Commonly, children are given one minute to read the passage. If children do not finish, they are only asked comprehension questions relating to the portion of text that they read. We found that the most reliable method for setting benchmarks involved allowing children three minutes (rather than one minute) to read to the end of the passage, thereby giving them an opportunity to answer all or most of the comprehension questions relating to the passage. We also piloted a different approach to setting benchmarks using the sentence choice test (see Section 5.1 of this guidance document) and found that this alternative com-prehension measure was highly reliable and resulted in more precise benchmark estimates than passage comprehension questions.
Step 1: Define the Goals of Benchmarking
Before beginning the process, it is essential to define the goals of the benchmarking exercise and plan how benchmarks will be used. This is important because it informs the approach to setting bench-marks. Two issues in particular are helpful to consider, as outlined below.
1.1 How Is Reading Proficiency Defined?It is important to define reading proficiency as measured by the intended benchmark. The methods in these guidance notes focus on a definition of proficiency as “reading with sufficient fluency to understand the text” because the methods described help to identify the fluency levels required for comprehension. However, reading fluency continues to develop beyond the minimum level required for comprehension, and it may be appropriate to set benchmarks for such higher fluency levels. It is important to be clear about the distinction between comprehension-related fluency benchmarks and fluency-only bench-marks as we progress through the methods in this document (Analysis Report Section 10.1).
GUIDANCE NOTE SETTING DATA-DRIVEN ORAL READING FLUENCY BENCHMARKS | 5
STEP 1: DEFINE THE GOALS OF BENCHMARKING

1.2 How Will Benchmarks Be Used?The methods described in this document typically determine a range of fluency levels at which bench-marks can be set. This implies that there is a choice of benchmarks from a range of values. This choice can be informed by the intended use of a benchmark. For example, if the intention is to set an ambi-tious benchmark designed to inspire performance improvements, a higher benchmark value may be chosen. If benchmarks will be used to identify a group of students requiring additional instructional support, a lower value may be appropriate.
Benchmarks are often used in conjunction with targets representing the proportion of students in each grade who are expected to reach the benchmark. It is most useful to consider the approach to target setting in the light of methods described below. In Step 8, we return to the issues of benchmark-ing goals and setting targets after detailing the analytical methods for setting benchmarks.
Step 2: Define the Target Population
It is important to define the target population(s) for which the benchmark will be set, and the data being used to set the benchmark should represent the target population. Linguistic characteristics have a significant influence on the comprehension-proxy relationship, and as noted earlier, our find-ings show that fluency benchmarks differ significantly from one language to another (Analysis Report Section 4.3). It is essential that a separate benchmarking exercise be carried out for each language.
Several key language-related questions should be addressed when setting benchmarks:
• Is the language of the EGRA the language of instruction in schools?
• If not, is the language of assessment taught as a secondary language in schools?
• What are the mother-tongue languages spoken by students and in what proportion?
• What are the oral language skills of students in the language of assessment and the language of instruction?
Benchmarks may also differ depending on whether students are being assessed in their mother tongue (L1) or in a second language (L2). During benchmarking exercises, the first language of each student should be recorded. If two regions of the country have the same language of assessment but different mother tongues, benchmarking results may be quite different. This contextual fac-tor should be used to interpret progress in the two regions. Based on results of the benchmarking exercise, consider setting different benchmarks for regions with different mother tongues and levels of oral language skills in the language of assessment.
Other factors—such as socioeconomic status and school quality—may influence the number of stu-dents reaching a benchmark (i.e., target), but should not influence the level of the actual benchmark.
GUIDANCE NOTE SETTING DATA-DRIVEN ORAL READING FLUENCY BENCHMARKS | 6
STEP 2: DEFINE THE TARGET POPULATION
This recommendation is based on an important assumption in benchmark setting (which should be tested with data in each context), that the relationship between fluency and comprehension is reasonably stable across different populations within the same language of assessment. That is, the shape of the curve on a graph of fluency vs. comprehension is roughly the same shape from region to region. Thus, a high-achieving sample may be higher up on the curve than a lower-achieving sample, but the shape of the curve is the same for both samples. An important implication of this assump-tion is that there is no requirement for a benchmarking sample to be nationally representative. The sample must only accurately estimate the shape of the fluency-comprehension curve.
Based on this assumption, we recommend setting the same benchmarks for different populations that have the same language characteristics (i.e., the same mother tongue and language of instruc-tion). If 30 cwpm represents a meaningful level of proficiency in urban areas, this figure should also represent the same level of proficiency in rural areas. As per the discussion in Analysis Report Section 4.1, it may be appropriate to set different targets between regions, but not different benchmarks. Different grades may warrant different benchmarks if the reading proficiency goal varies by grade.
Step 3: Select Assessment Instruments
It is important to select and evaluate assessment instruments carefully. Benchmarks will only be reli-able and valid if measures of reading fluency and comprehension are themselves reliable and valid. It is particularly challenging to assess comprehension reliably (Sweet & Snow, 2003), an observation that in part motivates the focus on oral reading fluency when setting benchmarks. Recommendations for benchmarking fluency against comprehension are based on the assumption that it is more feasible to assess comprehension reliably on one occasion with a relatively small sample during the benchmark-ing process than it is to monitor comprehension reliably across the whole target population. Below we outline the steps required to select and assess reliable instruments for this process.
3.1 Selecting Tools to Assess Fluency and ComprehensionThe EGRA Toolkit recommends assessing oral reading fluency and comprehension with a short passage of connected text and approximately five comprehension questions about the passage (RTI International, 2015). It can be challenging to develop reliable comprehension questions in this way (see Analysis Report Section 4.2). Another disadvantage is that the same tool is used to measure two different constructs, artificially inflating the degree to which the different constructs are correlated. For example, if a pas-sage relays a story about a computer, students who have familiarity with computers will likely read the
GUIDANCE NOTE SETTING DATA-DRIVEN ORAL READING FLUENCY BENCHMARKS | 7
STEP 3: SELECT ASSESSMENT INSTRUMENTS
passage more fluently and understand more of the passage. In such a case, familiarity with content will be part of the reason why fluency and comprehension are related.
A more effective approach is to assess fluency and comprehension with two independent measures. One option is to use the sentence choice test. The test involves students’ reading 20 sentences such as “A tiger lives in the forest” and indicating whether they thought the sentence was true or false. Each true sentence has a matching false sentence: “A tiger lives in a house.” The order of sentences in the tool is determined randomly so that pairs of sentences are not presented one after the other. Students are re-quired to give the correct answer to both sentences in a pair in order to receive credit for a correct answer. Thus, scores range from 0–10 correct pairs of answers. Students qualify as having 80% comprehension if they give correct answers for 8 out of the 10 pairs of sentences.
Our analysis (Analysis Report Section 6.1) showed that the sentence choice test scores correlated strongly with the scores on passage-related comprehension questions, had a higher internal reliabil-ity, and led to more precise benchmarks than the passage-related questions approach. The following sections consider the passage-related questions (for which there are more data available and more experience to draw from).
3.2 Assess the Difficulty Level of the PassageMore difficult reading passages are typically read more slowly and may be harder to understand. It is likely that passage difficulty will influence the fluency rate at which students can read with comprehen-sion. When using different passages in benchmarking exercises (with the same students, in different grades or over time) it is useful to compare the passage difficulty levels. We recommend documenting characteristics of passage difficulty including: grade level of vocabulary, number of unique and repeated words, average word and sentence length, and syllable complexity—whether the syllable ends in a vowel (an open syllable) or a consonant (closed syllable), and the presence of consonant clusters. Readability formulae can help formalize this process. Example readability formulae are given in Annex A.
3.3 Ensure Reliable Comprehension QuestionsInternal consistency (reliability) is one measure of whether comprehension questions are of high qual-ity. Cronbach’s alpha statistic gives a measure of internal consistency. If the reliability is low, it may be because of poor comprehension questions. Poor-quality questions can usually be identified by investi-gating questions with unusually high or low percentages of students answering correctly. If the question is easier or harder than intended, consider revising or replacing it. Additionally, if there is a low correla-tion between the question and the other four questions (item-rest correlation < 0.3), it may indicate a poor comprehension question. This is another indication that test developers should review the suspect comprehension question(s) to see if they can be improved or rewritten. A commonly accepted threshold for acceptable internal consistency of the assessment tool as a whole (measured by Cronbach’s alpha) is 0.7 (Tavakol & Dennick, 2011).
Figure 1 shows the relationship between the reliability of comprehension questions and the precision of benchmark estimates. This graph is based on fluency benchmark estimates generated by the logistic regression method calculated from 72 data sets in 9 languages. We calculate confidence intervals for the
GUIDANCE NOTE SETTING DATA-DRIVEN ORAL READING FLUENCY BENCHMARKS | 8
STEP 3: SELECT ASSESSMENT INSTRUMENTS
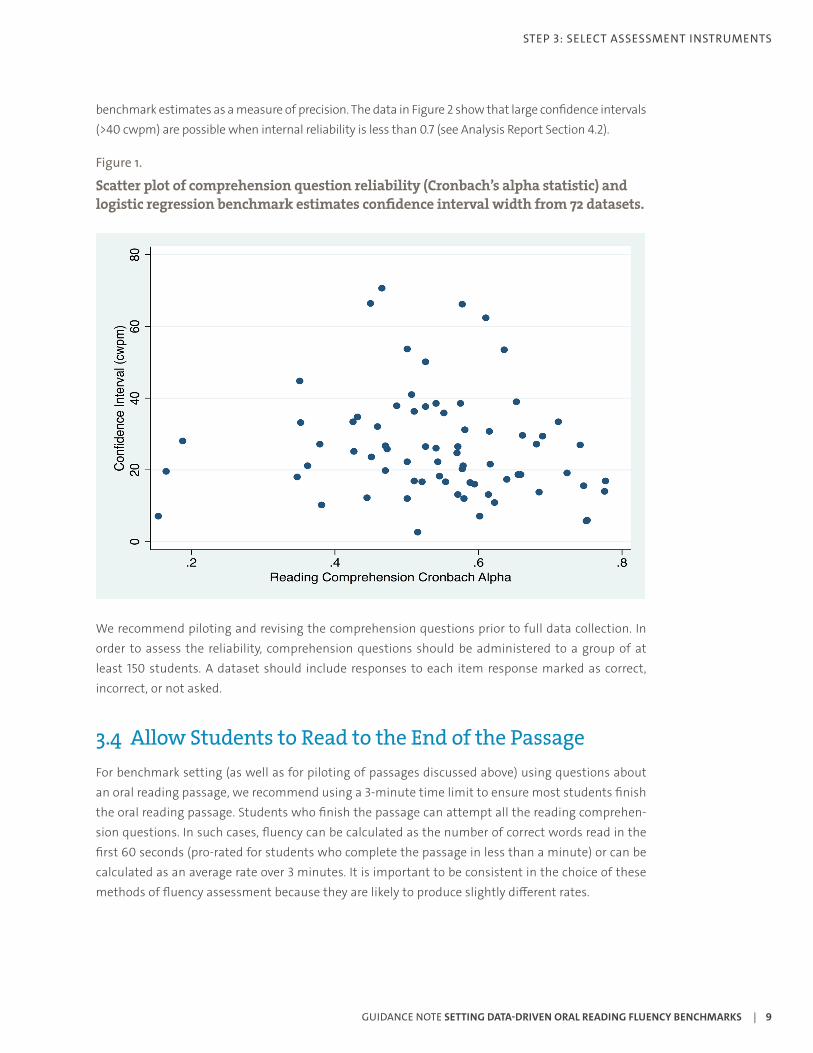
benchmark estimates as a measure of precision. The data in Figure 2 show that large confidence intervals (>40 cwpm) are possible when internal reliability is less than 0.7 (see Analysis Report Section 4.2).
Figure 1.
Scatter plot of comprehension question reliability (Cronbach’s alpha statistic) and logistic regression benchmark estimates confidence interval width from 72 datasets.
We recommend piloting and revising the comprehension questions prior to full data collection. In order to assess the reliability, comprehension questions should be administered to a group of at least 150 students. A dataset should include responses to each item response marked as correct, incorrect, or not asked.
3.4 Allow Students to Read to the End of the PassageFor benchmark setting (as well as for piloting of passages discussed above) using questions about an oral reading passage, we recommend using a 3-minute time limit to ensure most students finish the oral reading passage. Students who finish the passage can attempt all the reading comprehen-sion questions. In such cases, fluency can be calculated as the number of correct words read in the first 60 seconds (pro-rated for students who complete the passage in less than a minute) or can be calculated as an average rate over 3 minutes. It is important to be consistent in the choice of these methods of fluency assessment because they are likely to produce slightly different rates.
GUIDANCE NOTE SETTING DATA-DRIVEN ORAL READING FLUENCY BENCHMARKS | 9
STEP 3: SELECT ASSESSMENT INSTRUMENTS
Our analysis suggests (Analysis Report Section 6.2) that benchmarks set from passages read with a 1-minute time limit can be inaccurate if the comprehension score is calculated as the percentage of the total number of questions answered correctly (regardless of how many were attempted). When using a 1-minute time limit for reading passages in a benchmark setting exercise, we recom-mend calculating reading comprehension as a percentage of questions attempted. For example, if a student attempts 4 out of 5 comprehension questions in a 1-minute time limit and answers 2 of the questions correctly, the student’s comprehension score should be 50% (of 4) rather than 40% (of 5).
3.5 Use More Than One Reading Passage to Set BenchmarksBenchmarks differ when different EGRA passages are used. The impact of passage-specific variabil-ity on benchmarks can be reduced by using more than one reading passage to set benchmarks. If benchmarks from different passages are similar in value, a final figure can be selected from the range of values produced by the passages (for example a mean of all values). If benchmarks from different passages produce significantly different results, consider revising the tool and retesting, or using the tool with the best reliability statistics.
Step 4: Select a Sample
Benchmarking samples must be selected carefully to produce a precise benchmark estimate with relevance to the target population. The key characteristics of a good sample are:
• Same language of instruction as target population • Similar proportion of the sample and target population have the language of assessment as their mother tongue
• Sufficient size (a minimum of 150 students, but a sample of more students produces more precise estimates)
• A good representation of high- and low-performing students.
Issues of language were discussed in Step 2. We now provide additional details on size and perfor-mance levels of the sample.
4.1 Use a Large Enough SampleIn general, the larger the sample, the more precise are the fluency benchmark estimates. Our analyses show that estimates were unreliable with sample sizes of fewer than 150 students (Analysis Report Section 4.1). Most benchmarks set with a sample size of between 200 and 500 had reasonable preci-sion (roughly +/- 5 cwpm). The most precise benchmarks, with confidence intervals of +/- 2 cwpm, were derived from a sample of over 8,000 students. Given these results, 150 should be considered the absolute minimum sample size; however, the required sample size depends on the distribution of the data, as explained further below.
GUIDANCE NOTE SETTING DATA-DRIVEN ORAL READING FLUENCY BENCHMARKS | 10
STEP 4: SELECT A SAMPLE
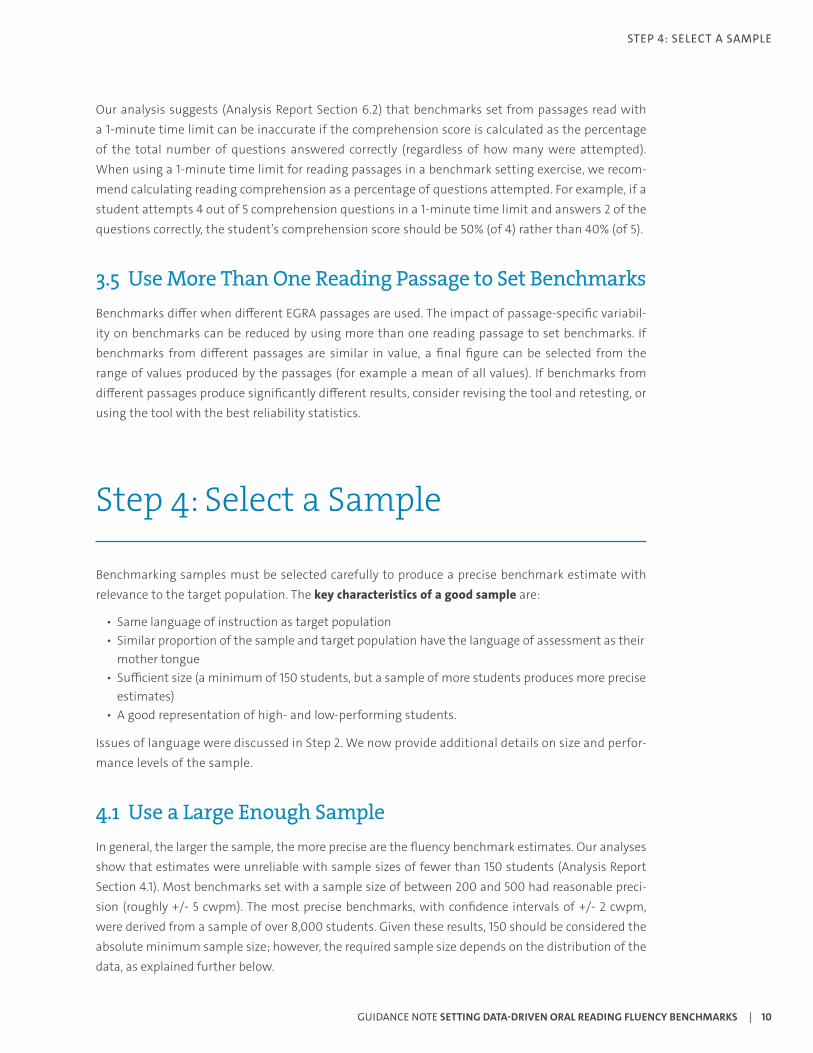
4.2 Include a Mixture of High- and Low-Performing StudentsFigure 2 below demonstrates how the benchmark estimate changes based on the proportion of the sample achieving 80% comprehension. The estimated benchmark is lower when a greater number of students read with comprehension. This relationship likely results from the fact that high-achieving samples are able to read at a lower fluency level by drawing on other language skills, such as better vocabulary. (See Analysis Report 10.1 for a similar relationship between benchmarks and grade level. See Analysis Report Section 4.1 for more detail on these relationships.) Based on this analysis, we recom-mend aiming for approximately 20%–50% of the sample reading with comprehension. This will result in a stable benchmark that will apply to a more general population. To reach this percentage, we recom-mend targeting populations of students who demonstrate a mix of both high and low performance.
Figure 2.
Logistic regression method benchmark levels vs. proportion of sample with 80% comprehension.
If a large majority of students in the sample are scoring zero, there are a few recommendations. First, make sure that the instrument is grade-appropriate; difficult texts may be responsible for high num-bers of zero scores. Second, consider sampling higher grades (or schools with higher achievement levels) to set reading proficiency benchmarks for lower grades to work towards. However, if only a small percentage of students (e.g., < 10%) of students are likely to read with fluency and comprehen-sion before the end of the grade, it may not be appropriate to use reading fluency and comprehension for setting benchmarks. Instead, consider using a benchmark of foundational reading skills, such as identifying syllable sounds or familiar words.
GUIDANCE NOTE SETTING DATA-DRIVEN ORAL READING FLUENCY BENCHMARKS | 11
STEP 4: SELECT A SAMPLE
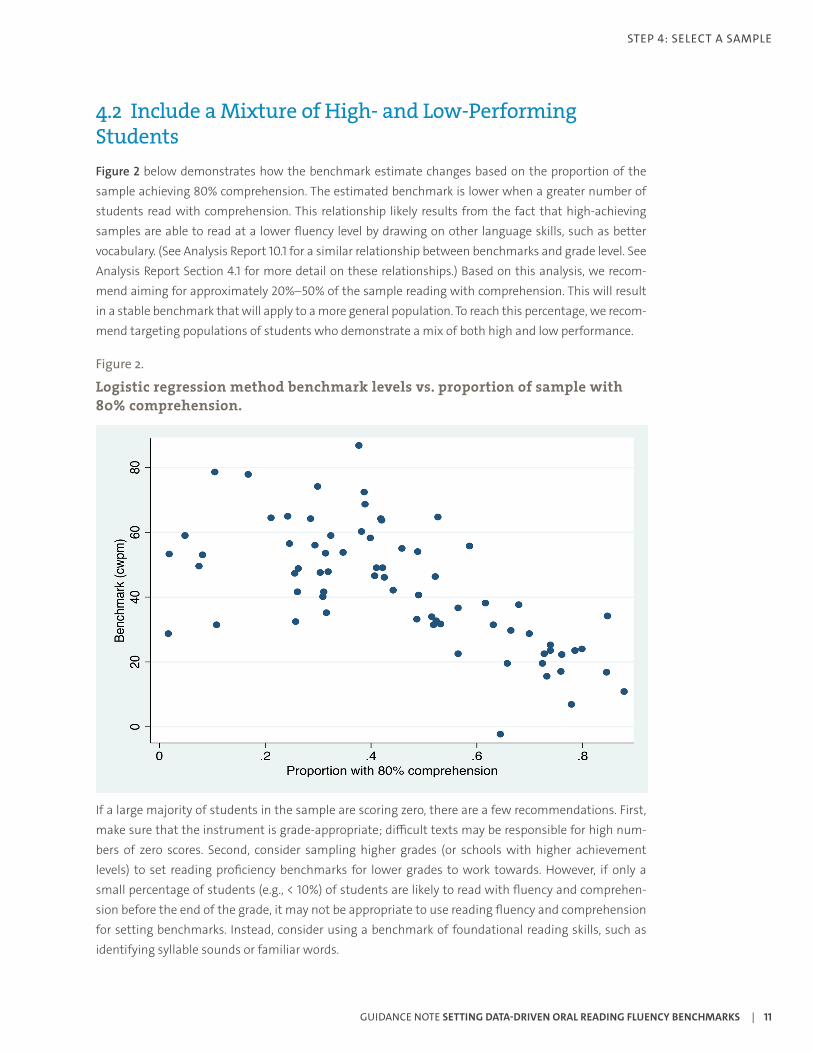
4.3 Use More Than One Sample to Set BenchmarksOur analyses found that benchmark estimates vary somewhat among different EGRA administrations and different samples. A recommended approach is to conduct benchmarking exercises with more than one sample. The final choice of benchmark can be selected from the range of values produced by the different samples (for example, a mean of all values). This approach is similar to that outlined above for benchmarks derived from different passages.
Decisions related to the sample are illustrated in Figure 3.
Figure 3.
Decision tree for sample selection.
* There are varying approaches to measuring reliability, and thresholds for acceptable reliability may vary based on method, number of assessment items, etc.
YES
YES
YES
YES
NO
NO
NO
NO
NO
Is the assessment language the same language for which the
benchmark is being set? Generate additional samples
Generate additional samples
Generate additional samples
Generate additional samples
Generate additional samples
Does sample have a mix of high and low performing students with 20-50% scoring 80%+ on
comprehension measure?
• Recalibrate instrument based on actual performance levels • Increase grade level of respondents • Use lower-level sub-tasks
• Develop new instruments • Pilot and test for reliability
Do you have more than one dataset available
for analysis?
Is the sample size 150+, excluding oral reading fluency zero scores?
Is the reliability of comprehension
measure sufficient?*
GUIDANCE NOTE SETTING DATA-DRIVEN ORAL READING FLUENCY BENCHMARKS | 12
STEP 4: SELECT A SAMPLE
Step 5: Run Pre-Analysis Checks on the Data
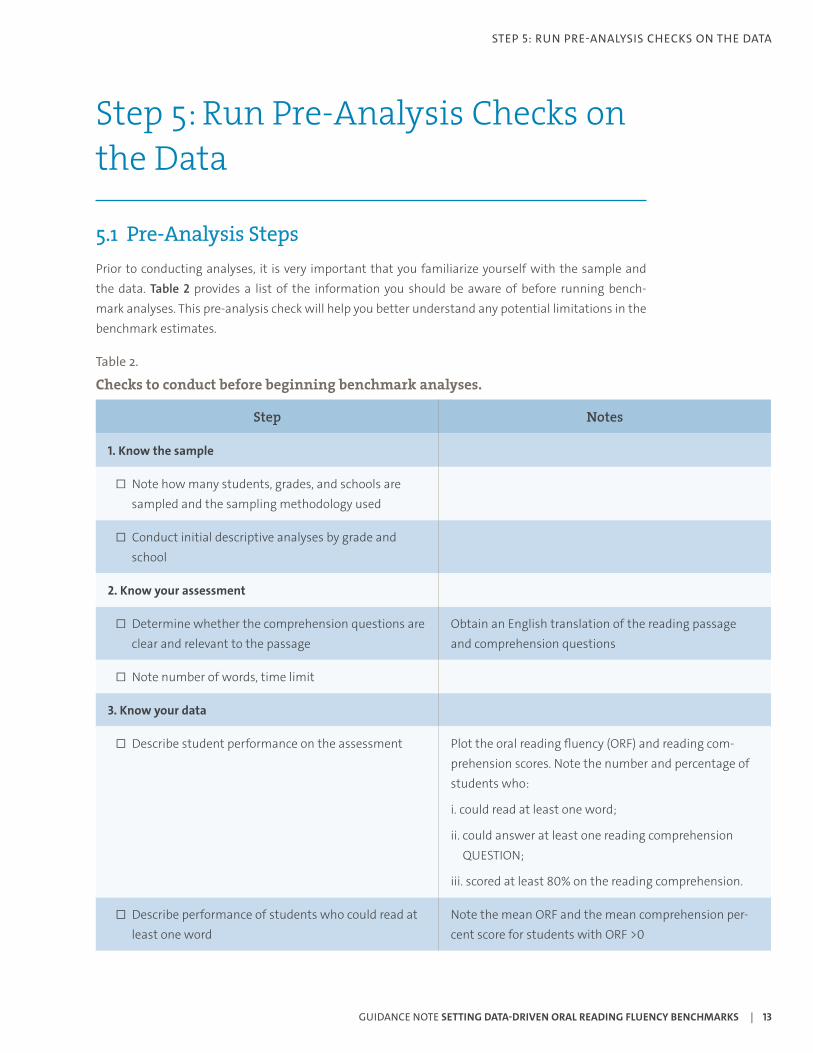
5.1 Pre-Analysis StepsPrior to conducting analyses, it is very important that you familiarize yourself with the sample and the data. Table 2 provides a list of the information you should be aware of before running bench-mark analyses. This pre-analysis check will help you better understand any potential limitations in the benchmark estimates.
Table 2.
Checks to conduct before beginning benchmark analyses.
Step Notes
1. Know the sample
□ Note how many students, grades, and schools are sampled and the sampling methodology used
□ Conduct initial descriptive analyses by grade and school
2. Know your assessment
□ Determine whether the comprehension questions are clear and relevant to the passage
Obtain an English translation of the reading passage and comprehension questions
□ Note number of words, time limit
3. Know your data
□ Describe student performance on the assessment Plot the oral reading fluency (ORF) and reading com-prehension scores. Note the number and percentage of students who:
i. could read at least one word;
ii. could answer at least one reading comprehension QUESTION;
iii. scored at least 80% on the reading comprehension.
□ Describe performance of students who could read at least one word
Note the mean ORF and the mean comprehension per-cent score for students with ORF >0
GUIDANCE NOTE SETTING DATA-DRIVEN ORAL READING FLUENCY BENCHMARKS | 13
STEP 5: RUN PRE-ANALYSIS CHECKS ON THE DATA
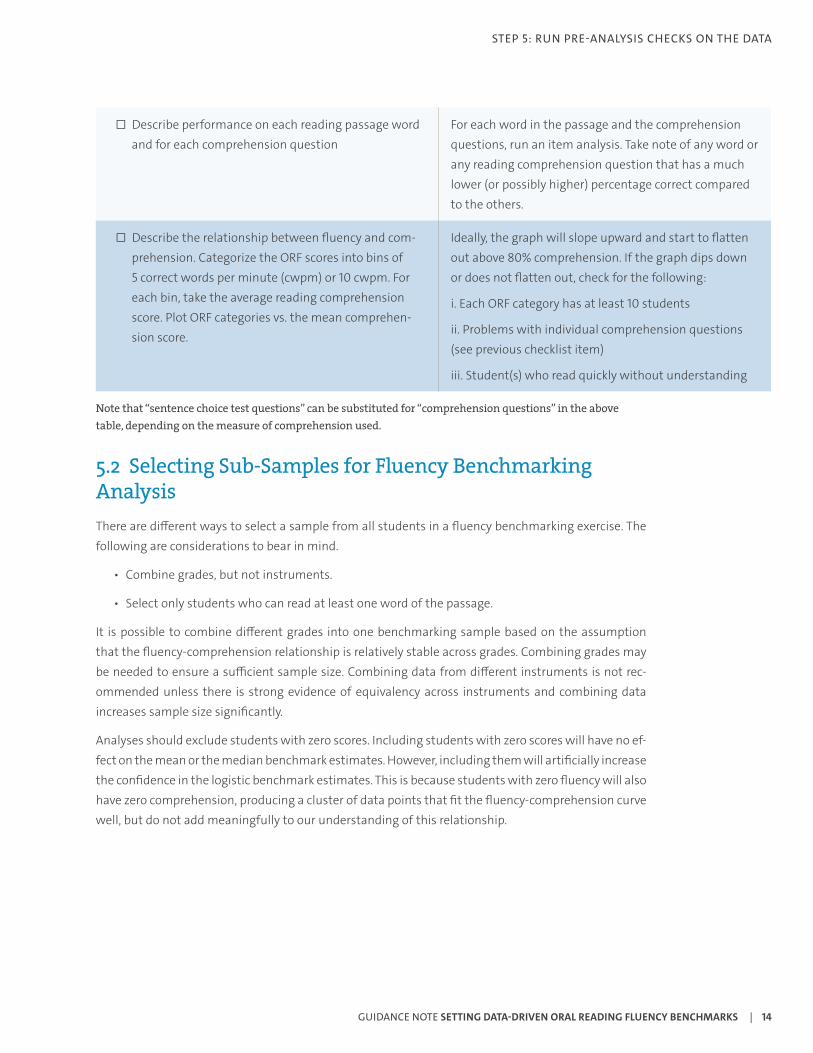
□ Describe performance on each reading passage word and for each comprehension question
For each word in the passage and the comprehension questions, run an item analysis. Take note of any word or any reading comprehension question that has a much lower (or possibly higher) percentage correct compared to the others.
□ Describe the relationship between fluency and com-prehension. Categorize the ORF scores into bins of 5 correct words per minute (cwpm) or 10 cwpm. For each bin, take the average reading comprehension score. Plot ORF categories vs. the mean comprehen-sion score.
Ideally, the graph will slope upward and start to flatten out above 80% comprehension. If the graph dips down or does not flatten out, check for the following:
i. Each ORF category has at least 10 students
ii. Problems with individual comprehension questions (see previous checklist item)
iii. Student(s) who read quickly without understanding
Note that “sentence choice test questions” can be substituted for “comprehension questions” in the above table, depending on the measure of comprehension used.
5.2 Selecting Sub-Samples for Fluency Benchmarking Analysis There are different ways to select a sample from all students in a fluency benchmarking exercise. The following are considerations to bear in mind.
• Combine grades, but not instruments.
• Select only students who can read at least one word of the passage.
It is possible to combine different grades into one benchmarking sample based on the assumption that the fluency-comprehension relationship is relatively stable across grades. Combining grades may be needed to ensure a sufficient sample size. Combining data from different instruments is not rec-ommended unless there is strong evidence of equivalency across instruments and combining data increases sample size significantly.
Analyses should exclude students with zero scores. Including students with zero scores will have no ef-fect on the mean or the median benchmark estimates. However, including them will artificially increase the confidence in the logistic benchmark estimates. This is because students with zero fluency will also have zero comprehension, producing a cluster of data points that fit the fluency-comprehension curve well, but do not add meaningfully to our understanding of this relationship.
GUIDANCE NOTE SETTING DATA-DRIVEN ORAL READING FLUENCY BENCHMARKS | 14
STEP 5: RUN PRE-ANALYSIS CHECKS ON THE DATA
Step 6: Select an Analysis Method and Estimate Benchmarks
In this section, we describe three analytical approaches to setting fluency benchmarks: the mean, me-dian, and logistic regression methods. We use passage reading comprehension of 80% or higher as the indicator of proficient comprehension in the examples below. The methods are equally applicable to an indicator of 80% comprehension measured by the sentence choice test (Analysis Report Section 5.1).
The following provides an overview of methods. Annex B provides detailed step-by-step instructions for carrying these methods out using Stata software.
6.1 Mean BenchmarkTo obtain the mean benchmark, calculate the mean oral reading fluency (ORF) for all students who scored at least 80% on the comprehension subtask. Precision is given by 95% confidence intervals for the estimated mean, which are typically included in the output of most statistical software packages.
6.2 Median Benchmark To obtain the median benchmark, take the median ORF value of all students who scored at least 80% on the comprehension subtask. The 95% confidence intervals for the estimated median can be ob-tained using the sign-rank test,1 detailed in Annex B.
6.3 Logistic Regression BenchmarkThere are several possible approaches to fitting the data with regression models. It is a challenge to find models that fit data given that the comprehension measure typically has only six values (0–5). We found that linear, log-linear, and quadratic models do not fit these six data points well and that logistic regression models provide the best fit to the data.
Setting an ORF benchmark using the logistic regression approach requires more steps than the mean and the median approach. Below provides an overview of the steps that must be taken. A more de-tailed list of steps can be found in Annex B.
1. Create a binary variable by dividing the sample into two groups:
a. Those who scored at least 80% on the reading comprehension (RC80 = 1)
b. Those who scored less than 80% on the reading comprehension (RC80 = 0)
1 For more information on the sign rank test: www.ucl.ac.uk/ich/short-courses-events/about-stats-courses/stats-rm/Chapter_8_Content/confidence_interval_single_median/
GUIDANCE NOTE SETTING DATA-DRIVEN ORAL READING FLUENCY BENCHMARKS | 15
STEP 6: SELECT AN ANALYSIS METHOD AND ESTIMATE BENCHMARKS
2. Run a logistic regression model with RC80 as the outcome variable and ORF as the predictor. This analysis produces two fitted estimates: Beta (ß) and a constant (_con). From this output, obtain each observation’s predicted probability of scoring 80% reading comprehension and associated 95% upper and lower bound estimates. These steps are detailed in Annex B.
3. Note that the logistic regression method may produce unstable estimates if the sample is not large enough (see Section 6.1), with enough students scoring above and below 80% reading comprehension.
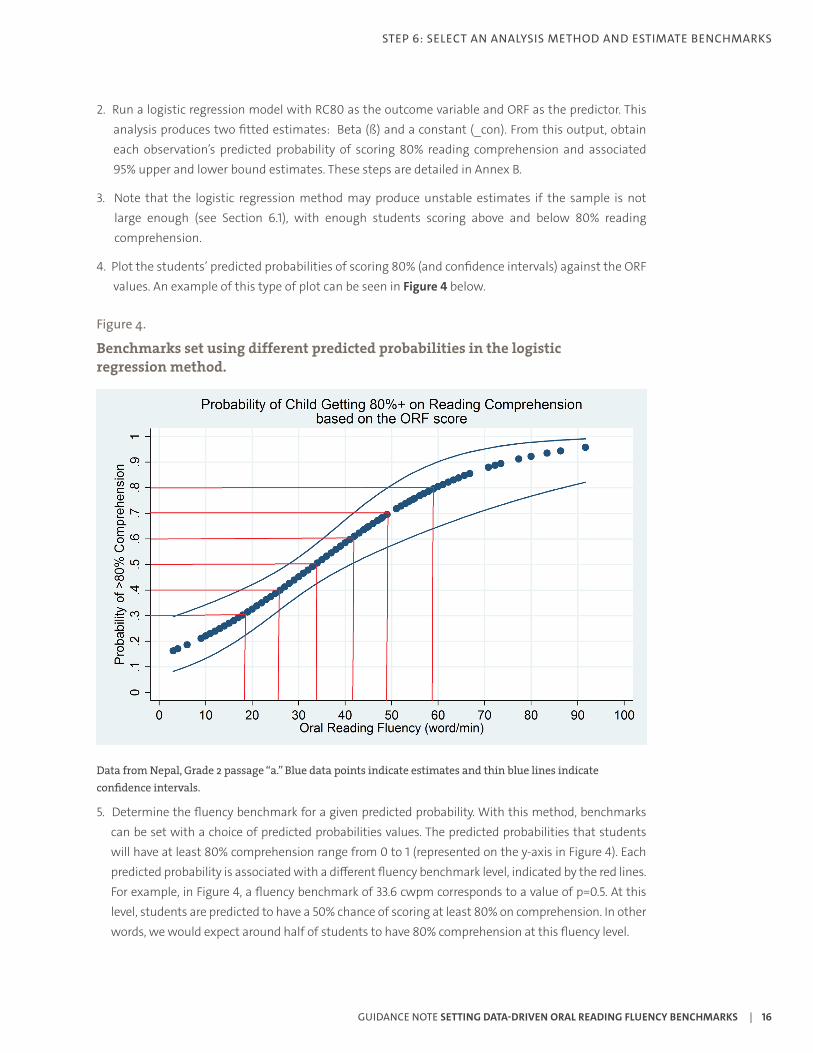
4. Plot the students’ predicted probabilities of scoring 80% (and confidence intervals) against the ORF values. An example of this type of plot can be seen in Figure 4 below.
Figure 4.
Benchmarks set using different predicted probabilities in the logistic regression method.
Data from Nepal, Grade 2 passage “a.” Blue data points indicate estimates and thin blue lines indicate confidence intervals.
5. Determine the fluency benchmark for a given predicted probability. With this method, benchmarks can be set with a choice of predicted probabilities values. The predicted probabilities that students will have at least 80% comprehension range from 0 to 1 (represented on the y-axis in Figure 4). Each predicted probability is associated with a different fluency benchmark level, indicated by the red lines. For example, in Figure 4, a fluency benchmark of 33.6 cwpm corresponds to a value of p=0.5. At this level, students are predicted to have a 50% chance of scoring at least 80% on comprehension. In other words, we would expect around half of students to have 80% comprehension at this fluency level.
GUIDANCE NOTE SETTING DATA-DRIVEN ORAL READING FLUENCY BENCHMARKS | 16
STEP 6: SELECT AN ANALYSIS METHOD AND ESTIMATE BENCHMARKS
6. The 95% confidence intervals can be determined from the graph by observing the points on the thin blue lines (indicating confidence intervals) that map onto the chosen predicted probability. For example, a predicted probability of 0.5 has an associated upper bound of 42 cwpm and a lower bound of 27 cwpm.
7. Finalize the predicted probability to use based on the following considerations:
a. What is the definition of reading proficiency (see Step 1)? Do the estimated benchmarks align with the definition of reading proficiency for this sample?
b. How will the benchmark be used (see Step 1)? Is the intended use appropriate to a benchmark set at the upper or lower end of the range of possible values, or something in the middle?
c. What is the precision of the benchmark estimate? In Figure 4, confidence intervals are wide (> +/- 10 cwpm) for predicted probabilities of 0.3 and less and predicted probabilities of 0.7 or more. This suggests that predicted probabilities of between 0.4 and 0.6 would be appropriate.
d. What is the proportion of students achieving 80% comprehension in the sample? The most precise estimates will involve predicted probabilities close to this proportion.
e. When setting comparable benchmarks (e.g., for two regions in a country or with two different instruments), estimates will be most easily compared if you use the same predicted prob-ability for both estimates.
Each of these methods has advantages and disadvantages that we will summarize after describing methods to evaluate benchmarks.
Step 7: Evaluate and Compare Benchmarks Methods
There are several ways to determine the quality of the benchmark estimates. The following questions are useful for reviewing benchmark estimates:
• Does the benchmark estimate seem reasonable? • Is the benchmark indicative of comprehension? • How precise is the benchmark estimate? • How do these three methods compare with each other? Do they provide similar benchmarks or are they significantly different?
• How does each method compare across grades and across different passages (if applicable)?
The rest of this section addresses these questions before drawing conclusions about the methods.
GUIDANCE NOTE SETTING DATA-DRIVEN ORAL READING FLUENCY BENCHMARKS | 17
STEP 7: EVALUATE AND COMPARE BENCHMARKS METHODS
7.1 Is the Benchmark Estimate Plausible? The first consideration is to see if the benchmark estimate is consistent with what is already known about reading in the context. The logistic regression approach can be unreliable with poor quality data and is capable of producing benchmark estimates of more than 100 cwpm, less than 10 cwpm, or even negative estimates. If the values are not consistent with what you understand about reading in the context, methods should be re-examined.
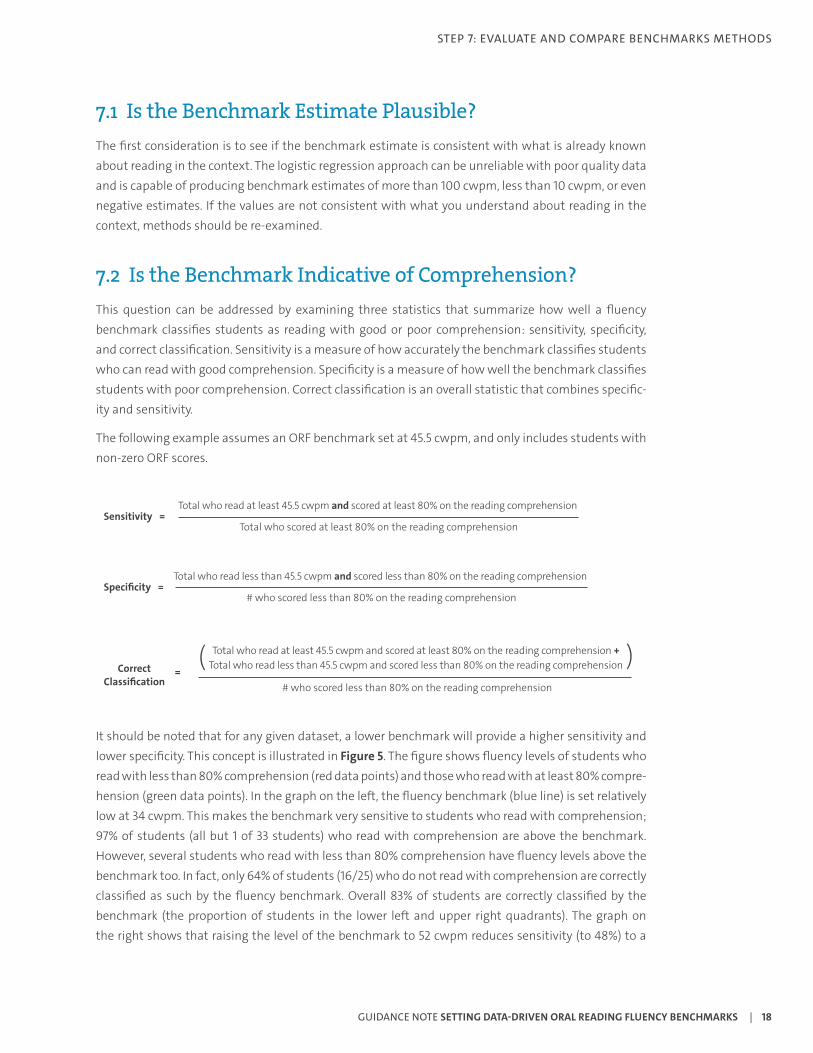
7.2 Is the Benchmark Indicative of Comprehension? This question can be addressed by examining three statistics that summarize how well a fluency benchmark classifies students as reading with good or poor comprehension: sensitivity, specificity, and correct classification. Sensitivity is a measure of how accurately the benchmark classifies students who can read with good comprehension. Specificity is a measure of how well the benchmark classifies students with poor comprehension. Correct classification is an overall statistic that combines specific-ity and sensitivity.
The following example assumes an ORF benchmark set at 45.5 cwpm, and only includes students with non-zero ORF scores.
Sensitivity =Total who read at least 45.5 cwpm and scored at least 80% on the reading comprehension
Total who scored at least 80% on the reading comprehension
Specificity =Total who read less than 45.5 cwpm and scored less than 80% on the reading comprehension
# who scored less than 80% on the reading comprehension
Correct Classification
Total who read at least 45.5 cwpm and scored at least 80% on the reading comprehension + Total who read less than 45.5 cwpm and scored less than 80% on the reading comprehension
# who scored less than 80% on the reading comprehension
( )=
It should be noted that for any given dataset, a lower benchmark will provide a higher sensitivity and lower specificity. This concept is illustrated in Figure 5. The figure shows fluency levels of students who read with less than 80% comprehension (red data points) and those who read with at least 80% compre-hension (green data points). In the graph on the left, the fluency benchmark (blue line) is set relatively low at 34 cwpm. This makes the benchmark very sensitive to students who read with comprehension; 97% of students (all but 1 of 33 students) who read with comprehension are above the benchmark. However, several students who read with less than 80% comprehension have fluency levels above the benchmark too. In fact, only 64% of students (16/25) who do not read with comprehension are correctly classified as such by the fluency benchmark. Overall 83% of students are correctly classified by the benchmark (the proportion of students in the lower left and upper right quadrants). The graph on the right shows that raising the level of the benchmark to 52 cwpm reduces sensitivity (to 48%) to a
GUIDANCE NOTE SETTING DATA-DRIVEN ORAL READING FLUENCY BENCHMARKS | 18
STEP 7: EVALUATE AND COMPARE BENCHMARKS METHODS
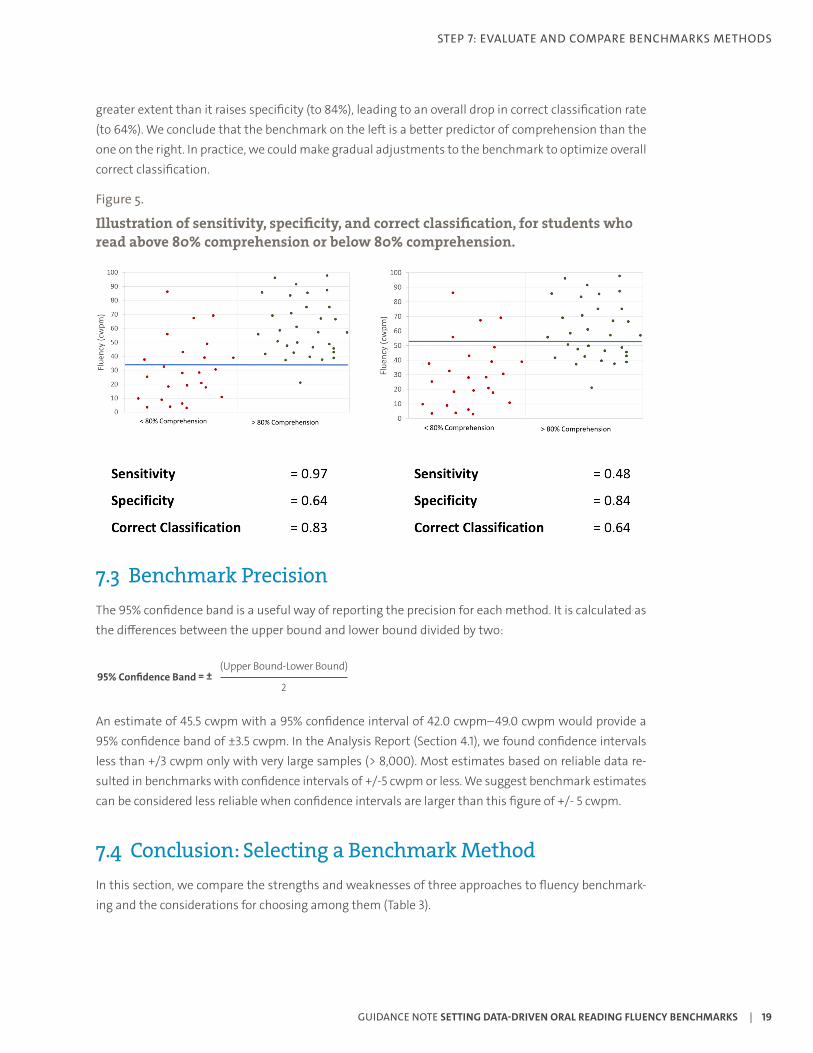
greater extent than it raises specificity (to 84%), leading to an overall drop in correct classification rate (to 64%). We conclude that the benchmark on the left is a better predictor of comprehension than the one on the right. In practice, we could make gradual adjustments to the benchmark to optimize overall correct classification.
Figure 5.
Illustration of sensitivity, specificity, and correct classification, for students who read above 80% comprehension or below 80% comprehension.
7.3 Benchmark PrecisionThe 95% confidence band is a useful way of reporting the precision for each method. It is calculated as the differences between the upper bound and lower bound divided by two:
95% Confidence Band(Upper Bound-Lower Bound)
2= ±
An estimate of 45.5 cwpm with a 95% confidence interval of 42.0 cwpm–49.0 cwpm would provide a 95% confidence band of ±3.5 cwpm. In the Analysis Report (Section 4.1), we found confidence intervals less than +/3 cwpm only with very large samples (> 8,000). Most estimates based on reliable data re-sulted in benchmarks with confidence intervals of +/-5 cwpm or less. We suggest benchmark estimates can be considered less reliable when confidence intervals are larger than this figure of +/- 5 cwpm.
7.4 Conclusion: Selecting a Benchmark MethodIn this section, we compare the strengths and weaknesses of three approaches to fluency benchmark-ing and the considerations for choosing among them (Table 3).
GUIDANCE NOTE SETTING DATA-DRIVEN ORAL READING FLUENCY BENCHMARKS | 19
STEP 7: EVALUATE AND COMPARE BENCHMARKS METHODS
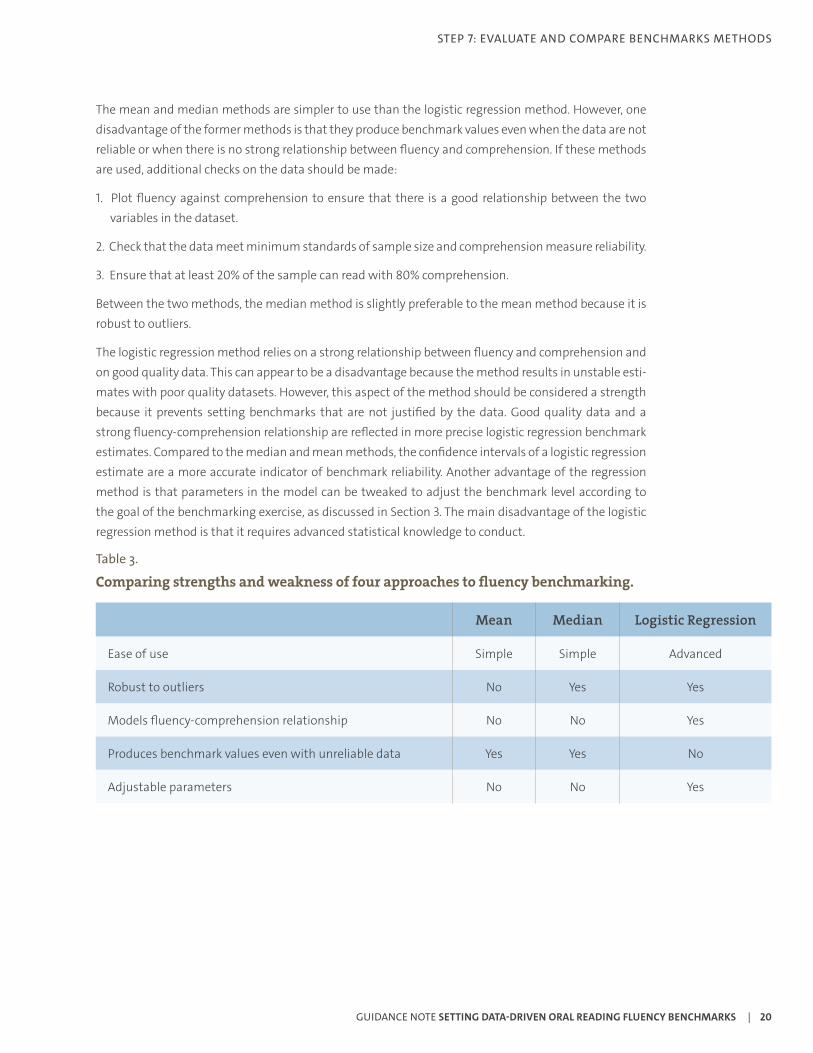
The mean and median methods are simpler to use than the logistic regression method. However, one disadvantage of the former methods is that they produce benchmark values even when the data are not reliable or when there is no strong relationship between fluency and comprehension. If these methods are used, additional checks on the data should be made:
1. Plot fluency against comprehension to ensure that there is a good relationship between the two variables in the dataset.
2. Check that the data meet minimum standards of sample size and comprehension measure reliability.
3. Ensure that at least 20% of the sample can read with 80% comprehension.
Between the two methods, the median method is slightly preferable to the mean method because it is robust to outliers.
The logistic regression method relies on a strong relationship between fluency and comprehension and on good quality data. This can appear to be a disadvantage because the method results in unstable esti-mates with poor quality datasets. However, this aspect of the method should be considered a strength because it prevents setting benchmarks that are not justified by the data. Good quality data and a strong fluency-comprehension relationship are reflected in more precise logistic regression benchmark estimates. Compared to the median and mean methods, the confidence intervals of a logistic regression estimate are a more accurate indicator of benchmark reliability. Another advantage of the regression method is that parameters in the model can be tweaked to adjust the benchmark level according to the goal of the benchmarking exercise, as discussed in Section 3. The main disadvantage of the logistic regression method is that it requires advanced statistical knowledge to conduct.
Table 3.
Comparing strengths and weakness of four approaches to fluency benchmarking.
Mean Median Logistic Regression
Ease of use Simple Simple Advanced
Robust to outliers No Yes Yes
Models fluency-comprehension relationship No No Yes
Produces benchmark values even with unreliable data Yes Yes No
Adjustable parameters No No Yes
GUIDANCE NOTE SETTING DATA-DRIVEN ORAL READING FLUENCY BENCHMARKS | 20
STEP 7: EVALUATE AND COMPARE BENCHMARKS METHODS
Step 8: Finalize Benchmarks and Targets
The final step in the process is to finalize benchmarks and targets for each grade. There are two primary decision points in setting a benchmark after data have been collected:
• Choosing between the mean, median, and logistic regression method • For the logistic regression method, choosing parameters for the model
In Section 3, we discussed the importance of defining “reading proficiency” as assessed by the bench-mark and being explicit about the intended use of the benchmark. The goal of benchmarking should also be considered when setting benchmarks by grade. This topic is discussed in the next section be-fore we consider the implications for target setting.
8.1 Benchmarks and Targets by GradeOne key consideration is how benchmarks should change by grade. This issue is informed by findings from the Analysis Report Section 4.1. We found that data from higher grades resulted in lower bench-marks. This counterintuitive finding is illustrated in Figure 6. Data from two countries were selected for this figure, but findings were consistent across the whole sample of countries. One possible explana-tion is that students with greater reading proficiency can draw on other reading skills (e.g., greater vocabulary) to enable them to understand at a slower reading speed. Another possible explanation may be that very few students are reading with proficiency in lower grades, and those who tend to be advanced readers, so their fluency rates would be much higher.
GUIDANCE NOTE SETTING DATA-DRIVEN ORAL READING FLUENCY BENCHMARKS | 21
STEP 8: FINALIZE BENCHMARKS AND TARGETS
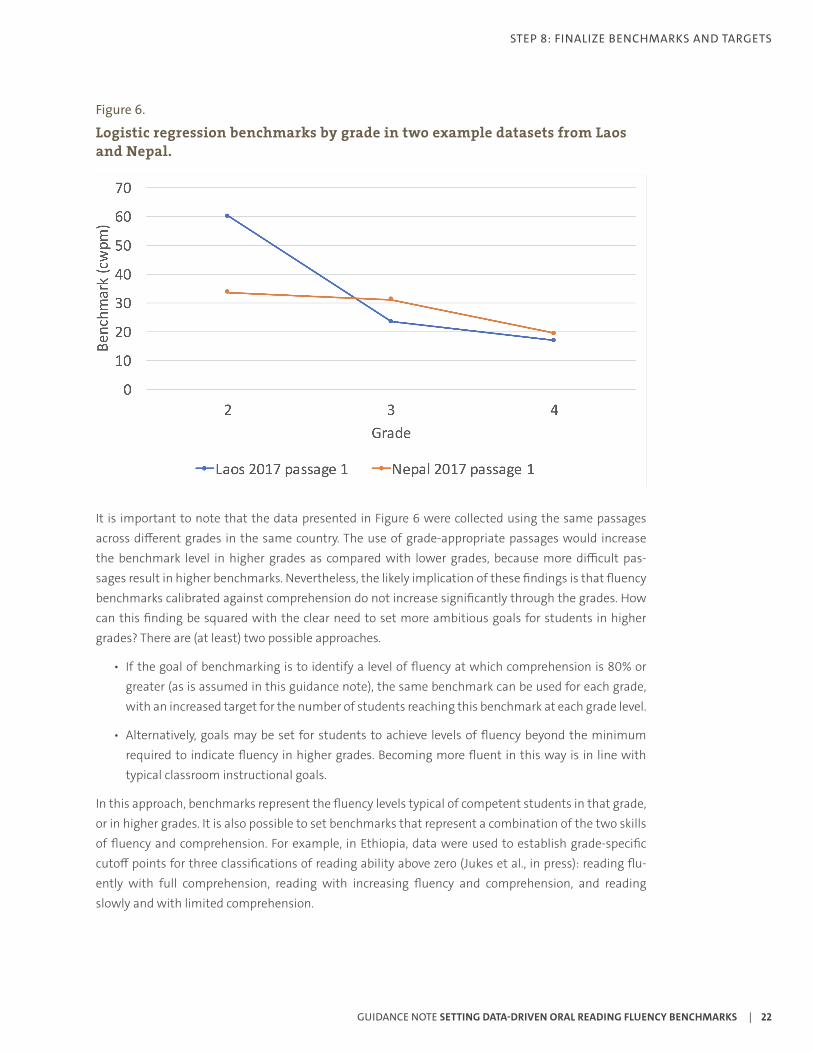
Figure 6.
Logistic regression benchmarks by grade in two example datasets from Laos and Nepal.
It is important to note that the data presented in Figure 6 were collected using the same passages across different grades in the same country. The use of grade-appropriate passages would increase the benchmark level in higher grades as compared with lower grades, because more difficult pas-sages result in higher benchmarks. Nevertheless, the likely implication of these findings is that fluency benchmarks calibrated against comprehension do not increase significantly through the grades. How can this finding be squared with the clear need to set more ambitious goals for students in higher grades? There are (at least) two possible approaches.
• If the goal of benchmarking is to identify a level of fluency at which comprehension is 80% or greater (as is assumed in this guidance note), the same benchmark can be used for each grade, with an increased target for the number of students reaching this benchmark at each grade level.
• Alternatively, goals may be set for students to achieve levels of fluency beyond the minimum required to indicate fluency in higher grades. Becoming more fluent in this way is in line with typical classroom instructional goals.
In this approach, benchmarks represent the fluency levels typical of competent students in that grade, or in higher grades. It is also possible to set benchmarks that represent a combination of the two skills of fluency and comprehension. For example, in Ethiopia, data were used to establish grade-specific cutoff points for three classifications of reading ability above zero (Jukes et al., in press): reading flu-ently with full comprehension, reading with increasing fluency and comprehension, and reading slowly and with limited comprehension.
GUIDANCE NOTE SETTING DATA-DRIVEN ORAL READING FLUENCY BENCHMARKS | 22
STEP 8: FINALIZE BENCHMARKS AND TARGETS
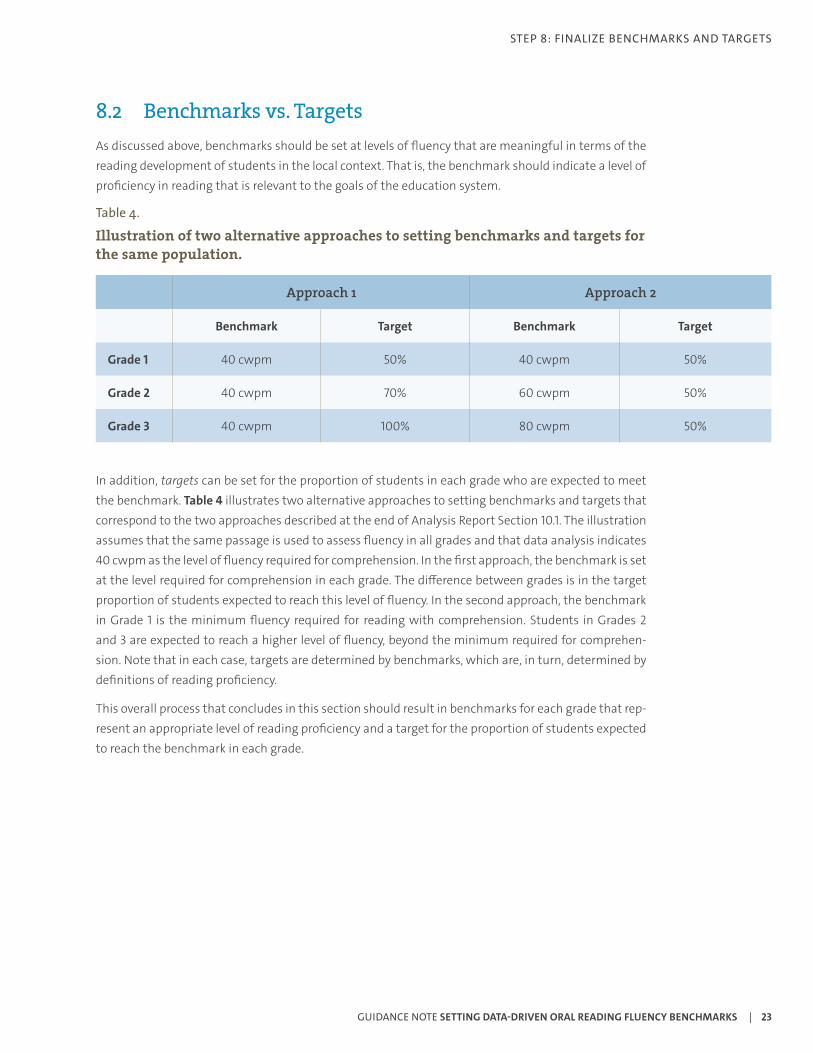
8.2 Benchmarks vs. TargetsAs discussed above, benchmarks should be set at levels of fluency that are meaningful in terms of the reading development of students in the local context. That is, the benchmark should indicate a level of proficiency in reading that is relevant to the goals of the education system.
Table 4.
Illustration of two alternative approaches to setting benchmarks and targets for the same population.
Approach 1 Approach 2
Benchmark Target Benchmark Target
Grade 1 40 cwpm 50% 40 cwpm 50%
Grade 2 40 cwpm 70% 60 cwpm 50%
Grade 3 40 cwpm 100% 80 cwpm 50%
In addition, targets can be set for the proportion of students in each grade who are expected to meet the benchmark. Table 4 illustrates two alternative approaches to setting benchmarks and targets that correspond to the two approaches described at the end of Analysis Report Section 10.1. The illustration assumes that the same passage is used to assess fluency in all grades and that data analysis indicates 40 cwpm as the level of fluency required for comprehension. In the first approach, the benchmark is set at the level required for comprehension in each grade. The difference between grades is in the target proportion of students expected to reach this level of fluency. In the second approach, the benchmark in Grade 1 is the minimum fluency required for reading with comprehension. Students in Grades 2 and 3 are expected to reach a higher level of fluency, beyond the minimum required for comprehen-sion. Note that in each case, targets are determined by benchmarks, which are, in turn, determined by definitions of reading proficiency.
This overall process that concludes in this section should result in benchmarks for each grade that rep-resent an appropriate level of reading proficiency and a target for the proportion of students expected to reach the benchmark in each grade.
GUIDANCE NOTE SETTING DATA-DRIVEN ORAL READING FLUENCY BENCHMARKS | 23
STEP 8: FINALIZE BENCHMARKS AND TARGETS
Conclusion and Summary
Setting fluency benchmarks is a mixture of art and science. The art involves setting benchmarks that have widespread buy-in and are politically feasible. The science involves setting benchmarks that rep-resent a valid level of reading proficiency. This report has mainly focused on the science. We have made recommendations largely based on extensive analysis of 35 datasets from 9 languages in 7 countries.
Some of the recommendations have universal applicability—such as defining the goals of bench-marking and the target population and setting meaningful benchmarks before choosing targets. Recommendations for data collection and analysis refer specifically to benchmarks calibrated against comprehension levels. As mentioned earlier, other methods, such as longitudinal studies, could be used for setting benchmarks when the appropriate data are available.
For comprehension-related fluency benchmarks, we recommend a process for data collection and analysis. For data collection, there are several clear recommendations for the most appropriate meth-ods. These include recommendations about instruments: assessing comprehension with a reliable, independent measure; allowing students to read to the end of the passage; and using more than one reading passage. We provide two options for comprehension assessment methods—either with five questions asked of an oral reading passage or the sentence choice test. We encourage continued exploration of the best methods for assessing comprehension.
There are also clear recommendations about sampling: selecting a sample of sufficient size with the right proportion of students reading with comprehension and with the same language characteristics as the target population.
Clear recommendations for data analysis involve pre-analysis steps of knowing your sample, instru-ments, and data and disaggregating your data to only include students who can read at least one word.
Data analysis involves a choice between three methods (mean, median, and logistic regression) and the selection of parameters for the logistic regression method. The choice of analytical method is informed by our recommended steps to evaluate benchmarks, including calculating benchmark preci-sion and sensitivity/specificity as an indicator of comprehension.
The final decision depends on an evaluation of methods, benchmarks, and targets and depends on the overall goal of the benchmarking exercise. Figure 7 gives an overview of the whole process of setting data-driven fluency benchmarks.
GUIDANCE NOTE SETTING DATA-DRIVEN ORAL READING FLUENCY BENCHMARKS | 24
CONCLUSION AND SUMMARY
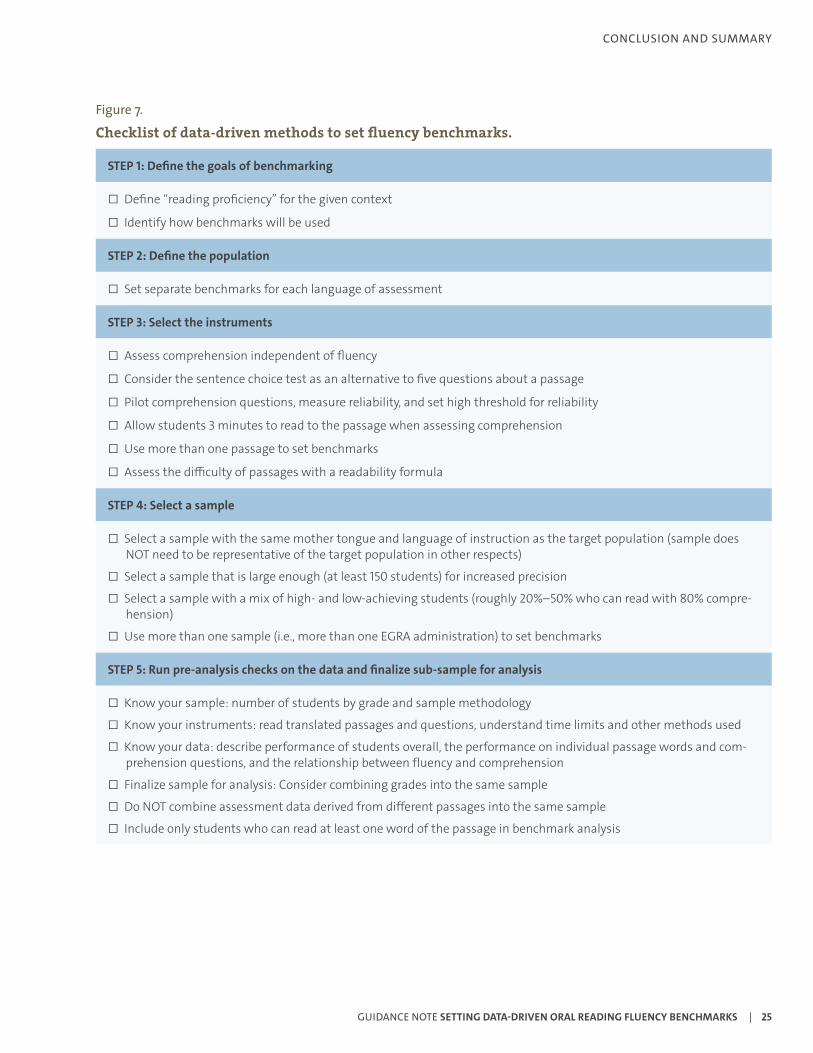
Figure 7.
Checklist of data-driven methods to set fluency benchmarks.
STEP 1: Define the goals of benchmarking
□ Define “reading proficiency” for the given context
□ Identify how benchmarks will be used
STEP 2: Define the population
□ Set separate benchmarks for each language of assessment
STEP 3: Select the instruments
□ Assess comprehension independent of fluency
□ Consider the sentence choice test as an alternative to five questions about a passage
□ Pilot comprehension questions, measure reliability, and set high threshold for reliability
□ Allow students 3 minutes to read to the passage when assessing comprehension
□ Use more than one passage to set benchmarks
□ Assess the difficulty of passages with a readability formula
STEP 4: Select a sample
□ Select a sample with the same mother tongue and language of instruction as the target population (sample does NOT need to be representative of the target population in other respects)
□ Select a sample that is large enough (at least 150 students) for increased precision
□ Select a sample with a mix of high- and low-achieving students (roughly 20%–50% who can read with 80% compre-hension)
□ Use more than one sample (i.e., more than one EGRA administration) to set benchmarks
STEP 5: Run pre-analysis checks on the data and finalize sub-sample for analysis
□ Know your sample: number of students by grade and sample methodology
□ Know your instruments: read translated passages and questions, understand time limits and other methods used
□ Know your data: describe performance of students overall, the performance on individual passage words and com-prehension questions, and the relationship between fluency and comprehension
□ Finalize sample for analysis: Consider combining grades into the same sample
□ Do NOT combine assessment data derived from different passages into the same sample
□ Include only students who can read at least one word of the passage in benchmark analysis
GUIDANCE NOTE SETTING DATA-DRIVEN ORAL READING FLUENCY BENCHMARKS | 25
CONCLUSION AND SUMMARY
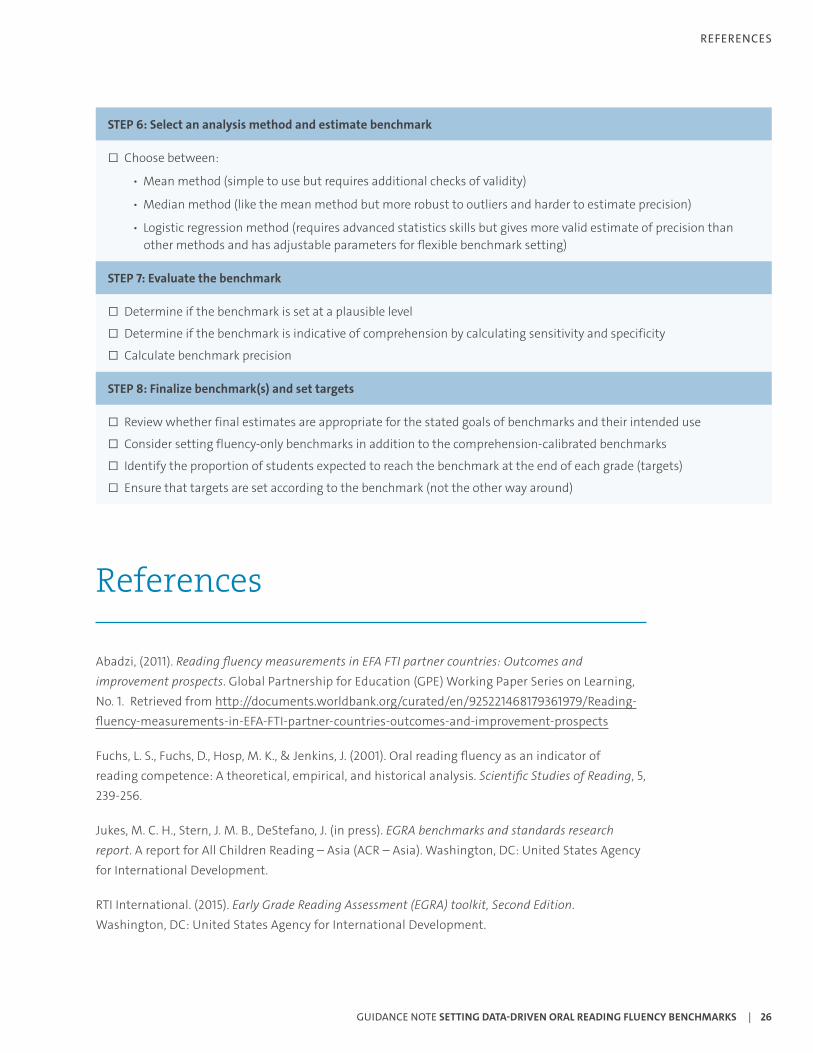
STEP 6: Select an analysis method and estimate benchmark
□ Choose between:
• Mean method (simple to use but requires additional checks of validity)
• Median method (like the mean method but more robust to outliers and harder to estimate precision)
• Logistic regression method (requires advanced statistics skills but gives more valid estimate of precision than other methods and has adjustable parameters for flexible benchmark setting)
STEP 7: Evaluate the benchmark
□ Determine if the benchmark is set at a plausible level
□ Determine if the benchmark is indicative of comprehension by calculating sensitivity and specificity
□ Calculate benchmark precision
STEP 8: Finalize benchmark(s) and set targets
□ Review whether final estimates are appropriate for the stated goals of benchmarks and their intended use
□ Consider setting fluency-only benchmarks in addition to the comprehension-calibrated benchmarks
□ Identify the proportion of students expected to reach the benchmark at the end of each grade (targets)
□ Ensure that targets are set according to the benchmark (not the other way around)
References
Abadzi, (2011). Reading fluency measurements in EFA FTI partner countries: Outcomes and improvement prospects. Global Partnership for Education (GPE) Working Paper Series on Learning, No. 1. Retrieved from http://documents.worldbank.org/curated/en/925221468179361979/Reading-fluency-measurements-in-EFA-FTI-partner-countries-outcomes-and-improvement-prospects
Fuchs, L. S., Fuchs, D., Hosp, M. K., & Jenkins, J. (2001). Oral reading fluency as an indicator of reading competence: A theoretical, empirical, and historical analysis. Scientific Studies of Reading, 5, 239-256.
Jukes, M. C. H., Stern, J. M. B., DeStefano, J. (in press). EGRA benchmarks and standards research report. A report for All Children Reading – Asia (ACR – Asia). Washington, DC: United States Agency for International Development.
RTI International. (2015). Early Grade Reading Assessment (EGRA) toolkit, Second Edition. Washington, DC: United States Agency for International Development.
GUIDANCE NOTE SETTING DATA-DRIVEN ORAL READING FLUENCY BENCHMARKS | 26
REFERENCES
Sweet, A. P., & Snow, C. E. (2003). Rethinking reading comprehension. New York: Guilford Press.
Tavakol, M., & Dennick, R. (2011). Making sense of Cronbach’s alpha. International Journal of Medical Education, 2:53-55.
Annex A. Readability Formulae
Most readability formulae use some combination of sentence complexity and vocabulary complexity. Readability levels usually give an objective numerical score, using a formula derived from measures of sentence difficulty and word difficulty. There is not one commonly recognized approach to assess-ing readability in most languages other than English. We recommend using a combination of word length, sentence length, and syllable length to assess readability and include vocabulary level for beginner readers. Here are two existing formulae that can be used as examples.
• Fry was developed over 50 years ago in Uganda. In 1960, Edward Fry taught at Makerere University in Kampala as a Fulbright Scholar. From that experience, he developed the Fry Readability Graph, which is popular and widely used. It is based on the average length of sentences (in words) and the average length of words (in syllables) in a passage. Averages are plotted on a graph to de-termine readability. An example of the Fry Graph applied to a 100-word passage is here: http://www.mccn.edu/library/patienteducation/staffresources_/patienteducatio_/fryreadabilityg/FryReadabilityGraph.pdf.
• Flesch-Kincaid Grade Level is readily available in Microsoft Word. Its formula uses average sentence length and average number of syllables per word (Formula (.39 x ASL) + (11.8 x ASW) – 15.59).
• ASL = average sentence length (the number of words divided by the number of sentences)
• ASW = average number of syllables per word (the number of syllables divided by the number of words)
GUIDANCE NOTE SETTING DATA-DRIVEN ORAL READING FLUENCY BENCHMARKS | 27
ANNEX A. READABILITY FORMULAE
Annex B. Statistical Methods Guide with Examples and Annotations
In this annex, we provide additional detail, examples, and some step-by-step instructions for carrying out analyses described in the main document. We provide example output and code from Stata software.
Benchmarking Analysis Approaches
Pre-Analysis Steps
Prior to conducting analyses, it is very important that you know your sample and your data. Here is a list of the information you should be aware of prior to running benchmarks based on compre-hension; these pre-analysis checks will help you better understand any potential limitations in the benchmark estimates.
1. Know the sample and the sample methodology. Take note of the sample size of schools and stu-dents, and what the sample is meant to represent. If the data contain more than one grade and/or more than one passage, take note of the sample sizes by grade and passage. All analyses mentioned below should initially be done by grade and passage to help you note the differences in reading and comprehension abilities across grades and passages, and how these differences might affect the benchmark estimates.
2. Know your assessment.
a. Obtain an English translation of the reading passage and comprehension questions. Try to get an understanding of how clear and fluid the passage would be for the student. Determine if the comprehension questions are clear and relevant to the passage.
b. Note how many total words there are.
c. Note how many minutes the students were given to complete the reading passage.
d. Note which words the students must attempt before they can be asked each comprehen-sion question.
3. Know your data.
a. See how well the students performed. Plot the oral reading fluency (ORF) and reading com-prehension scores distributions. An example is shown with the Nepal 2017 Grade 2 passage a data in Figure B1. Note the number and percentage of students who:
GUIDANCE NOTE SETTING DATA-DRIVEN ORAL READING FLUENCY BENCHMARKS | 28
ANNEX B. STATISTICAL METHODS GUIDE WITH EXAMPLES AND ANNOTATIONS
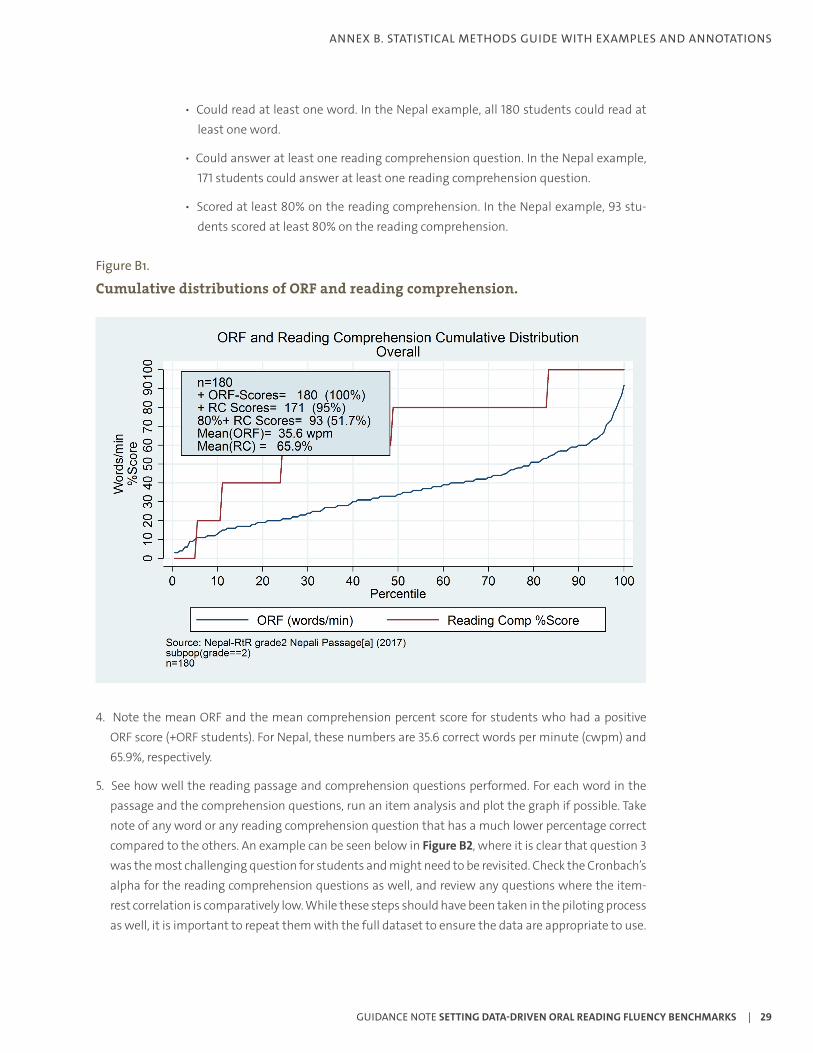
• Could read at least one word. In the Nepal example, all 180 students could read at least one word.
• Could answer at least one reading comprehension question. In the Nepal example, 171 students could answer at least one reading comprehension question.
• Scored at least 80% on the reading comprehension. In the Nepal example, 93 stu-dents scored at least 80% on the reading comprehension.
Figure B1.
Cumulative distributions of ORF and reading comprehension.
4. Note the mean ORF and the mean comprehension percent score for students who had a positive ORF score (+ORF students). For Nepal, these numbers are 35.6 correct words per minute (cwpm) and 65.9%, respectively.
5. See how well the reading passage and comprehension questions performed. For each word in the passage and the comprehension questions, run an item analysis and plot the graph if possible. Take note of any word or any reading comprehension question that has a much lower percentage correct compared to the others. An example can be seen below in Figure B2, where it is clear that question 3 was the most challenging question for students and might need to be revisited. Check the Cronbach’s alpha for the reading comprehension questions as well, and review any questions where the item-rest correlation is comparatively low. While these steps should have been taken in the piloting process as well, it is important to repeat them with the full dataset to ensure the data are appropriate to use.
GUIDANCE NOTE SETTING DATA-DRIVEN ORAL READING FLUENCY BENCHMARKS | 29
ANNEX B. STATISTICAL METHODS GUIDE WITH EXAMPLES AND ANNOTATIONS
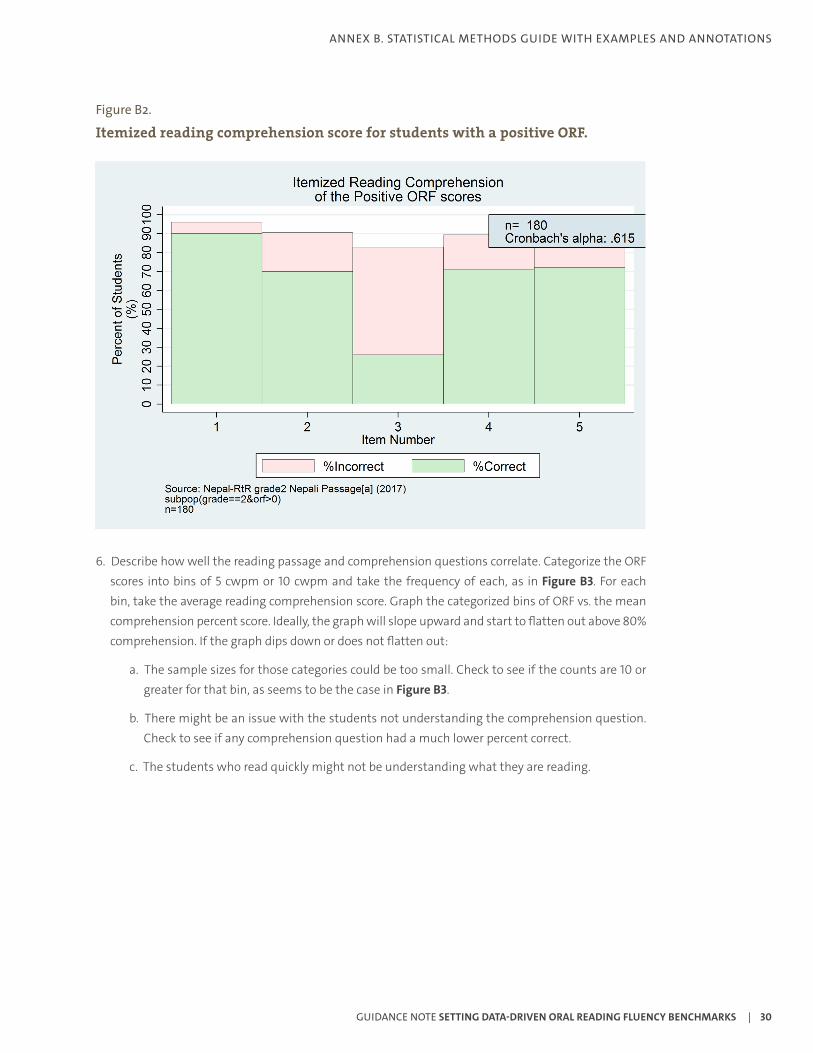
Figure B2.
Itemized reading comprehension score for students with a positive ORF.
6. Describe how well the reading passage and comprehension questions correlate. Categorize the ORF scores into bins of 5 cwpm or 10 cwpm and take the frequency of each, as in Figure B3. For each bin, take the average reading comprehension score. Graph the categorized bins of ORF vs. the mean comprehension percent score. Ideally, the graph will slope upward and start to flatten out above 80% comprehension. If the graph dips down or does not flatten out:
a. The sample sizes for those categories could be too small. Check to see if the counts are 10 or greater for that bin, as seems to be the case in Figure B3.
b. There might be an issue with the students not understanding the comprehension question. Check to see if any comprehension question had a much lower percent correct.
c. The students who read quickly might not be understanding what they are reading.
GUIDANCE NOTE SETTING DATA-DRIVEN ORAL READING FLUENCY BENCHMARKS | 30
ANNEX B. STATISTICAL METHODS GUIDE WITH EXAMPLES AND ANNOTATIONS
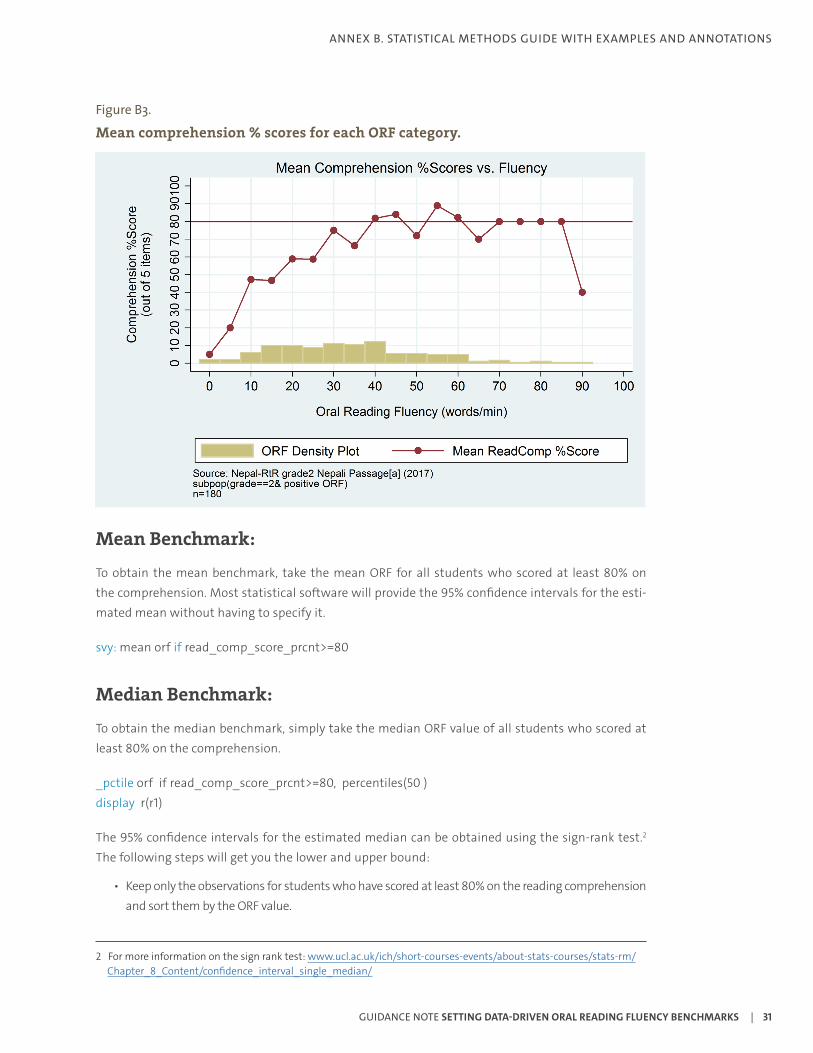
Figure B3.
Mean comprehension % scores for each ORF category.
Mean Benchmark:
To obtain the mean benchmark, take the mean ORF for all students who scored at least 80% on the comprehension. Most statistical software will provide the 95% confidence intervals for the esti-mated mean without having to specify it.
svy: mean orf if read_comp_score_prcnt>=80
Median Benchmark:
To obtain the median benchmark, simply take the median ORF value of all students who scored at least 80% on the comprehension.
_pctile orf if read_comp_score_prcnt>=80, percentiles(50 ) display r(r1)
The 95% confidence intervals for the estimated median can be obtained using the sign-rank test.2
The following steps will get you the lower and upper bound:
• Keep only the observations for students who have scored at least 80% on the reading comprehension and sort them by the ORF value.
2 For more information on the sign rank test: www.ucl.ac.uk/ich/short-courses-events/about-stats-courses/stats-rm/Chapter_8_Content/confidence_interval_single_median/
GUIDANCE NOTE SETTING DATA-DRIVEN ORAL READING FLUENCY BENCHMARKS | 31
ANNEX B. STATISTICAL METHODS GUIDE WITH EXAMPLES AND ANNOTATIONS
keep if read_comp_score_prcnt>=80 sort orf local Tot_n_rcomp80 =_N
• Determine the lower bound observation number by identifying the individual whose rank is:
n/2-(1.96√n)/2
where n=the overall sample size. Note that the median is found by identifying the individual whose rank order is n/2. The above formula identifies the individual whose rank is 1.96√n)/2 below that.
• The ORF values for that individual will be the lower bound.
*Lower Bound: local median_lb_obs = round((`Tot_n_rcomp80’/2) - (1.96*sqrt(`Tot_n_rcomp80’)/2),1.0) local median_lb_val = round(`orf’[`median_lb_obs’],0.1)
• Determine the upper bound observation number by identifying the individual whose rank is
1 + n/2 + (1.96√n)/2
• The ORF values for that individual will be the upper bound.
*Upper Bound: local median_ub_obs = round(1+ ((`Tot_n_rcomp80’/2) + (1.96*sqrt(`Tot_n_rcomp80’))),1.0) local median_ub_val= round(`orf’[`median_ub_obs’],0.1)
Logistic Benchmark:
Setting an ORF benchmark using the logistic regression approach requires more steps than setting one using the mean or the median approaches. Below is a list of the steps that must be taken.
• Create a binary variable:
—Those who scored at least 80% on the reading comprehension (RC80 = 1) —Those who scored less than 80% on the reading comprehension (RC80 = 0)
• Run a logistic regression model: RC80 = ORF. This will give you two fitted estimates: Beta (ß) and a constant (_con) that will be used to predict each student’s score.
svy: logistic rc80 orf if orf>0
It should be noted that the logistic regression gives unstable estimates if the sample size is small.
• Obtain each person’s predicted probability of scoring 80% on the reading comprehension. Pr(RC80=1) will have possible values of 0–1.0. You can do this in most statistical programs with
GUIDANCE NOTE SETTING DATA-DRIVEN ORAL READING FLUENCY BENCHMARKS | 32
ANNEX B. STATISTICAL METHODS GUIDE WITH EXAMPLES AND ANNOTATIONS
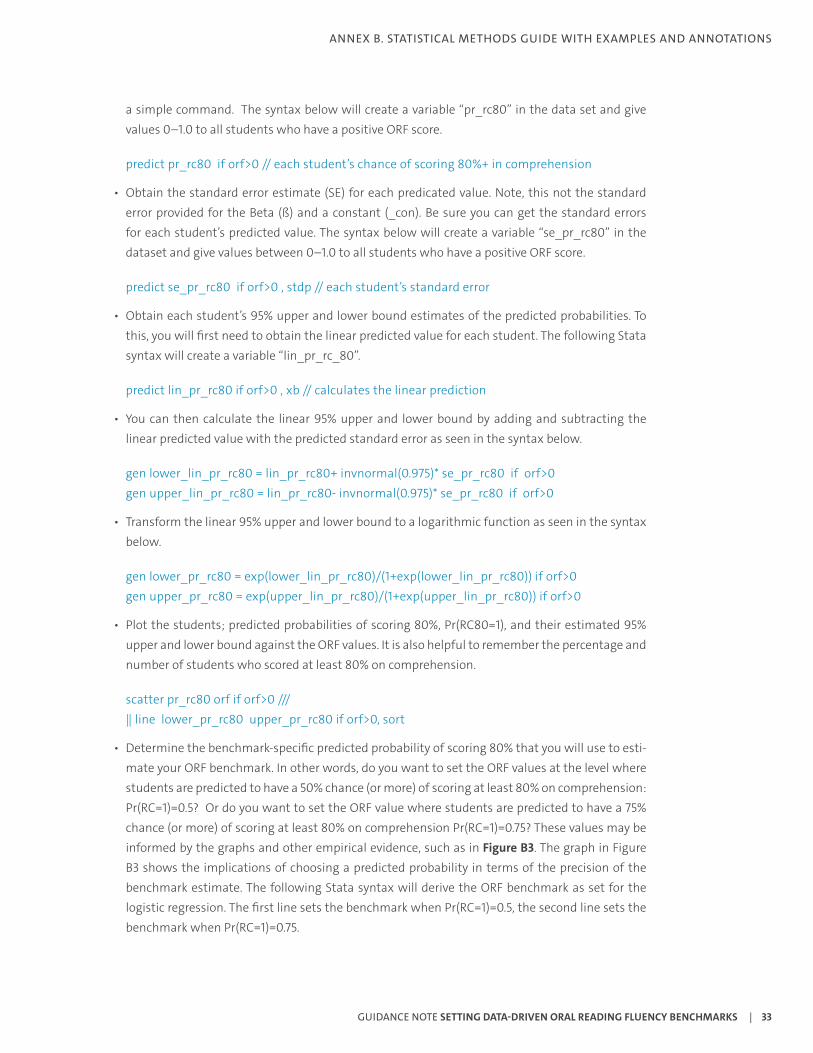
a simple command. The syntax below will create a variable “pr_rc80” in the data set and give values 0–1.0 to all students who have a positive ORF score.
predict pr_rc80 if orf>0 // each student’s chance of scoring 80%+ in comprehension
• Obtain the standard error estimate (SE) for each predicated value. Note, this not the standard error provided for the Beta (ß) and a constant (_con). Be sure you can get the standard errors for each student’s predicted value. The syntax below will create a variable “se_pr_rc80” in the dataset and give values between 0–1.0 to all students who have a positive ORF score.
predict se_pr_rc80 if orf>0 , stdp // each student’s standard error
• Obtain each student’s 95% upper and lower bound estimates of the predicted probabilities. To this, you will first need to obtain the linear predicted value for each student. The following Stata syntax will create a variable “lin_pr_rc_80”.
predict lin_pr_rc80 if orf>0 , xb // calculates the linear prediction
• You can then calculate the linear 95% upper and lower bound by adding and subtracting the linear predicted value with the predicted standard error as seen in the syntax below.
gen lower_lin_pr_rc80 = lin_pr_rc80+ invnormal(0.975)* se_pr_rc80 if orf>0 gen upper_lin_pr_rc80 = lin_pr_rc80- invnormal(0.975)* se_pr_rc80 if orf>0
• Transform the linear 95% upper and lower bound to a logarithmic function as seen in the syntax below.
gen lower_pr_rc80 = exp(lower_lin_pr_rc80)/(1+exp(lower_lin_pr_rc80)) if orf>0 gen upper_pr_rc80 = exp(upper_lin_pr_rc80)/(1+exp(upper_lin_pr_rc80)) if orf>0
• Plot the students; predicted probabilities of scoring 80%, Pr(RC80=1), and their estimated 95% upper and lower bound against the ORF values. It is also helpful to remember the percentage and number of students who scored at least 80% on comprehension.
scatter pr_rc80 orf if orf>0 /// || line lower_pr_rc80 upper_pr_rc80 if orf>0, sort
• Determine the benchmark-specific predicted probability of scoring 80% that you will use to esti-mate your ORF benchmark. In other words, do you want to set the ORF values at the level where students are predicted to have a 50% chance (or more) of scoring at least 80% on comprehension: Pr(RC=1)=0.5? Or do you want to set the ORF value where students are predicted to have a 75% chance (or more) of scoring at least 80% on comprehension Pr(RC=1)=0.75? These values may be informed by the graphs and other empirical evidence, such as in Figure B3. The graph in Figure B3 shows the implications of choosing a predicted probability in terms of the precision of the benchmark estimate. The following Stata syntax will derive the ORF benchmark as set for the logistic regression. The first line sets the benchmark when Pr(RC=1)=0.5, the second line sets the benchmark when Pr(RC=1)=0.75.
GUIDANCE NOTE SETTING DATA-DRIVEN ORAL READING FLUENCY BENCHMARKS | 33
ANNEX B. STATISTICAL METHODS GUIDE WITH EXAMPLES AND ANNOTATIONS
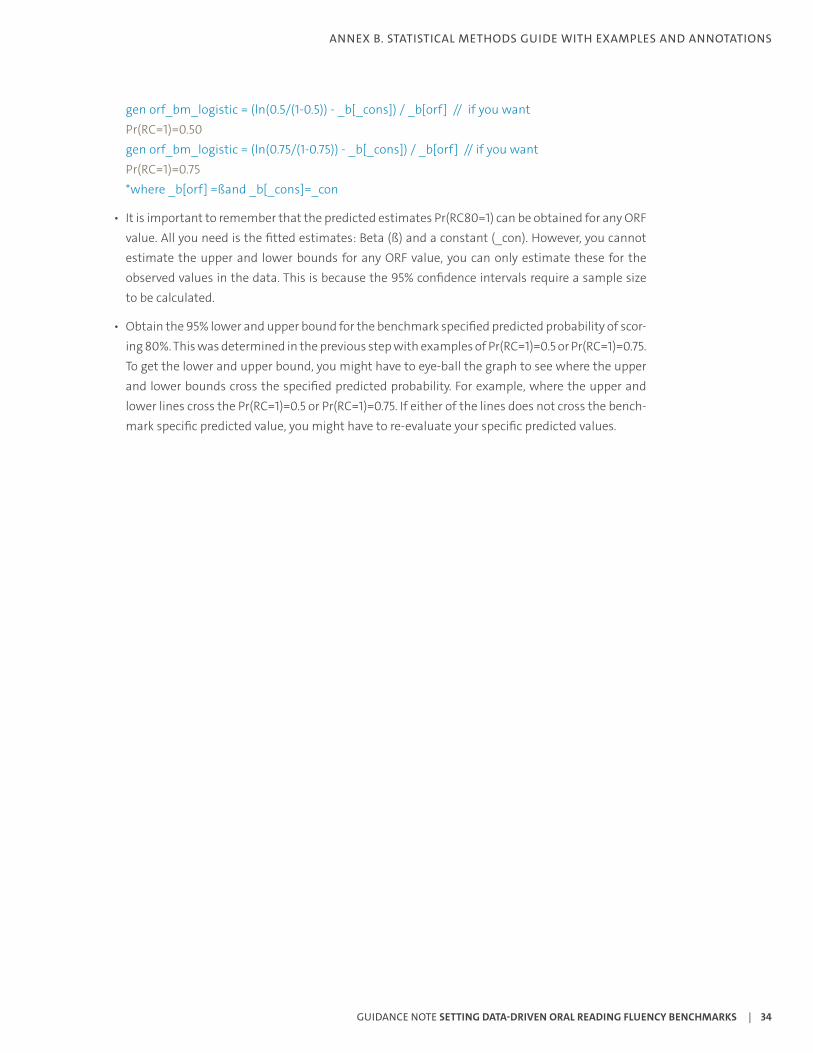
gen orf_bm_logistic = (ln(0.5/(1-0.5)) - _b[_cons]) / _b[orf] // if you want Pr(RC=1)=0.50 gen orf_bm_logistic = (ln(0.75/(1-0.75)) - _b[_cons]) / _b[orf] // if you want Pr(RC=1)=0.75 *where _b[orf] =ßand _b[_cons]=_con
• It is important to remember that the predicted estimates Pr(RC80=1) can be obtained for any ORF value. All you need is the fitted estimates: Beta (ß) and a constant (_con). However, you cannot estimate the upper and lower bounds for any ORF value, you can only estimate these for the observed values in the data. This is because the 95% confidence intervals require a sample size to be calculated.
• Obtain the 95% lower and upper bound for the benchmark specified predicted probability of scor-ing 80%. This was determined in the previous step with examples of Pr(RC=1)=0.5 or Pr(RC=1)=0.75. To get the lower and upper bound, you might have to eye-ball the graph to see where the upper and lower bounds cross the specified predicted probability. For example, where the upper and lower lines cross the Pr(RC=1)=0.5 or Pr(RC=1)=0.75. If either of the lines does not cross the bench-mark specific predicted value, you might have to re-evaluate your specific predicted values.
GUIDANCE NOTE SETTING DATA-DRIVEN ORAL READING FLUENCY BENCHMARKS | 34
ANNEX B. STATISTICAL METHODS GUIDE WITH EXAMPLES AND ANNOTATIONS
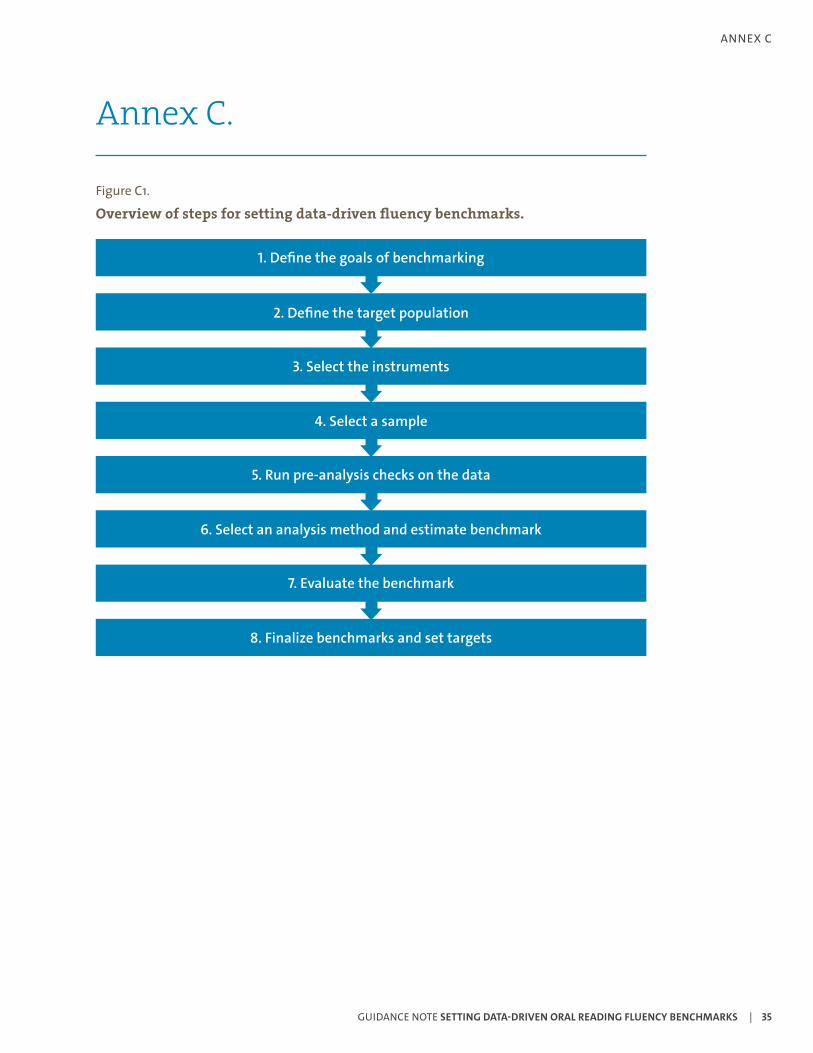
Annex C.
Figure C1.
Overview of steps for setting data-driven fluency benchmarks.
GUIDANCE NOTE SETTING DATA-DRIVEN ORAL READING FLUENCY BENCHMARKS | 35
1. Define the goals of benchmarking
2. Define the target population
3. Select the instruments
4. Select a sample
5. Run pre-analysis checks on the data
6. Select an analysis method and estimate benchmark
7. Evaluate the benchmark
8. Finalize benchmarks and set targets
ANNEX C

BENCHMARKING REPORT 2017 | 36
BACKGROUND
World Change Starts with Educated Children.®
www.roomtoread.org email: [email protected]