Embed Size (px)
Citation preview

AAllmmaa MMaatteerr SSttuuddiioorruumm –– UUnniivveerrssiittàà ddii BBoollooggnnaa
DOTTORATO DI RICERCA IN
INGEGNERIA AGRARIA Ciclo XXV
Settore Concorsuale di afferenza: 07/C1
Settore Scientifico disciplinare: AGR09
TITOLO TESI
APPLICATIONS OF INFRARED THERMOGRAPHY
IN THE FOOD INDUSTRY
Presentata da: LUCIAN CUIBUS
Coordinatore Dottorato Relatore
Prof. Ing. Adriano Guarnieri Ing. Angelo Fabbri
Dr. Luigi Ragni
Esame finale anno 2013


“Learning is experience. Everything else is just information.”
Albert Einstein


CONTENTS
INDEX OF FIGURES V
INDEX OF TABLES VIII
INTRODUCTION 1
I. INFRARED THERMOGRAPHY IN THE FOOD
INDUSTRY
3
I.1 The science of infrared thermography 3
I.2 Research concerning past and recent application of thermography in the
food industry
17
I.3 References 27
II. APPLICATION OF INFRARED THERMOGRAPHY IN
THE FOOD INDUSTRY
33
II.1 Experimental validation of a numerical model for hot air
treatment of eggs in natural convection conditions and with hot-air jet with
FLIR- IR thermocamera
33
II.1.1 Introduction 33
II.1.2 The eggs 35
II.1.3 Material and methods 41
II.1.4 Results and discussion 51
II.1.5 References 59
II.2 Application of infrared thermography for controlling freezing
process of raw potato
65
II.2.1 Introduction 66
II.2.2 Material and methods 67
II.2.3 Results and discussion 69
II.2.4 References 79

II.3 Analysis of water motion throughout the potato (var. Melody)
freezing by infrared thermography, microstructural and dielectric
techniques.
85
II.3.1 Introduction 87
II.3.2 Material and methods 89
II.3.3 Results and discussion 91
II.3.4 References 103
II.4 Spinach - Infrared thermography versus image analysis: A
survey
107
II.4.1 Introduction 107
II.4.2 Material and methods 109
II.4.3 Results and discussion 111
II.4.4 References 113

V
INDEX OF FIGURES
Figure 1 Components of an Infrared Sensing Instrument (Zayicek 2002) 5
Figure 2 Electromagnetic Spectrum (Kaiser 1996) 7
Figure 3 Radiation exchange at the target surface (Zayicek 2002) 9
Figure 4 Planck’s law for spectral emittance (Burnay et al., 1988) 10
Figure 5 Infrared Thermocamera FLIR A325 setup 43
Figure 6 Egg temperature measured with Infrared Thermocamera FLIR
A325
44
Figure 7 Infrared Thermocamera FLIR A325 setup for measurements in the
oven
46
Figure 8 The prototype used for the measurements 48
Figure 9 Analysis of the thermographic image for the egg treatment in the
oven at 55°C for 200 minutes
51
Figure 10 Time-temperature curves observed at the surface of egg shell
during the heat treatment in the oven at 55°C, for 200 minutes
52
Figure 11 Time-temperature curves of the egg shell measured and calculated 52
Figure 12 Time-temperature curves of the egg shell measured and calculated
for treatment 1
54
Figure 13 Time-temperature curves of the egg shell measured and calculated
for treatment 2
55
Figure 14 Time-temperature curves of the egg shell measured and calculated
for treatment 3
55
Figure 15 Time-temperature curves of the egg shell measured and calculated
for treatment 4
56
Figure 16 Time-temperature curves of the egg shell measured and calculated
for treatment 5
56
Figure 17 Time-temperature curves of the egg shell measured and calculated
for treatment 6
57

VI
Figure 18 Time-temperature curves of the egg shell measured and calculated
for treatment 7
57
Figure 19 Experimental setup 68
Figure 20 Freezing curves for potato, water and aluminium 69
Figure 21 Energy received by the camera with regard to the temperature of
potato and water
71
Figure 22 Freezing curve for potato, compared with the energy emitted by
the potato and registered by the camera thorough the treatment
72
Figure 23 Freezing curves for water, compared with the energy emitted by
the potato and registered by the camera thorough the treatment
73
Figure 24 Differential scanning calorimetry thermogram of potato 74
Figure 25 Energy received by the camera with regard to the internal energy
of potato and water
75
Figure 26 Energy received by the camera with regard to the internal energy
of potato and water
75
Figure 27 Freezing enthalpy area with regard to the temperature (principal
axis); water mass fraction (xwi) with regard to the temperature (secondary axis)
77
Figure 28 Emissivity with regard to temperature for potato 78
Figure 29 Experimental scheme of freezing process and control system 90
Figure 30 Freezing process curve and relative emissivity values
92
Figure 31 Temperature profile of potato sample through freezing process at
6, 9, 12, 42, 51, 84 and 120 min
93
Figure 32 Evolution of Temperature of potato sample through freezing 94

VII
process at 1mm, 4mm, 5mm, 1cm, 2cm
Figure 33 Variation of gradient of chemical potential through the time at
surface, 1 mm, 2 mm and 1 cm
95
Figure 34 Partial volume increment through the freezing process 96
Figure 35 Scheme of heat modelling to predict the behaviours involves in
the freezing process
97
Figure 36 Cryo-SEM micrograph for fresh (A-350x,C-500x,E-750x) and
thaw (B-350x,D-500x,F-750x) potato raw tissue
99
Figure 37 Dielectric spectra of fresh and thaw potato and liquid form
thawing process
100
Figure 38 Experimental setup for measuring the ice crystal dimension by
Nikon D700 digital camera and Flir A325 infrared thermocamera
110
Figure 39 Comparing the RGB digital image with an infrared image using
Image-Pro Plus software
111

VIII
INDEX OF TABLES
Table 1 Characteristics of the hot air gun Bosh, model GHG 660 LCD 47
Table 2 Characteristic parameters of the thermal cycles 49
Table 3 Parameters of the infrared thermocamera FLIR, A 325 used during the
experiment
50
Table 4 Results from the DSC experiments, moisture and non freezeable water
estimated
76
Table 5 Results from the DSC experiments, moisture and non freezeable water
estimated
96

INTRODUCTION
In the last 20-30 years, the implementation of new technologies from the
research centres to the food industry process was very fast. Normally, the
technological developments add value to stimulate the agricultural production,
industrial processing and services. In this direction all the companies try to
implement new technologies to reduce the cost of energy respecting also the
environmental rules. The further distinguished characteristics of the food industry
are the technological and economic relations. Almost all the industrial food
processors have to use the thermal process to obtain an optimal product respecting
the quality and safety standards.
Non-contact and non-destructive methods are increasingly used in the
present in the food industry because of the benefit provided by them. The infrared
thermography has been used in a small part of the food industry because of its
high price and the difficulty of using. The recent infrared thermocamera, the new
software and the lower prices simplified the applications in the industrial field.
Thermography has now a higher applicability in the food industry because it is a
non-contact technique and also totally non-destructive. This confers a big
advantage for the processors saving time, energy and a reduction of cost.
The present work is divided in two big chapters.
The science of thermography and also some applications made in the past by other
researchers were described and presented in the first chapter. In the second
chapter, the researches made on the different food products that can help the food
industry were presented.

2

3
I. INFRARED THERMOGRAPHY IN THE FOOD INDUSTRY
I.1 The science of infrared thermography
Infrared thermography (IRT) or thermal imaging is a rapid, non-contact
and non-destructive powerful technique to determine the defects, changes near-
surface of different products, by measuring the surface temperature. The
etymology of the word ―Thermography‖ derived from ―thermo‖ and ―graphy‖, the
Greek origin words, ―thermē‖ that means heat, warm, and ―graphein‖ that means
graphic, writing and literally we can say that thermography is ―writing with heat‖.
This technique involves the detection of electromagnetic radiation, the invisible
infrared pattern emitted by the surface objects, and the conversion of this into a
visible image - ―thermogram‖ (Vavilov 1992; Carino 1994; Rao 2008;
Vadivambal & Jayas 2010). In fact this technique is like taking photographs but
with a camera having an infrared detector.
The classical instruments like thermometers, thermocouples, thermistors,
and resistance temperature detectors can measure the temperature only at specific
point and most of these instruments need a contact with material (Meola 2004,
Vadivambal & Jayas 2010). The thermography revolutionized the concept of
measurements and temperature monitor and this can be very useful for many
fields that require a non-contact method and a bigger area to determine the
temperature of the products (Omar 2005; Vadivambal & Jayas 2010).
The first mentions of existence of invisible thermal rays had been
hypothesized by Titus Lucretius Carus (c.99 – c. 55 BCE), a roman poet and the
author of the philosophic epic ―De Rerum Natura‖ (―On the Nature of the
Universe‖) (Vavilov 1992). In 1800,3 the Sir William Herschel, English royal

4
astronomer and physicist of King George III, discovered the first thermal
radiation, infrared radiation outside the deep red in the visible spectrum, the
invisible light later called infrared (Herschel 1800, Vavilov 1992, Meola 2004).
The son of Sir William, Josh Hershel, proposed an evaporograph like a prototype
of IR imagers that focused with a lens solar radiation onto a suspension of carbon
particles in alcohol. In 1840 he called a thermal image ―thermogram‖, term still in
use today (Vavilov 1992). As a result of the next studies and observations of
others scientists like Macedonio Melloni, Gustav Kirchhoff, James Clerk
Maxwell, Joseph Stefan, Ludwig Boltzmann, Max Planck, Albert Einstein, and
others contributed to a fast progress of infrared thermography that become an
important technique to determine the surface temperature of the objects (Vavilov
1992; Meola 2004). In 1954 a real prototype of an airborne opto-mechanical IR
imager was developed in the USA and was an important step for the development
of Forward Looking Infrared (FLIR) systems mounted on aircraft (Vavilov 1992).
After the military application used in World War II, more technology was
developed for many fields like aerospace industry, civil structures, medicine,
agriculture and food industry, non-destructive evaluation, environmental and
others (Vavilov 1992; Omar 2005). Thermal non-destructive testing (TNDT) is a
particular application area of IR thermography with its own history. One of the
first industrial applications of TNDT was related to analysis of hot rolled metal by
Nichols on 1935 (Vavilov 1992). This technique was also used in the civil
engineering to detect the corrosion-induced delaminations in reinforced concrete
bridges decks in North America, where in the late 1970s, Virginia Highway and
Transportation Research Council (Clemeiia & McKeel, 1978) and the Ontario
Ministry of Transportation and Communication (Manning and Holt, 1983) do the

5
early research independently (Carino 1994). This initial studies involved handheld
scanners and photographic cameras to record the thermographic images (Carino
1994). In figure 1 we can see a scheme with the important components of an
infrared thermocamera.
Figure 1 Components of an Infrared Sensing Instrument (Zayicek 2002)
The infrared radiation (IR) is not detectable by the human eye, and the
most important element of IR camera is the radiation receiver called detector. The
infrared thermocamera detector is a focal plane array (FPA) of micrometer size
pixels made of various materials sensitive to IR wavelengths. The resolution of
FPA starts from 160 x 1120 pixels up to 1024 x 1024 pixels (Flir, 2010). We have
2 categories of infrared detectors: quantum detectors and thermal detectors. The
quantum detectors are faster (ns to µs) and more sensitive than thermal detectors,
because they are based on photon detector, the radiation is absorbed within the
material by interaction with electrons (Chrzanowski & Rogalski 2006). But
unfortunately to archive this information quantum detectors require cryogenic
cooling and this is the main obstacle to the more widespread use of this detectors.

6
The bolometer was invented by the American astronomer Samuel Pierpont
Langley at 1878. The bolometers have a temperature dependency and they
measure electrical resistance. The changes of temperature can be measured
directly or via an attached thermometer. The most used and cheap thermal
detector is a microbolometer, a special detector for measuring the energy of
incident electromagnetic radiations. The infrared radiation wavelengths between
7-14 µm strikes the detector material, heating it, and thus changing his resistance.
This electrical resistance is measured and processed into temperatures to create an
image – thermogram. In the last period, thermal detectors are more exploited in
commercial systems because they are cheaper, do not require cooling and can be
obtained good imagery. The speed and the moderate sensitivity of thermal
detectors are quite adequate for nonscanned imagers with two-dimensional (2D)
detectors. The performance of a thermocamera is determined by the quality of the
thermal image and the temperature resolution.
Large arrays of thermal detectors could help reach the best values of noise
equivalent differential temperature (NETD), below 0.1 K, due to effective
bandwidths less than 100Hz. It can be shown that the temperature sensitivity of an
imager, the so-called noise equivalent temperature (NETD), can be given by
(Lloyd, 1975):
*2/1
2/12
# )(4
MtA
ffNETD
op
(I.1.)
where f# is the f-number of the detector optics (f# = f/D, f is the focal length and D
the diameter of the lens), top the transmission of the optics and M* the figure of
merit that includes not only the detector performance D* but also the spectral

7
dependence of the emitted radiation, ( )/( TS ), and the atmospheric
transmission tat, it is given by following equation:
dDtT
SM at
*
0*
(I.2.)
NETD of one detector is the difference of temperature of the object
required to produce an electric signal equal to the rms (root mean square) noise at
the input of the display (Rogalski 2000).
The infrared electromagnetic radiation is located in the infrared
electromagnetic spectrum like we can see in the figure 2. Infrared radiation covers
a portion of the electromagnetic spectrum from approximately 700 to 14.000
nanometres (0.7-14 µm). All the objects emitted infrared radiation above absolute
zero (0 kelvin = -273, 15°C), and the amount of radiation increased with
temperature. The intensity of object radiation is directly correlated with the
temperature distribution on the surface of the object, and depends also on the
surface condition, thermal properties of the material and the environment (Weil
1992).
Figure 2. Electromagnetic Spectrum (Kaiser 1996)

8
Following the works of Planck, Stefan, Boltzmann, Wien, Rayleigh and
Kirchhoff, they defined precisely the electromagnetic spectrum and established
quantitative and qualitative correlations describing the infrared energy. The
objects are composed of continually vibrating atoms, with higher energy atoms
vibrating more frequently and this vibration of all particles generates
electromagnetic waves. The higher temperature of an object is, the faster
vibration, and thus the higher the spectral radiant energy (Chrzanowski &
Rogalski 2006). The measurement of thermal infrared radiation is the basis for
non-contact temperature measurement and thermal imaging (or thermography)
(Zayicek 2002). All the objects are continually emitting radiation at a rate with a
wavelength distribution that depends upon the temperature of the object and its
spectral emissivity ε (γ) (Chrzanowski & Rogalski 2006). The process of thermal
infrared radiation leaving a surface is called exitance or radiosity. (Zayicek 2002).
One object reacts to incident radiations from its surroundings by absorbing,
reflecting, or transmitting, passing through (as through a lens) as illustrated in
figure 3.

9
Figure 3 Radiation exchange at the target surface (Zayicek 2002)
Kirchhoff’s law states that the sum of the three components is always equal to the
received radiation (the percentage sum of the three components equals’ unity):
W = αW + ρW +τW, (I.3.)
This can be simplified to:
1 = α + ρ + τ (I.4.)
where W is total radiation, α is the absorption, ρ is reflection and τ transmission.
Radiant emission is usually treated in terms of the concept of a blackbody, a
theoretical ideal emitter (Ross 1994, Chrzanowski & Rogalski 2006). A
blackbody is an object capable of absorbing all incident radiation at any
wavelength and conversely, according to the Kirchhoff law, is a perfect radiator.

10
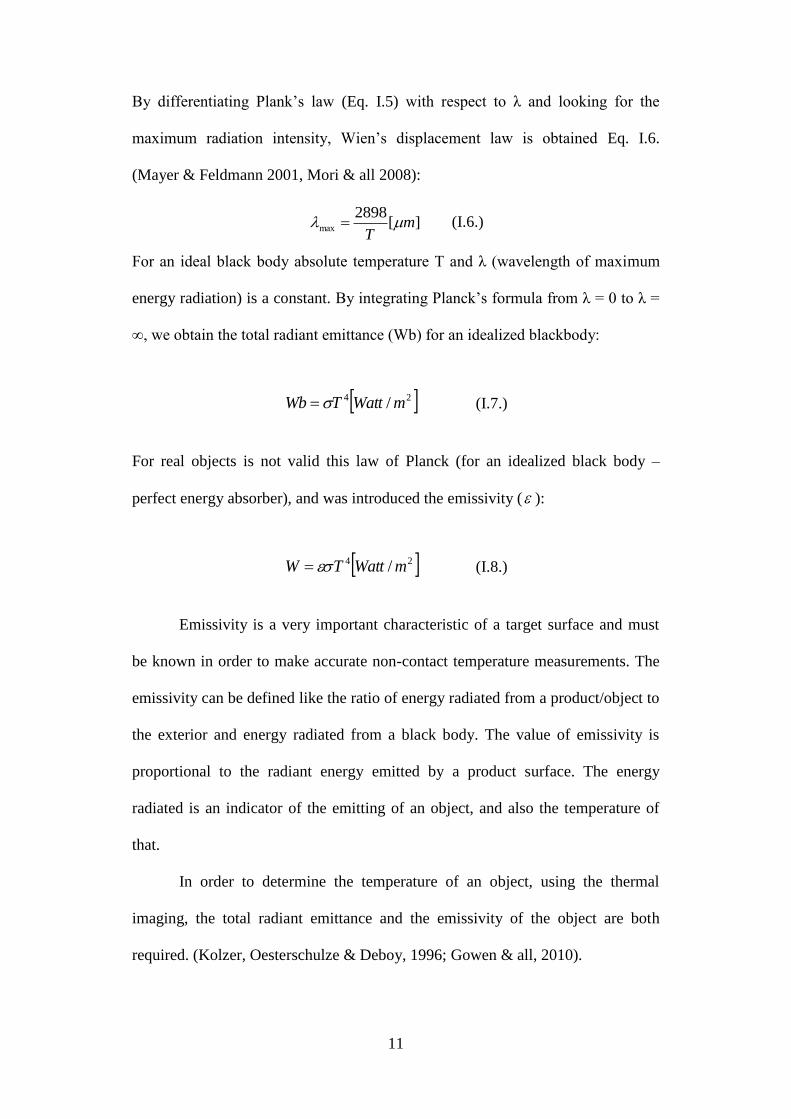
Figure 4 Planck’s law for spectral emittance (Burnay et al., 1988)
The energy emitted by an ideal blackbody is the maximum theoretically possible
for a given temperature. The radiative power (or number of photons emitted) and
its wavelength distribution is given by the Planck radiation law (Chrzanowski &
Rogalski 2006):
1
5
2
1)exp(2
),(
kT
hchcTWb
W cm
-1µm
-1 (I.5.)
where Wb (W cm-1
µm-1
) energy radiated per unit volume by a cavity of a
blackbody in the wavelength interval, λ (µm) is the wavelength, T (K) the absolute
temperature of a blackbody, h (6.6 × 10⁻³⁴
Joule sec) Planck’s constant, c (3 × 10⁸
m/s) the velocity of the light and k (1.4 × 10⁻²³
Joule/K) Boltzmann’s constant.
We can see a plot of these curves for a number of black body temperatures in the
figure 4.
11
By differentiating Plank’s law (Eq. I.5) with respect to λ and looking for the
maximum radiation intensity, Wien’s displacement law is obtained Eq. I.6.
(Mayer & Feldmann 2001, Mori & all 2008):
][2898
max mT
(I.6.)
For an ideal black body absolute temperature T and λ (wavelength of maximum
energy radiation) is a constant. By integrating Planck’s formula from λ = 0 to λ =
∞, we obtain the total radiant emittance (Wb) for an idealized blackbody:
24 / mWattTWb
(I.7.)
For real objects is not valid this law of Planck (for an idealized black body –
perfect energy absorber), and was introduced the emissivity ( ):
24 / mWattTW
(I.8.)
Emissivity is a very important characteristic of a target surface and must
be known in order to make accurate non-contact temperature measurements. The
emissivity can be defined like the ratio of energy radiated from a product/object to
the exterior and energy radiated from a black body. The value of emissivity is
proportional to the radiant energy emitted by a product surface. The energy
radiated is an indicator of the emitting of an object, and also the temperature of
that.
In order to determine the temperature of an object, using the thermal
imaging, the total radiant emittance and the emissivity of the object are both
required. (Kolzer, Oesterschulze & Deboy, 1996; Gowen & all, 2010).

12
Emissivity or emittance is defined as the ratio of energy emitted from an
object to the exterior, to that of a black body at the same temperature. Emissivity
can vary from 0 (perfect white body) to 1 (perfect black body) (Gowen & all,
2010). The emissivity depends on: the composition of material, the geometry, the
surface type and roughness. Usually the materials have an emissivity ranging from
0.1 to 0.99. For objects made of metal the emissivity is low increasing with
temperature, and for non-metals objects it tends to be high, nearby 1 and
decreases with temperature. The biological products normally have the emissivity
nearby 1, same like the human skin (Flir, 2010).
The infrared thermocamera converts the energy emitted by an object into
electrical signal via IR detectors, and displays it as a thermal image (colour or
monochrome); this we can estimate the surface temperature of objects.
We can obtain the thermal images using the most used and important
methods: passive or active thermography systems (classified by the source of
heating of the object). We can talk about the passive thermography when the body
of the object is heated by ambient conditions (solar radiation) (Rao, 2008).
In the active thermography the object is heated by an external source to
obtain the contrast of temperature. Normally the passive thermography is used for
assessing the large bodies like buildings, bridges, while active thermography is
generally adopted in research centres and for different industrial processes (Rao,
2008). The thermal information obtained in the passive mode largely describes
surface thermal properties (Gowen, 2010) Regarding the active thermography we
have different techniques for generating thermal energy like lock-in thermography
(expose to infrared radiation), pulsed-phase thermography (repeated heating at
short intervals of time), impulse thermography (local heating),

13
vibrothermography (expose to sonic waves) (Rao, 2008, Maldague, Galmiche, &
Ziadi, 2002, Shepard, Ahmed, & Lhota, 2004, Gowen & all, 2010)
Lock-in thermography, known as ―modulated thermography‖, requires a
thermal excitation applied to the sample surface to generate thermal waves. The
infrared thermocamera can monitor the sample during the modulated excitation,
measuring the resultant oscillating temperature field (Maldague, Galmiche, &
Ziadi, 2002, Sakagami & Kubo, 2002, Gowen & all, 2010). Using a sinusoidally
varying light source like laser beam, halogen lamp etc. the method is known as
―optically excited lock-in thermography‖ (Gowen & all, 2010). If we can observe
on the surface of the sample one uniformed temperature rise, then the sample
doesn’t have any defects; on the contrary, if we can observe regions with high
temperature, those areas correspond to the areas where the defects of a sample are.
(Sakagami & Kubo, 2002). As a consequence, the temperature distribution on the
sample surface is used to estimate the location, shape and the size of the defects
(Sakagami & Kubo, 2002).
The pulsed-phase thermography (PPT) combines the pulsed acquisition
procedure with phase/frequency concepts of lock-in thermography for which
specimens are submitted to a periodical excitation. This method was introduced
for non-destructive evaluation in infrared thermography applications a few years
ago as an interesting signal processing technique (Maldague et al., 2002).
To estimate the phase between the applied energy and local thermal
response, this two techniques (lock-in and pulsed-phase thermography), use the
Fourier transform on each pixel level of the time series of thermal images
(Sakagami & Kubo, 2002, Gowen & all, 2010, Maldague et al., 2002).

14
Impulse thermography method requires an internal or external local
heating of the sample; the heated part is observed by the infrared thermocamera to
record the temperature change at the surface as a function of time. This method is
more useful in civil engineering where we can detect defects like the voids, cracks
in concrete, in tendon ducts and more (Maierhofer & all, 2006).
These considerations define the use of vibrothermography as a non-
destructive method for observing the energy-dissipation ability of granular
material. A scanning camera was used, which is analogous to a television camera.
It utilizes an infrared detector system in a sophisticated electronics system in order
to detect radiated energy, and to convert it into a detailed real-time thermal picture
in a video system both colour and monochromatic. Response times are shorter
than a microsecond.
Vibrothermography is used as a non-destructive method for observing
the energy-dissipation ability of granular material, employs sonic waves to impart
energy to the target surface. Flaws such as cracks and inclusions within a target
resonate at the applied sonic frequency, resulting in localised heating. One
advantageous feature of this technique compared with other methods of active
thermography is that the bulk of the sample is not heated; therefore, contrast
between flaws and surrounding material is increased (Shepard, Ahmed, & Lhota,
2004; Loung, 2007; Gowen & all, 2010).
According with Vavilov, 1992 all the IR imagers can be classified by
application areas as follows:
1) simple imaging units used for night vision in military, IR
reconnaissance, search and rescue, observation, fire fighting, technical diagnostics

15
etc., such as PalmIR-250 from Raytheon, Night Conqueror from Cincinnati
Electronics etc.;
2) radiometric (temperature measuring) imagers used in technical
diagnostics and non-destructive testing (general-purpose IR cameras and modules,
such as ThermaCAM P60 and ThermoVision A40 from FLIR Systems, TH-9100
Pro from NEC Avio, Testo-880 from Testo etc.);
3) radiometric computerized IR thermographic systems mainly intended
for scientific research and characterized by the highest temperature sensitivity and
frame frequency, such as ThermaCAM SC 6000 from FLIR Systems and SC 7000
from FLIR-CEDIP. (Vavilov 1992)
Regarding IR imagers performance, a definite trend is further
improvement of temperature and spatial resolution and increase of frame
frequency. This non-destructive method will become more efficient and flexible
to test different objects with different geometry.

16

17
I.2 Research concerning past and recent application of
thermography in the food industry
The infrared thermography is a technique used recently for agriculture and
food industry, in the past it was developed only for military applications and the
price for this device was cost-prohibitive and no portable versions existed. In the
last 10-15 years the prices for the sensors of infrared thermocamera decreased
drastically and the producers created small portable versions for field
measurement.
In food industry we know that the heating process has a major
importance’s to obtain a good and safe product with a long shelf life. Also we
know that the traditionally way to measure and monitor the temperature with
different methods (thermometers, thermocouples, thermistor) provide only a
limited information’s.
The thermal imaging has revolutionized the concept of temperature
measurement in industries, and also in agriculture and food industry, because is a
very helpful tool to be exploited for the assessment of manufacturing procedures
as well for non-destructive evaluation of either end products, is fast, and also is a
non-contact analysis (Vavilov, 1992, Gowen & all, 2010, Vadivambal & Jayas,
2010).
The recent research shows the potential of IRT for agriculture and food
safety and quality assessment such as temperature validation, bruise and foreign
body detection, grain quality evaluation, assessing the seedling viability,
estimating soil water status, estimating crop water stress, scheduling irrigation,
determining disease and pathogen affected plants, estimating fruit yield,

18
evaluating maturity of fruits and vegetables and more over (Vadivambal & Jayas,
2010, Gowen & all, 2010).
In 1999 Nott & Hall used infrared thermal imaging for mapping the
temperature distributions induced by microwave in situ in two dimensions with
good results in spatial resolution. The advantage of this technique is the non-
invasive properties (can be applied to real food system without alterations), and
the disadvantage is that it only provides a surface measurement from which the
temperature within the sample has to be inferred in opinion of the same
researchers (Nott & Hall, 1999).
The spatial and temporal temperature distribution patterns obtained from
an object could have a potential application for food industry, for quality
assurance, safety profiling and authenticity. Du & Sun conclude that the necessity
of computer-based image processing technique is a consequence of increasing
demands for consistency and efficiency within the food industry.
In scientific literature we can discover only some research in the food
sector where thermal imaging was used. In the following paragraphs, I will
present briefly this recent advances and the potential of application of infrared
thermography for the food industry.
Advance and potential applications of thermal imaging to monitor the
surface temperature of food product cooked in a microwave oven, in the spectral
range of 8-12 µm, was reported by Goedeken, Tong, and Lentz (1991).
Others researchers, like Ibarra et al. (1999) applied this technique using a
spectral range of 3.4 - 5 µm to control the heating and cooling cycles at the
surface of food samples. They created a statistical model to express the internal
temperature of breast chicken in terms of the external temperature and time. They

19
obtained an accuracy of ± 1.22°C for cooling times between 0 and 450 s, and ± 0,
55 °C after cooking. This research confirms that thermal imaging has a good
potential for the real-time determination of the internal temperature of cooked
chicken meat in industrial line to verify that the minimum endpoint temperature
has been achieved.
Workmaste et al, (1999) used the infrared thermography to study the ice
nucleation and propagation in plants and confirmed that the technique can be
useful for studying the freezing process of plants.
Costa et al. (2007) used the infrared thermography on the slaughter-line for
the assessment of pork and raw ham quality. They obtained good results when
evaluating the meat and ham, using surface temperature differences. They
analyzed 40 carcasses of heavy pigs at 20 min. after stunning, thus left and right
caudal and dorsal surface images were kept for each half carcass. The settings of
the camera were as follows: emissivity of pig’s skin 0.98; reflected air
temperature 22°C; distance between camera and skin surface m 2.5. These studies
confirm the absence of relationship between meat quality traits and the skin
surface temperature. The ham with a lower fat cover has a surface warmer surface.
The preliminary results show a possible application of this technique for a good
selection of raw hams destined to the successive dry-cured processing.
Others researches concerned to facilitate the control of heating and cooling
cycles on surface of different food samples, for example the apparatus realized by
Foster, Ketteringham, Swain et al., 2006. They design and develop an apparatus to
provide repeatable surface temperature-time treatments on inoculated food
samples using thermal imaging camera for temperature measurements.
Temperature control to a defined ramp was achieved at an average accuracy of 1.7
20
°C and 2.4 °C on the sample surface, during heating and holding periods,
respectively (Foster, Ketteringham, Swain et al., 2006).
Manickavasagan, Jayas, White, and Jian (2006), studied the application of
thermal imaging for detection of hot spots in grain storage silos; the existence of
non-contact method to detect hot spot in a grain silo is very important. They
realize a small silo, filled with barley, to see the capability of thermal imaging to
detect a hot spot inside the silos. Artificial heat sources were used placed in 9
different locations inside the bulk and setup at 4 temperature levels (30, 40, 50,
and 60 °C) in each location. The infrared thermocamera was placed on the top of
the silos (the outer surface) and a hot spot was choosen. If the wind had a velocity
of 1, 1.5, 2 m/s it was impossible to detect the hot spot. The same situation
happened when the ambient temperature was 1°C and silo wall temperature was –
8 °C. Hot spot was detected from the thermal images when was located 0.3 m
from the silo wall and 0.3 m below the grain surface, respectively. They reported
that is not possible to use only the thermal imaging to monitor the grain
temperature on the silo.
Manickavasagan, et al. has developed in 2008 an infrared thermal imaging
system to identify eight western Canadian wheat classes. The wheat samples were
heated by a plate maintained at 90 °C, and the surface of the grain bulk were
imaged. The samples were imaged before heating, after heating for 180 s and after
cooling for 30 s using an infrared thermocamera.
This research showed the potential and accuracy of thermal imaging for
classification of wheat cultivars which are difficult to distinguish by visual
inspection, and may have potential to develop classification methods for varieties
and grain. Other investigation is required to study the performance of this system

21
for wheat from different crop years, samples mixed with defects (drought stressed
and other defects), and samples of varying kernel sizes and quality (such as
protein) within a class (Manickavasagan, & al., 2008).
More and more researchers study this field to evaluate the maturity state of
fruits and vegetables. The first ones were Danno, Miyazato and Ishiguro on 1980.
When the organic products (fruit and vegetables) generate heat in the metabolic
processes, the IR thermocamera can detect this temperature change on the surface.
The fruits and vegetables analyzed were: Japanese Persimmon, Japonese Pear and
tomato. They applied the same techniques as the ones used for grading apple for
bruise and to discriminate of hatching eggs during the incubation period. The
grade of maturity was divided in three categories: immaturity, maturity and over-
ripe depending on their colour, firmness and sugar content. The samples were kept
in two thermo-regulated rooms at 30 degrees and 5 degrees, respectively. The
changes in the surface temperature and the grade of maturity of samples were
investigated and also the relationship between the surface temperature and the
grade of maturity of the samples.
Varith et Al. (2003) have studied the use of infrared thermography to
detect bruises on apples stored at 3°C that were heated at 26°C with hot air. It’s
possible to detect apple bruise with thermal imaging because differences in
temperature between sound tissues and bruised were detected, depending on their
thermal properties. To detect the bruised apples, four thermal properties were
associated in heat transfer: thermal diffusivity (α), thermal conductivity (k),
specific heat (Cp), and thermal emissivity (ε). Stroshine, 1998 related that the
damaged cells release water into tissue air spaces, which may increase the thermal
conductivity. Mohsenin (1996) demonstrated that the moisture in old bruises

22
migrates out of damaged tissue, leaving a brown bruise, reducing bruise mass,
density, specific heat and possibly thermal conductivity.
They reported the difference from the sound tissue within 30-180 s was at
least 1-2°C in thermal images, and the asymmetries differences were possibly due
to the differences in thermal diffusivity. They accept that these techniques provide
good information about automatic bruise sorting and maybe some information to
understand better the bruise tissue of the apples.
Other researches on apples were conducted by Veraverbeke et al. (2006) to
monitor the cooling rate and surface temperature in relation to the surface quality
and wax layer structure before and during storage. The first step in this research
was to determine the emissivity, 0.96, for two different cultivars Jonagored and
Elshof. After that they recorded the cooling from 20 °C to 12 °C they showed that
the Elshof apples had a faster cooling rate and lower temperature than Jonagored
apples, which may be related to differences in wax structure between these
cultivars. The changes in wax structure occurred during storage were not detected
using thermographic imaging.
The most recent researches to detect early bruise in apples resulted in a
system made by Baranowski et al. (2012) that incorporates the hyperspectral
imaging and infrared thermal imaging. Hyperspectral image analysis was
performed by application of principal components analysis (PCA) and minimum
noise fraction (MNF). Thermal imaging (3000-5000nm) is useful for bruise
recognition when an active approach (lock-in or pulsed-phase) is applied.
The created models of supervised classification based on VNIR, SWIR
and MWIR ranges show that best prediction efficiency for both distinguishing
bruised and sound tissues as well as for detecting bruises of various depths is

23
obtained for models using these three ranges together; the conclusion is that it is
recommended to include MWIR range into sorting systems.
Thermal imaging was first used by Van Linden, Vereycken, Bravo,
Ramon, and De Baerdemaeker (2003) to detect tomato bruise.
They compared three temperature treatments with respect to bruise
detection. The analysis process contained the following steps: cooling the
tomatoes for 90 minutes at 1°C then warming them up in an oven at 70°C for 1 or
2 min. and shortly warming them up by means of microwaves during 7 or 15 s.
The most significant differences between bruised and intact tissue were after a 15s
treatment by means of microwaves, observing cold circular spots of bruises on
thermal images of the tomato surface.
This experiment provides a good method for automatic bruise detection of
tomatoes.
Wang et al. (2006) use the infrared thermocamera to determine the surface
temperature distributions of walnut kernels during radio frequency (RT) treatment
protocols to control insect pests in in-shell walnuts. A pilot system was used to
determine the effect of process parameters on walnut temperature distribution.
Temperatures of vertically oriented walnuts were 7.4 °C higher than those of
horizontally oriented walnuts. They report that the open shell walnuts are heated
much faster in RF systems than closed shell walnuts after 1.5 minutes of
bleaching. When they mix twice the walnuts during 3 min. of RF treatment
improved the heating uniformity of final walnut temperatures. This experimental
provide very useful information for designing an industrial scale quarantine
security process against insect pest in walnuts as an alternative to chemical
fumigation.

24
Fito et al. (2004) reported the use of infrared thermocamera to control
citrus surface drying by image analysis. Drying citrus surface is an important
operation in a fresh fruit processing plant, but air temperature is very difficult to
control. In industry, excessive air temperature is usually used or the fruit are left
long time in the drier, decreasing the fresh fruit shelf life and also causing a loss
of sensorial quality.
They tested a new system using infrared technique to control the surface
drying time by image analysis of the fruit surface temperature distribution. The
oranges from Valencia Late variety were washed with water or covered with wax
and were dried at 20, 25 and 35°C at different air velocity 1, 1.5, respectively 2
m/s. The fruit emissivity was measured by tempering the fruits at 20 degrees and
the value of that it’s 0.95. The surface temperature during the drying process was
measured with an AGEMA 470 the lowest surface temperature of the fruit was
assumed to be the wet bulb temperature.
They considered that the drying time could be established when the
temperature at any point of the citrus surface exceeded this value.
They created also an empirical model to correlate drying times with air
conditions, and these parameters can be used in industrial control systems for
citrus surface driers. Image analysis of infrared thermography has a good
applicability in food industry to determine the moment when surface drying ends
and the peel drying begins. This nondestructive technique offers a real possibility
to control better the heat consumption and fruit quality.
Albert et al. in 2011 reported the study ―A film of alginate plus salt as an
edible susceptor in microwaveable food‖. The research was made using infrared
thermal imaging. As they said, cooking or warming battered and breaded foods in

25
a microwave oven results in a lack of crunchiness due the way microwaves heat
foods. They tried to solve this problem with a film of alginate gel with high salt
concentration between substrate and batter used as an edible susceptor.
They prepared chicken nuggets sample with alginate coating set in a
calcium chloride (3%) plus sodium chloride (10%, 20%, and 30%) solution bath.
The prefried nuggets were cooked in a microwave oven at different
cooking times were used: 15, 20, 25, 30, 35, 40, 45, 50, 55 and 60 s. A thermal
camera was used to observe how heat was distributed once this new film of
alginate plus salt was incorporated. They took out the nugget sample from the
microwave after each preselected time, sectioning it perpendicularly through the
center immediately after, separating the two halves, and thermographing the two
exposed cross sections. They set the emissivity of the nuggets at 0.920. The
temperature distribution was registered from each sample’s thermogram. They
observed that the alginate films produced more even heating patterns of the
nuggets and shorter cooking times and it can be concluded that this technique has
given a useful tool to study the edible susceptor performance.
Lahiri et al. (2012) applied infrared thermography in the microbiology
field research. They studied the detection of some pathogenic gram negative
bacteria (Vibrio cholerae, Vibrio mimicus, Proteus mirabilis, Pseudomonas
aeruginos) using this technique. The conventional methods of enumerating
bacteria require labor-intensive and are usually time consuming. During the
metabolic activities all the organisms generate heat, measuring this energy is a
viable tool to detect and quantify bacteria.
They also observed that, the energy content; defined as the ratio of heat
generated by bacterial metabolic activities to the heat lost from the liquid medium
26
to the surrounding, vary linearly with the bacterial concentration in all the four
pathogenic bacteria (Lahiri et al., 2012).
This research shows that infrared thermography could be employed as a
real-time, non-contact alternative for quantification of clinically significant
pathogens. More studies are required to test the universality of this new approach
to be applied for a wide range of pathogens.

27
I.3. References
Albert, A., Salvador, A., Fiszman, S.M. (2011). A film of alginate plus salt as an
edible susceptor in microwaveable food. Food Hydrocolloids, 27, 421 - 426
Baranowski, P., Mazurek, W., Wozniak,J., Majewska,U. (2012). Detection of
early bruises in apples using hyperspectral data and thermal imaging. Journal of
Food Engineering 110, 345–355.
Burnay, S.G, Williams, T. L. & Jones, C. H. (1988) Applications of Thermal
Imaging, Bristol: Hilger
Castro, L. M. & Gavarrete, E. (2000). Competitividad en Centroamérica 1999.
CEN 1405, Centro Latinoamericano para la competitividad y el desarrollo
sostenible. CLACDS/INCAE, San José.
Carino, N.J. (1994). Concrete Technology: Past, Present and Future.
Nondestructive Testing of Concrete: History and Challenges, American Concrete
Institute (ACI SP-144), 623-678.
Chrzanowski, K., & Rogalski, A. (2006). Infrared devices and techniques.
Handbook of Optoelectronics (Two-Volume Set) Edited by Robert G . W . Brown
and John P Dakin Taylor & Francis, 653–692
Costa, L. N., Stelletta, C., Cannizzo, C., Gianesella, M., Lo Fiego, D. P., &
Morgante, M. (2007). The use of thermography on the slaughter-line for the
assessment of pork and raw ham quality. Italian Journal of Animal Science, 6, 704
- 706.
Danno, A., Miyazato, M., & Ishiguro, E. (1980). Quality evaluation of
agricultural products by infrared imaging method. III. Maturity evaluation of
fruits and vegetables. Memoirs of the Faculty of Agriculture Kagoshima
University, 16, 157 - 164.

28
Du, C. J., & Sun, D. W. (2004). Recent developments in the applications of
image processing techniques for food quality evaluations. Trends in Food Science
& Technology, 15, 230 - 249.
Fito, P. J., Ortola´, M. D., De los Reyes, R., Fito, P., & De los Reyes, E. (2004).
Control of citrus surface drying by image analysis of infrared thermography.
Journal of Food Engineering, 61(3), 287 - 290.
Flir (2010). The ultimate infrared handbook for R&D professionals.
Foster, A. M., Ketteringham, L. P., Purnell, G. L., Kondjoyan, A., Havet, M.,
& Evans, J. A. (2006). New apparatus to provide repeatable surface
temperatureetime treatments on inoculated food samples. Journal of Food
Engineering, 76, 19 - 26.
Foster, A. M., Ketteringham, L. P., Swain, M. J., Kondjoyan, A., Havet, M.,
Rouaud, O. et al. (2006). Design and development of apparatus to provide
repeatable surface temperature etime treatments on inoculated food samples.
Journal of Food Engineering, 76, 7 - 18.
Fuller, M. P. & Wisniewski, M. (1998). The use of infrared thermal imaging in
the study of ice nucleation and freezing of plants. Journal of Thermal Biology, 23,
81 - 89.
Giaime Ginesu, Daniele D. Giusto, Volker Märgner, & Peter Meinlschmidt
(2004). Detection of Foreign Bodies in Food by Thermal Image Processing, IEEE
Transactions on industrial electronics, Vol. 51, no. 2.
Goedeken, D. L., Tong, C. H., & Lentz, R. R. (1991). Design and calibration of
a continuous temperature measurement system in a microwave cavity by infrared
imaging. Journal of Food Processing & Preservation, 15, 331 - 337.

29
Gowen, A. A., Tiwari, B.K., Cullen, P.J., O’Donnell, C.P., McDonnell, K.
(2010). Applications of thermal imaging in food quality and safety assessment.
Trends in Food Science & Technology 21, 190-200
Herschel, W. (1800) Experiments on the refrangibility of the invisible rays of the
Sun Phil. Trans. Roy. Soc. London 90 284
Ibarra, J. G., Tao, Y., Walker, J., & Griffis, C. (1999). Internal temperature of
cooked chicken meat through infrared imaging and time series analysis.
Transactions of ASAE, 42, 1383 - 1390.
Ibarra, J. G., Tao, Y., & Xin, H. (2000). Combined IR imaging-neural network
method for the estimation of internal temperature in cooked chicken meat, Society
of Photo-Optical Instrumentation Engineers 39, 3032 - 3038
Kaiser, P. K. (1996). The joy of visual perception.
http://www.yorku.ca/eye/spectru.htm Accessed 15 Jan 2011.
Kolzer, J., Oesterschulze, E., Deboy, G. (1996). Thermal imaging and
measurement techniques for electronic materials and devices, Microelectronic
Engineering, 31, 251–270
Lahiri, B.B., Divya, M.P., Bagavathiappan, S., Thomas, S., Philip, J. (2012).
Detection of pathogenic gram negative bacteria using infrared thermography,
Infrared Physics & Technology 55, 485 - 490
Luong, M.P. (2007). Introducing infrared thermography in soil dynamics.
Infrared Physics & Technology, 306-311
Lloyd, J. M. (1975), Thermal Imaging Systems

30
Maierhofer, Ch., Arndt, R., Röllig,M., Rieck, C., Walther, A., Scheel & H.,
Hillemeier, B. (2006). Application of impulse-thermography for non-destructive
assessment of concrete structures. Cement & Concrete Composites 28, 393-401
Maldague, X., Galmiche, F., & Ziadi, A. (2002). Advances in pulsed phase
thermography. Infrared Physics & Technology, 43, 175 -181.
Maldague, X., (2002), Introduction to NDT by Active Infrared Thermography,
Materials Evaluation, 6, 1060 -1073,
Manickavasagan, A., Jayas, D.S., White, N.D.G., & Paliwal, J. (2008). Wheat
class identification using thermal imaging. Food and Bioprocess Technology 3,
450–460
Manickavasagan, A., Jayas, D. S., White, N. D. G., & Jian, F. (2006). Thermal
imaging of a stored grain silo to detect a hot spot. Applied Engineering in
Agriculture, 22(6), 891 - 897.
Mayer F, Feldmann, O. (2001) Optical Measurements (Techniques and
Applications), 2nd edn. Springer-Verlag,
Meola, C., Carlomagno, G.M. (2004). Recent advances in the use of infrared
thermography, Measurement Science and Technology 15, 27–58.
Mohsenin, N. N. (1996). Mechanical damage. Physical Properties of Plant and
Animal Materials, 481 – 615. Canada: Gordon and Breach Publishers.
Mori, M., Novak, L., Sekavčnik, M., Kuštrin, I. (2008). Application of IR
thermography as a measuring method to study heat transfer on rotating surface -
Forschung im Ingenieurwesen, Springer-Verlag.
Moss, C.E., Ellis R.J., Murray W.E., Parr, W.H., (1988). Nonionizing radiation
protection. Infrared radiation. WHO Reg Publ Eur Ser. 85-115.

31
Nott, K. P., & Hall, L. D. (1999). Advances in temperature validation of foods.
Trends in Food Science & Technology, 10, 366 - 374.
Omar, M., Hassan M. I., Saito K., and Alloo, R. (2005). IR self-referencing
thermography for detection of in-depth defects, Infrared Phys. Technology, vol.
46 (4), 283 - 289.
Petersen J . K . (2012). Handbook of Surveillance Technologies, Third Edition
CRC Press.
Rao, D. S. Prakash (2008), Infrared thermography and its applications in civil
engineering, Indian Concrete Journal
Rogalski, A. (2000). Infrared Detectors. Gordon and Breach Science Amsterdam:
Gordon and Breach)
Ross, W. (1994) Introduction to Radiometry and Photometry, Boston: Artech
Sakagami, T., Kubo, S. (2002). Applications of pulse heating thermography and
lock-in thermography to quantitative nondestructive evaluations. Infrared Physics
& Technology 43, 211–218
Shepard, S. M., Ahmed, T., & Lhota, J. R. (2004). Experimental considerations
in vibrothermography. Experimental considerations in vibrothermography.
Proceedings of SPIE, 5405, 332.
Stroshine, R. (1998). Thermal properties and moisture diffusivity. Physical
Properties of Agricultural Materials and Food Products. 217 –238. Purdue
University, West Lafayette, IN.
Vadivambal, R., & Jayas, D. S., (2010). Applications of thermal imaging in
agriculture and food industry—a review. Food and Bioprocess Technology.

32
Van Linden, V., Vereycken, R., Bravo, C., Ramon, H., & De Baerdemaeker,
J. (2003). Detection technique for tomato bruise damage by thermal imaging.
Acta Horticulturae (ISHS), 599, 389 - 394.
Varith, J., Hyde, G. M., Baritelle, A. L., Fellman, J. K., & Sattabongkot, T.
(2003). Non-contact bruise detection in apples by thermal imaging. Innovative
Food Science and Emerging Technologies, 4, 211 - 218.
Vavilov, V. P., (1992) Thermal non-destructive testing: short history and state-of-
art Proc. QIRT 92 (Paris) ed D Balageas, G Busse and G M Carlomagno (Paris:
EETI editions), 179–93
Veraverbeke, E. A., Verboven, P., Lammertyn, J., Cronje, P., De
Baerdemaeker, J., & Nicolai, B. M. (2006). Thermographic surface quality
evaluation of apple. Journal of FoodEngineering, 77, 162 - 168.
Wang, S., Tang, J., Sun, T., Mitcham, E. J., Koral, T., & Birla, S. L. (2006).
Considerations in design of commercial radio frequency treatments for
postharvest pest control in in-shell walnuts. Journal of Food Engineering, 77,
304 - 312.
Weil GJ. (1992) Non-destructive testing of bridge, highway and airport
pavements. No Trenches in Town Proceedings of International Conference, Paris,
France; 243–6.
Workmaste, B. A., Palta, J. P., & Wisniewski, M. (1999). Ice nucleation and
propagation in cranberry uprights and fruit using infrared video thermografy.
Journal of the American Society for Horticultural Science, USA, 124
Zayicek, P., (2002) Infrared Thermography Guide (Revision 3), EPRI, Palo Alto.

33
II. APPLICATION OF INFRARED THERMOGRAPHY IN THE
FOOD INDUSTRY
II.1 Experimental validation of a numerical model for hot
air treatment of eggs in natural convection conditions and with
hot-air jet with FLIR- IR thermocamera
II.1.1 Introduction
It is well known that eggs are a very important nutritive product, but also
that there are certain problems that can derive from the consumption of eggs with
pathogenic bacteria. The main goal and all effort should concentrate to inactivate
these microorganisms in order to provide consumers safe and healthy products. In
this direction, the use of all new technology is required and provided to food
operators so they can have better control methods during the production flux. The
most efficient known decontamination method for egg shells was reported by
Standelman (1996) and Hou (1996) with no significant differences regarding the
denaturation of protein between the fresh and pasteurized eggs in the oven. At the
same time, they reported a reduction of the Salmonella Enteritidis by 5 log 10
loads on yolk of eggs, after the treatment in the oven at 55 °C for 180 min.
On the other hand, James et al. (2002) reported significant reduction in
Salmonella numbers without damaging the egg content, with heat treatments
using a hot-air gun. The aim of this research was to validate the numerical model
for hot air treatment of eggs in natural convection condition and with hot-air jet,
using the experimental data obtained with an infrared thermocamera.

34
The models realized by Cevoli et al. (2010) and Fabbri et al. (2010) to
simulate a hot-air treatment of the egg shell was compared with experimental data
on the shell eggs using the thermocouples.
For the first validation, the treatment with hot air, in natural convection
conditions, the calculated temperature was compared with experimental data on
the egg shell obtained using the infrared thermocamera.
For the second validation, the treatment with hot-air jet using high
temperatures (300-500°C) to decontaminate the shell egg, the calculated
temperatures, were compared with experimental data observed. The potential of
treatments using high temperature was tested in the past by James et al. (2001)
and Pasquali et al. (2009). James et al. (2001) heat the eggs at 500 degrees for 8
seconds, but they don’t make any microbiological test. Instead, Pasquali et al.
(2009) used the prototype realized in the past to do a decontamination of shell
eggs using a hot air jet (600°C, two shots) in one side with an interval of 30
seconds and with an cold air jet for 30 seconds (1 shot) on the opposite side of the
egg. They investigated 380 eggs load on S. Enteritidis, during 24 days of storage
at 20 °C. Half of them were head treated, and half not. The hot air treatment
reduces the bacterial S. Enteritidis load on eggshells up to 1.9 log and they
conclude that the pasteurization using the hot air are useful for decontamination of
table eggs.
This research is important to determine the distribution of temperature on
the egg shell surface to have a good control during the decontamination of eggs
shell and not to affect the quality of content of the eggs.

35
II.1.2 The eggs
The European Parliament and the European Council defined by Regulation
(EC) No 853 /2004, the "Eggs" means eggs in shell – other than broken, incubated
or cooked eggs – that are produced by farmed birds and are fit for direct human
consumption or for the preparation of egg products. When shell is removed, we
can talk about the ―egg products‖. In the food industry the most used egg products
are liquid, frozen and dried, products that are safe for consumers.
The eggs are one of the highest quality sources of important nutrients and
they are also easily digested. According with FAO Stats, the level of global
production is about 1.182 billion eggs per year in 2011 or 64 million tons. The
sector of poultry and eggs production was the most dynamic sector in the last 10
years, which was reflected in growing demand for these products. According with
FAO, 2010, in the developing countries the consumer preferences are changing,
increasing the protein demand, especially for low-priced foods such as eggs,
gradual shift in consumption from pork to poultry. The easy way to cook the eggs
and poultry meat changed the lifestyle of many people and this will continue in
the future.
Poultry meat and eggs are a very important source of protein and can be
eaten by all healthy consumers. The eggs are 88.5% edible and are composed of
three main parts: shell, egg white, egg yolk. The shell of an egg is a porous part
that allows the oxygen to enter for the chick but bacteria and different odours can
also enter, and water and CO2 can escape.
The shell egg is usually strong and protects the egg against bacteria. The
older birds produce eggs with shells less strong and the colour varies to the breed.

36
The egg white has 2 layers, one near to the shell and another near to the yolk
(FAO, 2010). Over the 60% of the world’s eggs are produced in industrial
systems and the biggest producers are China, United States, India, Mexico.
Eggs are classified in Europe as follows : small size ( between 42g and
53g), medium size ( 53-63 g ), large ( 63-73 g ), very large ( 73 g and over ) .
The eggs have a high nutritional content: the white part contains 10.5%
proteins, 88.5% water, riboflavin and more vitamins from B group and on the
other hand the yolk part has more nutrients, 16.5% protein, 33% fat, 50% water,
vitamins A, E, K, D, some minerals, emulsifier (lecithin) (FAO, 2010).
In food preparations the eggs are used for: thickening - because of the
coagulation of the egg proteins; emulsifying – to make mayonnaise, cakes because
eggs contain lecithin; binding – ingredients for rissoles, croquettes; coating – they
form the protective layer during frying foods and prevent overcooking; glazing –
used to produce a golden brown shiny glaze during baking the pastries and bread.
Salmonella
One of the most problematic things for using eggs is the contamination
with bacteria such as Salmonella enterica serotype Enteritidis, existing in the
hen’s ovary or oviduct before the shell forms around the white part and yolk. S.
Enteritidis is the serovar which causes more than 60% of human infections with
Salmonella in the European Union (EFSA, 2009). Salmonella belongs to the
Enterobacteriaceae family and is a mesophilic bacteria, developing at
temperatures between 5.2°C and 47°C and optimally between 35°C and 37°C, at
pH between 4.5 and 9, with water activity (Aw) greater than 0.93 and appear as
37
Gram-negative, 0,3 to 1μm wide and 1 to 6 μm microns long (Romane et al.
2012).
The genus Salmonella consists of only two species:
- S. enterica, which is divided into six subspecies: S. enterica subsp, enterica,
S. enterica subsp, salamae, S. enterica subsp, arizonae, S. enterica subsp,
diarizonae, S. enterica subsp. houtenae, and S. enterica subsp, indica; and
- S. bongori (Popoff & all., 1998)
A total of 2501 different Salmonella serotype were identified until 2004,
almost all of them causing disease in humans. Other serotypes affect only a few
animal species (host-spectrum), like Salmonella Choleraesuis in pigs, Salmonella
Dublin in Cattle. When this serotypes cause disease in humans, it is very invasive
and can be life-threatening. Usually, these kind of strains cause gastroenteritis,
which is often uncomplicated and does not need treatment, but can be severe for
people with weakened immunity, like the young and the elderly patients (WHO,
2005). Salmonella Enteriditis and Salmonella Typhimurium are the two most
important serotypes for salmonellosis transmitted from animals to humans. S.
Enteritidis caused the most recent epidemic, which peaked in humans in 1992 in
many European countries. (WHO, 2005). Infection from contaminated food
occured for humans when individuals had contact with infected animals, including
domestic animals such as dogs or cats.
The contamination can come from faeces when the bacteria pass the pores
of the shells of the egg. The most frequently foodborne diseases worldwide are
salmonellosis. In the first few minutes, after the oviposition, the eggshell can be
more easily penetrated by bacteria according with Miyamoto et al., 1998 and
38
Padron, 1990. After the oviposition, the bacteria can penetrate the eggshell and
membranes more easy because the egg comes to temperatures cooler than the
chicken body temperature (42 °C), perhaps creating a negative pressure (Board,
1966). The ideal conditions for penetration of the egg shell by bacteria was
hypothesized by Berrang et al., 1999, and can be the moment a warm egg
encounters a moist and cool environment.
According with EFSA (2012) the salmonellosis is the second most
frequently reported zoonosis in UE and continues to decrease. Unfortunately we
have reported data about the economic cost of the disease only for few countries.
According with World Health Organization (2005) in the United States of
America an estimated 1.4 million non-typhoidal Salmonella infections, resulting
in 168 000 visits to physicians, 15 000 hospitalizations and 580 deaths annually,
with a cost estimates per case of humane salmonellosis range from 40 to 4,6
million US$, respectively for uncomplicated cases to cases ending with
hospitalization and death. It’s estimated a total cost associated with Salmonella at
US$ 3 billion annually in the United States of America (WHO, 2005). On the
other hand, in Denmark, the annual estimated cost of foodborne salmonellosis is
US% 15, 5 million in 2001, representing 0.009% of Gross domestic product
(GDP).
The symptoms of human salmonellosis are usually characterized by acute
onset of fever, abdominal pain, diarrhoea, nausea and sometimes vomiting. In
some cases, particularly in the very young and in the elderly, the associated
dehydration can become severe and life-threatening. Serious complications occur
in a small proportion of cases. In such cases, as well as in cases where Salmonella

39
causes bloodstream infection, effective antimicrobials are essential drugs for
treatment (WHO, 2005).
The optimal treatments of salmonellosis for adults are the antimicrobials
from the fluoroquinolones group. They have a good oral absorption, well tolerated
and are relatively cheap. Instead for the children with serious infections the most
frequently used treatment is cephalosporins (injection). As an alternative, others
drugs like chloramphenicol, ampicillin, amoxicillin and trimethoprim-
sulfamethoxazole can be used.
Starting 2012, all the European states were required to implement the CE
Directive 74/1999 concerning obeying the minimum standards for poultry farms,
replacing traditional systems with battery farming systems on the ground or
battery that provides better condition and more space.
Normally these new systems increase the risk of contamination of eggs
with various microorganisms, mainly with Salmonella Enteritidis that can harm
the human health. In Europe is not allowed to wash the eggs with hot water, like
in USA. In this case we have to find other methods to decontaminate the egg
shell. In the past only few studies have been published about the use of hot air to
decontaminate the shell of eggs. In the 1996, Hou et al. observe that after heating
at 55°C in a hot air oven for 180 min gave a 5 log 10 reductions of Salmonella
Enteritidis. Other researches like James et al (2002) verified the applicability of
treatment in a stream of hot air for the pasteurization of the egg surface, but they
did not assess the potential of the technique to decontaminate the eggs. In 2010,
Manfreda et al. (2010) reported good results about the treatments with hot air for
the surface decontamination of table eggs experimentally contaminated by
salmonella enterica serovar Enteritidis. They used a treatment with two shots of 8

40
s at 600°C, with an interval of 30s of cold air. The results show that this kind of
treatments can reduce the S. Enteritidis load on eggshells of up to 1.9 log10.
The results for egg shell obtained from the experiment with an FLIR
infrared thermocamera were compared with data from the numerical model for
hot air treatments obtained in the past by Fabbri et al. (2010).

41
II.1.3. Material and methods
A. Determination of egg emissivity
The current study required the experimental measurement of temperature
of eggs shell during the hot-air treatments using FLIR-IR thermocamera. This
experiment can be very useful to obtain important data with a nondestructive
method. In order to determine the temperature of the egg shell we have to know
the coefficient of emissivity of the egg shell. In the literature, unfortunately we
don’t have too much data about the radiation heat transfer emissivity coefficient,
because these techniques are recently used in the field of food industry. This is an
obstacle for the companies who want to use the infrared thermography in the food
processing because they will spend more time to determine this coefficient.
All the objects have a different emissivity that depends on the nature of
the emitting object, temperature and other parameters. These parameters are the
most important when an infrared thermocamera is used, because this is a measure
of how much radiation is emitted from an object, compared to that from a perfect
blackbody of the same temperature (FLIR, 2010).
To determine the emissivity we use the equation II.1:
4TW
[Watt/m2] (II.1.)
where W is the total power emitted at 7.5 - 13.0 μm in Wm-2
, ε is the emissivity of
the target (1 for the perfect body), σ is the Stefan-Boltzmann’s constant (5.67051
x 10-8
Wm-2
K-4
), T is the temperature of the target object in Kelvin degree.

42
The radiance entering a thermographic camera originates from three sources
(Lamprecht et al., 2002): (i) the observed object itself; (ii) other objects reflected
on the target’s surface, and; (iii) an atmospheric contribution.
The equation II.2 can also be used to determine the emissivity:
))1(( 444
Pyrambegg TTTW [Watt/m2] (II.2)
where W is the total power emitted at 7.5 - 13.0 μm in Wm-2
, ε is the emissivity of
the target (1 for the perfect body), σ is the Stefan-Boltzmann’s constant (5.67051
x 10-8 Wm-2K-4), Tegg is the temperature of the target object, egg in our case, in
Kelvin degree, Tamb is the temperature of background radiation, Tpyr is the
temperature of the device/air. I used the standard method for measuring the
emissivity (ASTM, 2003) using a surface-modifying materials that can change the
heat transfer properties and temperature of the specimen.
The infrared energy emitted by a target object, eggs in our case, is related
to the temperature of the object by means of its emissivity. Usually, emissivity of
the non-metals tends to be high, and decreases with temperature. The
measurement of absolute temperature requires the knowledge of the emissivity of
the material, a seldom available parameter for food product, or the calibration of
the thermocamera using reference materials (Al foil) having known emissivity.
A thermocamera FLIR model A325 was used to determine the emissivity
of egg. The model used works in the spectral range 7.5 to 13.0 μm, has a pixel
resolution of 320×240, with an operating temperature range between -15°C to
+50°C. The most important advantage of this method is that we don’t need a
physical contact with the eggs to find the emissivity and temperature.
The eggs to be measured were placed in a thermostatic cooling room at a
constant temperature of 20°C for 24 hours, and half of the eggs were covered with
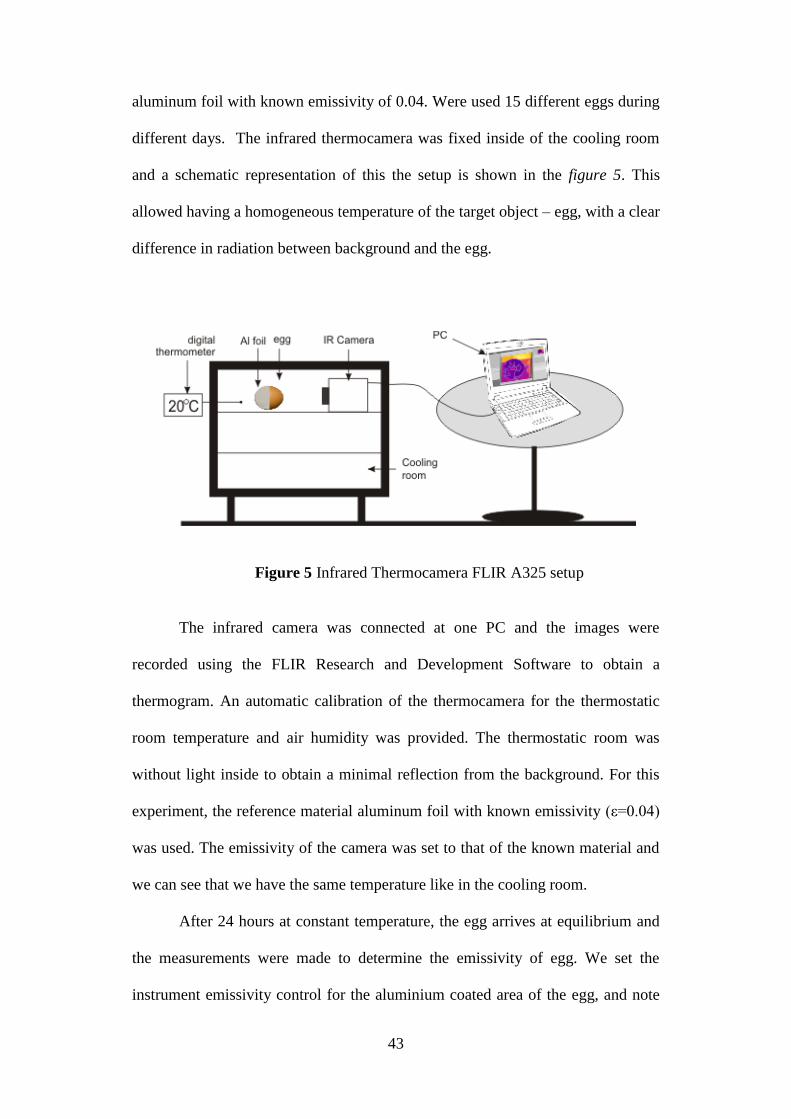
43
aluminum foil with known emissivity of 0.04. Were used 15 different eggs during
different days. The infrared thermocamera was fixed inside of the cooling room
and a schematic representation of this the setup is shown in the figure 5. This
allowed having a homogeneous temperature of the target object – egg, with a clear
difference in radiation between background and the egg.
Figure 5 Infrared Thermocamera FLIR A325 setup
The infrared camera was connected at one PC and the images were
recorded using the FLIR Research and Development Software to obtain a
thermogram. An automatic calibration of the thermocamera for the thermostatic
room temperature and air humidity was provided. The thermostatic room was
without light inside to obtain a minimal reflection from the background. For this
experiment, the reference material aluminum foil with known emissivity (ε=0.04)
was used. The emissivity of the camera was set to that of the known material and
we can see that we have the same temperature like in the cooling room.
After 24 hours at constant temperature, the egg arrives at equilibrium and
the measurements were made to determine the emissivity of egg. We set the
instrument emissivity control for the aluminium coated area of the egg, and note

44
the temperature given by the instrument. Afterwards the temperatures next to this
spot (fig. 6), on the uncoated area were noted, and the emissivity set was adjusted
until we obtained the same temperature like in the above case.
Figure 6 Egg temperature measured with Infrared
Thermocamera FLIR A325
We obtained this way the effective emissivity of the shell of egg. The
average of egg emissivity over the samples was 0.95 with a standard deviation of
0.01. The egg coefficient of emissivity is very important for the future
measurements made with infrared thermocamera to have a real temperature of the
shell of egg during the heat treatments.
B. Experimental validation of a numerical model for hot air treatment
of egg surface decontamination, in natural convection conditions using an
infrared thermocamera
The numerical model realized in the past by model Cevoli et al. (2010)
using the experience data about albumen coagulation limit condition reported in

45
the past by Hou (1996) was validated using an infrared thermocamera. This
numerical model was realized using a computational fluid dynamic tool (CFD)
based on the Finite Element Technique (Comsol Multiphysics 3.5a, COMSOL
Inc., Burlington, MA, USA) and describes the interaction between hot air and the
eggs.
The control of heating eggs in the oven was realized using the infrared
technique, and we can determine exactly the moment when the shell egg arrives at
55 degree avoiding internal degradation of eggs.
The tested treatments were realized in an oven (MOD 2100, F.lli Galli,
Milan, Italy). All the eggs, 10 samples, were tempered at 25ºC before starting the
experiment. A wall from extruded polystyrene (Thermo 33 extruded, 50 mm) was
placed between the oven heating area and the metallic door like we can see in the
figure 7, to avoid errors during the thermal process and imaging. The
characteristic of this material ensures a good isolation during the short time of
opening the metallic door. A perfect window was created for the Flir A 325
dimensions, to capture the thermal imaging.

46
Figure 7 Infrared Thermocamera FLIR A325 setup for measurements in
the oven
The treatments were performed in the oven at an air temperature of 55°C
for 50, 100, 150 and 200 minutes like in the experience of Hou (1996) and Cevoli
et al. (2010). Using this temperature we can have the condition for a high
decontamination of eggs and also we respect the albumen coagulation limit
conditions. The temperatures were measured during the heating using the infrared
thermocamera FLIR A 325 and also an thermocouples (Thermometer model
HIBOK 14). The calculated time-temperature curves from the model were than
compared with the observed data obtained during these measurements.
C. Experimental validation of a numerical model for hot air treatment
of egg surface decontamination with hot-air jet using an infrared thermal
camera

47
The tests treatments were realized using the prototype used for the
validation with thermocouple in the past by Fabbri et al. (2010). For this
validation the single egg rotate around its principal axis. Two hot-air jets and one
cold jet in opposite side of egg were used to decontaminate the egg surface. We
alternated the cold and hot air to arrive at highest temperature on the external shell
of the egg in very short time to avoid the internal degradation of eggs. The model
realized by Fabbri et al. (2010) to simulate a hot-air treatment of the egg shell was
compared with experimental data on the shell eggs using the infrared
thermocamera.
A special apparatus was used for the experiments. This was provided with
2 hot air gun (Bosh, model GHG 660 LCD-professional, Robert Bosh SpA,
Milano, Italy 2300 W) with different steps of settings of temperature to 660 °C,
positioned at 150 mm from the egg, preserving the egg content. Other
characteristics of the hot air gun were mentioned in the table 1.
Table 1 Characteristics of the hot air gun Bosh, model GHG 660 LCD
Characteristic Value
Rated power input 2300 W
Rated voltage 220-240 V
Temperature at the nozzle outlet (approx.) 50–660 °C
Air flow 250–500 l/min
Temperature-measuring accuracy
– at the nozzle outlet
– on the display
± 5%
± 5%

48
Display operating temperature -20…+70 °C
Weight according to EPTA-Procedure
01/2003
1 kg
Length 255 mm
Height 255 mm
The rolling cylinders (wheelbase 35 mm) are moved by a transmission
belt, linked to a stepping motor server by an electronic speed regulator (Pasquali
et al., 2010). This gun is turned on few minutes before exposing the egg at high
temperature (350 °C near by the egg). The cold air comes from a high pressure
nozzle using a pipe for compressed air, positioned at 120 mm from the cylinders
of rolling egg. The cold air jet has the ambient temperature. The infrared
thermocamera was fixed on tripod like in the figure 8.
Figure 8 The prototype used for the measurements

49
Were used the same treatments for the eggs like in the model development
and validation describes by Cevoli et al (2010) and Fabbri et. al (2010). For the
measurements were used 10 biological eggs for each treatment with an average
weight of 65 g. Before starting the experiment, all the eggs were temperate at 30
°C. The parameters for the treatments are detailed in the table 2. The speed of the
hot air jet was set at 10 ms-1 for all the treatments.
Table 2 Characteristic parameters of the thermal cycles
Treatment Duration (s) Cold air speed (m/s) Number of shots
T1 4 5 1
T2 6 10 1
T3 8 15 1
T4 10 20 1
T5 8+60+8 10 2
T6 8+30+8 15 2
T7 10+30+10 20 2
These treatments reported by Fabbri et all (2010), estimated the external
egg shell surface temperature higher than 70 °C and an inner temperature always
less than 55 °C to protect the content of the eggs. To measure the air velocity, hot
respectively cold, one anemometer was used (Testo AG 445, Ø 10 mm, with
telescopic handle, Testo AG, Lenzkirch, Germany). The speed of the egg was set
at 0.5 Hz.
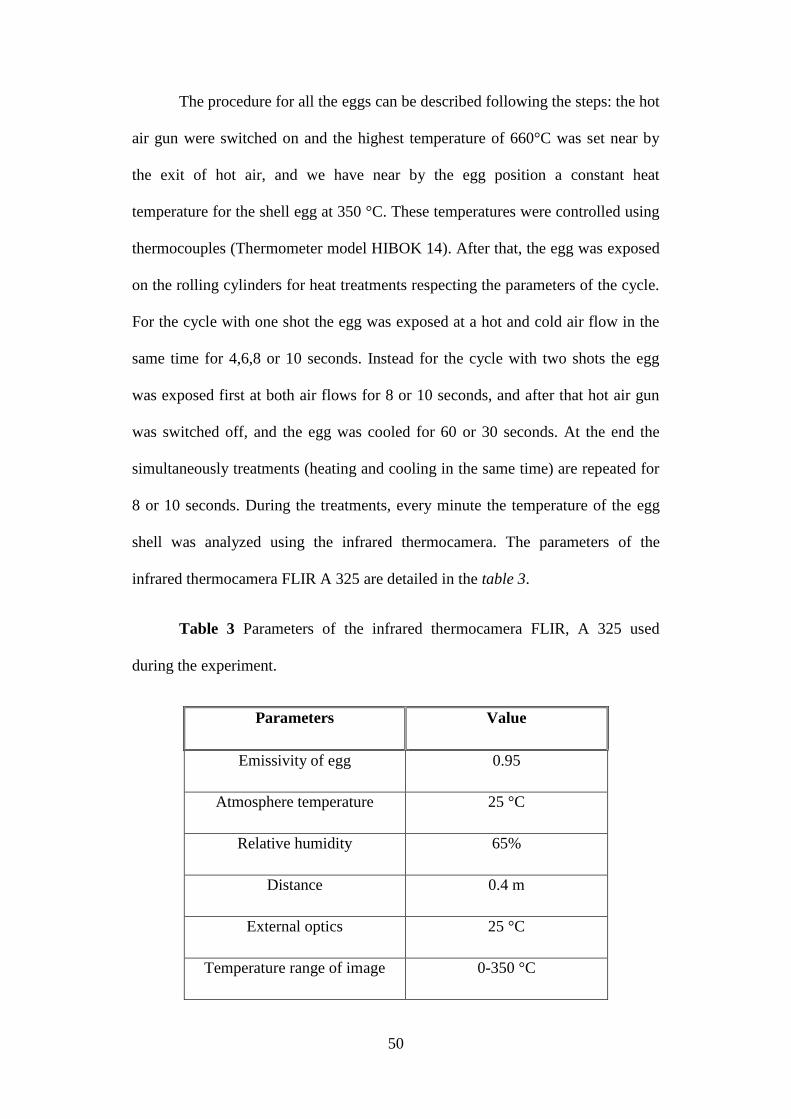
50
The procedure for all the eggs can be described following the steps: the hot
air gun were switched on and the highest temperature of 660°C was set near by
the exit of hot air, and we have near by the egg position a constant heat
temperature for the shell egg at 350 °C. These temperatures were controlled using
thermocouples (Thermometer model HIBOK 14). After that, the egg was exposed
on the rolling cylinders for heat treatments respecting the parameters of the cycle.
For the cycle with one shot the egg was exposed at a hot and cold air flow in the
same time for 4,6,8 or 10 seconds. Instead for the cycle with two shots the egg
was exposed first at both air flows for 8 or 10 seconds, and after that hot air gun
was switched off, and the egg was cooled for 60 or 30 seconds. At the end the
simultaneously treatments (heating and cooling in the same time) are repeated for
8 or 10 seconds. During the treatments, every minute the temperature of the egg
shell was analyzed using the infrared thermocamera. The parameters of the
infrared thermocamera FLIR A 325 are detailed in the table 3.
Table 3 Parameters of the infrared thermocamera FLIR, A 325 used
during the experiment.
Parameters Value
Emissivity of egg 0.95
Atmosphere temperature 25 °C
Relative humidity 65%
Distance 0.4 m
External optics 25 °C
Temperature range of image 0-350 °C

51
II.1.4. Results and discussion
For the first validation the simulated temperature of the egg shell was
compared with the experimental data obtained by the infrared thermocamera
during the heat treatment of the egg in the oven. We analyzed the thermogram
(fig. 9) data considering the entire surface of the egg using the FLIR ResearchIR
Software.
Figure 9 Analysis of the thermographic image for the egg treatment in the
oven at 55°C for 200 minutes.
In the figure 10 the time-temperature curves are shown, minimum,
maximum and average temperature of egg heated in the oven for 200 minutes at
55 °C.

52
Figure 10 Time-temperature curves observed at the surface of egg shell
during the heat treatment in the oven at 55°C, for 200 minutes.
In the following figure 11, the simulation data were validated by
experimental data obtained with infrared thermocamera.
Figure 11 Time-temperature curves of the egg shell measured and
calculated

53
During the head process we can say that the difference between calculated
data from the model and measured data is below 2°C.
Second experimental
To have more information and more control about the process of
decontamination of eggs using the hot-air gun, the temperatures measured on
rotating surface of egg were compared with the simulated temperature profiles of
the shell egg. The simulation data were validated by experimental data obtained
by infrared thermography.
In the figure 12, 13, 14, 15, 16, 17, 18 is showed the time-temperature
curve calculated and simulated for the equatorial part and over the air cell of the
shell egg for each treatment in part. However, the simulated curves and the data
from the measurements appear to be in good agreement and we can conclude that
the application of infrared thermography to control the egg decontamination using
the hot air it’s a valid method. The real advantages of this method in this case is
that is safe, not-destructive, non-contact, non-invasive and can offer the surface
temperatures of the product in real time, with a good accuracy. A great advantage
over measurements made with thermocouples is that we can see the entire surface
temperature of the product not only in one point.
We can mention also some disadvantages of this method like: it’s a new
technique used in the food industry, the highest price of the professional cameras,
require the training of operators that will perform the thermal measurements, the
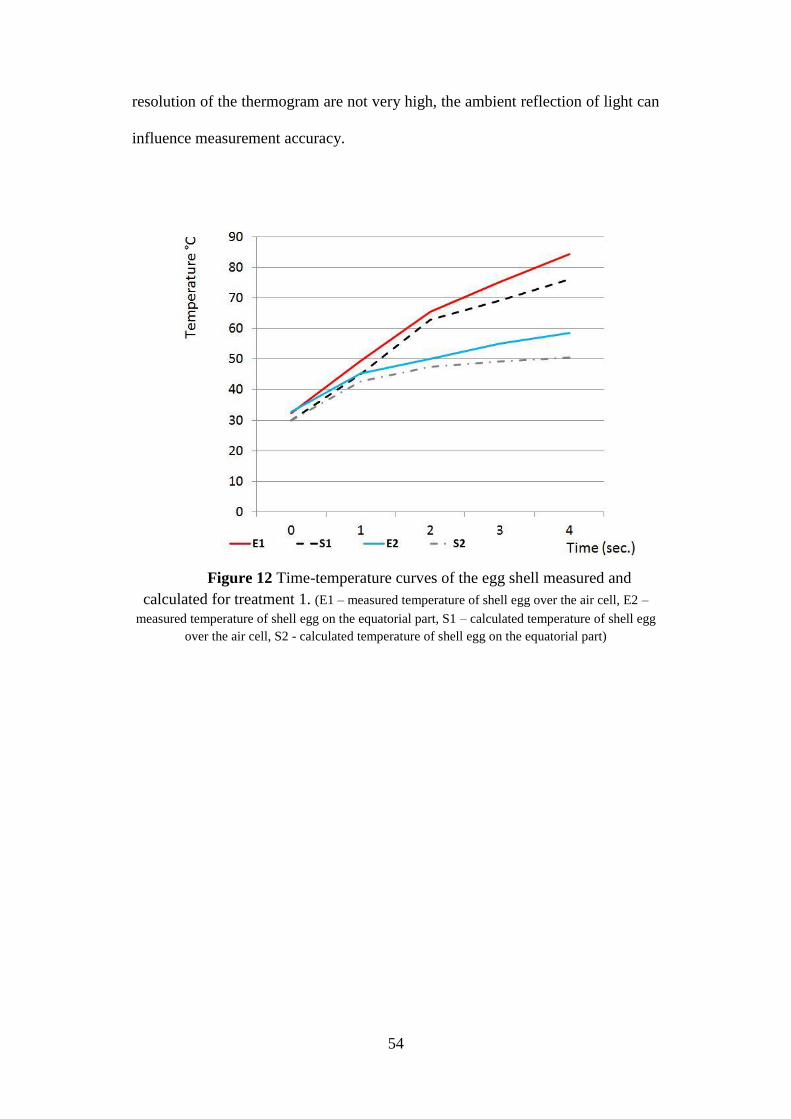
54
resolution of the thermogram are not very high, the ambient reflection of light can
influence measurement accuracy.
Figure 12 Time-temperature curves of the egg shell measured and
calculated for treatment 1. (E1 – measured temperature of shell egg over the air cell, E2 –
measured temperature of shell egg on the equatorial part, S1 – calculated temperature of shell egg
over the air cell, S2 - calculated temperature of shell egg on the equatorial part)

55
Figure 13 Time-temperature curves of the egg shell measured and
calculated for treatment 2. (E1 – measured temperature of shell egg over the air cell, E2 –
measured temperature of shell egg on the equatorial part, S1 – calculated temperature of shell egg
over the air cell, S2 - calculated temperature of shell egg on the equatorial part)
Figure 14 Time-temperature curves of the egg shell measured and
calculated for treatment 3. (E1 – measured temperature of shell egg over the air cell, E2 –
measured temperature of shell egg on the equatorial part, S1 – calculated temperature of shell egg
over the air cell, S2 - calculated temperature of shell egg on the equatorial part)

56
Figure 15 Time-temperature curves of the egg shell measured and
calculated for treatment 4. (E1 – measured temperature of shell egg over the air cell, E2 –
measured temperature of shell egg on the equatorial part, S1 – calculated temperature of shell egg
over the air cell, S2 - calculated temperature of shell egg on the equatorial part)
Figure 16 Time-temperature curves of the egg shell measured and
calculated for treatment 5. (E1 – measured temperature of shell egg over the air cell, E2 –
measured temperature of shell egg on the equatorial part, S1 – calculated temperature of shell egg
over the air cell, S2 - calculated temperature of shell egg on the equatorial part)

57
Figure 17 Time-temperature curves of the egg shell measured and
calculated for treatment 6. (E1 – measured temperature of shell egg over the air cell, E2 –
measured temperature of shell egg on the equatorial part, S1 – calculated temperature of shell egg
over the air cell, S2 - calculated temperature of shell egg on the equatorial part)
Figure 18 Time-temperature curves of the egg shell measured and
calculated for treatment 7. (E1 – measured temperature of shell egg over the air cell, E2 –
measured temperature of shell egg on the equatorial part, S1 – calculated temperature of shell egg
over the air cell, S2 - calculated temperature of shell egg on the equatorial part)

58

59
I.1.5. References
ASTM (1993) Standard test methods for measuring and compensating for
emissivity using infrared imaging radiometers. Annual Book of ASTM Standards.
Bell, C., & Kyrikides, A.. (2002) Salmonella. Blackwell Science Ltd., London
Berrang, M. E., Cox, N. A., Frank, J. F., & Buhr, R. J. (1999). Bacterial
penetration of the eggshell and shell membranes of the chicken hatching egg: A
review. Journal of Applied Poultry Research, 8, 499–504.
Bin, X., & Da-Wen, S. (2002). Applications of computational fluid dynamics
(CFD) in the food industry: a review. Computers and Electronics in Agriculture,
34, 5-24.
Board, R. G. (1966). Review: The course of microbial infection of the hen's egg.
The Journal of Applied Bacteriology, 29, 319–341.
Cevoli, C., Fabbri,A., Pasquali, F., Berardinelli,A., Guarnieri, A. (2010). Hot
air treatment, in natural convection conditions, for egg surface decontamination.
Journal of Agricultural Engineering 4, 23-27
Coburn, B., Grassi, G. A., & Finlay, B. B. (2007). Salmonella, the host and
disease: A brief review. Immunology and Cell Biology, 85, 112–118.
Davies, R.H. and Breslin, M. (2002). Investigations into possible alternative
decontaminationmethods for Salmonella enteritidis on the surface of table eggs.
Journal of Veterinary Medicine B. 50, 38–41.

60
European Food Safety Authority (2005). Opinion of the Scientific Panel on
Animal Health and Welfare on a request from the Commission related to the
welfare aspects of various systems of keeping laying hens. The welfare aspects of
various systems of keeping laying hens. EFSA Journal 197, 1-23
European Food Safety Authority. (2007). Report of the Task Force on Zoonoses
Data Collection on the Analysis of the baseline study on the prevalence of
Salmonella in holdings of laying hen flocks of Gallus gallus. The EFSA Journal,
97
European Food Safety Authority. (2012). Scientific Opinion on a review on the
European Union Summary Reports on trends and sources zoonoses, zoonotic
agents and food-borne outbreaks in 2009 and 2010 – specifically for the data on
Salmonella, Campylobacter, verotoxigenic Escherichia coli, Listeria
monocytogenes and foodborne outbreaks
Fabbri, A., Cevoli, C., Giunchi, A. (2010). Validation of a simplified
Numerical Model for Hot Air Treatment of Egg Shell Surface, Food Process
Engineering, 35, 695-700.
Flir (2010) The ultimate infrared handbook for R&D professionals.
Food and Agriculture Organization of the United Nations - FAO, (2010).
Poultry, meat & eggs. Agribusiness handbook
Foster, A.M., Ketteringham, L.P., Swain, M.J., Kondjoyan, A., Havet, M.,
Rouaud, O., Evans, J.A., (2006). Design and development of apparatus to

61
provide repeatable surface temperature-time treatments on inoculated food
samples. Journal of Food Engineering, Vol. 76, p. 7 - 18.
Hou, H., Singh, R.K., Muriana, P.M. and Stadelman,W.J. (1996).
Pasteurisation of intact shell eggs. Food Microbiology 13, 93–101.
James, C., Lechevalier,V. and Ketteringham, L. (2002). Surface pasteurisation
of shell eggs. Journal of Food Engineering 53, 193–197.
Lamprecht, I., Schmolz, E., Hilsberg, S., Schlegel, S., (2002). A tropical water
lily with strong thermogenic behaviour-thermometric and thermographic
investigations on Victoria cruziana. Thermochimica Acta 382, 199–210.
Mead, P.S., Slutsker, L., Dietz, V., McCaig, L.F., Bresee, J.S., Shapiro, C.,
Griffin, P.M., &. Tauxe, R.V. (1999). Food-related illness and death in the
United States. Emerging Infectious Diseases 5, 607-625.
Manfreda, G., Cevoli, C., Lucchi, A., Pasquali, F., Fabbri, A., Franchini, A.
(2010). Hot air treatment for surface decontamination of table eggs. Food Control
21, 431–435
Miyamoto, T., Horie, T., Baba, E., Sasai, K., Fukata, T., & Arakawa, A.
(1998). Salmonella penetration through eggshell associated with freshness of laid
eggs and refrigeration. Journal of Food Protection, 61, 350–353.
Mori, M, Novak, L., Sekavecnik, M., Kustrin, I (2008). Application of IR
thermography as a measuring method to study heat transfer on rotating surface.
Forsch Ingenieurwes 72, 1–10

62
Musgrove, M.T., Jones, D.R., Northcutt, J.K., Harrison, M.A.,Cox, N.A. JR,
Ingram, K.D. and Hinton, A. JR. (2005). Recovery of salmonella from
commercial shell eggs by shell rinse and shell crush methodologies. Poultry
Science 84, 1955–1958.
Narushin V.G., (1997). The avian egg: geometrical description and calculation of
parameters, Journal of Agricultural Engineering Research, 68, 201-205.
Olsson, E.E.M., Ahrn, L.M. and Tragardh, A.C. (2004). Heat transfer from a
slot air jet impinging on a circular cylinder. Journal of Food Engineering 63,
393–401.
Pasquali, F., Fabbri, A., Cevoli, C., Manfreda, G. and Franchini, A. (2009).
Hot air treatment for surface decontamination of table eggs. Food Control 21,
431–435.
Popoff, M.Y., J. Bockemül, &. Brenner F.W. (1998) Supplement 1997 (no. 41)
to the Kauffmann-White scheme. Research in Microbiology. 149, 601-604.
Raithby G.D., Terry K.G., (2000) Convection Heat Transfer CRC Handbook of
Thermal Engineering. Ed. Frank Kreith, 2000, Boca Raton: CRC Press LLC.
Regulation (EC), (2004), No 853 Official Journal of the European Union.
Romane, A., Harrak, R. and Bahri, F. (2012). Use Thyme Essential Oils for the
Prevention of Salmonellosis, Salmonella - A Dangerous Foodborne Pathogen, Dr.
Dr. Barakat S M Mahmoud, InTech.

63
Stadelman, W. J., Singh, R. K., Muriana, P. M., & Hou, H. (1996).
Pasteurisation of eggs in the shell. Poultry Science, 75, 1122–1125.
Van der Plancken, I.,Van Loey, A. and Hendrickx, M.E. (2005). Effect of
heat-treatment on the physico-chemical properties of egg white proteins: a kinetic
study. Journal of Food Engineering. 75, 316–326.
World Health Organization (2005). Drug-Resistant Salmonella. WHO website.
World Health Organization/Food and Agriculture Organization of the
United Nations (WHO/FAO), (2002). Risk assessments of Salmonella in eggs
and broiler chickens. Microbiological risk assessment series. FAO website

64

65
II.2 Application of infrared thermography for controlling
freezing process of raw potato
This paper was written by Cuibus, L.1, Fito, P.J.
2, Fabbri, A
1, Castro-
Giráldez, M.2*
and was send to Journal of Food Engineering.
Application of infrared thermography for controlling freezing process of raw
potato
Cuibus, L.1, Fito, P.J.
2, Fabbri, A
1, Castro-Giráldez, M.
2*
1 Dep. of Agricultural and Food Science, University of Bologna, Piazza
Goidanich 60, 47521 Cesena (FC)
2 Instituto Universitario de Ingeniería de Alimentos para el Desarrollo,
Universidad Politécnica de Valencia, Camino de Vera s/n, 46022 Valencia, Spain
*Author for correspondence: [email protected]
Freezing technique is a very useful method for food preservation. The distribution
of temperatures of raw potato was measured during the freezing operation by
using an infrared thermographic camera Thermal Imager Optris PI160. Moreover,
moisture was measured before and after the freezing process. Differential
Scanning Calorimetry of potato was also measured to analyze the freezing
process. The aim of this work was to analyze the potato freezing process by using
infrared thermography; the results showed that infrared thermography can be
considered an important nondestructive tool for controlling the freezing process of
potato.
Keywords: infrared thermography, potato, freezing.
66
II.2.1 Introduction
Freezing is one of the most important methods for food preservation which
produces good quality and long shelf-life food products (Delgado & Sun, 2001).
The phase transitions of the freezing process involve the conversion of water to
ice through the crystallization process (Fennema et al., 1973; Alizadeh et al.,
2009; Kiani & Sun, 2011). The extracellular large ice crystals produce a
significant damage to the food tissue (Sun & Zheng, 2003). The formation of fine
crystals, distributed inside and outside the cells, leads to a high quality product
that can be better preserved because the tissue has been less damaged (Sun &
Zheng, 2006; Kiani & Sun, 2011). Usually, the slow freezing produces large ice
crystals, while rapid freezing produces small intracellular ice (Li & Sun, 2002 a,
b). To improve the control of freezing process, it is necessary to understand the
crystallization process and the thermodynamic properties of water. In many fields,
the infrared thermography (TI) becomes a non-destructive and non-contact
technique commonly used for measuring the temperature of the products. TI is a
two-dimensional, non-contact diagnostic technique for measuring surface
temperature of materials which can be usefully used in non-destructive quality
evaluation (Giorleo & Meola, 2002, Gowen & all, 2010). The radiometric surface
temperatures obtained from thermal camera measurements are related with both
the physical surface temperature and the effective emissivity of the surface within
the band pass of the radiometric measurements (Humes et al., 1994; Lopez et al.,
2012). The emissivity describes the ratio of radiation emitted by an object at a
certain temperature, to the value emitted by a perfect emitter (Husehke, 1959;
Lopez et al., 2012).

67
The aim of the present study is to monitor the dynamics of variation of emissivity
of potato during the freezing process. This paper may offer a good opportunity of
food processors to realize the control of freezing potato using an infrared
thermocamera.
II.2.2 Material and methods
Experimental procedure
It is fundamental to calibrate properly the infrared sensor in order to obtain
reliable data of temperature. For this reason, previous experiments were carried
out with reference materials (ε=0.95) in order to obtain a real value of emissivity.
Experimental setup consisted on potato sample, distilled water and an aluminium
foil. Fresh potato samples (Solanum tuberosum L. cv. Melody) were peeled and
cut with a cylindrical core borer in order to obtain cylinders with 20 mm diameter
and 10 mm height. Distilled water was placed in a box with a bottom half painted
with black color (emissivity close to 1) and the other half was covered
with aluminium, although no differences were found between both measurements.
The freezing process was carried out from 20ºC until -20ºC with freezing air
velocity of 0.45 m/s. The experimental was carried out by triplicate but only one
of them is shown as an example.
A thermographic camera Thermal Imager Optris PI160 with a spectral infrared
range of wavelength from 7.5 a 13 µm was used for the experiments. Moreover,
different thermocouples (Thermometer model HIBOK 14) were used to register
the temperature of potato surface, water, aluminium foil and ambient. Figure 19
shows an scheme of the experimental setup.

68
Figure 19 Experimental setup.
Moisture was measured before and after the freezing process according to
the AOAC (1984) method 22.013.
Study of phase transitions: Differential Scanning Calorimetry (DSC)
Phase transitions were measured using a DSC 220 CU-SSC5200 (Seiko
Instruments) connected to a cooling controller. Samples of around 15-20 mg were
enclosed in hermetically sealed aluminum pans (Seiko Instruments, P/N
SSC000C008) and then loaded into the equipment at room temperature. An empty
hermetically sealed pan was used as the reference sample. The calibration of the
cell was made following the DSC manufacturers’ recommendation. Samples were
cooled from 20ºC to -60ºC and heated from -60ºC to 20ºC. Heating scans were
performed at 10ºC/min. The DSC measurements were made by triplicate.

69
II.2.3 Results and discussion
Figure 20 shows the freezing curve of pure water, potato and aluminium foil
obtained by the thermocouples. In the freezing curve of water, a slight
supercooling can be observed reaching -2ºC; at this point, the crystal nucleation
starts and an abrupt rise from the supercooled temperature to near 0ºC occurs
caused by the release of the latent heat of crystallization. The freezing process
continue forming ice crystals until around -4ºC; at this point, all the water has
been transformed into ice and the temperature of the ice mass starts to decrease
until -18ºC (equilibrium temperature). The figure also shows the curve of potato
freezing; this curve shows a freezing temperature of -2ºC due to the large amount
of solutes found in this system. When part of the potato water starts to be
crystallized, the potato liquid phase is being concentrated causing a decrease of
the water freezing point. The aluminium cooling curve shows a rapid decrease of
the temperature reaching in less than ten minutes the equilibrium temperature.
This reference material does not suffer any transition at these temperatures.
Figure 20 Freezing curves for potato (●), water (▲), and aluminium (■)
-22
-20
-18
-16
-14
-12
-10
-8
-6
-4
-2
0
2
4
6
8
10
12
14
16
18
20
0 5 10 15 20 25 30 35 40 45 50
T (ºC)
t(min)

70
All the objects with temperature above the absolute zero emit thermal radiation
following the Stefan-Boltzman law. In the present study, the infrared camera
registers the thermal energy emitted by the different bodies inside the freezer,
graphing a map of temperatures. In this case, the emissivity value used for register
the temperatures by the IR camera was 0.98 which is a common emissivity for
cellular tissues. Due to the fact that the emissivity of the bodies is changing with
the freezing treatment, the map of temperatures obtained by the camera is not real,
and thus, the temperatures were converted into thermal energies, which can be
considered as the response of the camera pyrosensor to the radiant energy in the
infrared spectrum; the radiant energy that can be absorbed by the pyrosensor
corresponds to the energy emitted by the superior orbital of the bodies that are
inside the freezer. The overall energy received by the camera can be defined by
equation II.3:
ChobjobjairsursurobjobjSST ETFTTFT 444411E (II.3)
Where ET is the overall energy received by the pyrolysis sensor, F is a geometric
factor, being 1 because the potato surface is located in parallel with the camera,
is the emissivity (from the object, surroundings or fixed in the camera), the
constant of Stefan-Bolzman (5,67·10-8
W/m2K), T the temperature (from the
object, surroundings or obtained in the IR camera) and ECh is the energy emitted
in a first order transition or chemical reaction. First term represents the energy
emitted by the potato; the second emitted by the surroundings and the third
represents the energy absorbed by the air.
As the freezer chamber is completely sealed and black, it can be considered that
there is no energy reflected from the environment, so all the energy that arrives to
the IR camera comes from the potato, water and aluminium foil. This means, that

71
only the energy emitted by the object is considered, being neglected the
background radiation and the atmospheric contribution. This fact was
corroborated by a previous experiment in which a reference grey body was
located inside the freezer, and the emissivity registered was 0.95 in all the
temperature range of study.
Figure 21 shows the changes in the energy received by the camera with regard to
the temperature measured by the thermocouples. In the figure it is possible to
appreciate that the energy received by the camera has the same tendency for
potato and for pure water. It is also possible to appreciate that the energy
decreases in three different steps, being possible to detect the freezing process.
This can be better appreciated in figure 22.
Figure 21 Energy received by the camera with regard to the temperature of (●)
potato and (▲) water.
In figure 22, the energy received by the camera shows three different slopes which
define the different steps in the freezing process of potato: the cooling until the
150
200
250
300
350
400
450
-20 -15 -10 -5 0 5 10 15 20 25
Ec
T (ºC)
Cooling
Freezing
Cooling
Ec (J/g)
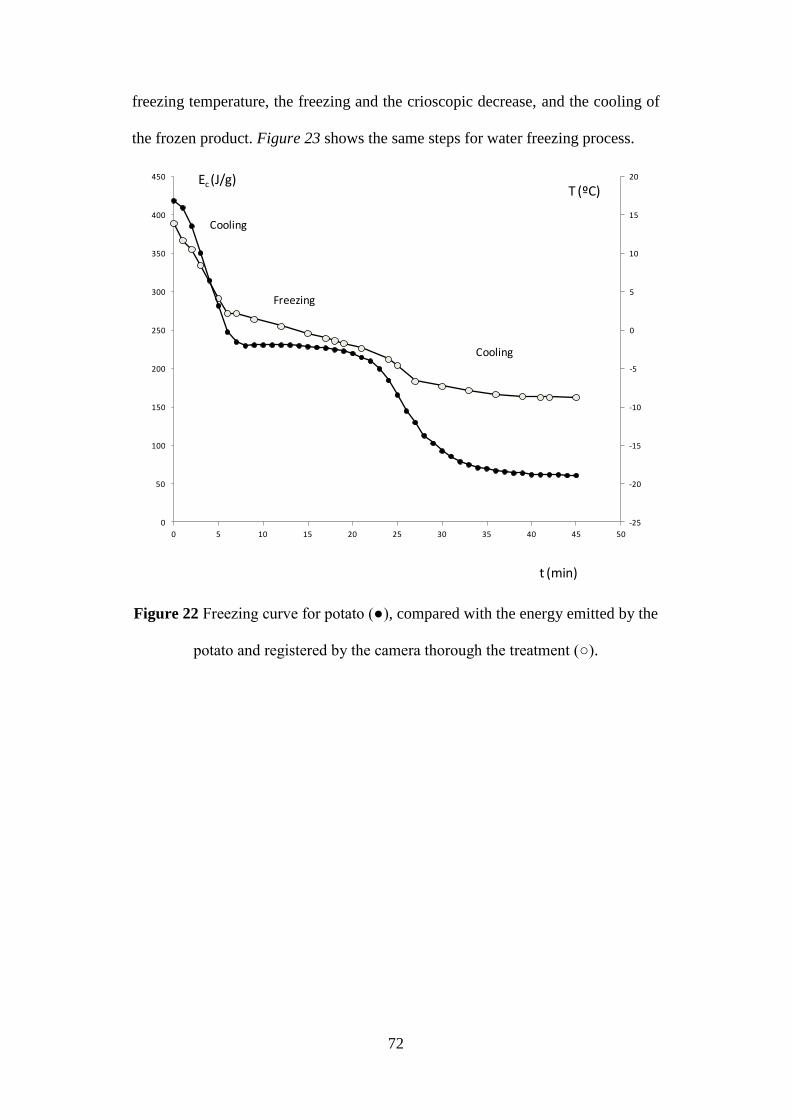
72
freezing temperature, the freezing and the crioscopic decrease, and the cooling of
the frozen product. Figure 23 shows the same steps for water freezing process.
Figure 22 Freezing curve for potato (●), compared with the energy emitted by the
potato and registered by the camera thorough the treatment (○).
-25
-20
-15
-10
-5
0
5
10
15
20
0
50
100
150
200
250
300
350
400
450
0 5 10 15 20 25 30 35 40 45 50
Cooling
Freezing
Cooling
Ec (J/g)T (ºC)
t (min)

73
Figure 23 Freezing curves for water (●), compared with the energy emitted by the
potato and registered by the camera thorough the treatment (●).
The thermal energy of the potato registered by the camera could be related with
the internal energy, which is the energy that depends on the state of the molecules
orbitals. From the data obtained by differential Scanning Calorimetry, the specific
heat was obtained in the sections without transitions. Figure 24 shows an example
of potato thermogram.
-25
-20
-15
-10
-5
0
5
10
15
20
25
0
50
100
150
200
250
300
350
400
450
0 5 10 15 20 25 30 35 40 45 50
Cooling
Freezing
Cooling
Ec (J/g) T (ºC)
t (min)

74
Figure 24 Differential scanning calorimetry thermogram of potato.
Internal energy of potato (U) was calculated as follows:
refP TTmCU (II. 4)
where, Cp is the specific heat obtained by thermography for the potato, and
obtained from bibliographic sources for the pure water (Heldman and Lund,
2007). T is the temperature of potato and water measured at each time with the
thermocouples, and Tref is the temperature of reference which was considered as
0ºC.
The three different steps mentioned before can be observed as well in figure 25. In
the figure it is possible to appreciate that, in the freezing process, the internal
energy does not varies significantly but the energy emitted by the potato shows a
marked decrease.
-100
-50
0
50
100
150
200
-70 -60 -50 -40 -30 -20 -10 0 10 20 30
Heat Flow (mW)
T (ºC)
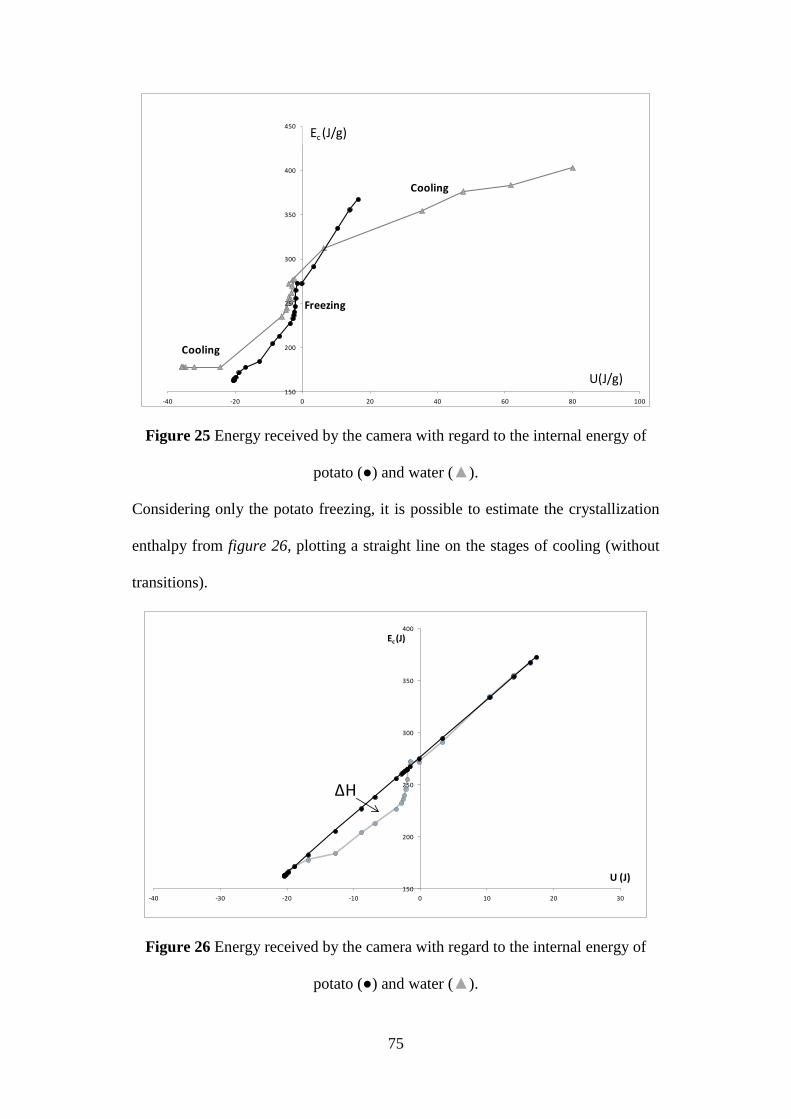
75
Figure 25 Energy received by the camera with regard to the internal energy of
potato (●) and water (▲).
Considering only the potato freezing, it is possible to estimate the crystallization
enthalpy from figure 26, plotting a straight line on the stages of cooling (without
transitions).
Figure 26 Energy received by the camera with regard to the internal energy of
potato (●) and water (▲).
150
200
250
300
350
400
450
-40 -20 0 20 40 60 80 100
Cooling
Freezing
Cooling
Ec (J/g)
U(J/g)
150
200
250
300
350
400
-40 -30 -20 -10 0 10 20 30
Ec (J)
U (J)
ΔH

76
By other hand, with the melting enthalpy of potato (see table 4) obtained from the
calorimetric analysis and the melting enthalpy of pure water obtained from the
bibliography, it is possible to obtain the unfreezeable water (xwnf
) (Sablani et al.,
2009).
Table 4 Results from the DSC experiments, moisture and non freezeable water
estimated
Hmelting Hfreezing Hwater Tm' xw0 xw
nf
223±15 249±19 334 -19±2 0.847±0.015 0.204±0.016
Comparing the enthalpy obtained from figure 26 with the crystallization enthalpy
of pure water, it is possible to estimate freezing enthalpy area and also the
quantity of ice formation following the energies involved in the emission of
molecules (Figure 27). By subtracting the amount of ice formed to the initial
moisture of the samples, it is possible to obtain the amount of water that remains
in liquid phase (Figure 27). In the figure, it is possible to appreciate that the
amount of water that remains in liquid phase reaches a value near 0.2 that
coincides with the value of unfreezeable water obtained by DSC. It is also
possible to observe that the temperature of the potato remains during the whole
treatment below the Tm’, and, thus, ice is being formed during all the treatment.
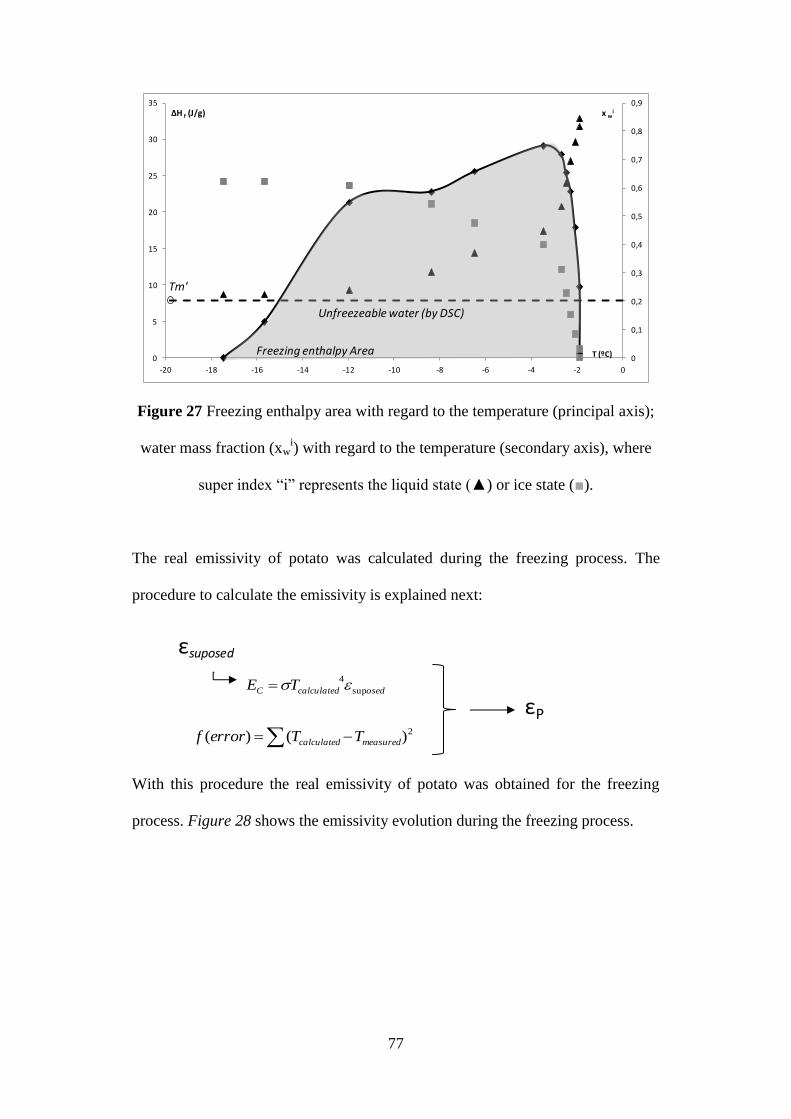
77
Figure 27 Freezing enthalpy area with regard to the temperature (principal axis);
water mass fraction (xwi) with regard to the temperature (secondary axis), where
super index ―i‖ represents the liquid state (▲) or ice state (■).
The real emissivity of potato was calculated during the freezing process. The
procedure to calculate the emissivity is explained next:
With this procedure the real emissivity of potato was obtained for the freezing
process. Figure 28 shows the emissivity evolution during the freezing process.
0
0,1
0,2
0,3
0,4
0,5
0,6
0,7
0,8
0,9
0
5
10
15
20
25
30
35
-20 -18 -16 -14 -12 -10 -8 -6 -4 -2 0
x wiΔH f (J/g)
T (ºC)
Unfreezeable water (by DSC)
Freezing enthalpy Area
Tm'
εsuposed
osedcalculatedC TE sup
4
2)()( measuredcalculated TTerrorf
εP

78
Figure 28 Emissivity with regard to temperature for potato (■).
Conclusions
The results showed that infrared thermography can be considered an important
nondestructive tool for controlling the freezing process of potato. This technique
can be used to describe completely the freezing potato process, being possible to
calculate the quantity of ice formed and the emissivity of the potato during this
process.
0,6
0,65
0,7
0,75
0,8
0,85
0,9
0,95
1
-25 -20 -15 -10 -5 0 5 10 15 20
ε
T (ºC)

79
II.2.4 References
Aguilera, L. M., & Stanley, D. W. (1990). Microstructural principles of food
processing and engineering. Essex, UK: Elsevier Science Publishers Ltd.
Alizadeh, E., Chapleau, N., de Lamballerie, M., & Le-Bail, A. (2007). Effect
of different freezing processes on the microstructure of Atlantic salmon (Salmo
salar) fillets. Innovative Food Science & Emerging Technologies, 8, 493-499.
Alvarez, M., Fernandez, C., & Canet, W. (2010). Oscillatory rheological
properties of fresh and frozen/thawed mashed potatoes as modified by different
cryoprotectants. Food and Bioprocess Technology, 3, 55 - 70.
AOAC (1984). Official methods of analysis (14th
ed.). Washington, DC:
Association of Official Analytical Chemists.
Buettner, K.J.K., Kern, C.D., (1965). The determination of infrared emissivities
of terrestrial surfaces. Journal of Geophysical Research 70, 1329–1337.
Da-Wen Sun *, Bing, Li, (2002). Microstructural change of potato tissues frozen
by ultrasound-assisted immersion freezing, Journal of Food Engineering
Delgado, A. E., & Sun, D.-W. (2001). Heat and mass transfer models for
predicting freezing process––a review. Journal of Food Engineering, 47, 157–
174.

80
Fennema, O. R., Powrie, W. D., & Marth, E. H. (1973). Low temperature
preservation of foods and living matter. New York: Marcel Dekker.
Fellows, P. (2000). Food Processing Technology––Principles and Practice (2nd
ed., pp. 418–440). Chichester, UK: Ellis HorwoodLtd.
Fuller M. P. and Wisniewski M., (1998). The use of infrared thermal imaging
in the study of ice nucleation and freezing of plants Journal of Thermal Biology
Vol. 23, No. 2, pp. 81-89.
Gowen, A. A., Tiwari, B.K., Cullen, P.J., O’Donnell, C.P., McDonnell, K.
(2010). Applications of thermal imaging in food quality and safety assessment.
Trends in Food Science & Technology 21 (2010) 190e200
Giorleo, G., & Meola, C. (2002). Comparison between pulsed and modulated
thermography in glasseepoxy laminates. NDT & E International, 35(5), 287e292.
Hudson, M.A. and Idle, D.,B. (1962). The formation of ice in plant tissues.
Planta 57, 718-730
Jalté M., Lanoisellé J.L., Lebovka, N. I., & Vorobiev, E. (2007). Plasmolysis of
sugarbeet: pulsed electric fields and thermal treatment. LWT - Food Science and
Technology 42 (2009) 576–580

81
Karlsson, M.E. & Eliasson A.-C. (2003). Gelatinization and retrogradation of
potato (Solanum tuberosum) starch in situ as assessedby differential scanning
calorimetry (DSC) Lebensm.-Wiss. u.-Technol. 36, 735–741
Kiani, H. and Sun. D-W, (2011) Water crystallization and its importance to
freezing of foods: A review. Trends in Food Sscience & Technology 22, 407-426
Kita, A. (2002). The influence of potato chemical composition on crisp texture,
Food Chemistry 76,173-179
Le Grice, P., Fuller, M. P. & Campbell, A. (1993). An investigation of the
potential use of thermal imaging technology in the study of frost damage to
sensitive crops. Proceedings of 6th International Conference on Biological Ice
Nucleation. University of Wyoming, Laramie, USA, p. 4.
Li, B., & Sun, D.-W. (2002 a). Novel methods for rapid freezing and thawing of
foods––a review. Journal of Food Engineering, 54, 175–182.
Li, B.,& Sun, D.-W. (2002 b). Effect of power ultrasound on freezing rate during
immersion freezing. Journal of Food Engineering, 55, 85–90.
Lopez, A., Molina-Aiz, F.D., Valera, D.L. & Pena, A., (2012). Determination
the emissivity of the leaves of nine horticultural crops by means of infrared
thermography. Scientia Horticulturae 137, 49 - 58
82
Minkina, W. (2004). Thermovision Measurements – Instruments and Methods,
Publishing Office of Częstochowa University of Technology, Częstochowa, (in
Polish)
Pinkley, L.W., Sethna, P.P., Williams, D., (1977). Optical constants of water in
the infrared: influence of the temperature. Journal for Optical Society of America
67 (4), 494–499.
Robinson, P.J., Davies, I.A., (1972). Laboratory determinations of water surface
emissivity. Journal of Applied Meteorology 11, 1391–1393.
Sablani, S.S., Bruno, L., Kasapis, S. & Symaladevi, R.M. (2009). Thermal
transitions of rice: development of a state diagram. Journal of Food Engineering,
90, 110-118.
Singh, J., Kaur, L. (2009). Advances in potato chemistry and technology,
Academic Press, Elsevier Inc.
Sun, D.-W., & Li, B. (2003). Microstructural change of potato tissues frozen by
ultrasound-assisted immersion freezing. Journal of Food Engineering, 57, 337 -
345.
Sun, D.-W., & Zheng, L. (2006). Innovations in freezing process. In D. W. Sun
(Ed.), Handbook of frozen food processing and packaging. Boca Raton,
Fla./London: CRC/Taylor & Francis.

83
Świędrych, A., Prescha, A., Matysiak-Kata, I., Biernat, J., Szopa, J. (2002).
Repression of the 14-3-3 gene affects the amino acid and mineral composition of
potato tubers, Journal of agricultural and Food Chemistry, 50, 2137-2141
Szymońska, J., & Wodnickab, K. (2005). Effect of multiple freezing and
thawing on the surface and functional properties of granular potato starch, Food
Hydrocolloids ,753–760
Wisniewski, M., Lindow, S. E. & Ashworth, E. N. (1997). Observations of ice
nucleation and propagation in plants using infrared video thermography. Pl. Phys.
113, 327-346.
Zhang, Y.W., Zhang, C.G., Klemas, W., (1986). Quantitative measurements of
ambient radiation, emissivity, and truth temperature of a greybody: methods and
experimental results. Applied Optics 28 (20), 4482–4486.

84
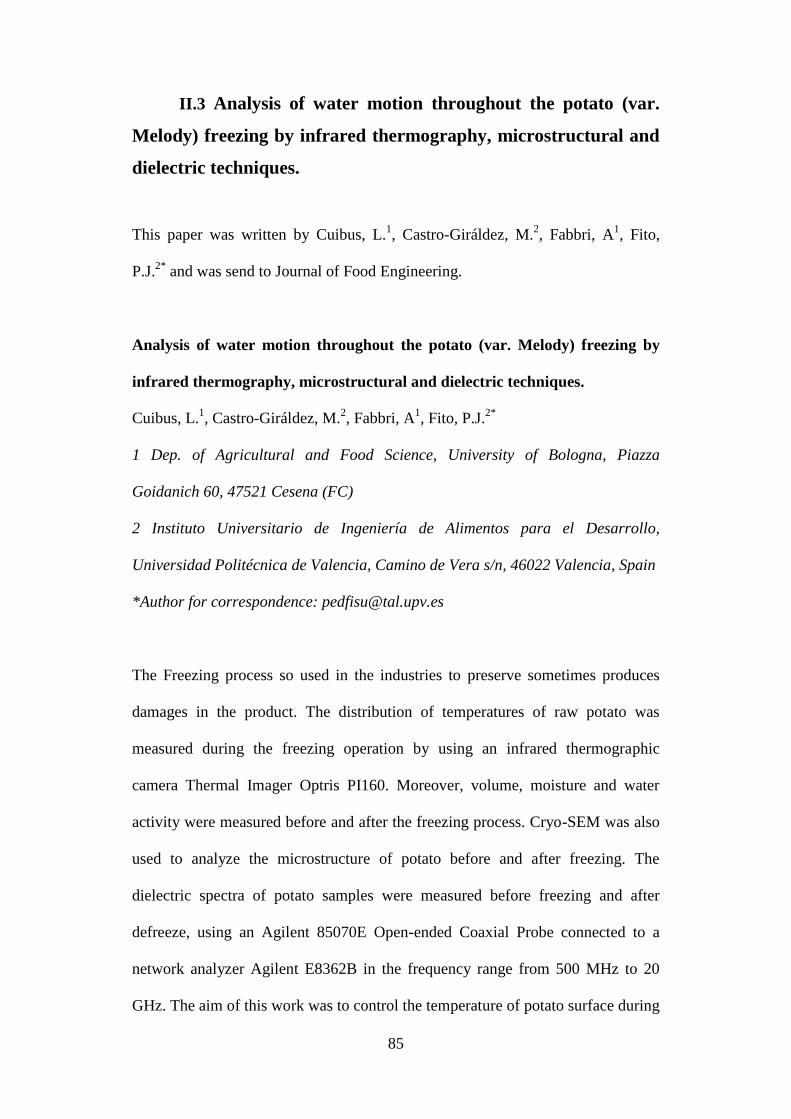
85
II.3 Analysis of water motion throughout the potato (var.
Melody) freezing by infrared thermography, microstructural and
dielectric techniques.
This paper was written by Cuibus, L.1, Castro-Giráldez, M.
2, Fabbri, A
1, Fito,
P.J.2*
and was send to Journal of Food Engineering.
Analysis of water motion throughout the potato (var. Melody) freezing by
infrared thermography, microstructural and dielectric techniques.
Cuibus, L.1, Castro-Giráldez, M.
2, Fabbri, A
1, Fito, P.J.
2*
1 Dep. of Agricultural and Food Science, University of Bologna, Piazza
Goidanich 60, 47521 Cesena (FC)
2 Instituto Universitario de Ingeniería de Alimentos para el Desarrollo,
Universidad Politécnica de Valencia, Camino de Vera s/n, 46022 Valencia, Spain
*Author for correspondence: [email protected]
The Freezing process so used in the industries to preserve sometimes produces
damages in the product. The distribution of temperatures of raw potato was
measured during the freezing operation by using an infrared thermographic
camera Thermal Imager Optris PI160. Moreover, volume, moisture and water
activity were measured before and after the freezing process. Cryo-SEM was also
used to analyze the microstructure of potato before and after freezing. The
dielectric spectra of potato samples were measured before freezing and after
defreeze, using an Agilent 85070E Open-ended Coaxial Probe connected to a
network analyzer Agilent E8362B in the frequency range from 500 MHz to 20
GHz. The aim of this work was to control the temperature of potato surface during

86
the freezing operation to determine the water chemical potential and structural
changes of potato during this process, in order to determine the water motion
throughout the freezing. The results showed important relations between the heat
flux, water chemical potential gradients, structure changes and dielectric
properties indicating that infrared thermography and dielectric properties can be
considered very important nondestructive tools for controlling the freezing
process of potato.

87
II.3.1 Introduction
The potato (Solanum tuberosum L.) which is grown in over 100 countries
throughout the world is one of the staples of the human diet and one of the most
important raw materials for the food industry. Potatoes are one of the most
important sources of energy and other nutrients including vitamins and minerals
(Singh & Kaur, 2009). Potatoes are industrially processed in a wide range of
convenience products (Karlsson & Eliasson, 2003). The dry matter of potato
tubers is composed of various substances: starch (15%), sugars, nitrogen
compounds, lipids, organic acids, phenolic compounds, mineral substances and
non-starch polysaccharides (protopectin, soluble pectin, hemicelluloses, cellulose)
(Kita, 2002).
Freezing is one of the most used methods for long preservation of food
products, because it results in minimal deterioration of the original flavour,
colour, texture or nutritional values (Jalté& all, 2007) when it is compared with
other preservation methods. The quality of frozen foods depends on the size of ice
crystals (Li & Sun, 2002 a, b). Rapid freezing produces small intracellular ice
crystals, while slow freezing forms large ice crystals. Large ice crystals would
cause damages to food quality including appearance, sensory properties, textural
attributes and nutritional value (Li & Sun, 2002). Plant tissues (fruits and
vegetables), which present a semi-rigid cellular structure, exhibit less resistance to
the expansion of ice crystals in volume, thus they are prone to being subjected to
the irreversible freezing damage (Li & Sun, 2002). The freezing damages are also
caused by solute concentration in the unfrozen liquid and the osmotic transfer of
water from cell interior determines the dehydration damage. These damages in

88
plant tissues would result in loss of function in cell membrane, disruption of
metabolic systems, protein denaturation, permanent transfer of intracellular water
to the extracellular environment, enzyme inactivation, and extensive cell rupture
(Li & Sun, 2002).
Until recently, the only method for the detection of ice formation in plant tissues
has been the electronic recording of plant temperature using thermocouples and
examining the exothermic process, but this detection methods are both difficult
and sometimes unreliable (Le Grice et al., 1993; Wisniewski et al., 1997).
Moreover, the thermocouples are inserted into the tissue damaging the cells and
leading to solute leakage which itself may become a site for ice nucleation thus
creating an artifact (Le Grice et al., 1993; Wisniewski et al., 1997). Recent
advances and potential applications of Infrared thermography (TI) for food safety
and quality assessment such as temperature validation bruise and foreign body
detection and grain quality evaluation have been reviewed (Gowen& all, 2010).
TI is a two-dimensional, non-contact diagnostic technique for measuring surface
temperature of materials which can be usefully employed in non-destructive
quality evaluation (Giorleo & Meola, 2002, Gowen& all, 2010).
The aim of this paper was to describe and quantify the effect of the motion of
water in the freezing process and evaluate it effect in the structure.

89
II.3.2 Material and methods
Ten Fresh potato samples (Solanum tuberosum L. cv. Melody) were tempered at
4ºC before starting the experiment. Ten fresh potato samples were peeled and cut
with a cylindrical core borer in order to obtain cylinders with 45 mm diameter and
70 mm height. Potato samples were removed from the refrigerator, placed in the
freezer (Dycometal, S.L. model ACR-45/87) and maintained at -20 ºC. During the
freezing process, the surface temperature was recorded with an infrared
thermocamera (Thermal Imager optris PI160 with 120 Hz frame rate, detector
with 160 x 120 pixels), see figure 29. The volume of the samples during freezing
process was determined by image analysis of the pictures captured with
thermocamera every three minutes. The image analysis was made with Adobe
Photoshop®. Moreover, different thermocouples (Thermometer model HIBOK
14) were used to register the temperature of potato surface, the internal
temperature of potato and the temperature of the freezer. Volume, mass, surface
water activity, sugar content (º Brix), moisture and dielectric properties were
measured for every sample before and after freezing process. Mass was
determined using a Mettler Toledo (±0.0001) (Mettler-Toledo, Inc., USA)
balance.
The surface water activity was measured with hygrometer (DECAGON model
Aqualab CX-2, ±0.003). The measurement was carried out at 25ºC. Sugar content
was determined with a refractometer (Atago NAR-3T serie No 072505, Japan).
Moisture was determined by drying in vacuum at 70 ºC till constant weight
(AOAC, 1990). Cryo-SEM (low temperature scanning electron microscope) was
also used to analyzed the microstructure of potato before and after freezing;
Cryostage CT-1500C unit (Oxford Instruments, Witney, UK), coupled to a Jeol

90
JSM-5410 scanning electron microscope (Jeol, Tokyo, Japan) were used for the
analysis. The samples of fresh raw potato, respectively unfrozen potato, was
immersed in slush N2 (-210ºC) and then quickly transferred to the Cryostage at 1
kPa, where sample fracture took place. The sublimation (etching) was carried out
at -95ºC; the final point was determined by direct observation in the microscope,
working at 5 kV. The air velocity was measured using portable Airflow’s TA5
Thermal Anemometer.
Figure 29 Experimental scheme of freezing process and control system.

91
II.3.3 Results and discussion
In order to determine the real temperature at the upper surface of the potato during
the freezing process, it was estimated the emissivity of each potato in function of
the temperature and the freezing process. It has been applied the following
equation (see equation II.5)
ChobjobjairsursurobjobjSST ETFTTFT 444411E (II.5)
Where ET is the overall energy received by the pyrolysis sensor, F is a geometric
factor, being 1 because is parallel with the camera, is the emissivity (from the
object, surroundings or fixed in the camera), the constant of Stefan-Bolzman
(5,67·10-8
W/m2K), T the temperature (from the object, surroundings or obtained
in the IR camera) and ECh is the energy emitted in a first order transition or
chemical reaction. First term represents the energy emitted by the potato; the
second emitted by the surroundings and the third represents the energy absorbed
by the air.
In order to obtain the real temperature of the object where developed a simple
methodology with measures of temperature by thermopar sensor, sited in centre of
sample (1 mm of the surface) and was fitted real energy emitted and energy
received by the IR camera to obtain temperature profiles of surface sample.
The apparent emissivity was obtained, and it is shown in figure 30. In this figure it
is possible to observe a low decreasing of emissivity before freezing, fast
depression through the ice formation and an increasing of it during the low ice
formation and liquid phase concentration process.

92
Figure 30 Freezing process curve (■) and relative emissivity values (◊).
With this relation between emissivity and surface temperature is possible to obtain
the whole profile of temperatures in the slab surface of potato. Figure 31 shows
an example of temperature profile.
0,7
0,72
0,74
0,76
0,78
0,8
0,82
0,84
0,86
0
20
40
60
80
100
120
-12 -10 -8 -6 -4 -2 0 2 4 6
t (min)
T (ºC)
freezing process
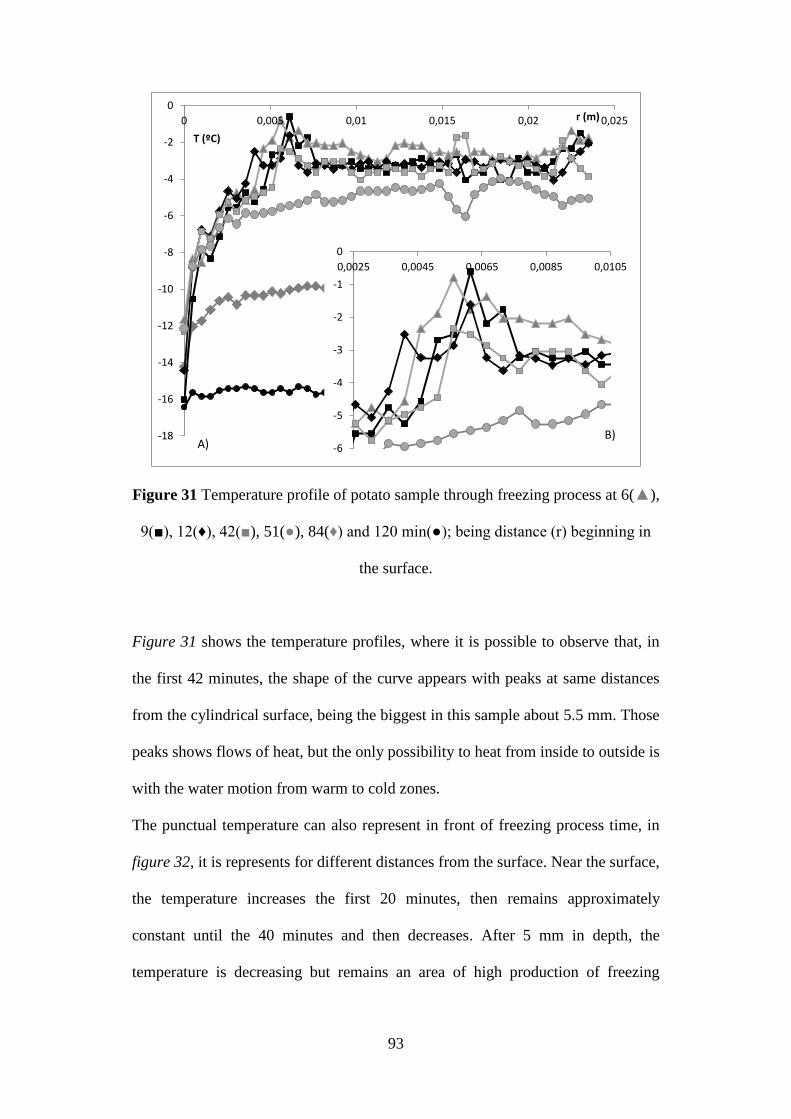
93
Figure 31 Temperature profile of potato sample through freezing process at 6(▲),
9(■), 12(♦), 42(■), 51(●), 84(♦) and 120 min(●); being distance (r) beginning in
the surface.
Figure 31 shows the temperature profiles, where it is possible to observe that, in
the first 42 minutes, the shape of the curve appears with peaks at same distances
from the cylindrical surface, being the biggest in this sample about 5.5 mm. Those
peaks shows flows of heat, but the only possibility to heat from inside to outside is
with the water motion from warm to cold zones.
The punctual temperature can also represent in front of freezing process time, in
figure 32, it is represents for different distances from the surface. Near the surface,
the temperature increases the first 20 minutes, then remains approximately
constant until the 40 minutes and then decreases. After 5 mm in depth, the
temperature is decreasing but remains an area of high production of freezing
-18
-16
-14
-12
-10
-8
-6
-4
-2
0
0 0,005 0,01 0,015 0,02 0,025
T (ºC)
r (m)
A) -6
-5
-4
-3
-2
-1
0
0,0025 0,0045 0,0065 0,0085 0,0105
B)

94
during 20 min. From 20 to 40 minutes is produce the maximum quantity of ice,
and represents for all profiles the same 20 minutes range.
Figure 32 Evolution of Temperature of potato sample through freezing process at
1mm(■), 4mm(□), 5mm(▲), 1cm(∆), 2cm(♦) and centre (●); being distance (r)
beginning in the surface.
Again, there is shown a flux of water from the inner heating the surface, the water
flux has to be promoted by the production of ice and the consequent concentration
process of the liquid phase.
The water activity of potato through the freezing can be estimate by Robinson &
Stokes (1965) adapted by Fontan and Chirife (1981), in next equation (see
equation II.6):
( )
(eq. II.6)
Being Tf the gradient between the initial freezing temperature and the freezing
temperature of product.
-16
-14
-12
-10
-8
-6
-4
-2
0
0 20 40 60 80 100 120 140
T(ºC)
t (min)

95
The engine of the movement of water is the water chemical potential and it is
possible to define as follows (see equation II.7):
(eq. II.7)
Figure 33 shows the evolution of water chemical potential at different distances,
where it is possible to observe high gradients close the surface and low gradients
close de centre of sample.
Figure 33 Variation of gradient of chemical potential through the time at surface
(♦), 1 mm (■), 2 mm (▲) and 1 cm (∆).
Water chemical potential promote the water transport from the inside to outside,
heating the surface, because the water inside is warmer than the water close the
surface. This water transport, accumulate water in a ring close the surface, in a
continuous process of ice production. Therefore the water freezing produce an
increasing of the overall volume of sample. In figure 34 is possible to observe the
partial volume average of samples throughout the freezing process.

96
Figure 34 Partial volume increment through the freezing process.
Figure 34 shows how after 40 minutes, the cylinder still grown, reaching the
maximum increase at 80 minutes, therefore the ice formation is important till this
time, figure 32, shows a temperature from -11 to -12 ºC for all profiles. By other
hand, with the enthalpy of melting of potato (see table 5) obtained from the
calorimetric analysis and the enthalpy of melting pure water obtained from the
bibliography is possible to obtain the unfreezeable water.
Table 5. Results from the DSC experiments, moisture and non freezeable water
estimated
Hmelting Hfreezing Hwater Tm' xw0 xw
nf
223±15 249±19 334 -19±2 0.847±0.015 0.204±0.016
0,98
1
1,02
1,04
1,06
1,08
1,1
0 20 40 60 80 100 120 140
V
t (min)

97
Thus, the freezing process produce ice throughout all process because never reach
the Tm’, prompting continuous gradients of water chemical potential and
consequently water movement, this phenomenon produces ice accumulation in the
area near the surface, dehydrating the middle of the samples, preserving the inner
area and degrading the area near the surface. Figure 35 present an scheme
explaining the dehydration process with the freezing and the accumulation energy
as a freezing latent heat.
Figure 35 Scheme of heat modelling to predict the behaviours involves in the
freezing process.
In the figure 36 we can see the microstructure of fresh potato cells tissue are
intact. The damage of cell structures of tissues, during the freezing process itself
can be mainly attributed to alterations of the middle lamella, cell membranes and
cell walls (Fennema, Powrie, &Marth, 1973). Though the freezing process, water
appears in multi phases, intracellular space, extracellular space, starch globules,

98
cell organs; the different membranes and layers that produce this separation of
water molecules also produce a resistance in the heat transmission. Therefore, the
freezing process produces different levels of ice and water liquid concentration
with the associated water transport. Water transport produces the deformation of
the tissue, as show figure 33, a water transport is promoted throughout the
freezing, induced by high gradients of water chemical potential, the water
transport accumulate ice close the surface of sample and dehydrate (preserving the
tissue) in the middle of potato. Comparing the left microstructure of fresh potato,
wall and membrane appears with tension; high water content inside de cell
produce high internal high pressure (Castro-Giraldez, et al., 2011), right
micrographies shows walls and membranes softs with folds, because the water
transport reduce the internal pressure.
S
W
A
A
S
W
A
B
W
S
A
C
D
W
S
D

99
Figure 36 Cryo-SEM micrograph for fresh (A-350x,C-500x,E-750x) and thaw
(B-350x,D-500x,F-750x) potato raw tissue (A: air space; S: starch granule; W:
cellular wall and membrane structure, SP: separation of cells, D: disruption of
cells).
Dielectric properties were measure in the middle of sample, where the
dehydration process by freezing were bigger, and were the thawing process
recover better the original structure. Figure 37 shows the spectra and also the
average values of loss factor in range of the effect of ionic molecules and in range
of water molecules.
W
S
A
E
W
S
SP
F
100
Figure 37 Dielectric spectra of fresh (black line) and thaw potato (dark grey line)
and liquid form thawing process (soft grey line); being solid line for loss factor
and dashed line for dielectric constant. Table shows the average values of loss
factor in range of 500 MHz, 10 GHz and gamma relaxation frequency.
Figure 37 shows in the average values of loss factor how the structure recover the
fresh structure in the middle of sample, but It is possible to observe how grown
the values in the liquid loss in thawing process with high mobility in the ionic
compounds and in the water, produced by the worst structural state in the areas
near the surface of the potato.
0
10
20
30
40
50
60
70
80
90
100
0,1 1 10 100
',''
f (GHz)
frequency 500 MHz 10 GHz relaxation
fresh 28,0±1,5 32,7±1,8 32,8±1,2
unfrozen 25,0±1,6 31±2 31,9±1,4
liquid 43,4±0,4 39,0±0,2 39,1±0,2
''

101
Conclusions
The freezing process produce ice throughout all process because never reach the
Tm’, prompting continuous gradients of water chemical potential and
consequently water movement, this phenomenon produces ice accumulation in the
area near the surface, dehydrating the middle of the samples, preserving the inner
area and degrading the area near the surface.
Infrared thermography not only serves to keep the heat fluxes flowing through the
potato but in addition also serve to keep the water activity gradients which move
this chemical specie by changing the structural state inside thereof.

102

103
II.3.4 References
Aguilera, L. M., & Stanley, D. W. (1990). Microstructural principles of food
processing and engineering. Essex, UK: Elsevier Science Publishers Ltd.
AOAC (1990), Official methods of analysis (15th ed.). Association of Official
Analytical Chemists, Arlington, VA.
Da-Wen Sun *, Bing Li, (2002). Microstructural change of potato tissues frozen
by ultrasound-assisted immersion freezing, Journal of Food Engineering
Fellows, P. (2000).Food Processing Technology––Principles and Practice (2nd
ed., pp. 418–440). Chichester, UK: Ellis HorwoodLtd.
Fuller M. P.&Wisniewski M., (1998). The use of infrared thermal imaging in
the study of ice nucleation and freezing of plants Journal of Thermal Biology Vol.
23, No. 2, pp. 81-89.
Gowen, A. A., Tiwari, B.K., Cullen, P.J., O’Donnell, C.P., McDonnell, K.
(2010). Applications of thermal imaging in food quality and safety
assessment.Trends in Food Science & Technology 21 (2010) 190e200
Giorleo, G., &Meola, C. (2002). Comparison between pulsed and modulated
thermography in glasseepoxy laminates. NDT & E International, 35(5), 287e292.
104
Jalté M., Lanoisellé J.L., Lebovka, N. I., & Vorobiev, E. (2009). Plasmolysis of
sugarbeet: pulsed electric fields and thermal treatment. LWT - Food Science and
Technology 42 576–580
Karlsson, M.E. &Eliasson A.-C. (2003). Gelatinization and retrogradation of
potato (Solanum tuberosum) starch in situ as assessed by differential scanning
calorimetry (DSC) Lebensm.-Wiss. u.-Technol. 36 735–741
Kita, A. (2002). The influence of potato chemical composition on crisp texture,
Food Chemistry 76,173-179
Le Grice, P., Fuller, M. P. and Campbell, A. (1993). An investigation of the
potential use of thermal imaging technology in the study of frost damage to
sensitive crops. Proceedings of 6th International Conference on Biological Ice
Nucleation. University of Wyoming, Laramie, USA, p. 4.
Li, B., & Sun, D.-W.(2002a). Novel methods for rapid freezing and thawing of
foods–A review. Journal of Food Engineering, 54, 175–182.
Li, B.,& Sun, D.-W.(2002b). Effect of power ultrasound on freezing rate during
immersion freezing.Journal of Food Engineering, 55, 85–90.
Minkina, W. (2004). Thermovision Measurements – Instruments and Methods,
Publishing Office of Częstochowa University of Technology, Częstochowa, (in
Polish)

105
Singh, J., Kaur, L. (2009). Advances in potato chemistry and technology,
Academic Press, Elsevier Inc.
Świędrych, A., Prescha, A., Matysiak-Kata, I., Biernat, J., Szopa, J. (2002).
Repression of the 14-3-3 gene affects the amino acid and mineral composition of
potato tubers, Journal of agricultural and Food Chemistry, 50, 2137-2141
Szymońska, J., &Wodnickab, K. (2005). Effect of multiple freezing and
thawing on the surface and functional properties of granular potato starch, Food
Hydrocolloids ,753–760

106

107
II.4 Spinach- Infrared thermography versus image analysis:
A survey
II.4.1 Introduction
Spinach (Spinacia oleracea) was recorded in Europe as early as the mid-13th
century, with colonists carrying spinach seed to the New World and is native from
Southwest Asia. The consumption of spinach increases during the years and this
vegetable increases the lymphocyte DNA resistance to oxidative stress (Porrini et
al., 2002).
Freezing is an extensively used method for long preservation of food quality
products, which may result in textural changes leading to tissue softening. The
freeze food product has been increasing in recent years, especially as a result of
changes in the lifestyles of consumers (Ragaert et al., 2004). The quality of
frozen foods depends on the size of ice crystals (Li & Sun, 2002 a, b) and some
attempts have been made to improve the resistance of fruit and vegetables to
freezing damage by several methods (Moraga et al., 2006 and Suutarinen et al.,
2000). Rapid freezing produces small intracellular ice crystals, but if the product
it’s kept for a long time frozen, the formed ice crystals expand creating
irreversible damage for the cell membrane. Infrared thermography becomes
popular and is being used in the agro-food research and processing because of the
characteristic non-destructive of this technique to measure the temperature of
surface of the products.
The objective of this study was to evaluate the capability of IRT to detect the
ice dimension distribution comparing with image analysis system. This paper
reports the development of image processing methods for the detection of
superficial changes related to quality deterioration in spinach cubes freeze after 10

108
months of storage at -20 °C. This survey was realized at the end of the one part of
the project that study the development of image processing methods for the
detection of superficial changes, ice crystal dimension, related to quality
deterioration in freeze spinach cubes during storage for a long period. To have a
better control of the crystal ice formation the cubes were analyzed every week and
see the difference of ice crystal dimensions using a digital camera.

109
II.4.2. Material and methods
Theorical considerations
The radiance entering a thermographic camera originates from three
sources (Lamprecht et al., 2002): (i) the observed object itself; (ii) other objects
reflected on the target's surface, and; (iii) an atmospheric contribution.
444411R areflreflobjobjrrT TTTT (II.8)
where RT is the energy flux emitted at a wavelength of 7.3–13 μm in W
m−2
, ɛ is the emissivity of the target (equal to 1 for a perfect emitter), σ is Stefan–
Boltzmann's constant (5.67051 × 10⁻⁸ W m−2
K−4
), (1 – ɛ) corresponds to the
reflectivity, (1 – τ) is the emittance of the atmosphere, T is the temperature of the
target, Trefl is the background temperature that the target is reflecting and Ta is the
air temperature, all in K.
With the use of an image capture device such as a digital camera (Nikon
D7000), an image can be analyzed by application of the appropriate algorithms to
determine some characteristics regarding the structural quality of the products.
Experimental procedure
The Spinach (Spinacia oleracea) cubes freeze used for our experiment was
stored at -20 °C for 10 months. The setup of the experiment is shown in the figure
38. A black box was used in order to remove light reflections that could have
disturbed our measurements. For image analysis was used a digital camera Nikon
D7000 (Nikon Corp., Tokyo, Japan) with a professional 105 mm lens. The

110
settings used for the camera were: exposure time 0.77 sec., ISO 100, f-stop f-16,
digital zoom 1, and metering mode was set to spot. The pictures obtained in sRGB
format color have a resolution about 4928 x 3264 pixels, 300 dpi, and bit depth
24.
Figure 38 Experimental setup for measuring the ice crystal dimension by
Nikon D700 digital camera and Flir A325 infrared thermocamera.
For the measurement of temperature of spinach freeze cubes were use an
infrared camera FLIR A325 with a spectral infrared range of wavelength from 7.5
to 13.0 μm, a temperature range of -20 to + 120 °C. The thermograms obtained
use the sRGB color representation and a resolution around 320 x 240 pixels, 72
dpi, and bit depth 24. The emissivity used for this measurement was set at 0.98
(Fuchs & Tanner 1966; Salisbury & Milton, 1988; Rahkonen & Jokela 2003).
Measurements were performed at ambient room temperature of 22 ± 2°C.
The freeze cubes stored at -20 °C were carried out from the freezer and fix
in the black box. After that were captured images using the both camera for 15
samples. The images obtained were analyzed using professional software Image-
Pro Plus.

111
II.4.3. Results and discussion
The highest obstacle in this analysis was the resolution of the pictures that
we can see also in the figure 39. In the first case the digital image with a highest
resolution confers more information and was possible to analyze the dimension of
ice crystals.
Figure 39 Comparing the RGB digital image with an infrared image using
Image-Pro Plus software.
The thermogram having a less resolution doesn’t offer enough data to
correlate with the dimension of ice crystals. The temperature of the spinach is not
very relevant in this case because the spinach cube is covered entirely with ice
with a different thickness. In this case any reflection can cause a temperature
measurement error. We have tried also to analyze the spinach cubes after
defrosting, but in this case we lose a high quantity of ice and the applicability in
industrial line are without any benefit.
112
After the data analysis of the picture obtained we can conclude that is
difficult finding a correlation between data from digital image and thermogram
am more analysis are required. With the new sensors development with a higher
resolution for infrared thermocamera we can confront this 2 techniques.
The techniques available for digital image analysis are applied with
success in many control steps in the food industry (i.e., colour, size, shape, and
texture). IR images are very adequate for the process where is important to have a
control of surface temperature of the product, non-destructive and with a low
importance in terms of image resolution.

113
II.4.4. References
Fuchs,M. , Tanner, C.B. (1966). Infrared thermometry of vegetation. Agronomy
Journal, 58, 597–601
Lamprecht, I., Schmolz, E., Hilsberg, S., Schlegel, S., (2002). A tropical water
lily with strong thermogenic behaviour-thermometric and thermographic
investigations on Victoria cruziana. Thermochimica Acta, 382, 199–210.
Li, B., & Sun, D.-W. (2002a). Novel methods for rapid freezing and thawing of
foods––a review. Journal of Food Engineering, 54, 175–182.
Li, B.,& Sun, D.-W. (2002b). Effect of power ultrasound on freezing rate during
immersion freezing. Journal of Food Engineering, 55, 85–90.
López,A., Molina-Aiz,F.D., Valera, D.L., Peña, A. (2012). Determining the
emissivity of the leaves of nine horticultural crops by means of infrared
thermography. Scientia Horticulturae, 137, 49-58
Moraga, G., Martínez-Navarrete, N., Chiralt A., (2006). Compositional
changes of strawberry due to dehydration, cold storage and freezing-thawing
process Journal of Food Processing and Preservation, 30, 458–474
Porrini M, Riso P, Oriani G. (2002). Spinach and tomato consumption increases
lymphocyte DNA resistance to oxidative stress but this is not related to cell
carotenoid concentrations. European Journal of Nutrition 41, 95-100
Ragaert, P., W. Verbeke, F. Devlieghere, J. Debevere. (2004) Consumer
perception and choice of minimally processed vegetables and packaged fruits
Food Qual. Preference, 15, 259–270

114
Salisbury,J.W., Milton, N.M. (1988). Thermal infrared (2.5–13.5 μm)
directional hemispherical reflectance of leaves. Photogrammetric Engineering &
Remote Sensing, 54, 1301–1304
Suutarinen, J., Heiska, K., Moss, P, Autio, K. (2000). The effects of calcium
chloride and sucrose prefreezing treatments on the structure of strawberry tissues
LWT Food Science and Technology, 33, pp. 89–102

VERBALE DEL COLLEGIO DOCENTI
DOTTORATO IN INGEGNERIA AGRARIA
Il giorno 07.03.2013 alle ore 19.00 in una sala del Dipartimento di Economia e Ingegneria Agrarie dell'Università di
Bologna, si riunisce il Collegio dei Docenti del Dottorato in Ingegneria Agraria.
Risultano presenti: Adriano Guarnieri, Patrizia Tassinari, Marco Bentini, Giuseppe Taglioli, Giorgio Ade, Fabio
Pezzi, Giovanni Molari, Angelo Fabbri, Paolo Zappavigna, Luigi Ragni, Donatella Pavanelli, Paolo Liberati, Daniele
Torreggiani, Stefano Benni
Risultano assenti giustificati: Valda Rondelli, Antonio Checchi, Claudio Caprara.
Presiede la seduta il: prof. ing. Adriano Guarnieri
Segretario del collegio: prof. ing. Giovanni Molari
ORDINE DEL GIORNO
1. Comunicazioni
2. Presentazione dottorandi XXV da allegare alla tesi
3. Varie
……………………………………………………….OMISSIS………………………………………………………….
2) Presentazione dottorandi XXV Ciclo da allegare alla tesi
Il Collegio è chiamato a redigere, per ciascun allievo, la “presentazione“ da allegare alla tesi finale.
Si invitano, a tal fine, i componenti del Collegio, che prevalentemente hanno guidato le attività di ricerca dei
dottorandi a voler illustrare i contenuti delle predette tesi ed i risultati conseguiti dagli allievi.
Dopo ampia discussione, il Collegio dei Docenti decide, unanime, di approvare le “presentazioni” di seguito riportate
che illustrano la personalità di ciascun dottorando e l’attività scientifico - formativa svolta durante il corso,
mettendone in luce gli aspetti positivi o, eventualmente, negativi.
Ing. Lucian Cuibus
Curriculum seguito: Macchine e impianti per i prodotti agricoli
Titolo tesi: Applications of infrared thermography in the food industry
L’ing. Lucian Cuibus, nel periodo di attività del dottorato, ha partecipato alle attività formative programmate. Ha
svolto attività di ricerca relativa all'applicazione della termografia infrarossa su diversi prodotti alimentari, in termini
di miglioramento della qualità e della sicurezza degli alimenti. L’ing. Cuibus si è occupato inoltre della validazione
sperimentale di modelli numerici di processi, sviluppati in precedenza, relativi al trattamento termico di uova con aria
calda. L’ing. Cuibus ha trascorso un periodo all’estero presso l’Institute of Food Engineering for Development
Department of Food Technology, Polytechnic, University of Valencia, Spain, sotto la guida del prof. Pedro J. Fito
Suñer. Durante lo stage il dottorando si è occupato di studio della applicazione della termografia al controllo della
surgelazione della patata. Ha inoltre svolto attività di supporto alla didattica. Visto il percorso formativo svolto, il
collegio dei docenti esprime unanime il parere favorevole all’attribuzione del titolo di Dottore di Ricerca per l’ing.
Lucian Cuibus.
……………………………………………………….OMISSIS………………………………………………………….
Le deliberazioni assunte in questa seduta, sono redatte, lette e sottoscritte seduta stante.
La seduta è tolta alle ore 19.45.
IL SEGRETARIO IL PRESIDENTE DELLA SEDUTA
Prof. Ing. Giovanni Molari Prof. Ing. Adriano Guarnieri