Embed Size (px)
Citation preview
Seven Key Measures Seven Key Measures for Software Testingfor Software Testing
Graham ThomasRCOG, 15th June 2006
Specialist Interest Groupin Software Testing
2
Abstract
Last year I came across the worst measurement example that I had seen in over 20 years experience of IT.
Part of the problem comes from the fact that there isn’t a standard set of measures, so should we actually get upset when software testers measure the wrong thing, in the wrong way, and then report it badly? Actually no! Not until there is a standard definition for software test measurement and reporting.
So there is the challenge for this presentation. To present a standard set of measures, metrics and reports for software testing so that there can no longer be any excuse.
This presentation proposes 7 key measures across the software testing lifecycle, covering; Planning, Risk, Test Preparation, Test Execution and Defect analysis. The presentation will also identify effective ways to present the 7 key measures in the form of a practical model.
3
Agenda
● An example Test Report
● Definition of Measurement and Metric
● Seven Key Measures
● Weekly Reporting
● More measures and metrics
● Tips for success
● Conclusion
4
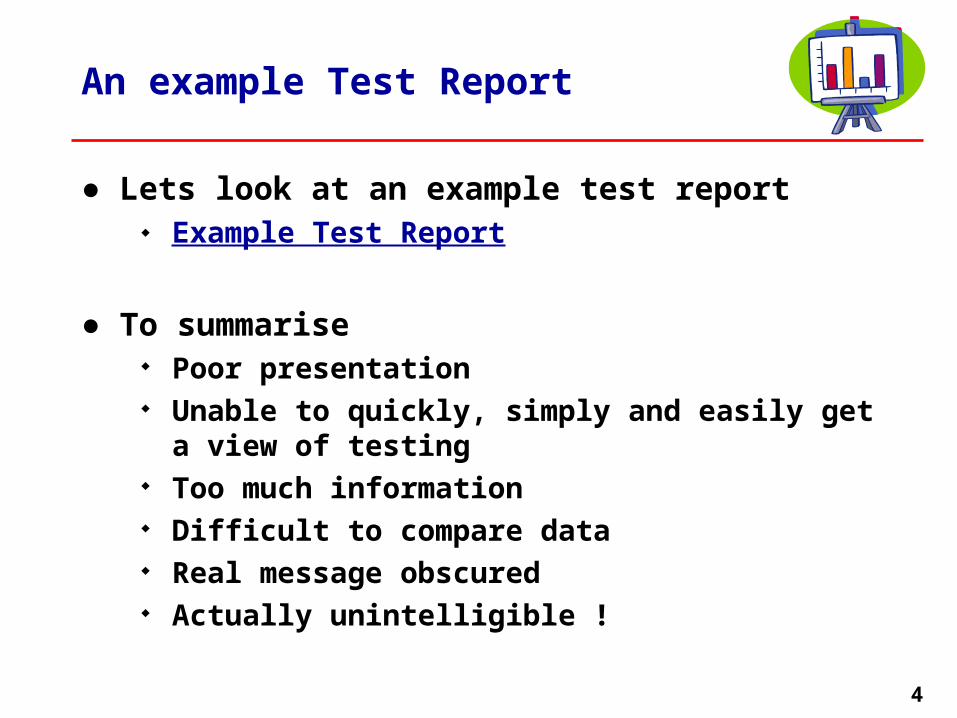
An example Test Report
● Lets look at an example test report Example Test Report
● To summarise Poor presentation Unable to quickly, simply and easily get a view of testing Too much information Difficult to compare data Real message obscured Actually unintelligible !
5
DefinitionMeasurement - Metric
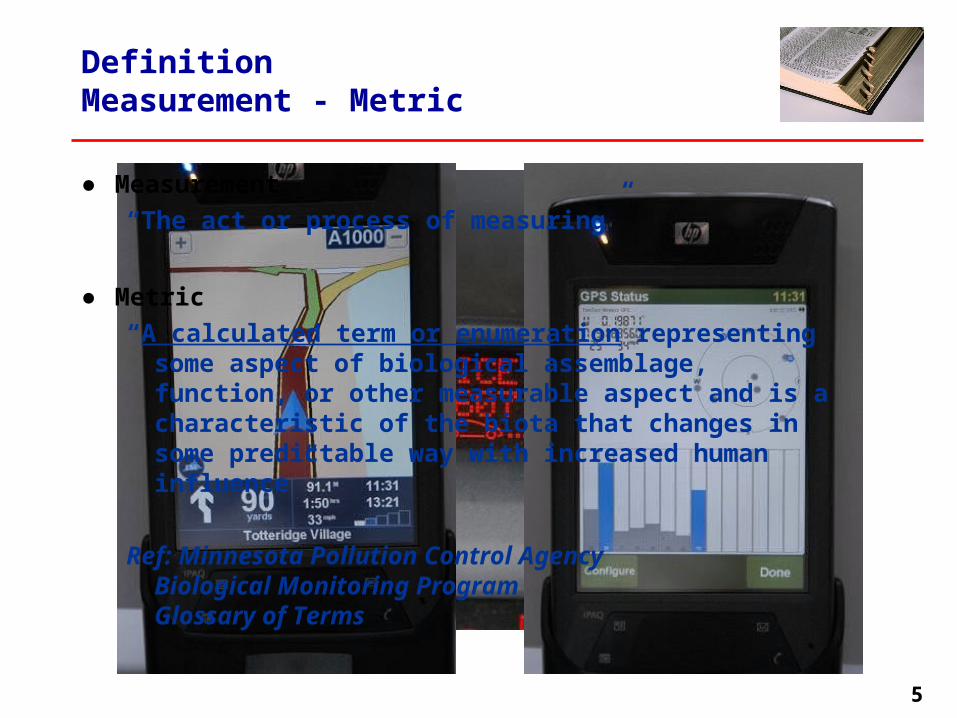
● Measurement
“The act or process of measuring”
● Metric
“A calculated term or enumeration representing some aspect of biological assemblage, function, or other measurable aspect and is a characteristic of the biota that changes in some predictable way with increased human influence”
Ref: Minnesota Pollution Control AgencyBiological Monitoring ProgramGlossary of Terms
6
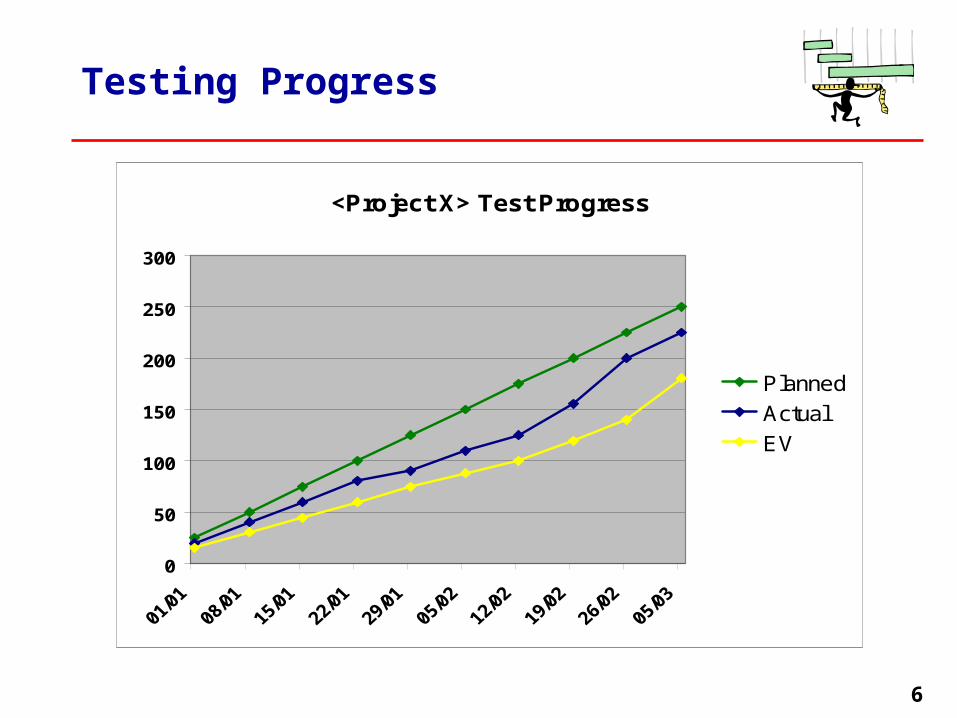
Testing Progress
<Project X> Test Progress
0
50
100
150
200
250
300
Planned
Actual
EV
7
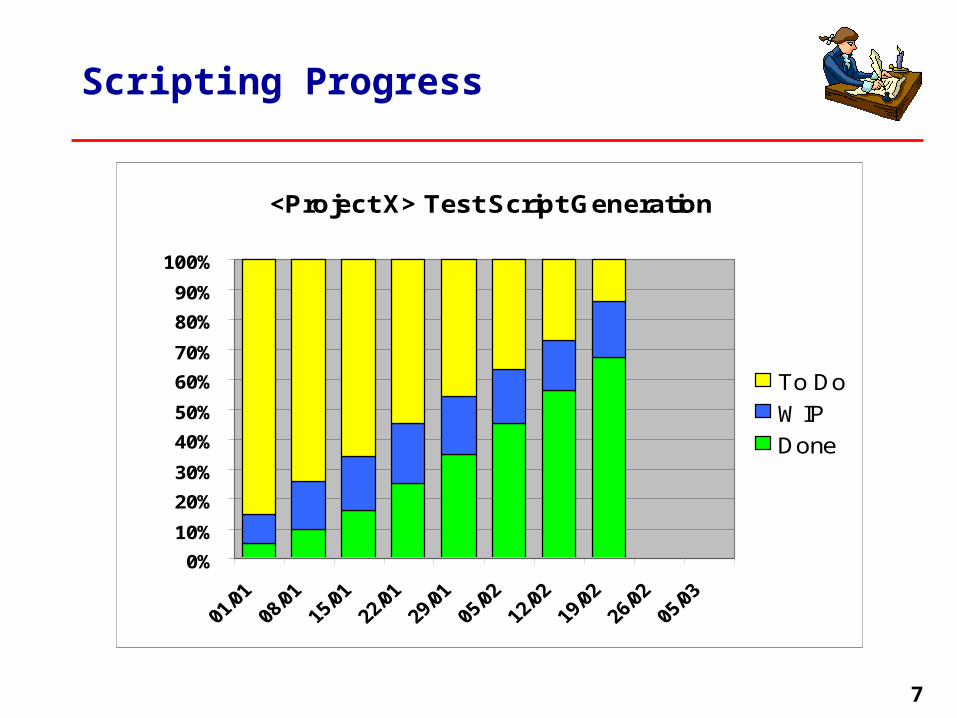
Scripting Progress
<Project X> Test Script Generation
0%
10%
20%
30%
40%
50%
60%
70%
80%
90%
100%
To Do
WIP
Done
8
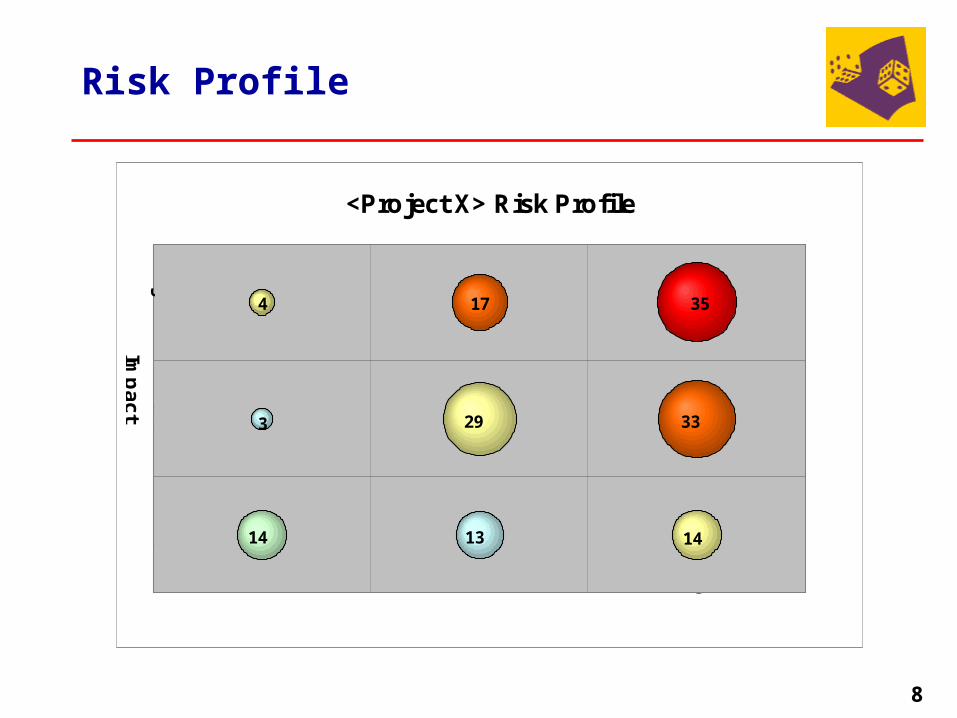
Risk Profile
<Project X> Risk Profile
17 354
3 29 33
14 13 14
Imp
ac
t
Likelihood
HighMediumLow
Hig
hM
ed
ium
Lo
w
9
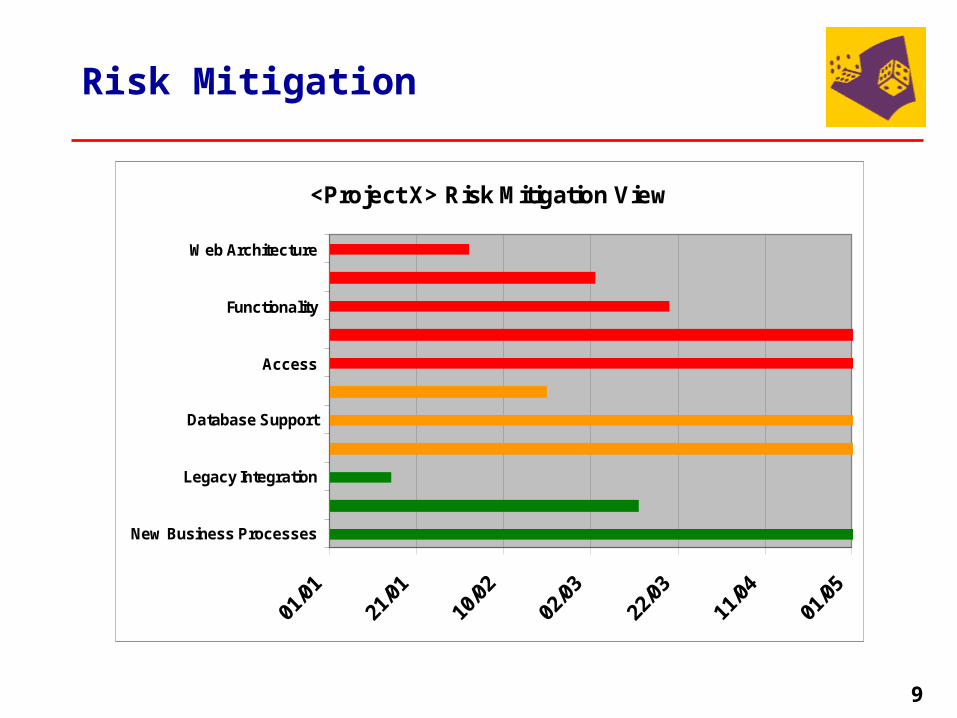
Risk Mitigation
<Project X> Risk Mitigation View
New Business Processes
Legacy Integration
Database Support
Access
Functionality
Web Architecture
10
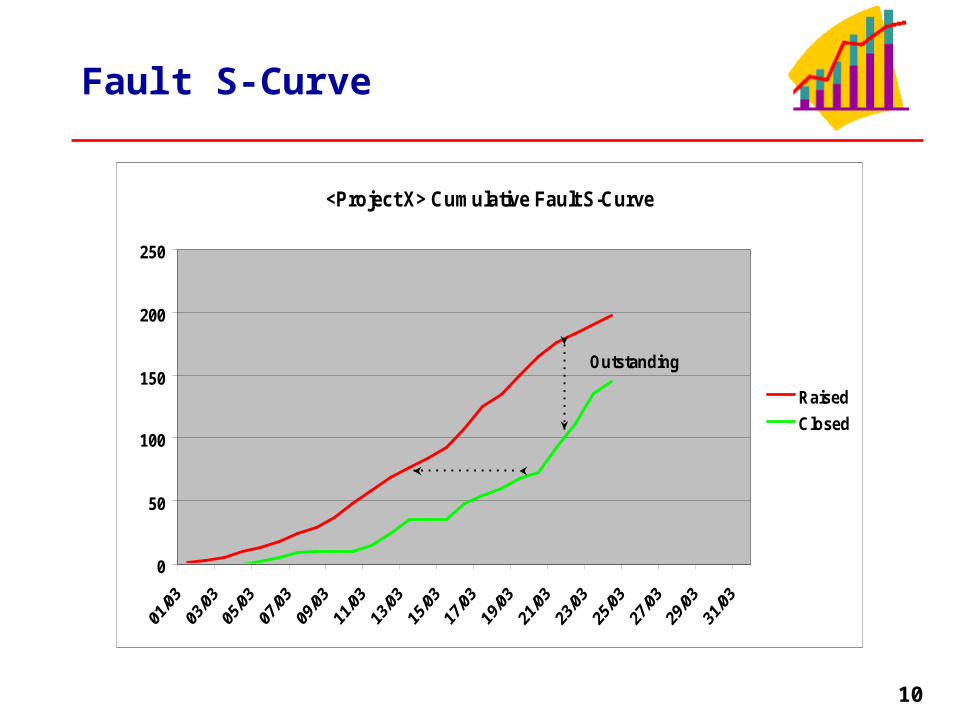
Fault S-Curve
<Project X> Cumulative Fault S-Curve
0
50
100
150
200
250
Raised
Closed
Outstanding
lag
11
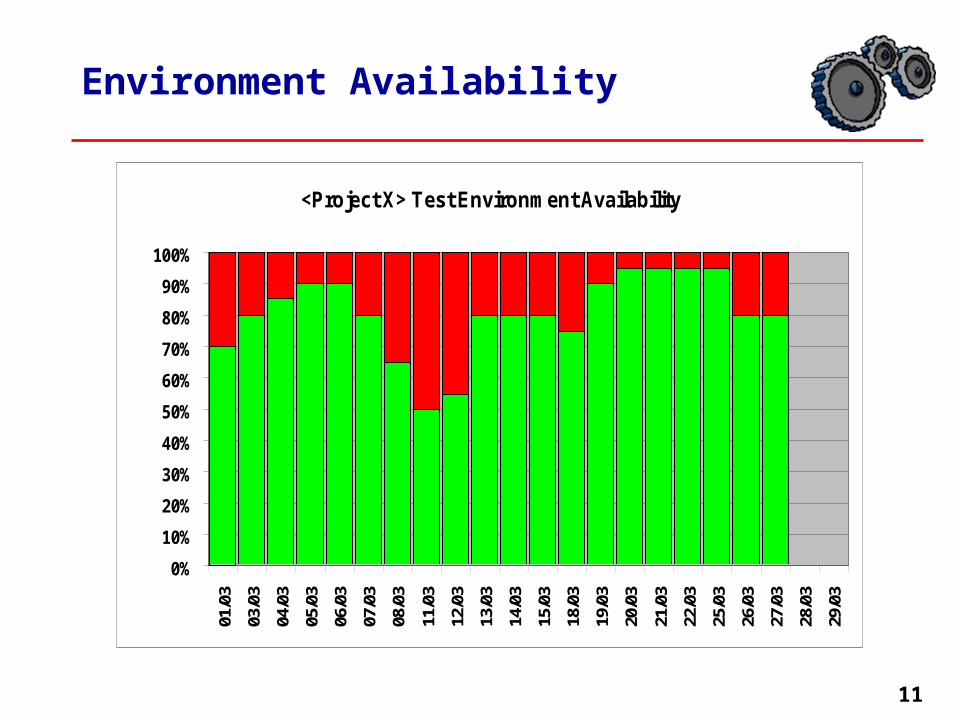
Environment Availability
<Project X> Test Environment Availability
0%
10%
20%
30%
40%
50%
60%
70%
80%
90%
100%
01/0
3
03/0
3
04/0
3
05/0
3
06/0
3
07/0
3
08/0
3
11/0
3
12/0
3
13/0
3
14/0
3
15/0
3
18/0
3
19/0
3
20/0
3
21/0
3
22/0
3
25/0
3
26/0
3
27/0
3
28/0
3
29/0
3
12
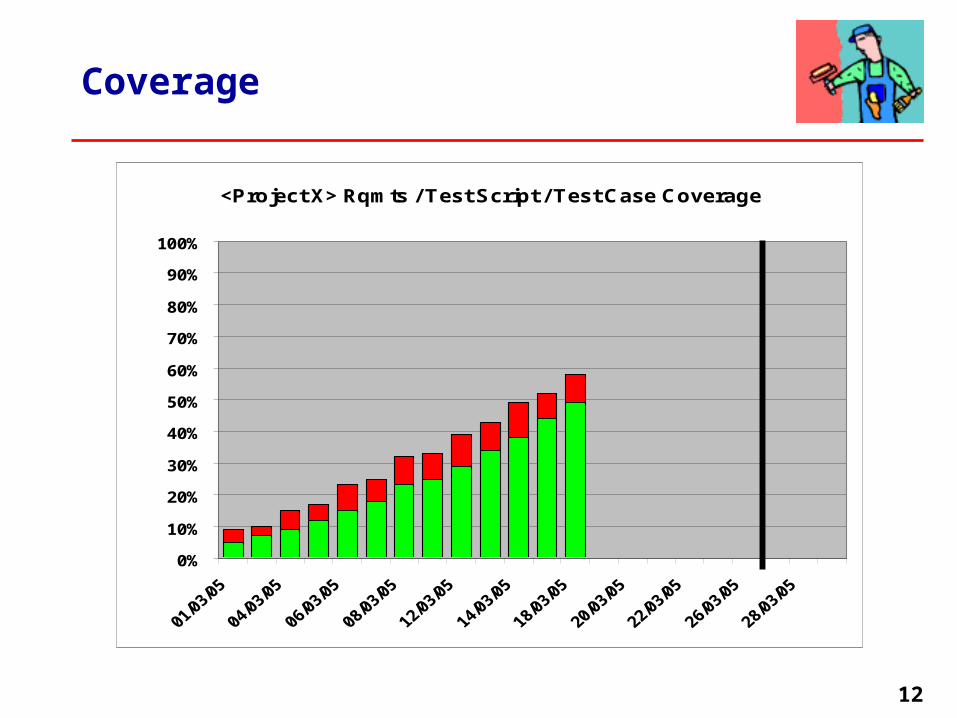
Coverage
<Project X> Rqmts / Test Script / Test Case Coverage
0%
10%
20%
30%
40%
50%
60%
70%
80%
90%
100%
13
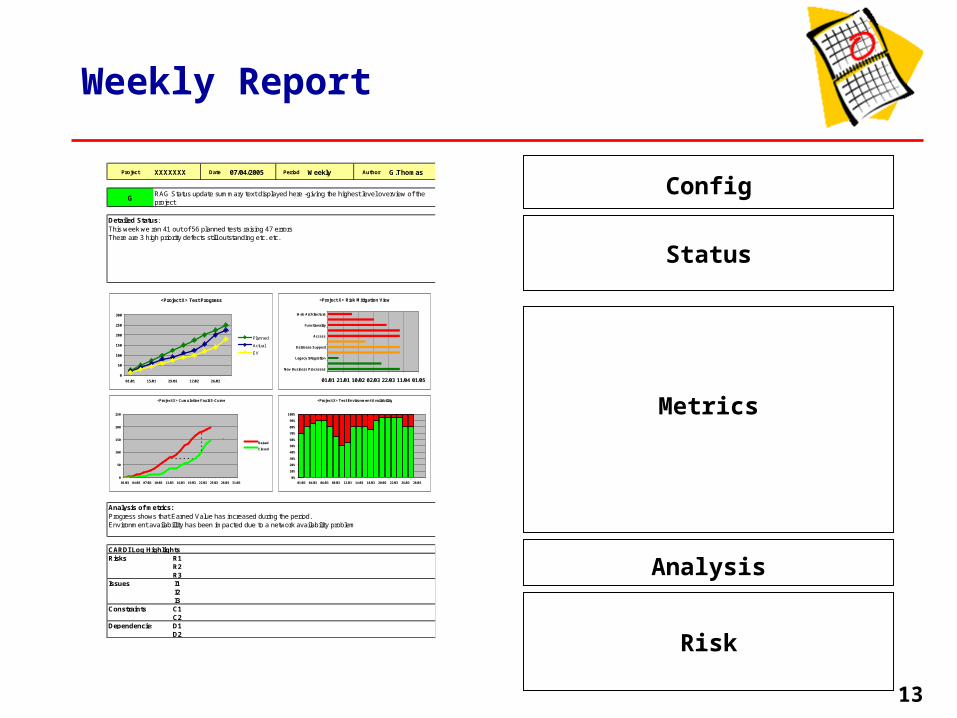
Weekly Report
Project XXXXXXX Date 07/04/2005 Period Weekly Author G.Thomas
G
Risks R1R2R3
Issues I1I2I3
Constraints C1C2
Dependencies D1D2
RAG Status update summary text displayed here -giving the highest level overview of the project
CARDI Log Highlights
Analysis of metrics:Progress shows that Earned Value has increased during the period.Environment availabillity has been impacted due to a network availability problem
Detailed Status:This week we ran 41 out of 56 planned tests raising 47 errorsThere are 3 high priority defects still outstanding etc. etc.
<Project X> Test Progress
0
50
100
150
200
250
300
01/01 15/01 29/01 12/02 26/02
Planned
Actual
EV
<Project X> Risk Mitigation View
01/01 21/01 10/02 02/03 22/03 11/04 01/05
New Business Processes
Legacy Integration
Database Support
Access
Functionality
Web Architecture
<Project X> Cumulative Fault S-Curve
0
50
100
150
200
250
01/03 04/03 07/03 10/03 13/03 16/03 19/03 22/03 25/03 28/03 31/03
Raised
Closed
Outstanding
lag
<Project X> Test Environment Availability
0%
10%
20%
30%
40%
50%
60%
70%
80%
90%
100%
01/03 04/03 06/03 08/03 12/03 14/03 18/03 20/03 22/03 26/03 28/03
Config
Status
Metrics
Analysis
Risk
14
REDBLACK
YELLOWBLUERED
GREENYELLOWBLACKBLUE
BLACKRED
YELLOWGREENBLUE
GREEN
ZYPQLEKFSUWRGXCIDBWOPR
ZYPQLEKFXCIDB SUWRGWOPR
SUWRGZYP
XCIDB QLEKFWOPR
More Measures and Metrics
● Use these views to support the view and message Defects by Type / Severity / Priority Defect Hot Spot Analysis Defect Age Analysis Causal Analysis
● Metrics Defects / Faults per KLOC / KXLOC Defects per Requirement Days Test Effort per Requirement DDP
The Stroop Effect
15
A Few Tips for successful charting
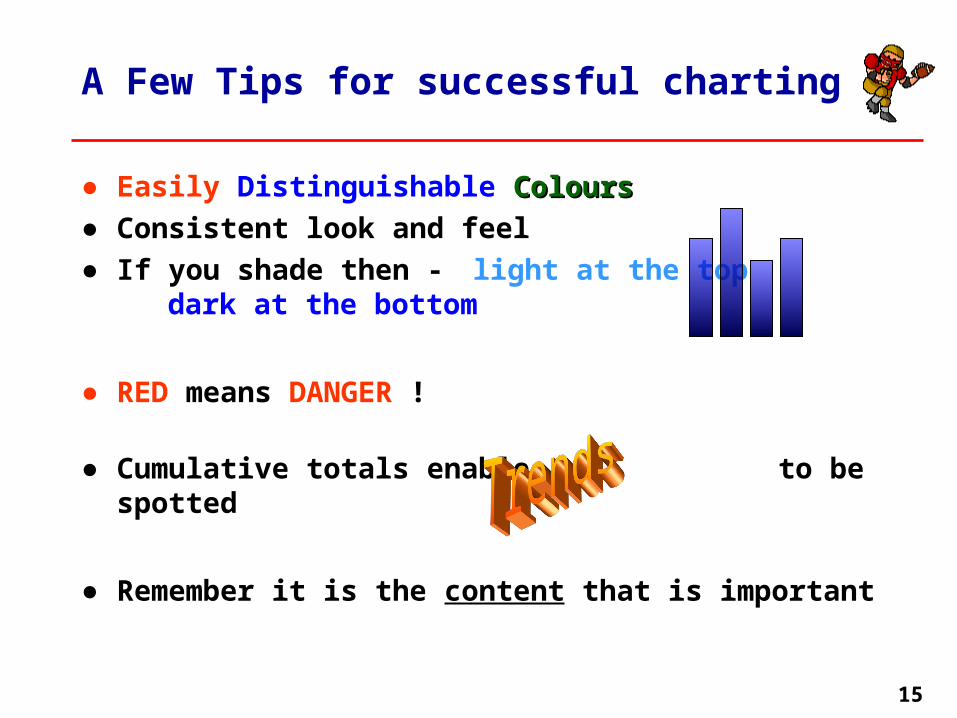
● Easily Distinguishable ColoursColours● Consistent look and feel
● If you shade then - light at the topdark at the bottom
● RED means DANGER !
● Cumulative totals enable to be spotted
● Remember it is the content that is important
16
Conclusions
● There are other things to measure than just defects
● Report trends rather than snapshot measurements
● Limit the amount that you report to increase impact
● Be consistent in your reporting
● Explain what you mean by your measurements - don’t assume that others will automatically know
17
Contact Details
Graham Thomas
Independent Consultant
+44 7973 387 853
www.badgerscroft.com