Embed Size (px)
Citation preview

I am grateful to Gregory Kidd for his help in writing this speech, and to Andrew Bailey, James Benford, Christine Boykiw, Ben Broadbent, Nicholas Butt, Rohan Churm, Victoria Cleland, Amber Evans, Michael Foster, Richard Gordon, Sarah Hall, Andrew Harley, Ronan Hodge, Al Hughes, Lance Jones, Adam Newell, Will Parry, Rhys Phillips, Jo Place, Eugenia Planas, Dave Ramsden and Tim Taylor for their advice, comments and guidance.
All speeches are available online at www.bankofengland.co.uk/news/speeches
1
Seven Moments in Spring: Covid-19, financial markets and the Bank of England’s balance sheet operations Speech given by
Andrew Hauser, Executive Director, Markets
Bloomberg, London
4 June 2020
All speeches are available online at www.bankofengland.co.uk/news/speeches
2
2
Introduction
I have always had a funny feeling about Friday the 13th – and 13 March 2020, Mark Carney’s last day in the
office as Governor of the Bank of England, was no exception.
Two days earlier, on Wednesday 11 March, the Bank and HM Treasury had launched an unprecedentedly
comprehensive package of measures to respond to the rapidly growing economic consequences of the
spread of Covid-19. Hailed globally as a shining example of how monetary, fiscal and regulatory policies
could work together to reinforce one another, the combination of interest rate cuts, government spending,
cheap funding and capital easing measures seemed sure to stabilise markets and restore some much-
needed confidence to households and businesses.
So it cannot have been hugely welcome when, on Friday morning, with the removal vans waiting outside,
I suggested the Bank’s Governors needed to meet again before the weekend. The previous day had seen
disorderly conditions in the US Treasury market and the largest one-day fall in equity prices since the 1987
crash, despite major new policy announcements from the Federal Reserve and ECB. As I ran through my
gloomy update, it was clear that further action would be needed – but perhaps not at that stage quite how
much more. Monday morning would be no quiet start for Andrew Bailey, the new Governor.
In my remarks today, I want to give a bird’s eye’s view of what happened in those extraordinary weeks, and
the steps we took – either in concert with others, or using our own balance sheet – to neutralise the sudden
pre-lockdown 'dash for cash' – the biggest test of core market functioning and resilience since the Great
Financial Crisis (GFC) of 2008-9. Judged solely against that narrow yardstick, central bank actions –
unprecedented in scale and speed – were successful in averting a market meltdown. Commercial banks,
strengthened by the post-GFC reforms, have continued to lend, supported by a range of public sector
schemes. And we learned some surprisingly positive things about operating a financial system remotely –
both in terms of market resilience, but also in terms of diversity and inclusion.
But this is no time for self-congratulation. The broader aspects of the Covid-19 crisis – medical, social,
economic, and personal – remain hugely challenging, and involve a much wider set of actors than central
banks alone. Further financial instability cannot be ruled out. And the sheer scale of the balance sheet
interventions necessary in recent months pose important longer term questions. About the extent to which
the non-bank financial system may still be capable of amplifying instability – for example through sudden
non-bank deleveraging, runs on money market funds, or rigidities in dealer intermediation. And about the
appropriate balance of responsibilities between the public and private sector for dealing with such
vulnerabilities.
All speeches are available online at www.bankofengland.co.uk/news/speeches
3
3
I cannot give comprehensive answers to these questions today. But, in what follows, I have tried to provide
some raw material for that exercise, illustrated using seven of the most vivid ‘moments’ from my own
experience of the past few weeks.
Moment 1: the first rumbles of thunder
In the first week of March – the week before that fateful Friday 13th – we at the Bank had decided to move all
of our market operations to full split site working, to reduce the risk of Covid-19 transmission. On Friday 6
March, as I was walking across the trading floor saying goodbye, my attention was drawn to a group of our
foreign exchange reserves managers staring intently at their screens and talking animatedly. A big
adjustment in financial markets had already been underway for some time, as expectations of slower
demand caused by the global spread of the virus pulled down on equity and oil prices, and investors moved
into safer assets, reducing yields (Chart 1). Market functioning had however mostly held up well.
In recent days, however, something had changed. Wednesday had seen a sharp intraday rise in yields on
US Treasury bonds (USTs) – normally one of the deepest and most liquid markets in the world – amidst a
big pickup in market volumes. Then, on Friday morning, yields on 30-year USTs fell by 7 basis points in less
than 15 minutes. More worryingly, other normally reliable relationships between USTs and related financial
instruments had begun to unravel.
What seemed to be happening was that financial transactions that normally helped to stabilise UST markets
had gone into reverse, becoming stress-amplifiers. In recent years, hedge funds and other leveraged
investors had taken on the role of maintaining so-called ‘arbitrage relationships’ between financial
instruments that should trade in line with one another. They did this in a number of ways – but a particularly
popular trade involved the so-called ‘futures basis’: buying USTs, funded by repo, and selling bond futures
to large asset managers eager to pick up return. These trades were conducted at thin margins and high
rates of leverage.1 The sharp pickup in asset price volatility, as markets struggled to process the news about
the onset of the virus, increased margin calls – forcing funds to unwind some of their basis trades, selling
USTs to generate cash. Initially these trades were conducted quietly. But as time went on, their speed and
size – running to hundreds of billions of dollars – began to overwhelm dealers’ intermediation capacity, which
was itself shrinking as the result of rising volatility and the operational challenges of remote working. Rising
transaction costs and the breakdown in arbitrage relationships began feeding on themselves: a classic
‘doom loop’ (Chart 2).
What was unique about this process, and potentially disastrous for the financial system, was that even the
highest quality government assets were not good enough. Just like high street companies facing
1 Leverage rates of 40-60 times were common, but anecdotal reports suggest some ran much higher.

All speeches are available online at www.bankofengland.co.uk/news/speeches
4
4
evaporating revenues, market participants needed cash. In the days that followed, this so-called ‘dash for
cash’ would spread to every corner of the global financial system.
Chart 1: US equity prices and bond yields
Sources: Bloomberg Finance L.P. and Bank calculations. Displayed as changes year to date.
Chart 2: The ‘dash for cash’ in US Treasuries
Sources: Bloomberg Finance L.P, Eikon by Refinitiv.and Bank calculations. Bid/offer spreads are 5 day moving averages.
Moment 2: a global response to dollar shortages
Monday 9 March was another day of turmoil in financial markets: oil prices fell by 30%, equity prices by 8%
and there were further sharp moves in UST yields. Just after 9pm that evening, we received an email from
the Federal Reserve: could the dollar swap line central banks speak the following morning?
The dollar swap lines may be the most important part of the international financial stability safety net that few
have ever heard of.
Global trade and investment relies on the dollar. In normal times, firms and local banks located outside the
United States can easily secure these dollars using FX swaps, provided by international banks with access
to US markets, to exchange their local currency for dollars. In times of turbulence, however, these markets
can become impaired, or even seize up altogether, as the international banks batten down the hatches.
Trading firms who cannot secure dollars will either have to cease trading altogether, or try to raise dollars in
other ways, for example by liquidating dollar-denominated assets. That selling pressure, if allowed to take
hold, could trigger, or amplify, global financial instability.
9 Mar: Start of ‘dash for cash’
-35
-30
-25
-20
-15
-10
-5
0
5
-150
-130
-110
-90
-70
-50
-30
-10
10
Jan 20 Feb 20 Mar 20 Apr 20 May 20 Jun 20
Basis pointsPer cent
UST 10y yield (RHS) S&P 500 (LHS)
Brent Crude (LHS)
6 Mar
23 Mar: Federal Reserve announces further measures
-20
0
20
40
60
80
100
120
140
0
0.4
0.8
1.2
1.6
2
2.4
2.8
3.2
Jan 20 Feb 20 Mar 20 Apr 20 May 20
Basis points
UST 30y bid/offer spread (RHS)
UST swap spread 30y, inverted (LHS)
UST 10y cash-futures basis (LHS)
15 Mar: USD swapline rate and maturity enhanced
Basis points
All speeches are available online at www.bankofengland.co.uk/news/speeches
5
5
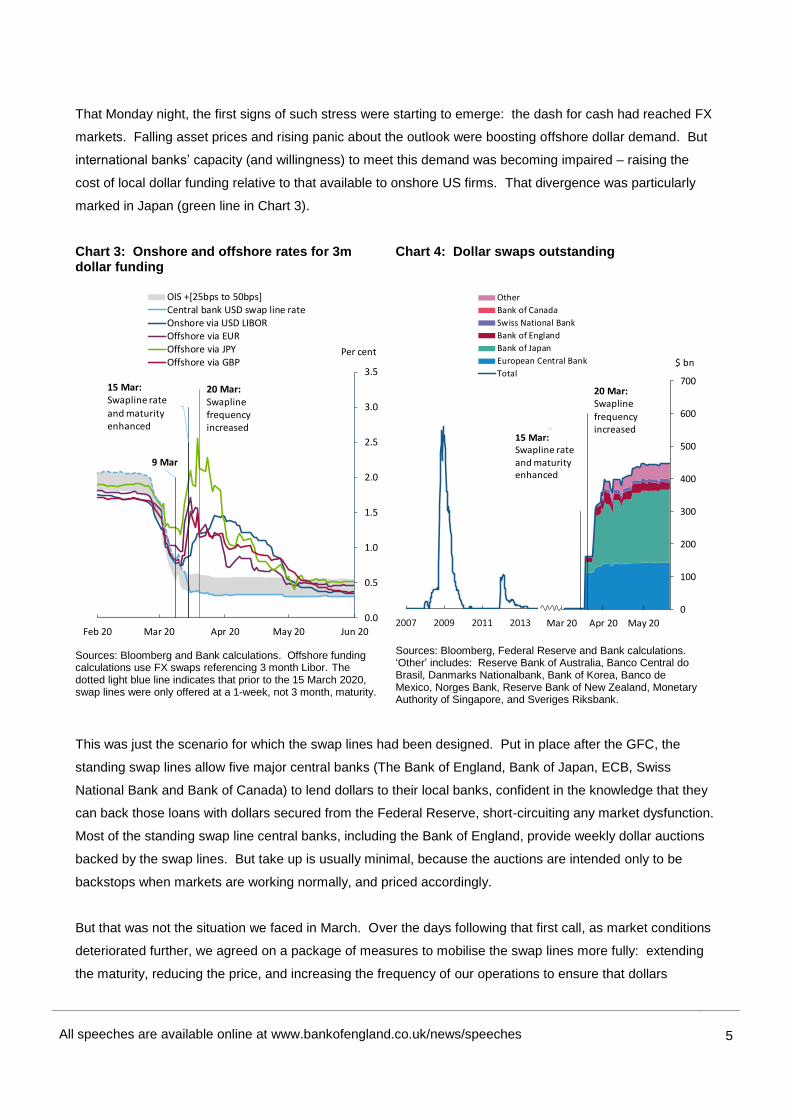
That Monday night, the first signs of such stress were starting to emerge: the dash for cash had reached FX
markets. Falling asset prices and rising panic about the outlook were boosting offshore dollar demand. But
international banks’ capacity (and willingness) to meet this demand was becoming impaired – raising the
cost of local dollar funding relative to that available to onshore US firms. That divergence was particularly
marked in Japan (green line in Chart 3).
Chart 3: Onshore and offshore rates for 3m dollar funding
Sources: Bloomberg and Bank calculations. Offshore funding calculations use FX swaps referencing 3 month Libor. The dotted light blue line indicates that prior to the 15 March 2020, swap lines were only offered at a 1-week, not 3 month, maturity.
Chart 4: Dollar swaps outstanding
Sources: Bloomberg, Federal Reserve and Bank calculations. ‘Other’ includes: Reserve Bank of Australia, Banco Central do Brasil, Danmarks Nationalbank, Bank of Korea, Banco de Mexico, Norges Bank, Reserve Bank of New Zealand, Monetary Authority of Singapore, and Sveriges Riksbank.
This was just the scenario for which the swap lines had been designed. Put in place after the GFC, the
standing swap lines allow five major central banks (The Bank of England, Bank of Japan, ECB, Swiss
National Bank and Bank of Canada) to lend dollars to their local banks, confident in the knowledge that they
can back those loans with dollars secured from the Federal Reserve, short-circuiting any market dysfunction.
Most of the standing swap line central banks, including the Bank of England, provide weekly dollar auctions
backed by the swap lines. But take up is usually minimal, because the auctions are intended only to be
backstops when markets are working normally, and priced accordingly.
But that was not the situation we faced in March. Over the days following that first call, as market conditions
deteriorated further, we agreed on a package of measures to mobilise the swap lines more fully: extending
the maturity, reducing the price, and increasing the frequency of our operations to ensure that dollars
15 Mar: Swapline rate and maturity enhanced
9 Mar
0.0
0.5
1.0
1.5
2.0
2.5
3.0
3.5
Feb 20 Mar 20 Apr 20 May 20 Jun 20
Per cent
OIS +[25bps to 50bps]Central bank USD swap line rateOnshore via USD LIBOROffshore via EUROffshore via JPYOffshore via GBP
20 Mar: Swaplinefrequency increased
20 Mar: Swaplinefrequency increased
0
100
200
300
400
500
600
700
Mar 20 Apr 20 May 20
$ bn
Other
Bank of Canada
Swiss National Bank
Bank of England
Bank of Japan
European Central Bank
Total
15 Mar: Swapline rate and maturity enhanced
20 Mar: Frequency increased
23 Mar: Federal Reserve announces further measures
0
100
200
300
400
500
600
700
Mar.20 Apr.20 May.20
USD bn
2007 2009 2011 2013

All speeches are available online at www.bankofengland.co.uk/news/speeches
6
6
continued to flow. The first part of this package was announced on Sunday 15 March, and further extended
on 20 March. The Federal Reserve also agreed temporary arrangements with a further nine central banks.
The expanded swap lines have since been used heavily, with the stock of dollar borrowing approaching
$½ trillion – by far the highest usage since the GFC (Chart 4). Pressures in sterling and euro FX swap
markets (measured by the gap between onshore and offshore dollar rates) fell back rapidly. Yen markets
took a little longer to normalise. But all of the major onshore and offshore dollar rates are now back within
tight ranges of one another (Chart 3).
Moment 3: dysfunction spreads to the gilt market
Would the dash for cash engulf the UK gilt market too? It seemed distinctly possible – the gilt functioning
indicators we monitor had started turning red2 as the week progressed, and by Friday 13th we were hearing
‘you’ll be next’ warnings from anxious funds. On the other hand, leveraged trading in gilts was less prevalent
than in USTs. And the Federal Reserve’s announcement on Sunday 15 March of an eye-popping $500bn
(later unlimited) asset purchase programme to support market functioning and meet the global need for cash
was seen as a game-changer by some.
Any misplaced optimism on that front would be short-lived. Gilt markets may have taken a little longer to
react – but they were not immune. As a new week began, selling pressure continued to drive yields up
sharply (Chart 5), and functioning worsened further (Chart 6). When the sterling exchange rate juddered
sharply lower on Wednesday 18 March, reaching levels against the dollar not seen since the mid-1980s and
triggering big new margin calls amidst speculation about a UK lockdown, any hope of relying on US actions
alone to stabilise global market functioning had gone.
As one of the safest sterling assets, gilts underpin every aspect of the UK economy; provide a benchmark for
other borrowing rates, and hence are vital to the transmission of monetary policy. With the economic outlook
worsening sharply, and gilt market conditions in freefall, the Monetary Policy Committee voted on 19 March –
less than 24 hours after the onset of critical market stress – to purchase an additional £200bn of gilts and
sterling corporate bonds ‘as soon as operationally possible’. This was by far the largest and fastest single
programme ever launched: equivalent to around a tenth of UK GDP, or 50% of the MPC’s existing holdings,
and more than twice as rapid as the opening salvo of purchases in 2009.
The impact was immediate, and decisive. Gilt yields fell back sharply as confidence returned, and market
functioning measures began to normalise (Charts 5-6). Purchase operations have since taken place
smoothly, with good participation and tight pricing.
2 ‘Red’ in this context meaning the 95th percentile of levels seen since the GFC.

All speeches are available online at www.bankofengland.co.uk/news/speeches
7
7
Chart 5: Gilt yields
Sources: Bloomberg Finance L.P., TradeWeb and Bank calculations
Chart 6: Bid/offer spreads on gilts
Source: Eikon by Refinitiv
Moment 4: congestion in sterling money markets
When our sterling desk received a call from a large asset manager to let us know that – highly unusually – it
had been unable to liquidate its holdings of bank certificates of deposit (CDs) to meet a margin call, we knew
the dash for cash had reached the sterling money markets.
The coming days brought stories of companies and local authorities also seeking liquidity – whether through
greater borrowing3, selling assets, or drawing down their holdings in sterling money market funds (MMFs).
MMFs play an important part in the story, because they act as a bridge between depositors’ desire for
immediate liquidity and banks’ desire for term wholesale funding: providing the former with on-demand cash,
while holding a significant share of their assets in banks’ term liabilities, including commercial paper (CP) and
CDs. In total, sterling MMFs saw outflows of some £25bn, or 10% of their total assets, in the eight days
between 12 and 20 March (Chart 7). At first, they met these outflows by running down cash holdings. But as
the outflows intensified, the MMFs tried to liquidate some of their CDs and CP, only to find, just as we’d
heard, that the market was effectively closed. As MMF liquid asset ratios fell towards regulatory thresholds,
we faced the prospect of one or more MMFs deciding to ‘gate’ access to investors, cutting off their access to
liquidity in the fund – something that some feared could trigger further contagion.
3 The drawdown by Boeing of a $13.8bn syndicated loan facility on Wednesday 11 March was a particularly widely-cited example in global markets.
-0.2
0
0.2
0.4
0.6
0.8
1
1.2
1.4
1.6
Jan 20 Feb 20 Mar 20 Apr 20 May 20 Jun 20
Per cent5 year 10 year 30 year
19 Mar: Further BoE package (Bank rate cut 15bps and additional £200bn asset purchases)
19 Mar: Further BoE package
0
0.4
0.8
1.2
1.6
2
2.4
2.8
3.2
3.6
4
Jan 20 Feb 20 Mar 20 Apr 20 May 20 Jun 20
Basis points5 year 10 year 30 year

All speeches are available online at www.bankofengland.co.uk/news/speeches
8
8
As demand for cash grew, but supply failed to respond, sterling money market rates rose sharply (Chart 8).
Though sharpest at longer tenors, we also saw a pickup in overnight repo rates: a particularly serious sign of
dysfunction, and a challenge to our commitment to keep such rates broadly aligned to Bank Rate.
Chart 7: MMF outflows and assets
Sources: Crane Data LLC and Bank calculations
Chart 8: Sterling money market spreads
Source: Bank of England Sterling Money Market data collection and Bank calculations. Overnight rate for cleared Delivery by Value transactions; 3-month repo rate uses only transactions estimated to be non-nettable under leverage ratio rules. Both rates volume-weighted and stated from perspective of dealers.
Two key sets of policy actions helped to ease pressure on money market rates. First, the MPC’s decision on
19 March to buy gilts in large size – coupled with similar policy actions by other central banks – helped
stabilise broader markets, reducing the incidence of margin calls, and triggering renewed inflows into MMFs
and the money markets more generally. And, second, the Bank activated its Contingent Term Repo Facility
(CTRF) on 24 March, committing to lend unlimited amounts of sterling at close to Bank Rate, against a broad
range of collateral. These operations, together with the passing of the March quarter end, brought repo rates
back to more normal levels (Chart 8).
By contrast, term LIBOR measures took much longer to subside, in both dollar and sterling markets (Charts
3 and 8). In part that reflected the persistent illiquidity in the market for CP, CD and other unsecured bank
paper. But that same illiquidity, coupled with the sharp reduction in the size of the market since the GFC,
also meant that, throughout the crisis, LIBOR was based on few if any direct underlying transactions (Chart
9).4 That is a wholly unsatisfactory basis for a benchmark that still underpins a substantial share of global
4 Libor submissions are classified in three levels. Level 1 is ‘transaction-based’ submissions — an average of transactions in unsecured deposits and primary issuances of commercial paper and certificates of deposit. Level 2 is ‘transaction-derived’ data, including information from historical transactions. Level 3 is ‘expert judgement’ — where a panel bank has insufficient Level 1 or 2 transactions, it estimates the rate at which it could fund itself in the unsecured wholesale funding market, based on an approved procedure. Further details are available at: www.theice.com/publicdocs/ICE_LIBOR_Methodology.pdf
210
220
230
240
250
260
270
Mar 20 Apr 20 May 20
-3
-2
-1
0
1
2
3
4
Daily flow (RHS)Assets under management (LHS)
Per cent£ bn‘Dash for cash’
24 Mar: CTRF announced
19 Mar:Further BoE
package
24 Mar: CTRF announced
31 Mar: Quarter-end
-20
0
20
40
60
80
100
Jan 20 Feb 20 Mar 20 Apr 20 May 20
Basis points
Overnight reverse repo - Bank rate spread
3-month reverse repo-OIS spread
3-month £LIBOR-OIS spread
All speeches are available online at www.bankofengland.co.uk/news/speeches
9
9
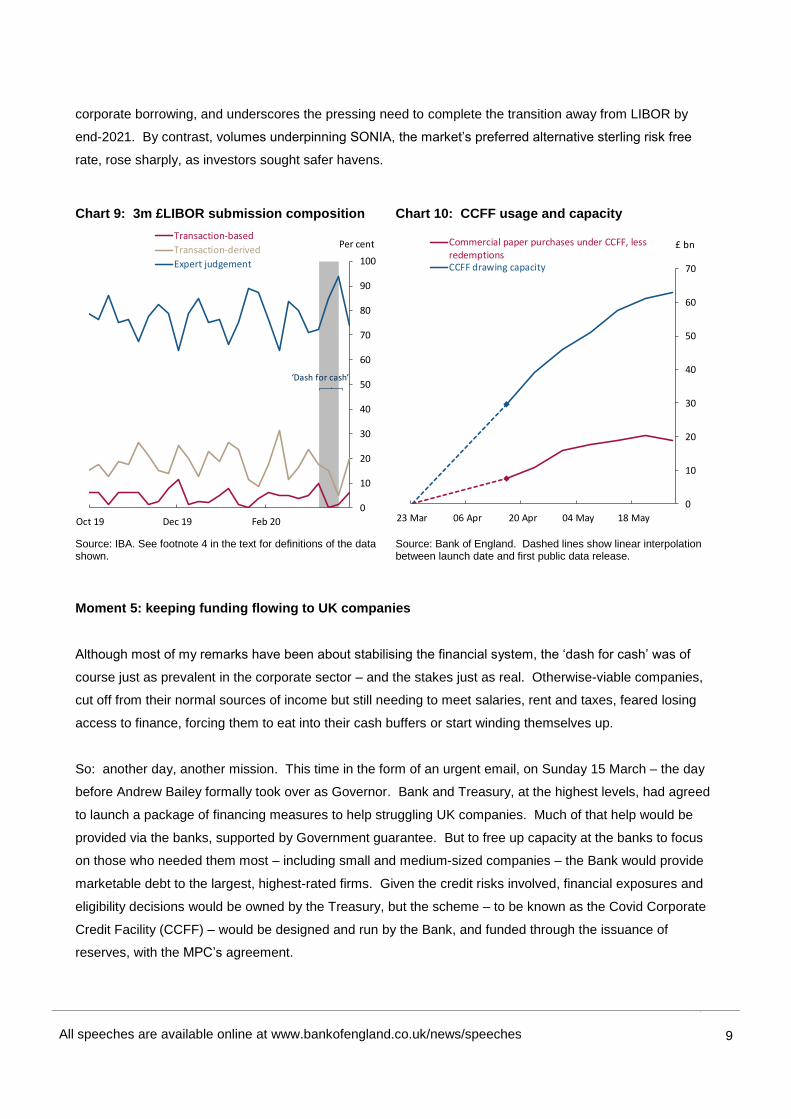
corporate borrowing, and underscores the pressing need to complete the transition away from LIBOR by
end-2021. By contrast, volumes underpinning SONIA, the market’s preferred alternative sterling risk free
rate, rose sharply, as investors sought safer havens.
Chart 9: 3m £LIBOR submission composition
Source: IBA. See footnote 4 in the text for definitions of the data shown.
Chart 10: CCFF usage and capacity
Source: Bank of England. Dashed lines show linear interpolation between launch date and first public data release.
Moment 5: keeping funding flowing to UK companies
Although most of my remarks have been about stabilising the financial system, the ‘dash for cash’ was of
course just as prevalent in the corporate sector – and the stakes just as real. Otherwise-viable companies,
cut off from their normal sources of income but still needing to meet salaries, rent and taxes, feared losing
access to finance, forcing them to eat into their cash buffers or start winding themselves up.
So: another day, another mission. This time in the form of an urgent email, on Sunday 15 March – the day
before Andrew Bailey formally took over as Governor. Bank and Treasury, at the highest levels, had agreed
to launch a package of financing measures to help struggling UK companies. Much of that help would be
provided via the banks, supported by Government guarantee. But to free up capacity at the banks to focus
on those who needed them most – including small and medium-sized companies – the Bank would provide
marketable debt to the largest, highest-rated firms. Given the credit risks involved, financial exposures and
eligibility decisions would be owned by the Treasury, but the scheme – to be known as the Covid Corporate
Credit Facility (CCFF) – would be designed and run by the Bank, and funded through the issuance of
reserves, with the MPC’s agreement.
0
10
20
30
40
50
60
70
80
90
100
Oct 19 Dec 19 Feb 20
Per centTransaction-based
Transaction-derived
Expert judgement
‘Dash for cash’
0
10
20
30
40
50
60
70
23 Mar 06 Apr 20 Apr 04 May 18 May
£ bnCommercial paper purchases under CCFF, lessredemptionsCCFF drawing capacity

All speeches are available online at www.bankofengland.co.uk/news/speeches
10
10
Time was of the essence. The package of measures was announced by the Chancellor 48 hours later, on
Tuesday 17 March. And a mere six days after that, on Monday 23 March, the CCFF was open for business:
allowing investment grade firms to issue Commercial Paper (CP), via an agent bank, to the Bank at pre-
Covid rates. No public sector scheme can ever reach every firm in need. But the numbers are substantial.
Firms eligible for the scheme account for over a quarter of UK corporate turnover and nearly a fifth of UK
employment. So far, over 140 firms have signed up for the scheme, and have borrowed over £20bn in total,
some of which has already matured. Firms’ borrowing capacity in the scheme is more than three times that
level (Chart 10), helping to underpin confidence – and complementing the Government-run schemes,
including the Coronavirus Business Interruption and Bounce Back Loan (BBL) Schemes, which together
have lent a further £31bn.
Central bank facilities are generally designed to support, rather than replace, market mechanisms – and here
too the CCFF has brought benefits. First, CP issuance under the scheme has been at least three times
larger than the size of the pre-Covid-19 sterling CP market – and nearly three quarters of CCFF firms have
set up a CP programme since applying. So the CCFF has helped to deepen the CP market, with potentially
lasting benefits. And, second, the normalisation of conditions in core markets, coupled with the restart of the
MPC’s sterling corporate bond purchases on 7 April and similar schemes operated by the ECB and Federal
Reserve, has allowed many larger firms to return to private debt markets, reducing the need of some to draw
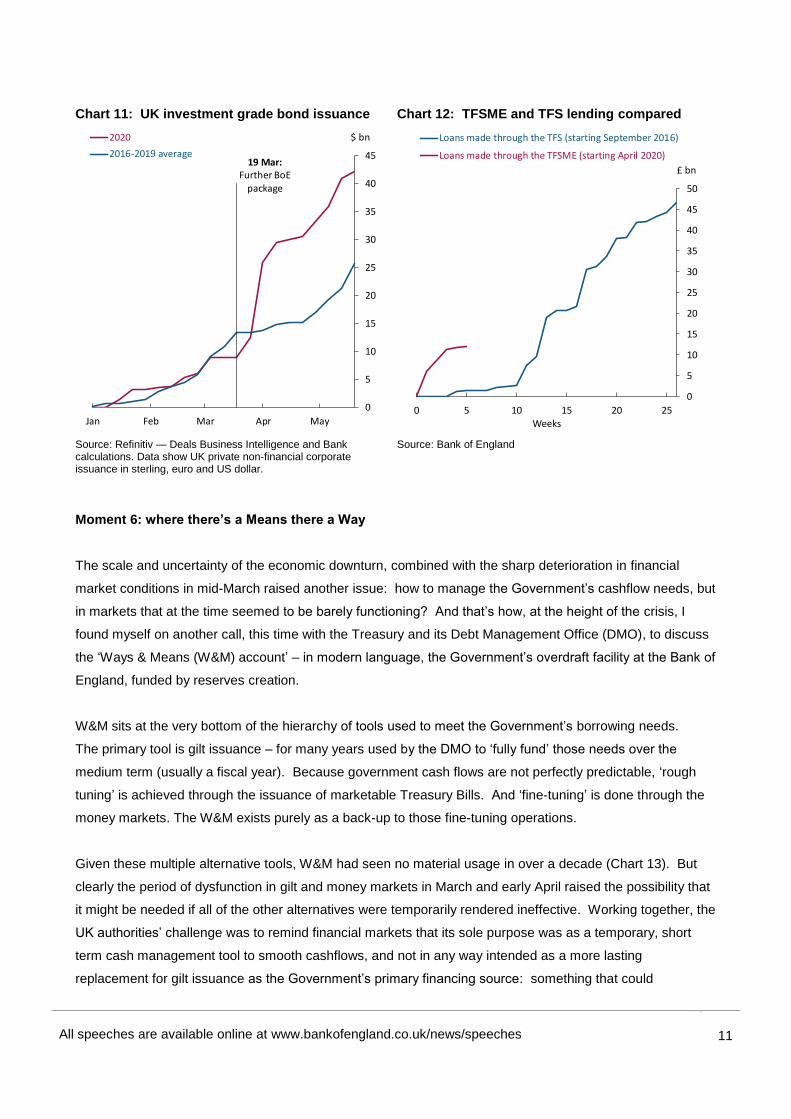
on schemes like the CCFF. Indeed, UK firms’ debt issuance has been running materially ahead of the
average in previous years (Chart 11).
In addition to the CCFF, the Bank also opened the borrowing window for the new Term Funding Scheme
with additional incentives for Small and Medium Sized Enterprises (TFSME) on 15 April. The TFSME is
designed to help bridge the supply of credit to UK firms through the Covid-19 disruption and reinforce the
transmission of the MPC’s reductions in Bank Rate. It does this by providing banks with cheap funding over
a four-year term (rising to six years for loans guaranteed under the BBL scheme). There has already been
£12bn of lending from the scheme – a far more rapid pace than the previous TFS (Chart 12).
All speeches are available online at www.bankofengland.co.uk/news/speeches
11
11
Chart 11: UK investment grade bond issuance
Source: Refinitiv — Deals Business Intelligence and Bank calculations. Data show UK private non-financial corporate issuance in sterling, euro and US dollar.
Chart 12: TFSME and TFS lending compared
Source: Bank of England
Moment 6: where there’s a Means there a Way
The scale and uncertainty of the economic downturn, combined with the sharp deterioration in financial
market conditions in mid-March raised another issue: how to manage the Government’s cashflow needs, but
in markets that at the time seemed to be barely functioning? And that’s how, at the height of the crisis, I
found myself on another call, this time with the Treasury and its Debt Management Office (DMO), to discuss
the ‘Ways & Means (W&M) account’ – in modern language, the Government’s overdraft facility at the Bank of
England, funded by reserves creation.
W&M sits at the very bottom of the hierarchy of tools used to meet the Government’s borrowing needs.
The primary tool is gilt issuance – for many years used by the DMO to ‘fully fund’ those needs over the
medium term (usually a fiscal year). Because government cash flows are not perfectly predictable, ‘rough
tuning’ is achieved through the issuance of marketable Treasury Bills. And ‘fine-tuning’ is done through the
money markets. The W&M exists purely as a back-up to those fine-tuning operations.
Given these multiple alternative tools, W&M had seen no material usage in over a decade (Chart 13). But
clearly the period of dysfunction in gilt and money markets in March and early April raised the possibility that
it might be needed if all of the other alternatives were temporarily rendered ineffective. Working together, the
UK authorities’ challenge was to remind financial markets that its sole purpose was as a temporary, short
term cash management tool to smooth cashflows, and not in any way intended as a more lasting
replacement for gilt issuance as the Government’s primary financing source: something that could
19 Mar: Further BoE
package
0
5
10
15
20
25
30
35
40
45
Jan Feb Mar Apr May
$ bn2020
2016-2019 average
0
5
10
15
20
25
30
35
40
45
50
0 5 10 15 20 25
£ bn
Weeks
Loans made through the TFS (starting September 2016)
Loans made through the TFSME (starting April 2020)

All speeches are available online at www.bankofengland.co.uk/news/speeches
12
12
complicate the execution of monetary policy. Those principles were embodied in a public announcement
released on 9 April.
In the event, the rapid normalisation of market conditions allowed the Government to announce, and so far
meet, sharply higher near-term gilt issuance plans (Chart 14) without any need for recourse to the
Ways & Means account. The account remains available for use, if unexpected future cash needs cannot be
met by any other market-based means, e.g. because of a renewed period of dysfunction. But in such
circumstances, the usage would be short term; and, as soon as possible before the end of the year, the
DMO would scale up its market operations to repay the W&M balance.
Chart 13: Usage of the Ways & Means account
Source: Bank of England. Available here
Chart 14: DMO funding plans compared
Source: DMO and Bank Calculations. Past values adjusted for inflation (April 2020 equivalents).
Moment 7: central banking on the home front
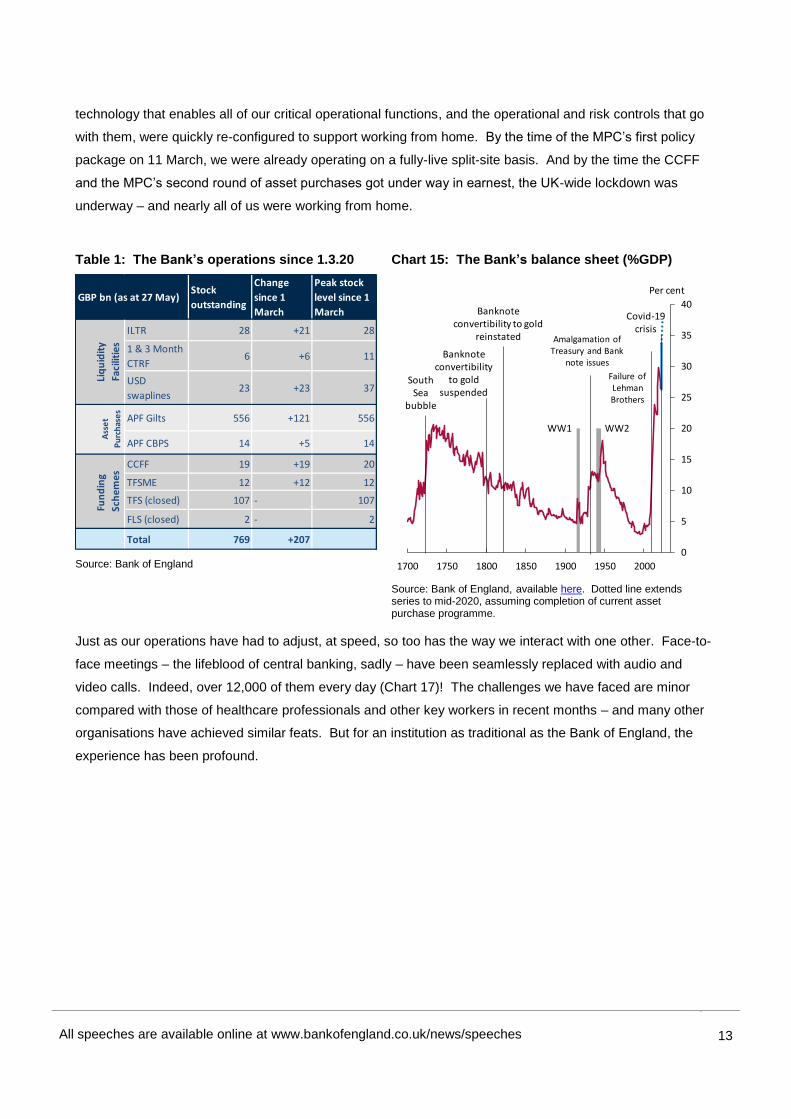
Table 1 and Chart 15 summarise the scale of the Bank’s recent balance sheet operations: a balance sheet
that has expanded by almost a third in three months, and will reach nearly 40% of annual UK GDP by
mid-year. To deliver that, we are doing more than ten times the number of weekly operations than in the
pre-Covid19 period (Chart 16).
This is eye-popping by itself. But, more extraordinary still, virtually all of it has been done remotely –
hundreds of billions of pounds worth of operations delivered from peoples’ bedrooms, attics and kitchens,
whilst isolated on their own, or caring for children and other relatives. The Bank has long embraced home
working as part of its flexible working arrangements – but the sheer scale of what has been done – what we
have had to do – would frankly never have been contemplated by choice. Preparation began early – and the
0
5
10
15
20
25
2006 2008 2010 2012 2014 2016 2018 2020
£ bn
0
50
100
150
200
250
300
350
Jan Feb Mar Apr May Jun Jul Aug Sep Oct Nov Dec
£ bn
20092016-2019 average20202020 (DMO announced)
All speeches are available online at www.bankofengland.co.uk/news/speeches
13
13
technology that enables all of our critical operational functions, and the operational and risk controls that go
with them, were quickly re-configured to support working from home. By the time of the MPC’s first policy
package on 11 March, we were already operating on a fully-live split-site basis. And by the time the CCFF
and the MPC’s second round of asset purchases got under way in earnest, the UK-wide lockdown was
underway – and nearly all of us were working from home.
Table 1: The Bank’s operations since 1.3.20
Source: Bank of England
Chart 15: The Bank’s balance sheet (%GDP)
Source: Bank of England, available here. Dotted line extends series to mid-2020, assuming completion of current asset purchase programme.
Just as our operations have had to adjust, at speed, so too has the way we interact with one other. Face-to-
face meetings – the lifeblood of central banking, sadly – have been seamlessly replaced with audio and
video calls. Indeed, over 12,000 of them every day (Chart 17)! The challenges we have faced are minor
compared with those of healthcare professionals and other key workers in recent months – and many other
organisations have achieved similar feats. But for an institution as traditional as the Bank of England, the
experience has been profound.
Stock
outstanding
Change
since 1
March
Peak stock
level since 1
March
ILTR 28 +21 28
1 & 3 Month
CTRF6 +6 11
USD
swaplines23 +23 37
APF Gilts 556 +121 556
APF CBPS 14 +5 14
CCFF 19 +19 20
TFSME 12 +12 12
TFS (closed) 107 - 107
FLS (closed) 2 - 2
Total 769 +207
Ass
et
Pu
rch
ase
s
Fun
din
g
Sch
emes
GBP bn (as at 27 May)
Liq
uid
ity
Faci
litie
s
0
5
10
15
20
25
30
35
40
1700 1750 1800 1850 1900 1950 2000
Per cent
South Sea
bubble
WW1 WW2
Amalgamation of Treasury and Bank
note issues
Failure of Lehman Brothers
Banknote convertibility
to gold suspended
Banknote convertibility to gold
reinstated
Covid-19 crisis

All speeches are available online at www.bankofengland.co.uk/news/speeches
14
14
Chart 16: no. of market operations per week
Source: Bank of England
Chart 17: The impact of remote working
Source: Bank of England
What have we learned? Some (very) tentative lessons
The Covid-19 crisis is very far from over. The medical and economic challenges we face are huge and
potentially persistent – and many are not for central banks to resolve. Against that backdrop, I have covered
only one aspect of our actions during the crisis: the steps we took to prevent the initial shock, and the
uncertainty that came with it, from threatening monetary and financial stability.
Let’s take the good news first. The central banking response was bigger, faster, and more comprehensively
co-ordinated with domestic and international partners than ever before. We deployed the tools developed
since the GFC – extending the dollar swap lines, the CTRF, the TFSME and asset purchases. And the
banking system, with much stronger capital and liquidity reserves, continued to lend – supported by new
schemes such as the CCFF, built from scratch in record time. In designing our interventions, we have been
careful to demarcate clearly between our respective institutional responsibilities: the MPC took the decisions
on asset purchases; the Treasury bore the financial risk on lending to corporates; and we reminded financial
markets that any usage of the Ways & Means account would be temporary and short term. In light of those
actions, and similar steps by other central banks globally, core markets are today stable and well-functioning.
That is no small achievement.
But it is far too soon to take a lap of honour, even on the narrow stage I have occupied today. Financial
markets could come under strain again, if there is another leg to the global infection cycle, or if economic
data come out persistently worse than expected. And even if – as hoped – we escape that, the sheer scale
of our interventions means we must, in time, ask ourselves hard questions about the financial markets we
0
10
20
30
40
28 Feb 13 Mar 27 Mar 10 Apr 24 Apr 08 May 22 May
No. of ops per week
Contingent Term Repo Facility (CTRF)
Indexed Long-Term Repo (ILTR)
Term Funding Scheme with additional incentives for SMEs (TFSME)
Asset Purchase Facility - Corporate Bonds & Gilts
Covid Corporate Financing Facility (CCFF)
US dollar swaplines
0
500
1000
1500
2000
2500
3000
0
2000
4000
6000
8000
10000
12000
14000
Mar.20 Apr.20 May.20
Attendance Calls per day
Audio/video calls bank wide (RHS)
Attendance in Threadneedle Street office (LHS)
11 Mar: Bank rate cut
19 Mar: Bank rate cut
23 Mar: Lockdown begins

All speeches are available online at www.bankofengland.co.uk/news/speeches
15
15
rely upon, and their potential to amplify the sort of ‘dash for cash’ we saw in March and April. Based on what
I’ve said today, let me identify four such questions:
- First, do we understand why intermediaries struggled to make effective markets in core government bond, money and foreign exchange instruments at crucial moments during the crisis? Was it simply the sheer scale of the shock, combined with the operational challenges of remote working? Or did regulatory constraints also play a role? If there are circumstances where our traditional counterparties aren’t able to intermediate, do we need to fix that at source? Or do central banks need to change the design of their balance sheet facilities more profoundly to fill that gap?
- Second, are we comfortable with the central role played by highly-leveraged but thinly-capitalised non-banks in arbitraging between key financial markets, if the unwinding of those trades can amplify instability so starkly?
- Third, how do we deal with the risks posed to financial stability by the structural tendency for Money Market and some other open-ended funds to be prone to runs, without having to commit scarce public money to costly support facilities?
- And, fourth, how can we ensure timely transition away from LIBOR, whose weaknesses were highlighted so starkly by the crisis?
The Bank’s Financial Policy Committee will be reflecting on these and other issues in the months ahead.
Closer to home, there are lessons too for us in some of the ways of working that we’ve been forced to
explore whilst in lockdown. Some roles have undoubtedly been made harder: for example those involving
the control of operational risk. But it has also forced us to exploit the benefits of technology in ways that
many of us would never have dared do voluntarily. It has embedded flexible working in a far deeper way
than before. It has brought a new understanding and respect for the challenges many staff have to deal
with. It has given us back the many hours spent in mindless or stressful commuting. And, perhaps most
profoundly of all, it has been a great leveller. Meetings conducted by video- or audio-conference have been
more orderly – even if they are also more likely to be interrupted by over-exuberant children or misfiring wifi!
Ideas and contributions matter more than who is making them, or how they are made. And we’ve become
more inclusive, allowing us to share material in real time, bringing each other in and virtually raising our
hands to talk. I am not sure that many people would have predicted that a global pandemic might end up
being the thing that finally really moves the dial on diversity and inclusion.
What I can say with some confidence is that it has been a privilege to lead the Bank’s markets function
during this extraordinary period, and I look forward to discussing some of the themes I have outlined here
with you further now.