Embed Size (px)
Citation preview

Seven Steps for Doing 2
• 1) State the hypothesis
• 2) Create data table
• 3) Find 2 critical
• 4) Calculate the expected frequencies
• 5) Calculate 2
• 6) Decision
• 7) Put answer into words
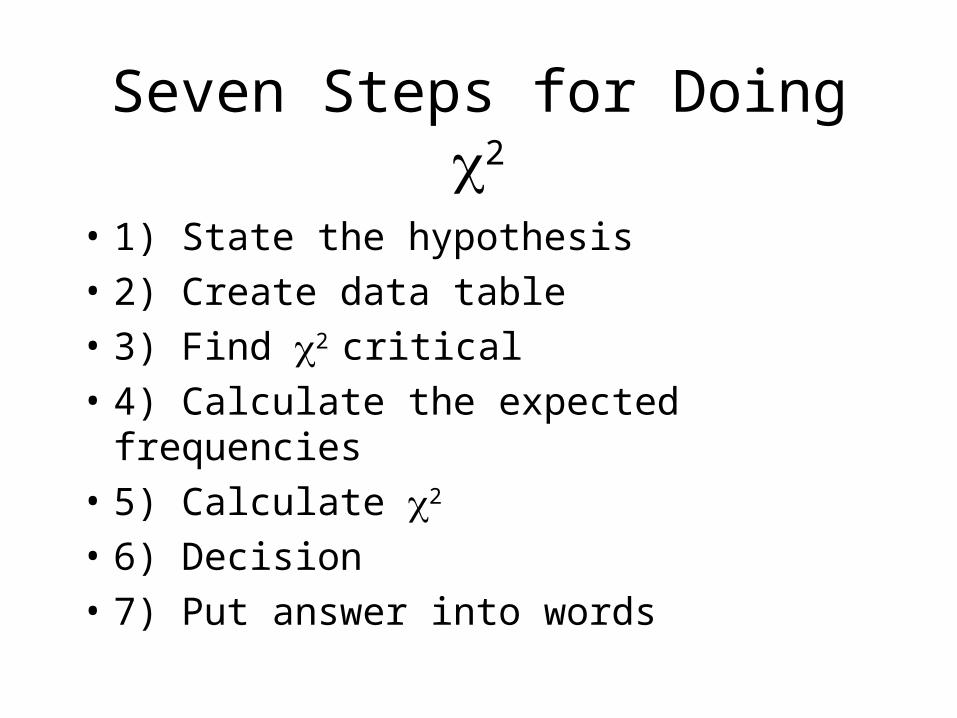
Example
• With whom do you find it easiest to make friends?
• Subjects were either male and female.
• Possible responses were: “opposite sex”, “same sex”, or “no difference”
• Is there a significant (.05) relationship between the gender of the subject and their response?
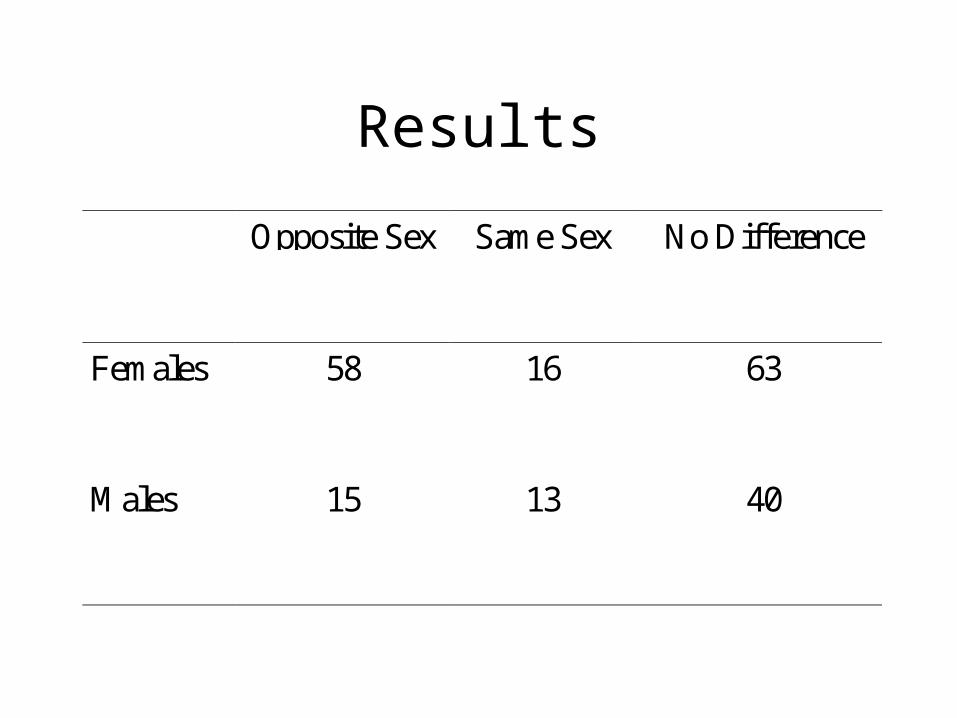
Results
Opposite Sex Same Sex No Difference
Females 58 16 63
Males 15 13 40
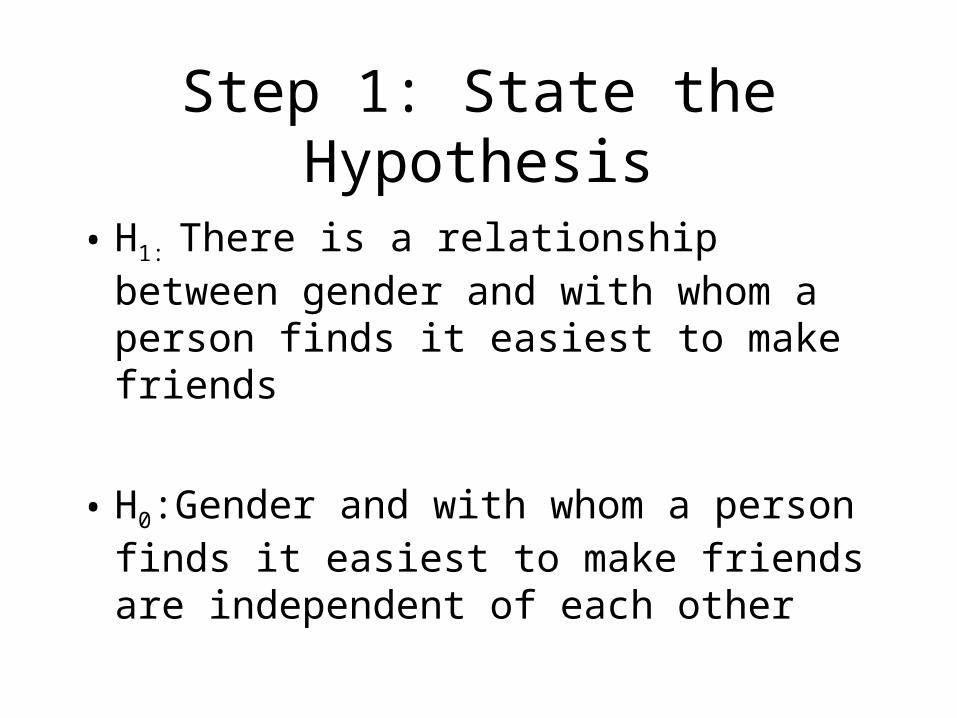
Step 1: State the Hypothesis
• H1: There is a relationship between gender and with whom a person finds it easiest to make friends
• H0:Gender and with whom a person finds it easiest to make friends are independent of each other
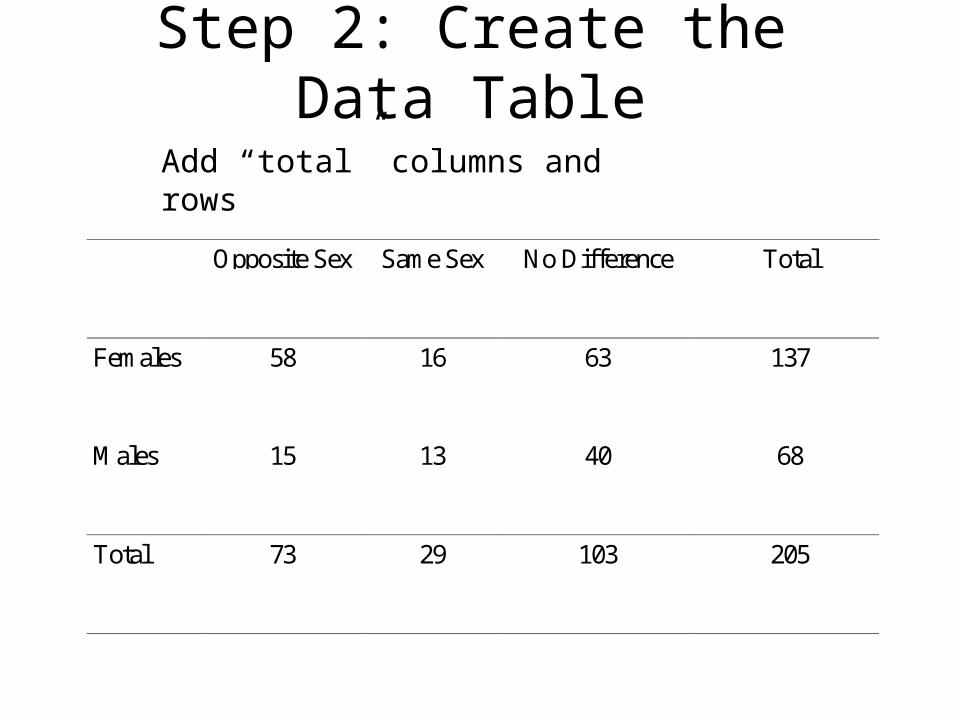
Step 2: Create the Data Table
Opposite Sex Same Sex No Difference Total
Females 58 16 63 137
Males 15 13 40 68
Total 73 29 103 205
Add “total” columns and rows
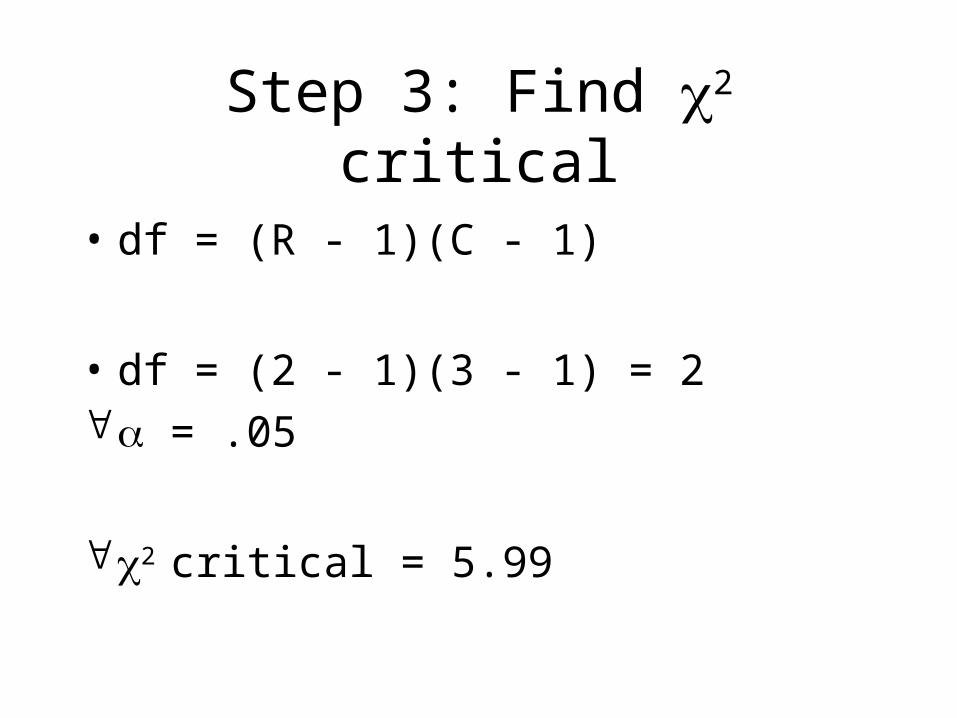
Step 3: Find 2 critical
• df = (R - 1)(C - 1)
• df = (2 - 1)(3 - 1) = 2 = .05
2 critical = 5.99
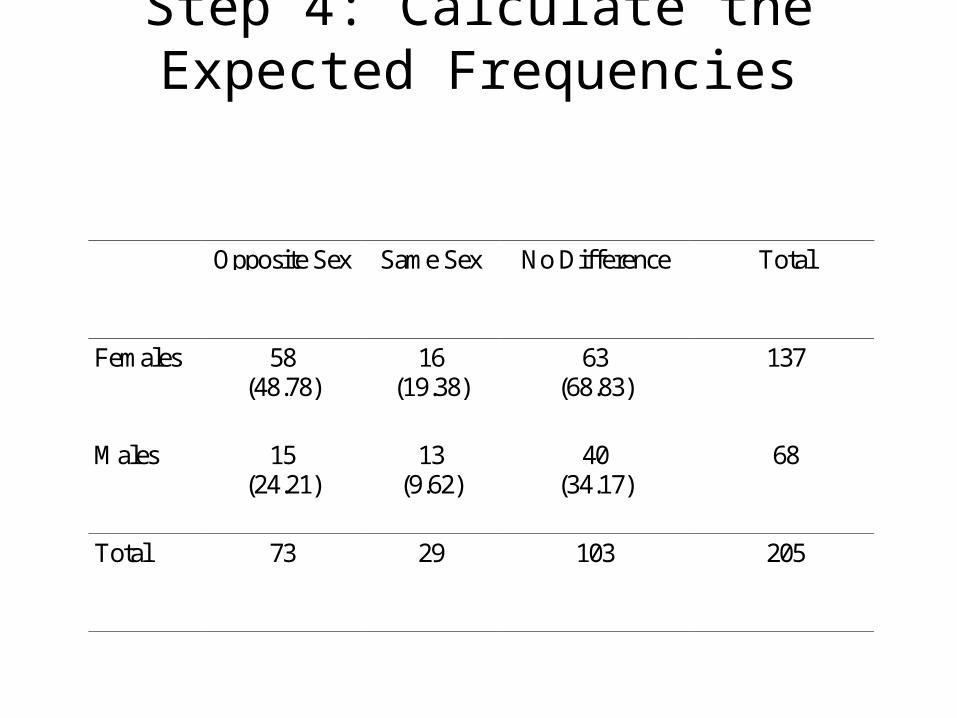
Step 4: Calculate the Expected Frequencies
Opposite Sex Same Sex No Difference Total
Females 58(48.78)
16(19.38)
63(68.83)
137
Males 15(24.21)
13(9.62)
40(34.17)
68
Total 73 29 103 205
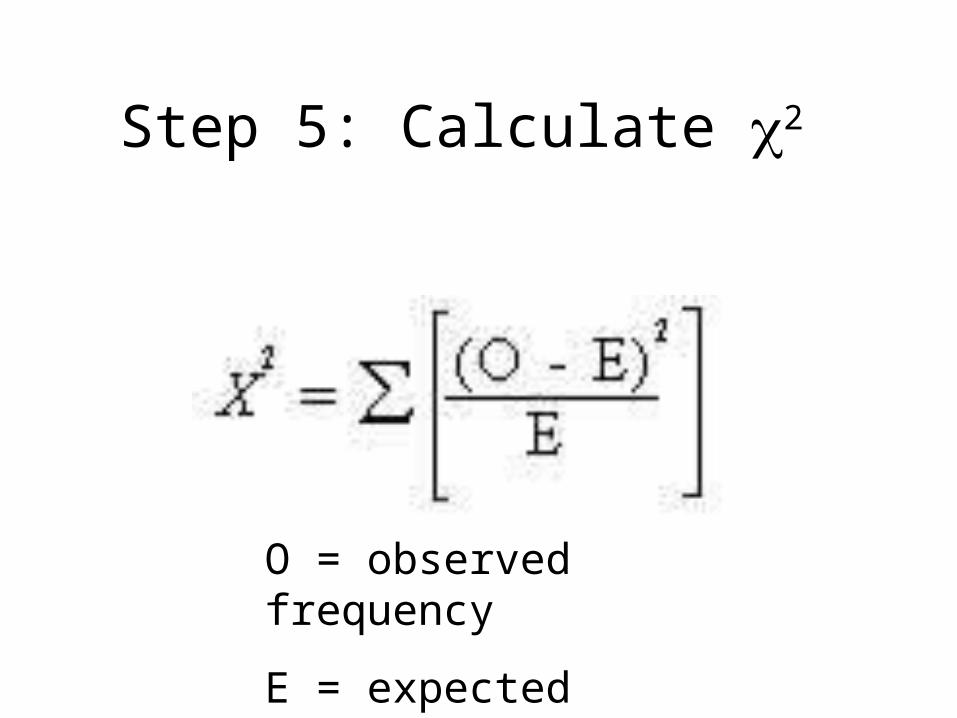
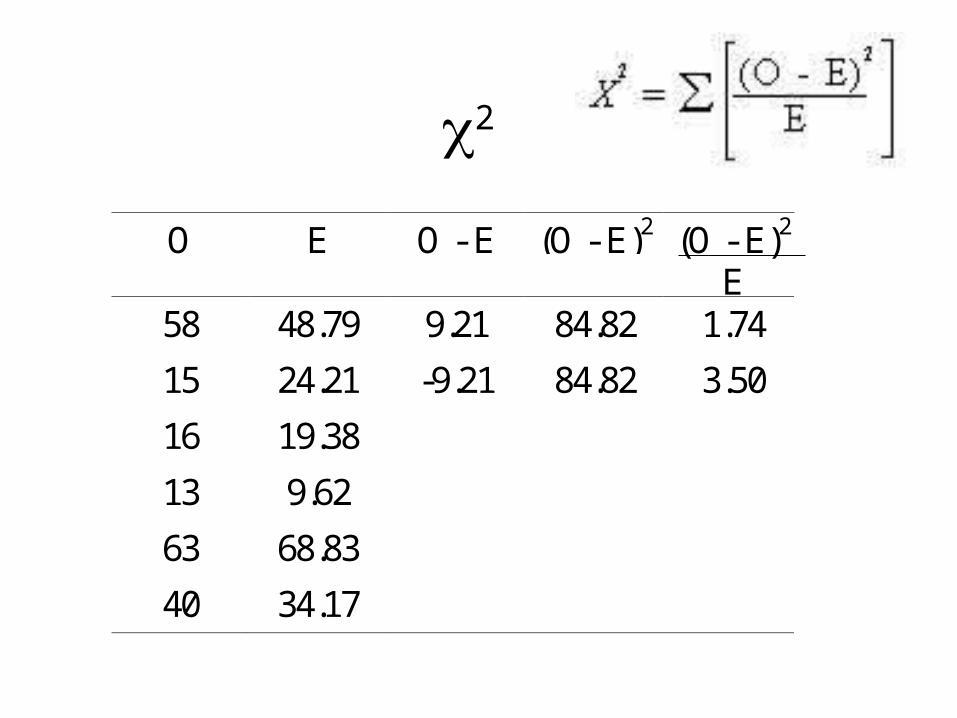
Step 5: Calculate 2
O = observed frequency
E = expected frequency
2
O E O - E (O - E)2 (O - E)2
E58 48.79
15 24.21
16 19.38
13 9.62
63 68.83
40 34.17
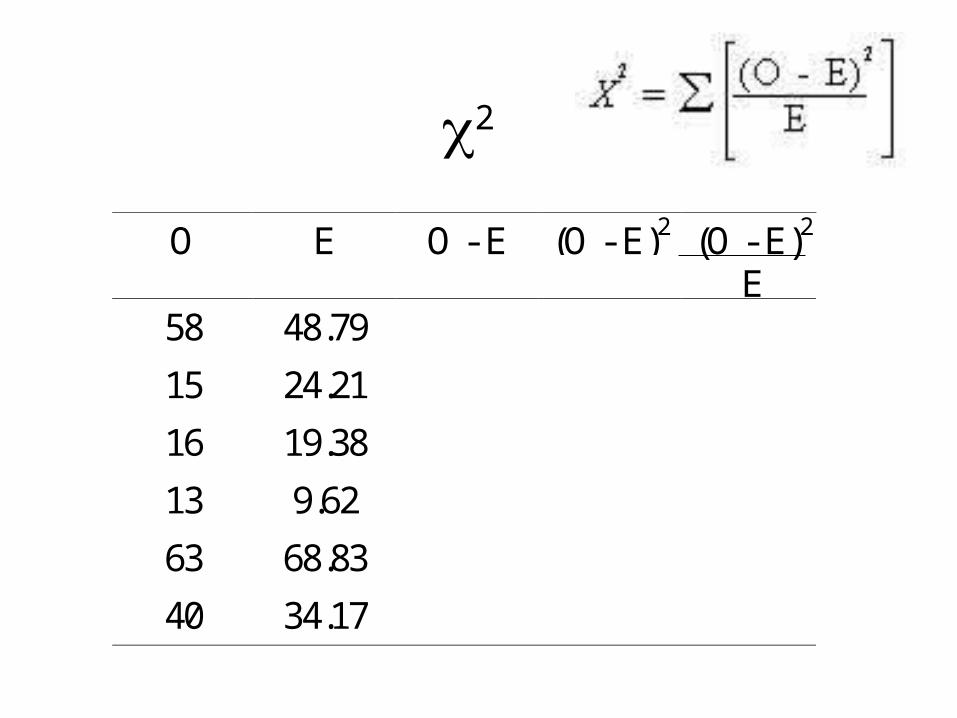
2
O E O - E (O - E)2 (O - E)2
E58 48.79 9.21 84.82 1.74
15 24.21
16 19.38
13 9.62
63 68.83
40 34.17
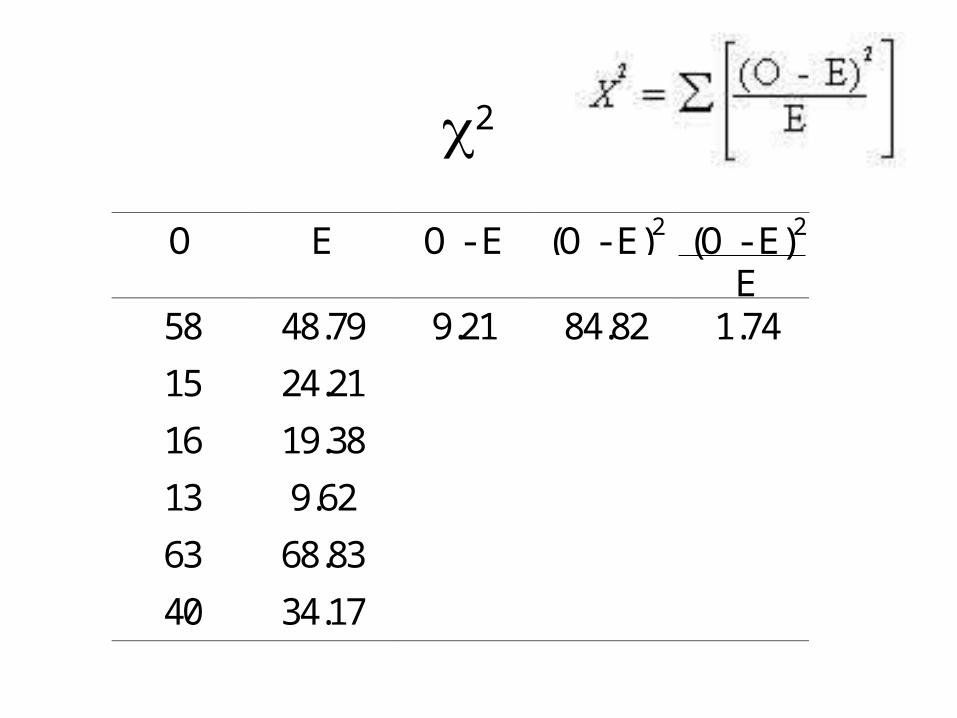
2
O E O - E (O - E)2 (O - E)2
E58 48.79 9.21 84.82 1.74
15 24.21 -9.21 84.82 3.50
16 19.38
13 9.62
63 68.83
40 34.17
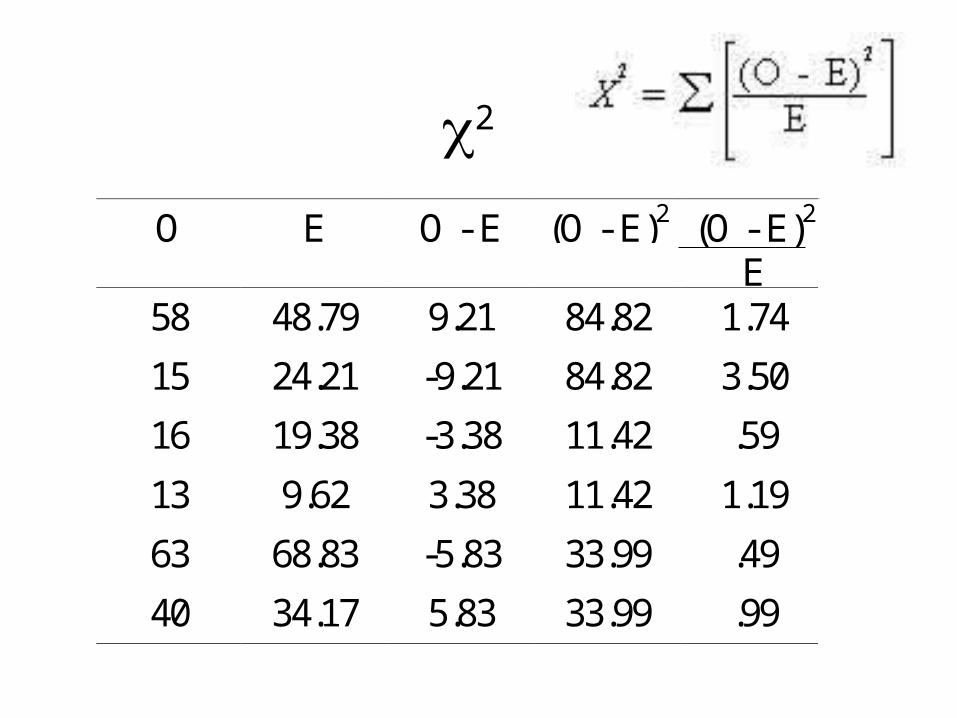
2
O E O - E (O - E)2 (O - E)2
E58 48.79 9.21 84.82 1.74
15 24.21 -9.21 84.82 3.50
16 19.38 -3.38 11.42 .59
13 9.62 3.38 11.42 1.19
63 68.83 -5.83 33.99 .49
40 34.17 5.83 33.99 .99
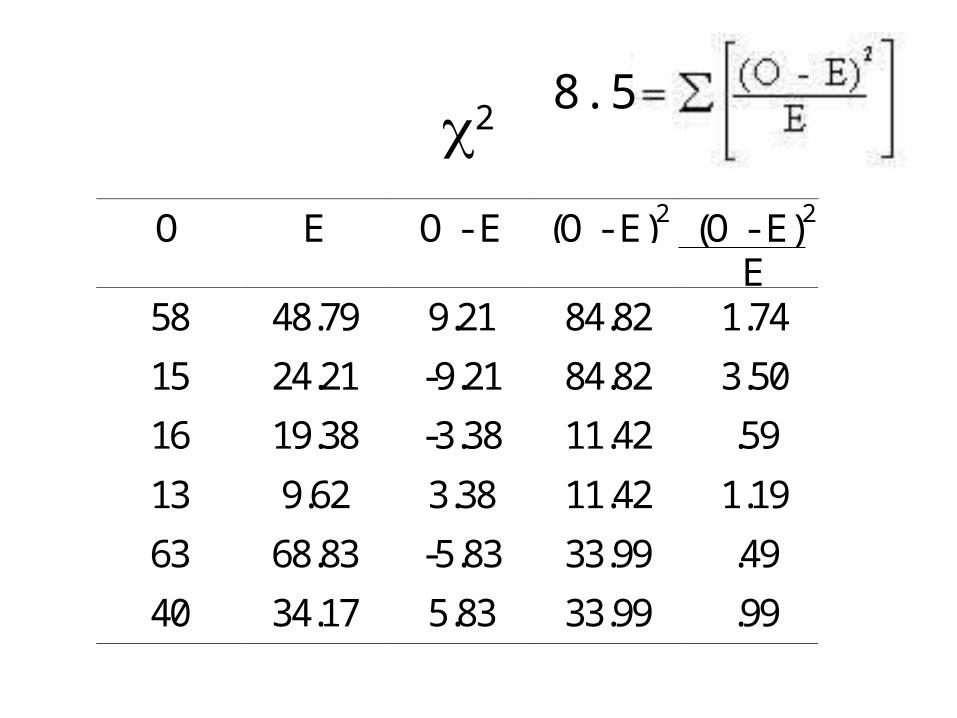
2
O E O - E (O - E)2 (O - E)2
E58 48.79 9.21 84.82 1.74
15 24.21 -9.21 84.82 3.50
16 19.38 -3.38 11.42 .59
13 9.62 3.38 11.42 1.19
63 68.83 -5.83 33.99 .49
40 34.17 5.83 33.99 .99
8.5

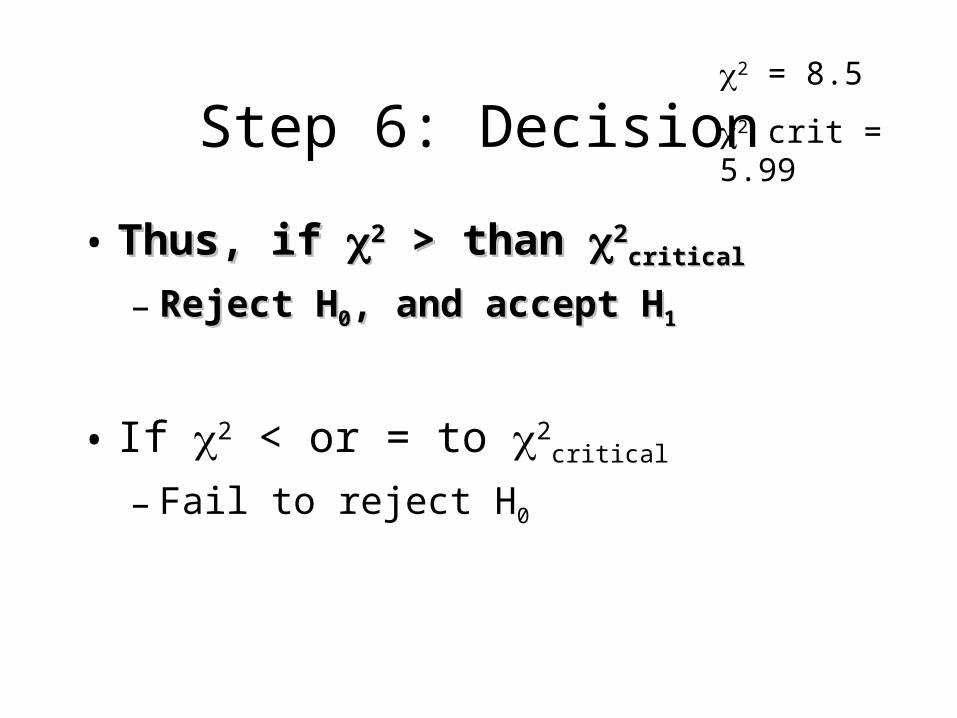
Step 6: Decision
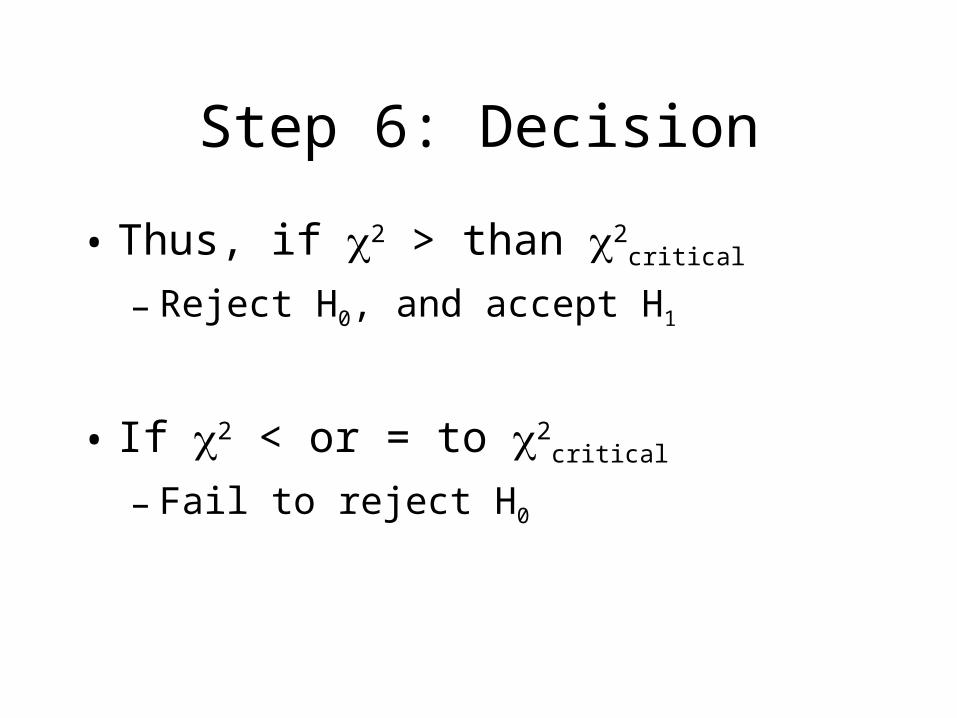
• Thus, if 2 > than 2critical
– Reject H0, and accept H1
• If 2 < or = to 2critical
– Fail to reject H0
Step 6: Decision
• Thus, if Thus, if 22 > than > than 22criticalcritical
– Reject HReject H00, and accept H, and accept H11
• If 2 < or = to 2critical
– Fail to reject H0
2 = 8.5
2 crit = 5.99
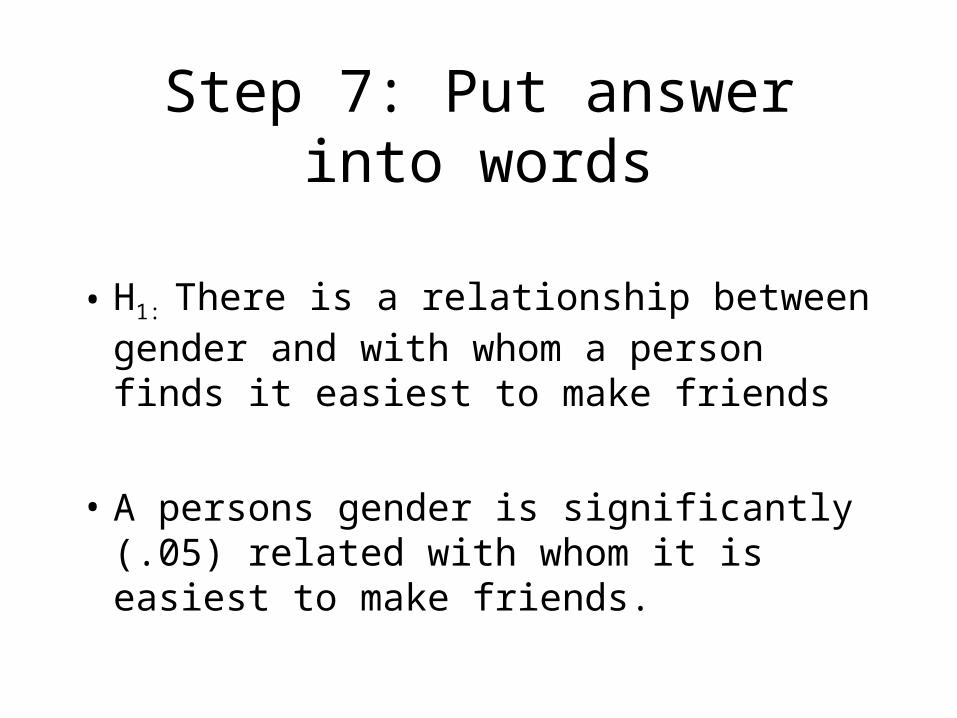
Step 7: Put answer into words
• H1: There is a relationship between gender and with whom a person finds it easiest to make friends
• A persons gender is significantly (.05) related with whom it is easiest to make friends.
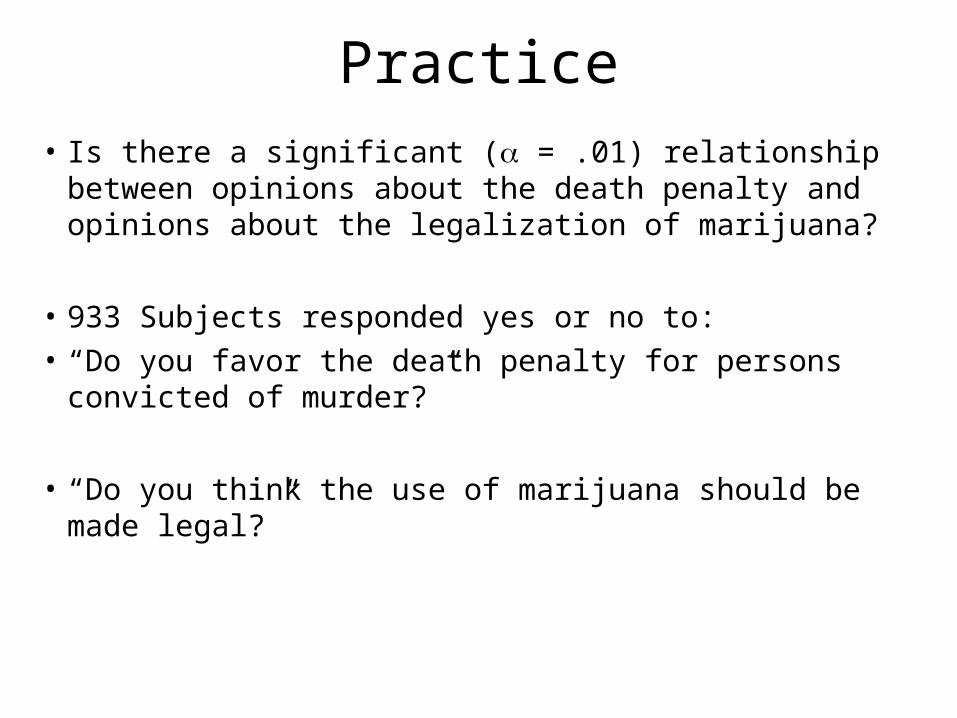
Practice
• Is there a significant ( = .01) relationship between opinions about the death penalty and opinions about the legalization of marijuana?
• 933 Subjects responded yes or no to:• “Do you favor the death penalty for persons convicted of
murder?”
• “Do you think the use of marijuana should be made legal?”
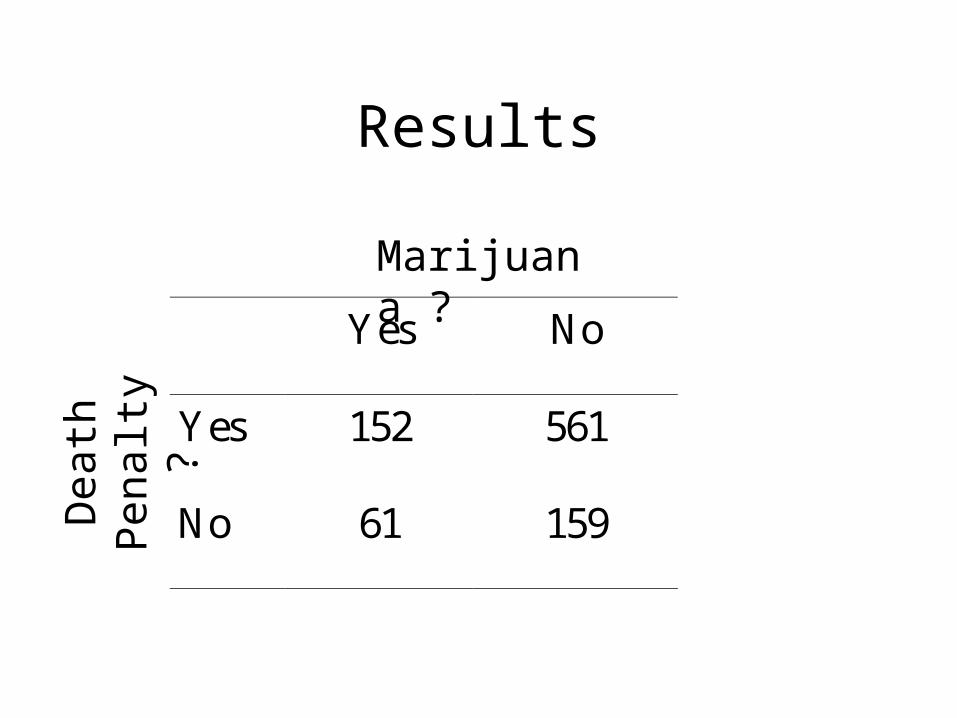
Results
Yes No
Yes 152 561
No 61 159
Marijuana ?
Dea
th
Pen
alty
?
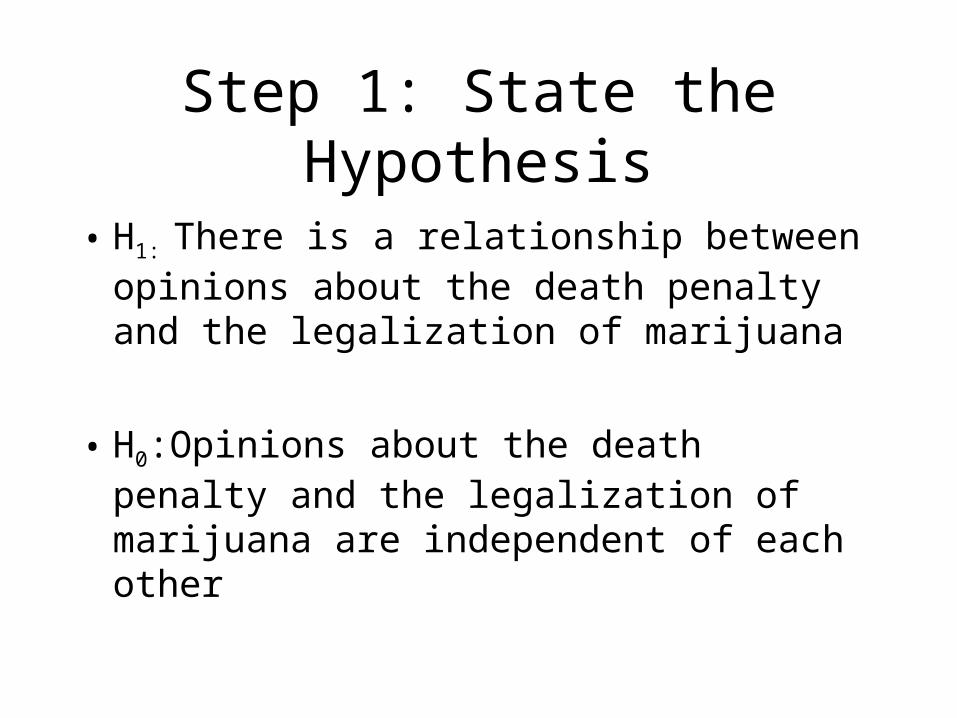
Step 1: State the Hypothesis
• H1: There is a relationship between opinions about the death penalty and the legalization of marijuana
• H0:Opinions about the death penalty and the legalization of marijuana are independent of each other
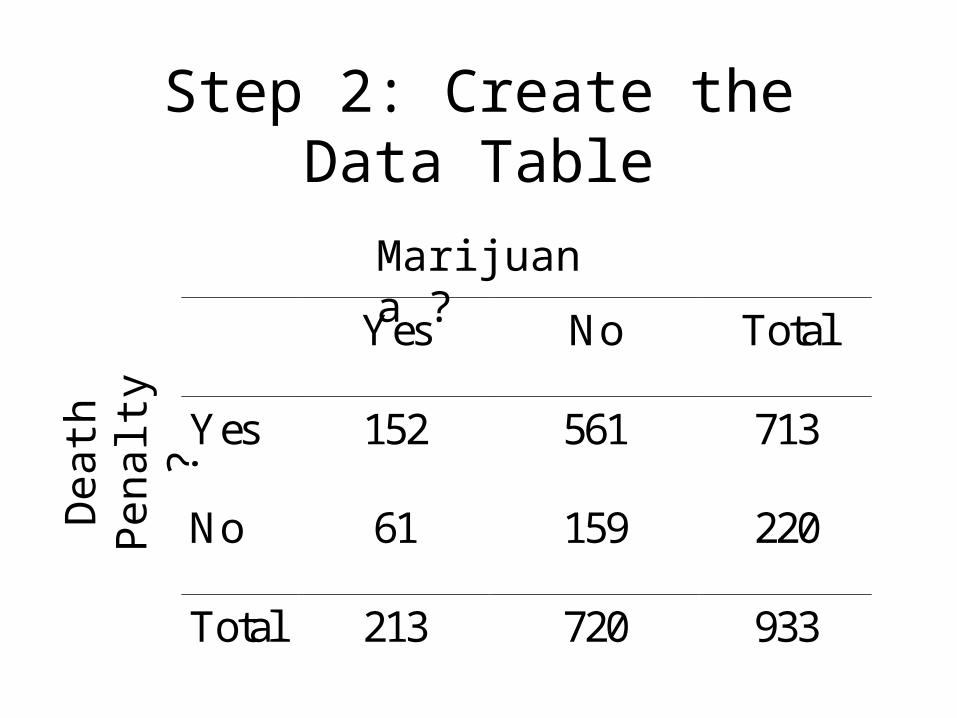
Step 2: Create the Data Table
Yes No Total
Yes 152 561 713
No 61 159 220
Total 213 720 933
Marijuana ?
Dea
th
Pen
alty
?
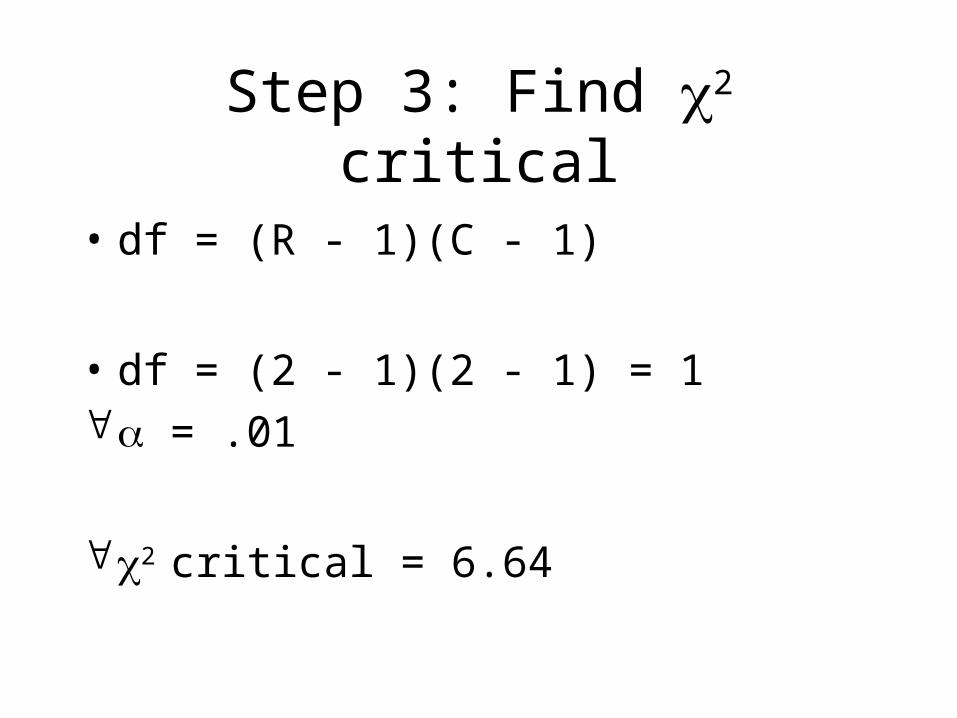
Step 3: Find 2 critical
• df = (R - 1)(C - 1)
• df = (2 - 1)(2 - 1) = 1 = .01
2 critical = 6.64
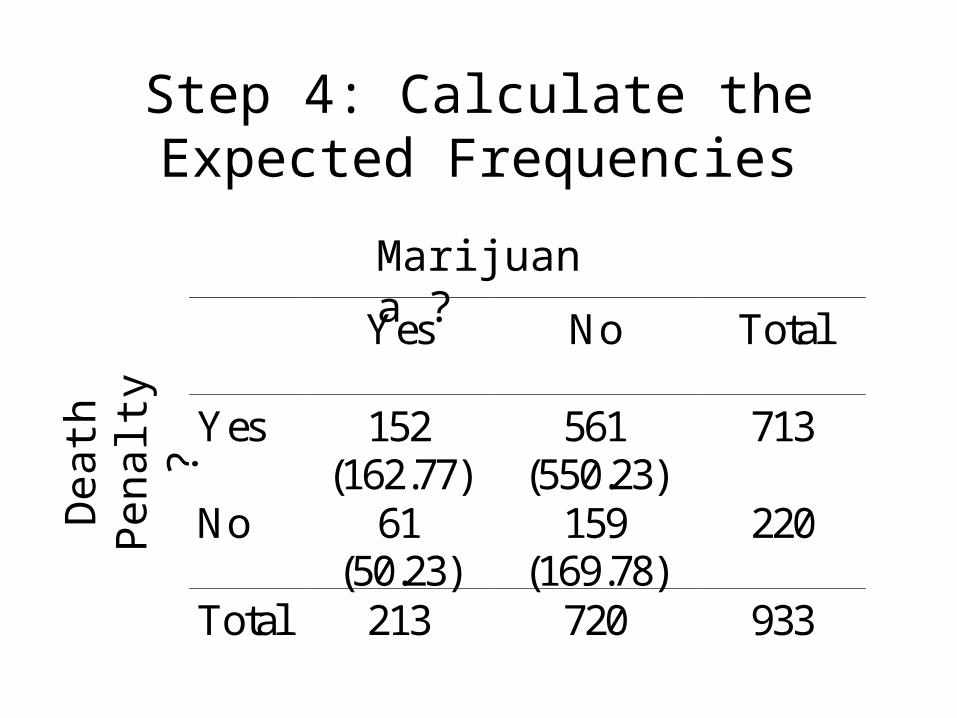
Step 4: Calculate the Expected Frequencies
Yes No Total
Yes 152(162.77)
561(550.23)
713
No 61(50.23)
159(169.78)
220
Total 213 720 933
Marijuana ?
Dea
th
Pen
alty
?
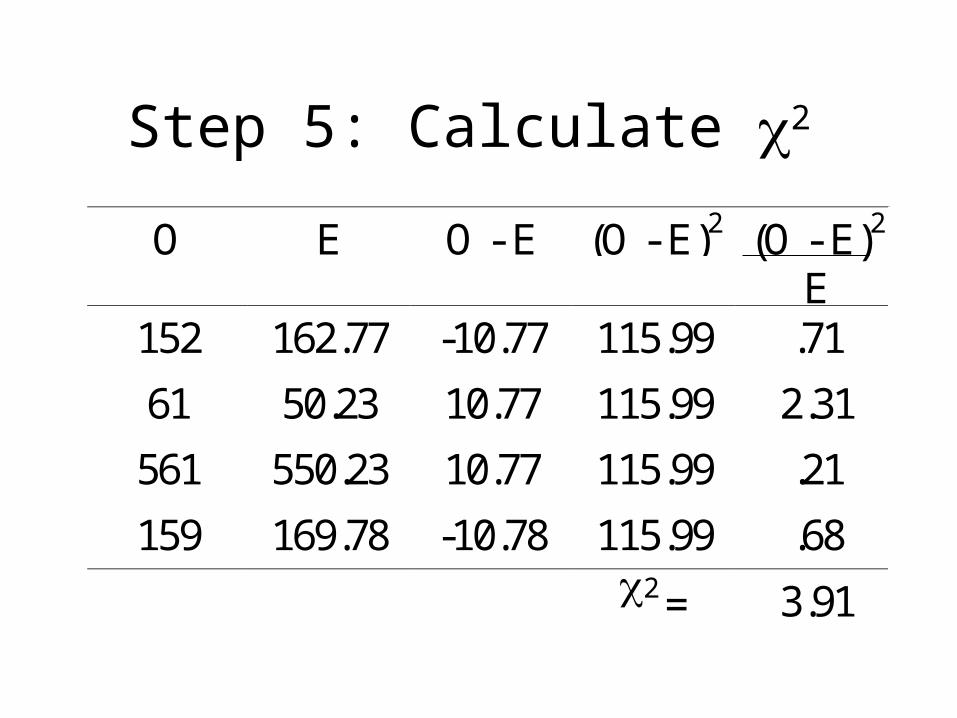
Step 5: Calculate 2
O E O - E (O - E)2 (O - E)2
E152 162.77 -10.77 115.99 .71
61 50.23 10.77 115.99 2.31
561 550.23 10.77 115.99 .21
159 169.78 -10.78 115.99 .682 = 3.91
Step 6: Decision
• Thus, if 2 > than 2critical
– Reject H0, and accept H1
• If 2 < or = to 2critical
– Fail to reject H0
Step 6: Decision
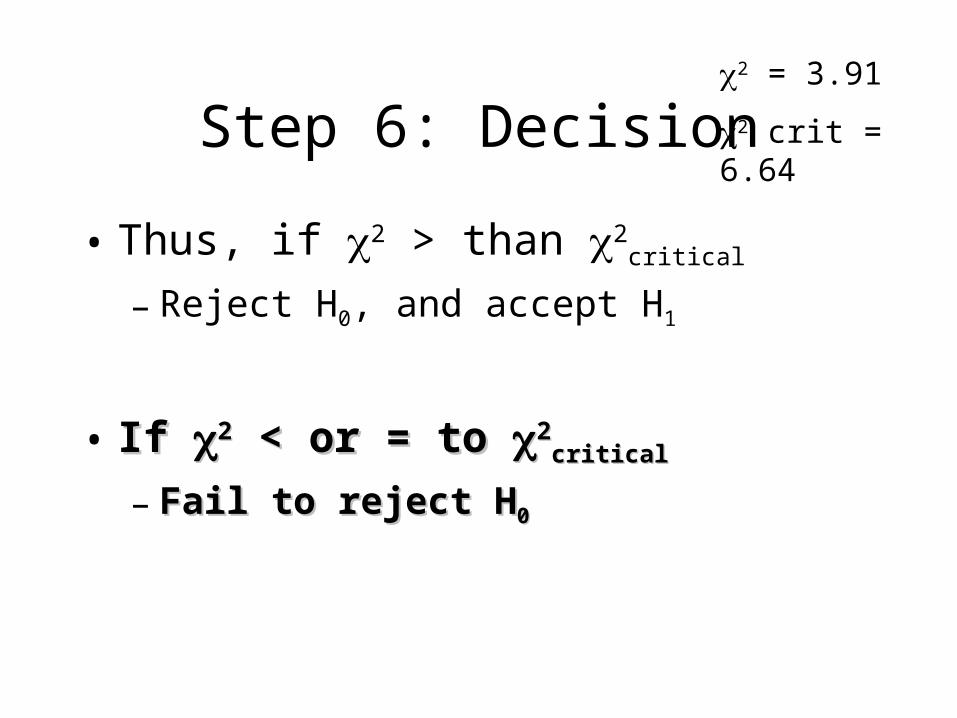
• Thus, if 2 > than 2critical
– Reject H0, and accept H1
• If If 22 < or = to < or = to 22criticalcritical
– Fail to reject HFail to reject H00
2 = 3.91
2 crit = 6.64
Step 7: Put answer into words
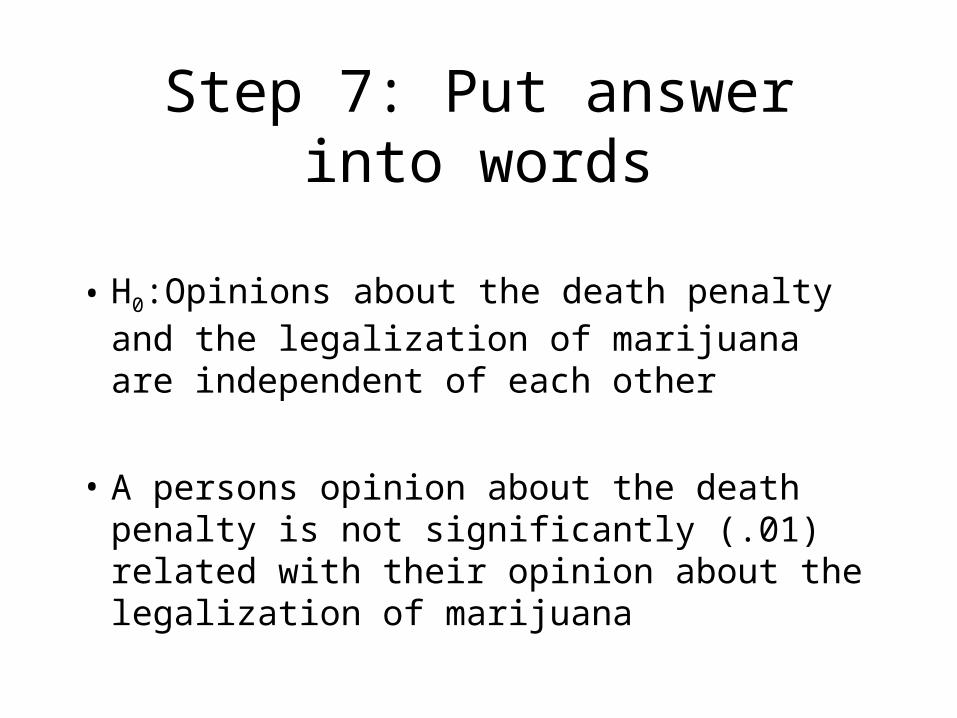
• H0:Opinions about the death penalty and the legalization of marijuana are independent of each other
• A persons opinion about the death penalty is not significantly (.01) related with their opinion about the legalization of marijuana

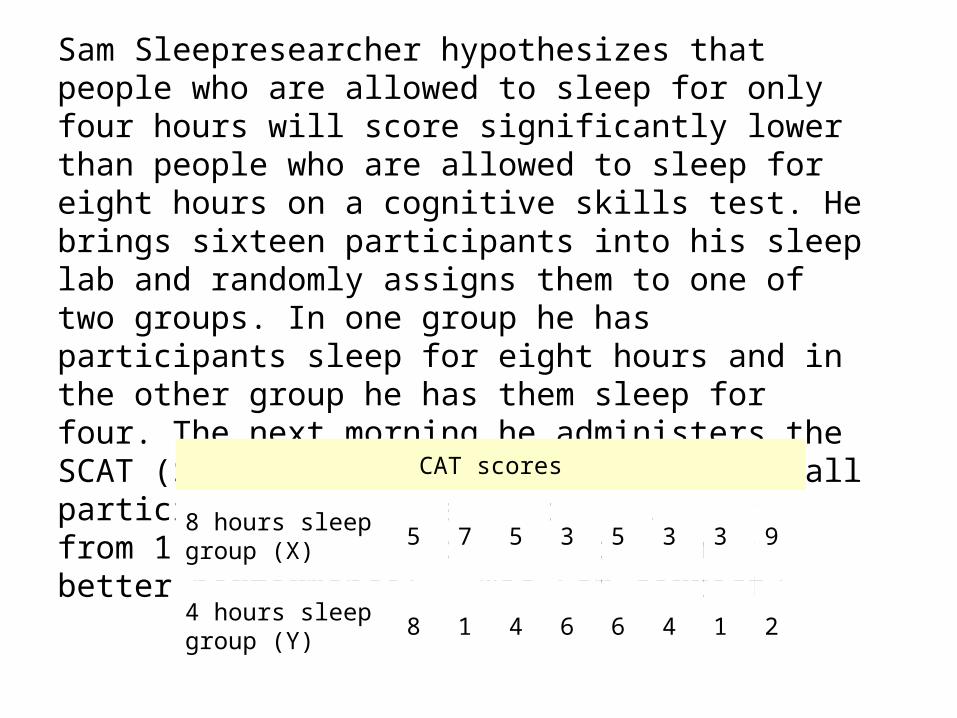
Sam Sleepresearcher hypothesizes that people who are allowed to sleep for only four hours will score significantly lower than people who are allowed to sleep for eight hours on a cognitive skills test. He brings sixteen participants into his sleep lab and randomly assigns them to one of two groups. In one group he has participants sleep for eight hours and in the other group he has them sleep for four. The next morning he administers the SCAT (Sam's Cognitive Ability Test) to all participants. (Scores on the SCAT range from 1-9 with high scores representing better performance). Was Sam correct?
CAT scores
8 hours sleep group (X)
5 7 5 3 5 3 3 9
4 hours sleep group (Y)
8 1 4 6 6 4 1 2
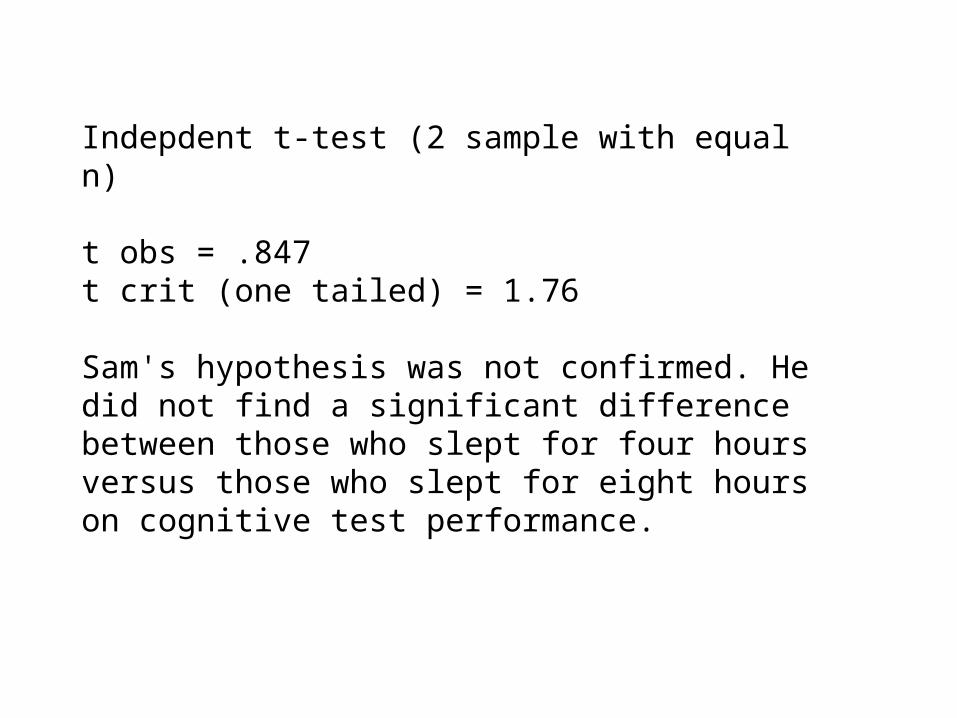
Indepdent t-test (2 sample with equal n)
t obs = .847t crit (one tailed) = 1.76
Sam's hypothesis was not confirmed. He did not find a significant difference between those who slept for four hours versus those who slept for eight hours on cognitive test performance.
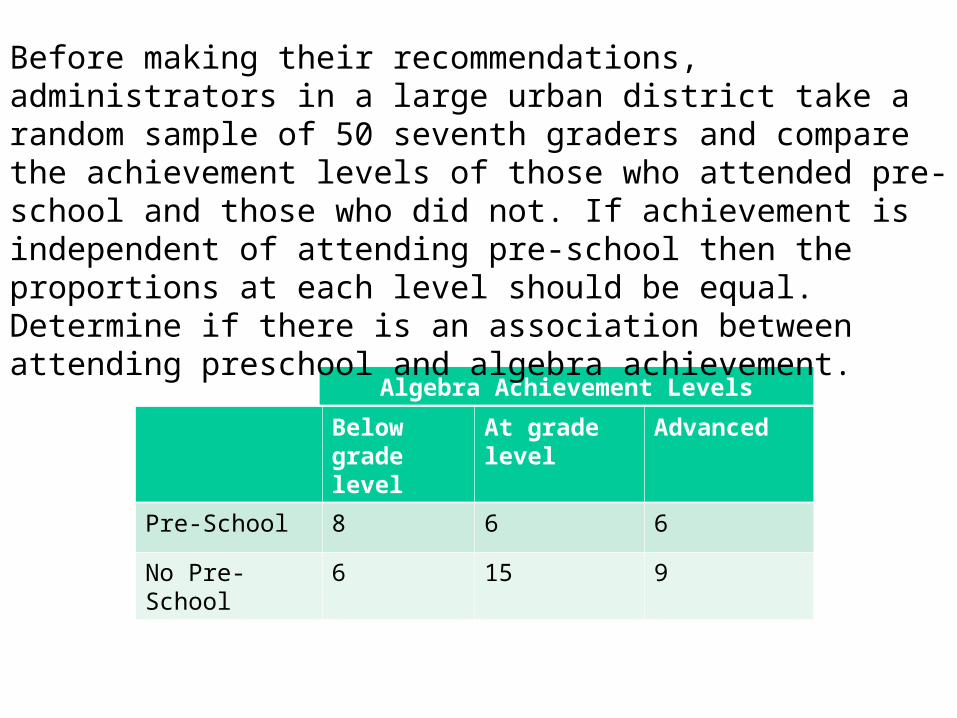
Below grade level
At grade level Advanced
Pre-School 8 6 6
No Pre-School 6 15 9
Algebra Achievement Levels
Before making their recommendations, administrators in a large urban district take a random sample of 50 seventh graders and compare the achievement levels of those who attended pre-school and those who did not. If achievement is independent of attending pre-school then the proportions at each level should be equal. Determine if there is an association between attending preschool and algebra achievement.