Embed Size (px)
Citation preview
Seventeenth Statewide Conference on Local BridgesTuesday, October 25, 2011
Training Session: Culvert Design, Analysis - talk 1
Presented by: George Long, P.E.NYSDOT
CULVERTS: Design, Analysis, Management, Rating & Inspection
Statewide Conference on Local Bridges , 2011
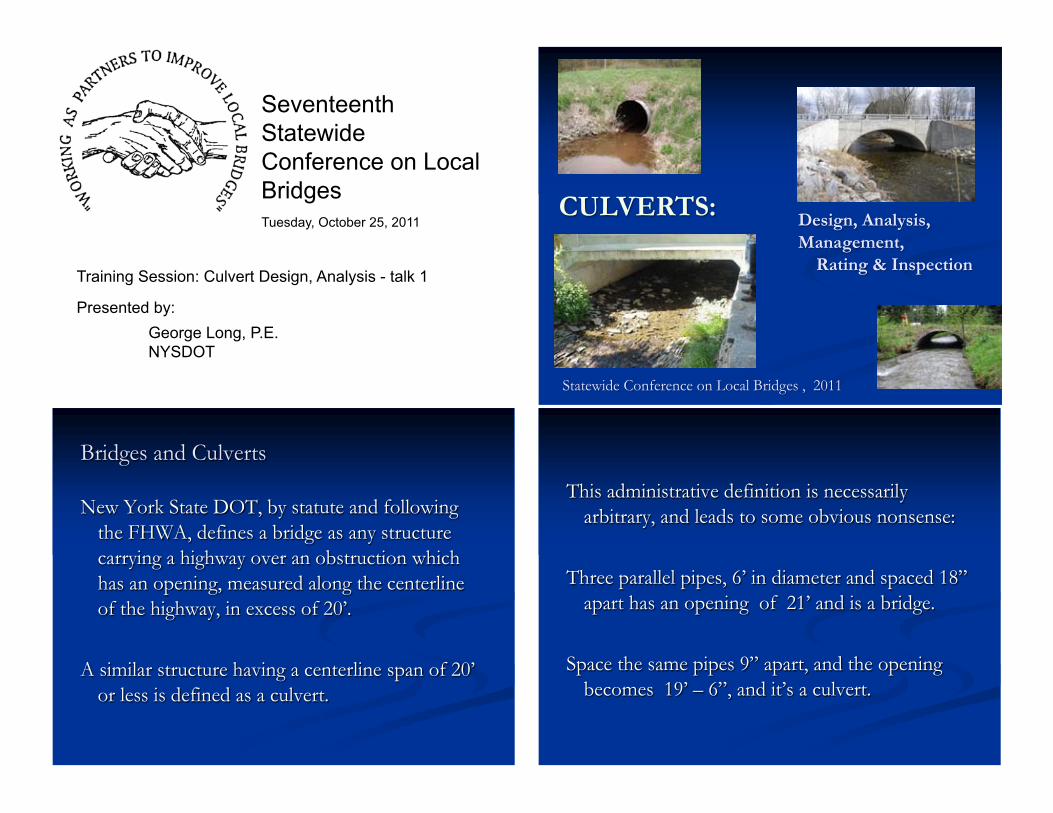
This administrative definition is necessarily arbitrary, and leads to some obvious nonsense:
Three parallel pipes, 6’ in diameter and spaced 18”
apart has an opening of 21’ and is a bridge. Space the same pipes 9” apart, and the opening
becomes 19’ – 6”, and it’s a culvert.
Bridges and Culverts
New York State DOT, by statute and following the FHWA, defines a bridge as any structure carrying a highway over an obstruction which has an opening, measured along the centerline of the highway, in excess of 20’.
A similar structure having a centerline span of 20’
or less is defined as a culvert.

The administrative definitions, though established by statute, do not reflect common usage.
A perhaps better distinction might be a structural
one, based on the method of support.
An open bottomed structure, by contrast, must support these loads on a much smaller area. It requires foundations capable of dealing with the more concentrated loads, either on stronger soils (or rock) or on pile foundations, which add significantly to the cost of the structure.
The smaller the structure, the greater the cost of
the foundations in proportion to the total cost of the structure. For small structures, a closed conduit may be the only economical choice.
A closed conduit stream crossing is self supporting. It distributes the load of its own weight, the fill and roadway above it, and the traffic over the bottom of the structure which is in contact with the soil.
Where soils allow, this type of support is simple
and inexpensive, and is quick and easy to construct with a minimum of specialized equipment.
Let a stream flow through a 16’ wide x 8’ high box. Cross the box with a road at 0° skew, and the 16’
centerline span makes it a culvert. Cross it at 40° skew, and the centerline span of
20.9’ makes it a bridge. It acts the same . The stream can’t tell the
difference.
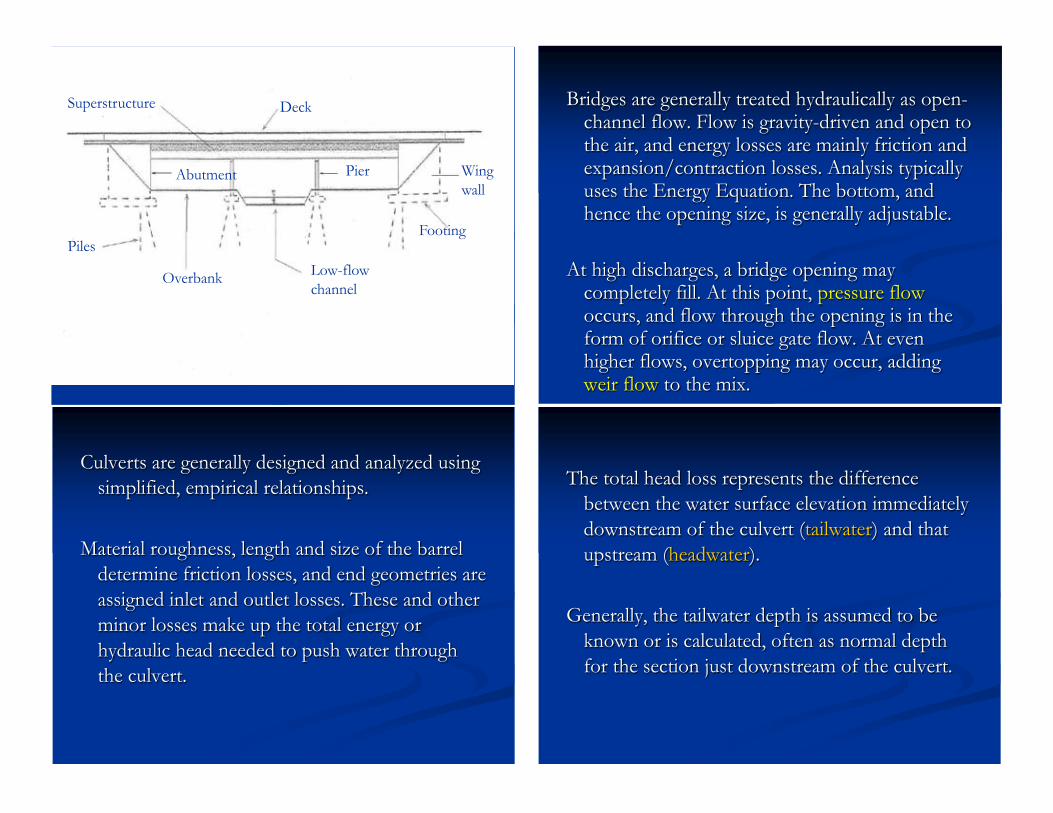
Bridges are generally treated hydraulically as open-channel flow. Flow is gravity-driven and open to the air, and energy losses are mainly friction and expansion/contraction losses. Analysis typically uses the Energy Equation. The bottom, and hence the opening size, is generally adjustable.
At high discharges, a bridge opening may
completely fill. At this point, pressure flow occurs, and flow through the opening is in the form of orifice or sluice gate flow. At even higher flows, overtopping may occur, adding weir flow to the mix.
The total head loss represents the difference between the water surface elevation immediately downstream of the culvert (tailwater) and that upstream (headwater).
Generally, the tailwater depth is assumed to be
known or is calculated, often as normal depth for the section just downstream of the culvert.
Culverts are generally designed and analyzed using simplified, empirical relationships.
Material roughness, length and size of the barrel
determine friction losses, and end geometries are assigned inlet and outlet losses. These and other minor losses make up the total energy or hydraulic head needed to push water through the culvert.
Piles
Overbank Low-flow channel
Deck Superstructure
Abutment Pier Wing wall
Footing
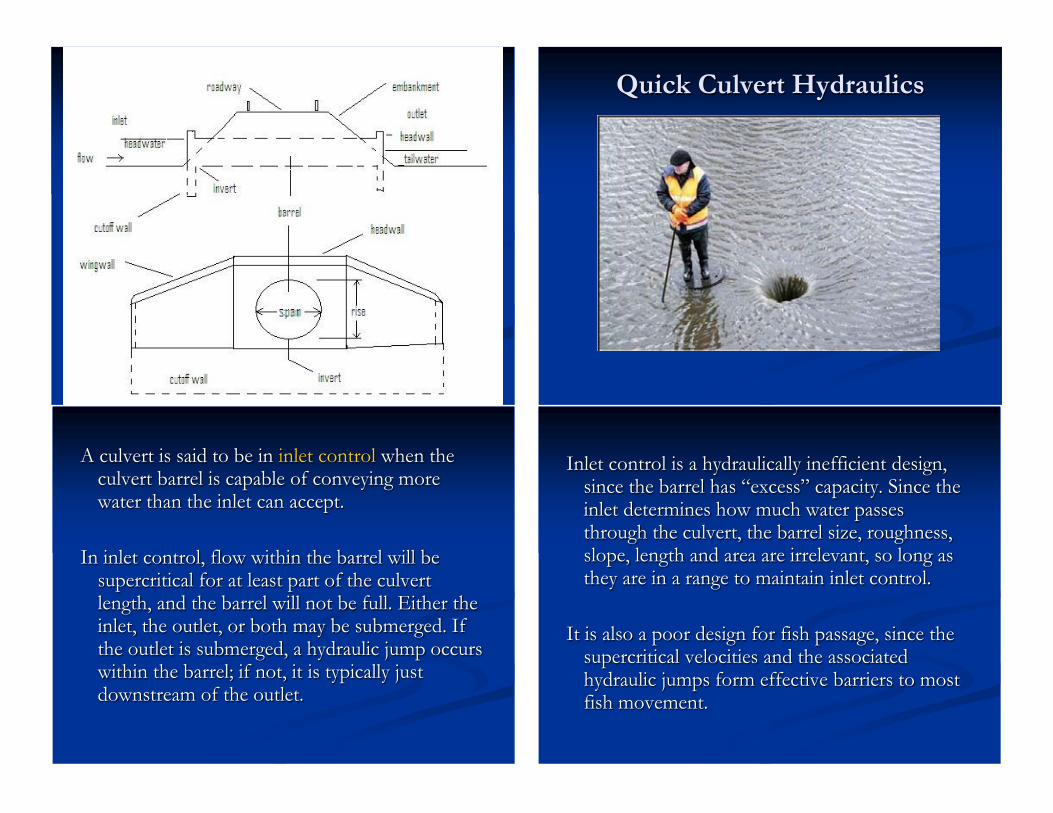
Quick Culvert Hydraulics
Inlet control is a hydraulically inefficient design, since the barrel has “excess” capacity. Since the inlet determines how much water passes through the culvert, the barrel size, roughness, slope, length and area are irrelevant, so long as they are in a range to maintain inlet control.
It is also a poor design for fish passage, since the
supercritical velocities and the associated hydraulic jumps form effective barriers to most fish movement.
A culvert is said to be in inlet control when the culvert barrel is capable of conveying more water than the inlet can accept.
In inlet control, flow within the barrel will be
supercritical for at least part of the culvert length, and the barrel will not be full. Either the inlet, the outlet, or both may be submerged. If the outlet is submerged, a hydraulic jump occurs within the barrel; if not, it is typically just downstream of the outlet.

Outlet control occurs when the inlet does not limit the flow through the culvert. Rather, it is controlled by the slope and the characteristics of the barrel.
Again, either the inlet, the outlet or both may be
submerged, but most often the outlet is unsubmerged. Flow in the culvert will be subcritical. Such culverts present significantly less of a barrier to fish passage.
Whether a culvert is in inlet or outlet control can determine what maintenance activities will be possible.
As long as inlet control is maintained, barrel length, size and roughness are irrelevant; it can be lengthened, fish passage baffles can be added, or the barrel paved or slip-lined without loss of capacity.
If it’s in outlet control, these may decrease
capacity.
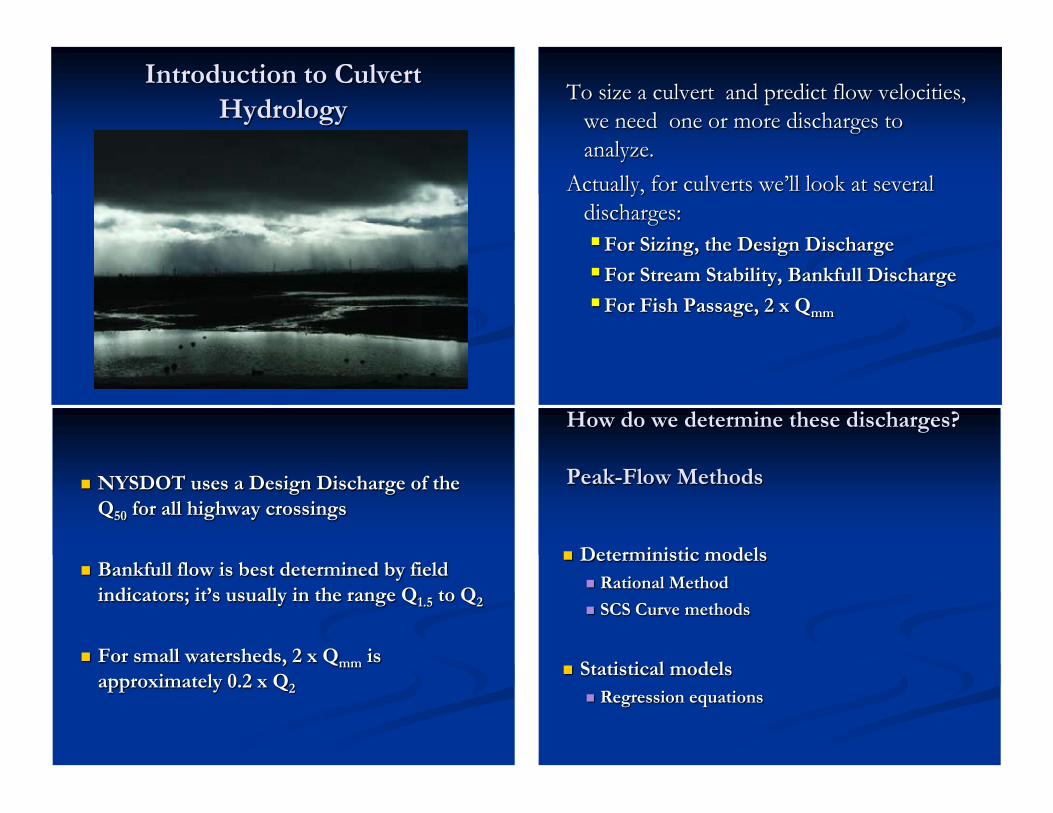
To size a culvert and predict flow velocities, we need one or more discharges to analyze.
Actually, for culverts we’ll look at several discharges: For Sizing, the Design Discharge For Stream Stability, Bankfull Discharge For Fish Passage, 2 x Qmm
How do we determine these discharges? Peak-Flow Methods
Deterministic models Rational Method SCS Curve methods
Statistical models
Regression equations
NYSDOT uses a Design Discharge of the Q50 for all highway crossings
Bankfull flow is best determined by field indicators; it’s usually in the range Q1.5 to Q2
For small watersheds, 2 x Qmm is approximately 0.2 x Q2
Introduction to Culvert Hydrology
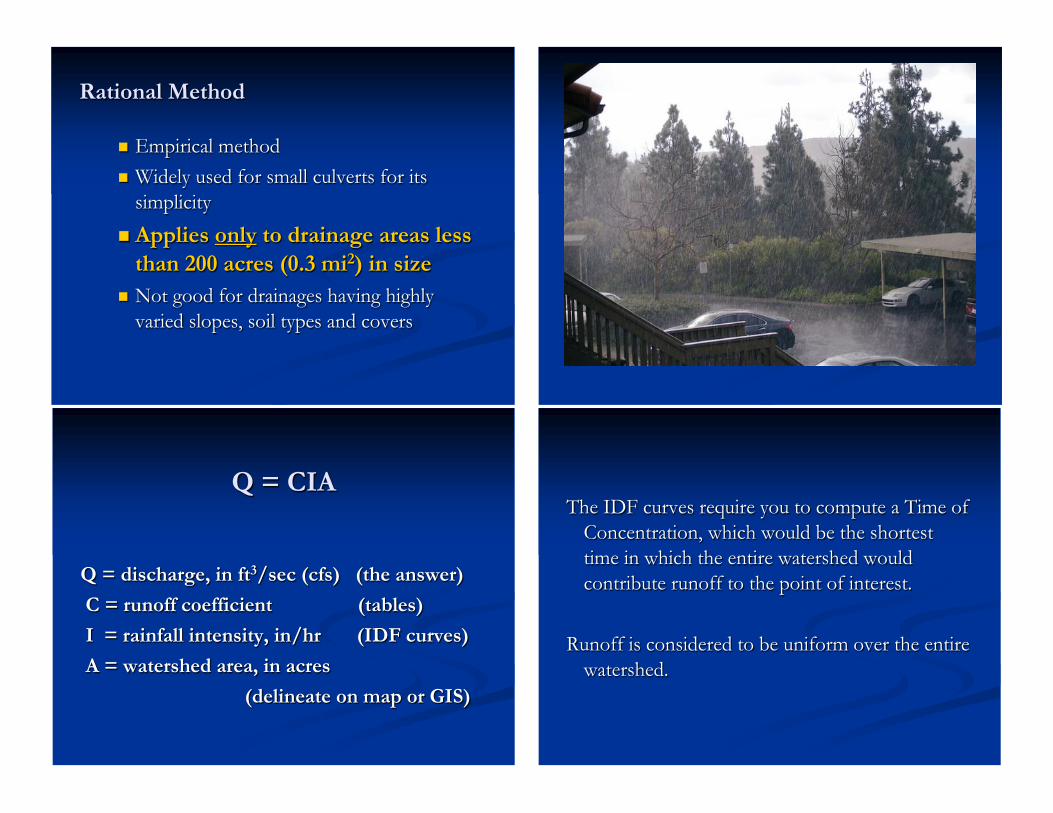
The IDF curves require you to compute a Time of Concentration, which would be the shortest time in which the entire watershed would contribute runoff to the point of interest.
Runoff is considered to be uniform over the entire
watershed.
Q = CIA
Q = discharge, in ft3/sec (cfs) (the answer) C = runoff coefficient (tables) I = rainfall intensity, in/hr (IDF curves) A = watershed area, in acres (delineate on map or GIS)
Rational Method
Empirical method Widely used for small culverts for its
simplicity Applies only to drainage areas less
than 200 acres (0.3 mi2) in size Not good for drainages having highly
varied slopes, soil types and covers
Details of this, and much, much more can be found in
SCS Tech Release 55 “Urban Hydrology for Small Watersheds”
TR-55
Rainfall can be precisely measured, giving the illusion that stream discharge will have little uncertainty. But the uncertainty lies in the models’ connection from one to the other.
Model simplifications and assumptions are
grossly out of line with field research, and have serious consequences in engineering application.
Discussion of Deterministic Models
Fennessey (2001) notes that deterministic models
are at their most inaccurate in small wooded watersheds, where results may overestimate runoff by factors of 10 or more.
NRCS (SCS) Curve Method
This method uses soil and regional rainfall characteristics, land use and cover, a watershed Time of Concentration and other factors to predict peak discharge at the site of interest.
Again, runoff is assumed to be uniformly
distributed over the watershed.
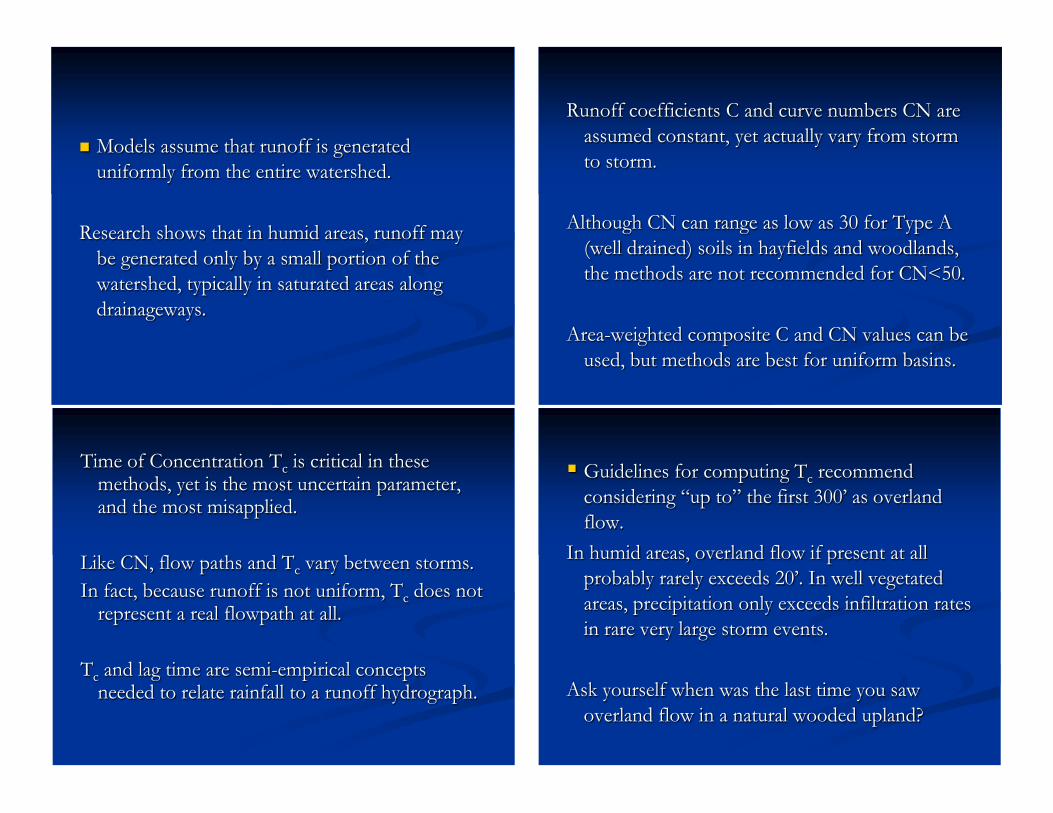
Runoff coefficients C and curve numbers CN are assumed constant, yet actually vary from storm to storm.
Although CN can range as low as 30 for Type A
(well drained) soils in hayfields and woodlands, the methods are not recommended for CN<50.
Area-weighted composite C and CN values can be
used, but methods are best for uniform basins. Guidelines for computing Tc recommend
considering “up to” the first 300’ as overland flow.
In humid areas, overland flow if present at all probably rarely exceeds 20’. In well vegetated areas, precipitation only exceeds infiltration rates in rare very large storm events.
Ask yourself when was the last time you saw
overland flow in a natural wooded upland?
Time of Concentration Tc is critical in these methods, yet is the most uncertain parameter, and the most misapplied.
Like CN, flow paths and Tc vary between storms. In fact, because runoff is not uniform, Tc does not
represent a real flowpath at all. Tc and lag time are semi-empirical concepts
needed to relate rainfall to a runoff hydrograph.
Models assume that runoff is generated uniformly from the entire watershed.
Research shows that in humid areas, runoff may
be generated only by a small portion of the watershed, typically in saturated areas along drainageways.

The Lag Time equation, modified in 1974, is TLag= L0.8(S + 1)0.7 / 1900(Y)0.5
In hours, where L = longest hydraulic length, in feet S = 1000/CN – 10 where CN is the Curve
Number Y = slope of watershed, in percent You may want to run TR-55 using this Lag Time
Does all this mean we should avoid using deterministic methods?
No. In many cases, especially with small
watersheds, they’re all we have. But be aware of their limitations and don’t put too
much reliance on them. Think about the hydrologic processes at the site, and apply the Astonishment Test.
When the Soil Conservation Service first developed their method, it was based on a synthetic hydrograph technique (Mockus, 1956). This used a tabulated Lag Time determined from regression analysis, based on curve number CN.
When TR-55 was developed, they changed to Time of Concentration tc.
But the method wasn’t designed to work with tc
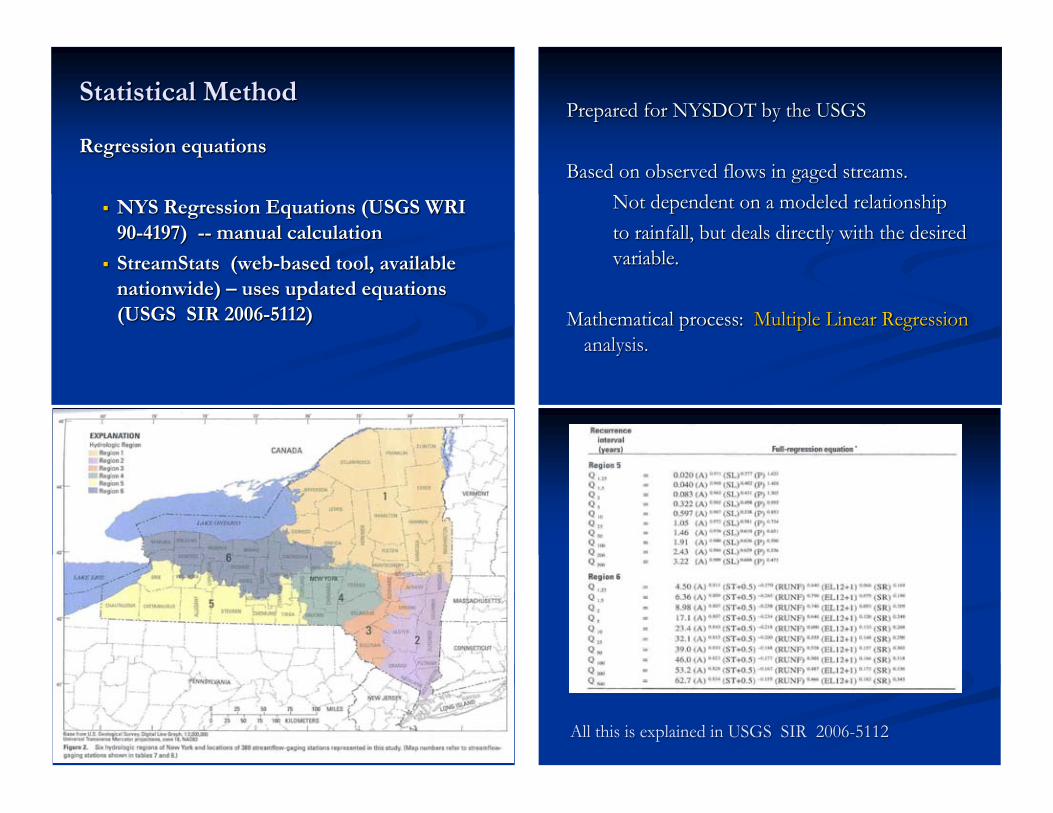
Prepared for NYSDOT by the USGS Based on observed flows in gaged streams. Not dependent on a modeled relationship to rainfall, but deals directly with the desired
variable. Mathematical process: Multiple Linear Regression
analysis.
All this is explained in USGS SIR 2006-5112
Statistical Method
Regression equations
NYS Regression Equations (USGS WRI 90-4197) -- manual calculation
StreamStats (web-based tool, available nationwide) – uses updated equations (USGS SIR 2006-5112)
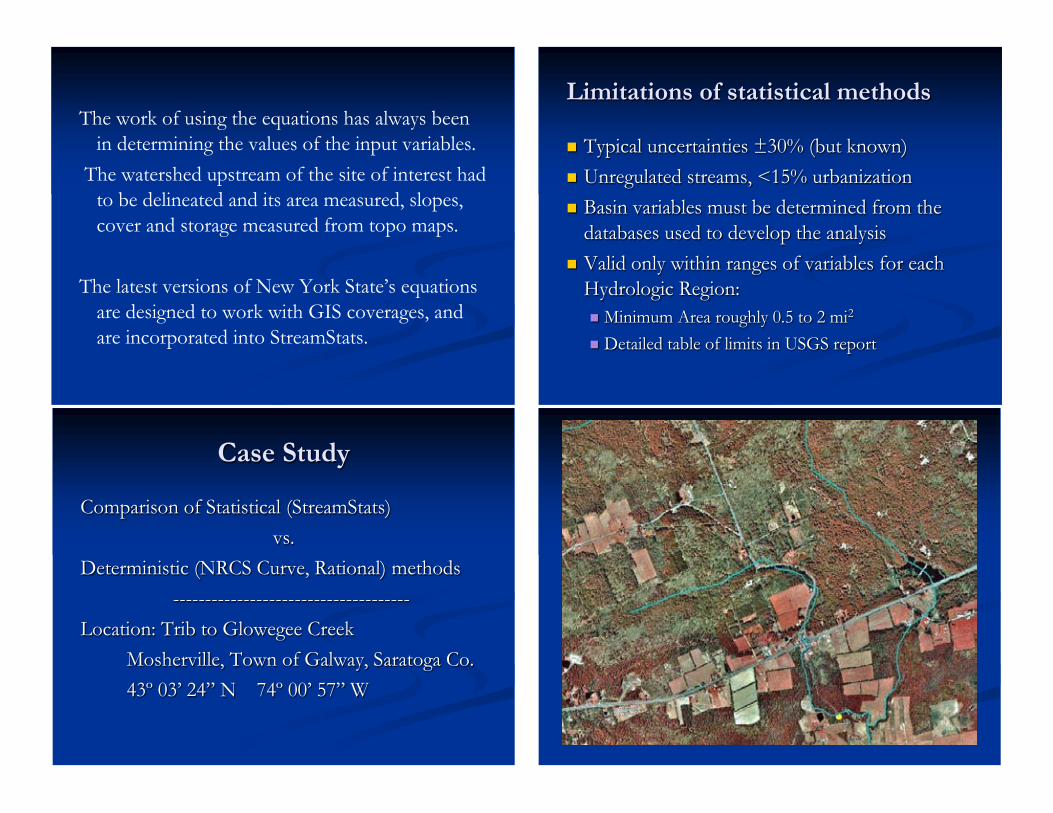
Limitations of statistical methods
Typical uncertainties ±30% (but known) Unregulated streams, <15% urbanization Basin variables must be determined from the
databases used to develop the analysis Valid only within ranges of variables for each
Hydrologic Region: Minimum Area roughly 0.5 to 2 mi2 Detailed table of limits in USGS report
Case Study
Comparison of Statistical (StreamStats) vs.
Deterministic (NRCS Curve, Rational) methods ------------------------------------- Location: Trib to Glowegee Creek Mosherville, Town of Galway, Saratoga Co. 43º 03’ 24” N 74º 00’ 57” W
The work of using the equations has always been in determining the values of the input variables.
The watershed upstream of the site of interest had to be delineated and its area measured, slopes, cover and storage measured from topo maps.
The latest versions of New York State’s equations
are designed to work with GIS coverages, and are incorporated into StreamStats.
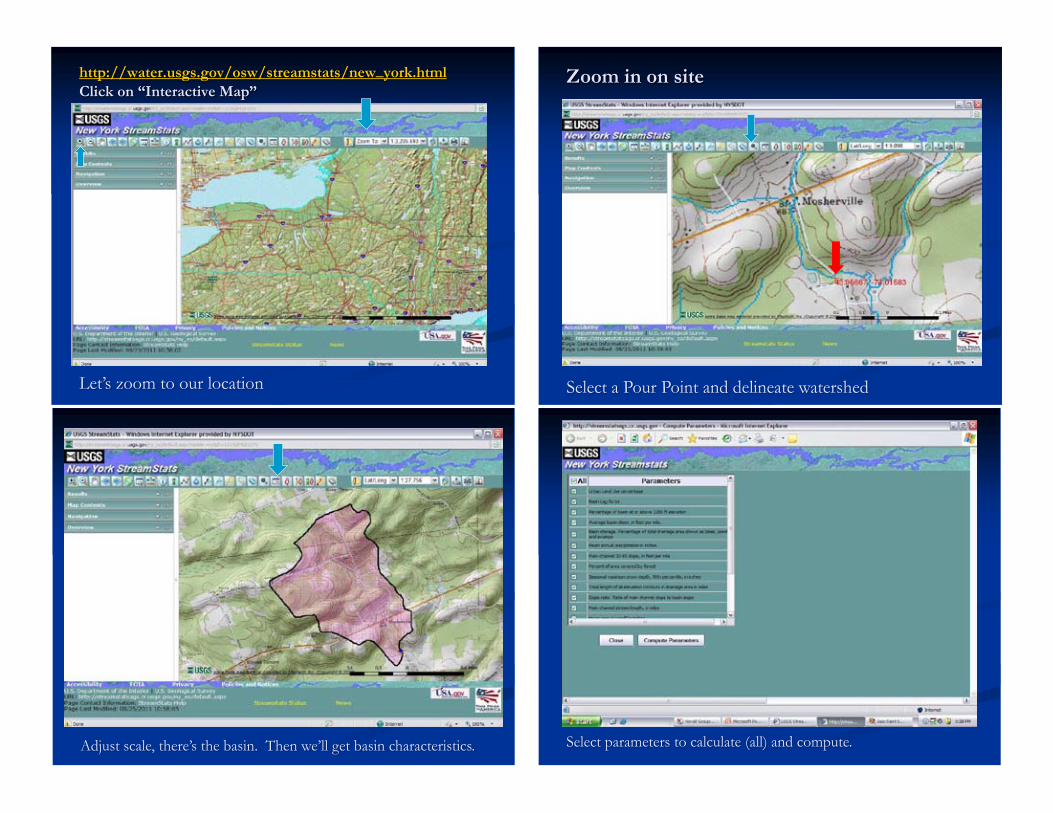
Zoom in on site
Select a Pour Point and delineate watershed
Select parameters to calculate (all) and compute. Adjust scale, there’s the basin. Then we’ll get basin characteristics.
http://water.usgs.gov/osw/streamstats/new_york.html Click on “Interactive Map”
Let’s zoom to our location
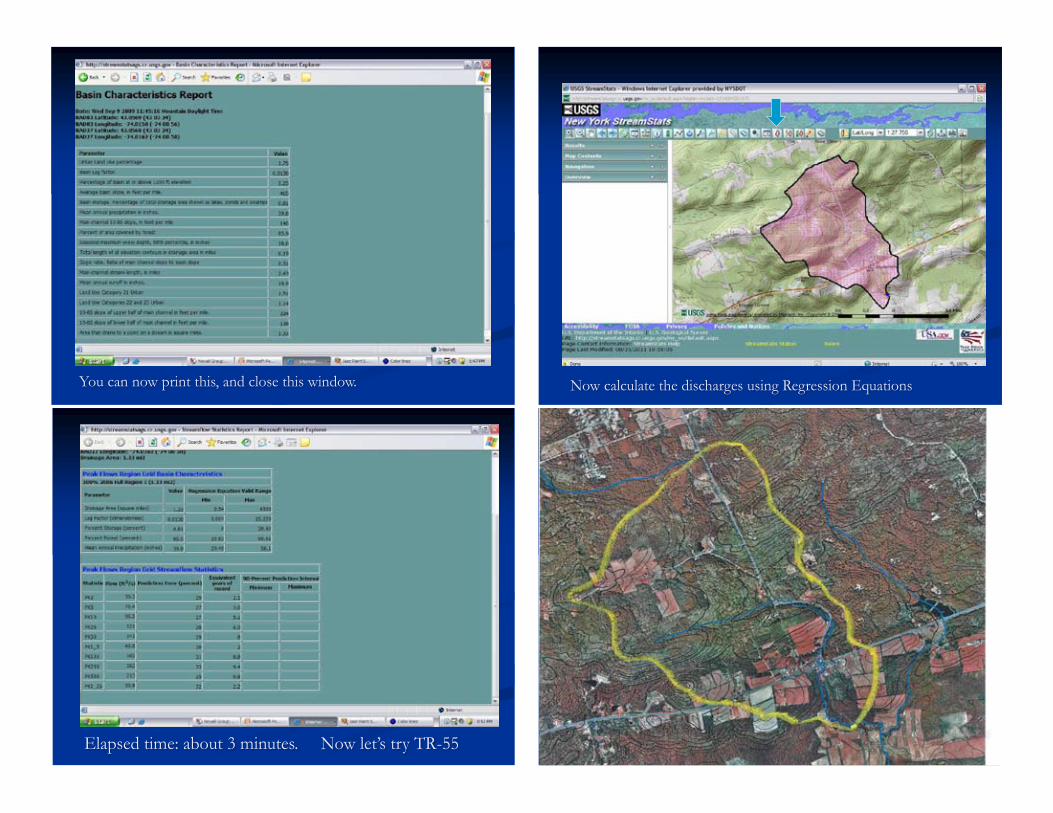
Now calculate the discharges using Regression Equations
Elapsed time: about 3 minutes. Now let’s try TR-55
You can now print this, and close this window.

To find the runoff depth Q (subject to the assumptions of TR-55) we need a representative Curve Number.
From the orthophoto, we estimate that the
watershed is about 85% wooded, and about 90% in soils of Type B, so we expect a CN of about 55 (Type B, woods, good condition).
A full area-weighted average gives a CN of 58.5 From TR-55 Fig. 2-1, for our three frequencies
Q2 = 0.18” Q10 = 0.65” Q50 = 1.2”
From Table 4-1, for CN = 58.5, Ia = 1.42 (Ia/P)2 = 0.57 >0.50 → Use 0.50 (Ia/P)10 = 0.36 (Ia/P)50 = 0.28
The area was determined to be 1.36 mi2
From the 24-hr rainfall charts in TR-55, we get 2-year: P = 2.5 inches 10-year: P = 3.9 inches 50-year: P = 4.95 inches
There is no pond or swamp storage: Fp = 1.0
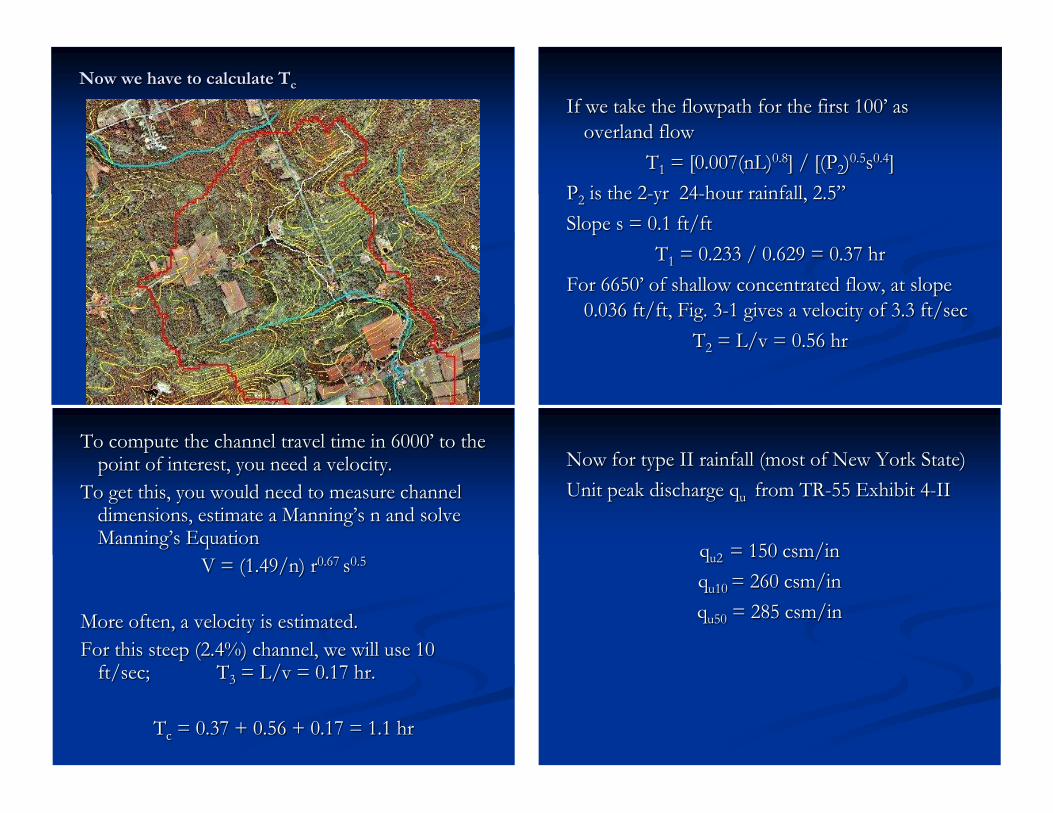
If we take the flowpath for the first 100’ as overland flow
T1 = [0.007(nL)0.8] / [(P2)0.5s0.4] P2 is the 2-yr 24-hour rainfall, 2.5” Slope s = 0.1 ft/ft
T1 = 0.233 / 0.629 = 0.37 hr For 6650’ of shallow concentrated flow, at slope
0.036 ft/ft, Fig. 3-1 gives a velocity of 3.3 ft/sec T2 = L/v = 0.56 hr
Now for type II rainfall (most of New York State) Unit peak discharge qu from TR-55 Exhibit 4-II
qu2 = 150 csm/in qu10 = 260 csm/in qu50 = 285 csm/in
To compute the channel travel time in 6000’ to the point of interest, you need a velocity.
To get this, you would need to measure channel dimensions, estimate a Manning’s n and solve Manning’s Equation
V = (1.49/n) r0.67 s0.5
More often, a velocity is estimated. For this steep (2.4%) channel, we will use 10
ft/sec; T3 = L/v = 0.17 hr.
Tc = 0.37 + 0.56 + 0.17 = 1.1 hr
Now we have to calculate Tc
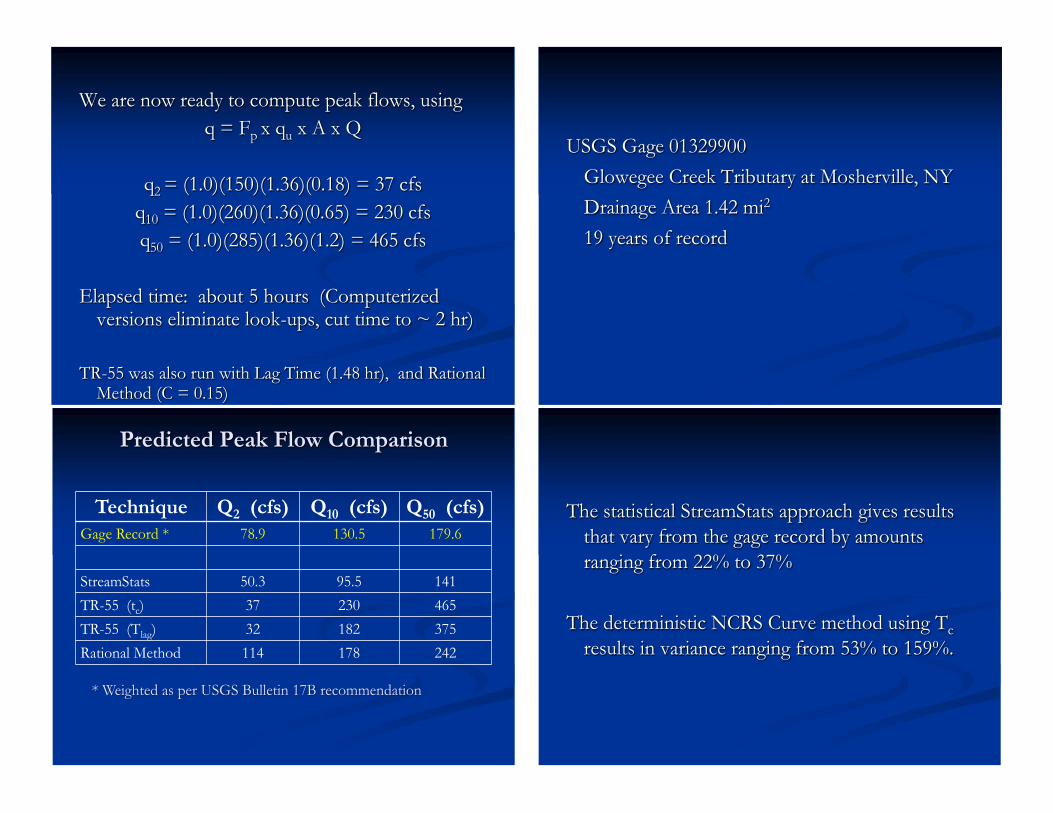
USGS Gage 01329900 Glowegee Creek Tributary at Mosherville, NY Drainage Area 1.42 mi2 19 years of record
The statistical StreamStats approach gives results that vary from the gage record by amounts ranging from 22% to 37%
The deterministic NCRS Curve method using Tc
results in variance ranging from 53% to 159%.
Predicted Peak Flow Comparison
Technique Q2 (cfs) Q10 (cfs) Q50 (cfs) Gage Record * 78.9 130.5 179.6
StreamStats 50.3 95.5 141 TR-55 (tc) 37 230 465 TR-55 (Tlag) 32 182 375 Rational Method 114 178 242
* Weighted as per USGS Bulletin 17B recommendation
We are now ready to compute peak flows, using q = Fp x qu x A x Q
q2 = (1.0)(150)(1.36)(0.18) = 37 cfs
q10 = (1.0)(260)(1.36)(0.65) = 230 cfs q50 = (1.0)(285)(1.36)(1.2) = 465 cfs
Elapsed time: about 5 hours (Computerized
versions eliminate look-ups, cut time to ~ 2 hr) TR-55 was also run with Lag Time (1.48 hr), and Rational
Method (C = 0.15)
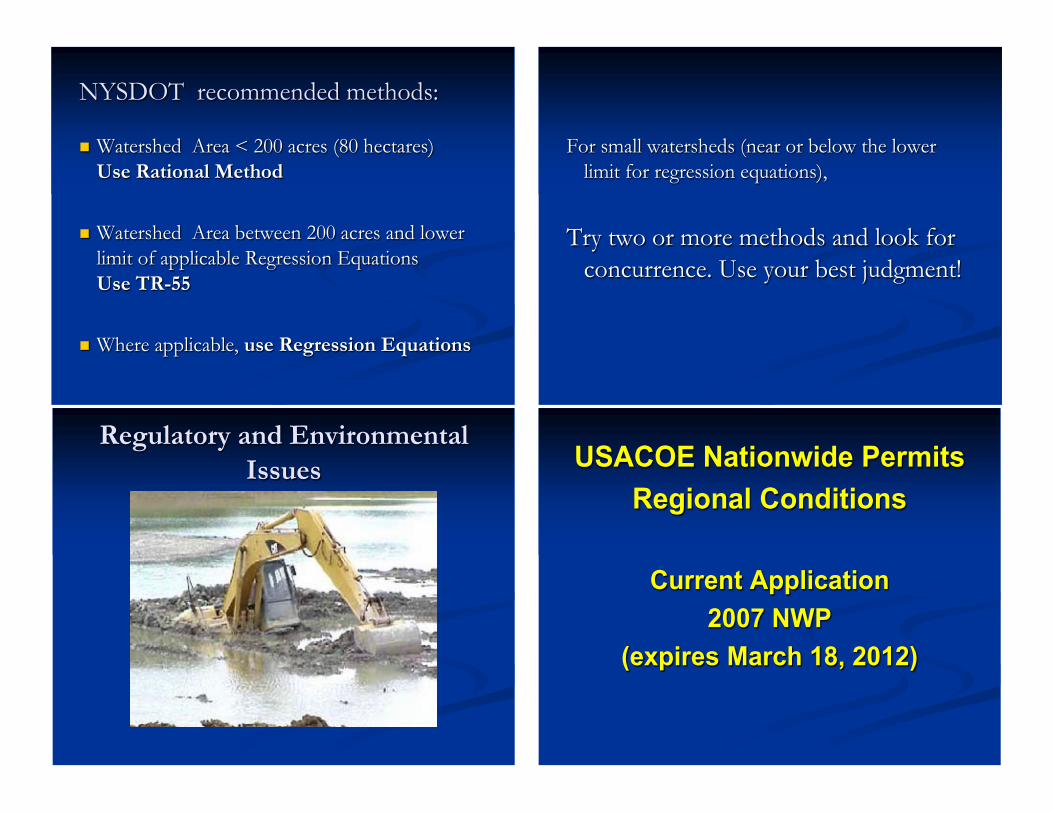
For small watersheds (near or below the lower limit for regression equations),
Try two or more methods and look for concurrence. Use your best judgment!
USACOE Nationwide Permits Regional Conditions
Current Application
2007 NWP (expires March 18, 2012)
Regulatory and Environmental Issues
NYSDOT recommended methods:
Watershed Area < 200 acres (80 hectares) Use Rational Method
Watershed Area between 200 acres and lower limit of applicable Regression Equations Use TR-55
Where applicable, use Regression Equations

Justifications: To reduce habitat connectivity barriers Fish -- perched outlets, excessive velocities Others (herptiles, invertebrates, small mammals -- artificial or impassible substrates Promote stream stability
New or replacement culverts on fish-bearing streams 3-sided or embedded structures required
What are the requirements? Buffalo District General Regional Conditions I. Construction Best Management
Practices (p. 44 – 46) http://www.lrb.usace.army.mil/regulatory/NWP%20
RC%20PN%207-28-08%20rev.pdf
As implemented by EI-10-028
What are NWPs?
NWPs authorize activities that are similar in nature and that cause only minimal adverse environmental impacts individually or cumulatively NWP’s regulate work in wetlands and waters of US under Sec. 404 Clean Water Act and Sec. 10 Rivers and Harbors Act of 1899
Each District develops Regional Conditions (RC) to protect local aquatic ecosystems and ensure that the NWPs only authorize activities that have minimal adverse impacts on these systems
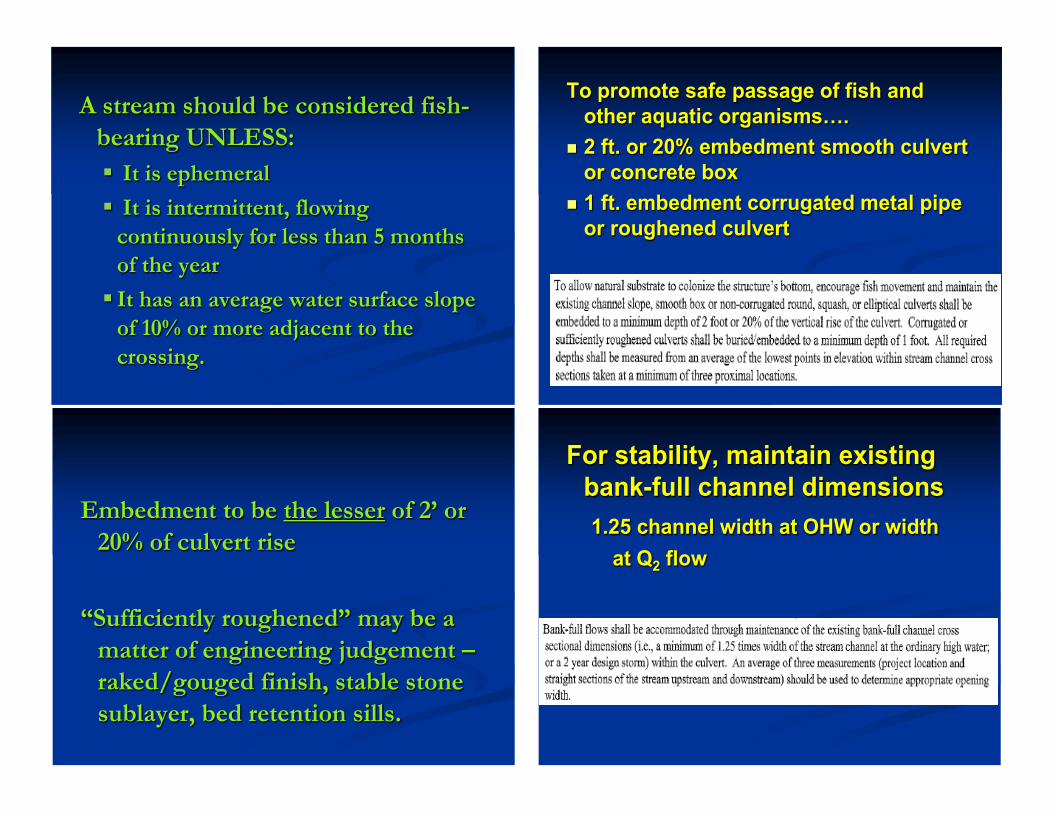
To promote safe passage of fish and other aquatic organisms….
2 ft. or 20% embedment smooth culvert or concrete box
1 ft. embedment corrugated metal pipe or roughened culvert
For stability, maintain existing bank-full channel dimensions
1.25 channel width at OHW or width at Q2 flow
Embedment to be the lesser of 2’ or 20% of culvert rise
“Sufficiently roughened” may be a
matter of engineering judgement – raked/gouged finish, stable stone sublayer, bed retention sills.
A stream should be considered fish-bearing UNLESS: It is ephemeral It is intermittent, flowing
continuously for less than 5 months of the year
It has an average water surface slope of 10% or more adjacent to the crossing.
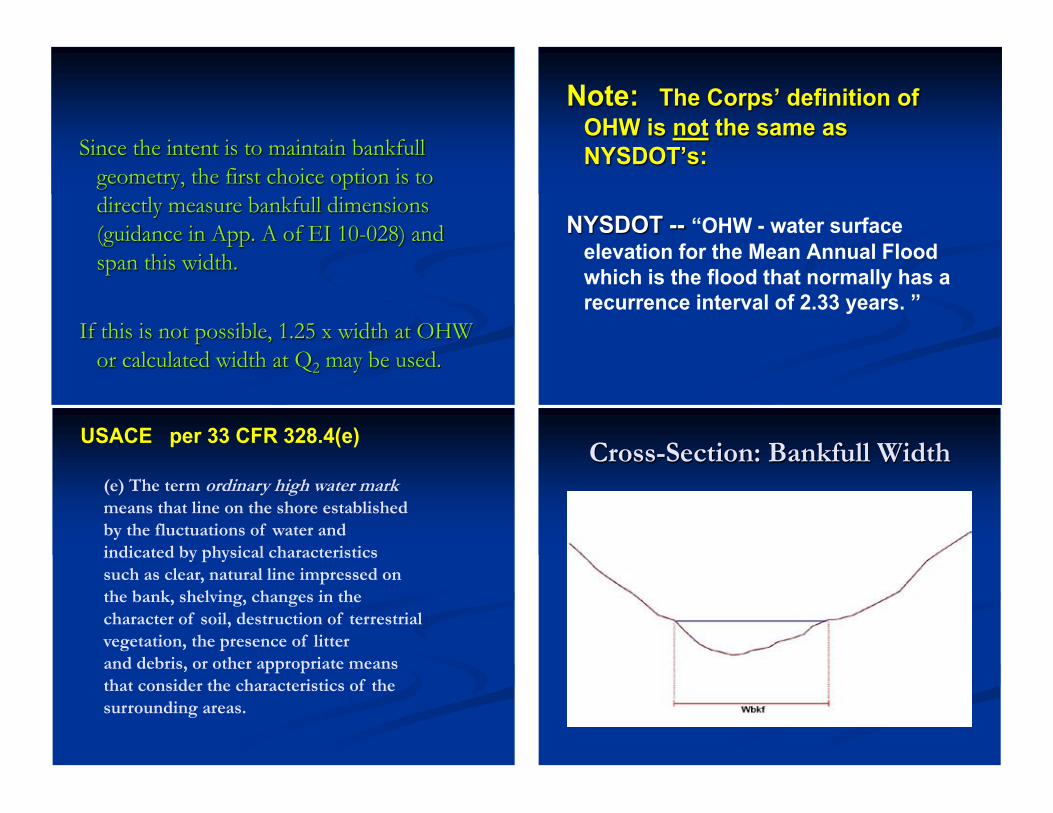
Note: The Corps’ definition of OHW is not the same as NYSDOT’s:
NYSDOT -- “OHW - water surface
elevation for the Mean Annual Flood which is the flood that normally has a recurrence interval of 2.33 years. ”
Cross-Section: Bankfull Width USACE per 33 CFR 328.4(e) (e) The term ordinary high water mark means that line on the shore established by the fluctuations of water and indicated by physical characteristics such as clear, natural line impressed on the bank, shelving, changes in the character of soil, destruction of terrestrial vegetation, the presence of litter and debris, or other appropriate means that consider the characteristics of the surrounding areas.
Since the intent is to maintain bankfull geometry, the first choice option is to directly measure bankfull dimensions (guidance in App. A of EI 10-028) and span this width.
If this is not possible, 1.25 x width at OHW
or calculated width at Q2 may be used.
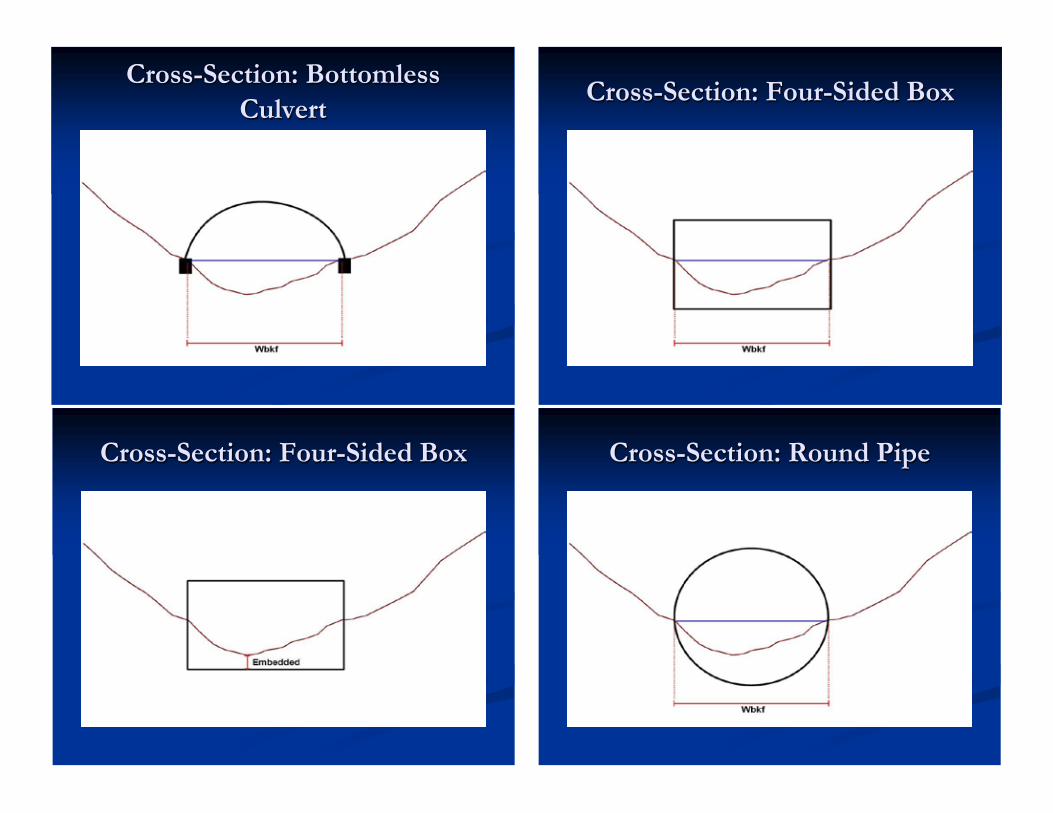
Cross-Section: Four-Sided Box
Cross-Section: Round Pipe Cross-Section: Four-Sided Box
Cross-Section: Bottomless Culvert

If these required measures cannot be implemented, submit PCN
Explain why not practicable Evaluate effects on aquatic species Measures to mitigate those effects
Why not just use a PCN anyway?
NWPs self-certify. No permit review, just document the work.
PCN must be reviewed – USACE has 30 days to
determine completeness. They may request additional information.
Once the PCN is deemed complete, they have 45 days to respond.
Reasons to consider PCN Embedment conflicts: bedrock or buried utilities that
cannot feasibly be relocated Span limit constraints: congested urban settings with
existing buildings, walls, utilities and transportation facilities adjacent to the culvert.
Span/rise ratio causing increased fill height Where the maximum span to rise ratio (4) governs, the increased span increases structure height. This increased height in turn raises the roadway profile, increasing the size of the road footprint and making the culvert longer – stream corridor impacts
Limited downstream culvert hydraulic capacity
Cross-Section: Round Pipe
Proposed 2012 NWP Conditions
March 2011 Draft for Comments: Same embedment requirements (2’ / 20%, 1’
for CMP or roughened) No mention of width requirement
Although the current NWPs took effect in March 2007, the Regional Conditions were not issued until July 28, 2008.
New NWPs will be issued for March,
2012, but we may continue under these Regional Conditions until new ones are adopted.
What will the new conditions be?
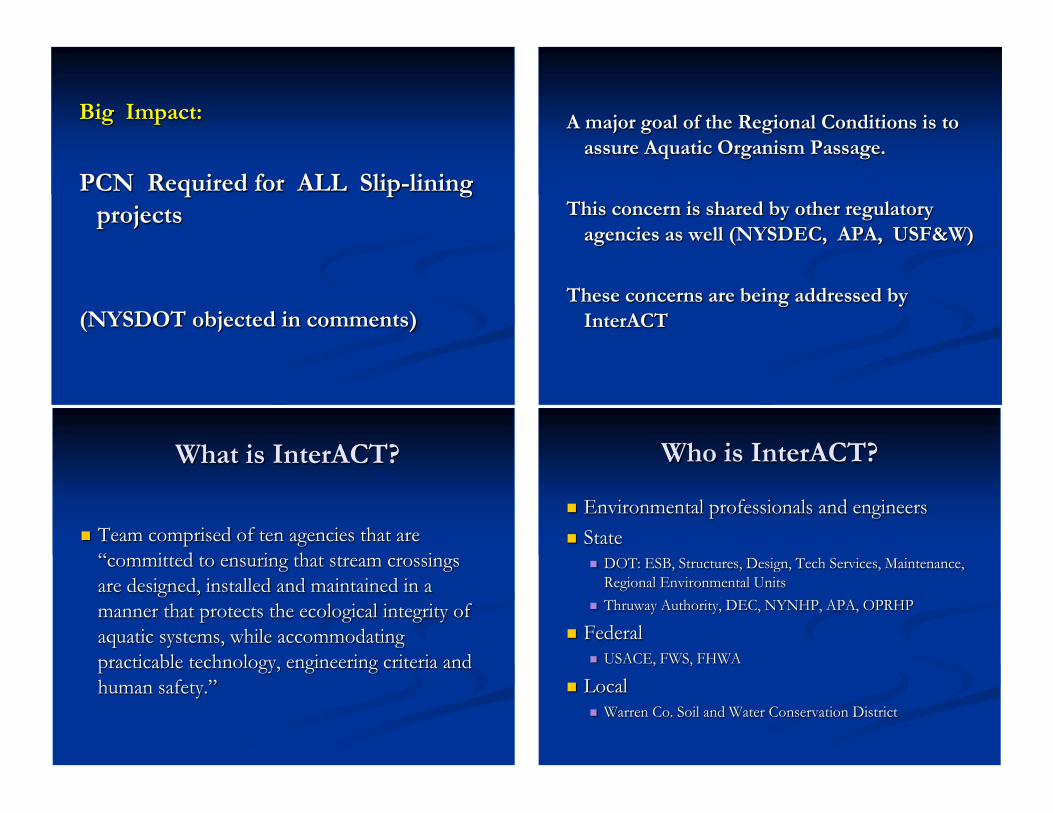
A major goal of the Regional Conditions is to assure Aquatic Organism Passage.
This concern is shared by other regulatory
agencies as well (NYSDEC, APA, USF&W) These concerns are being addressed by
InterACT
Who is InterACT?
Environmental professionals and engineers State
DOT: ESB, Structures, Design, Tech Services, Maintenance, Regional Environmental Units
Thruway Authority, DEC, NYNHP, APA, OPRHP
Federal USACE, FWS, FHWA
Local Warren Co. Soil and Water Conservation District
What is InterACT?
Team comprised of ten agencies that are “committed to ensuring that stream crossings are designed, installed and maintained in a manner that protects the ecological integrity of aquatic systems, while accommodating practicable technology, engineering criteria and human safety.”
Big Impact: PCN Required for ALL Slip-lining
projects (NYSDOT objected in comments)
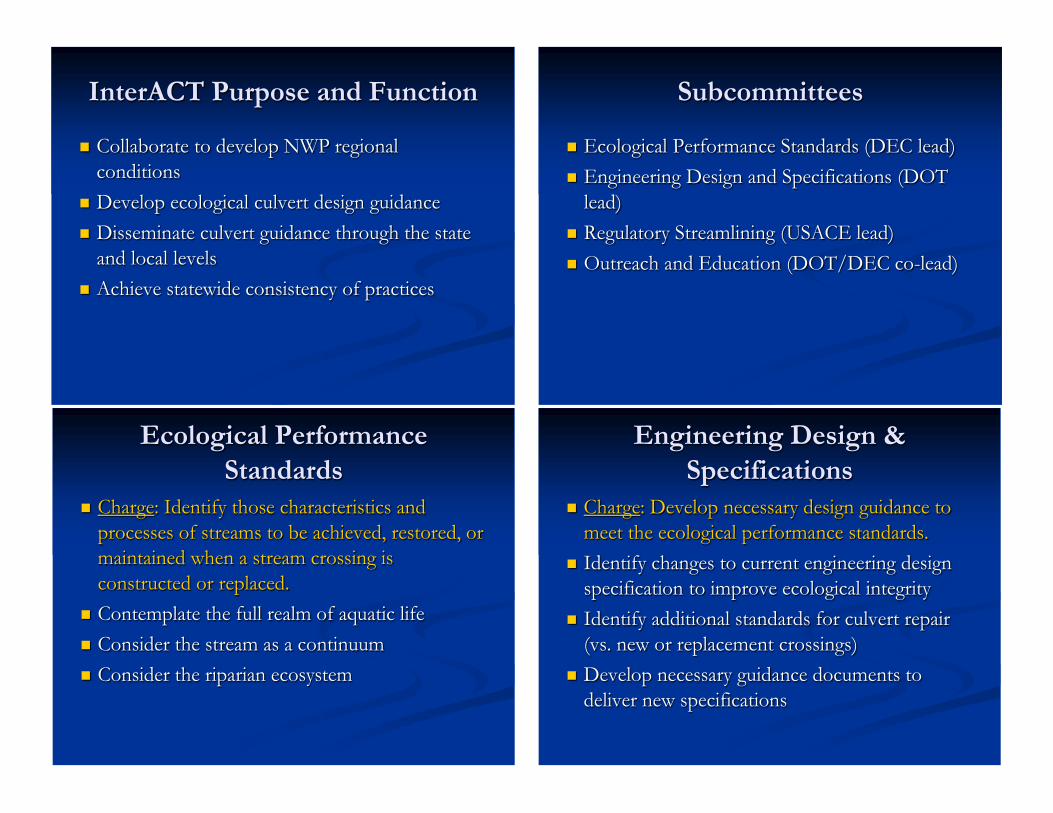
Subcommittees
Ecological Performance Standards (DEC lead) Engineering Design and Specifications (DOT
lead) Regulatory Streamlining (USACE lead) Outreach and Education (DOT/DEC co-lead)
Engineering Design & Specifications
Charge: Develop necessary design guidance to meet the ecological performance standards.
Identify changes to current engineering design specification to improve ecological integrity
Identify additional standards for culvert repair (vs. new or replacement crossings)
Develop necessary guidance documents to deliver new specifications
Ecological Performance Standards
Charge: Identify those characteristics and processes of streams to be achieved, restored, or maintained when a stream crossing is constructed or replaced.
Contemplate the full realm of aquatic life Consider the stream as a continuum Consider the riparian ecosystem
InterACT Purpose and Function
Collaborate to develop NWP regional conditions
Develop ecological culvert design guidance Disseminate culvert guidance through the state
and local levels Achieve statewide consistency of practices
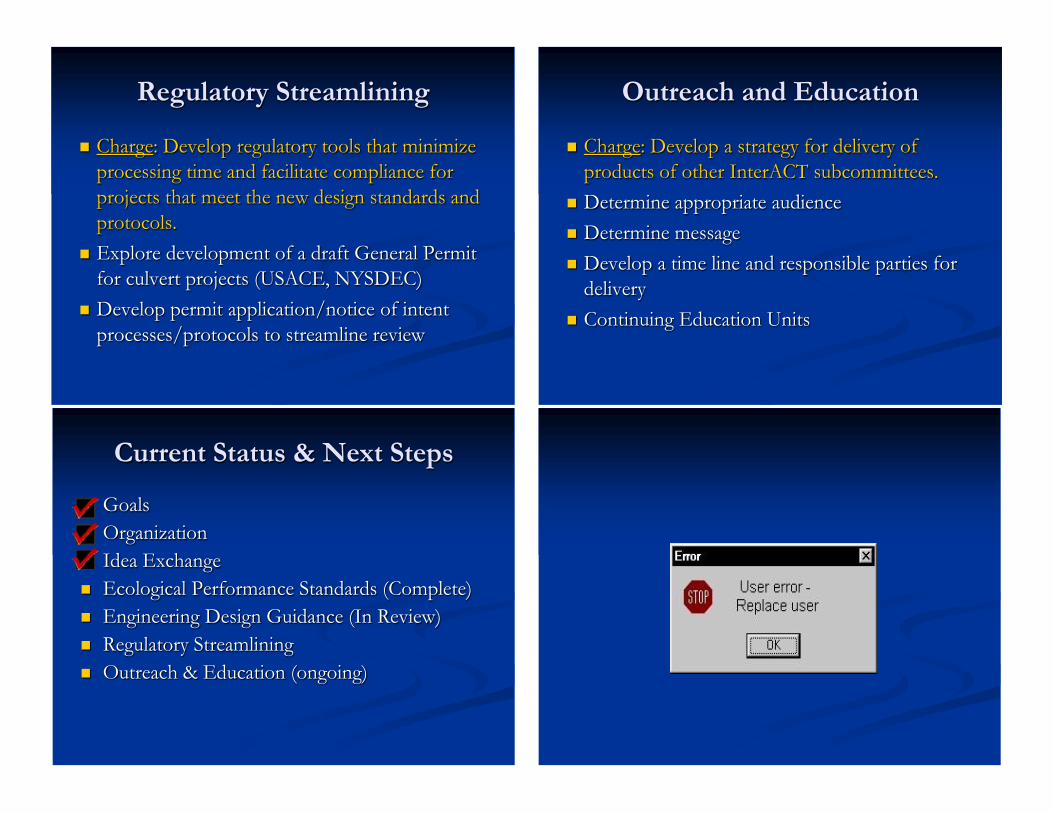
Outreach and Education
Charge: Develop a strategy for delivery of products of other InterACT subcommittees.
Determine appropriate audience Determine message Develop a time line and responsible parties for
delivery Continuing Education Units
Current Status & Next Steps
Goals Organization Idea Exchange Ecological Performance Standards (Complete) Engineering Design Guidance (In Review) Regulatory Streamlining Outreach & Education (ongoing)
Regulatory Streamlining
Charge: Develop regulatory tools that minimize processing time and facilitate compliance for projects that meet the new design standards and protocols.
Explore development of a draft General Permit for culvert projects (USACE, NYSDEC)
Develop permit application/notice of intent processes/protocols to streamline review