Embed Size (px)
Citation preview

Tatsuo SAKAIDepartment of Mechanical
College of ScienceRitsumeikan University, Japan
Institute ofChinese Academy
May 5,
Several Recent Topicsin Research on Fatigue Behavior
of Metallic Materials
SAKAIMechanical Engineering
Science and EngineeringUniversity, Japan
of MechanicsAcademy of Sciences
5, 2015
Several Recent Topicsin Research on Fatigue Behavior
of Metallic Materials

Outline of My Lecture
[ Part 1: Introduction ]◇ Introduction of myself and Ritsumeikan◇ Brief history of research on fatigue of metallic materials◇ Subjects of my lecture today
[ Part 2: Very high cycle fatigue of metallic ◇ Fundamentals and simple review◇ Duplex S-N characteristics consisting of different fracture modes◇ Crack Initiation Mechanisms of interior initiated fracture◇ Statistical aspects of the very high cycle fatigue behavior
[ Part 3: Estimation of the S-N property from only tensile strength]◇ Relationships between fatigue limit and static mechanical properties◇ Statistical estimation of S-N curve from tensile strength◇ Physical model to estimate the S
Outline of My Lecture
[ Part 1: Introduction ]Ritsumeikan University
Brief history of research on fatigue of metallic materialsSubjects of my lecture today
atigue of metallic materials ]Fundamentals and simple review
characteristics consisting of different fracture modesCrack Initiation Mechanisms of interior initiated fractureStatistical aspects of the very high cycle fatigue behavior
property from only tensile strength]Relationships between fatigue limit and static mechanical properties
curve from tensile strengthPhysical model to estimate the S-N curve from tensile strength

[ Part
Introduction◇ Introduction of myself and
◇ Brief history of research on
◇ Subjects of my lecture today
Part 1 ]
IntroductionIntroduction of myself and Ritsumeikan University
Brief history of research on fatigue of metallic materials
today

Brief Carriculum
• EDUCATION• B.E. in Mechanical Engineering, Ritsumeikan• M.E. in Mechanical Engineering, Ritsumeikan• Ph.D in Science and Engineering, Ritsumeikan
• ACADEMIC APPOINTMENTS• 1971-1986: Assistant Professor, Ritsumeikan• 1986-1992: Associate Professor, Ritsumeikan• 1988-1989: Visiting Professor, University• 1992-2011: Professor, M.E. and Ph.D<2011.3.31> Retired and again employed as follows;
• 2011-present: Specially Employed Professor【特任教授】
Vitae of Myself
Ritsumeikan University, 1968Ritsumeikan University, 1970Ritsumeikan University, 1981
Ritsumeikan University, JapanRitsumeikan University, Japan
University of Washington, Seatle, USAPh.D supervisor, Ritsumeikan University
<2011.3.31> Retired and again employed as follows;Specially Employed Professor, Ritsumeikan University
】
Ritsumeikan UniversitySuzaku Campus
Headquarters & Special Graduate Schools
Overview of Ritsumeikan University
Ritsumeikan AsiaPacific University
Ritsumeikan UniversityKyoto Kinugasa Campus
Law・Social Science・International Relations・Letters・Image-Arts & Sciences
Ritsumeikan UniversityOsaka Ibaraki Campus (OIC)
Policy Science・Business Administration・(Psychology-2016)
KYOTO TOKYO
BEPPU
KUSATSUOSAKA
Ritsumeikan UniversityBiwako-Kusatsu Campus (BKC)
Economics・Science & Engng・Information Sci.& Engng・Life Science・Pharmaceutical Science・Sport & Health Science
RitsumeikanUniversity
APU
Professors 1,269
Undergrad. Stud. 32,853
Graduated Stud. 2,799
Foreign Stud. 1,253
Numbers of Professors and Students
University
Student Total 36,905
Osaka Ibaraki Campus (OIC)Business Administration

老いも若きも幼きも隔てなく、共に身を修めることが重
要であり、これを精励努力することにより、初めて人間
として「命」を立つることになる。
Both young person and aged person have totheir best everyday to cultivate their minds. Basedon such a daily life, people can develop theircreative lives.
立命館の由来と生涯学習
家塾「立命館」を創始 1869(明治学祖:西園寺公望
A stone statue of “孟子” had gifted to RitsumeikanUniversity from Chinese Government in 2005.
「孟子」 盡心章
老いも若きも幼きも隔てなく、共に身を修めることが重
要であり、これを精励努力することにより、初めて人間
to doBased
their
立命館の由来と生涯学習
(明治2)年
Ritsumeikan
孟子像

This institute was established in Ritsumeikan University(Kyoto Campus) as the first Confucius Instituteon October, 2005. Since establishment of thisthe institute has been commonly administratedBeijing University and Tongji University. A lot ofhave been organized in the relation to this instituteorder to facilitate the mutual communicationexchange the culture in both countries.
Opening of Confucius Institute at Ritsumeikan(立命館孔子学院)
立命館大学 (Ritsumeikan University) 孔子
UniversityInstitute in Japan
institute,administrated with
of projectsinstitute in
communication and
Ritsumeikan
北京大学 (Beijing University)
同済大学 (Tongji University)孔子(BC552-BC479)

Origin of research on fatigue of metallicWilhelm August Julius Albert (1787-1846)
★ He was a mining engineer in Germany working to reduce the failure accidents of chains lifting ore and coal.
★ He had developed a special type of fatigue testing machine as shown in the figure. An edge of the chain is connected to the tip of the arm and a plate is connected to the other end. Thus, if the wheel is turning around, cyclic loads can be applied to the chain.
Brief history of research on fatigue of metallic materials
. Albert, Archiv fur Mineralogie, Geognosie, Bergbau und Huttenkunde, 10, (1838), p.215.
Fatigue life (Stress cycles to failure)
Appl
ied
load
etallic materials
He was a mining engineer in Germany working to reduce the
He had developed a special type of fatigue testing machine as shown in the figure. An edge of the chain is connected to the tip of the arm and a plate is connected to the other end. Thus, if the wheel is turning around, cyclic loads can be applied to the chain.
Brief history of research on fatigue of metallic materials
, (1838), p.215.
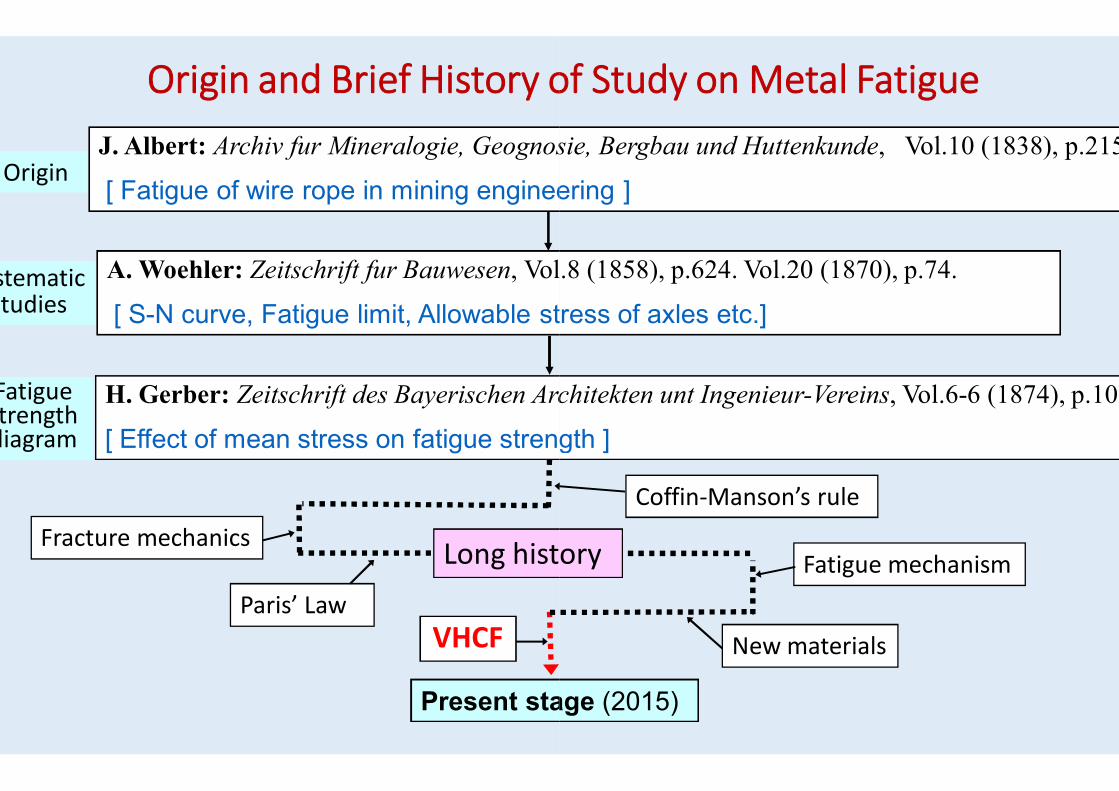
Origin and Brief History of Study on J. Albert: Archiv fur Mineralogie, Geognosie
[ Fatigue of wire rope in mining engineering ]
A. Woehler: Zeitschrift fur Bauwesen, Vol.8 (1858), p.624. Vol.20 (1870), p.74.
[ S-N curve, Fatigue limit, Allowable stress of axles etc.]
H. Gerber: Zeitschrift des Bayerischen Architekten
[ Effect of mean stress on fatigue strength
Origin
Systematic Studies
Fatigue strength diagram
Present stage
Fracture mechanics
Paris’ Law
Long history
VHCF
Origin and Brief History of Study on Metal FatigueGeognosie, Bergbau und Huttenkunde, Vol.10 (1838), p.215.
[ Fatigue of wire rope in mining engineering ]
, Vol.8 (1858), p.624. Vol.20 (1870), p.74.
N curve, Fatigue limit, Allowable stress of axles etc.]
Architekten unt Ingenieur-Vereins, Vol.6-6 (1874), p.101.
strength ]
Present stage (2015)
Fatigue mechanism
New materials
Long history
Coffin-Manson’s rule

Subjects of my lecture today
★ Based on the above trend, the very
behavior of metallic materials is introduced as
★ As a new prospect, my research group has been working
a special subject. Can we estimate the
tensile strength? Estimation
tensile strength is introduced as
Subjects of my lecture today
Based on the above trend, the very high cycle fatigue
behavior of metallic materials is introduced as Part 2
As a new prospect, my research group has been working
a special subject. Can we estimate the S-N curve from the
tensile strength? Estimation of the S-N property from only
tensile strength is introduced as Part 3

[ Part
Very high cycle fatigue of metallic
◇ Fundamentals and simple ◇ Duplex S-N characteristics consisting of different
modes◇ Crack Initiation Mechanisms of interior initiated ◇ Statistical aspects of the very high cycle fatigue
[ Part 2 ]
high cycle fatigue of metallic materials
Fundamentals and simple reviewcharacteristics consisting of different fracture
Crack Initiation Mechanisms of interior initiated fractureStatistical aspects of the very high cycle fatigue behavior

Background of Activated
1) Some of machine parts are actuallyThus, fatigue properties in VHCF regimedata to design such mechanical structuresshafts, Springs for tappet valves and
2) Long term use of machines and structureseffects to save resources, to save energyproducts, to reduce environmental loadsand steel making and to reduce industrial
If design life of any mechanical product isresources becomes 1/2, energy consumptionalso becomes 1/2, and quantity of the wastes
Thus, we have quadruplex effect of 1/2x1/2technology to realize the sustainable society
Background of Activated Studies on VHCF
actually used for a long term of N>108-9 cycles.regime should be clarified as reference
structures. [Axles of train vehicle, Crankand so on.]
structures can have quadruplex synergyenergy required to fabricate mechanicalloads caused in their fabrication process
industrial wastes.
is expanded into two times, consumption ofconsumption also becomes 1/2, environmental load
wastes becomes 1/2, simultaneously.
2x1/2x1/2=1/16 and this can provide a keysociety (Low Carbon Society).
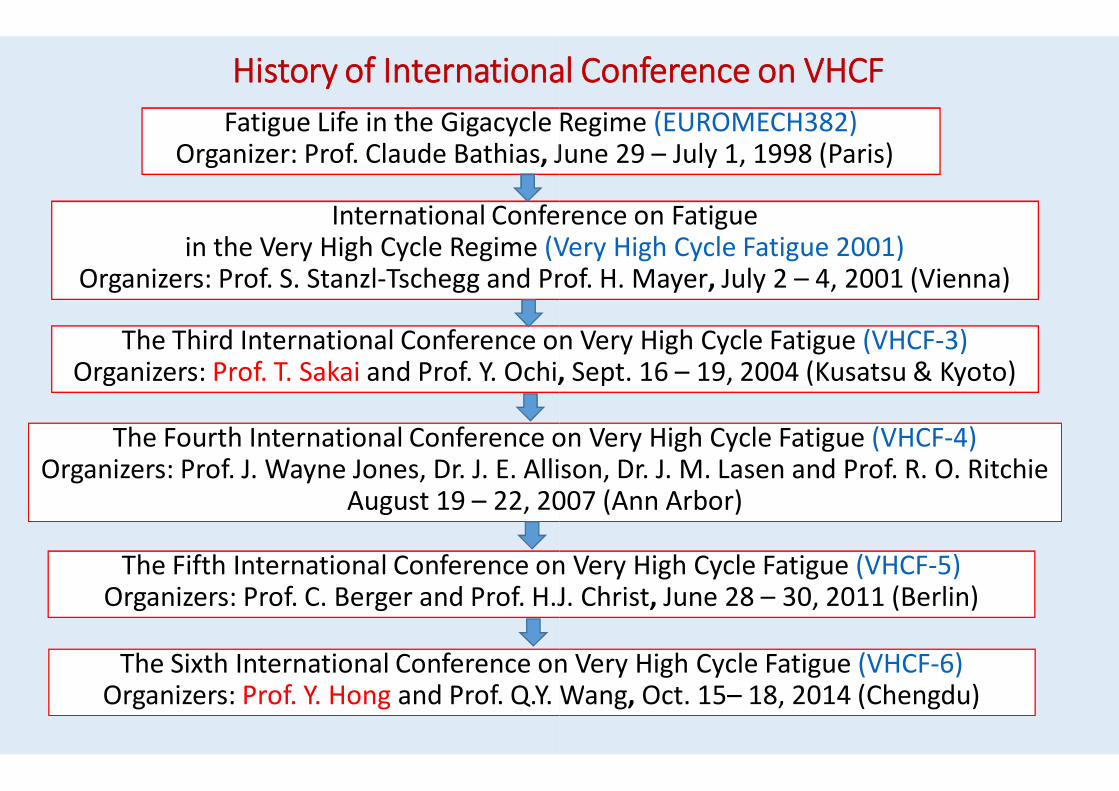
History of International Conference on VHCFFatigue Life in the Gigacycle Regime
Organizer: Prof. Claude Bathias, June
International Conference on Fatiguein the Very High Cycle Regime (Very High Cycle Fatigue 2001)
Organizers: Prof. S. Stanzl-Tschegg and Prof. H.
The Third International Conference on Organizers: Prof. T. Sakai and Prof. Y. Ochi,
The Fourth International Conference on Organizers: Prof. J. Wayne Jones, Dr. J. E. Allison,
August 19 – 22, 2007 (Ann Arbor)
The Fifth International Conference on Organizers: Prof. C. Berger and Prof. H.J. Christ
The Sixth International Conference on Organizers: Prof. Y. Hong and Prof. Q.Y. W
History of International Conference on VHCFRegime (EUROMECH382)June 29 – July 1, 1998 (Paris)
International Conference on Fatigue(Very High Cycle Fatigue 2001)
and Prof. H. Mayer, July 2 – 4, 2001 (Vienna)
on Very High Cycle Fatigue (VHCF-3), Sept. 16 – 19, 2004 (Kusatsu & Kyoto)
on Very High Cycle Fatigue (VHCF-4)Organizers: Prof. J. Wayne Jones, Dr. J. E. Allison, Dr. J. M. Lasen and Prof. R. O. Ritchie
22, 2007 (Ann Arbor)
on Very High Cycle Fatigue (VHCF-5)H.J. Christ, June 28 – 30, 2011 (Berlin)
on Very High Cycle Fatigue (VHCF-6)Wang, Oct. 15– 18, 2014 (Chengdu)

Sakai T. et al., Experimental reconfirmation of characteristic S-N propertycarbon chromium bearing steel in wide life region in rotating bending, J Soc
Vol.49, No.7, (2000), pp.779-785
Typical Example of Duplex S-N Property in Rotating Bending
property for highSoc Mat Sci
Property in Rotating Bending
(b) Fracture surface with fish-eye(σ=1300MPa, N =2663500)
(a)Fracture surface of surface inducedfracture (σ=1600MPa, N =2731)

Some Examples of S-N Characteristics in Axial Loading
Case 1: S-N diagram of SUJ2 steel in axialloading 17)
103 104 105 106 107 108 109500
1000
1500
2000
Stre
ss a
mpl
itude
σa ,
MPa
Number of cycles to failure Nf
Surface induced fractureFish-eye(contact)Fish-eye(inside)
Sakai T. et al., Fatigue Fract. Engng. Mater. Struct., Vol.25, (2002), pp.765-773.
Characteristics in Axial Loading
103 104 105 106 107 108 109 1010500
1000
1500
Number of cycles to failure Nf
Stre
ss a
mpl
itude
σa ,
MPa
2
Surface induced fracture Interior induced fracture
Case 2 : S-N diagram of SUJ2 steel in axialloading 7)
Sakai, T., Journal of Solid Mechanics and Materials Engineering, Vol.3, No.3, (2009), pp.425-439.

Duplex S-N Property
In very high cycle regime, we often find the consisting of S-N curves for surfaceinclusion-induced fracture.
Stre
ss
Fatigue life N
Surface-induced fracture
Interior inclusioninduced fracture
Property
In very high cycle regime, we often find the duplex S-N propertycurves for surface-induced fracture and interior
N
induced fracture
Interior inclusion-induced fracture
Conventional mechanism
What mechanism?

(a) Fracture surface with fish-eye(σ=1300MPa, N =2.66×10⁶)
SEM Observations of Fracture Surfacesin Interior Inclusion-induced Fracture
Sakai T. et al., Experimental reconfirmation of characteristicin wide life region in rotating bending, J Soc Mat Sci Jpn, Vol
(b) FGA around inclusion at the centerof fish-eye in (a)
SEM Observations of Fracture Surfacesinduced Fracture in Rotating Bending (SUJ2)
characteristic S-N property for high carbon chromium bearing steelVol.49, No.7, (2000), pp.779-785.

(a) Fracture surface with fish-eye(σ=1100MPa, N =8.01×10⁷)
(a) Fracture surface with fish-eye(σ=1100MPa, N =6.60×10⁷)
ConventionalBearing Steel
High PurityBearing Steel
Fracture Surfaces at the Crack Initiation Site
Oguma, N. et al., Long life fatigue fracture induced by interior inclusions for high carbon chromium bearing steels, Journal of ASTM International, Vol.7, No.9, (2010), pp.1
(b) FGA around inclusion at the centerof fish-eye in (a)
(b) FGA around inclusion at the centerof fish-eye in (a)
Fracture Surfaces at the Crack Initiation Site
life fatigue fracture induced by interior inclusions for high carbon chromium bearing (2010), pp.1-9.

Some Examples of Fracture Surfaces in Axial Loading
(a) Example of surface induced fracture
Sakai, T. et al., (2002): Characteristic S-N properties high-carbon-chromium-bearing steel under axial loading in long life fatigue, Fat Fract Engng Mater Struct, Vol.25, pp.765-773.
Some Examples of Fracture Surfaces in Axial Loading
(b) Example of interior inclusion induced fracture
(c) FGA around inclusion at the center of fish-eye in (b)
bearing steel under axial loading in long life
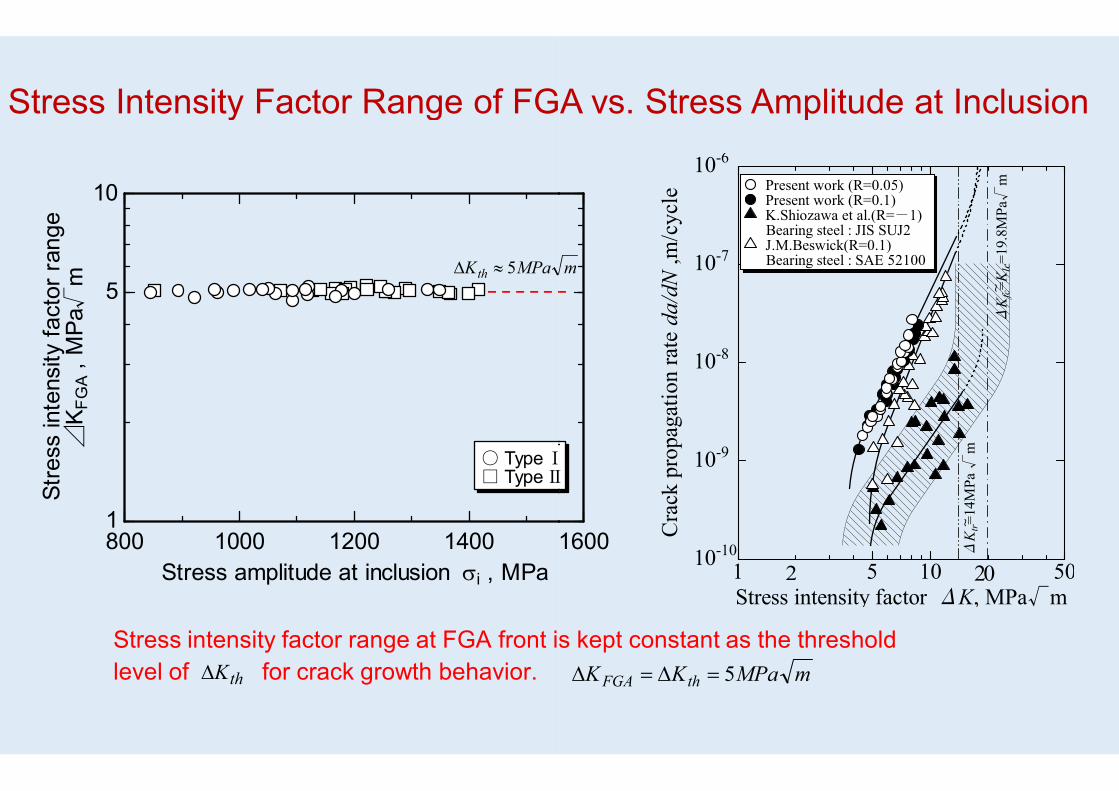
Stress Intensity Factor Range of FGA vs. Stress Amplitude at Inclusion
800 1000 1200 1400 16001
5
10
○ TypeⅠ□ TypeⅡ
Stress amplitude at inclusion i , MPa
Stre
ss in
tens
ity fa
ctor
rang
e⊿
K FG
A , M
Pa√
m MPaKth 5
Stress intensity factor range at FGA front is kept constant as the threshold level of for crack growth behavior.thK
Stress Intensity Factor Range of FGA vs. Stress Amplitude at Inclusion
1600
ⅠⅡ
m
Stress intensity factor range at FGA front is kept constant as the threshold mMPaKK thFGA 5
~
~
2 201 5 10 5010-10
10-9
10-8
10-7
10-6
Cra
ck p
ropa
gatio
n ra
te d
a/dN
,m/c
ycle
Stress intensity factor ΔK, MPa√m
Present work (R=0.05)Present work (R=0.1)K.Shiozawa et al.(R=-1)
Bearing steel : JIS SUJ2J.M.Beswick(R=0.1)
Bearing steel : SAE 52100
ΔK t
r=14
MPa
√m
ΔK f
c=K I
c=19
.8M
Pa√
m

Fine Granular Area(FGA) around the Inclusion at the Crack Initiation Site
Fig.6 Example of FE-SEM image of FGA on fracture surface.
Fine Granular Area(FGA) around the Inclusion at the Crack Initiation Site
SEM image of FGA on fracture surface.
①
②
10μm

Microstructures observed by SIM
Fig.7 SIM image of longitudinal section of fracture surface.
(a) Inside FGA:part① in Fig.6
1μm
Microstructures observed by SIM
image of longitudinal section of fracture surface.
(b) Outside FGA:part② in Fig.6
1μm

500nm
C
Microstructure beneath the Fracture and X-ray Diffraction Patterns
Oguma, N.; Harada, H.; Sakai, T., Mechanism inclusion for bearing steel, J Soc Mat Sci Jpn
500nm
D
Microstructure beneath the Fracture Surface in FGAray Diffraction Patterns
., Mechanism of long life fatigue fracture induced by interior Jpn, Vol.52, No.11, (2003), pp.1292-1297.

A pair of mating fracture surfaces around the FGA
SIM observations of cross sections beneath the FGA
Fine Granular Layer on only One Side of Fracture Surface
A pair of mating fracture surfaces around the FGA
SIM observations of cross sections beneath the FGA
Fine Granular Layer on only One Side of Fracture Surface

Crack Initiation Mechanisms of interior initiated
Step A:Formation of fine granular layer (Polygonization)
Step B:Microdebondings alongboundaries and theircoalescence
(Formation of FGA)
Step C:A pair of fracture surfacesincluding FGA and inclusion
(Final fracture)
Crack Initiation Mechanisms of interior initiated fracture
Inclusion
Inclusion
FGA
Inclusion
Inclusion

σ b
Statistical Fatigue PropertyProperty [S-N Plots of Whole Data]
Only surface failure mode occurs at high stress levels
Only interior failure mode occurs at low stress levels
Both types of failure modes occur at middle stress levels

σ a
σ a
Modification into Life Distribution Data at Several Stress Levels

P-S-N Curves for the Respective Failure Modes
σ a
1 expF N N c b
Curves for the Respective Failure Modes
1 exp /aF N N c b

P-S-N Curves Analyzed by Mixed
σ a
F
Mixed-mode Weibull DistributionT. Sakai, B. Lian, M. Takeda, K. Shiozawa, N. Oguma, Y. Ochi, M. Nakajima, T. Nakamura, of High Carbon Chromium Bearing Steel in Rotating Bending in Very High Cycle Regime", (2010), pp.497-504.
Curves Analyzed by Mixed-mode Weibull Distribution
s s f fF N p F N p F N
F
a
s bcNF exp1
a
f bcNF exp1
:sp
:fp
Occurrence probabilityof surface fracture
Occurrence probabilityof fish-eye fracture
1 fs pp
mode Weibull Distribution, M. Takeda, K. Shiozawa, N. Oguma, Y. Ochi, M. Nakajima, T. Nakamura, "Statistical Duplex S-N Characteristics
of High Carbon Chromium Bearing Steel in Rotating Bending in Very High Cycle Regime", International Journal of Fatigue, Vol.32,

Concluding Remarks in Part 21. Round robin fatigue tests were performed
several kinds of high-strength steelgigacycle regime in order to clarify the
2. In those high strength steels, duplexmode and fish-eye mode were clearlyfeature is not so clear in axial loading.
3. Fatigue crack takes place around interiorarea of FGA, and once the stressreaches ΔKth, the crack tends to grow
4. Fatigue life distributions at middle stresscan be analyzed by using the mixed-modefatigue property can be effectively analyzed
5. The long-life design of the mechanicalto realize the sustainable society. Thus,property of metallic materials in the very
Concluding Remarks in Part 2performed by using common specimens forsteel (SUJ2, SCM435 and SNCM439) inthe VHCF properties.
duplex S-N characteristics for surface fractureclearly observed in rotating bending, but the
interior inclusion forming the characteristicintensity factor range at the FGA frontfollowing the Paris’ law.
stress levels appearing both fracture modesmode Weibull distribution. Thus, statistical
analyzed by using this method.
mechanical structures provides us a key technologyThus, it is important to clarify the fatiguevery high cycle region.

[ Part 3Estimation of the S
only tensile ◇ Relationships between fatigue limit and
mechanical properties◇ Statistical estimation of
strength◇ Physical model to estimate the S
tensile strengthAs a new prospect, my research group has been workinga special subject. Can we estimate the tensile strength? Estimation of the tensile strength is introduced as
[ Part 3 ] S-N property from
tensile strengthbetween fatigue limit and static
Statistical estimation of S-N curve from tensile
Physical model to estimate the S-N curve from
a new prospect, my research group has been workinga special subject. Can we estimate the S-N curve from thetensile strength? Estimation of the S-N property from onlytensile strength is introduced as Part 3

Review of Conventional Researches in Relative Subjects
Fatigue limit is given by a half of tensile strength as
(1)Bw 21
Researches in Relative Subjects
Fatigue limit is given from hardness as follows;
(2)HVw 6.1

Analytical Results of S-N curves in the Previous study
Based on the correlation between parameters and tensile strength,curve itself can be estimated from the tensile strength of the material.Why can we analyze the S-N property from only the tensile strength
10log f f wA N B N N E N N ,
curves in the Previous study
and tensile strength, S-N curve itself can be estimated from the tensile strength of the material.
property from only the tensile strength?
w fE N N Estimation procedure1) σB → E2) σB → B3) B → A

Physical Modelof Fatigue Property Combined
with Static Properties
Physical Modelof Fatigue Property Combined
with Static Properties

Static Stress-Strain Curve and
Fatigue life at σ1 → N1 ; Fatigue Fatigue strength at N=1 is supposed to correspond to the tensile strength, but the loading rate is significantly differ from each other.
1
Curve and S-N curve in Cyclic Loadings
Fatigue life at σ2 → N2=1 is supposed to correspond to the tensile
, but the loading rate is significantly differ from each other.

Loading Rate Dependence of Static StrengthLoading Rate Dependence of Static Strength
Stress pattern in the cyclic loadings is illustrated in Fig.5(a), and the stress patternreplaced by the triangle loading patternshown in Fig.5(b).Based on such a replacement of the stresspattern, the stress rate of the cyclic loadingis given by
However, the loading rate(stress rate) in the usual tensile test is very low as supposed to be almost zero.
TTr aa
42/
2
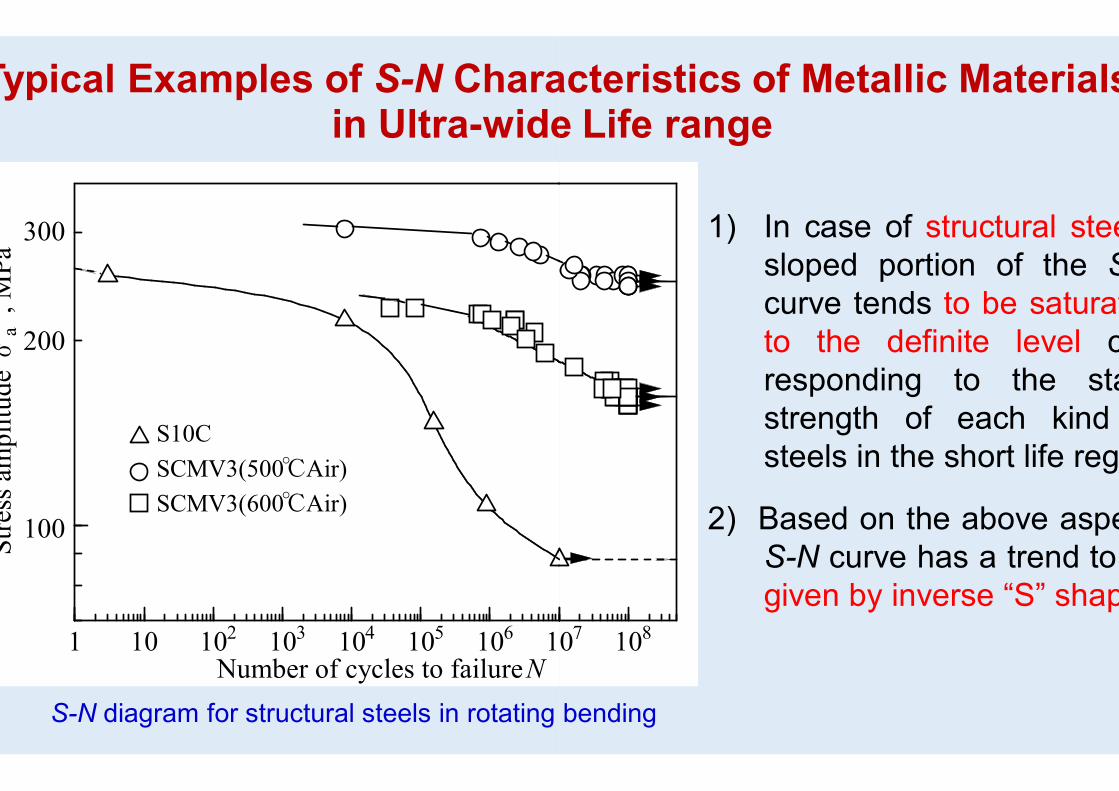
Typical Examples of S-N Characteristics of Metallic Materials in Ultra-wide Life range
1 10 102 103 104 105 106 10Number of cycles to failureN
Stre
ss a
mpl
itude
σa
, MPa
100
200
300
S10CSCMV3(500℃Air)SCMV3(600℃Air)
S-N diagram for structural steels in rotating bending
Characteristics of Metallic Materials wide Life range
107 108
1) In case of structural steelssloped portion of the Scurve tends to be saturatedto the definite level corresponding to the staticstrength of each kindsteels in the short life region
2) Based on the above aspect,S-N curve has a trend togiven by inverse “S” shape
diagram for structural steels in rotating bending

1 10 102 103 104 105 106 107 108 10500
10001500200025003000350040004500
Number of cycles to failure N
Stre
ss σ
a M
Pa
Crack initiation siteSurface-slipFish-eye
In airf=3150rpmRotating bending fatigue R=-1
Fatigue Characteristics
S-N diagram for bearing steel(SUJ2) in rotating bending
sometimes increasesin rotating bending
109 1010
Crack initiation siteSurface-slip
1) Tensile strength:σB = 2316 MPa
2) Elongation:δ=1.32 %
3) In case of brittle materialssloped portion of the S-curve tends to appearstraightforwardly in the shortlife region.
4) In case of rotating bending,fatigue strength in short liferegion tend to be higher thanthe tensile strength.
of High Strength Steel
diagram for bearing steel(SUJ2) in rotating bending

Extrapolation of S-N Curve for Carbon Steelinto Ultra-short Life Region (No.1)
1) Fatigue test data and S-N curve forS45C steel in conventional life regionare plotted here.
2) If the tensile strength is plotted at theordinate, sloped portion of the S-Ncurve tends to saturate as indicatedby black dashed line in the short liferegion.
3) The tensile strength at the stress ratein cyclic loadings would be muchhigher than the value in the usualtensile test.
4) If tensile strength at the higher stressrate is plotted at the ordinate, the S-Ncurve would appear linearly.
Curve for Carbon Steel

Extrapolation of S-N Curve for Carbon Steel into Ultra-short Life Region (No.2)
1) This is another example of the S-N propertyanalyzed for a low carbon steel of S15C.
) Sloped portion of the S-N curve tends tosaturate as indicated by black dashed line inthe short life region.
) If tensile strength at the higher stress rateplotted at the ordinate, the S-N curve wouldappear linearly.
) But, the difference of tensile strengths andis small comparing with the result for S45C.
Thus, we have to evaluate the difference betweenand for each kind of steel. In other word,
we know the stress rate dependence of the tensilestrength, S-N curve can be successfully analyzed
103102101100
440
σB=441MPa
200
400
360
Stre
ss a
mpl
itude
(M
Pa)
320
280
240
480
Curve for Carbon Steel
property
toin
iswould
betweenif
tensileanalyzed.

Concluding Remarks in Part 31) According to the survey on the loading
strength, the tensile strength tendsloading rate.
2) In case of structural steels, slopedsaturated to the definite level correspondingthe S-N curve has a trend to give the
3) If we accept the tensile strength atsloped portion of S-N curve can beshort life region. This is the fundamentalS-N curve itself from only the tensile
Future Subjects:1) Select appropriate co-ordinates for the2) The loading rate dependence of the
each kind of structural steels.
Concluding Remarks in Part 3loading rate dependence of the static
to increase with an increase of the
portion of the S-N curve tends to becorresponding to the static strength. Thus,
the inverse “S” shape.
the stress rate in cyclic loadings, thebe extrapolated linearly up to the ultra-
fundamental reason why we can analyze thestrength.
the S-N diagram. [semi-log or log-log]the static strength should be clarified for

Thank Youfor Your Attention
Thank Youfor Your Attention


![Effects of part build orientations on fatigue behaviour of ... · fatigue data. Lee and Huang [8] have investigated the fatigue data for several print orientations of ABS and ABSplus](https://img.pdfslide.net/doc/110x75/5e931ffbab839750302369bf/effects-of-part-build-orientations-on-fatigue-behaviour-of-fatigue-data-lee.jpg)