Embed Size (px)
Citation preview

NUREG- 150Vol. 2
Severe Accident Risks:An Assessment for FiveU.S. Nuclear Power Plants
Appendices A, B, and C
Final Report
U.S. Nuclear Regulatory Commission
Office of Nuclear Regulatory Research

AVAILABILITY NOTICE
Availability of Reference Materials Cited in NRC Publications
Most documents cited in NRC publications will be available from one of the followingsources:
1. The NRC Public Document Room, 2120 L Street, NW, Lower Level, Washington, DC20555
2. The Superintendent of Documents, U.S. Government Printing Office, P.O. Box 37082,Washington, DC 20013-7082
3. The National Technical Information Service, Springfield, VA 22161
Although the listing that follows represents the majority of documents cited in NRC publica-tions, it is not intended to be exhaustive.
Referenced documents available for inspection and copying for a fee from the NRC PublicDocument Room include NRC correspondence and internal NRC memoranda; NRC Office ofInspection and Enforcement bulletins, circulars, information notices, inspection and investi-gation notices; Licensee Event Reports; vendor reports and correspondence; Commissionpapers; and applicant and licensee documents and correspondence.
The following documents in the NUREG series are available for purchase from the GPO SalesProgram: formal NRC staff and contractor reports, NRC-sponsored conference proceed-ings, and NRC booklets and brochures. Also available are Regulatory Guides, NRC regula-tions in the Code of Federal Regulations, and Nuclear Regulatory Commission Issuances.
Documents available from the National Technical Information Service include NUREG seriesreports and technical reports prepared by other federal agencies and reports prepared bythe Atomic Energy Commission, forerunner agency to the Nuclear Regulatory Commission.
Documents available from public and special technical libraries include all open literatureitems, such as books, journal and periodical articles, and transactions. Federal Registernotices, federal and state legislation, and congressional reports can usually be obtainedfrom these libraries.
Documents such as theses, dissertations, foreign reports and translations, and non-NRCconference proceedings are available for purchase from the organization sponsoring thepublication cited.
Single copies of NRC draft reports are available free, to the extent of supply, upon writtenrequest to the Office of Information Resources Management, Distribution Section, U.S.Nuclear Regulatory Commission, Washington, DC 20555.
Copies of industry codes and standards used in a substantive manner in the NRC regulatoryprocess are maintained at the NRC Library, 7920 Norfolk Avenue, Bethesda, Maryland, andare available there for reference use by the public. Codes and standards are usually copy-righted and may be purchased from the originating organization or, if they are AmericanNational Standards, from the American National Standards Institute, 1430 Broadway,New York, NY 10018.

NUREG-1150Vol. 2
Severe Accident Risks:An Assessment for FiveU.S. Nuclear Power Plants
Appendices A, B, and C
Final Report
Manuscript Completed: October 1990Date Published: December 1990
Division of Systems ResearchOffice of Nuclear Regulatory ResearchU.S. Nuclear Regulatory CommissionWashington, DC 20555

ABSTRACT
This report summarizes an assessment of the risksfrom severe accidents in five commercial nuclearpower plants in the United States. These risks aremeasured in a number of ways, including: theestimated frequencies of core damage accidentsfrom internally initiated accidents and externallyinitiated accidents for two of the plants; theperformance of containment structures undersevere accident loadings; the potential magnitudeof radionuclide releases and offsite consequencesof such accidents; and the overall risk (theproduct of accident frequencies and conse-quences). Supporting this summary report are alarge number of reports written under contract toNRC that provide the detailed discussion of themethods used and results obtained in these riskstudies.
This report was first published in February 1987as a draft for public comment. Extensive peerreview and public comment were received. As aresult, both the underlying technical analyses and
the report itself were substantially changed. Asecond version of the report was published in June1989 as a draft for peer review. Two peer reviewsof the second version were performed. One wassponsored by NRC; its results are published as theNRC report NUREG-1420. A second wassponsored by the American Nuclear Society(ANS); its report has also been completed and isavailable from the ANS. The comments by bothgroups were generally positive and recommendedthat a final version of the report be published assoon as practical and without performing anymajor reanalysis. With this direction, the NRCproceeded to generate this final version of thereport.
Volume 2 of this report contains three appendi-ces, providing greater detail on the methods used,an example risk calculation, and more detaileddiscussion of particular technical issues found im-portant in the risk studies.
iii NUREG-1 150

CONTENTS
Page
APPENDIX A-RISK ANALYSIS METHODS
A 1 Introduction and Overview .................................................. A-1
A. 1.1 Introduction ...................................................... A-1A.1.2 Overview of Risk Analysis Process ................................... A-1
A.2 Accident Frequency Analysis Methods ......................................... A-6
A.2.1 Internal-Event Methods for Surry, Sequoyah, Peach Bottom, and Grand Gulf A-6A.2.2 Internal-Event Methods for Zion .A- 12A.2.3 External-Event Methods for Surry and Peach Bottom .A-16A.2.4 Products of Accident Frequency Analysis .A-20
A.3 Accident Progression, Containment Loadings, and Structural Response Analysis .A-22
A.3.1 Introduction .A-22A. 3.2 Development of Accident Progression Event Trees .A-24A.3.3 Structural Analyses .A-27A.3.4 Probabilistic Quantification of APETs .A-27A.3.5 Grouping of Event Tree Outcomes .A-27A.3.6 Products of Accident Progression Analysis .A-27
A.4 Radioactive Material Transport (Source Term) Analysis .A-28
A.4.1 Introduction .A-28A.4.2 Development of Parametric Models .A-28A.4.3 Development of Values or Probability Distributions .A-33A.4.4 Grouping of Radioactive Releases .A-33A.4.5 Products of Source Term Analysis .A-33
A.5 Offsite Consequence Analysis .A-33
A.5.1 Introduction .A-33A.5.2 Assessment of Pre-Accident Inventories .A-36A.5.3 Transport, Dispersion, and Deposition of Radioactive Material .A-37A.5.4 Calculation of Doses .A-37A.5.5 Mitigation of Doses by Emergency Response Actions .A-37A.5.6 Health Effects Modeling .A-38A.5.7 Products of Offsite Consequence Analysis .A-39
A.6 Characterization and Combination of Uncertainties .A-39
A.7 Elicitation of Experts .A-43
A.8 Calculation of Risk .A-45
A.8.1 Methods for Calculation of RiK .A-45A.8.2 Products of Risk Calculation .A-47
A.9 Additional Explanation of Some Figures, Tables, and Terms . .A-48
A.9.1 Additional Explanation of Some Figures and Tables .A-48A.9.2 Explanation of Some Terms .A-S1
REFERENCES FOR APPENDIX A ........ ............... ......................... A-53
v NUREG- 1150

Page
APPENDIX B-AN EXAMPLE RISK CALCULATION
B.1 Introduction .............................................................. B-1
B.2 Accident Frequency Analysis ................................................ B-1
B.2.1 Overview of Accident Frequency Analysis .............................. B-1B.2.2 Description of Accident Sequence .................................... B-7B.2.3 Quantification of Cut Set ........................................... B-8B.2.4 Accident Sequence and PDS ........................................ B-9
B.3 Accident Progression Analysis ............................................... B-10
B.3.1 Introduction ............. ................................. ...... B-10B.3.2 Discussion of APET Questions ....................................... B-16B.3.3 Quantification of APET Questions by Expert Judgment ..... .............. B-22B.3.4 Binning Results of APET ........................................... B-35
B.4 Source Term Analysis .......... ................................. ......... B-38
B.4.1 Equation for Release Fraction for Iodine .............................. B-39B.4.2 Discussion of Source Term Factors ................................... B-41B.4.3 Quantification of Source Term Factors by Experts ....................... B-44B.4.4 Releases for All Fission Products ..................................... B-53
B.5 Partitioning of Source Terms ................................................ B-53
B.5.1 Introduction ............ .......................................... B-53B.5.2 Effects Weights . ................................................ B-54B.5.3 Partitioning Process and Results ...................................... B-58
B.6 Consequence Calculation ........................ ........................... B-60
B.6.1 Description of Consequence Calculation ............................... B-60B.6.2 Results of Consequence Calculation ................................... B-61
B.7 Computation of Risk .............. B-63
B.7.1 Introduction ............. ......................................... B-63B.7.2 Calculation and Display of Mean Risk ................................. B-63B.7.3 Calculation and Display of CCDFs .................................... B-66
B.8 Summary . ................................................................ B-70
REFERENCES FOR APPENDIX B .B-72
APPENDIX C-ISSUES IMPORTANT TO QUANTIFICATION OF RISK
C. 1 Introduction . .............................................................. C-1
C. 1.1 Description of Table C. 1.1; Variables Sampled in Accident FrequencyAnalysis . ........................................................ C-3
C. 1.2 Description of Table C.1.2; Questions in Surry APET .................... C-7C.1.3 Description of Table C.1.3; Variables Sampled in Source Term Analysis ..... C-12
REFERENCES FOR SECTION C. I.C-13
vi

C.2 Common-Cause and Dependent Failures ................
C.2.1 Issue Definition ..............................C.2.2 Technical Bases for Issue Quantification ..........
.................
.................
.................
Page
C-15
C-15C-16C-18C.2.3 Treatment in PRA and Results .......................................
REFERENCES FOR SECTION C.2 .................................
C.3 Human Reliability Analysis .......................... .
C.3.1 Issue Definition ......................................C.3.2 Technical Bases for Issue Quantification ..................C.3.3 Treatment in PRA and Results ..........................
REFERENCES FOR SECTION C.3 .................................
C.4 Hydrogen Combustion Prior to Reactor Vessel Breach ............
C.4.1 Issue Definition ......................................C.4.2 Technical Bases for. Issue Quantification ..................C.4.3 Treatment in PRA and Results ..........................
REFERENCES FOR SECTION CA .................................
C.5 PWR Containment Loads During High-Pressure Melt Ejection.
...........
...........
...........
...........
...........
......
...... I ....
...........
...........
...........
C.5.1 Issue Definition ...................................................C.5.2 Technical Bases for Issue Quantification ...............................C.5.3 Treatment in PRA and Results .......................................C.5.4 Differences in Treatment of HPME and DCH Between First and
Second Drafts of NUREG-1150 ......................................
REFERENCES FOR SECTION C.5 ................................................
C.6 Mechanisms for PWR Reactor Vessel Depressurization Prior to Vessel Breach.
C.6.1 Issue Definition ..................................................C.6.2 Technical Bases for Issue Quantification ...............................C.6.3 Treatment in PRA and Results ......................................
REFERENCES FOR SECTION C.6 ................................................
C.7 Drywell Shell Meltthrough ..................................................
C.7.1 Issue Definition ...................................................C.7.2 Technical Bases for Issue Quantification ...............................C.7.3 Treatment in PRA and Results .......................................
REFERENCES FOR SECTION C.7 ................................................
C.8 Containment Strength Under Static Pressure Loads ..............................
C.8.1 Issue Definition ...................................................C.8.2 Technical Bases for Issue Quantification ...............................C.8.3 Treatment in PRA and Results .......................................
C-20
C-21
C-21C-21C-22
C-23
C-24
C-25C-27C-33
C-41
C-42
C-43C-49C-57
C-61
C-62
C-64
C-64C-65C-69
C-71
C-73
C-73C-76C-80
C-81
C-83
C-83C-84C-89
vii NUREG-l 150

Page
REFERENCES FOR SECTION C.8 ................................................ C-92
C.9 Containment Failure as a Result of Steam Explosions ............................ C-94
C.9.1 Issue Definition ................................................... C-94C.9.2 Technical Bases for Issue Quantification ............................... C-96C.9.3 Treatment in PRA and Results ....................................... C-99
REFERENCES FOR SECTION C.9 ................................................ C-101
C.10 Source Term Phenomena ................................................... C-102
C.10.1 Issue Definition ................................................... C-102C.10.2Technical Bases for Issue Quantification ............................... C-103C.10.3 Treatment in PRA and Results ....................................... C-103
REFERENCES FOR SECTION C.10 ............................................... C- 110
C.11 Analysis of Seismic Issues ................................................... C-1ll
C.11.1 Issue Definition ................................................... C-111C.11.2 Treatment in PRA and Results ...................................... C-121
REFERENCES FOR SECTION C.1 1 ...................... ......................... C-126
C.12 Analysis of Fire Issue ...................................................... C-128
C. 12.1 Analysis Procedure for NUREG-1150 Fire Analysis ..................... C-128C.12.2 PRA Results ..................................................... C-128C.12.3 Issue Definition and Discussion ...................................... C-130
REFERENCES FOR SECTION C.12 ............................................... C-133
C.13 Containment Bypass Sequences .............................................. C-134
C.13.1 ISLOCAs-Accident Sequence Issues ................................. C-134C.13.2 ISLOCAs-Source Term Issues ...................................... C-135C. 13.3 SGTRs-Accident Sequence Issues ................................... C-137C. 13.4 SGTRs-Source Term Issues ........................................ C-139
REFERENCES FOR SECTION C. 13 ............................................... C-141
C. 14 Reactor Coolant Pump Seal Failures in Westinghouse Plants After Loss of AllSeal Cooling .............................................................. C-142
C.14.1 Issue Definition ................................................... C-142C. 14.2 Technical Bases for Issue Quantification .............................. C-142C.14.3 Treatment in PRA and Results ...................................... C-144
REFERENCES FOR SECTION C.14 ............................................... C-151
C.15 Zion Service Water and Component Cooling Water Upgrade ...................... C-152
C.15.1 Issue Definition ..................................................... C-152C.15.2 Issue Analysis ...................................................... C-152
viii

Page
C.15.3 Issue Quantification and Results ....................................... C-153C.15.4 Impact of Issues on Risk ............................................. C-153
REFERENCES FOR SECTION C.15 ............................................... C-154
FIGURES
PageA. 1 Principal steps in NUREG-1150 risk analysis process ........................... A-2A.2 Interfaces between risk analysis steps ........................................ A-3A.3 Models used in calculation of risk .......................................... A-7A.4 Steps in accident frequency analysis of Surry, Sequoyah, Peach Bottom, and
Grand Gulf ............................................................. A-8A.5 Zion Probabilistic Safety Study master logic diagram ........................... A-13A.6 Example display of core damage frequency distribution . ........................ A-21A.7 Example display of mean plant damage state frequencies ........................ A-23A.8 Schematic of accident progression event tree ........................ I I...... . A-26A.9 Example display of early containment failure probability distribution .... .......... A-29A.10 Example display of mean accident progression bin conditional probabilities ......... A-30A. 11 Simplified schematic of source term (XSOR) algorithm . ........................ A-32A. 12 Example display of radioactive release distributions for selected accident
progression bin .......................................................... A-34A. 13 Example display of source term complementary cumulative distribution function .... A-35A. 14 Example display of offsite consequences complementary cumulative distribution
function . ............................................................... A-40A. 15 Principal steps in expert elicitation process . .................................. A-44A.16 Matrix formulation of risk analysis calculation ................................ A-46A. 17 Example display of relative contributions to mean risk .......................... A-49A.18 Probability that f(PDS) will fall in intervalI . ................................. A-50
B. Event tree for TIS-SBO at Surry Unit 1 ...................................... B-4B.2 Reduced fault tree for DG 1 at Surry Unit 1 ... ............................. B-B.3 Reduced fault tree for AFWS at Surry Unit 1 ................................ B-6B.4 Simplified diagram of first part of Surry accident progression event tree. .......... B-13B.5 Event tree used by all three experts in determining the probabilities of different
leak rates for a single reactor coolant pump .B-24B.6 First part of the event tree used by Expert A in determining the probabilities of
different leak rates for all three reactor coolant pumps .B-25B.7 Second part of the event tree used by Expert A in determining the probabilities of
different leak rates for all three reactor coolant pumps . ........................ B-26B.8 Results of expert elicitation for pressure rise at vessel breach for Surry . ........... B-32B.9 Simplified schematic of Surry containment ..... ............................ 13-33B. 10 Results of expert elicitation for static failure pressure of Surry containment ......... B-36B.11 Results of expert elicitation for FCOR, fraction of the fission products released
from core to vessel for the nine radionuclide groups. B-46
ix x NUREG-1 150

Page
B. 12 Results of expert elicitation for FCOR, fraction of fission products released fromcore to vessel for the nine radionuclide groups . ............................... B-47
B.13 Results of expert elicitation for FCONV, fraction of fission products in containmentfrom RCS release that is released to environment .B-50
B. 14 Distributions for late release of iodine from containment in volatile form .B-52B.15 Relationship between I-131 release and mean early fatalities used in determining
early effects weights for partitioning ...................................... B-56B. 16 Distribution of latent cancer fatalities computed for STG SUR-49 .B-62B. 17 Distribution of expected (weather-averaged) latent cancer fatality risk for Surry. B-65B.18 CCDFs for latent cancer fatalities for STG SUR-49 and for all 52 STs .B-67B. 19 Computed curves showing four statistical measures of 200 CCDFs for Surry for early
fatalities and latent cancer fatalities ...................................... B-69
C.1.1 Example of NUREG-1150 "issue decomposition" .C-2
C.4.1 Cross section of Sequoyah containment .C-28C.4.2 Cross section of Grand Gulf containment .C-30C.4.3 Ignition frequency as a function of initial hydrogen concentration in the Grand
Gulf containment building (outer containment-wetwell region for accidentprogressions in which the RPV is at high pressure). .C-31
C.4.4 Ignition frequency for various regions of the Sequoyah containment-illustratedfor an assumed initial hydrogen concentration between 5.5 and 11 volume percent . . C-32
C.4.5 Range of Grand Gulf containment loads in comparison with important structuralpressure capacities (various initial hydrogen concentrations and high initial steamconcentrations) .C-34
C.4.6 Range of Grand Gulf containment loads in comparison with important structuralpressure capacities (various initial hydrogen concentrations and low initial steamconcentrations) .C-35
C.4.7 Range of Sequoyah containment loads from hydrogen combustion in comparisonwith containment pressure capacity (fast station blackout scenarios with variouslevels of in-vessel cladding oxidation) .C-36
C.4.8 Range of Sequoyah containment loads from hydrogen combustion in comparisonwith containment pressure capacity (slow station blackout accidents with inducedreactor coolant pump seal LOCA and various levels of in-vessel cladding oxidation) C-37
C.4.9 Frequency of hydrogen detonations in Grand Gulf containment (probability of adetonation per combustion event-i.e., given ignition). H and L refer to highand low steam concentrations, respectively .C-38
C.4.10 Frequency of hydrogen detonations in Sequoyah ice condenser or upper plenum(probability of a detonation per combustion event) .C-39
C.5.1 Cross section of Surry Unit 1 containment .C-44C.5.2 Cross section of Zion Unit 1 containment .C-45C.5.3 Calculated containment peak pressure as a function of molten mass ejected
(Ref. C.S.8) .C-48C.S.4 Example display of distributions for containment loads at vessel breach versus
static failure pressure .C-50C.5.5 Surry containment loads at vessel breach; cases involving vessel breach at high
pressure with containment sprays operating (wet cavity) .C-52C.5.6 Surry containment loads at vessel breach; cases involving vessel breach at high
pressure without containment sprays operating (dry cavity) .C-53
x
Page
C.5.7 Surry containment load distributions generated by composite of individual expertsfor each of the cases shown in Figure C.5.5 ................................. C-54
C.5.8 Zion containment loads at vessel breach, cases involving vessel breach at highpressure with containment sprays operating (wet cavity) .C-55
C.5.9 Zion containment loads at vessel breach; cases involving vessel breach at highpressure without containment sprays operating (dry cavity) .C-5 6
C.5.10 Sequoyah containment loads at vessel breach; cases involving vessel breach athigh pressure with containment sprays operating (wet cavity) and a substantialinventory of ice remaining .C-58
C.5.11 Sequoyah containment loads at vessel breach; cases involving vessel breach athigh pressure without containment sprays operating (dry cavity) and a substantialinventory of ice remaining .C-59
C.5.12 Sequoyah containment loads at vessel breach; cases involving vessel breach athigh pressure without containment sprays operating (dry cavity) and a negligiblysmall inventory of ice remaining. ...................................... C-60
C.6.1 Aggregate distribution for frequency of temperature-induced hot leg failure (Surry,Zion, and Sequoyah) .................................................... C-67
C.6.2 Aggregate distributions for frequency of temperature-induced steam generatortube rupture ..................................................... C-68
C.7.1 Configuration of Peach Bottom drywell shell/floor-vertical cross section .... ....... C-74C.7.2 Configuration of Peach Bottom drywell shell/floor-horizontal cross section .... ..... C-75C.7.3 Aggregate cumulative conditional probability distributions for Peach Bottom drywell
shell meltthrough . ........................................................ C-78C.7.4 Cumulative probability distributions composite of individuals on expert panel for
this issue. (Six panelists (6 curves) are shown for each of four cases.) .... ........ C-79
C.8.1 Containment failure pressure .............................................. C-86
C.9.1 Frequency of alpha-mode failure conditional upon core damage .... ............. C-100
C.10.1 In-vessel release distribution, PWR case with low cladding oxidation .... .......... C-105C. 10.2 RCS transmission fraction, PWR case at system setpoint pressure .... ............. C-106C. 10.3 RCS transmission fraction, PWR case with low system pressure ..... ............. C-107C. 10.4 Revaporization release fraction for iodine, PWR case with two holes .... .......... C-109
C. 11.1 Model of seismic hazard analysis ........................................... C-112C.11.2 LLNL hazard curves for Peach Bottom site .................................. C-114C. 11.3 10000-year return period uniform hazard spectra for Peach Bottom site .... ....... C-115C. 11.4 Example of logic-tree format used to represent uncertainty in hazard analysis
input (EPRI program) ........... ......................................... C- 16C. 11.5 EPRI hazard curves for Peach Bottom site ................................... C-117C. 11.6 Surry external events, core damage frequency ranges (5th and 95th percentiles) .... C-119C.11.7 Peach Bottom external events, core damage frequency ranges (5th and 95th
percentiles) . ............................................................ C-120C. 11.8 Contribution from different earthquake ranges at Peach Bottom ..... ............. C-125C. 11.9 Mean plant level fragilities ................................................ C-126
xi NUREG-1 150

Page
C. 14.1 Westinghouse RCP seal assembly (Ref. C. 14.1) ............................... C-143C. 14.2 Decision tree (Ref. C. 14.1) .C-144
TABLES
A. 1 Issues considered by expert panels .A-4 1B. 1 Most likely cut set in Surry sequence Ti S-QS-L quantification for observation 4. B-3B.2 Selected questions in Surry APET .B-iB.3 Aggregate results for RCP seal failure with existing o-ring material .B-28B.4 Isotopes in each radionuclide release class .B-39B.5 Partitioning parameters and results .B-55B.6 Properties of source term 17, subgroup 1 .................................... B-60
C. 1.1 Variables sampled in accident frequency analysis for internal initiators .C-3C. 1.2 Questions in Surry APET .C-9C. 1.3 Variables sampled in source term analysis. C- 12
C.2.1 Beta factor analysis for pumps-based on Fleming data .C-17C.2.2 Beta factor analysis for valves-based on Fleming data .C-17C.2.3 Beta factor models from EPRI NP-3967 .C-19C.2.4 Risk-reduction measures for selected common-cause events in Surry and
Peach Bottom analysis .C-19C.2.5 Results of sensitivity study in which common-cause failures were eliminated from
fault trees .C-20
C.3.1 Representative ranges of human error uncertainties (taken from Grand Gulfanalysis) .C-22
C.3.2 Core damage frequencies with and without human errors .C-23
C.5.1 Mean conditional probability of containment failure for three PWRs .C-61
C.6.1 Surry reactor vessel pressure at time of core uncovery and at vessel breach .C-70C.6.2 Surry reactor vessel pressure at time of core uncovery and at vessel breach
(sensitivity study without induced hot leg failure and steam generator tube ruptures) . C-70C.6.3 Fraction of Surry slow blackout accident progressions that results in various modes
of containment failure (mean values) .C-71C. 6.4 Fraction of Sequoyah accident progressions that results in HPME and containment
overpressure failure .C-71
C.7.1 Probability of drywell shell meltthrough (conditional on a core damage accident ofvarious types) .C-8 I
C.8.1 Containment strength under static pressure loads: summary information .C-9 1
C.10.1 APS recommendations for source term research (Ref. C.10.3) .. C-102
xii

Page
C.10.2 Source term issues ....................................................... C-104
C.11.1 Seismic core damage and release frequencies from published probabilistic riskassessments .............. .............................................. C-112
C. 11.2 Core damage frequencies ................................................. C-122C.11.3 Comparison of contributions of modeling uncertainty in response, fragility, and
hazard curves to core damage frequency ..................................... C-123C.11.4 Dominant sequences at Peach Bottom ............ I .......................... C-124
C. 12.1 Dominant Surry fire area core damage frequency contributors (core damagefrequencylyr) (Ref. C. 12.7) ............................................... C-129
C. 12.2 Dominant Peach Bottom fire area core damage frequency contributors (coredamage frequency/yr) (Ref. C. 12.8) .. . ...................................... C-129
C. 12.3 Dominant Surry accident sequence core damage frequency contributors(Ref. C.12.7) .............. ............................................. C-131
C. 12.4 Dominant Peach Bottom accident sequence core damage frequency contributors(Ref. C.12.8) .............. ............................................. C-131
C. 13.1 Secondary side safety valve failure probabilities ............................... C-138
C. 14.1 Aggregated RCP seal LOCA probabilities for Westinghouse three-loop plant .... .... C-145C. 14.2 Aggregated RCP seal LOCA probabilities for Westinghouse four-loop plant .... ..... C-146C.14.3 Sequoyah RCP seal LOCA model scenarios .................................. C-148C.14.4 Sequoyah RCP seal LOCA model .......................................... C-150
C. 15.1 Plant damage state comparison ............................................. C-153C.15.2 Comparison of mean risk values ....... ............. ....................... C-154
xiii NUREG-1150

APPENDIX A
RISK ANALYSIS METHODS
CONTENTS
Page
A. I Introduction and Overview ................................................ A-1
A. 1.1 Introduction ...................................................... A-1A.1.2 Overview of Risk Analysis Process .................................... A-1
A.2 Accident Frequency Analysis Methods .................. .. .................. A-6
A.2.1 Internal-Event Methods for Surry, Sequoyah, Peach Bottom, and Grand Gulf A-6A.2.2 Internal-Event Methods for Zion ..................................... A-12A.2.3 External-Event Methods for Surry and Peach Bottom .................... A-16A.2.4 Products of Accident Frequency Analysis .............................. A-20
A.3 Accident Progression, Containment Loadings, and Structural Response Analysis ..... A-22
A.3.1 Introduction ...................................................... A-22A.3.2 Development of Accident Progression Event Trees ....................... A-24A.3.3 Structural Analyses ................................................. A-27A.3.4 Probabilistic Quantification of APETs .................................. A-27A.3.5 Grouping of Event Tree Outcomes .................................... A-27A.3.6 Products of Accident Progression Analysis ............................... A-27
A.4 Radioactive Material Transport (Source Term) Analysis ......................... A-28
A.4.1 Introduction ...................................................... A-28A.4.2 Development of Parametric Models ................................... A-28A.4.3 Development of Values or Probability Distributions ....................... A-33A.4.4 Grouping of Radioactive Releases ..................................... A-33A.4.5 Products of Source Term Analysis .................................... A-33
A.5 Offsite Consequence Analysis .............................................. A-33
A.5.1 Introduction ...................................................... A-33A.5.2 Assessment of Pre-Accident Inventories ................................ A-36A.5.3 Transport, Dispersion, and Deposition of Radioactive Material .... ......... A-37A.5.4 Calculation of Doses ............................................... A-37A.5.5 Mitigation of Doses by Emergency Response Actions ..................... A-37A.S.6 Health Effects Modeling ............................................ A-38A.5.7 Products of Offsite Consequence Analysis ............................... A-39
A.6 Characterization and Combination of Uncertainties ............................ A-39
A.7 Elicitation of Experts ..................................................... A-43
A.8 Calculation of Risk ....................................................... A-45
A.8.1 Methods for Calculation of Risk ...................................... A-45A.8.2 Products of Risk Calculation ......................................... A-47
A.9 Additional Explanation of Some Figures, Tables, and Terms ........ .. .......... A-48
A.9.1 Additional Explanation of Some Figures and Tables ...................... A-48A.9.2 Explanation of Some Terms ......................................... A-51
REFERENCES FOR APPENDIX A ....................... ...................... A-53
iii NUREG-1150

FIGURES
A.1 Principal steps in NUREG-1150 risk analysis process ........................... A-2
A.2 Interfaces between risk analysis steps .... ................................... A-3
A.3 Models used in calculation of risk .......................................... A-7
A.4 Steps in accident frequency analysis of Surry, Sequoyah, Peach Bottom, andGrand Gulf . ........................................................... A-8
A.5 Zion Probabilistic Safety Study master logic diagram ........................... A-13
A.6 Example display of core damage frequency distribution . ........................ A-21
A.7 Example display of mean plant damage state frequencies ........................ A-23
A.8 Schematic of accident progression event tree .................................. A-26
A.9 Example display of early containment failure probability distribution .... .......... A-29
A.10 Example display of mean accident progression bin conditional probabilities .... ..... A-30
A.11 Simplified schematic of source term (XSOR) algorithm . ........................ A-32
A. 12 Example display of radioactive release distributions for selected accidentprogression bin ................. ......................................... A-34
A. 13 Example display of source term complementary cumulative distribution function .... A-35
A. 14 Example display of offsite consequences complementary cumulative distributionfunction . .............................................................. A-40
A. 15 Principal steps in expert elicitation process . .................................. A-44
A.16 Matrix formulation of risk analysis calculation ................................ A-46
A. 17 Example display of relative contributions to mean risk .......................... A-49
A. 18 Probability that f(PDSi) will fall in intervalI .................................. A-50
TABLE
A. 1 Issues considered by expert panels ......................................... A-41
NUREG-1150 IV

Appendix A
A. 1 Introduction and Overview
A. 1.1 Introduction
This appendix provides an overview of the NUREG-1150 risk analysis process, describing the differentsteps in the calculational process and the interrelationships among steps. This summary has been writtenfor a reader familiar with risk analysis but does not discuss the subtleties and complexities of the methodsused to perform the various analysis steps. The reader seeking a more comprehensive discussion isdirected to References A.1 and A.2.
The analysis methods used in NUREG-1150 were selected or developed to satisfy some special objectivesof the project. In particular, the following were important considerations in the selection of methods:
* The need to perform quantitative uncertainty analyses (considering both data and modelinguncertainties) as part of the calculations;
* The need to make explicit use of the data base of severe accident experimental and calculationalinformation generated by NRC's contractors and the nuclear industry, which resulted in thedevelopment of more detailed accident progression analysis models and the use of formal methodsfor eliciting expert judgment;
* The ability to readily assess the impact of postulated modifications to the studied plants;
* The ability to calculate and display intermediate results and a detailed breakdown of the risk results,providing traceability throughout the computations; and
* Computational practicality.
The selection of the methods also benefited from experience obtained in conducting the analysespresented in the first draft version of NUREG-1150 (Ref. A.3) and supporting contractor reports (Refs.A.4, A.5, and A.6), and the reviews of these reports (Refs. A.7, A.8, and A.9).
The remainder of this appendix discusses the individual steps in the NUREG-1150 risk analysis process.Section A.1.2 provides an overview of the process, while Sections A.2 through A.8 describe individualsteps in greater detail. Section A.2 contains a separate discussion of the methods used in the accidentfrequency analysis of internal events for the Surry, Sequoyah, Peach Bottom, and Grand Gulf plants; theinternal-event analysis for the Zion plant; and the external-event analysis for the Surry and Peach Bottomplants. Since the accident progression, source term, and offsite consequence analysis methods did notsignificantly differ among the plants or for internal and external events, the discussions in Sections A.3through A.8 are applicable to all five plants and for both internally and externally initiated accidents.
As noted above, the risk analyses of NUREG-1150 included the performance of quantitative uncertaintyanalysis, considering both data and modeling uncertainties. Section A.6 discusses how this uncertaintyanalysis was introduced and applied in the NUREG-11SO risk analyses. The methods by which expertjudgments were obtained for use in the risk analyses are discussed in Section A.7.
The remaining sections of this appendix have been extracted from the contractor reports underlyingNUREG-1150. Some editorial modifications have been made to improve the flow of the text.
A.1.2 Overview of Risk Analysis Process*
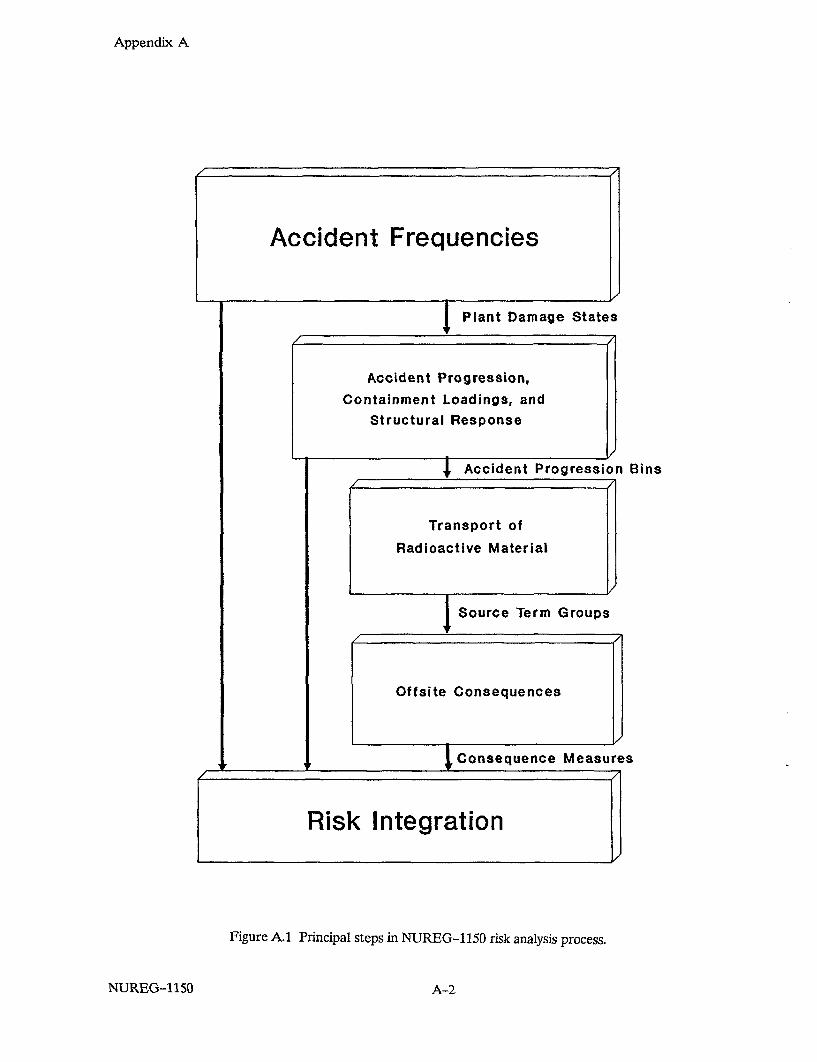
The risk analyses performed in NUREG-1150 have five principal steps (as shown in Fig. A. 1):(1) accident frequency (systems) analysis; (2) accident progression, containment loadings, and structuralresponse analysis; (3) radioactive material transport (source term) analysis; and (4) offsite consequenceanalysis. A fifth analysis part, risk calculation, combines and analyzes the information from the previousfour steps.
The transfer of information between analysis steps is critical; thus, three interfaces are illustrated in FigureA.2. Each distinct continuous line that can be followed from the left of the illustration to the box marked
*This section adapted, with editorial modification, from Chapter 2 of Reference A.2.
A-1 NUREG-1150
Appendix A
Accident Frequencies
I Plant Damage States
Accident Progression,Containment Loadings, and
Structural Response
I Accident Progression Bins
Transport of
Radioactive Material
I Source Term Groups
Offsite Consequences
I Consequence MeasuresF
Risk Integration
Figure A.1 Principal steps in NUREG-1150 risk analysis process.
NUREG-1150 A-2

Syst
ems
Ana
lysi
sA
ccid
ent
Pro
gres
sion
& C
onta
inm
ent
Ana
lysi
sS
ourc
e Te
rmA
naly
sis
Con
sequ
ence
Ana
lysi
sIn
terfa
ceIn
terf
ace
Key
: *
nPD
S**
= n
AP
B+
= ST
G
0
Figu
re A
.2
Inte
rfac
es b
etw
een
risk
ana
lysi
s st
eps.

Appendix A
"Risk Calculation" corresponds to a distinct group of accidents with a particular set of characteristics ineach analysis step. Each of the analysis steps produces results that are useful for understanding the plant'sresponse to that stage or aspect of the accident, and each part also provides an ingredient necessary tothe calculation of overall risk.
Each of the analysis steps is supported by a variety of information sources and supporting analyses. Anideal study might use comprehensive mechanistic models to calculate the entire sequence of events leadingto core damage, release of radioactive material, and exposure to the public for each possible accident.However, a large variety of accidents will be possible because there are a variety of initiating events andbecause "random" events occurring during the accident can change the progress of the accident. It ispresently neither practical (too many possible accidents to follow) nor possible (mechanistic models donot exist for many parts of the process) to conduct such a study. As such, PRAs have relied on the use ofa variety of simple models and calculational tools to substitute where integrated mechanistic calculationswere not available. Some of the tools assemble results from several existing mechanistic calculations toyield a more comprehensive result. Other models provide simplified mechanistic models with as much ofthe detailed analysis as possible but which are able to efficiently calculate results for the wide range ofconditions needed to examine the set of possible accidents.
The accident frequency analyses identify the combination of events that can lead to core damage andestimate their frequency of occurrences. Potential accident initiating events (including external events fortwo plants) were examined and grouped according to the subsequent system response required. Oncethese groups were established, accident sequence event trees were developed that detailed the relation-ships among systems required to respond to the initiating event in terms of potential system successes andfailures. The front-line systems in the event trees, and the related support systems, were modeled withfault trees or Boolean logic expressions as required. The core damage sequence analysis was accomplishedby appropriate Boolean reduction of the fault trees in the system combinations (the accident sequences)specified by the event trees. This Boolean reduction provides the logical combinations of failures (the cutsets) that can lead to core damage. Once the important failure events are identified, probabilities areassigned to each event and the accident sequence frequencies are quantified. The accident sequence cutsets are then regrouped into plant damage states in which all cut sets are expected to result in a similaraccident progression. Variations in these frequencies are explicitly considered in an uncertainty analysisusing a structured Monte Carlo approach.
The NUREG-1150 accident frequency analyses have the following products:
* The total core damage frequency from internal events and, where estimated, for external events;
* The definitions and estimated frequencies of plant damage states; and
* The definitions and estimated frequencies of accident sequences.
Importance measures, including risk reduction, risk increase, and uncertainty measures, have also beenassessed in NUREG-1150 accident frequency analyses.
The accident progression, containment loadings, and structural response analysis investigated the physicalprocesses affecting the core after an initiating event occurs. In addition, this part of the analysis trackedthe impact of the accident progression on the containment building. The principal tool used inNUREG-1150 for delineating and characterizing the possible scenarios in this study was the accidentprogression event tree. The event tree is a computational tool used to assemble a large variety of analysisresults and data to yield a comprehensive result (in terms of the characteristics of alternative failure modesof the containment building and related probabilities) for each of the many accidents. The event tree isparticularly suited for the study of processes that are not completely understood, permitting the study ofalternative phenomenological models. The output of the accident progression event tree (APET) was alisting of numerous different outcomes of the accident progression. As illustrated in Figure A.2, theseoutcomes were grouped into accident progression bins (APBs) that, analogous to plant damage states,allow the collection of outcomes into groups that are similar in terms of the characteristics that areimportant to the next stage of the analysis, in this case source term estimation. Once the APET isconstructed, the probabilities of the paths through the APET were evaluated by a computational tool,EVNTRE (Ref. A. 10). EVNTRE also performs the function of grouping similar outcomes into bins. The
NUREG-1150 A-4

Appendix A
accidents that are grouped into a single bin are similar enough in terms of timing, energy, and othercharacteristics that a single source term estimate suffices for estimating the radiological impact of any ofthe individual accidents within that bin.
The qualitative product of the containment loadings analysis is a set of accident progression bins. Each binconsists of a set of event tree outcomes (with associated probabilities) that have a similar effect on thesubsequent portion of the risk analysis, analysis of radioactive material transport. Quantitatively, theproduct consists of a matrix of conditional failure probabilities, with one probability for each combinationof plant damage state and accident progression bin. These probabilities are in the form of probabilitydistributions, reflecting the uncertainties in accident processes.
The next step in the risk calculation was the source term analysis. Once again a relatively simple modelwas developed to allow consideration of alternative inputs and the assembly of information from manysources. In this study, a plant-specific model was developed for each of the plants, with the suffix SORbuilt into the code name (shown as XSOR in Fig. A.2) (Ref. A. 11). For example, SURSOR is the sourceterm model for the Surry plant. The results of the source term analysis were release fractions for groups ofchemically similar radionuclides for each accident progression bin. As with the previous analyses, a largenumber of results were calculated, too many for direct transfer to the next part. The interface in this caseis accomplished through the calculation of "partitioned" source term groups. The large number of XSORresults are assessed and grouped in terms of their important parameters (i.e., early health threat potentialand latent health threat potential) and by similarity of accident progression as it affects warning times tothe surrounding population.
The product of this step in the NUREG-1 150 risk analysis was the estimate of the radioactive release of aset of source team groups, each with an associated energy content, time, and duration of release.
The offsite consequence analysis in this study was performed with the MACCS (MELCOR AccidentConsequence Code System) computer code, Version 1.5 (Ref. A.12). This code has been developed as areplacement for the CRAC2 code (Ref. A. 13), which had previously been used by the NRC and others toestimate consequences for nuclear power plant risk analyses and other studies. The MACCS calculationswere performed for each of the partitioned source terms defined in the previous step.
The product of this part of the analysis is a set of offsite consequence measures for each source termgroup. For NUREG-1150, the specific consequence measures discussed include early fatalities, latentcancer fatalities, population dose (within 50 miles and total), and two measures for comparison withNRC's safety goals (average individual early fatality probability within 1 mile and average individual latentfatality probability within 10 miles) (Ref. A. 14).
The final stage of the risk analysis was the assembly of the outputs of the first four steps into an expressionof risk. As shown in Figure A.2, the calculation of risk can be written in terms of the outputs of theindividual steps in the analyses:
Riskj = h i j k f(IEh) P (IE - PDS1) P (PDSI - APBj) Pn (APBj - STG) Ck
where:
Risk,, = Risk of consequence measure for observation n (consequences/year);
fn (IEh) = Frequency (per year) of initiating event h for observation n;
Pn(IEh > PDSi) = Conditional probability that initiating event h will lead to plant damage state ifor observation n;
Pn(PDSj 4 APBj) = Conditional probability that PDSi will lead to accident progression bin j forobservation n;
Pn (APB STGk) = Conditional probability that accident progression bin j will lead to source termgroup k for observation n; and
A- NUREG-1150
Appendix A
Ck = Expected value of consequence measure conditional on the occurrence ofsource term group k.
In considering this equation, the reader should note that the frequency and probabilities noted are in theform of distributions, rather than single-valued. A specialized Monte Carlo (Latin hypercube sampling)technique is used to generate these distributions (Ref. A. 15). As discussed in Section A.5, however, theconsequence values used were expected values, reflecting variability in meteorology only.
Because of the large information-handling requirements of all these analysis steps, computer codes havebeen used to manipulate the data. Figure A.3 illustrates the computer codes used in the risk assemblyprocess in this study. The purpose of each of these codes will be discussed in the following sections.
A.2 Accident Frequency Analysis Methods
A.2.1 Internal-Event Methods for Surry, Sequoyah, Peach Bottom, and Grand Gulf*
The accident frequency analysis for the Surry, Sequoyah, Peach Bottom, and Grand Gulf plants consistedof 10 principal tasks. These are illustrated in Figure A.4. This section briefly discusses each major taskand the interrelationships among tasks. These tasks are discussed in greater detail in Reference A.1.
The principal steps in the accident frequency analysis of the Surry, Sequoyah, Peach Bottom, and GrandGulf plants were:
* Plant familiarization analysis,* Accident sequence initiating event analysis,* Accident sequence event tree analysis,* Systems analysis,* Dependent and subtle failure analysis,* Human reliability analysis,* Data base analysis,e Accident sequence quantification analysis,* Plant damage state analysis, and* Uncertainty analysis.
Each of these steps will be discussed below.
Plant Familiarization Analysis
The initial task of this analysis was to develop familiarity with the plant, forming the foundation for thedevelopment of plant models in subsequent tasks. Information was assembled using such sources as theFinal Safety Analysis Report, piping and instrumentation diagrams, technical specifications, operatingprocedures, and maintenance records, as well as a plant site visit to inspect the facility and clarify andgather information from plant personnel. One week was spent in the initial plant visit. Regular contact wasmaintained with the plant staff throughout the course of the study. The analyses discussed inNUREG-1150 reflect each plant's status as of approximately March 1988.
At the conclusion of the initial plant visit, much of the information required to perform the remainingtasks had been collected and discussed in some detail with utility personnel so that the analysis team wasfamiliar with the design and operation of the plant. Subsequent plant contacts were used to verify theinformation obtained and to identify plant changes that occurred during the analysis.
Accident Sequence Initiating Event Analysis
The next task was to identify potentially important initiating events and determine the plant systemsrequired to respond to these events. Initiating events of importance were generally those that led to a need
This section elracted, with editorial modification, from Chapter 1 of Reference A.1.
NUREG-1150 Am6

SY
ST
EM
SA
NA
LYS
ISA
CC
IDE
NT
PR
OG
RE
SS
ION
AN
ALY
SIS
SOU
RC
E T
ER
MA
NA
LY
SIS
CO
NS
EQ
UE
NC
EA
NA
LYS
IS
Fau
lt a
ndev
ent
tree
mod
els
I.
SET
S IC
ore
dam
age
outs
etex
pre
sion
s
TEM
AC
I .
Fre
quen
cies
of
plan
t da
mag
est
ates I
Acc
iden
t P
rogr
essi
onev
ent
tree
I
EVN
TRE
PS
TEV
NT
I--
I~~
~~
~
Acc
iden
tpr
ogre
ssio
nbi
nch
arac
teri
stic
s
Mag
nitu
des
of a
ll so
urce
term
s ca
lcul
ated
I_
PAR
TITI
ON
Sou
rce
term
gro
upch
arac
teri
stic
san
dm
appi
ng o
f ac
cide
ntpr
ogre
ssio
n bi
nsto
sou
rce
term
gro
ups
I
MAC
CS
I
-J
Pro
babi
litie
sof
acc
iden
t pr
ogre
ssio
nbi
ns f
or e
ach
plan
tda
mag
e st
ate
Il l
I
Sou
rce
term
mag
nitu
des
and
rele
ase
Info
rmat
ion
for
each
acc
iden
tpr
ogre
ssio
n bi
nP
roba
bili
ties
of c
onse
quen
cem
easu
res
for
each
sou
rce
term
grou
pI
I _
I 0
z c) r-"
_I
I I
I
shri
njk
fEh
P(lE
h-PD
SI)
P(PD
SI-A
PBj)
P(A
PBiS
TG
k) C
(ST
Gk
= R
Ski
RISQ
UE/
PRA
MIS
10 CD
:3 (L R-
Figu
re A
.3
Mod
els
used
in
calc
ulat
ion
of r
isk.

z c) T1
00
CD AL
Figu
re A
. 4 S
teps
in
acci
dent
fre
quen
cy a
naly
sis
of S
urry
, Se
quoy
ah,
Peac
h B
otto
m,
and
Gra
nd G
ulf.

Appendix A
for plant trip and removal of decay heat by plant safety systems. The analysis explicitly included initiatingevents due to failures in support systems, such as ac power or component cooling water. This analysisincluded several steps:
* Identification of initiating events to be included in the analysis by review of previous PRAs and plantdata, including review of unusual or unique events that might have affected the specific plant;
* Screening of initiating events on frequency of occurrence (and elimination from further considerationevents of very low frequency); *
* Identification of functions required to successfully prevent core damage by review of plant design andoperational information;
* Identification of the "front-line" systems (e.g., emergency core cooling systems) performing theabove functions by review of plant design and operational information;
* Identification of the support systems (e.g., ac power, component cooling water) necessary foroperation of the front-line systems by review of plant design and operational information;
* Delineation of success criteria for each front-line system responding to each initiating event by reviewof available data and performance of additional calculations (e.g., as described in Ref. A. 16); and
* Grouping of initiating events, based on similarity of system response.
At the conclusion of this task, the number and type of event trees to be constructed and the systems to bemodeled had been identified. Thus, the scope of the modeling effort in subsequent tasks was defined.
Accident Sequence Event Tree Analysis
In this task, accident sequences leading to core damage were defined by constructing event trees for eachinitiating event group. In general, separate event trees were constructed for each group.
System event trees that included the systems responding to each initiating event group as defined in theaccident sequence initiating event analysis were constructed. The event tree structure reflected systeminterrelationships and aspects of accident phenomenology that determined whether or not the sequencesled to core damage. Phenomenological information, such as containment failure effects that potentiallyimpact core cooling or other systems, was obtained from the staff involved in the accident progression andcontainment loadings analysis.
At the conclusion of this task, models that identified all those accident sequences to be assessed in theaccident sequence quantification analysis task had been constructed.
Systems Analysis
In order to estimate accident sequence frequencies, the success and failure probabilities must bedetermined for each question (or "top event") on the system event trees. Thus, the importantcontributors to failure of each system must be identified, modeled, and quantified. Although the eventtree questions were usually phrased in terms of system success, the fault tree top events were formulated interms of system failure. With this transformation in mind, fault trees were constructed that reflected thesuccess criteria specified in the three previous tasks. Each success criterion was transformed into a failurecriterion that was developed for all the front-line systems included in the event trees. If these front-linesystems depended on support systems, such as electric power or service water, then models were alsodeveloped for those systems. In a subsequent task, the support system trees were merged with therespective front-line system fault trees to describe the ways, including support system faults, that theundesired event may occur. Thus support system dependencies were included systematically andautomatically in the quantification process.
*The reader is cautioned that the screening analysis performed and the degree of system modeling detail performed in thisstudy were based on the designs of each of the plants. Thus, it should not be inferred that such assessments necessarilyapply o other plants.
A-9 NUREG-1150

Appendix A
The majority of the models in this study were detailed fault trees. These were supplemented with a fewsimplified fault trees, Boolean equations, or black box models (event probabilities or failure rates), basedon guidelines that considered such things as the relative importance of the system, complexity of thesystem, dominant failure modes, availability of data, etc. Selection of the level of modeling detail for eachsystem was one of the most important steps in the analysis and did, to a great extent, determine theamount of effort required to complete the accident frequency analysis. All the front-line fluid systemsrequired detailed fault trees, as did a few critical support systems. The outputs of this task were models foreach event found in the event trees.
This task interfaced with the human reliability, dependent and subtle failure, and data base analyses.Human errors associated with test and maintenance activities and certain responses to and recovery fromaccident situations were modeled directly in the fault trees. Dependent and subtle failures as a result ofsystem interdependencies and component common-cause failures were also directly modeled. The faulttrees were developed to a level of detail consistent with the data base used for quantifying failureprobabilities.
Dependent and Subtle Failure Analysis
Nuclear power plants are sufficiently complex that dependent and subtle failures can be of significantimportance in estimating the core damage frequency. Failures that are buried in the depths of the designand operation of the plant are often not easily identifiable. Dependent and subtle failures were categorizedseparately because they are very distinct types of failures.
The dependent failures included:
* Direct functional dependencies that involve initiators, support systems, and shared equipment; and
* Common-cause faults involving failures that can affect multiple components.
The subtle failures included:
* Peculiar or unusual interactions of system design and interfaces, or system component operation; and
* Subtle interactions identified in previous studies and PRAs or by PRA experts.
The dependent failures were identified in the accident sequence analysis. When the subtle failures wereidentified, they were added to the sequence event trees or fault trees, as appropriate. In rare cases, suchevents were modeled by changes to failure data or the cut-set expressions.
Human Reliability Analysis
This task involved the analysis of two types of potential human errors: (1) pre-accident errors, includingmiscalibrations of equipment or failure to restore equipment to operability following test and maintenance,and (2) post-accident errors, including failure to diagnose and respond appropriately to accidents. In theevaluation of pre-accident faults, calibration, test, and maintenance procedures and practices werereviewed for each front-line and support system. The evaluation included the identification of componentsimproperly calibrated or left in an inoperable state following test or maintenance activities. Forpost-accident faults, procedures expected to be followed in responding to accidents modeled in the eventtrees were identified and reviewed for possible sources of human errors that could have affected theoperability or function of responding systems. In order to support eventual sequence quantification,estimates were produced for human error rates. In generating these estimates, screening values weresometimes used for initial calculations. For most of the human errors expected to be significant in theanalysis, nominal human error probabilities were evaluated using modified THERP techniques (Ref.A. 17) and plant-specific characteristics. For the boiling water reactor (BWR) plants in NUREG-1150, adetailed human reliability analysis (HRA) was performed on the post-accident human faults for theanticipated transient without scram (ATWS) sequences (Ref. A.18).
Data Base Analysis
This task involved the development of a data base for quantifying initiating event frequencies and basicevent probabilities (other than human errors) that appeared in the models. A generic data base
NUREG- 1150 A-10

Appendix A
representing typical initiating event frequencies as well as plant component failure rates and theiruncertainties was developed. Data for the plant being analyzed, however, may have differed significantlyfrom industrywide data. In this task, the operating history of the plant (if available) was reviewed todevelop plant-specific initiating event frequencies and to determine whether any plant components hadunusually high or low failure rates. Test and maintenance practices and plant experiences were alsoreviewed to determine the frequency and duration of these activities. This information was used tosupplement the generic data base.
Accident Sequence Quantification Analysis
The models from each previous step were integrated into the accident sequence quantification analysistask to calculate accident sequence frequencies. This was an iterative task performed at various timesduring the analysis. For example, the analyst first estimated partial sequence frequencies, sometimesconservatively. If the resulting frequency of the accident sequence, considering only some of the failuresinvolved, was below a specified cutoff value, the sequence was dropped from further consideration.However, if the frequency of the partial accident sequence was above the cutoff value, the sequence wasfully developed and recovery actions applied where appropriate using the SETS code (Ref. A. 19).
Plant Damage State Analysis
Plant damage state analysis provides the information necessary to initiate an accident progression analysisin a Level 2 PRA (discussed in Section A.3). The plant damage state definitions provide the status ofplant systems at the onset of core damage. These definitions include descriptions of the status of corecooling systems, containment systems, and support systems in sufficient detail to describe the state of theplant for the accident progression analysis. The development of plant damage state definitions wasaccomplished by adding additional questions to the end of the accident sequence event trees. However, inmany cases it was not necessary to actually draw the plant damage state event tree, but rather, thequestions could be dealt with in a matrix format (see Section 11 of Ref. A. 1).
The questions that defined the plant damage states were selected during an iterative process with theaccident progression analysis staff. During the actual analysis, the accident sequence cut sets wereregrouped into plant damage states, based on the particular failures in the cut sets and the answers to theselected questions. Some accident sequences contained cut sets that contributed to several different plantdamage states. Similarly, there were cases where several different accident sequences could havecontributed cut sets to the same plant damage state.
Once the new plant damage state cut-set groups were formed, they were quantified in the same manner asthe accident sequences, in that point estimates (using mean values) were generated and an uncertaintyanalysis performed (as discussed below).
Uncertainty Analysis
With the NUREG-1150 objective of assessing the uncertainties in severe accident frequencies and risks,the single-valued estimates of accident sequence and plant damage state frequencies were supplementedwith quantitative uncertainty analysis. Both parameter value (data) and modeling uncertainties wereincluded in the analysis, which involved several steps:
* Preparation of probability distributions for the set of basic events in the logic models;
* Elicitation of expert judgment (from expert panels and project staff)for those issues or parameters forwhich insufficient information was available to readily prepare an uncertainty distribution;
* Determination of the correlation between parameters in the logic models;
* Input of the logic models and probability distributions, including correlation factors, to a computer-ized analysis package (Ref. A.20) to perform the Monte Carlo sampling and importance calculations;and
* Performance of additional sensitivity studies on certain key issues.
A-11 NUREG-1 150

Appendix A
This analysis produced a frequency distribution from which mean, median, and 5th and 95th percentilevalues were obtained. The underlying logic models were also analyzed to rank the basic events accordingto their contribution to core damage frequency (using risk-reduction and risk-increase importancemeasures) and the uncertainty in this frequency.
A.2.2 Internal-Event Methods for Zion*
The analysis of the Zion Nuclear Plant Unit for NUREG-1150 (Ref. A.21) used the large event tree,small fault tree approach originally used in the Zion Probabilistic Safety Study (ZPSS) (Ref. A.22).Because of the existence of the ZPSS, it was determined that an accident frequency analysis of the Zionplant could be included in NUREG-1150 at a greatly reduced level of effort and cost. To achieve this,many aspects of the probabilistic risk analysis process developed in the ZPSS were carried over into theNUREG-1150 analysis.
The principal steps of the methods used in the analysis of Zion included:
* Identification of initiating events,
* Plant response modeling (including systems analysis),
* Human reliability analysis (including recovery),
* Data analysis,
* Quantification, and
* Sensitivity/uncertainty analyses.
Each of these steps is discussed in more detail in the following sections.
Identification of Initiating Events-Zion
The initiating event categories for which plant response models were developed were determined in theZPSS and were used directly in the NUREG-1150 analysis with only minimal changes. The ZPSS used anumber of sources of information to establish these initiating event categories, including:
* Zion plant operating records,
* Zion plant design features and safety analyses,
* Previous probabilistic risk analyses, and
* General industry experience.
In addition to these resources, the ZPSS analysis team developed a "Master Logic Diagram" to organizetheir thought processes and to structure the information. Figure A.5 shows the high-level Master LogicDiagram developed for the Zion Probabilistic Safety Study. Level I in the diagram represents theundesired event for which the risk analysis is being conducted, i.e., an offsite release of radioactivematerial. Level II answers the question: "How can a release to the environment occur?" Level III showsthat a release of radioactive material requires simultaneous core damage and containment failure. LevelIV answers the question: "How can core damage occur?" After several more levels of "how can"questions, the diagram arrives at a set of potential initiating events.
The ZPSS listed 59 internal initiating events that were assigned to the first 13 initiating event categoriesshown in Figure A.5. The NUREG-1150 analysis was able to reduce the number of initiating eventcategories by combining several that had the same plant response. For example, the loss of steam insideand outside the containment was collapsed into loss of steam. The result was 11 initiating event categoriesfor the NUREG-1150 analysis.
Plant Response Modeling-Zion
The plant response modeling for the NUREG-1 150 analysis was based on the ZPSS work and consists ofthree parts. The first part is event tree modeling. The ZPSS developed 14 event tree models, one for each
This section extracted, with editorial modification, from Reference A.21.
NUREG- 150 A- 12

r-�r
n
IIo
f^4
OF
ICO
RE
A
TtX
IAL
p-_
I I'
ll,
arz
I
CO
AL M
AT
CH
IAL
EA
ILU
Al
LL
VI%
II
LEV
EL V
I
.
w-
LE
VE
L V
I|
I"A
RY
C
OO
LIT
|O
UM
DA
RY
PA
ILA
III
L
LIV
L
VI
_
3
4
1
_I.C
t (
MLO
bi*
S
MA
LL
AtA
CIG
E
LOS
OP
L
OSS O
F
LOS
S Of
IUA
OIT
NLV
9 L
Vi
LO
CA
LO
CA
T
O
PR
IMA
RY
F
f S
TA
M
TO
WS
LC
OI.
0A
P
CO
OLA
NT
F
L"
FL
OW
WO
LAN
I FL
OW
ITE
RN
A.
INIIT
ER
hA
L
I T
ER
IAI.
yT
lAN
A
| L
IX
YR
LN
AL
INT
S h
AL
| T
LA
NA
L
INt1
lAN
AI
INIT
IAT
OR
S W
ITIA
1OA
L
INIT
IAT
OR
S
ITIS
IN
ITIA
TO
RS
IT
IAS
C
INIT
IAS
OLS
IN
ISI:S
OA
1
UV
it V
ill
6I&
LU
AL
IL
TA
RN
AL
EX
TE
RN
WA
L
EX
TE
RN
AL
E
IAN
AT
. L
IIC
NA
L
LX
SLIA
NA
I.
(1F
IN.4
1IN
OIA
4T
OA
S
.,.T
iAT
O
INIT
IAS
ON
S1
IWT
OL
S
II4IT
IAT
OA
S
IIIIA
TO
RS
IN
ITIA
TO
RS
-I
11-T
AS
0R
INT
ER
NA
L
AIL
AN
AL
S
TE
A.
NT
AA
.
NII
.AT
OA
S
IIT
IAT
OR
S
INIT
IAT
OR
S
INT
IAT
OS
INI.
A0
"S
I IT
IAT
OR
S
INIT
IAIO
RS
IN
ITIA
TO
RS
It
IA
I I
1'x^
14
'^w
Is
PI_
A
ME
AT
A
LL
SA
SI
INC
RIA
St
tAIL
VR
I
NII
AN
AL
IN
"TE
RN
tAl
i lIR
Nt~
AS
IhlT
IAT
OR
S
INIT
IAT
OR
S
ITIA
TO
.^R
| A
XT
RA
N
AL
|
E| X
tE
AN
AL
|
AX
TE
RA
LI
INT
IAT
OR
II
ITO
S
SN
ITIA
TO
RS
z C/ 0
Ad (0 0-
Figu
re A
.5
Zio
n Pr
obab
ilist
ic S
afet
y St
udy
mas
ter
logi
c di
agra
m.

Appendix A
of the initiating event categories and one for the failure of reactor trip condition (anticipated transientwithout scram). This last event tree is actually a subtree or extension to a number of the main event treesbut was separated out to easily quantify the frequency of ATWS.
The ZPSS event trees were the basis for the NUREG-1 150 event trees. Modifications were made to eachof the original event trees to reflect the latest understanding of the intersystem dependencies. Many of thechanges from the ZPSS to the NUREG-1150 analysis were based on the review of the ZPSS performed bySandia National Laboratories under contract to the NRC staff (Ref. A.23) and comments on the draftversion of this work (Ref. A.4).
The second part of the plant response model was the development of electric power support states. TheZPSS analysis of the Zion electric power system and the dependencies of other plant systems on electricpower resulted in the identification of eight unique electric power states. Each power state defined acombination of successful and failed power sources. Each electric power state had a unique impact on theset of systems included in the event tree top events.
The final part of the plant response modeling was the analysis of the systems that provide the safety andsupport functions defined by the event tree top events. From the top event definitions and success criteriaand the electric power states, a set of boundary conditions for each system analysis was developed. Thenumber of unique boundary conditions determined the number of conditional split fractions that had tobe modeled.
A conditional split fraction is the system availability given a specific set of conditions such as the initiatingevent, the electric power state, and the operational status of other required support systems. For instance,for the auxiliary feedwater system, seven conditional split fractions were needed. One (conditional splitfraction "L11"), for example, was used for transients and loss-of-coolant accidents (LOCAs) with allpower available.
The NUREG-1150 analysis for Zion made extensive use of the system analyses in the ZPSS. Afterverification of the current plant configuration, most conditional split fractions used in the NUREG-1150analysis came directly from the ZPSS. In some cases, new conditional split fractions had to be developedto accommodate event tree model changes. These included several for the component cooling watersystem, the service water system, and the high-pressure injection system, among others. For the most part,the new conditional split fractions were able to be constructed from pieces of system analyses existing inthe ZPSS.
Human Reliability Analysis-Zion
The human reliability analysis identified the human actions of operation, maintenance, and recovery thatshould be considered in the probabilistic risk analysis process. It also determined the human error rates tobe used in the quantification of these actions. The NUREG-1150 analysis included human actioninvolving: pre-initiator testing and maintenance actions; accident procedure actions; and recovery actions.
Pre-initiator testing and maintenance actions included the types of human errors that could render aportion of the plant unavailable to respond to an initiating event. Examples of these errors were improperrestoration of a system after testing and miscalibration of instrument channels.
Accident procedure actions are required for the plant to fully respond to an initiating event. These actionswere generally called out in the emergency operating procedures. Examples of these human actions wereestablishing feed-and-bleed cooling, switching from the injection mode of emergency core cooling tocontainment sump recirculation, and depressurizing below the steam generator safety valve setpointsduring a steam generator tube rupture.
Recovery actions may or may not be called out in the emergency operating procedures. These actions aretaken in response to the failure of an expected function. Examples of these types of actions includedrecovering ac electrical power, manually starting a pump that should have received an auto-start signal,and refilling the refueling water storage tank in the event of emergency core cooling system recirculationfailure.
NUREG- 1150 A-14

Appendix A
Pre-initiator testing and maintenance actions were usually incorporated into the system models since mostof them impacted only a single system. Accident procedure actions were typically included at the eventtree level as a top event because they were an expected portion of the plant/operator response to theinitiating event. These actions may have been included in the system models if they impacted only a singlesystem. Recovery actions were included either i the event trees or the system models or applied to thesequence models after processing of the plant response models.
Pre-initiating event testing and maintenance errors were included in the system models and were takendirectly from the ZPSS. The accident procedure errors were also taken from the ZPSS after verificationthat the emergency procedures and plant operating philosophies had not changed significantly from thetime of the ZPSS. Recovery actions were developed specifically for the NUREG- 1150 analysis and wereapplied to specific system models and to specific accident sequences as appropriate.
Data Analysis-Zion
The ZPSS performed an extensive analysis of plant-specific data to determine the failure rates anddemand failure probabilities for all the basic events used in the models. The plant data collected includedcomponent failure data, test frequencies and results, component service hours, and maintenancefrequencies and durations.
This information was combined with generic failure data from sources such as Reactor Safety Study (Ref.A.24), IEEE-500 (Ref. A.25), and others by a single-stage or two-stage Bayesian update analysis. Thegeneric data were reviewed and screened for applicability before being used as a prior distribution in theBayesian updating process.
The NUREG-1150 analysis reviewed the plant operating history and determined that no significantchanges had occurred that would invalidate any portion of the ZPSS data analysis. This was confirmed indiscussions with the licensee. Therefore, the data used in the NUREG- 1150 analysis were taken directlyfrom the ZPSS.
Quantification-Zion
For the NUREG-1 150 analysis, the event tree models and the conditional split fraction values were inputand processed using computer codes designed specifically for manipulation of large event tree, small faulttree models with support system states (i.e., the models used in the ZPSS and other PRAs)(e.g.,Ref. A.26). Approximately 16,000 accident sequences were quantified. Each event tree was analyzedeight times, once for each electric power state. For each analysis, the appropriate conditional splitfractions were assigned to the top events. The results were single-valued estimate accident sequencefrequencies.
The accident sequences with a single-valued estimate frequency less than E-9 per year were notprocessed any further and were dropped. Recovery actions pertaining to specific situations were applied tothe appropriate remaining sequences. Again, any sequences that fell below the 1E-9 cutoff were dropped.
The remaining accident sequences were assigned to plant damage states (PDSs). The PDS frequencieswere determined by summing the frequencies of all the sequences in a given PDS.
Sensitivity/Uncertainty Analyses-Zion
For purposes of sensitivity and uncertainty analyses, the accident sequences with a single-valued estimatefrequency greater than or equal to 1E-9 per reactor year were loaded into IRRAS 2.0 (Ref. A.27), a faulttree/event tree generation and analysis model developed for NRC. Six issues were identified for whichsensitivity/uncertainty evaluations were desired. These issues were determined by examining the results ofthe single-valued estimate quantification.
For each of these issues, an expression of the uncertainty was developed. These expressions were used incombination with uncertainties in failure data in a specialized Monte Carlo analysis method (Latinhypercube sampling) (Ref. A.15) to generate a sample of 150 observations. These observations were
A-15 NUREG-1150

Appendix A
propagated through the system and sequence models using IRRAS 2.0 to generate 150 frequencies foreach sequence and plant damage state. From these, probability distributions for individual plant damagestates and total core damage frequency were determined. This information was then passed on to theaccident progression and risk analysis portions of the Zion study.
A.2.3 External-Event Methods for Surry and Peach Bottom*
Seismic Accident Frequency Analysis Methods
A nuclear power plant is designed to ensure the survival of buildings and emergency safety systems inearthquakes less than one of a specific magnitude (the "safe shutdown" earthquake). In contrast, theanalysis of seismic risk requires consideration of the range of possible earthquakes, including those ofmagnitudes less than and greater than the safe shutdown earthquake. Seismic risk is obtained bycombining the frequencies of the spectrum of possible earthquakes, their potential (and very uncertain)effects on equipment and structures within the plant under study, and the subsequent effects on core andcontainment building integrity. In considering this, it should be noted that during an earthquake, all partsof the plant are excited simultaneously. Thus, during an earthquake, redundant safety system componentsexperience highly correlated base motion, and there is a high likelihood that multiple redundantcomponents would be damaged if one is damaged. Hence, the "planned-for" redundancy of equipmentcould be compromised. This common-cause failure mechanism represents a potentially significant risk tonuclear power plants during earthquakes.
The seismic accident frequency analysis method used in NUREG-1150 for the analysis of the Surry andPeach Bottom plants is based, in part, on the results of two earlier NRC-sponsored programs. The first wasthe Seismic Safety Margins Research Program (SSMRP) (Ref. A.29). In the SSMRP, a detailed seismicrisk analysis method was developed. This program culminated in a detailed evaluation of the seismic coredamage frequency of the Zion nuclear power station (Ref. A.30). In this evaluation, an attempt was madeto accurately compute the responses of walls and floor slabs in the Zion structures, movements in theimportant piping systems, accelerations of all important valves, and the spectral accelerations at eachsafety system component (pump, electrical bus, motor control center, etc.). Correlation between theresponses of all components was computed from the detailed dynamic response calculations. Theimportant safety and auxiliary systems functions were analyzed, and fault trees were developed that tracedfailure down to the individual component level. Event trees related the system failures to accidentsequences and radioactive release modes. Using these detailed models and calculations, it was possible toevaluate the frequency of core damage from seismic events at Zion and to determine quantitatively therisk importance of the components, initiating events, and accident sequences.
The second NRC program used in the NUREG-1150 analyses was the Eastern Seismic HazardCharacterization Program (Ref. A.31), which performed a detailed earthquake hazard assessment ofnuclear power plant sites east of the Rocky Mountains. Results of these two programs formed the basis fora number of simplifications used in the seismic method reported here.
There are seven steps required for calculating the frequency of seismically initiated core damage accidentsin a nuclear power plant:
* Determination of the local earthquake hazard (hazard curve and site spectra);
* Identification of accident sequences for the plant that lead to the potential for release of radioactivematerial (initiating events and event trees);
* Determination of failure modes for the plant safety and support systems (fault trees);
* Determination of the responses (accelerations or forces) of all structures and components (for eachearthquake level);
* Determination of fragilities (probabilistic failure criteria) for the important structures and compo-nents;
'This section extracted, with editorial modification, from Part 3 of Reference A.28.
NUREG-1150 A-16

Appendix A
* Computation of the frequency of core damage using the information from the first five steps; and
* Estimation of the uncertainty in the core damage frequencies.
Work performed in each of these steps is summarized below.
Determination of Local Earthquake HazardThe seismic analyses in this report made use of two data sources on the frequency of earthquakes ofvarious intensities at the specific plant site (the seismic "hazard curve" for that site): the Eastern UnitedStates Seismic Hazard Characterization Program, funded by the NRC at Lawrence Livermore NationalLaboratory (LLNL) (Ref. A.31); and the Seismic Hazard Methodology for the Central and EasternUnited States Program, sponsored by the Electric Power Research Institute (EPRI) (Ref. A.32). In boththe LLNL and EPRI programs, seismic hazard curves were developed for all U.S. commercial power plantsites east of the Rocky Mountains, using expert panels to interpret available data. The NRC staff presentlyconsiders both program results to be equally valid (Ref. A.33). For this reason, two sets of seismic resultsare provided in this report. Section C. 11 of Appendix C discusses the analysis of seismic hazards in moredetail.
Identification of Accident Sequences
The scope of the NUREG-1150 seismic analysis includes loss-of-coolant accidents (LOCAs) (includingvessel rupture and pipe ruptures of a spectrum of sizes) and transient events. Two types of transient eventswere considered: those in which the power conversion system (PCS) is initially available (denoted type T3transients) and those in which the PCS is failed as a direct consequence of the initiating event (denotedtype T1 transients). The event trees developed in the internal-event analyses are used. For the seismicanalysis, the reactor vessel rupture and large LOCA event frequencies were based on a Monte Carloanalysis of steam generator and reactor coolant pump support failures. The frequency of Type Titransients is based on the frequency of loss of offsite power (LOSP). This is the dominant cause of thistype of transient (for plants such as those studied in NUREG-1150 in which LOSP causes loss of mainfeedwater). Given an earthquake of reasonable size, it is assumed that a type T3 transient occurs with aprobability of unity.
Determination of Failure Modes
The internal-event fault trees were used in the seismic analysis with some modification to include basicevents for seismic failure modes and to resolve the trees for pertinent cut sets to be included in theprobabilistic calculations. Probabilistic culling was used in the resolution of these trees in such a way as toensure that important correlated failure modes were not lost.
Determination of FragilitiesComponent seismic fragilities were obtained both from a generic fragility data base and from plant-specificfragilities developed for components identified during the plant walkdown.
The generic data base of fragility functions for seismically induced failures was originally developed as partof the SSMRP (Ref. A.29). Fragility functions for the generic categories were developed based on acombination of experimental data, design analysis reports, and an extensive expert opinion survey. Theexperimental data used in developing fragility curves were obtained from the results of componentmanufacturers' qualification tests, independent testing laboratory failure data, and data obtained from theextensive U.S. Corps of Engineers SAFEGUARD Subsystem Hardness Assurance Program (Ref. A.34).These data were statistically combined with the expert opinion survey data to produce fragility curves foreach of the generic component categories.
Detailed structural fragility analyses were performed for all important safety-related structures at theNUREG-1150 plants. In addition, an analysis of liquefaction for the underlying soils was performed.These were included directly into the accident frequency analysis.
Determination of ResponsesBuilding and component seismic responses were estimated from peak ground accelerations at severalprobability intervals on the hazard curve. Three basic aspects of seismic response-best estimates,
A-17 NUREG- 115 0

Appendix A
variability, and correlation-were generated. Results from the SSMRP Zion analysis (Ref. A.30) and othermethods studies (Ref. A.35) formed the basis for assigning scaling, variability, and correlation ofresponses.
In each case, computer code calculations (using the SHAKE code (Ref. A.36)) were performed to assessthe effect of the local soil column (if any) on the surface peak ground acceleration and soil-structureinteractions. This permitted an evaluation of the effects of nonhomogeneous underlying soil conditionsthat could have strongly affected the building responses.
Fixed base mass-spring (eigen-system) models were either obtained from the plant's architect/engineer orwere developed from the plant drawings. Using these models, the floor slab accelerations were calculatedusing the CLASSI computer code (Ref. A.37). This code uses a fixed-base eigen-system model of thestructure and input-specified frequency-dependent soil impedances and computes the structural response(as well as variation in structural response if desired). Variability in responses (floor and spectralaccelerations) was assigned based on results of the SSMRP.
Correlation between component failures was explicitly included in the analysis. In computing thecorrelation between component failures (in order to quantify the cut sets), it was necessary to considercorrelations both in the responses and in the fragilities of each component. Inasmuch as there are no dataas yet on correlation between fragilities, the fragility correlations between like components were taken aszero, and the possible effect of such correlation quantified in a sensitivity study. The correlation betweenresponses is assigned according to a set of rules.
Computation of Frequency of Core Damage
Given the input from the five steps above, the SETS computer code (Ref. A. 19) was used to calculaterequired outputs (probabilities of failure, core damage frequency, etc.).
Estimation of Uncertainty
Using Monte Carlo techniques, frequency distributions of individual parameters in the seismic analysiswere combined to yield frequency distributions of accident sequences, plant damage states, and total coredamage.
Fire Accident Frequency Analysis Methods
Nuclear power plants are designed to be able to safely shut down in the presence of a spectrum of possiblefires throughout the plant (Ref. A. 38). Nonetheless, some plant areas contain cabling for multiple trains ofcore cooling equipment. Fires in such areas (and in some cases in conjunction with random equipmentfailures not caused by a fire) can lead to accident sequences with relatively important frequencies. For thisreason, the core damage frequency from fire-initiated accidents was assessed for two power plants (Surryand Peach Bottom).
The principal steps in the simplified fire accident frequency analysis method used in NUREG-1150 wereas follows:
* Initial plant visit,
* Screening of potential fire locations, and
* Accident sequence quantification.
Each of these steps is summarized below.
Initial Plant Visit
Based on the internal-event and seismic analyses, the general location of cables and components of theprincipal plant systems had previously been developed. A plant visit was then made to provide the analysisstaff with a means of seeing the physical arrangements in each of these areas. The analyst had a fire zonechecklist that would aid the screening analysis and the quantification step.
NUREG-1150 A-18

Appendix A
The second purpose of the initial plant visit was to confirm with plant personnel that the documentationbeing used was in fact the best available information and to get clarification about any questions that mighthave arisen in a review of the documentation. As part of this, a thorough review of firefighting procedureswas conducted.
Screening of Potential Fire Locations
It was necessary to select important fire locations within the power plant under study that have the greatestpotential for producing accident sequences of high frequency or risk.
The screening analysis was comprised of:
* Identification of relevant fire zones
A thorough review of the plant Appendix R (Ref. A.38) submittal was conducted to permit thedivision of this plant into fire zones. A fire zone can be defined as a plant area surrounded by a3-hour-rated barrier or its equivalent. From this complete plant model, fire zones were screened fromfurther analysis if it could be shown that neither safety-related equipment nor its associated power orcontrol cabling was located within them.
* Screening of fire zones on probable fire-induced initiating events
Fire zones where the overall fire occurrence frequency is less than 1-6 per year were eliminatedfrom further consideration. Also, certain fire-induced initiating events such as loss of offsite powercould be eliminated if a particular fire zone contained none of its cabling. Therefore, even if a firezone could not be screened as a whole, certain of the fire-induced initiators that might be postulatedto occur within this zone could be eliminated.
* Screening of fire zones on both order and frequency of cut sets
Cut sets containing random failure combinations with frequencies less than E-4 were eliminatedfrom further consideration. In this step, cut sets with multiple fire zone combinations were addressed.Any cut set containing three or more fire zone combinations was screened from further considera-tion. These scenarios would imply the simultaneous failure of two or more 3-hour-rated fire barriersand therefore were considered probabilistically insignificant. Cut sets containing only two fire zoneswere eliminated on the following three criteria:- If there was no adjacency between the two areas;
- If there was an adjacency, it contains no penetrations; and
- On probability, with barrier failure probability set to 0.1.
* Analysis of each fire zone remaining to numerically evaluate and to cull on probability
The remaining cut sets were now resolved with fire-zone-specific fire initiating event frequencies andthen screened on a frequency criteria of E-8 per year.
Accident Sequence Quantification
After the screening analysis has eliminated all but the probabilistically significant fire zones, quantificationof dominant cut sets was completed as follows:
* Determination of the temperature response in each fire zone
The modified COMPBRN III code (Ref. A.39) was used to calculate time to damage of all criticalcabling and components within a fire zone.
* Computation of component fire fragilities
For those modeled components in the COMPBRN analysis, damageability temperatures wereassigned based on fire test experience.
* Assessment of the probability of barrier failure for all remaining combinations of fire zones
A-19 NUREG-1150

Appendix A
The remaining cut sets that contained two fire zones had barrier failure probabilities calculated.Those cut sets that were below 1E-8 per year were eliminated from further consideration.
0 Performance of recovery analyses
In a manner like that of the internal-event recovery analysis, recovery of random failures was appliedon a cut-set by cut-set basis. For sequences less than 24 hours in duration, only one recovery actionwas allowed. If more than one recovery action was possible for any of these given cut sets, aconsistent hierarchy of which recovery action to apply was used. In sequences of greater than 24hours, two recovery actions were allowed. The only modifications to recovery probabilities werefound in areas where a fire had to first be extinguished and then the area desmoked prior to theoccurrence of a local action.
This quantification was performed using specialized Monte Carlo techniques (Latin hypercube sampling)(Ref. A. 15) so that individual parameter frequency distributions can be combined into frequencydistributions of accident sequences, plant damage states, and total core damage frequency.
Bounding Analysis of Other External Events
Bounding analyses were performed for NUREG-1150 for those external events that were judged topotentially contribute to the estimated plant risk. Those events that were considered included extremewinds and tornadoes, turbine missiles, internal and external flooding, and aircraft impacts.
Conservative probabilistic models were used in these bounding analyses to integrate the randomness anduncertainty associated with event loads and plant responses and capacities. Clearly, if the mean initiatingevent frequency resulting from a conservative model was predicted to be low (e.g., less than 1E-6), theexternal event could be eliminated from further consideration. Using this logic, the bounding analysesidentified those external events that needed to be studied in more detail as part of the risk analysis. In thecase of both Peach Bottom and Surry, none of these "other external events" was found to be a potentiallysignificant contributor to core damage frequency.
A.2.4 Products of Accident Frequency Analysis
The results of the accident frequency analyses discussed in this section can be displayed in a variety ofways. The specific products shown in NUREG-1150 are described as follows:
* The total core damage frequency for internal events and, where estimated, for external events
For Part II of NUREG-i150 (plant-specific results), a histogram-type plot was used to represent thedistribution of total core damage frequency as shown on the right side of Figure A. 6. This histogramdisplays the fraction of Latin hypercube sampling (LHS) observations falling within each interval.*Four measures of the probability distribution are identified:- Mean,
- Median,
- 5th percentile value, and
- 95th percentile value.
A second display of accident frequency results is used in Part III of NUREG-liSO, where results forall five plants are displayed together. This figure provides a summary of these four specific measuresin a simple graphical form (shown on the left side of Fig. A.6).For those plants in which both internal and external events have been analyzed (Surry and PeachBottom), the core damage frequency results are provided separately for the two classes of accidentinitiators.
*Care should be taken in using these histograms to estimate probability densityfunctions. These histogram plots were developed such that theheights of the individual rectangles were not adjusted so that the rectangular areas represented probabilities. The shape of a correspondingdensity function may be very different from that of the histogram. The histograms represent the probability distribution of the logarithm ofthe core damage frequency.
NUREG-1 150 A-20

Appendix A
95th- l
5t h- I
Key
M = meanm = median
Figure A.6 Example display of core damage frequency distribution.
A-21 NUREG-1150

Appendix A
* The definitions and estimated frequencies of plant damage states
The total core damage frequency estimates described above are the result of the summation of thefrequencies of various types of accidents. For this summary report, the total core damage frequencyhas been divided into the contributions of specific plant damage states:*
- Station blackouts, in which all ac power (coming from offsite and from emergency sources in the plant)is lost;
- Transient events with failure of the reactor protection system (ATWS events);- Other transient events;
- Loss-of-coolant accidents (LOCAs) resulting from pipe ruptures, reactor coolant pump seal failures,and failed relief valves occurring within the containment building; and
- LOCAs that bypass the containment building (steam generator tube ruptures and other "interfacing-system LOCAs").
Figure A.7 provides an example display of mean plant damage state frequencies used in NUREG-1150.
In addition to these quantitative displays, the results of the accident frequency analyses also can bediscussed with respect to the qualitative perspectives obtained. In NUREG-1 150, qualitative perspectivesare provided in two levels:
* Important plant characteristics. The discussion of important plant characteristics focuses on generalsystem design and operational aspects of the plant. Perspectives are thus provided on, for example,the design and operation of the emergency diesel generators or the capability for the feed and bleedmode of emergency core cooling.
* Important individual events. One typical product of a PRA is a set of "importance measures." Suchmeasures are used to assess the relative importance of individual items (such as the failure rates ofindividual plant components or the uncertainties in such failure rates) to the total core damagefrequency. While a variety of measures exists, two are discussed (qualitatively) in NUREG-1150. Thefirst importance measure (risk reduction) shows the effect of significant reductions in the frequenciesof individual plant component failures or plant events (e.g., loss of offsite power, specific humanerrors) on the total core damage frequency. In effect, this measure shows how to most effectivelyreduce core damage frequency by reductions in the frequencies of these individual events. Thesecond importance measure (uncertainty reduction) discussed in NUREG-1 150 indicates the relativecontribution of the uncertainty in key probability distributions to the uncertainty in total core damagefrequency. In effect, this measure shows how most effectively to reduce the uncertainty in coredamage frequency. A third importance measure, risk increase, is discussed in the contractor reportsunderlying NUREG-1150.
As illustrated in Figure A.3, the results of this analysis are the first and second inputs to the riskcalculations, F(IEh), the frequency of initiating event h, and P(IEA - PDSi), the conditional probabilityof plant damage state i, given initiating event h.
A.3 Accident Progression, Containment Loadings, and Structural ResponseAnalysis**
A.3. 1 Introduction
The purpose of the accident progression, containment loadings, and structural response analysis is to trackthe physical progression of the accident from the initiating event until it is concluded that no additionalrelease of radioactive material from the containment building will occur. Thus, the core damage process isstudied in the reactor vessel, as the vessel is breached, and outside the vessel. At the same time, theanalysis tracks the impact of the accident progression on the containment building structure, withparticular focus on the threat to containment integrity posed by pressure loadings or other physicalprocesses.
'A more detailed set of plant damage states is provided in the supporting contractor reports.**This section extracted, with editorial modification, from Chapter 2 of Reference A.2.
NUREG-1150 A-22

Appendix A
Station Blackout
AT WS
Transients
OCA
Total Mean Core Damage Frequency: 4.SE-6
Figure A7 Example display of mean plant damage state frequencies.
A-23 NUREG-1 150

Appendix A
The requirements of an ideal accident progression analysis would be knowledge, probably in the form ofthe results of mechanistic calculations from validated computer codes, of the characteristics of the set ofpossible accident progressions resulting from individual plant damage states defined in the previousanalysis step. More than one accident progression can result from each plant damage state since randomevents (hydrogen detonations, for example) occurring during the accident progression can alter the courseof the accident. Given the frequency of the plant damage state and the probabilities of the random events,one could determine the outcomes and frequencies of the set of possible accidents.
Knowledge of the characteristics of all possible accidents resulting from each plant damage state is clearlynot available with current technology. A large number of mechanistic codes that can predict some aspectsof the accident progression are available. For example, MELPROG (Ref. A.40) and CONTAIN (Ref.A.41) can be used to track in-vessel and containment events, respectively, for very explicit accidentprogressions. Less detailed but more comprehensive codes, such as the Source Term Code Package(STCP) (Ref. A.42), MAAP (Ref. A.43), and, more recently, MELCOR (Ref. A.44), have beendeveloped to predict generalized characteristics of more aspects of the accident in an integrated fashion.While these codes are very useful for developing a detailed understanding of accident phenomena andhow the different phenomena interact, they do not meet the constraints imposed by a PRA; i.e., theability to analyze a very wide range of scenarios with diverse boundary conditions in a timely andcost-efficient manner. In addition, the number of code calculations necessary to investigate uncertaintyand sensitivity to inputs, models, and assumptions would be prohibitively expensive. Further, these codeshave not been fully validated against experiments. Thus, codes developed by different groups (forexample, NRC and industry contractors) frequently include contradictory models and give different resultsfor given sets of accident boundary conditions. Finally, these codes also do not contain models of allphenomena that may determine the progression of the accident.
The information that was available with which to conduct the accident progression analysis forNUREG-1150 consisted of the diverse body of research results from about 10 years of severe accidentresearch within the reactor safety community. This included a large variety of severe accident computercode calculations, other mechanistic analyses, and experimental results. Much of the informationrepresented basic understanding of some important phenomena. Because of the expense of developingand running large integrated codes, less information was in the form of integrated accident progressionanalyses. That which was available was usually confined to analyses of a few types of accident sequences.All existing codes were recognized to have some limitations in their abilities to mechanistically modelsevere accidents.Many new calculations were conducted specifically for NUREG-1 150. For example, new CONTAIN codecalculations were performed to assess pressure loadings on the containment and sensitivity of the loadingcalculations to various phenomenological assumptions (Ref. A.45). Most of the new calculations aredescribed in the contractor reports supporting NUREG-1150. In particular, Reference A.46 contains acomplete listing and description of the new supporting calculations. For the most part, the newcalculations were intended to fill the largest gaps in the present state of knowledge of accident progressionfor the most important accidents.
Given this state of information, the NUREG- 1150 accident progression analysis was performed in a seriesof steps, including:
* Development of accident progression event trees,e Structural analyses,* Probabilistic quantification of event tree issues, and* Grouping of event tree outcomes.
Each of these steps is discussed below.
A.3.2 Development of Accident Progression Event Trees
The NUREG-1150 accident progression analyses were conducted using plant-specific event trees, calledaccident progression event trees (APETs). The APETs consist of a series of questions about physicalphenomena affecting the progression of the accident. A typical question would be "What is the pressurerise in the containment building at reactor vessel breach?" A complete listing of the questions that make
NUREG-1 150 A-24

Appendix A
up the accident progression event tree for each plant studied in NUREG-1150 can be found in ReferencesA.47 through A.51. Typically, the event trees for each plant consisted of about 100 questions; eachquestion could have multiple outcomes or branches.
The NUREG-1150 APETs were general enough to efficiently calculate the impact of changes inphenomenological models on the accident progression in order to study the effect of uncertainties amongthese models. This generality added complexity to the analysis since, with the ability to consider differentmodels, some paths through the tree, which would be forbidden for a specific model, had to be includedwhen a variety of models was considered. The multiplicity of possible accident progression results causedby the consideration of multiple models for some of the accident phenomena was amplified at eachadditional stage of the accident progression since, in addition to creating more possible outcomes, a widerrange in boundary conditions at the subsequent events was made possible. Because of the flexibility andgenerality of the APETs, basic principles, such as hydrogen mass conservation, steam mass conservation,etc., were incorporated into the event trees in order to automatically eliminate pathways for which theprinciples are violated. This was accomplished with parameters, such as hydrogen concentrations invarious compartments, passed along in the tree as each accident pathway was evaluated. At somequestions in the tree, the parameters were manipulated using computer subroutines. The branch taken ineach question could depend on the values of such calculated parameters. The consistency of phenomen-ological treatment throughout each accident was also ensured by allowing questions to depend on thebranches or parameters taken in previous questions.
Figure A. 8 schematically illustrates the APETs used in this study. The first section of the tree (about 20percent of the total number of questions) was used to automatically define the input conditions associatedwith the individual plant damage state (PDS). Thus, if one of the characteristics of a PDS was the pressurein the reactor vessel at the onset of core damage, a question was included to set the initial conditionaccording to that variable. The next part of the tree was then devoted to determining whether or not theaccident was terminated before failure of the reactor vessel. Questions pertinent to the recovery of coolingand coolability of the core were asked in this part of the tree. The next section of the tree continued theexamination of the accident progression in the reactor vessel. As illustrated in Figure A. 8, there were twoprincipal areas of investigation for this part of the analysis: in-vessel phenomena that determined theradioactive release characteristics; and events that impacted the potential for containment loadings. Theexample in Figure A.8 shows the phenomena associated with the release of hydrogen during the in-vesselphase of accident progression and the resultant escape of that hydrogen into the containment building.
The next stage illustrated in Figure A.8 continues the examination of the accident during, andimmediately after, reactor vessel breach. This included the continued core meltdown in the vessel and thesimultaneous loading and response of the containment building. A good example for this stage of theAPET analysis is an examination of the coolability of the debris once out of the reactor vessel, followed byquestions concerning the loading of the containment as a result of core-concrete interactions.
The final stage of the illustrated APET is related to the final status of containment building integrity.Long-term overpressurization, threats from combustion events, and similar questions were asked for thisstage of the accident progression. For convenience, some questions that summarized the status of thecontainment at specific times during the accident were also included.
Throughout the progression of a severe accident, operator intervention to recover systems has thepotential to mitigate the accident's impact. Such actions were considered in the APET analysis, using thesame rules as those used in the accident frequency analysis.
The previous explanation has delineated the general flow of the accident progression event tree. What isnot immediately apparent in this summary is the degree to which dependencies could be taken intoaccount.
An example of the dependency treatment is a series of questions that relate to hydrogen combustion. Theoutcomes of the event tree questions that ask whether hydrogen deflagration occurs sometime after vesselbreach and what is the resulting pressure load from the burn are highly dependent on previous questions.The individual values for the probability of ignition and the pressure rise were dependent on:
* Previous hydrogen burn questions (the amount consumed in each previous burn was tracked, and theconcentration at the later time was calculated consistent with all previous hydrogen events);
A-25 NUREG-1 150

Appendix A
BoundaryConditions:Plant DamageStates
PressureIn vessel
System
I Recovery of
Core PriortoVessel Breach
I Recovery of
njection
I Yes
I
I
I
I
I In-Vesseli Processes and
ContainmentI Impact
I
I
Hydrogen
I released?
Yes*
I _
No
IHydrogenbum before
I vessel brea
I
I _
I
I
I
Ex-VesselProcesses andContainment
t Impact
Debriscoolabitty
I Yes
L I No
chi IrYes
I Pressure increaseNo due to H2 burn
during CCI gasI generation
* I S fYes,
I: :
It.
IFinalOutcome
I
ILate
I containmentoverpressure
i Yes
I No
'E
III I
1
II
IEI
*Amount of hydrogen released is sampled fromcontinuous probability distribution
**Pressure Increase is calculated from user unction
Figure A.8 Schematic of accident progression event tree.
NUREG-1150 A-26

Appendix A
* Questions concerning the steam loading to determine whether the atmosphere was steam inert; and* Questions concerning the availability of power, which influenced the probability of ignition.
In turn, these questions all had further dependencies on each other and on other questions. For example,the steam loading questions were dependent on the power and equipment availability since heat removalsystem operation would impact the steam concentration.A.3.3 Structural Analyses
The NUREG-1 150 APETs explicitly incorporate consideration of the structural response of containmentbuildings, including a building's ultimate strength, failure locations, and failure modes. Use was made ofavailable detailed structural analyses (e.g., Ref. A.52) and results of recent experimental programs (e.g.,Ref. A.53). The judgments of experts were used to interpret the available information and develop therequired input (probability distributions) for the APET (see Section A.7 for discussion of the use of expertjudgment).
A.3.4 Probabilistic Quantification of APETs
In general, phenomenological models were not directly substituted into the event trees (in the form ofsubroutines) at each question. Rather, the results of the model calculations were entered into the treesthrough the assigned branching probabilities, the dependencies of the questions on previous questions (the"case structure"), and/or tables of values that were used to determine parameters passed or manipulatedby the event tree. Some questions in the trees, such as those concerning the operability of equipment andavailability of power, were assigned probability distributions derived from data analogous to the process inthe accident frequency analysis. Timing of key events was identified through a review of available codecalculations and other relevant studies in the literature. The process of assigning values to the branch pointprobabilities, creating the case structure, writing the user functions, and supplying parameter values ortables is referred to as "quantification" of the tree.
Once an accident progression event tree, with its list of questions (their branches and their case structure),its subroutines, and its parameter tables, had been constructed by an analyst, it was evaluated using thecomputer code EVNTRE (Ref. A. 10). EVNTRE can automatically track the different kinds of dependen-cies associated with the accident progression issues. This code was also built with specific capabilities foranalyzing and investigating the tree as it was being built, allowing close scrutiny of the development of acomplex model. For each plant damage state, EVNTRE evaluates the outcomes of the set of subsequentaccident progressions predicted by the APET and their probabilities.
A.3.5 Grouping of Event Tree Outcomes
EVNTRE groups paths through the tree into accident progression bins. PSTEVNT (Ref. A.54) is a"rebinner" computer code that further groups the initial set of bins produced by EVNTRE. * To meet theneeds of the subsequent source term analysis, the APET results are grouped into "accident progressionbins."
The accident progression bins were defined through interactions between the accident progression analystsand the source term analysts. Characteristics of the bins include, for example, timing of release events,size and location of containment failure, and availability of equipment and processes that removeradioactive material. As such, the bins are relatively insensitive to many of the individual questions in thetree as they focus on the ultimate outcomes, and through the use of these bins, the paths through the treewere greatly reduced in terms of the number of unique outcomes.
A.3.6 Products of Accident Progression AnalysisThe qualitative product of the accident progression, containment loadings, and structural responseanalysis is a set of accident progression bins. Each bin consists of a set of event tree outcomes (withassociated probabilities) that have a similar effect on the subsequent portion of the risk analysis, analysisof radioactive material transport. As such, the accident progression bins are analogous to the plantdamage states described in Section A.2.4.
IEVNTRE groupings can be chosen to illustrate the importance of a specific aspect of accident phenomenology, system performance, oroperator performance, as long as that aspect is a distinct part of the APET.
A-27 NUREG-1150

Appendix A
Quantitatively, the product consists of a matrix of conditional failure probabilities, with one probability foreach combination of plant damage state and accident progression bin. These probabilities are in the formof probability distributions, reflecting the uncertainties in accident processes.
In NUREG-1150, products of the accident progression analysis are shown in the following ways:
* The distribution of the probability of early containment failure* for each plant damage state (asshown in Fig. A.9).
Measures of this distribution provided include:- Mean,
- Median,
- 5th percentile value, and
- 95th percentile value.
* The mean probability of each accident progression bin for each plant damage state (as shown inFig. A.10).
As illustrated in Figure A.3, the result of this process is the third input to the risk calculation,P(PDSi - APBj), the conditional probability of accident progression bin j given plant damage state .
A.4 Radioactive Material Transport (Source Term) Analysis**
A. 4.1 Introduction
The third part of the NUREG-1150 risk analyses is the estimation of the extent of radioactive materialtransport and release into the environment and the conditions of the release (timing and energy). Asdescribed above, the interface between this and the previous step (the interface being the accidentprogression bin) is defined to efficiently transfer the important information, while maintaining amanageable set of calculations.
The principal steps in the source term analyses were:
* Development of parametric models of material transport,
* Development of values or probability distributions for parameters in the models, and
* Grouping of radioactive releases.
Each of these steps will be discussed below.
A.4.2 Development of Parametric Models
As noted previously, in a risk analysis it is not practical to analyze every projected accident in detail with amechanistic computer code. The method used for this part of the risk analysis was designed to be efficientenough to calculate source terms for thousands of accident progression bins and flexible enough to allowfor incorporation of phenomenological uncertainties into the analysis.
For the NUREG-1150 risk analyses, parametric models were developed that allowed the calculation ofsource terms for a wide range of projected accidents. While the basic parametric equation for the modelswas largely the same for all five plants studied, it was customized to reflect plant-specific features and
*In this report, early containment failure includes failures occurring before orwithin a few minutes of reactorvessel breach for pressurizedwater reactors and those failures occurring before orwithin 2 hours of vessel breach for boiling water reactors. Containment bypass fail-ures are categorized separately from early failures.
iThis section adapted, with editorial modification, from Chapter 2 of Reference A.2.
NUREG-1150 A-28

N
1.EO
N
1.E
-1 -
-4)
-4 0 :40 C-q
co cJ
,1.E
-2
a) *<1.
E-3
.
0CD )
'4-
-0
1 1.E
-5-
4 -
1.E
l-5
SUR
RY
95
tk,.
95
th,
_ 9
l 0
95tt
W
_ 1
~ ~
~~~~
~
~~
9 9
5 t
h..
M-0
. 5t
5th,
.
95th
.,.5h
-,
m
=
nedia
xn
th =
perc
e.n
tle
z I (A
…In
tern
al
Init
iato
rs…
Fir
eS
eism
ic(D 0-
PD
S G
roup
Cor
e D
amag
e F
req
.L
OSP
A
TWS
2.8
E-0
5
1 4E
-06
Tra
nsi
en
ts1
.BE
-06
LO
CA
s B
ypas
s A
ll6
.1E
-06
3.4
E-0
6
4.1
E-0
5LL
NL
l.IE
-O5
I 9E
-04
Figu
re A
.9 E
xam
ple
disp
lay
of e
arly
con
tain
men
t fai
lure
pro
babi
lity
dist
ribu
tion.
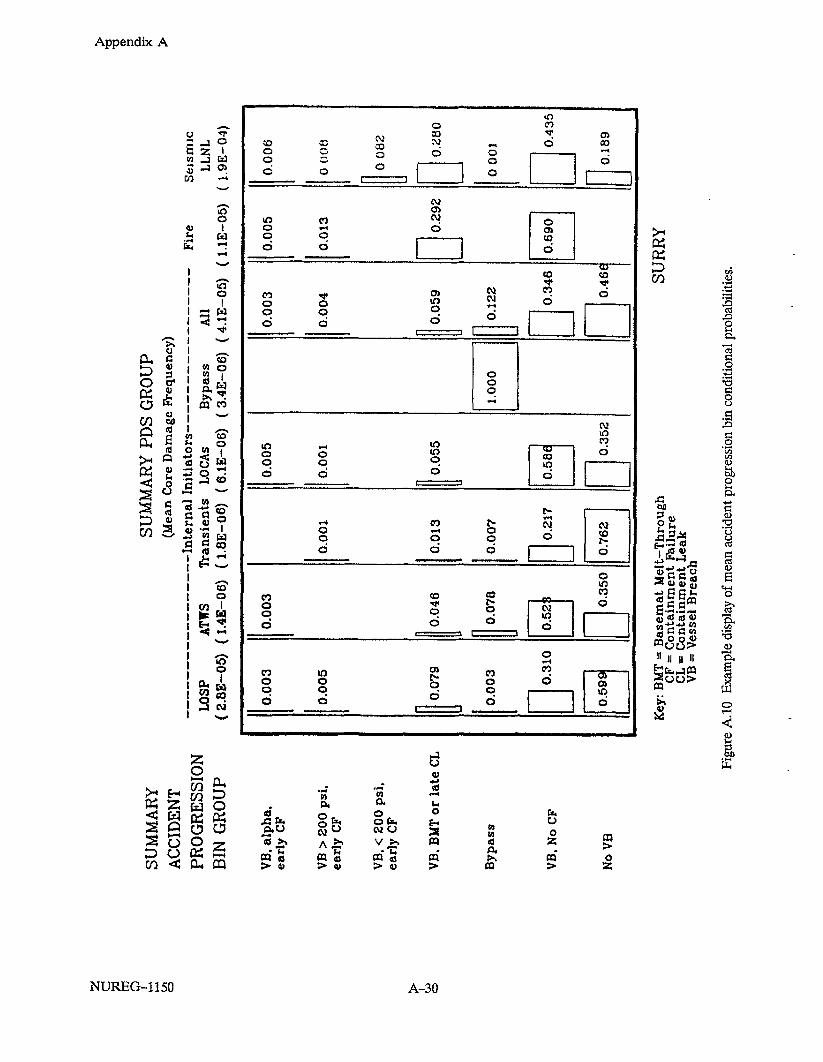
z 0 0SU
MM
AR
YA
CC
IDEN
TPR
OG
RE
SSIO
NB
IN G
RO
UP
VB.
alp
ha.
earl
y C
F
VB
> 2
00 p
si.
earl
y CF
VB
. <
200 p
si.
earl
y C
F
VB.
BU
T or
late
CL
Byp
ass
VB.
No
CF
No
VB
SUM
MA
RY
PD
S G
RO
UP
(Mea
n C
ore
Dam
age
Fre
quen
cy)
…--
----
----
----
--
Inte
rnal
Ini
tiato
rs…
----
---
Fir
e S
eism
icLO
SP
ATW
S T
rans
ient
s LO
CAs
Byp
ass
All
LLN
L(
2A8E
-05)
(
1.4E
-06)
(
1.8E
-06)
(
6.1E
-06)
(
3.4E
-06)
(
4.1E
-05)
(
.1E
-05)
(
l.9E
-04)
Key
: B
T =
Bas
emat
Mel
t-T
hrou
ghC
F =
Con
tain
men
t F
ilu
reC
L =
Co
nta
inm
ent
Lea
kV
B =
Ves
sel
Bre
ach
SUR
RY
Figu
re A
. 10
Exa
mpl
e di
spla
y of
mea
n ac
cide
nt p
rogr
essi
on b
in c
ondi
tiona
l pr
obab
ilitie
s.

Appendix A
conditions that could impact the source term estimates. As noted in Figure A.3, the codes that manipulatethese parametric equations are called XSOR, where the X refers to a plant-specific abbreviation; forexample, the code for Peach Bottom is PBSOR (Ref. A.11).
The parametric equations do not contain any chemistry or physics (except mass conservation) butdescribe the source terms as the product of release fractions and transmission factors at successive stagesin the accident progression for a variety of release pathways, a variety of projected accidents, and nineclasses of radionuclides. (To allow a manageable calculation, the radionuclides were treated in terms ofradionuclide groups that have similar properties, the same nine groups that are defined in the SourceTerm Code Package (Ref. A.42)). Figure A.11 illustrates some of the release pathways and releasefractions included in the model. The release is broken up into constituent parts (release fractions andtransmission factors) in order to allow the input of a range of uncertainty within each part and to allowdifferent components of the release to occur at different times.
The basic parametric equations are of the form
STi(i) + STh (i) + STe(i) + STI(i) + Special Terms,
where (i) represents the radionuclide group, ST,(i) represents releases from the fuel that occur in-vessel,STh(i) represents releases from the fuel that occur during high-pressure melt ejection, STe(i) representsreleases from the fuel when the fuel is out of the vessel, primarily during core-concrete interactions, andSTI(i) represents releases from the fuel that occur in-vessel but that plate out in the reactor coolant system(RCS) before the RCS integrity is lost and are released later. An example of a "Special Term" is anexpression for releases from the plant for a bypass accident. The individual terms on the right hand side ofthe equation above represent different radionuclide release pathways and are represented as products ofrelease fractions and transmission factors. For example, the expression for STi(i) for PWRs is given by
ST,(i) = FCOR(i)*(FISG(i) FOSG(i) + (1 - FISG(i))*FVES(i)*FCONV/DFE)
where FCOR(i) is the fraction of initial inventory of nuclide group i released from the fuel in-vessel,FISG(i) is the fraction of material released from the core in-vessel that enters the steam generators,FOSG(i) is the fraction of material entering the steam generators that leaves the steam generators andenters the environment, FVES(i) is the fraction of material entering the RCS that is released from theRCS, FCONV(i) is the fraction of the material released from the vessel that would be released from thecontainment in the absence of special decontamination mechanisms such as sprays that are included inDFE, and DFE is the decontamination factor to be applied to release from the vessel. The expression forBWRs is simpler because the terms related to the steam generators can be omitted. Similar expressionsexist for STe(i), STh(i), and STI(i).
The parametric equation allows for uncertainty in the release fractions and for the effects of importantboundary conditions, such as timing or temperature history to be included in the source term calculation.Any parameter in the equation can be represented by a probability distribution (this distribution can besampled in the Monte Carlo analysis). All parameters (FVES(i) FISG(i), etc.) can be made to vary withaccident progression bin characteristics, such as high pressure in the vessel. The accident progression bincharacteristics are passed from the previous part of the risk analysis.
The expression for STe(i) is associated with the core-concrete interaction releases. The impact ofcontainment conditions such as the availability of overlaying water or the operability of sprays is includedin the expression for STe(i). In addition, the timing and mode of containment failure or leakage isconsidered in order to calculate a release from the containment to the environment.
Late revolatilization from the vessel and late release of iodine from water pools are included in theexpression for ST1(i). These secondary sources of radionuclides that were removed in earlier processes arekept track of in a consistent manner and made available for release at a later time.
A-31 NUREG-1 150

Appendix A
Containment release ofi-vessel species
J-q1
Late cont. decon
Figure A.11 Simplified schematic of source term (XSOR) algorithm.
NUREG-1 150 A-32

Appendix A
A.4.3 Development of Values or Probability Distributions
Given the parametric equations used to define the source terms, it was necessary to define basicparameters. None of the parameters was internally calculated; the values must be specified by the user orchosen from a distribution of values by a sampling algorithm. Initially, the equations and the parametersfor the equations were developed through detailed examination of the results of Source Term CodePackage (STCP) analyses of selected accidents, performed specifically for the NUREG-1150 study (Refs.A.55 and A.56). Subsequent incorporation of calculations and experimental data from a variety ofsources (e.g., STCP (Ref. A.42), CONTAIN (Ref. A.41), MELCOR (Ref. A.44), and other computercodes) has led to models that more broadly reflect the range of source term information available in thereactor safety research community.
With the NUREG-1150 objective of the performance of quantitative uncertainty analysis, data on themore important parameters were constructed in the form of probability distributions. Such distributionswere developed using expert judgment to interpret the available data or calculations. For a few parametersthat were judged of lesser importance or not considered as uncertain, single-valued estimates were used inthe XSOR models. These estimates were derived from STCP and other calculations, adjusted as neededfor the boundary conditions associated with the accident progression bins.
A.4.4 Grouping of Radioactive Releases
The source term calculations performed with the XSOR codes have a one-to-one correspondence with theaccident progression bins. With the large number of bins used in the detailed risk analyses and theconsideration of parameter uncertainties, a large number of source term calculations was required. Thisnumber of calculations was too great to be directly used in the next step in the risk analysis, the offsiteconsequence analysis. Therefore, the tens of thousands of source terms were grouped into about 50groups. The source terms were grouped according to their potential for causing early fatalities, theirpotential for causing latent cancer fatalities, and the warning time associated with them. This grouping wasaccomplished with the PARTITION code (Ref. A.57). Reference A.57 explains in more detail how theearly fatality and latent cancer fatality potentials and the warning times were calculated. Each source termgroup was represented by an average source term, where the averaging was weighted by the frequency ofoccurrence of the accident progression bin giving rise to that source term and where each (Monte Carlo)calculation for the uncertainty analysis was weighted equally. Characteristics such as the energy of releasewere not used to group the source terms, although each group was represented by an average energy ofrelease.
A.4.5 Products of Source Term Analysis
The product of this step in the NUREG-1 150 risk analysis process is the estimate of the radioactiverelease magnitude (in the form of a probability distribution), with associated energy content, time, andduration of release, for each of the specified source term groups.
In NUREG-1150, radioactive release magnitudes are displayed in the following ways:
* Distribution of release magnitudes for each of the nine isotopic groups for selected accidentprogression bins (as shown in Fig. A. 12); and
* Frequency distribution (in the form of complementary cumulative distribution functions) of radioac-tive releases of iodine, cesium, strontium, and lanthanum (as shown in Fig. A. 13).
The results of the source term analysis are the fourth input to the risk calculation, P(APBj - STGk), theconditional probability that accident progression bin j will lead to source term group k.
A.5 Offsite Consequence Analysis
A.5.1 Introduction
The severe reactor accident radioactive releases described in the preceding section are of concern becauseof their potential for impacts in the surrounding environment and population. The impacts of radioactive
A-33 NUREG-1150

Appendix A
Release Fraction1 .OEOO
1.QE-O1
1.OE-02
1.OE-03
1.OE-04
1.OE-05
~~~~LY 0~~~~~~~~ 5%T -- ~~~~~~~~~~~~~~~mean
6%
NG I Cs Te Sr Ru
RadionuclideLa Ba
GroupCe
Figure A.12 Example display of radioactive release distributions for selected accident progression bin.
NUREG-1 150 A-34

Appendix A
Iodine Group
Frequency of R > R* (yr-1)L.OE-03
Surry
-.-- Zion
-*~ Sequoyah
- Peach Bottom
-- "sGrand Gulf
I.OE-05 .
10E:-06_ 3,.a
L.OE-07
1 OE-08 -'
_ ~ ~ ~ ~ ~ ~ ~ ~ ~ ~ ~ ~ ~ ~ ~ ~ ~ ~ ' a
OE-09 HIM II I 1 1 1 1 111I I I I |
1.OE-05 l.OE-04 l.OE-03 1.OE-02 l.OE-01 1.OE+OO
Release Fraction
Figure A.13 Example display of source term complementary cumulative distribution function.
A-35 NUREG-1150

Appendix A
releases to the atmosphere from such accidents can manifest themselves in a variety of ways, such as earlyand delayed health effects, loss of habitability of areas close to the power plant, and economic losses. Thefourth step in the NUREG-1150 risk analyses is the estimation of these offsite consequences, given theradioactive releases generated in the previous step of the analysis.
The principal steps in the offsite consequence analysis are:
* Assessment of pre-accident inventories of radioactive material;
* Analysis of the downwind transport, dispersion, and deposition of the radioactive materials releasedfrom the plant;
* Analysis of the radiation doses received by the exposed populations via direct (cloudshine,inhalation, groundshine, and deposition on skin) and indirect (ingestion) pathways;
* Analysis of the mitigation of these doses by emergency response actions (evacuation, sheltering, andrelocation of people), interdiction of milk and crops, and decontamination or interdiction of landand buildings; and
* Calculation of the health effects of the release, including:
- Number of early fatalities and early injuries expected to occur within 1 year of the accident, and thelatent cancer fatalities expected to occur over the lifetimes of the exposed individuals;
- The total population dose received by the people living within specific distances (e.g., 50 miles) of theplant; and
- Other specified measures of offsite health effect consequences (e.g., the number of early fatalities inthe population living within 1 mile of the reactor site boundary).
Each of these steps will be discussed in the following sections.
The NUREG-1150 offsite consequence calculations were performed with Version 1.5 of the MACCS(MELCOR Accident Consequence Code System) computer code (Ref. A.12).
A.5.2 Assessment of Pre-Accident Inventories
The radionuclide core inventories were calculated using the SANDIA-ORIGEN code (Ref. A.58). ForPWRs, a 3412 megawatt (MW) (thermal) Westinghouse PWR was used, assuming an annual refuelingcycle and an 80 percent capacity factor. The core contains 89.1 metric tons of uranium (MTU), is initiallyenriched to 3.3 percent U-235, and is used in a 3-year cycle, with one-third of the core being replacedeach year. The specific power is 38.3 MW/MTU, which gives the burnups at the end of a 3-year cycle at11,183 megawatt-days (MWD)/MTU, 22,366 MWD/MTU, and 33,550 MWD/MTU for each of the threeregions of the core.
For BWRs, a 3578 MWT General Electric BWR-6 was used, assuming an annual refueling cycle and an80 percent capacity factor. The core contains 136.7 MTU and has initial enrichments of 2.66 percent and2.83 percent U-235. The 2.66 percent fuel is used for both the 3-year cycle and the 4-year cycle, whilethe 2.83 percent is used only for the 4-year cycle. The fuel on 4-year cycles operates at roughly averagepower for the first three years and is then divided into two batches for the fourth year: half going to thecore center (near average power) and half going to the periphery (about half of the average power). Thiscomplex fuel management plan yields five different types of discharged spent fuel. The inventory at theend of annual refueling is then a blend of different types since the code performed the actual calculationon a per fuel assembly basis.
The core inventory of each specified plant studied was calculated by multiplying the standard PWR orBWR core inventory calculated above by the ratio of plant power level to the power level of the standardplant.
For these risk analyses, nine groups were used to represent 60 radionuclides considered to be of mostimportance to offsite consequences: noble gases, iodine, cesium, tellurium, strontium, ruthenium, cerium,barium, and lanthanum.
NUREG-1150 A-36
Appendix A
A.5.3 Transport, Dispersion, and Deposition of Radioactive Material
The MACCS code uses an empirical straightline Gaussion model for calculations of transport anddispersion of the plume that would be formed by the radioactive material released from the plant. Thesecalculations use the sequence of successive hourly meteorological data of the reactor site for several daysbeginning at the release (Ref. A.12). MACCS also calculates the rise of the plume vertically while it istransported downwind if the radionuclide release is accompanied by thermal energy. Actual occurrenceand the height of the plume rise would depend on the thermal release rate and the ambient meteorologicalconditions at the time of the release (Ref. A.59). Depletion of the plume by radioactive decay and dryand wet deposition processes during transport are taken into account. Radioactive contamination of theground in the wake of the plume passage due to the dry and wet deposition processes is also calculated.These calculations are performed up to a very large distance, namely, 1,000 miles, from the reactor.Beyond the distance of 500 miles from the reactor, a special artifice of calculation is used to graduallydeplete the plume of its remaining radionuclide content in particulate form and deposit it on the ground.The purpose of doing this is to provide a nearly complete accounting of the radionuclides released inparticulate form from the plant. The impact of relatively small quantities of the noble gases (which do notdeposit) leaving the 1,000-mile region is considered to be negligible. For this reason the 1,000-milecircular region is recognized as the entire impacted site region for this study.
The consequences for a given release of radioactive material would be different if the release occurred atdifferent times of the year and under different ambient weather conditions. Consequences would also bedifferent for different wind directions during the accident due to variations with direction in thepopulation distribution, land use, and agricultural practice and productivity of the site region. As such, theMACCS code provides probability distributions of the consequence estimates arising from the statisticalvariability of seasonal and meteorological conditions during the accident. The models generally accom-plish this by repeating the calculations for many weather sequences (each beginning with the release of theradioactive material) which are statistically sampled from the historical hourly meteorological data of thereactor site for 1 full year. The product of the probability of a weather sequence and the probability ofwind blowing toward a direction sector of the compass provides the probability for the estimate of themagnitude of each consequence measure for this weather sequence and direction sector combination.Computer models employed in the past and present NRC studies use about 1,500 to 2,500 weathersequence and direction sector combinations. This produces a like number of magnitude and probabilitypairs for each consequence measure analyzed. Collectively, these pairs for a consequence measureprovide a large data base to generate its meteorology-based probability distribution.
A.5.4 Calculation of Doses
MACCS calculates the radiological doses to the population resulting from several exposure pathways usinga set of dose conversion factors described in References A.60 through A.62. During the early phase,which begins at the time of the radionuclide release and lasts about a week, the exposure pathways are theexternal radiation from the passing radioactive cloud (plume), contaminated ground, and radiation fromthe radionuclides deposited on the skin, and internal radiation from inhalation of radionuclides from thecloud and resuspended radionuclides deposited on the ground. Following the early phase, the long-term(chronic) exposure pathways are external radiation from the contaminated ground and internal radiationfrom ingestion of (1) foods (milk and crops) directly contaminated during plume passage, (2) foods grownon contaminated soil, and (3) contaminated water, and from inhalation of resuspended radionuclides.
A.5.5 Mitigation of Doses by Emergency Response Actions
In the event of a large atmospheric release of radionuclides in a severe reactor accident, a variety ofemergency response and long-term countermeasures would be undertaken on behalf of the public tomitigate the consequences of the accident. The emergency response measures to reduce the doses fromthe early exposure pathways include evacuation or sheltering (followed by relocation) of the people in theareas relatively close to the plant site and relocation of people from highly contaminated areas fartheraway from the site. The long-term countermeasures include decontamination of land and property tomake them usable, or temporary or permanent interdiction (condemnation) of highly contaminated land,property, and foods that cannot be effectively or economically decontaminated. These response measuresare associated wth expenses and losses that contribute to the offsite economic cost of the accident.
A-37 NUREG-1150
Appendix A
The analysis of offsite consequences for this study included a "base case" and several sets of alternativeemergency response actions. For the base case, it was assumed that 99.5 percent of the population withinthe 10-mile emergency planning zone (EPZ) participated in an evacuation. This set of people wasassumed to move away from the plant site at a speed estimated from the plant licensee's emergency plan,after an initial delay (to permit communication of the need to evacuate) also estimated from the licensee'splan. It was also assumed that the 0.5 percent of the population that did not participate in the initialevacuation was relocated within 12 to 24 hours after plume passage, based on the measured concentra-tions of radioactive material in the surrounding area and the comparison of projected doses with proposedEnvironmental Protection Agency (EPA) guidelines (Ref. A.63). Similar relocation assumptions weremade for the population outside the 10-mile planning zone.
Several alternative emergency response assumptions were also analyzed in this study's offsite consequenceand risk analyses. These included:
* Evacuation of 100 percent of the population within the 10-mile emergency planning zone;
* Indoor sheltering of 100 percent of the population within the EPZ (during plume passage) followedby rapid subsequent relocation after plume passage;
* Evacuation of 100 percent of the population in the first 5 miles of the planning zone, and shelteringfollowed by fast relocation of the population in the second 5 miles of the EPZ; and
* In lieu of evacuation or sheltering, only relocation from the EPZ within 12 to 24 hours after plumepassage, using relocation criteria described above.
In each of these alternatives, the region outside the 10-mile zone was subject to a common assumptionthat relocation was performed based on comparisons of projected doses with EPA guidelines (as discussedabove).
A.5.6 Health Effects Modeling
The potential early health effects of radioactive releases are fatalities and morbidities (injuries) occurringwithin about a year in the population that would receive acute and high radiological doses from the earlyexposure pathways. The potential delayed health effects are fatal and nonfatal cancers that may occur inthe exposed population after varying periods of latency and continuing for many years; and various typesof genetic effects that may occur in the succeeding generations stemming from radiological exposures ofthe parents. Both early and chronic exposure pathways would contribute to the latent health effects.
The early fatality models currently implemented in MACCS are based on information provided inReference A.64. Three body organs are used in the early fatality calculations: red marrow, lung, andlower large intestine (LLI). The organ-specific early fatality threshold doses used are 150 rems, 500 rems,and 750 rems, and LD50 used are 400 rems, 1,000 rems, and 1,500 rems to the red marrow, lung, andLLI, respectively. The models incorporate the reduced effectiveness of inhalation dose protraction incausing early fatality and the benefits of medical treatment.
The early injury models implemented in MACCS are also threshold models and are similar to thosedescribed in Reference A.64. The candidate organs used for the current analysis are the stomach, lungs,skin, and thyroid.
The latent fatal and nonfatal cancer models implemented in MACCS are the same as described inReference A.64, which are based on those of the BEIR III report (Ref. A.65). These models arenonthreshold and linear-quadratic types. However, only a linear model was used for latent cancerfatalities from the chronic exposure pathways since the quadratic term was small compared to the linearterm because of low individual doses from these pathways. The specific organs used were red marrow (forleukemia), bone, breast, lung, thyroid, LLI, and others (based on the LLI dose representing the dose tothe other organs).
Population exposure has been treated as a nonthreshold measure; truncation at low individual radiationdose levels was not performed.
NUREG-1150 A-38

Appendix A
A.5.7 Products of Offsite Consequence AnalysisThe product of this part of the analysis is a set of offsite consequence measures for each source termgroup. For NUREG-1150, the specific consequence measures discussed include early fatalities, latentcancer fatalities, total population dose (within 50 miles and the entire site region), and two measures forcomparison with NRC's safety goals, average individual early fatality risk within 1 mile and averageindividual latent fatality risk within 10 miles. In NUREG-1 150, results of the offsite consequence analysisare displayed in the form of complementary cumulative distribution functions (CCDFs), as shown inFigure A.14.
The schedule for completing the risk analyses of this report did not permit the performance of uncertaintyanalyses for parameters of the offsite consequence analysis although variability due to annual variations inmeteorological conditions is included.
The reader seeking extensive discussion of the methods used is directed to Part 7 of Reference A.46 andto Reference A. 12, which discusses the computer used to perform the offsite consequence analysis (i.e.,the MELCOR Accident Consequence Code System (MACCS), Version 1.5).
Through the use of the MACCS code, the fifth part of the risk calculation was developed: CiA, the meanconsequence (representing the meteorologically based statistical variability) for measure given the sourceterm group k.
A.6 Characterization and Combination of Uncertainties*An important characteristic of the probabilistic risk analyses conducted in support of this report is thatthey have explicitly included an estimation of the uncertainties in the calculations of core damagefrequency and risk that exist because of incomplete understanding of reactor systems and severe accidentphenomena.
There are four steps in the performance of uncertainty analyses. Briefly, these are:
* Scope of Uncertainty Analyses. Important sources of uncertainty exist in all four stages of the riskanalysis. In this study, the total number of parameters that could be varied to produce an estimate ofthe uncertainty in risk was large, and it was somewhat limited by the computer capacity required toexecute the uncertainty analyses. Therefore, only the most important sources of uncertainty wereincluded. Some understanding of which uncertainties would be most important to risk was obtainedfrom previous PRAs, discussion with phenomenologists, and limited sensitivity analyses. Subjectiveprobability distributions for parameters for which the uncertainties were estimated to be large andimportant to risk and for which there were no widely accepted data or analyses were generated byexpert panels. Those issues for which expert panels generated probability distributions are listed inTable A.1.
* Definition of Specific Uncertainties. In order for uncertainties in accident phenomena to be includedin this study's probabilistic risk analyses, they had to be expressed in terms of uncertainties in theparameters that were used in the study. Each section of the risk analysis was conducted at a slightlydifferent level of detail. However, each analysis part (except for offsite consequence analysis, whichwas not included in the uncertainty analysis) did not calculate the characteristics of the accidents inas much detail as would a mechanistic and detailed computer code. Thus, the uncertain inputparameters used in this study are "high level" or summary parameters. The relationships betweenfundamental physical parameters and the summary parameters of the risk analysis parts are notalways clear; this lack of understanding leads to what is referred to in this study as modelinguncertainties. In addition, the values of some important physical or chemical parameters are notknown and lead to uncertainties in the summary parameters. These uncertainties were referred to asdata uncertainties. Both types of uncertainties were included in the study and no consistent effort wasmade to differentiate between the effects of the two types of uncertainties.
As noted above, parameters were chosen to be included in the uncertainty analysis if they wereestimated to be large and important to risk and if there were no widely accepted data or analysis.
*Inis section adapted, with editorial modification, from Section 2 of Reference A.2.
A-39 NUREG-1150

z C
>
I .
t.A
>
I OE
-03
tO
E -
03
Sto
~~
~~
~~
~~
~~
~~
~~
~~
~~
~~
~~
~~
~~
~~
~~
~~
CP
FrC
On
tiS
P
erce
nti
le
OE
-0
4..
95
tn
I o
-04.
-
95
th
X
-M
szea
n
U
-,,
, -
ticM
ean
I tOE
-Os
-60
th
I O
E-0
5
.01h
._
.---
6t
h C
=
,
I O
-
I OF-
OBM
-- \
a)
(orD
lE
o C
~~
~~
~~
~~
~~
~~
~~
~~
~~
~~
~~
~~
~~
C
91
OE
-08
I O
E-0
8
I O
E- 1
0 iO
-
I OE
-00
I O
E40
1 IO
E-0
2 O
E-0
3
IOE
-04
OE
-o5
IOE
-00
IOE
-01
OE
-02
E
-03
OE
-04t
O
E-0
5
.oE
-08
> E
arly F
ata
llties
Late
nt
Cancer
Fa
talltie
s
I OE
03
I
OE-
03-.
----
----
-
CD
C
>'
I O
E -04
..
..
>'.
I O
E-0
4...,
,
o "
'. s
\"'s
--
----
,,,,
,,
~~
~~
~~
~~
~~
~~
~~
~~
~.
'----
......
. .....
I O
-05
X
iI
OE
-05
N
-
I O
E -0
-
I O
E-0
0
t>
.~
>
\
OE
-07
I
OE
-07
Ur
{_
~Perce
nie
\ J
Perc
en
tile
5'~
~~
~~
~~
~~
~~
~~
~~
~~
~~
~~
~~
~~
~L
cw I
OE
-08
I O
E-0
.
951h
0 (0
0 0
CD
I O
E -0
9
= 60th
'I\
\
D
I O
E-0
4
-=
01r,
-
O
-'
Sh
'\\
.>--
5tn
,
0 IO
E -
0..
L
I O
E-0
tO
E-o
o I O
E-0
2
101:
-04
lsE
o0et
10E
-018
iOE
-00
O(E
-2
lOE
-04
tO
E-0
0
ItO
E 0
8P
op
ula
tio
n D
oso
p
ErS
on
-reT
In)
to
-50 M
iles
Po
pu
lati
on
o
se
p
rso
n-r
em
n)
to -
En
tire
R
eg
ion
Fig
ure
A
.14
E
xam
ple
d
isp
lay
o
f off
site
conse
quences
com
ple
menta
ry
cum
ula
tiv
e dis
trib
uti
on
fun
cti
on
.

Appendix A
Table A. I Issues considered by expert panels.
* Accident Frequency Analysis Panel
Failure probabilities for check valves in the quantification of interfacing-system LOCA frequencies(PWRs)Physical effects of containment structural or vent failures on core cooling equipment (BWRs)Innovative recovery actions in long-term accident sequences (PWRs and BWRs)Pipe rupture frequency in component cooling water system (Zion)Use of high-pressure service water system as source for drywell sprays (Peach Bottom)
* Reactor Coolant Pump Seal Performance Panel
Frequency and size of reactor coolant pump seal failures (PWRs)
* In-Vessel Accident Progression Panel
Probability of temperature-induced reactor coolant system hot leg failure (PWRs)Probability of temperature-induced steam generator tube failure (PWRs)Magnitude of in-vessel hydrogen generation (PWRs and BWRs)Mode of temperature-induced reactor vessel bottom head failure (PWRs and BWRs)
* Containment Loadings Panel
Containment pressure increase at reactor vessel breach (PWRs and BWRs)Probability and pressure of hydrogen combustion before reactor vessel breach (Sequoyah and GrandGulf)Probability and effects of hydrogen combustion in reactor building (Peach Bottom)
* Molten Core-Containment Interactions Panel
Drywell shell meltthrough (Peach Bottom)Pedestal erosion from core-concrete interaction (Grand Gulf)
* Containment Structural Performance Panel
Static containment failure pressure and mode (PWRs and BWRs)Probability of ice condenser failure due to hydrogen detonation (Sequoyah)Strength of reactor building (Peach Bottom)Probability of drywell and containment failure due to hydrogen detonation (Grand Gulf)Pedestal strength during concrete erosion (Grand Gulf)
* Source Term Expert Panel
In-vessel retention and release of radioactive material (PWRs and BWRs)Revolatization of radioactive material from the reactor vessel and reactor coolant system (early andlate) (PWRs and BWRs)Radioactive releases during high-pressure melt ejection/direct containment heating (PWRs andBWRs)Radioactive releases during core-concrete interaction (PWRs and BWRs)Retention and release from containment of core-concrete interaction radioactive releases (PWRs andBWRs)Ice condenser decontamination factor (Sequoyah)Reactor building decontamination factor (Grand Gulf)Late sources of iodine (Grand Gulf )
A-41 NUREG-1150

Appendix A
* Development of Probability Distributions. Probability distributions for input parameters weredeveloped by a number of methods. As stated previously, distributions for the input parametershaving the highest uncertainties and believed to be of the largest importance to risk were determined bypanels of experts. The experts used a wide variety of techniques to generate probability distributions,including reliance on detailed code calculations, extrapolation of existing experimental and accident data topostulated conditions during the accident, and complex logic networks. Probability distributions wereobtained from the expert panels using formalized procedures designed to minimize bias and maximizeaccuracy and scrutability of the experts' results. These procedures are described in more detail in SectionA.7. Probability distributions for parameters believed to be of less importance to risk were generated byanalysts on the project staff or by phenomenologists from several different national laboratories usingtechniques like those employed with the expert panels. This list of issues assigned probability distributionsfor the Surry plant is provided in Section C. 1 of Appendix C. Similar lists for the other plants are providedin References A.48 thorugh A.51.
* Combination of Uncertainties. A specialized Monte Carlo method, Latin hypercube sampling (Ref.A. 15), was used to sample the probability distributions defined for the many input parameters. Thesample observations were propagated through the constituent analyses to produce probabilitydistributions for core damage frequency and risk. Monte Carlo methods produce results that can beanalyzed with a variety of techniques, such as regression analysis. Such methods can treatdistributions with wide ranges and can incorporate correlations between variables. Latin hypercubesampling provides for a more efficient sampling technique than straightforward Monte Carlo samplingwhile retaining the benefits of Monte Carlo techniques. It has been shown to be an effectivetechnique when compared to other, more costly, methods (Ref. A.66). Since many of the probabilitydistributions used in the risk analyses are subjective distributions, the composite probabilitydistributions for core damage frequency and risk must also be considered subjective.
As stated in Section A.1.2, the results of the risk analysis and its constituent analyses are subjectiveprobability distributions for the quantities in the following equation:
Riskl = h i j k f (IEh) P (IEh - PDS,) Pn (PDS -> APBj) Pn (APB -> STGk) Clk
where:
Riskn = Risk of consequence measure I for observation n (consequences/year);
fn (IEh) = Frequency (per year) of initiating event h for observation n;
Pn(IEh : PDSi) = Conditional probability that initiating event h will lead to plant damage state ifor observation n;
Pn(PDS, b APBj) = Conditional probability that PDS1 will lead to accident progression bin j forobservation n;
Pn(APBj STGk) = Conditional probability that accident progression bin j will lead to source termgroup k for observation n; and
Clk = Expected value of consequence measure I conditional on the occurrence ofsource term group k.
With Latin hypercube sampling, the probability distributions are estimated with a limited number (about200) of calculations of risk, each calculation being equally likely. That is, for the uncertainty analysisabout 200 values of Risk,, are generated. Riskin can then be described in a number of ways, such as a his-togram describing the distribution of Risk1n values, the average (mean) value of risk, etc. Explanations forthe tables and figures in this document that show the results of the risk analysis and its constituent analysesare provided in Section A.9.
Detailed discussion of the NUREG-1150 uncertainty analysis methods is provided in Reference A.2.
NUREG-1 150 A-42

Appendix A
A.7 Elicitation of Experts*
The risk analysis of severe reactor accidents inherently involves the consideration of parameters for whichlittle or no experiential data exist. Expert judgment was needed to supplement and interpret the availabledata on these issues. The elicitation of experts on key issues was performed using a formal set ofprocedures, discussed in greater detail in Reference A.2. The principal steps of this process are shown inFigure A. 15. Briefly, these steps are:
* Selection of Issues. As stated in Section A.6, the total number of uncertain parameters that could beincluded in the core damage frequency and risk uncertainty analyses was somewhat limited. Theparameters considered were restricted to those with the largest uncertainties, expected to be the mostimportant to risk, and for which widely accepted data were not available. In addition, the number ofparameters that could be determined by expert panels was further restricted by time and resourcelimitations. The parameters that were determined by expert panels are, in the vernacular of thisproject, referred to as "issues." An initial list of issues was chosen from the important uncertainparameters by the plant analyst, based on results from the first draft NUREG-1150 analyses (Ref.A.3). The list was further modified by the expert panels.
* Selection of Experts. Seven panels of experts were assembled to consider the principal issues in theaccident frequency analyses (two panels), accident progression and containment loading analyses(three panels), containment structural response analyses (one panel), and source term analyses (onepanel). The experts were selected on the basis of their recognized expertise in the issue areas, such asdemonstrated by their publications in refereed journals. Representatives from the nuclear industry,the NRC and its contractors, and academia were assigned to each panel to ensure a balance of"perspectives." Diversity of perspectives has been viewed by some (e.g., Refs. A.67 and A.68) asallowing the problem to be considered from more viewpoints and thus leading to better qualityanswers. The panels contained from 3 to 10 experts.
* Training in Elicitation Methods. Both the experts and analysis team members received training fromspecialists in decision analysis. The team members were trained in elicitation methods so that theywould be proficient and consistent in their elicitations. The experts' training included an introductionto the elicitation and analysis methods, to the psychological aspects of probability estimation (e.g.,the tendency to be overly confident in the estimation of probabilities), and to probability estimation.The purpose of this training was to better enable the experts to transform their knowledge andjudgments into the form of probability distributions and to avoid particular psychological biases suchas overconfidence. Additionally, the experts were given practice in assigning probabilities to samplequestions with known answers (almanac questions). Studies such as those discussed in ReferenceA.69 have shown that feedback on outcomes can reduce some of the biases affecting judgmentalaccuracy.
* Presentation and Review of Issues. Presentations were made to each panel on the set of issues to beconsidered, the definition of each issue, and relevant data on each issue. Other parametersconsidered by the analysis staff to be of somewhat lesser importance were also described to theexperts. The purposes of these presentations were to permit the panel to add or drop issuesdepending on their judgments as to their importance; to provide a specific definition of each issuechosen and the sets of associated boundary conditions imposed by other issue definitions; and toobtain information from additional data sources known to the experts.
In addition, written descriptions of the issues were provided to the experts by the analysis staff. Thedescriptions provided the same information as provided in the presentations, in addition to referencelists of relevant technical material, relevant plant data, detailed descriptions of the types of accidentsof most importance, and the context of the issue within the total analysis. The written descriptionsalso included suggestions of how the issues could be decomposed into their parts using logic trees.The issues were to be decomposed because the decomposition of problems has been shown to easethe cognitive burden of considering complex problems and to improve the accuracy of judgments(Ref. A.70).
*This section adapted, with editorial modification, from Section 2 of Reference A.2.
A-43 NUREG-1 150

Appendix A
Figure A. 15 Principal steps in expert elicitation process.
NUREG-1150 A-44
Appendix A
For the initial meeting, researchers, plant representatives, and interested parties were invited topresent their perspectives on the issues to the experts. Frequently, these presentations took severaldays.
* Preparation of Expert Analyses. After the initial meeting in which the issues were presented, theexperts were given time to prepare their analyses of the issues. This time ranged from 1 to 4 months.The experts were encouraged to use this time to investigate alternative methods for decomposing theissues, to search for additional sources of information on the issues, and to conduct calculations.During this period, several panels met to exchange information and ideas concerning the issues.During some of these meetings, expert panels were briefed by the project staff on the results fromother expert panels in order to provide the most current data.
* Expert Review and Discussion. After the expert panels had prepared their analyses, a final meetingwas held in which each expert discussed the methods he/she used to analyze the issue. Thesediscussions frequently led to modifications of the preliminary judgments of individual experts.However, the experts' actual judgments were not discussed in the meeting because group dynamicscan cause people to unconsciously alter their judgments in the desire to conform (Ref. A.71).
e Elicitation of Experts. Following the panel discussions, each expert's judgments were elicited. Theseelicitations were performed privately, typically with an individual expert, an analysis staff membertrained in elicitation techniques, and an analysis staff member familiar with the technical subject,With few exceptions, the elicitations were done with one expert at a time so that they could beperformed in depth and so that an expert's judgments would not be adversely influenced by otherexperts. Initial documentation of the expert's judgments and supporting reasoning were obtained inthese sessions.
* Composition and Aggregation of Judgments. Following the elicitation, the analysis staff composedprobability distributions for each expert's judgments. The individual judgments were then aggregatedto provide a single composite judgment for each issue. Each expert was weighted equally in theaggregation because this simple method has been found in many studies (e.g., Ref. A.72) to performthe best.
* Review by Experts. Each expert's probability distribution and associated documentation developed bythe analysis staff was reviewed by that expert. This review ensured that potential misunderstandingswere identified and corrected and that the issue documentation properly reflected the judgments ofthe expert.
Detailed documentation of the expert elicitations is provided in References A.46 and A.73.
A.8 Calculation of Risk*A.8.1 Methods for Calculation of RiskThe constituent parts of the risk calculation have been described in previous sections. As illustrated inFigure A.3, a number of computer codes were used to generate a variety of intermediate information.This information is then processed by an additional code, RISQUE, to calculate risk. RISQUE is a matrixmanipulation code. As illustrated in Figure A. 16 and explained in Section A. 1.2, the elements of the riskcalculation can be represented in a vector/matrix format.
The initiating event frequencies f(IE) constitute a vector of n1E dimensions, where n1E is the number ofinitiating events. The plant damage state frequencies f(PDS) constitute a vector of nPDs dimension, wherenPDs is derived from f(IE) by multiplying it by the n1E by npDs matrix [P(IE -+ PDS)]. P(IEh - PDSI isthe conditional probability that initiating event h will result in plant damage state . In the detailed analysesunderlying this study, there are approximately 20 plant damage states. The f(PDS) vector is a product ofthe accident frequency analysis.
Similarly, to obtain the accident progression bin frequencies, the plant damage state vector is multiplied bythe accident progression tree output matrix P(PDS -+ APB)]. The P(PDS -+ APB)J matrix is theprincipal product of the accident progression analysis. This npDs by nApB matrix represents the conditional
'This section adapted, with editorial modification, from Section 2 of Reference A.2.
A-45 NUREG-1 150

z Crl 0v
U'
Sy
stem
sA
naly
sis
Acc
i de
ntP
rog
ressi
onA
naly
sis
Sourc
e
Term
Analy
sis
Con
seq
ue
nce
An
aly
sis
Ris
k
Re
su
lts
LHS#
1 f(PD
S)
i
fnP
DS
] x
LHS#2 f(
PDS)
pDS
LHS#
nLH
Sf(
PDS)
E1 *--
---f
n P
]X
P (PDS
-APB
)P(
APBS
-STG
) C(
STG
)
1 tl
P1
2 ...
..P
1nS
C
1t
C12
...
p21
-C21
Ij L
APB1
.. nA
pB ST
Gj
CnST
G
RIS
K
a
[RIS
KI
......
R
ISK
C]
P(PD
S-AP
B)
P1
1P12
....
.P
inA
PB
P21
X
P(AP
B-.S
TG)
P11
P12
...-
Pjn
STG
Pt
Pn
IP05
.....
Pn
nPD
S A
PB
Pn
IA
PB
BSGPn
nA
PB
ST
G
x x
C(ST
G)ci
1 Ci 2
.......
CC
n CC 2
1
Cn
I
...
Pn n
STG
S
TG C
C(ST
G)
C1
1C12
......
. .
C
C2
1
= C
RIS
K .
RIS
Kj1
RIS
K
= [R
ISK
I ..
RTS
Kn
3
RISK
P(PDS-*APB)
p 11
P1
2...
...P
jn
P21
Ap8]
X
P (APB
-.ST
G)
P11
P 12
.--
Pin
STG
P 2t
Pn
1
....
. Pn
n
APB
APB
STG
Pn
1 ..
Pn
nPD
S PD
S AP
BC
n
tS
TGn
nS
TG C
Figu
re A
. 16
Mat
rix f
orm
ulat
ion
of ri
sk a
naly
sis
calc
ulat
ion.

Appendix A
probability that an accident grouped in plant damage state I will result in an accident grouped in the jthaccident progression bin. In the detailed analyses underlying this study, there are between a few hundredand a few thousand accident progression bins (nApB = 1000) depending on the plant.
The result of the previous calculation is multiplied by a third matrix that represents the outcome of thesource term and partitioning analyses P(APB -+ STG) . This nAPB by nsTG matrix represents theconditional probability that an accident progression bin i will be assigned to source term group k. Thereare approximately 50 source term groups (nsrG = 50). This yields a vector f(STG) of frequencies of thesource term groups.
The final element of the risk calculation is a matrix representing the consequences for each of the sourceterm groups C. The nSTG by nc matrix is the product of the consequence analysis, where nc represents thenumber of consequence measures. For this study, eight consequence measures were calculated (nc = 8).Risk is the product of the frequency vector for the source term groups f (STG) and the consequence matrixC. Risk is an eight-component vector, for the eight consequence measures, and represents consequencesaveraged over the source term groups.
There are nLHs sets of vectors and matrices described above, one for each sample member. Each samplemember represents a unique set of values for each uncertainty issue and is equally likely. Sinceconsequence uncertainty was not included in LHS sampling, only one consequence matrix C is required;the last term in Figure A.16 is the same for each and every sample member.
The matrix manipulations described above were carried out using the RISQUE code. The risk calculationis a fairly straightforward process, but the number of numerical manipulations is large, since the risk vectormust be calculated nLHs times, where nLHs is 150 for the Zion calculation, 200 for the Surry, Sequoyah,and Peach Bottom calculations, and 250 for the Grand Gulf calculation. Results form a distribution in riskvalues that represent the uncertainty associated with the issues.
The Monte Carlo-based techniques are amenable to statistical examination to provide insights concerningthe result. Descriptive statistics such as central measures, variance, and range can be calculated. Therelative importance of the issues to uncertainty in risk can be determined through examination of theresults with statistical techniques such as regression analysis. The individual observations can also beexamined. For example, if the final distribution contains some results that are quite different from all theothers (say five observations an order of magnitude higher in consequences than any other observations),the individual five sample members can be examined as separate complete risk analyses to determine theimportant effects causing the overall result.
One of the key developments in this program is the automation of the risk assembly process. The mostsignificant advantage of this methods package is the ability to recalculate an entire risk result veryefficiently, even given major changes in the constituent analyses. The manipulation of these models insensitivity studies allows efficient, focused examination of particular issues and significant ability forexamining changes in the plants or in the analysis.
The objectives of the program included not only calculations and conclusions concerning the risk results,but also intermediate results were quite important. Each of the analysis steps resulted in intermediateoutputs. The intermediate outputs were examined by analysts to ensure the correctness of each step. Thenomenclature and representation of the results described in this section are used consistently throughoutthe documentation of both the methods and the results for a specific plant. The same intermediate resultsare illustrated for each facility, and the terminology used to describe those results is consistent with thatdeveloped here.
A.8.2 Products of Risk Calculation
The risk analyses performed in the NUREG-1150 project can be displayed in a variety of ways. Thespecific products shown in NUREG-1150 are described in the following sections, with similar productsprovided for early fatality risk, latent cancer fatality risk, average individual early fatality risk within 1 mile(for comparison with NRC safety goals (Ref. A. 14)), average individual latent cancer fatality risk within10 miles of the site boundary (for safety goal comparison), population dose risk within 50 miles, andpopulation dose risk within the entire region.
A-47 NUREG-l1SO

Appendix A
* The totar risk from internal events and, where estimated, for external events
Reflecting the uncertain nature of risk results, such results can be displayed using a probabilitydistribution. For Part II of NUREG-1 150 (plant-specific results), a histogram is used to represent thisprobability distribution (like that shown on the right side of Fig. A. 6). Four measures of theprobability distribution are identified in NUREG-1150:- Mean,
- Median,
- 5th percentile, and
- 95th percentile.
A second display of risk results is used in Part III of this report, where results for all five plants aredisplayed together. This rectangular display (shown on the left side of Fig. A. 6) provides a summaryof these four specific measures in a simple graphical form.
* Contributions of plant damage states and accident progression bins to mean risk
The risk results generated in the NUREG-1150 project can be studied to determine the relativecontribution of individual plant damage states and accident progression bins to the mean risk. Anexample display of the results of such a study is shown in Figure A.17.
A.9 Additional Explanation of Some Figures, Tables, and Terms
A.9.1 Additional Explanation of Some Figures and Tables
Most of the results presented in this report are generalized or summary results. They are similar to theintermediate results described in Section A.8. 1. However, the groupings of postulated accidents that takeplace at the end of each constituent part of the risk calculation are more general in this document than inthe contractor reports and than described in Section A. 8.1. For example, in reporting the results for theSurry power plant, only five (summary) plant damage states are used, rather than the nine plant damagestates described in the supporting documents. The descriptions of the results at both levels of detail areconsistent with each other, and one can derive the more generalized results presented in this documentfrom those presented in the supporting documents. Details of this derivation are presented in thesupporting documents.
Since a Latin hypercube sample of size nLHs is being used for the risk analyses, there are nLHS values ofthe generalized frequency vectors f(IE), f(PDS), f(APB), f(STG), and RISK. (PDS, APB, and STG referto the generalized groupings of projected accidents used in this report.) Due to the nature of Latinhypercube sampling, each of these observations has probability equal to 1/nLHs, Thus, the mean value ofthe ith element of the vector f(PDS), (i.e., f( PDSI )) is given by
f(PDSI)mean = n f(PDSi)n/nLHs
where f(PDS) n is the frequency of the generalized plant damage state i for Latin hypercube member n.Further, individual analysis results for the nLHs sample elements can be ordered from the smallest to thelargest and then used to estimate desired quantiles (i.e., 5th, median, and 95th), where the 'q'th quantileis the value of the variable that is greater than or equal to the 'q' of the observed results. Median is thecommonly used term for the 50th quantile.
The nLHs values of f(PDSi) can also be used to construct estimated probability density functions forf(PDSi). The estimated density function is constructed by discretizing the range of values of f(PDSI) into anumber of equal intervals. The estimated density function over each of these intervals is the fraction ofLatin hypercube members with values that fall within that interval. In Figure A. 18, Pmis an estimate of theprobability that f(PDSi) will fall in interval Im. However, because most of the histograms/density plotspresented in NUREG-1150 span several orders of magnitude, the plots are provided on a logarithmicscale. Thus, the corresponding histogram/density functions presented are for the logarithm of the variableunder consideration. In these cases, the histogram/density functions represent the probability that the
NUREG-1 150 A-48

Appendix A
SURRY EARLY FATALITY
MEAN * 2E-S/RY
SURRY LATENT CANCER FATALITY
MEAN * .2E-3/RY
_.,4,_ 42
Plant Damage States
1. So2. A7WS3. TRANSIENTS4. LOCAe. BYPASS
SURRY EARLY FATALITY
MEAN * 2E-G/RY
SURRY LATENT CANCER FATALITY
MEAN * 6.2E-S/RY
2
1
5 5\Z
Accident Progression Bins
1. Vt. Early CF. Alpha Mods2. VS. Early CF, RCS Prsure 200 pla at VB3. VS, Early CF, RCS Preseure 200 pla at VB4. VD, BMT and LalW Leak6. SypacaS. VS. No CF7, No VS
Figure A.17 Example display of relative contributions to mean risk.
A-49 NUREG-1150

Appendix A
f(PDSi):
frequencyof PDSi
Im 4-1 -- ::1
tPM
probability that f(PDSI) e m
Figure A.18 Probability that f(PDS) will fall in interval I.
NUREG-1 150 A-50

Appendix A
logarithm of the variable falls in various intervals. Whether a density function is for a variable or itslogarithm can be recognized by the scale used on the axis corresponding to the variable.
Explanation of Figure A.6: Figure A.6 represents an estimated probability density function, as explainedabove, for the total core damage frequency. The total core damage frequency for a single observation isrelated to the vector f(PDSh) by
total core damage frequency = TCDF = 2i f(PDSi).
Total core damage frequency is calculated for each observation and used to estimate a core damagehistogram as described above.
Explanation of Figure A.7: Figure A. 7 shows the mean value of the total core damage frequency, wherethe mean is over all the Latin hypercube sample members, as explained above. The fractionalcontributions indicated by sections of the pie charts are the ratios of the mean values of the frequencies ofthe summary plant damage states f(PDSi) to the mean value of the total core damage frequency.
Explanation of Figure A. IO: Figure A. 10 is a table of mean transition probabilities (the mean taken overall Latin hypercube members) of the matrix (P(PDS-+APB)), using summary plant damage states andsummary accident progression bins. The summary plant damage states and accident progression bins aredescribed in the figure and the figure key.
Explanation of Figures A. 13 and A. 14: The results of the risk analyses are also used in the construction ofcomplementary cumulative distribution functions (CCDFs). Examples of mean CCDFs appear in FiguresA. 13 and A. 14. The CCDFs in Figure A. 13 are for source term magnitude. The CCDFs in Figure A. 14are for consequence results and incorporate both stochastic weather variation and variation/uncertainty inaccident initiation, progression, and source term characteristics. In figures of this type, the value on theordinate (y-axis) gives the frequency at which the corresponding value on the abscissa (x-axis) isexceeded. A discussion of the construction of the CCDFs is provided in Appendix B.
A.9.2 Explanation of Some Terms
An uncertain variable (often called a random variable in statistical texts) can take on any of severalpossible values, but it is impossible to predict which value will be observed in any given trial. The possiblespecific values are called realizations of the uncertain variable. Although there is no precise knowledgewhich realization will occur, there is a rule that tells which of the possible realizations is most likely; infact, the rule quantifies the likelihood of each possible realization. The rule is called a probabilitydistribution. For any possible realization, the probability distribution tells the probability of that valueoccurring.
There is controversy about the meaning of the probability distribution. The two principal interpretationsare the frequentist and the subjective approaches. The frequentist orientation defines the probability asthe frequency of obtaining the specific value in a very long number of independent trials. For example, ifthe uncertain variable took the value xl 500 times out of 1000 trials, then the probability attached to thevalue x1 is 0.50. The subjective approach defines the probability as an individual's degree of belief in thelikelihood of obtaining the specific value. The subjective probability can be defined as the odds that anindividual would be equally willing to give or take on a bet that the uncertain variable would have thespecific value. For example, if an individual will accept even money odds that the uncertain variable willhave the value x1 and is equally willing to take either side of the bet, then his probability for the value xlis 0.50.
For many variables, the probability distribution for their realizations is unknown or the laws of natureaffecting the probability distribution are imperfectly understood. However, an expert might understandwhich laws could apply and have an opinion as to which law is more likely. If the expert combines hisknowledge of the known parts of the situation with his opinions about the relevant unknown parts, he candevelop a personal estimate of the probability distribution. This is a subjective probability distribution(SPD). It is subjective because it varies from one expert to another. SPDs are manipulated by preciselythe same rules as probability distributions developed from a frequentist approach.
A-51 NUREG-1 150

Appendix A
If, in a group of experts who are representative of the possible pool of experts, each expert produces asubjective probability distribution, the distributions of the group members can be aggregated or combinedin such a way that the aggregate distribution can be generalized to the entire pool of possible experts. *The most important uncertain variables of this study were developed by groups of experts and soaggregated.
There is an important difference in interpretation between subjective probability distributions anddata-based probability distributions. The latter represent the probability that a specific value will occur ona given trial. The SPD expresses a degree of belief that the value might occur. The distribution can beconsidered a distribution of belief rather than of knowledge. It must not be supposed that any value will berealized with the probability indicated by the SPD, nor even that an occurrence must be contained withinthe experts' aggregated range. However, although experts are sometimes wrong, the aggregated opinionsof experts should be superior to the opinions of non-experts.
Most of the variables in this study are actually continuous and have an infinite number of possiblerealizations. Almost all uncertain variables have a minimum possible value and a maximum possible value;the distance between the two is the range of the uncertain variable. The probability that the uncertainvariable will take on just one value out of an infinite number of possible values within the range is zero.However, it is possible to speak of the density of probability about any specific value. The rule thatdescribes the density of probability over the range of the variable is the probability density function(PDF). It is the probability that a realization will occur within the neighborhood of each value, divided bythe width of the neighborhood. The integral of the PDF over the range is 1.0; this says that any realizationmust be within the range. The integral of the PDF between the minimum value of the range and anyspecific point in the range is the probability that the next realization will have a value less than or equal tothe specific point. If the integral is carried out for every point in the range, the resulting function is thecumulative distribution function (CDF) or cumulative probability distribution (CPD). The CDF was usedto characterize the uncertainty in each of the sampled variables considered in this study but does notgenerally appear in this report.
The complementary cumulative distribution function (CCDF) is closely related to the CDF. It is theprobability that the "true" realization will be greater than any specific point in the range. The CCDF issimply 1.0 minus the CDF at every point. The CCDF is used in some instances in this report.
The PDF is difficult to compute accurately from a limited sample of data. However, the PDF can beapproximated by the frequency histogram. This is the number of observations falling in each finite intervalof the range. If the intervals are suitably chosen, the frequency histogram can be a good approximation ofthe PDF. Frequency histograms are often used in this report.
Initiating events are characterized by their frequency-the number of times such events can be expected tooccur per year. As long as the frequency is substantially less than 1.0, this is equivalent to the probabilityof the event occurring in any given year. Succeeding events are characterized by their conditionalprobability. The conditional probability of B given A is the probability that B will occur if A has alreadyoccurred. The characterization of succeeding events can also be thought of as a relative frequency, that is,their frequency relative to the frequency of the preceding event. The methods for manipulation of chainsof conditional probabilities are well known.
Additional information on statistics and probability can be found in References A.74 through A.78.
'This is so because (absent any other information about the population) the sample mean is the best estimate of the popula-tion mean, and the population mean (absent any special information about individuals in the population) is the bestestimate of the responses of any member of the population.
NUREG-1150 A-52

Appendix A
REFERENCES FOR APPENDIX A
A.1 D. M. Ericson, Jr., (Ed.) et al., "Analysis of Core Damage Frequency: Internal Events Methodol-ogy," Sandia National Laboratories, NUREG/CR-4550, Vol. 1, Revision 1, SAND86-2084,January 1990.
A.2 E. D. Gorham-Bergeron et al., "Evaluation of Severe Accident Risks: Methodology for theAccident Progression, Source Term, Consequence, Risk Integration, and Uncertainty Analyses,"Sandia National Laboratories, NUREGICR-4551, Vol. 1, Draft Revision 1, SAND86-1309, to bepublished. *
A.3 U.S. Nuclear Regulatory Commission (USNRC), "Reactor Risk Reference Document,"NUREG-1150, Vols. 1-3, Draft for Comment, February 1987.
A.4 F. T. Harper et al., "Analysis of Core Damage Frequency from Internal Events: MethodologyGuidelines," Sandia National Laboratories, NUREG/CR-4550, Vol. 1, SAND86-2084, September1987.
A.5 A. S. Benjamin et al., "Evaluation of Severe Accident Risks and the Potential for Risk Reduction:Surry Power Station, Unit 1," Sandia National Laboratories, NUREGICR-4551, Vol. 1, Draft forComment, SAND86-1309, February 1987.
A.6 A. S. Benjamin et al., "Containment Event Analysis for Postulated Severe Accidents: SurryNuclear Power Station, Unit 1," Sandia National Laboratories, NUREG/CR-4700, Vol. 1, Draftfor Comment, SAND86-1135, February 1987.
A.7 H. J. C. Kouts et al., "Methodology for Uncertainty Estimation in NUREG-1150 (Draft):Conclusions of a Review Panel," Brookhaven National Laboratory, NUREG/CR-5000, BNL-NUREG-52119, December 1987.
A.8 W. E. Kastenberg et al., "Findings of the Peer Review Panel on the Draft Reactor Risk ReferenceDocument, NUREG-1150," Lawrence Livermore National Laboratory, NUREG/CR-5113,UCID-21346, May 1988.
A.9 L. LeSage et al., "Initial Report of the Special Committee on Reactor Risk Reference Document(NUREG-1150)," American Nuclear Society, April 1988.
A. 10 J. M. Griesmeyer and L. N. Smith, "A Reference Manual for the Event Progression Analysis Code(EVNTRE)," Sandia National Laboratories, NUREG/CR-5174, SAND88-1607, September 1989.
A.11 H-N Jow et al., "XSOR Codes User's Manual," Sandia National Laboratories, NUREG/CR-5360,SAND89-0943, to be published.*
A.12 D. I. Chanin, H-N Jow, J. A. Rollstin et al., "MELCOR Accident Consequence Code System(MACCS)," Sandia National Laboratories, NUREG/CR-4691, Vols. 1-3, SAND86-1562, Febru-ary 1990.
A. 13 L. T. Ritchie et al., "CRAC2 Model Description," Sandia National Laboratories, NUREG/CR-2552, SAND82-0342, April 1984.
A. 14 USNRC, "Safety Goals for the Operation of Nuclear Power Plants; Policy Statement," FederalRegister, Vol. 51, p. 30028, August 21, 1986.
-A. 15 M. D. McKay et al., "A Comparison of Three Methods for Selecting Values in Input Variables inthe Analysis of Output from a Computer Code," Technometrics 21(2), 1979.
A. 16 M. T. Drouin et al., "Analysis of Core Damage Frequency: Grand Gulf Unit 1," Sandia NationalLaboratories, NUREG/CR-4550, Vol. 6, Revision 1, SAND86-2084, September 1989.
*Available in the NRC Public Document Room, 2120 L Street NW., Washington, DC.
A-53 NUREG-1150

Appendix A
A. 17 A. D. Swain III, "Accident Sequence Evaluation Program-Human Reliability Analysis Procedure,"Sandia National Laboratories, NUREG/CR-4772, SAND86-1996, February 1987.
A. 18 W. J. Luckas, Jr., "A Human Reliability Analysis for the ATWS Accident Sequence with MSIVClosure at the Peach Bottom Atomic Power Station," Brookhaven National Laboratory, May 1986.
A. 19 D. W. Stack, "A SETS User's Manual for Accident Sequence Analysis," Sandia NationalLaboratories, NUREG/CR-3547, SAND83-2238, January 1984.
A.20 R. L. Iman and M. J. Shortencarier, "A User's Guide for the Top Event Matrix Analysis Code(TEMAC)," Sandia National Laboratories, NUREG/CR-4598, SAND86-0960, August 1986.
A.21 M. B. Sattison and K. W. Hall, "Analysis of Core Damage Frequency: Zion Unit 1," IdahoNational Engineering Laboratory, NUREG/CR-4550, Vol. 7, Revision 1, EGG-2554, May 1990.
A.22 Commonwealth Edison Company of Chicago, "Zion Probabilistic Safety Study," September 1981.
A.23 D. L. Berry et al., "Review and Evaluation of the Zion Probabilistic Safety Study: Plant Analysis,"Sandia National Laboratories, NUREGICR-3300, SAND83-1118, May 1984.
A.24 USNRC, "Reactor Safety Study-An Assessment of Accident Risks in U.S. Commercial NuclearPower Plants," WASH-1400 (NUREG-75/014), October 1975.
A.25 Institute of Electrical and Electronics Engineers, Inc. (IEEE), "IEEE Guide to the Collection andPresentation of Electrical, Electronic, Sensing Component, and Mechanical Equipment ReliabilityData for Nuclear-Power Generating Stations," IEEE Standard 500-1984, 1983.
A.26 Houston Lighting and Power Company, "South Texas Project Probabilistic Safety Assessment,"April 1989.
A.27 K. D. Russell et al., "Integrated Reliability and Risk Analysis System (IRRAS) Version 2.0 User'sGuide," Idaho National Engineering Laboratory, NUREG/CR-5111, EGG-2535, June 1990.
A.28 R. C. Bertucio and J. A. Julius, "Analysis of Core Damage Frequency: Surry Unit 1," SandiaNational Laboratories, NUREG/CR-4550, Vol. 3, Revision 1, SAND86-2084, April 1990.
A.29 G. E. Cummings, "Summary Report on the Seismic Safety Margins Research Program," LawrenceLivermore National Laboratory, NUREG/CR-4431, UCID-20549, January 1986.
A.30 M. P. Bohn et al., "Application of the SSMRP Methodology to the Seismic Risk at the ZionNuclear Power Plant," Lawrence Livermore National Laboratory, NUREG/CR-3428,UCRL-53483, January 1984.
A.31 D. L. Bernreuter et al., "Seismic Hazard Characterization of 69 Nuclear Power Sites East of theRocky Mountains," Lawrence Livermore National Laboratory, NUREG/CR-5250, Vols. 1-8,UCID-21517, January 1989.
A.32 Seismicity Owners Group and Electric Power Research Institute, "Seismic Hazard Methodology forthe Central and Eastern United States," EPRI NP-4726, July 1986.
A.33 J. E. Richardson, USNRC, letter to R. A. Thomas, Seismicity Owners Group, "Safety EvaluationReview of the SOG/EPRI Topical Report Titled 'Seismic Hazard Methodology for the Central andEastern United States,' " dated September 20, 1988.
A.34 U.S. Army Corps of Engineers, Huntsville Division, SAFEGUARD Shock Test Program,HNDDSP-72-151-ED-R, Vol. 1, 1973.
A.35 M. P. Bohn and J. A. Lambright, "Procedures for the External Event Core Damage FrequencyAnalyses for NUREG-1150," Sandia National Laboratories, NUREG/CR-4840, SAND88-3102,November 1990.
NUREG-1150 A-54

Appendix A
A.36 P. B. Schnabel, J. Lysmer, and H. B. Seed, "SHAKE-A Computer Program for EarthquakeResponse Analysis of Horizontally Layered Sites," Earthquake Engineering Research Center,University of California at Berkeley, EERC 72-12, 1972.
A.37 H. L. Wong and J. E. Luco, "Soil-Structure Interaction: A Linear Continuum MechanicsApproach (CLASSI)," Department of Civil Engineering, University of Southern California,CE79-03, 1980.
A.38 Code of Federal Regulations, Appendix R, "Fire Protection Program for Nuclear Power FacilitiesOperating Prior to January 1, 1979," to Part 50, "Domestic Licensing of Production and UtilizationFacilities," of Title 10, "Energy."
A.39 V. Ho et al., "COMPBRN III-A Computer Code for Modeling Compartment Fires," University ofCalifornia at Los Angeles, UCLA-ENG-8524, November 1985.
A.40 S. S. Dosanjh, "MELPROG-PWR/MOD1: A Two-Dimensional, Mechanistic Code for Analysis ofReactor Core Melt Progression and Vessel Attack Under Severe Accident Conditions," SandiaNational Laboratories, NUREG/CR-5193, SAND88-1824, May 1989.
A.41 K. D. Bergeron et al., "User's Manual for CONTAIN 1.0, A Computer Code for Severe ReactorAccident Containment Analysis," Sandia National Laboratories, NUREG/CR-4085, SAND84-1204, July 1985.
A.42 J. A. Gieseke et al., "Source Term Code Package: A User's Guide," Battelle Columbus Division,NUREG/CR-4587, BMI-2138, July 1986.
A.43 Fauske and Associates, Inc., "MAAP Modular Accident Analysis Program User's Manual, " Vols.I and II, IDCOR Technical Report 16.2-3, February 1987.
A.44 R. M. Summers et al., "MELCOR In-Vessel Modeling," Proceedings of the Fifteenth WaterReactor Safety Information Meeting (Gaithersburg, MD), NUREG/CP-0091, Feburary 1988.
A.45 N. K. Tutu et al., "Estimation of Containment Loading Due to Direct Containment Heating for theZion Plant," Brookhaven National Laboratory, NUREG/CR-5282, BNL-NUREG-52181, to bepublished. *
A.46 F. T. Harper et al., "Evaluation of Severe Accident Risks: Quantification of Major InputParameters," Sandia National Laboratories, NUREG/CR-4551, Vol. 2, Revision 1, SAND86-1309, December 1990.
A.47 R. J. Breeding et al., "Evaluation of Severe Accident Risks: Surry Unit 1," Sandia NationalLaboratories, NUREG/CR-4551, Vol. 3, Revision 1, SAND86-1309, October 1990.
A.48 A. C. Payne, Jr., et al., "Evaluation of Severe Accident Risks: Peach Bottom Unit 2," SandiaNational Laboratories, NUREG/CR-4551, Vol. 4, Draft Revision 1, SAND86-1309, to bepublished. *
A.49 J. J. Gregory et al., "Evaluation of Severe Accident Risks: Sequoyah Unit 1," Sandia NationalLaboratories, NUREG/CR-4551, Vol. 5, Revision 1, SAND86-1309, December 1990.
A.50 T. D. Brown et al., "Evaluation of Severe Accident Risks: Grand Gulf Unit 1," Sandia NationalLaboratories, NUREG/CR-4551, Vol. 6, Draft Revision 1, SAND86-1309, to be published.*
A.51 C. K. Park et al., "Evaluation of Severe Accident Risks: Zion Unit 1," Brookhaven NationalLaboratory, NUREG/CR-4551, Vol. 7, Draft Revision 1, BNL-NUREG-52029, to be published.*
A.52 K. Mokhtarian et al., "MARK I Containment Severe Accident Analysis for the MARK I Owners'Group," CBI NA-CON, Inc., April 1987.
*Available in the NRC Public Document Room, 2120 L Street NW., Washington, DC.
A-55 NUREG-1 150
Appendix A
A.53 D. B. Clauss, "Comparison of Analytical Predictions and Experimental Results for a 1:8-ScaleSteel Containment Model Pressurized to Failure," Sandia National Laboratories, NUREG/CR-4209, SAND85-0679, September 1985.
A.54 S. J. Higgins, "A User's Manual for the Postprocessing Program PSTEVNT," Sandia NationalLaboratories, NUREG/CR-5380, SAND88-2988, November 1989.
A.55 R. S. Denning et al., "Radionuclide Release Calculations for Selected Severe Accident Scenarios,"Battelle Columbus Division, NUREG/CR-4624, Vols. 1-5, BMI-2139, July 1986.
A.56 R. S. Denning et al., "Radionuclide Release Calculations for Selected Severe Accident Scenarios:Supplemental Calculations," Battelle Columbus Division, NUREG/CR-4624, Vol. 6, BMI-2139,August 1990.
A.57 R. L. Iman et al., "PARTITION: A Program for Defining the Source Term/Consequence AnalysisInterface in the NUREG-1150 Probabilistic Risk Assessments," Sandia National Laboratories,NUREG/CR-5253, SAND88-2940, May 1990.
A.58 D. Bennett, "SANDIA-ORIGEN User's Manual," Sandia National Laboratories, NUREG/CR-0987, SAND79-0299, December 1979.
A.59 G. A. Briggs, "Plume Rise Prediction," Proceedings of Workshop: Lectures on Air Pollution andEnvironmental Analysis, American Meteorological Society, 1975.
A.60 D. C. Kocher, "Dose Rate Conversion Factors for External Exposure to Photons and Electrons,"Oak Ridge National Laboratory, NUREG/CR-1918, ORNL/NUREG-79, August 1981.
A.61 International Commission on Radiological Protection, "Recommendations of CRP," Publication26, Annals of ICRP, Vol. , No. 3, 1977.
A.62 International Commission on Radiological Protection, "Limits for Intakes of Radionuclides byWorkers," Publication 30, Annals of ICRP, Vol. 2, Nos. 3 and 4, 1978.
A.63 U. S. Environmental Protection Agency, "Manual of Protective Action Guides and ProtectiveActions for Nuclear Incidents," Office of Radiation Programs, Draft, 1989.
A.64 J. S. Evans et al., "Health Effects Model for Nuclear Power Plant Accident ConsequenceAnalysis," Harvard University, NUREG/CR-4214, SAND85-7185, August 1985.
A.65 U.S. National Research Council, National Academy of Sciences, Committee on the BiologicalEffects of Ionizing Radiation, "The Effects on Populations of Exposure to Low Levels of IonizingRadiation: 1980," National Academy Press, 1980.
A.66 R. L. Iman and J. C. Helton, "A Comparison of Uncertainty and Sensitivity Analysis Techniquesfor Computer Models," Sandia National Laboratories, NUREG/CR-3904, SAND84-1461, May1985.
A. 67 P. A. Seaver, "Assessments of Group Preferences and Group Uncertainty for Decision Making,"University of Southern California, Social Sciences Research Institute, 1976.
A.68 J. M. Booker and M. A. Meyer, "Sources and Effects of Interexpert Correlation: An EmpiricalStudy," IEEE Transactions on Systems, Man, and Cybernetics, Vol. 18, No. 1, pp. 135-142,1988.
A.69 S. Lictenstein et al., "Calibration of Probabilities: The State of the Art to 1980," Judgment UnderUncertainty: Heuristics and Biases, Cambridge University Press, 1982.
A.70 J. S. Armstrong et al., "Use of the Decomposition Principle in Making Judgments," OrganizationalBehavior and Human Performance, 14: 257-263, 1975.
NUREG-1150 A-5 6

Appendix A
A.71 I. C. Janis, Victims of Group Think A Psychological Study of Foreign Policy Decisions andFiascoes, Houghton Mifflin, Boston, MA.
A.72 H. F. Martz et al., "Eliciting and Aggregating Subjective Judgment-Some Experimental Results,"Proceedings of the 1984 Statistical Symposium on National Energy Issues (Seattle, WA),NUREG/CP-0063, July 1985.
A.73 T. A. Wheeler et al., "Analysis of Core Damage Frequency from Internal Events: Expert JudgmentElicitation," Sandia National Laboratories, NUREG/CR-4550, Vol. 2, SAND86-2084, April 1989.
A.74 I. J. Good, "Axioms of Probability," Encyclopedia of Statistical Sciences, Vol. 1, pp. 169-176,Wiley, New York, 1983.
A.75 E. Sverdrup, "Frequency Interpretation in Probability and Statistical Inference," Encyclopedia ofStatistical Sciences, Vol. 3, pp. 225-231, Wiley, New York, 1983.
A.76 T. L. Fine, "Foundation of Probability," Encyclopedia of Statistical Sciences, Vol. 3, pp.175-184, Wiley, New York, 1983.
A.77 R. V. Hogg and A. T. Craig, Introduction to Mathematical Statistics, 3rd Ed., Macmillan, NewYork, 1970.
A.78 V. Barnett, Comparative Statistical Inference, 2nd Ed., Wiley, New York, 1982.
A-57 NUREG-1150