Embed Size (px)
Citation preview

HAL Id: hal-03031024https://hal.archives-ouvertes.fr/hal-03031024
Submitted on 30 Nov 2020
HAL is a multi-disciplinary open accessarchive for the deposit and dissemination of sci-entific research documents, whether they are pub-lished or not. The documents may come fromteaching and research institutions in France orabroad, or from public or private research centers.
L’archive ouverte pluridisciplinaire HAL, estdestinée au dépôt et à la diffusion de documentsscientifiques de niveau recherche, publiés ou non,émanant des établissements d’enseignement et derecherche français ou étrangers, des laboratoirespublics ou privés.
Distributed under a Creative Commons Attribution - NonCommercial - NoDerivatives| 4.0International License
Severe undernutrition increases bleeding risk onvitamin-K antagonists
Farès Moustafa, Loïc Dopeux, Aurelien Mulliez, Yves Boirie, ChristineMorand, Elodie Gentes, Nicolas Farigon, Damien Richard, Aurélien Lebreton,
Dorian Teissandier, et al.
To cite this version:Farès Moustafa, Loïc Dopeux, Aurelien Mulliez, Yves Boirie, Christine Morand, et al.. Severe under-nutrition increases bleeding risk on vitamin-K antagonists. Clinical Nutrition, Elsevier, 2021, 40 (4),pp.2237-2243. �10.1016/j.clnu.2020.10.002�. �hal-03031024�

1
Severe undernutrition increases bleeding risk on vitamin-K antagonists
Farès Moustafa MD. PhD 1,2, Loïc Dopeux MD 1, Aurelien Mulliez 3, Yves Boirie MD. PhD 4,5, Christine Morand MD. PhD 6, Elodie Gentes MD 4,5, Nicolas Farigon4, Damien Richard MD 7, Aurélien Lebreton MD. PhD 6,8,9, Dorian Teissandier MD1, Frederic Dutheil MD. PhD 1,2,10,11, and Jeannot Schmidt MD 1,2
1 Emergency department, Clermont-Ferrand University Hospital, Clermont-Ferrand, France
2 Université Clermont Auvergne, Clermont-Ferrand, France 3 Biostatistics Unit, DRCI, Clermont-Ferrand University Hospital, Clermont-Ferrand, France 4 Service de Nutrition Clinique, CHU Clermont-Ferrand, unité de nutrition humaine, INRA, Université
Clermont Auvergne, 63003, Clermont-Ferrand, France. 5 Université Clermont-Auvergne, Unité de Nutrition, CRNH, Clermont-Ferrand 6 Université Clermont Auvergne, INRAE, UNH, Unité de Nutrition Humaine, Clermont-Ferrand, France 7 Université Clermont Auvergne, CHU Clermont-Ferrand, Laboratoire de Pharmacologie et Toxicologie,
Clermont-Ferrand, France 8 Service d'Hématologie Biologique, CHU Clermont-Ferrand, Clermont-Ferrand, France. 9 Centre de Ressources et Compétences des Maladies Hémorragiques Constitutionnelles, CHU
Clermont-Ferrand, Clermont-Ferrand, France. 10 School of Exercise Science, Australian Catholic University, Melbourne, VIC, Australia
11 UMR CNRS 6024, “Physiological and psychosocial stress” team, LAPSCO, Clermont-Ferrand, France
Word count abstract: 250
Word count article (excluding title page, abstract, references, tables): 2850
Keywords: Undernutrition; Bleeding; Anticoagulant agent; Micronutriment.
Corresponding author:
Farès Moustafa, Service des urgences, CHU Clermont-Ferrand, 58 rue Montalembert, F-63003 Clermont-Ferrand Cedex 1, FRANCE Email address: [email protected] Phone number: +33 (0)624366369

2
Abstract
Introduction. Hemorrhage occurs in 7 to 10% of patients treated with vitamin K
antagonist (VKA), with major bleeding in 1 to 3%. Impact of nutritional status on the
bleeding risk of patients on anticoagulants is still poorly documented. Our study aimed
to analyze the link between the nutritional status of patients on VKA and the occurrence
of hemorrhagic events. We also analyzed micronutrients status.
Methods. A case-control, monocentric, and prospective study was conducted from
August 2012 to October 2015. The case patients were those presenting with major
bleeding and control patients those without any bleeding under VKA treatment.
Results. Overall, 294 patients under VKA treatment were paired according to age,
gender, and index normalized ratio (INR). Out of these, 98 (33.3%) had major bleeding
and 196 (66.7%) did not have any bleeding. Additionally, more than two-thirds of
patients displayed undernutrition, which was more prevalent in bleeding than non-
bleeding patients (OR = 1.85, CI95%: 1.07 - 3.21). There was a higher bleeding risk
for those with severe undernutrition (OR = 2.66, CI95%: 1.58 - 4.46), with no difference
found concerning moderate undernutrition. Bleeding patients had lower plasma-zinc
concentrations than non-bleeding patients (9.4±3.6 vs. 10.5±3.7µmol/L, p = 0.003);
among them, there was a higher rate of patients with plasma zinc under 5µmol/L (9%
vs. 2%, p <0.001).
Conclusion. Patients with undernutrition on VKA exhibit a significantly higher bleeding
risk, which increases three-fold in case of severe undernutrition. The evaluation of
nutritional status provides additional, valuable prognosis information prior to initiating
VKA therapy.
ClinicalTrials.gov number: NCT 01742871

3
Introduction
Vitamin-K antagonists (VKA) are the most common anticoagulants used to prevent
cerebrovascular events in patients with atrial fibrillation or a mechanical valve. VKA
therapy is also employed to prevent and treat patients with venous thrombosis.[1] A
bleeding event is an essential complication of anticoagulant therapy. Every year,
hemorrhage events occur in 7–10% of patients treated with VKA, including major
bleeding in 1–3% [2,3] The literature has described many factors that explain the
occurrence of hemorrhagic stroke, [4] including index normalized ratio (INR) >4.5 [5],
age over 80 years old, female gender, weight, genetic polymorphisms like those
encoding cytochromes P4502C9 or VKORC1 [6], catabolic or comorbid conditions,
such as congestive heart failure, liver and renal failure, and diabetes [7], as well as
polymedication, which can generate drug interactions.[4,8–10]
Many studies have examined the influence of vitamin K in food and the risk of INR
imbalance in patients on VKA.[11] These studies assert that a regular and moderate
intake of vitamin K allows for a better index normalized ratio (INR) balance under
antivitamin K.[12] However, only a few studies have investigated patients’ nutritional
status and its impact on the bleeding risk of patients on anticoagulants. Some authors
have shown that protein-energy undernutrition is a risk factor for INR imbalance,[8]
while others have reported that specific micronutrients likely interfere with the
maintenance of coagulation homeostasis. For example, vitamin-C deficiency increases
the risk of bleeding;[13] Cuper (Cu) deficiency exposes the patient to inhibition of
thrombogenesis and platelet aggregation, and prolongs prothrombin and bleeding
times;[14,15] acute depletion of zinc stores alters platelets and their aggregation,
thereby resulting in prolonged bleeding times.[16–18]

4
Therefore, the present study assessed the link between the nutritional status,
specifically the undernutrition, of patients under VKA treatment and the occurrence of
hemorrhagic events. We also analyzed the role of micronutrients in the occurrence of
hemorrhages.
Material and methods
Inclusion criteria
Patients were included in the study that were over 18 years old, on VKA, with INR
over 1.5, and that had been admitted to the emergency unit of the Clermont-Ferrand
university hospital, France. We excluded pregnant women, patients with pacemakers
or implantable defibrillators, and patients with mechanical cardiac valves.
All patients were included after obtaining their signatures for informed consent.
This research was approved by the appropriate French research ethics committee
(CPP Sud-Est VI, IRB number: 00008526) and declared on clinicaltrials.gov (NCT
01742871).
Study design
A case-control, monocentric, and prospective study was conducted from August 2012
to October 2015. The case patients were those presenting with major bleeding under
VKA treatment, in accordance with the French definition,[19] and the control patients
were those without any bleeding on VKA treatment. Control and case patients were
paired according to age, gender, and INR, with a ratio of one case for every two control
patients. In this study, bleeding was considered major if the clinician in charge of the
patient used reversal therapy with prothrombin complex concentrate (PCC).

5
The primary endpoint was the diagnosis of protein-energy undernutrition, which is
defined as undernutrition (either weight loss ≥10% within six months, weight loss ≥5%
within one month, body mass index (BMI) ≤21Kg/m2, albumin <35g/L, prealbumin
between 50–110mg/L, or MNA score <17), or severe undernutrition (either weight loss
≥15% within 6 months, weight loss ≥10% within one month, BMI ≤18Kg/m2, albumin
<30 g/L, or prealbumin <50mg/L).[20] We also calculated the fat and fat-free mass
compartment using bioelectrical impedance analysis for all included patients, the value
of which was compared to the value for healthy adults.[21–23]
The secondary endpoints were the assessment of different plasma micronutrients,
whose values were then compared with normal thresholds (vitamin B1, vitamin C, zinc,
and cupper [Cu]), along with the nutritional risk index (NRI)[24], Beyth bleeding-risk
score[25], and Pronostic Inflammatory and Nutritional Index (PINI) score.
Baseline variables
We collected data pertaining to demographics, indication for anticoagulant therapy,
anticoagulant type, length of treatment, previous bleeding events on VKA, related
treatments, physical examination, weight at one and six months, height, BMI, and
laboratory analyses for INR, prothrombin time (PT), platelet count,
albumin/prealbumin, c-reactive protein (CRP), orosomucoid, zinc, Cuper (Cu),
Selenium, vitamin B1, vitamin C, and creatinine. For zinc blood sample, we analyzed
plasma and erythrocyte concentration because if most of blood concentration was
erythrocyte zinc, plasma concentration is a good reflect of zinc protein binding which
could be impacted by undernutrition.
Statistical analysis
6
Justification for the number of subjects involved was based on a power simulation with
recruitment capacity. It similarly considered data from literature exploring the
relationship between undernutrition state and bleeding risk under VKA treatment. In
2011, in our hospital, there were 162 prothrombin complex concentrate (PCC) orders
to reverse VKA for a major bleeding accident over 46,000 patients admitted in our
emergency unit. Thus, to show a different rate of undernutrition patients between the
controls and case group, 300 patients (200 controls per 100 cases) would provide the
trial with 90% power to detect a minimum difference of 13%, at two-sided significance
level of α = 0.05.
Moreover, faced with the difficulty of evaluating the expected difference between the
two groups, two analyses were also planned for ethical reasons (the risk of
overestimating the number of patients) and methodological reasons (the re-estimation
of the expected difference). For 75 patients (50 controls and 25 cases), the difference
would be significant at 0.018 [26]. For 150 patients (100 controls and 50 cases), the
difference was significant and equal to 0.031 [26].
Statistical analyses were performed using STATA 15.0 (StataCorp, College Station).
Qualitative variables were expressed in terms of numbers and associated proportions,
while quantitative variables were reported in terms of numbers, mean, and the
associated standard deviation, median, and range.
Graphic representations are included with these analyses wherever possible.
Description are always global and by group (patients under antivitamin-K treatment,
with or without a severe hemorrhagic event that required care in the emergency
department). Comparisons between groups (anthropometric and biological, treatment)
were systematically conducted without adjusting (either a chi2 test or Fisher's exact
test for qualitative parameters and Student's t-test or Mann–Whitney test for

7
quantitative variables). A multivariable logistic regression model was performed to
analyze severe bleeding. Covariates entered in the model were selected according to
their statistical significance (p<0.2 in univariate analysis). [27] Results are shown as
odd ratio with their 95% confidence interval). All statistical tests were carried out at the
risk of error of the first species α = 5% (except interim analysis).
For the analysis of the primary endpoint, which is the rate of patients considered
undernourished, the comparison between the two groups was performed using a chi2
test or Fisher's exact test, when appropriate.
Secondary endpoints, which are the rate of micronutrient-deficient patients and
endothelial dysfunction, were analyzed in a similar manner to that described for the
qualitative parameters. Concerning comparisons between independent groups of
quantitative variables (body composition measured by bio-impedancemetry, PINI, and
RNI), data were analyzed using a Student test or Mann–Whitney U test. In case of
unsatisfied t-test conditions, normality was verified using Shapiro-Wilk test and
homoscedasticity using Fisher–Snedecor test.
Since observational studies do not allow for conclusions to be drawn in terms of
causality, the study considered the use of so-called propensity scores, which were first
proposed by Rosenbaum and Rubin.[28] This was used as a sensitivity analysis, in
order to validate the classical multivariate model. Confounding factors were selected
statistically, according to their statistical relationship with both the outcome (severe
bleeding) and the main covariate assessed (undernutrition). Propensity score
was performed using ordered logistic regression with undernutrition as dependent
variable and confounding factors as covariates. Then we performed the same
multivariate analysis (or severe bleeding) with logistic regression, with an inverse
weighting on this propensity score calculated.

8
Results
From August 2012 to January 2014, 294 patients under VKA treatment were paired:
98 (33.3%) patients with major bleeding and 196 (66,7%) without bleeding.
The mean age was 81.9±7.8 years old, with most (77.4%) of the patients on VKA for
atrial fibrillation. The age and gender ratio were similar between bleeding and non-
bleeding patients (Table 1). However, history of bleeding events was twice as high for
bleeding versus non-bleeding patients (23% vs. 10.5%, p = 0.004, respectively), while
the bleeding-risk score (Beyth score) was higher for bleeding versus non-bleeding
patients (1.8±0.7 vs. 1.5±0.7, p = 0.005, respectively).
Biological analyses revealed that bleeding patients displayed higher platelet counts
than non-bleeding patients (276.9±100.7 vs. 236.8±74.7g/L, p = 0.001, respectively).
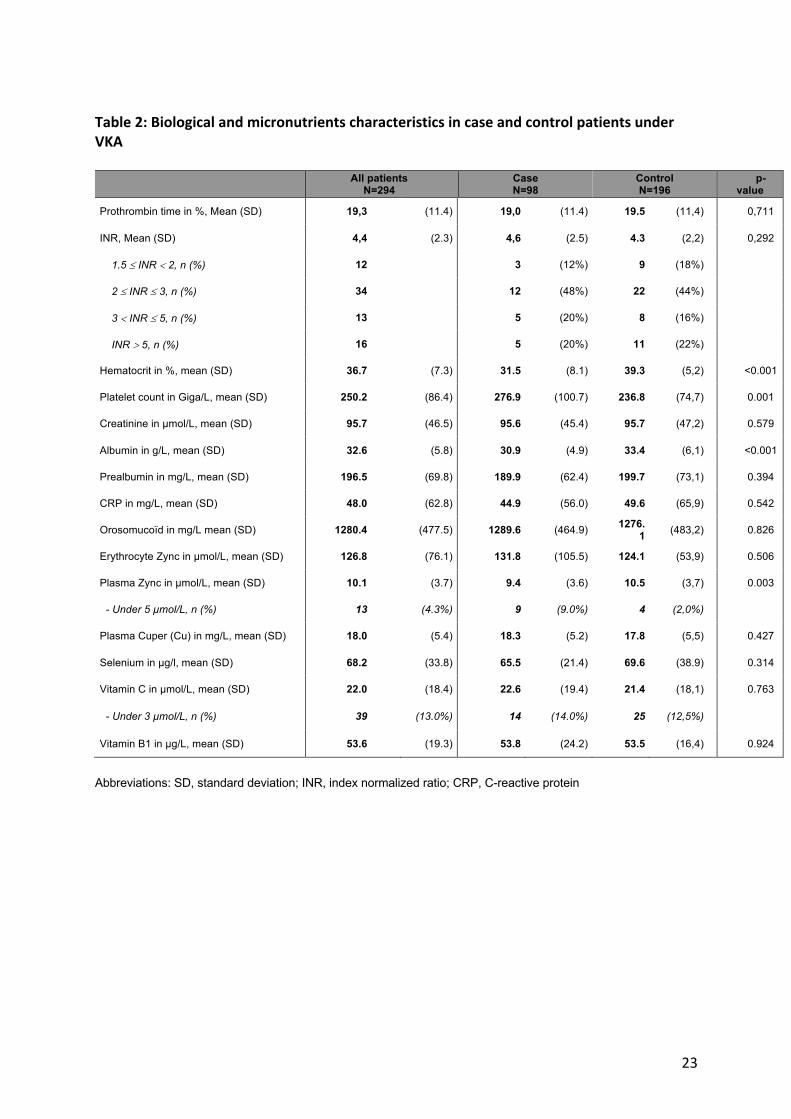
Biochemical and micronutrient characteristics are provided in Table 2. With regards to
biological-nutritional data, bleeding patients exhibited lower albumin levels than non-
bleeding patients (30.9±4.9 vs. 33.4±6.1g/L, p <0.001, respectively), without any
significant difference observed for prealbumin levels. Accordingly to the micronutrient
analysis, bleeding patients had lower plasma zinc levels than non-bleeding patients
(9.4±3.6 vs. 10.5±3.7µmol/L, p = 0.003, respectively), involving a higher rate of patients
with plasmatic zinc levels under 5µmol/L (9% vs. 2%, p <0.001, respectively). No
differences were detected regarding plasma Cu, vitamin C, or vitamin B1 levels.
Accordingly, to the nutritional status, more than two-thirds of patients had
undernutrition. Global undernutrition prevalence was higher in bleeding than non-
bleeding patients (OR = 1.85, CI95%: 1.07 - 3.21), with over a two-fold higher bleeding
risk for those with severe undernutrition (OR = 2.66, CI95%: 1.58 - 4.46), whereas no

9
difference was detected considering moderate undernutrition (Table 3). Moreover,
bleeding patients had a lower NRI score (88.1±8.1 vs. 91.8±9.6, p <0.01, respectively)
and lower fat mass (28.1±9.7 % vs. 30.8±9.8 %, p = 0.03, respectively) than non-
bleeding patients but without difference for fat free mass.
Interestingly, there were several differences identified with respect to the bleeding
sites (Table 4). Patients with intracranial bleeding exhibited lower INR values and
higher vitamin B1 levels than those with other bleeding sites. Patients with
gastrointestinal bleeding displayed lower PINI scores than those with other bleeding
sites. Patients with muscular hematoma presented higher CRP levels, higher
orosomucoid rates, and higher PINI scores than those with other bleeding sites.
However, no difference was found in undernutrition status between different bleeding
sites.
Multivariable analysis revealed that patients with severe undernutrition (OR = 2.83,
CI95%: 1.34-5.99) or bleeding history (OR = 3.49, 95%IC: 1.63-7.51) or showed an
increased bleeding risk (Table 5). As shown in Figure 1, our multivariable analysis,
which included severe undernutrition and history of bleeding, showed the best
predictive value for bleeding complications during VKA treatment (AUC 0.70, CI95%:
0.63-0.77), and was significantly better than PINI score (AUC 0.53, CI95%: 0.46-0.61).
As no major difference between the main multivariable analysis and the sensitivity
analysis with inverse propensity matching were noticed, we do not show these results.
Discussion

10
The present study demonstrates that there is a significantly higher bleeding risk for
patients with an undernutrition status and that are under VKA treatment. In this large
cohort of 294 patients on VKA, bleeding patients exhibited a higher global
undernutrition status than non-bleeding patients, with nearly a two-fold higher bleeding
risk. Moreover, we have demonstrated that severe undernutrition results in a three-fold
higher bleeding risk under VKA treatment.
Surprisingly, very few studies have paid attention to the nutritional status’ impact on
bleeding risk under VKA treatment, despite major bleeding being one of the latter’s
most feared outcomes. In our study, severe undernutrition was revealed to be a
bleeding risk factor that was as high as a history of major bleeding, involving a three-
fold higher bleeding risk. Indeed, a history of major bleeding is one of the most
essential risk factors that are included in different bleeding-risk scores.[29] One study
has shown that protein-energy undernutrition is a risk factor for INR imbalance, in
terms of the therapeutic imbalance factors of antivitamin K and the hemorrhagic
consequences in geriatric practice.[8] Conversely, cases of low INR or resistance to
VKA have been described in subjects receiving a diet that is rich in protein and low in
carbohydrates, without increased amounts of foods containing vitamin K.[30]
Identifying poor nutritional status remains a challenge for physicians, despite various
methods and indexes for nutritional evaluation being advocated and used to predict
unfavorable prognoses in some clinical settings.[31] In our study, bleeding patients on
VKA were shown to display lower NRI scores and lower fat mass than non-bleeding
patients. The NRI is a simple, well-validated tool for identifying patients at risk for
nutrition-related complications and may therefore be a valuable tool for identifying

11
patients with nutritional depletion, prior to significant body wasting.[32] In stable heart-
failure patients, the NRI is strongly associated with appetite-regulating hormones,
inflammatory markers, and metabolic markers, while indicating nutritional depletion.
Additionally, low NRI is associated with an increased death incidence.[33] A new
international consensus for defining undernutrition was very recently obtained, through
an crucial collaboration between the American (ASPEN) and European clinical nutrition
societies (ESPEN). [34] These new phenotypic and etiological criteria were not
considered in this study, given that our study was initiated before this new definition
was proposed.
In this study, serum albumin levels were lower in bleeding than non-bleeding patients.
Although the serum albumin level is not solely an accurate indicator of nutritional
status, it was used in the NRI and PINI scores. However, meta-analysis revealed that
hypoalbuminemia (which is defined as a serum albumin concentration of less than 34
g/L) could be used as an outcome predictor in acutely ill patients.[35] Moreover,
albumin is the most abundant plasma protein and contributes to the transport of drugs.
Warfarin, a specific VKA, is primarily bound to serum albumin, meaning that
hypoalbuminemia is likely to increase the free fraction of warfarin, thereby increasing
the risk of major bleeding.[36] In patients under 75 years old, hypoalbuminemia was a
significant predictor of all bleeding events (minor and major).[37] Hypoalbuminemia is
similarly associated with age-related frailty and could thus reflect underlying conditions
and diseases that in their turn facilitate bleeding. Thus, albumin could easily be
considered a biological parameter for the benefit-risk balance of preventing VKA
bleeding events in clinical practice.

12
With regards to micronutrient assays, we only found a difference between the rates of
plasma-zinc levels. In our study, bleeding patients had lower plasmatic zinc levels than
non-bleeding patients, with a higher patient proportion with plasmatic zinc under
5µmol/L among bleeders The clinical impact of plasma-zinc deficit aligns with its
biological action, as zinc deficit can increase bleeding time [14,15]. Furthermore, in-
vitro results have demonstrated that zinc and Cu are linked to Cu-ZN superoxide
dismutase and can impact intracranial bleeding due to hypertension.[38] Unfortunately,
we were unable to detect any statistical difference, between bleeding and non-bleeding
patients, for other micronutrients like Cu, vitamin C, or vitamin B1. Unexpectedly,
regarding the bleeding site, we found that patient with intracranial bleeding showed a
higher level of vitamin B1 which is contradictory with some case reports showing that
hemorrhages in the brain, indicating a disruption of the blood-brain barrier, is
characterized by a vitamin B1 deficiency. [39–41] However, these cases reports were
about rats or patients with Wernicke’s encephalopathy. An interesting means of
analyzing the impact of micronutrients on bleeding risk would be to analyze patient
diets. Unfortunately, we didn’t analyze the patient diet in our study. However, some
diet like the Mediterranean diet’s, with abundance of fruits and vegetables, is well
recognized for its containing many antioxidant nutrients.[42] This diet has been
reportedly demonstrated to reduce cardiovascular events but with higher bleeding
times, which is likely to impact bleeding complications.[43,44]
To our knowledge, this is the first study to focus on the nutritional status of bleeding
complications in patients under VKA treatment. Nevertheless, our study has several
limitations that must be acknowledged. First, patients were recruited in one single
center, which may have generated less reproducibility, despite the avoidance of
13
practice variability among different centers. However, data were collected
prospectively using a case-control design and the number of included patients was
remarkable; therefore, our data thus provide a useful basis for future controlled clinical
trials. Second, since we focused solely on major bleeding, the mean age of our
population was higher (81.9 years old) than that observed in other studies that
examined patients on VKA treatment. This could render it difficult to generalize these
results.[45] One possible explanation could be that most of our patients (77.4%) were
on VKA treatment for atrial fibrillation and that we had chosen bleeders as case
subjects. However, patients over 75 years old show a higher bleeding risk and most
are at risk of undernutrition; owing to these facts, they represent a likely population of
interest for evaluating the bleeding risk. Third, there was no external adjudication of
major bleeding events, which align with the French definition of major bleeding.[19]
However, prior studies have demonstrated that adjudicated data are usually well
matched with onsite outcome assessments.[46,47]
Conclusion
The present study has demonstrated that there is a significantly higher bleeding risk
for patients on VKA that display undernutrition, which is three-fold higher in case of
severe undernutrition. With regards to micronutrients, we found lower plasma-zinc
levels in bleeding patients, along with a higher rate of patients showing levels under
5µmol/L. Therefore, we can conclude that the evaluation of nutritional status may
provide additional, valuable prognosis information about the benefit-risk balance for
older patients, prior to the initiation of VKA therapy.

14
Acknowledgments
All authors had full access to all study data (including statistical reports and tables) and
bear responsibility for data integrity and accuracy. All authors were involved in the
critical revision of the manuscript, with regard to its primary intellectual content, and all
authors approved the final version that has been submitted for publication.
Statement of Authorship
F Moustafa, L Dopeux and J Schmid designed the study and had final responsibility
for study supervision. A Mulliez had the responsibility of data analysis. F Moustafa, Y
Boirie, C Morand, E Gentes, D Richard, N Farigon, A Lebreton, D Teissandier and F
Dutheil participated to the revising the intellectual content. Each author critically
reviewed and participated in revising the manuscript, and each author approved the
final version.
Declaration of interest
Dr. Moustafa has served as a consultant for Bayer HealthCare Pharmaceuticals and
Sanofi; has been a speaker for Bayer HealthCare Pharmaceuticals, Boehringer
Ingelheim, Daiichi-Sankyo, and Sanofi; and has received grants from LFB.
Dr. Schmidt has received payments for board membership from Bayer HealthCare
Pharmaceuticals, Daichi, Lilly, and Pfizer, as well as personal compensation from
Biomerieux, Bohringer Ingelheim, Sanofi, and Novartis.
All other authors declare that they have no relationships that are relevant to the
contents of this paper.
Research Funding
This research did not receive any specific grant from funding agencies in the public,
commercial, or not-for-profit sectors

15
References
[1] Van Der Heijden JF, Remkes MGH, Büller HR, Vermeulen M. Treatment with
vitamin K antagonists: Frequency of indications and appropriateness of
continuation. Pathophysiol Haemost Thromb 2002;32:111–4.
doi:10.1159/000065209.
[2] Linkins L-A, Choi PT, Douketis JD. Clinical impact of bleeding in patients taking
oral anticoagulant therapy for venous thromboembolism: a meta-analysis. Ann
Intern Med 2003;139:893–900.
[3] Landefeld CS, Beyth RJ. Anticoagulant-related bleeding: clinical epidemiology,
prediction, and prevention. Am J Med 1993;95:315–28.
[4] Palareti G, Cosmi B. Bleeding with anticoagulation therapy - who is at risk, and
how best to identify such patients. Thromb Haemost 2009;102:268–78.
doi:10.1160/TH08-11-0730.
[5] Palareti G, Leali N, Coccheri S, Poggi M, Manotti C, D’Angelo A, et al. Bleeding
complications of oral anticoagulant treatment: an inception-cohort, prospective
collaborative study (ISCOAT). Italian Study on Complications of Oral
Anticoagulant Therapy. Lancet (London, England) 1996;348:423–8.
[6] Moreau C, Siguret V, Loriot M-A. [The pharmacogenetics of vitamin K
antagonists: still a matter for discussion]. La Rev Med Interne 2010;31:361–8.
doi:10.1016/j.revmed.2009.07.014.
[7] Penning-van Beest FJ, van Meegen E, Rosendaal FR, Stricker BH.
Characteristics of anticoagulant therapy and comorbidity related to
overanticoagulation. Thromb Haemost 2001;86:569–74.
[8] Chatap G, Giraud K, Delay V, Cassereau C, Bastuji-Garin S, Vincent J-P, et al.
16
Les facteurs de déséquilibre thérapeutique des antivitamines K et leurs
conséquences hémorragiques en pratique gériatrique. Therapie 2008;63:393–
401. doi:10.2515/THERAPIE:2008058.
[9] Hylek EM, Heiman H, Skates SJ, Sheehan MA, Singer DE. Acetaminophen
and other risk factors for excessive warfarin anticoagulation. JAMA
1998;279:657–62.
[10] Holbrook AM, Pereira JA, Labiris R, McDonald H, Douketis JD, Crowther M, et
al. Systematic overview of warfarin and its drug and food interactions. Arch
Intern Med 2005;165:1095–106. doi:10.1001/archinte.165.10.1095.
[11] Bal dit Sollier C, Drouet L. Vitamine K, antivitamine K et alimentation. Cah Nutr
Diététique 2009;44:273–7. doi:10.1016/J.CND.2009.11.003.
[12] Khan T, Wynne H, Wood P, Torrance A, Hankey C, Avery P, et al. Dietary
vitamin K influences intra-individual variability in anticoagulant response to
warfarin. Br J Haematol 2004;124:348–54. doi:10.1046/j.1365-
2141.2003.04787.x.
[13] Blee TH, Cogbill TH, Lambert PJ. Hemorrhage associated with vitamin C
deficiency in surgical patients. Surgery 2002;131:408–12.
doi:10.1067/msy.2002.122373.
[14] Schuschke DA, Saari JT, Nuss JW, Miller FN. Platelet thrombus formation and
hemostasis are delayed in the microcirculation of copper-deficient rats. J Nutr
1994;124:1258–64.
[15] Schuschke DA. Dietary copper in the physiology of the microcirculation. J Nutr
1997;127:2274–81.
[16] Hughes S, Samman S. The effect of zinc supplementation in humans on
plasma lipids, antioxidant status and thrombogenesis. J Am Coll Nutr

17
2006;25:285–91.
[17] Stefanini M. Cutaneous bleeding related to zinc deficiency in two cases of
advanced cancer. Cancer 1999;86:866–70.
[18] Haboubi NY, Haboubi NA, Gyde OH, Small NA, Barford A V. Zinc deficiency in
senile purpura. J Clin Pathol 1985;38:1189–91.
[19] Pernod G, Godiér A, Gozalo C, Tremey B, Sié P, French National Authority for
Health. French clinical practice guidelines on the management of patients on
vitamin K antagonists in at-risk situations (overdose, risk of bleeding, and
active bleeding). Thromb Res 2010;126:e167-74.
doi:10.1016/j.thromres.2010.06.017.
[20] Desport J-C, Jésus P, Fayemendy P, Linut R. [Food and malnutrition in the
elderly]. Rev Prat 2018;68:312–8.
[21] Kyle UG, Pirlich M, Schuetz T, Luebke HJ, Lochs H, Pichard C. Prevalence of
malnutrition in 1760 patients at hospital admission: A controlled population
study of body composition. Clin Nutr 2003;22:473–81. doi:10.1016/S0261-
5614(03)00049-9.
[22] Kyle UG, Genton L, Slosman DO, Pichard C. Fat-free and fat mass percentiles
in 5225 healthy subjects aged 15 to 98 years. Nutrition n.d.;17:534–41.
[23] Stephen S Lim‡, Theo Vos, Abraham D Flaxman, Goodarz Danaei KS,
Heather Adair-Rohani, Markus Amann*, H Ross Anderson* KGA, Martin
Aryee*, Charles Atkinson*, Loraine J Bacchus*, Adil N Bahalim* K,
Balakrishnan*, John Balmes* SB-C, Lim SS, Vos T, et al. A comparative risk
assessment of burden of disease and injury attributable to 67 risk factors and
risk factor clusters in 21 regions, 1990–2010: a systematic analysis for the
Global Burden of Disease Study 2010. Lancet 2012;380:2224–60.

18
doi:10.1016/S0140-6736(12)61766-8.A.
[24] Buzby GP, Williford WO, Peterson OL, Crosby LO, Page CP, Reinhardt GF, et
al. A randomized clinical trial of total parenteral nutrition in malnourished
surgical patients: the rationale and impact of previous clinical trials and pilot
study on protocol design. Am J Clin Nutr 1988;47:357–65.
doi:10.1093/ajcn/47.2.357.
[25] Beyth RJ, Quinn LM, Landefeld CS. Prospective evaluation of an index for
predicting the risk of major bleeding in outpatients treated with warfarin. Am J
Med 1998;105:91–9. doi:10.1016/S0002-9343(98)00198-3.
[26] Lan KK, DeMets DL. Changing frequency of interim analysis in sequential
monitoring. Biometrics 1989;45:1017–20.
[27] Steyerberg EW, Eijkemans MJ, Harrell FE, Habbema JD. Prognostic modelling
with logistic regression analysis: a comparison of selection and estimation
methods in small data sets. Stat Med 2000;19:1059–79.
[28] Rosenbaum PR, Rubin DB. Biometrika Trust The Central Role of the
Propensity Score in Observational Studies for Causal Effects The central role
of the propensity score in observational studies for causal effects. Source:
Biometrika Biometrika 1983;70:41–55.
[29] van Es N, Wells PS, Carrier M. Bleeding risk in patients with unprovoked
venous thromboembolism: A critical appraisal of clinical prediction scores.
Thromb Res 2017;152:52–60. doi:10.1016/j.thromres.2017.02.016.
[30] Beatty SJ, Mehta BH, Rodis JL. Decreased warfarin effect after initiation of
high-protein, low-carbohydrate diets. Ann Pharmacother 2005;39:744–7.
doi:10.1345/aph.1E454.
[31] Narumi T, Arimoto T, Funayama A, Kadowaki S, Otaki Y, Nishiyama S, et al.

19
The prognostic importance of objective nutritional indexes in patients with
chronic heart failure. J Cardiol 2013;62:307–13. doi:10.1016/j.jjcc.2013.05.007.
[32] Al-Najjar Y, Clark AL. Predicting outcome in patients with left ventricular
systolic chronic heart failure using a nutritional risk index. Am J Cardiol
2012;109:1315–20. doi:10.1016/j.amjcard.2011.12.026.
[33] Gouya G, Voithofer P, Neuhold S, Storka A, Vila G, Pacher R, et al.
Association of nutritional risk index with metabolic biomarkers, appetite-
regulatory hormones and inflammatory biomarkers and outcome in patients
with chronic heart failure. Int J Clin Pract 2014;68:1293–300.
doi:10.1111/ijcp.12513.
[34] Cederholm T, Jensen GL, Correia MITD, Gonzalez MC, Fukushima R,
Higashiguchi T, et al. GLIM criteria for the diagnosis of malnutrition – A
consensus report from the global clinical nutrition community. Clin Nutr
2019;38:1–9. doi:10.1016/j.clnu.2018.08.002.
[35] Vincent JL, Dubois MJ, Navickis RJ, Wilkes MM. Hypoalbuminemia in Acute
Illness: Is There a Rationale for Intervention? A Meta-Analysis of Cohort
Studies and Controlled Trials. Ann Surg 2003;237:319–34.
doi:10.1097/00000658-200303000-00005.
[36] Kawai M, Harada M, Motoike Y, Koshikawa M, Ichikawa T, Watanabe E, et al.
Impact of serum albumin levels on supratherapeutic PT-INR control and
bleeding risk in atrial fibrillation patients on warfarin: A prospective cohort
study. IJC Hear Vasc 2019;22:111–6. doi:10.1016/j.ijcha.2019.01.002.
[37] Abdelhafiz AH, Myint MP, Tayek JA, Wheeldon NM. Anemia,
hypoalbuminemia, and renal impairment as predictors of bleeding
complications in patients receiving anticoagulation therapy for nonvalvular atrial

20
fibrillation: a secondary analysis. Clin Ther 2009;31:1534–9.
doi:10.1016/j.clinthera.2009.07.015.
[38] Wakisaka Y, Chu Y, Miller JD, Rosenberg GA, Heistad DD. Critical role for
copper/zinc-superoxide dismutase in preventing spontaneous intracerebral
hemorrhage during acute and chronic hypertension in mice. Stroke
2010;41:790–7. doi:10.1161/STROKEAHA.109.569616.
[39] Shin NY, Nam HS, Lee S-K. Hemorrhagic Wernicke encephalopathy in a
patient with liver transplantation. Neurology 2009;73:1423.
doi:10.1212/WNL.0b013e3181bd82b9.
[40] Helbok R, Beer R, Engelhardt K, Broessner G, Lackner P, Brenneis C, et al.
Intracerebral haemorrhage in a malnourished patient, related to Wernicke’s
encephalopathy. Eur J Neurol 2008;15:e99–100. doi:10.1111/j.1468-
1331.2008.02302.x.
[41] Calingasan NY, Baker H, Sheu K-FR, Gibson GE. Blood-Brain Barrier
Abnormalities in Vulnerable Brain Regions during Thiamine Deficiency. Exp
Neurol 1995;134:64–72. doi:10.1006/EXNR.1995.1037.
[42] Joshipura KJ, Hu FB, Manson JE, Stampfer MJ, Rimm EB, Speizer FE, et al.
The effect of fruit and vegetable intake on risk for coronary heart disease. Ann
Intern Med 2001;134. doi:10.7326/0003-4819-134-12-200106190-00010.
[43] Mezzano D, Leighton F, Strobel P, Martínez C, Marshall G, Cuevas A, et al.
Mediterranean diet, but not red wine, is associated with beneficial changes in
primary haemostasis. Eur J Clin Nutr 2003;57:439–46.
doi:10.1038/sj.ejcn.1601558.
[44] Violi F, Pignatelli P, Basili S. Nutrition, supplements, and vitamins in platelet
function and bleeding. Circulation 2010;121:1033–44.

21
doi:10.1161/CIRCULATIONAHA.109.880211.
[45] Moustafa F, Corriger A, Lambert C, Barres A, Camminada C, Teissandier D, et
al. Management of major bleeding outcomes under antithrombotic therapy in
real-life. Thromb Res 2020;187:28–31. doi:10.1016/j.thromres.2020.01.007.
[46] Granger CB, Vogel V, Cummings SR, Held P, Fiedorek F, Lawrence M, et al.
Do we need to adjudicate major clinical events? Clin Trials 2008;5:56–60.
doi:10.1177/1740774508096007.
[47] Hata J, Arima H, Zoungas S, Fulcher G, Pollock C, Adams M, et al. Effects of
the Endpoint Adjudication Process on the Results of a Randomised Controlled
Trial: The ADVANCE Trial. PLoS One 2013;8:e55807.
doi:10.1371/journal.pone.0055807.

22
Table 1: Clinical Characteristics in case and control patients under VKA
All patients N= 294
Case N= 98
Control N= 196 p-value
Sex gender
Men, n (%) 126 (41,9%) 42 (42,0%) 84 (42,0%) 1.000
Women, n (%) 174 (57,8%) 58 (58,0%) 116 (58,0%)
Age
Age, mean (SD) 81.9 (7,8) 82.4 (7,9) 81.7 (7,8) 0.481
Medical History
Renal insufficiency, n (%) 54 (17.9%) 16 (16.0%) 38 (19,0%) 0.524
Cardiac insufficiency, n (%) 254 (84.4%) 82 (82.0%) 172 (86,0%) 0.365
Stroke, n (%) 61 (20.3%) 21 (21.0%) 40 (20,0%) 0.839
Cardiac infarct, n (%) 61 (20.3%) 15 (15.0%) 46 (23,0%) 0.105
History of bleeding, n (%) 44 (14.6%) 23 (23.0%) 21 (10,5%) 0.004
VKA agent
Fluindione, n (%) 198 (65.8%) 68 (68.0%) 130 (65,0%) 0.605
Warfarin, n (%) 67 (22.3%) 20 (20.0%) 47 (23,5%) 0.493
Acenocoumarol, n (%) 31 (10.3%) 11 (11.0%) 20 (10,0%) 0.789
VKA indication
Atrial fibrillation, n (%) 233 (77.4%) 75 (75.0%) 158 (79,0%) 0.433
Venous thromboembolism, n (%) 23 (7.6%) 5 (5.0%) 18 (9,0%) 0.220
Pulmonary hypertension, n (%) 1 (0.3%) 1 (1.0%) 0 (0,0%) 0.333
Beyth score, mean (SD) 1.6 (0.7) 1.8 (.7) 1.5 (0,7) 0.005
Abbreviations: SD, standard deviation; VKA, vitamin K antagonist*
23
Table 2: Biological and micronutrients characteristics in case and control patients under VKA All patients
N=294 Case N=98
Control N=196
p-value
Prothrombin time in %, Mean (SD) 19,3 (11.4) 19,0 (11.4) 19.5 (11,4) 0,711
INR, Mean (SD) 4,4 (2.3) 4,6 (2.5) 4.3 (2,2) 0,292
1.5 £ INR < 2, n (%) 12 3 (12%) 9 (18%)
2 £ INR £ 3, n (%) 34 12 (48%) 22 (44%)
3 < INR £ 5, n (%) 13 5 (20%) 8 (16%)
INR > 5, n (%) 16 5 (20%) 11 (22%)
Hematocrit in %, mean (SD) 36.7 (7.3) 31.5 (8.1) 39.3 (5,2) <0.001
Platelet count in Giga/L, mean (SD) 250.2 (86.4) 276.9 (100.7) 236.8 (74,7) 0.001
Creatinine in µmol/L, mean (SD) 95.7 (46.5) 95.6 (45.4) 95.7 (47,2) 0.579
Albumin in g/L, mean (SD) 32.6 (5.8) 30.9 (4.9) 33.4 (6,1) <0.001
Prealbumin in mg/L, mean (SD) 196.5 (69.8) 189.9 (62.4) 199.7 (73,1) 0.394
CRP in mg/L, mean (SD) 48.0 (62.8) 44.9 (56.0) 49.6 (65,9) 0.542
Orosomucoïd in mg/L mean (SD) 1280.4 (477.5) 1289.6 (464.9) 1276.1 (483,2) 0.826
Erythrocyte Zync in µmol/L, mean (SD) 126.8 (76.1) 131.8 (105.5) 124.1 (53,9) 0.506
Plasma Zync in µmol/L, mean (SD) 10.1 (3.7) 9.4 (3.6) 10.5 (3,7) 0.003
- Under 5 µmol/L, n (%) 13 (4.3%) 9 (9.0%) 4 (2,0%)
Plasma Cuper (Cu) in mg/L, mean (SD) 18.0 (5.4) 18.3 (5.2) 17.8 (5,5) 0.427
Selenium in µg/l, mean (SD) 68.2 (33.8) 65.5 (21.4) 69.6 (38.9) 0.314
Vitamin C in µmol/L, mean (SD) 22.0 (18.4) 22.6 (19.4) 21.4 (18,1) 0.763
- Under 3 µmol/L, n (%) 39 (13.0%) 14 (14.0%) 25 (12,5%)
Vitamin B1 in µg/L, mean (SD) 53.6 (19.3) 53.8 (24.2) 53.5 (16,4) 0.924
Abbreviations: SD, standard deviation; INR, index normalized ratio; CRP, C-reactive protein

24
Table 3: Nutritional characteristics in case and control patients under VKA All patients
N= 294 Case N= 98
Control N= 196 p-value
Undernutrition, n (%) 200 (68.0%) 75 (76.5%) 125 (63.8%) 0.027
Severe undernutrition, n (%) 90 (30.6%) 44 (44.9%) 46 (23.5%) <0.001
Moderate undernutrition, n (%) 110 (36.9%) 31 (31.6%) 79 (40.3%) 0.185
Nutritional assessment
Weight (Kg), mean (SD) 73.2 (1.0) 71.8 (1.6) 73.9 (1.3) 0.32
BMI, mean (SD) 27.1 (5.5) 26.4 (5.0) 27.5 (5.7) 0.08
NRI score, mean (SD) 90.6 (9.2) 88.1 (8.1) 91.8 (9.6) <0.01
PINI score, mean (SD) 23.54 (62.7) 17.97 (34.9) 26.15 (72.1) 0.48
Fat-free mass in kg, mean (SD) 50.9 (11.6) 51.2 (10.4) 50.7 (12.3) 0.73
Fat mass in %, mean (SD) 29.8% (9.8%) 28.1% (9.7%) 30.8% (9.8%) 0.03
Abbreviations: SD, standard deviation; NRI, nutritional risk index; PINI, Pronostic Inflammatory and Nutritional Index

25
Table 4: Clinical characteristics at baseline in patients who suffered major bleeding on VKA therapy “Case patients” according to bleeding site (N=98)
Intracranial bleeding
N=10
Gastrointestinal bleeding
N=33
Muscular bleeding
N=29
Others N=26
P-value
Gender, n (%) Men 3 (30%) 17 (51.5%) 11 (37.9%) 10 (38.5%) 0.571
Women 7 (70%) 16 (48.5%) 18 (62.1%) 16 (61.5%) Age, mean (SD) 80.1 (12.1) 83.8 (6.8) 82.4 (7.5) 80.9 (7.9) 0.43 Biological, mean (SD)
INR 2.71 (0.92) 4.5 (2.5) 5.1 (45) 4.8 (2.8) 0.015
Albumin in g/L 34.2 (5.2) 30.7 (4.4) 29.9 (4.4) 31.3 (5.6) 0.13 Prealbumin in mg/L 184 (63.6) 200.9 (60.5) 195.3 (63.9) 171.25 (62.0) 0.49
Creatinin in µmol/L 73.9 (23.8) 100.0 (59.7) 95.9 (38.9) 98.0 (36.1) 0.26
CRP in mg/L 40.3 (50.9) 17.9 (25.9) 77.9 (61.8) 37.9 (52.0) <0.001 Platelet count in Giga/L 253.6 (95.7) 294 (90.1) 281.6 (85.2) 261.4 (135.5) 0.28 Orosomucoid in mg/L 1104 (541) 1161 (357) 1538 (509) 1254 (438) 0.02
PINI score, median (IQR) 3.8 (0.3-12.5) 1.31 (0.5-6.6) 13.1 (5.2-55.4) 4.1 (1.4-9.8) <0.001 NRI score, mean (SD) 94.2 (7.9) 87.4 (7.75) 86.6 (7.5) 88.5 (8.5) 0.9 Micronutrient, mean (SD)
Plasmatic Cuper in mg/L 17.6 (5.6) 16.9 (4.5) 18.7 (5.2) 20.1 (5.6) 0.109 Vitamin B1 in µg/L 66.2 (16.6) 49.8 (20.9) 57.7 (31.6) 49.6 (21.2) 0.026
Vitamin C in µmol/L 26.45 (24.8) 26.7 (19.7) 15.2 (13.5) 23.2 (23.3) 0.08
Erythrocyte zinc in µmol/L 142.4 (64.7) 125.9 (51.9) 104.5 (38.9) 160.2 (187.9) 0.18 Plasmatic zinc in µmolL 10.1 (4.9) 10.2 (7.9) 9.64 (3.2) 9.7 (4.2) 0.9
Selenium in µg/l 75.8 (24.6) 67.4 (19.1) 61.5 (20.9) 63.8 (22.9) 0.36 Undernutrition, n (%) 7 (70%) 26 (78.8%) 24 (82.8%) 8 (30.8%) 0.605 Severe undernutrition, n (%) 2 (20%) 16 (48.5%) 14 (48.3%) 12 (46.1%) 0.439
Abbreviations: SD, standard deviation; VKA, vitamin K antagonist; INR, index normalized ratio; CRP, C-reactive protein; IQR, interquartile rang ; NRI, nutritional risk index; PINI, Pronostic Inflammatory and Nutritional Index.

26
Table 5: Multivariable analysis
Odds ratio CI95% p-value
No undernutrition ref
Non severe undernutrition 1.12 0.54 – 2.3 0.768
Severe undernutrition 2.83 1.34 – 5.99 0.007
Age <70 years ref
Age 70-80 0.31 0.09 – 1.03 0.056
Age 80-90 0.35 0.11 – 1.09 0.069
Age >90 0.57 0.17 – 1.98 0.38
Platelet count in Giga/L 1 1 – 1.01 0.009
Plasmatic zinc 0.92 0.85 – 1 0.055
Bleeding history 3.49 1.63 – 7.51 0.001
Low risk, Beyth score 0.42 0.04 – 4.61 0.48
High risk, Beyth score 1.58 0.68 – 3.64 0.286
Abbreviations : CI, confidence interval ; ref, reference.

27
Figure 1. Receiver operating characteristic curve from final multivariate analysis
Abbreviations: AUC, area under curve; SD, Standard Deviation; CI, confidence interval; NRI, nutritional risk index; PINI, Pronostic Inflammatory and Nutritional Index
Observation AUC SD 95%CI
Multivariable model 265 0.7238 0.0349 0.655 – 0.792
Undernutrition status 265 0.6208 0.0355 0.551 – 0.690
NRI score 265 0.6305 0.0361 0.559 – 0.701
PINI score 265 0.5352 0.0372 0.462 – 0.608

28


![Major bleeding with Vitamin K antagonist anticoagulants in ... · 8/30/2012 · arterial hypertension patients.[8, 7] Furthermore, clinical studies of systematic anticoagulation](https://img.pdfslide.net/doc/110x75/607433757248b62e12450818/major-bleeding-with-vitamin-k-antagonist-anticoagulants-in-8302012-arterial.jpg)