Embed Size (px)
Citation preview

SEWER V6.3
Reference Manual
Copyright 2004
KNOWLEDGE BASE

Conditions of Sale
The purchaser (further referred to as the Licensee) hereby accepts a non-exclusive, non-transferable license to use the software, Civil Designer, on the following conditions.
1. The license fee shall be payable in advance and this agreement commences on said date of purchase.
2. A separate license fee is payable for each CPU upon which the Licensee wishes to use the software.
3. The Licensee undertakes not to copy, except for backup purposes, reproduce, translate, adapt, vary or modify the software, nor to communicate the software to any third party other than the Licensee’s employees, without the Licensor’s prior written consent.
4. The Licensee agrees that it shall not itself or through any subsidiary, agent or third party, sell, lease, license, sub-license or otherwise deal with the software.
5. The Licensee acknowledges that any and all of the intellectual property rights including trademark, trade name, copyright and other rights used or embodied in or in connection with the software shall be and remain the sole property of the Licensor and it’s principals.
6. The Licensee shall not question or dispute the ownership of any such rights at any time.
7. It is up to the Licensee to insure the program for the full replacement value. In the event of theft or loss of the program, security disk, or security module the license must be re-purchased in full.
8. No warranty of any kind is made with regard to the use or application of the software or it’s fitness for any particular purpose. The verification of all results and output is entirely the responsibility of the purchaser.
9. While every care has been taken in the preparation of the Civil Designer program and it’s manual, Knowledge Base cc, it’s employees and agents shall not be liable for any loss or damage (including in particular, consequential losses, loss of profits and penalties) suffered by the Licensee arising from any cause whatsoever in connection with the Civil Designer program or the use thereof whether such loss or damage results from breach of contract (including a fundamental breach), negligence or any other cause and whether or not this contract is at any time cancelled by the Licensee arising from any cause whatsoever in connection with the Civil Designer program or the use thereof whether or not this contract is at any time cancelled.
i
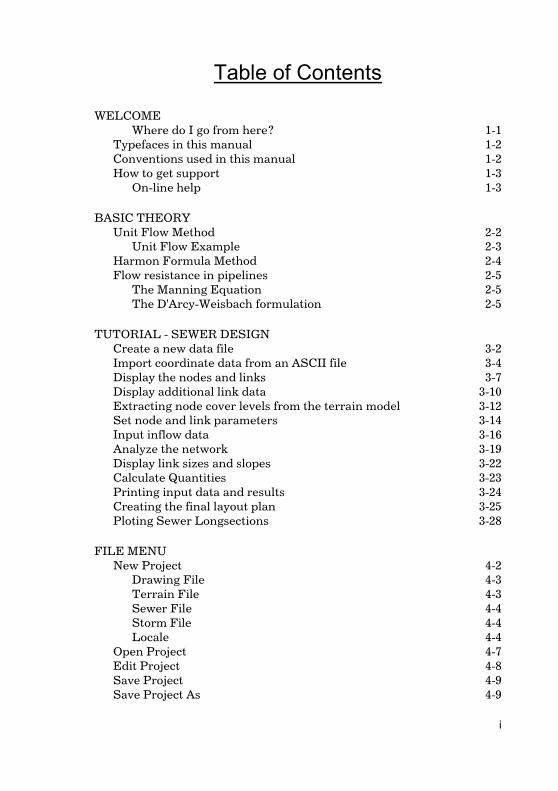
Table of Contents
WELCOME Where do I go from here? 1-1
Typefaces in this manual 1-2 Conventions used in this manual 1-2 How to get support 1-3 On-line help 1-3
BASIC THEORY Unit Flow Method 2-2 Unit Flow Example 2-3
Harmon Formula Method 2-4 Flow resistance in pipelines 2-5 The Manning Equation 2-5 The D'Arcy-Weisbach formulation 2-5
TUTORIAL - SEWER DESIGN Create a new data file 3-2 Import coordinate data from an ASCII file 3-4 Display the nodes and links 3-7 Display additional link data 3-10 Extracting node cover levels from the terrain model 3-12 Set node and link parameters 3-14 Input inflow data 3-16 Analyze the network 3-19 Display link sizes and slopes 3-22 Calculate Quantities 3-23 Printing input data and results 3-24 Creating the final layout plan 3-25 Ploting Sewer Longsections 3-28
FILE MENU New Project 4-2 Drawing File 4-3 Terrain File 4-3 Sewer File 4-4 Storm File 4-4 Locale 4-4
Open Project 4-7 Edit Project 4-8 Save Project 4-9 Save Project As 4-9

ii
Close Project 4-9 Import 4-10 ASCII File 4-10 Version 3 Data 4-13 MAP Theme 4-14 Inflow Hydrograph 4-15 Convert Drawing Entities 4-16
Export 4-17 MAP Theme 4-17 ASCII FILE 4-18
Print 4-19 Output Manager 4-22 Spool Output 4-24 Option Settings 4-25 General 4-26 Survey 4-29 Terrain 4-30 Roads 4-34 Plot 4-37 Output Window 4-38
Security 4-39 Authorize 4-39 Check Network Dongles 4-40
Exit 4-40
EDIT MENU Default Settings 5-2 Design Parameters 5-3 Inflow Calculation Method 5-3 Friction Loss Formula 5-3 Geometric Controls 5-4 Flow Controls 5-4
Unit Flow Parameters 5-5 Inflow Classes 5-5 Attenuation Curve Dialog 5-6
Harmon Parameters 5-7 Inflow Hydrograph Parameters 5-8 Name List 5-8 Hydrograph Array 5-9
Pumps 5-10 Name Page 5-11 Sump Page 5-12 Pumps Page 5-13
Depth Increments 5-14 Bedding Classes 5-15
iii
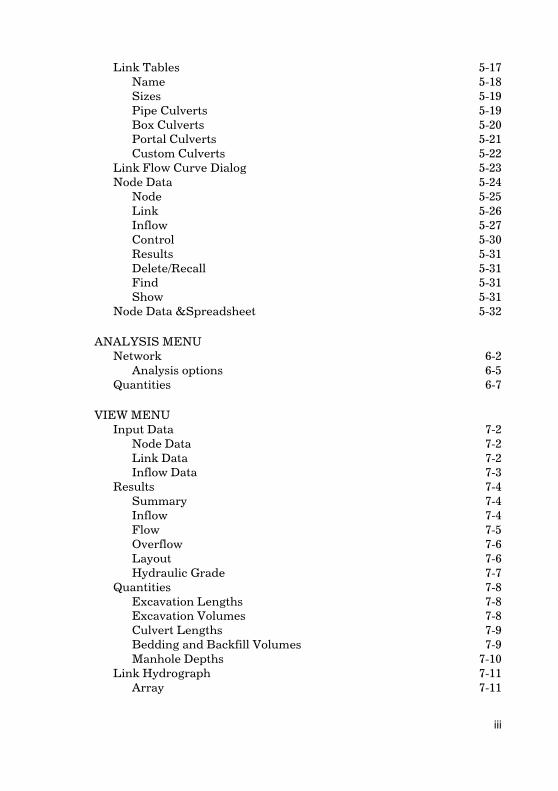
Link Tables 5-17 Name 5-18 Sizes 5-19 Pipe Culverts 5-19 Box Culverts 5-20 Portal Culverts 5-21 Custom Culverts 5-22
Link Flow Curve Dialog 5-23 Node Data 5-24 Node 5-25 Link 5-26 Inflow 5-27 Control 5-30 Results 5-31 Delete/Recall 5-31 Find 5-31 Show 5-31
Node Data &Spreadsheet 5-32
ANALYSIS MENU Network 6-2 Analysis options 6-5
Quantities 6-7
VIEW MENU Input Data 7-2 Node Data 7-2 Link Data 7-2 Inflow Data 7-3
Results 7-4 Summary 7-4 Inflow 7-4 Flow 7-5 Overflow 7-6 Layout 7-6 Hydraulic Grade 7-7
Quantities 7-8 Excavation Lengths 7-8 Excavation Volumes 7-8 Culvert Lengths 7-9 Bedding and Backfill Volumes 7-9 Manhole Depths 7-10
Link Hydrograph 7-11 Array 7-11
iv
Graph 7-12 Multiple Hydrographs 7-13 Links 7-13 Graph 7-14
GRAPHICAL MENU Classify Nodes and Links 8-2 Edit Node and Link Data 8-4 Select 8-5 Single 8-5 Branch 8-5 Upstream 8-6 All 8-6 Clear 8-6 Toggle Show Selected 8-7
Add Node 8-8 Delete Node 8-9 Insert Node 8-10 Connect Node 8-11 Move Node 8-12 Cover Levels 8-13 Set Parameters 8-14 Clashes 8-15 Rename 8-17 Renumber Branches 8-18 Create Subnetwork 8-19 Vertical Alignment 8-20
SETTINGS MENU Index Order 9-2 Rebuild Index 9-3 DTM Surface 9-4 Display Settings 9-5

Welcome 1-1
Welcome
Welcome to Civil Designer, the design system created by civil engineers for civil engineers, to save you time, effort and money. Now you can work faster, smarter and accomplish more.
This manual introduces you to Civil Designer and gets you up and running without delay. It shows you how to accomplish the most common tasks and provides tips on the exciting and innovative new features to be found in Civil Designer.
The easy-to-follow tutorial will help you gain hands-on experience with the program.
Where do I go from here?
After reading this manual you should know the following:
• How to get Civil Designer up and running
• How to use the menus and the on-line help system
• How to input and edit data files
• How to start an analysis
• How to view and output the results of the calculations
For more detail simply refer to the on-line help file: it contains detailed information on each function.
1-2 Sewer Reference
Typefaces in this manual
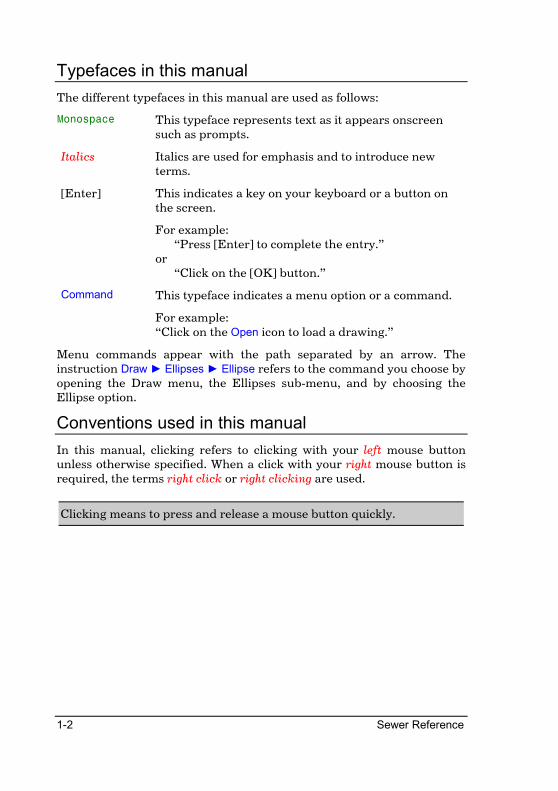
The different typefaces in this manual are used as follows:
Monospace This typeface represents text as it appears onscreen such as prompts.
Italics Italics are used for emphasis and to introduce new terms.
[Enter] This indicates a key on your keyboard or a button on the screen.
For example: “Press [Enter] to complete the entry.” or “Click on the [OK] button.”
Command This typeface indicates a menu option or a command.
For example: “Click on the Open icon to load a drawing.”
Menu commands appear with the path separated by an arrow. The instruction Draw ► Ellipses ► Ellipse refers to the command you choose by opening the Draw menu, the Ellipses sub-menu, and by choosing the Ellipse option.
Conventions used in this manual
In this manual, clicking refers to clicking with your left mouse button unless otherwise specified. When a click with your right mouse button is required, the terms right click or right clicking are used.
Clicking means to press and release a mouse button quickly.
Welcome 1-3
How to get support
Technical support is available from 08.00 to 17.00 Mondays to Fridays excluding public holidays from our Customer Support Centre at [email protected].
You can also call our Customer Support Centre at:
South Africa 086 0101 999
International +27 21 7011850
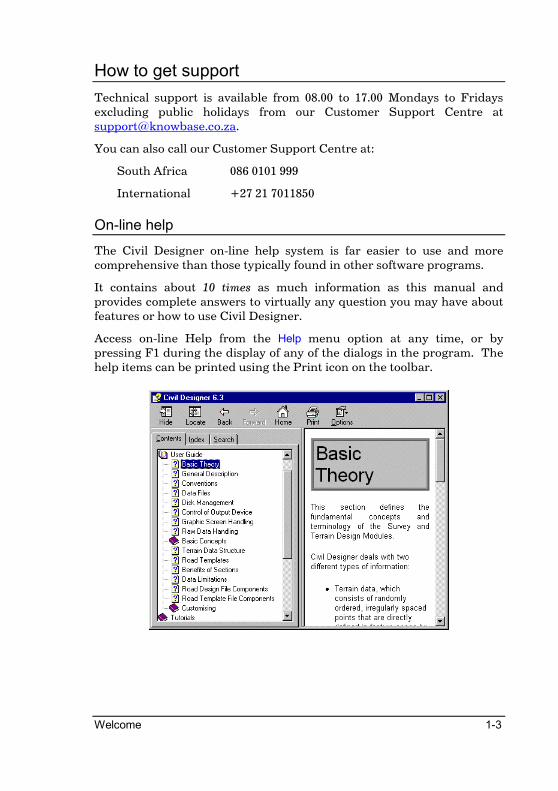
On-line help
The Civil Designer on-line help system is far easier to use and more comprehensive than those typically found in other software programs.
It contains about 10 times as much information as this manual and provides complete answers to virtually any question you may have about features or how to use Civil Designer.
Access on-line Help from the Help menu option at any time, or by pressing F1 during the display of any of the dialogs in the program. The help items can be printed using the Print icon on the toolbar.

1-4 Sewer Reference
Notes:

Basic Theory 2-1
Basic Theory
The Sewer Analysis and Design module is a complete tool for the design of foul water or sewerage networks. It will calculate the invert levels, slopes and diameters of the culverts as well as the design flow, capacity and the flow velocity of each culvert.
The program will model a network consisting of both existing and new culverts. Any culverts which do not have a size, invert level and/or slope will automatically be designed according to the design parameters.
In most cases multiple inflows may be specified at each node. Inflows may be user-defined in the inflow parameters tables.
The program will simulate a complex system of local storage (surge tanks) and overflows thereby enabling you to model the intricate networks that are typical of modern cities. The network size is only limited to your hard drive capacity.
Each model may have multiple sub networks and outfalls. You may specify the outfall levels if you wish to connect to existing systems. Alternatively, the program will determine the best possible outfall level in accordance with the design parameters.
The Guidelines for the Provision of Engineering Services in Residential Townships published by the Department of Community Development have been followed in the calculation of unit flows.
In addition the design flows may also be calculated according to the Harmon formula or using unit inflow hydrographs. A brief discussion on each method of flow determination is included.
The design is controlled by a number of parameters which are set by the user. This facility enables the design to be tailored to your own requirements or that of the local authorities or councils.
2-2 Sewer Reference
Unit Flow Method
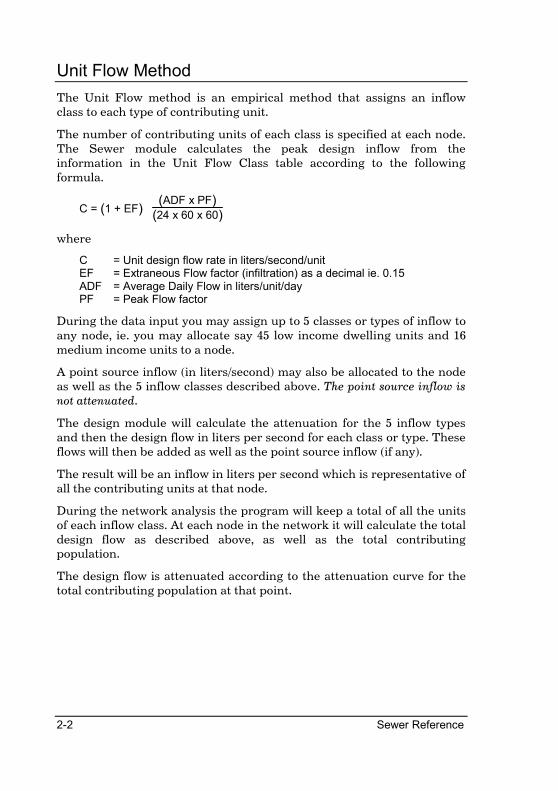
The Unit Flow method is an empirical method that assigns an inflow class to each type of contributing unit.
The number of contributing units of each class is specified at each node. The Sewer module calculates the peak design inflow from the information in the Unit Flow Class table according to the following formula.
C = ( )1 + EF ( )ADF x PF
( )24 x 60 x 60
where
C = Unit design flow rate in liters/second/unit EF = Extraneous Flow factor (infiltration) as a decimal ie. 0.15 ADF = Average Daily Flow in liters/unit/day PF = Peak Flow factor
During the data input you may assign up to 5 classes or types of inflow to any node, ie. you may allocate say 45 low income dwelling units and 16 medium income units to a node.
A point source inflow (in liters/second) may also be allocated to the node as well as the 5 inflow classes described above. The point source inflow is not attenuated.
The design module will calculate the attenuation for the 5 inflow types and then the design flow in liters per second for each class or type. These flows will then be added as well as the point source inflow (if any).
The result will be an inflow in liters per second which is representative of all the contributing units at that node.
During the network analysis the program will keep a total of all the units of each inflow class. At each node in the network it will calculate the total design flow as described above, as well as the total contributing population.
The design flow is attenuated according to the attenuation curve for the total contributing population at that point.
Basic Theory 2-3
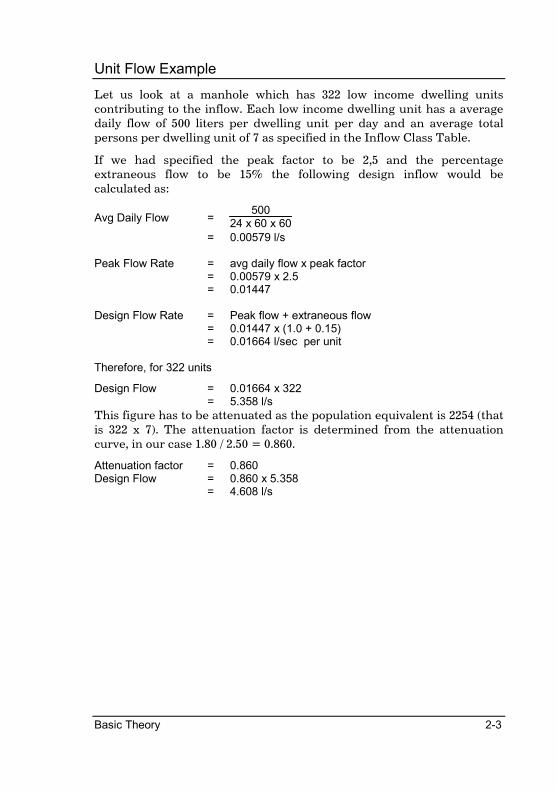
Unit Flow Example
Let us look at a manhole which has 322 low income dwelling units contributing to the inflow. Each low income dwelling unit has a average daily flow of 500 liters per dwelling unit per day and an average total persons per dwelling unit of 7 as specified in the Inflow Class Table.
If we had specified the peak factor to be 2,5 and the percentage extraneous flow to be 15% the following design inflow would be calculated as:
Avg Daily Flow = 500
24 x 60 x 60
= 0.00579 l/s Peak Flow Rate = avg daily flow x peak factor = 0.00579 x 2.5 = 0.01447 Design Flow Rate = Peak flow + extraneous flow = 0.01447 x (1.0 + 0.15) = 0.01664 l/sec per unit Therefore, for 322 units
Design Flow = 0.01664 x 322 = 5.358 l/s
This figure has to be attenuated as the population equivalent is 2254 (that is 322 x 7). The attenuation factor is determined from the attenuation curve, in our case 1.80 / 2.50 = 0.860.
Attenuation factor = 0.860 Design Flow = 0.860 x 5.358
= 4.608 l/s
2-4 Sewer Reference
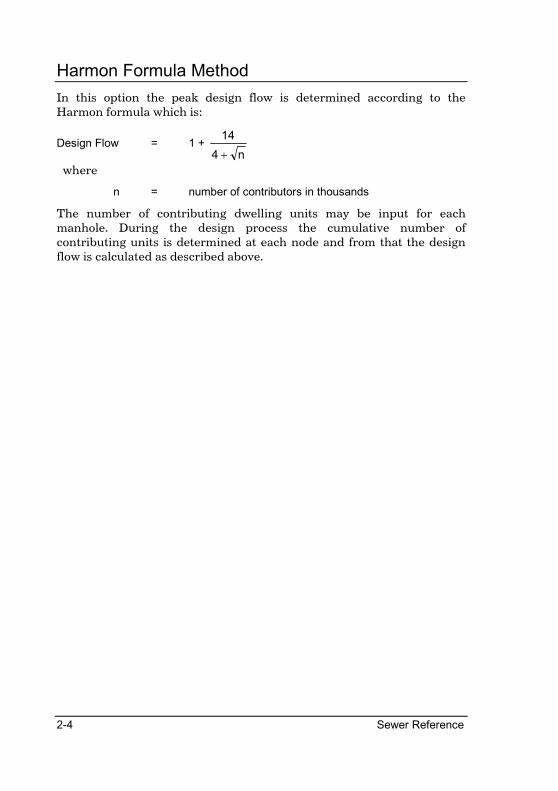
Harmon Formula Method
In this option the peak design flow is determined according to the Harmon formula which is:
Design Flow = 1 + n4
14
+
where
n = number of contributors in thousands
The number of contributing dwelling units may be input for each manhole. During the design process the cumulative number of contributing units is determined at each node and from that the design flow is calculated as described above.
Basic Theory 2-5
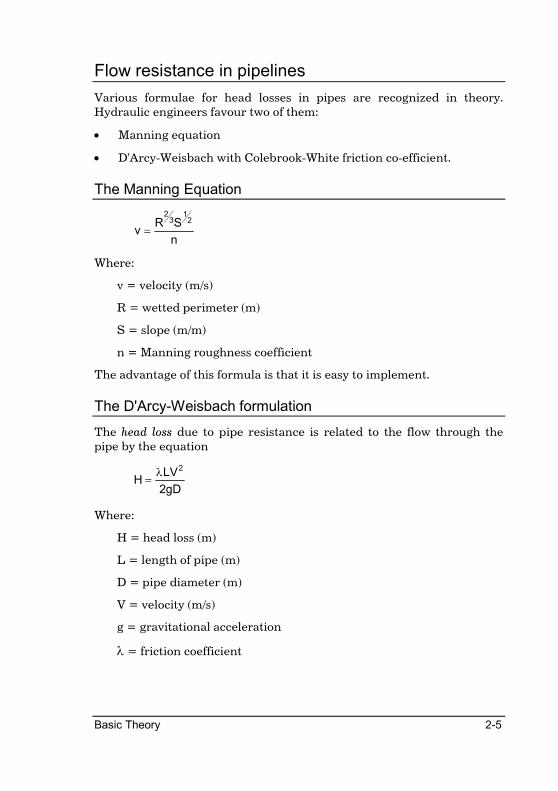
Flow resistance in pipelines
Various formulae for head losses in pipes are recognized in theory. Hydraulic engineers favour two of them:
• Manning equation
• D'Arcy-Weisbach with Colebrook-White friction co-efficient.
The Manning Equation
n
SRv
21
32
=
Where:
v = velocity (m/s)
R = wetted perimeter (m)
S = slope (m/m)
n = Manning roughness coefficient
The advantage of this formula is that it is easy to implement.
The D'Arcy-Weisbach formulation
The head loss due to pipe resistance is related to the flow through the pipe by the equation
gD2
LVH
2λ=
Where:
H = head loss (m)
L = length of pipe (m)
D = pipe diameter (m)
V = velocity (m/s)
g = gravitational acceleration
λ = friction coefficient
2-6 Sewer Reference
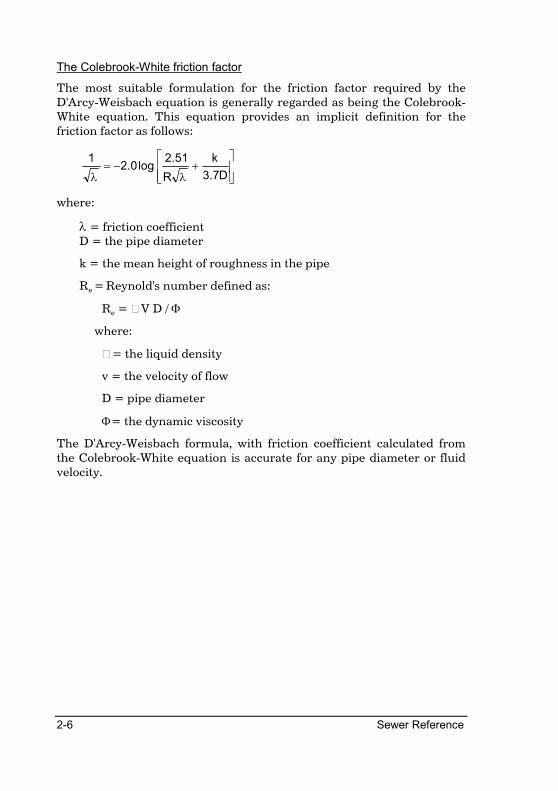
The Colebrook-White friction factor
The most suitable formulation for the friction factor required by the D'Arcy-Weisbach equation is generally regarded as being the Colebrook-White equation. This equation provides an implicit definition for the friction factor as follows:
+
λ−=
λ D7.3
k
R
51.2log0.2
1
where:
λ = friction coefficient D = the pipe diameter
k = the mean height of roughness in the pipe
Re = Reynold's number defined as:
Re = V D / Φ
where:
= the liquid density
v = the velocity of flow
D = pipe diameter
Φ= the dynamic viscosity
The D'Arcy-Weisbach formula, with friction coefficient calculated from the Colebrook-White equation is accurate for any pipe diameter or fluid velocity.

Tutorial - Sewer Design 3-1
Tutorial - Sewer Design
In order to familiarize yourself with Civil Designer it is advisable to complete the following tutorial that will teach you how to import manhole data from an ASCII file and build up the data set in preparation for analysis. Thereafter you will generate contract drawings. You will be shown how to:
• add a sewer data file to the project or create a new sewer data file
• import coordinate data containing node names, Y and X coordinates from an ASCII file
• generate a manhole layout plan from the coordinate data
• connect the nodes by means of links
• edit and set the link parameters
• input inflow data
• change the display settings
• run the analysis and view the results
• generate and view long sections
• calculate quantities according to SABS 1200
• generate a layout drawing with manhole names and a link schedule
3-2 Sewer Reference
Create a new data file
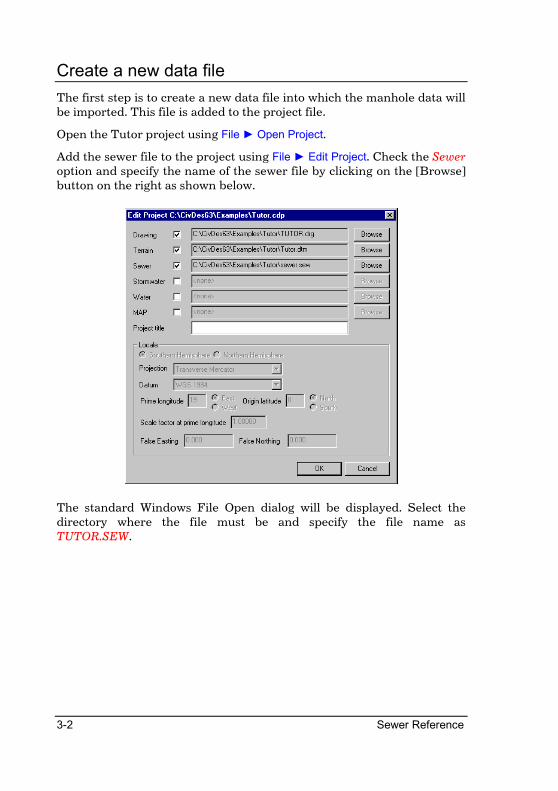
The first step is to create a new data file into which the manhole data will be imported. This file is added to the project file.
Open the Tutor project using File ► Open Project.
Add the sewer file to the project using File ► Edit Project. Check the Sewer option and specify the name of the sewer file by clicking on the [Browse] button on the right as shown below.
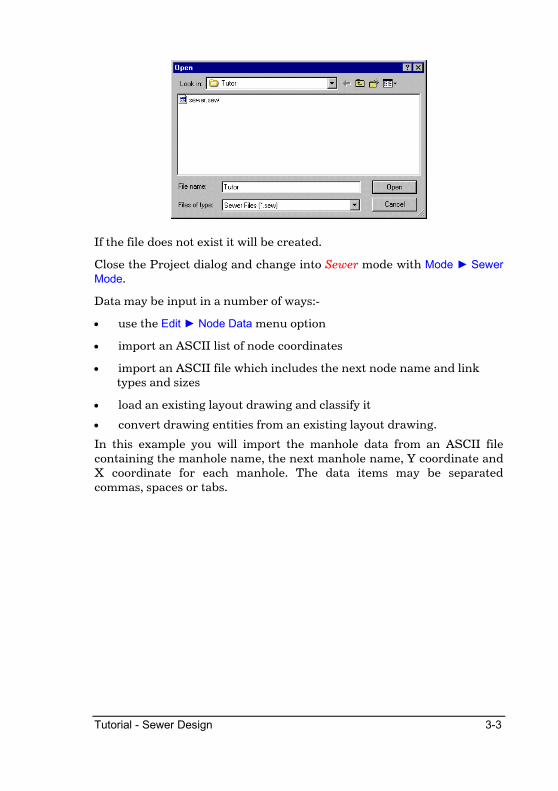
The standard Windows File Open dialog will be displayed. Select the directory where the file must be and specify the file name as TUTOR.SEW.
Tutorial - Sewer Design 3-3
If the file does not exist it will be created.
Close the Project dialog and change into Sewer mode with Mode ► Sewer
Mode.
Data may be input in a number of ways:-
• use the Edit ► Node Data menu option
• import an ASCII list of node coordinates
• import an ASCII file which includes the next node name and link types and sizes
• load an existing layout drawing and classify it
• convert drawing entities from an existing layout drawing.
In this example you will import the manhole data from an ASCII file containing the manhole name, the next manhole name, Y coordinate and X coordinate for each manhole. The data items may be separated commas, spaces or tabs.
3-4 Sewer Reference
Import coordinate data from an ASCII file
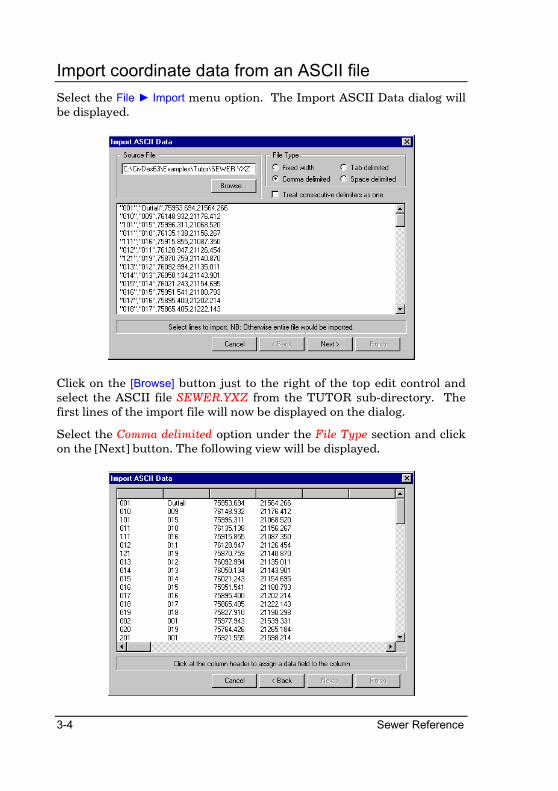
Select the File ► Import menu option. The Import ASCII Data dialog will be displayed.
Click on the [Browse] button just to the right of the top edit control and select the ASCII file SEWER.YXZ from the TUTOR sub-directory. The first lines of the import file will now be displayed on the dialog.
Select the Comma delimited option under the File Type section and click on the [Next] button. The following view will be displayed.
Tutorial - Sewer Design 3-5
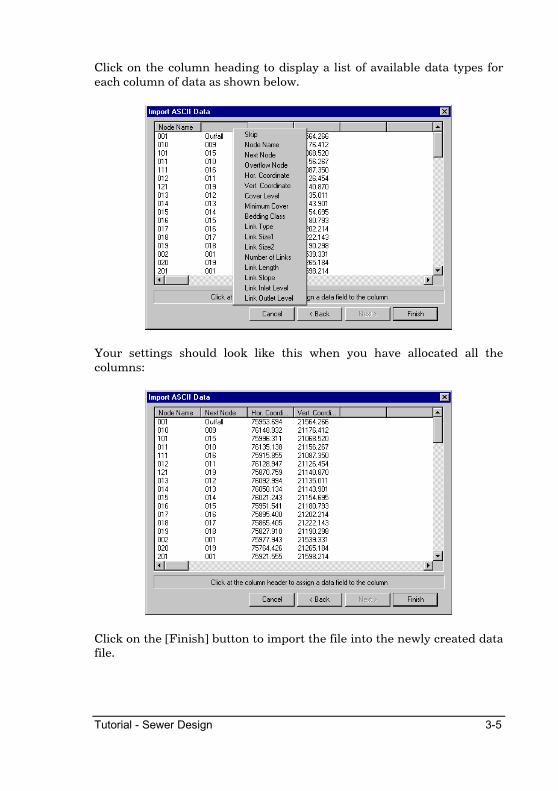
Click on the column heading to display a list of available data types for each column of data as shown below.
Your settings should look like this when you have allocated all the columns:
Click on the [Finish] button to import the file into the newly created data file.

3-6 Sewer Reference
If you import data into an existing data file the program will search the existing data for matching node names, and if it finds an existing record, it will update the fields in the record with the imported data.
Tutorial - Sewer Design 3-7
Display the nodes and links
Civil Designer has many graphical functions to simplify the definition of nodes and links in the network. Obviously these functions can only be used if your data includes coordinates for the nodes.
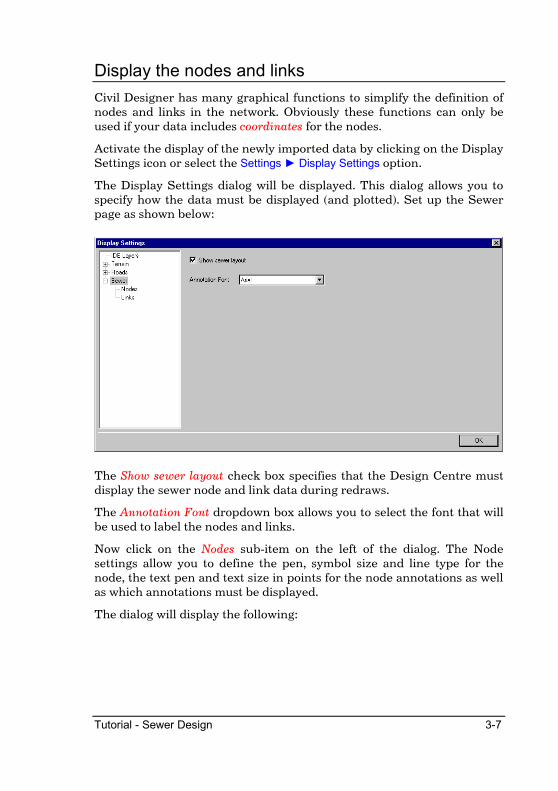
Activate the display of the newly imported data by clicking on the Display Settings icon or select the Settings ► Display Settings option.
The Display Settings dialog will be displayed. This dialog allows you to specify how the data must be displayed (and plotted). Set up the Sewer page as shown below:
The Show sewer layout check box specifies that the Design Centre must display the sewer node and link data during redraws.
The Annotation Font dropdown box allows you to select the font that will be used to label the nodes and links.
Now click on the Nodes sub-item on the left of the dialog. The Node settings allow you to define the pen, symbol size and line type for the node, the text pen and text size in points for the node annotations as well as which annotations must be displayed.
The dialog will display the following:
3-8 Sewer Reference
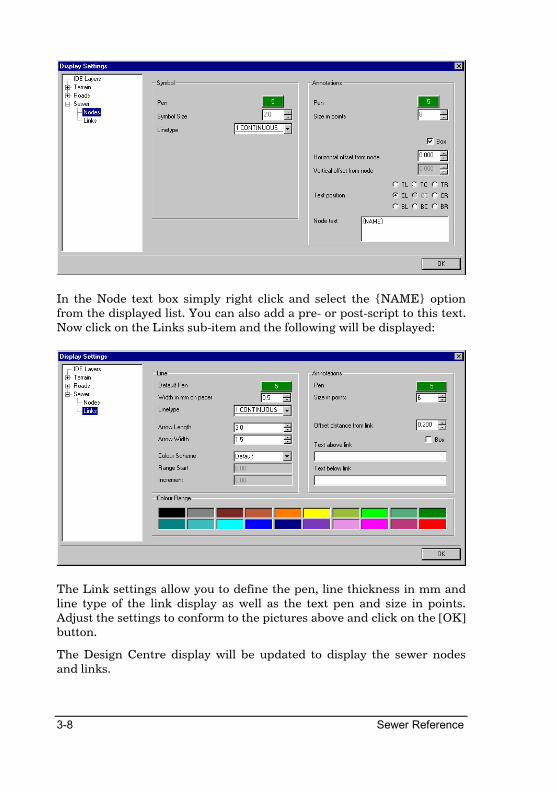
In the Node text box simply right click and select the {NAME} option from the displayed list. You can also add a pre- or post-script to this text. Now click on the Links sub-item and the following will be displayed:
The Link settings allow you to define the pen, line thickness in mm and line type of the link display as well as the text pen and size in points. Adjust the settings to conform to the pictures above and click on the [OK] button.
The Design Centre display will be updated to display the sewer nodes and links.
Tutorial - Sewer Design 3-9
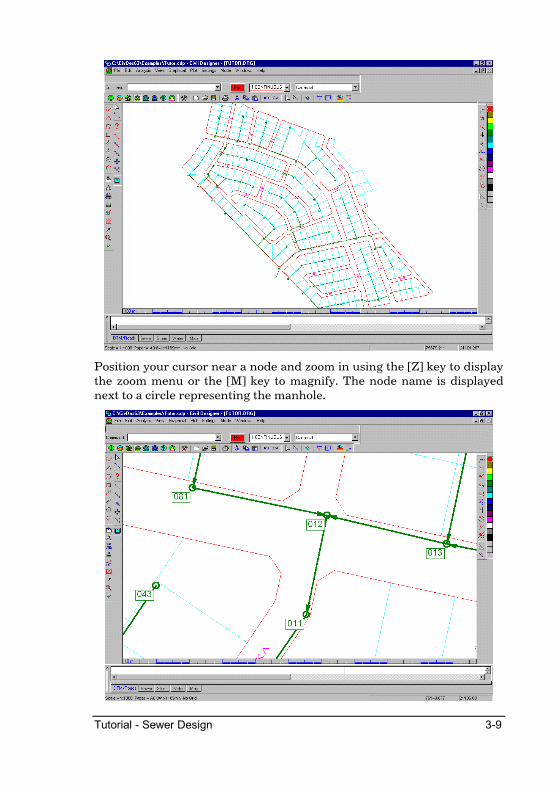
Position your cursor near a node and zoom in using the [Z] key to display the zoom menu or the [M] key to magnify. The node name is displayed next to a circle representing the manhole.
3-10 Sewer Reference
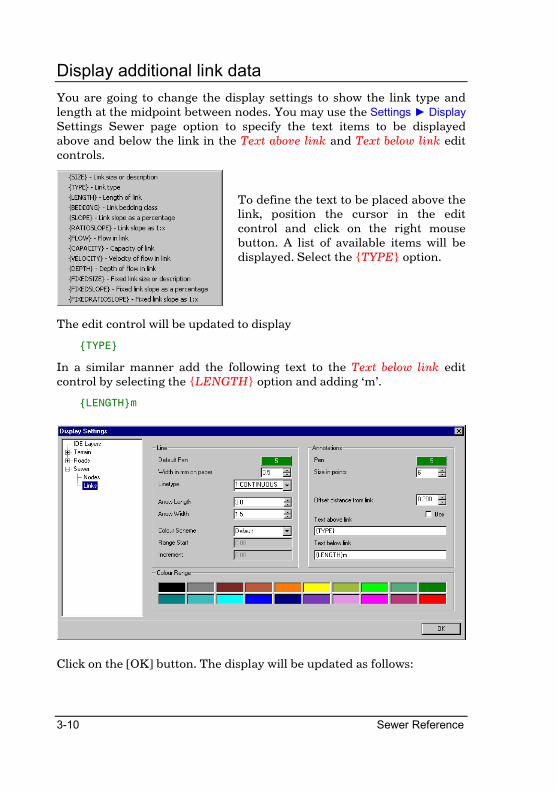
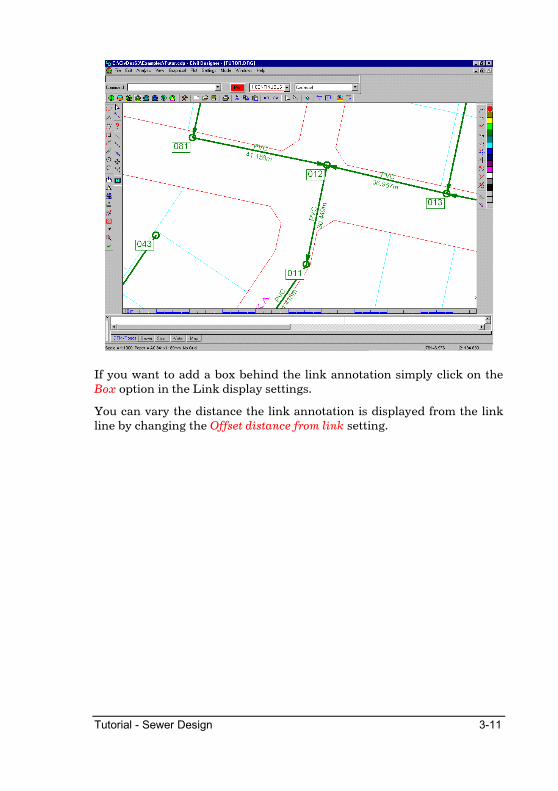
Display additional link data
You are going to change the display settings to show the link type and length at the midpoint between nodes. You may use the Settings ► Display
Settings Sewer page option to specify the text items to be displayed above and below the link in the Text above link and Text below link edit controls.
To define the text to be placed above the link, position the cursor in the edit control and click on the right mouse button. A list of available items will be displayed. Select the {TYPE} option.
The edit control will be updated to display
{TYPE}
In a similar manner add the following text to the Text below link edit control by selecting the {LENGTH} option and adding ‘m’.
{LENGTH}m
Click on the [OK] button. The display will be updated as follows:
Tutorial - Sewer Design 3-11
If you want to add a box behind the link annotation simply click on the Box option in the Link display settings.
You can vary the distance the link annotation is displayed from the link line by changing the Offset distance from link setting.
3-12 Sewer Reference
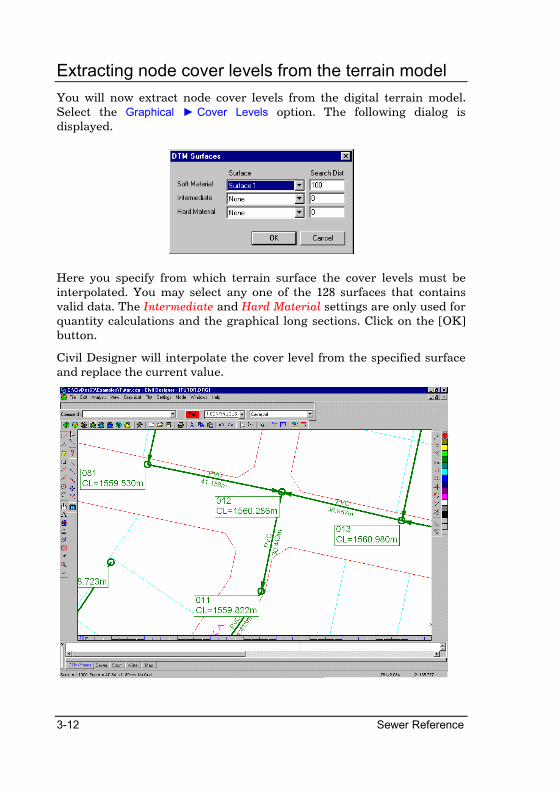
Extracting node cover levels from the terrain model
You will now extract node cover levels from the digital terrain model. Select the Graphical ► Cover Levels option. The following dialog is displayed.
Here you specify from which terrain surface the cover levels must be interpolated. You may select any one of the 128 surfaces that contains valid data. The Intermediate and Hard Material settings are only used for quantity calculations and the graphical long sections. Click on the [OK] button.
Civil Designer will interpolate the cover level from the specified surface and replace the current value.

Tutorial - Sewer Design 3-13
To check the results, let us update the display settings to show the cover level next to each node. Select the Settings ► Display Settings option, go to the Sewer Node settings and add the ‘CL={COVER}m’ option to the node annotation.
Click on the [OK] button. The display will be updated to display the node names as well as the cover level at the node with the ‘CL=’ subscript.
3-14 Sewer Reference
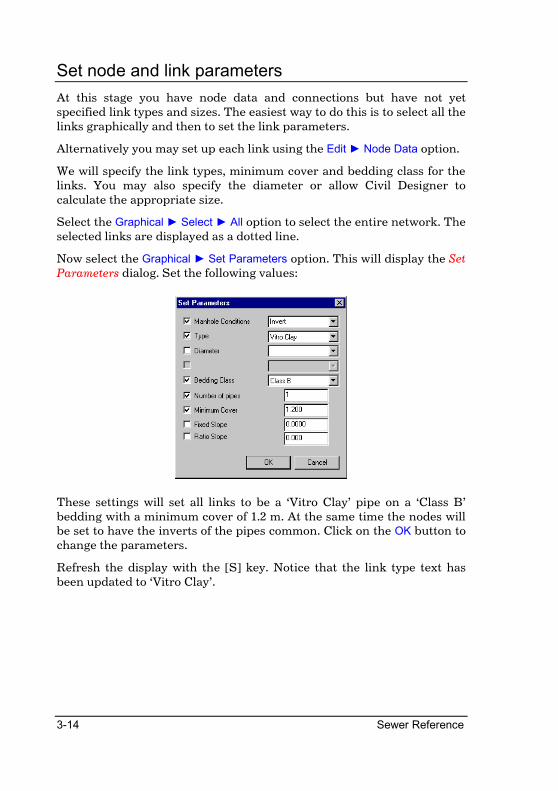
Set node and link parameters
At this stage you have node data and connections but have not yet specified link types and sizes. The easiest way to do this is to select all the links graphically and then to set the link parameters.
Alternatively you may set up each link using the Edit ► Node Data option.
We will specify the link types, minimum cover and bedding class for the links. You may also specify the diameter or allow Civil Designer to calculate the appropriate size.
Select the Graphical ► Select ► All option to select the entire network. The selected links are displayed as a dotted line.
Now select the Graphical ► Set Parameters option. This will display the Set Parameters dialog. Set the following values:
These settings will set all links to be a ‘Vitro Clay’ pipe on a ‘Class B’ bedding with a minimum cover of 1.2 m. At the same time the nodes will be set to have the inverts of the pipes common. Click on the OK button to change the parameters.
Refresh the display with the [S] key. Notice that the link type text has been updated to ‘Vitro Clay’.
Tutorial - Sewer Design 3-15
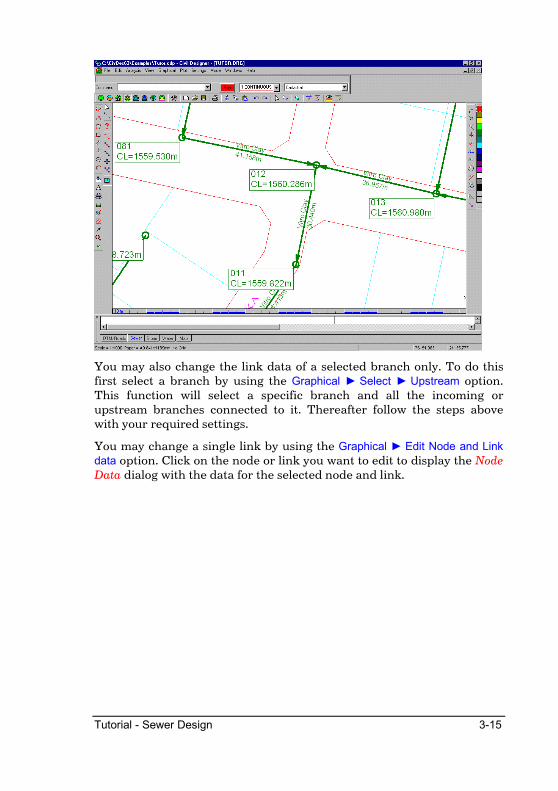
You may also change the link data of a selected branch only. To do this first select a branch by using the Graphical ► Select ► Upstream option. This function will select a specific branch and all the incoming or upstream branches connected to it. Thereafter follow the steps above with your required settings.
You may change a single link by using the Graphical ► Edit Node and Link
data option. Click on the node or link you want to edit to display the Node Data dialog with the data for the selected node and link.
3-16 Sewer Reference
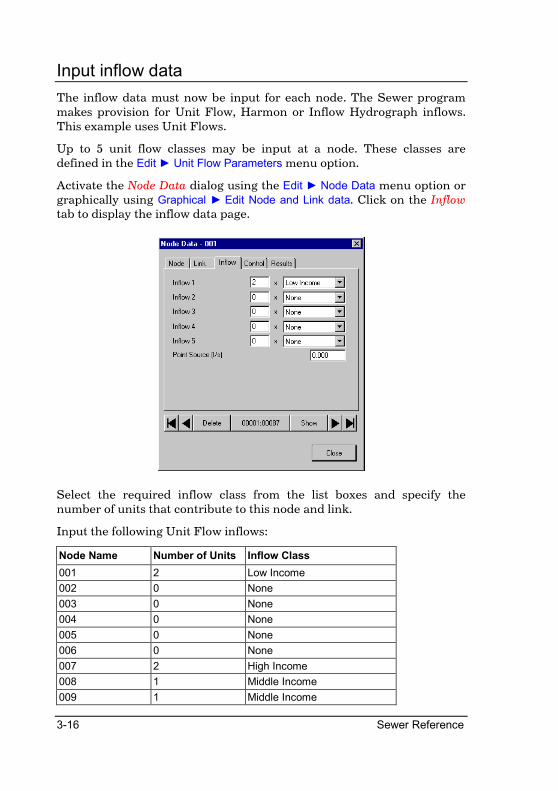
Input inflow data
The inflow data must now be input for each node. The Sewer program makes provision for Unit Flow, Harmon or Inflow Hydrograph inflows. This example uses Unit Flows.
Up to 5 unit flow classes may be input at a node. These classes are defined in the Edit ► Unit Flow Parameters menu option.
Activate the Node Data dialog using the Edit ► Node Data menu option or graphically using Graphical ► Edit Node and Link data. Click on the Inflow tab to display the inflow data page.
Select the required inflow class from the list boxes and specify the number of units that contribute to this node and link.
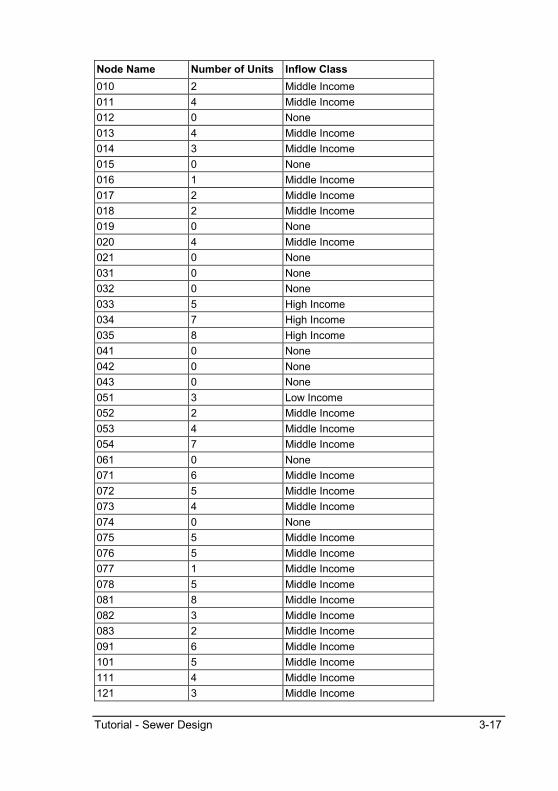
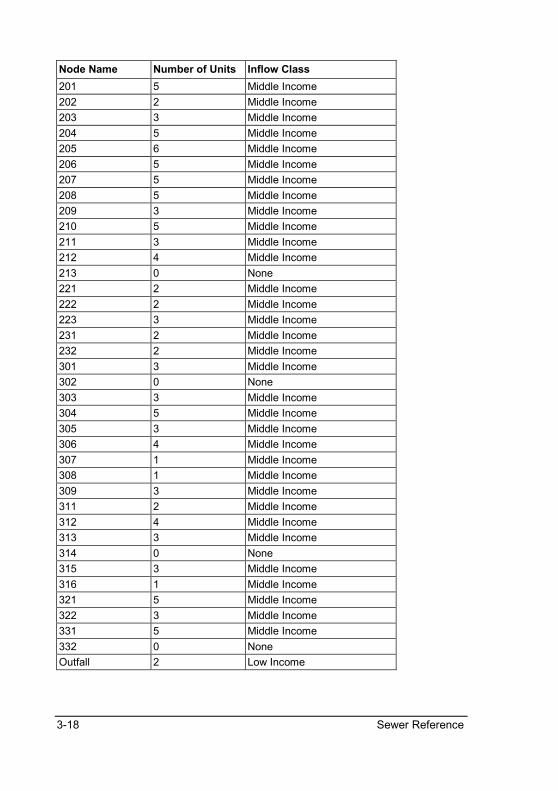
Input the following Unit Flow inflows:
Node Name Number of Units Inflow Class
001 2 Low Income
002 0 None
003 0 None
004 0 None
005 0 None
006 0 None
007 2 High Income
008 1 Middle Income
009 1 Middle Income
Tutorial - Sewer Design 3-17
Node Name Number of Units Inflow Class
010 2 Middle Income
011 4 Middle Income
012 0 None
013 4 Middle Income
014 3 Middle Income
015 0 None
016 1 Middle Income
017 2 Middle Income
018 2 Middle Income
019 0 None
020 4 Middle Income
021 0 None
031 0 None
032 0 None
033 5 High Income
034 7 High Income
035 8 High Income
041 0 None
042 0 None
043 0 None
051 3 Low Income
052 2 Middle Income
053 4 Middle Income
054 7 Middle Income
061 0 None
071 6 Middle Income
072 5 Middle Income
073 4 Middle Income
074 0 None
075 5 Middle Income
076 5 Middle Income
077 1 Middle Income
078 5 Middle Income
081 8 Middle Income
082 3 Middle Income
083 2 Middle Income
091 6 Middle Income
101 5 Middle Income
111 4 Middle Income
121 3 Middle Income
3-18 Sewer Reference
Node Name Number of Units Inflow Class
201 5 Middle Income
202 2 Middle Income
203 3 Middle Income
204 5 Middle Income
205 6 Middle Income
206 5 Middle Income
207 5 Middle Income
208 5 Middle Income
209 3 Middle Income
210 5 Middle Income
211 3 Middle Income
212 4 Middle Income
213 0 None
221 2 Middle Income
222 2 Middle Income
223 3 Middle Income
231 2 Middle Income
232 2 Middle Income
301 3 Middle Income
302 0 None
303 3 Middle Income
304 5 Middle Income
305 3 Middle Income
306 4 Middle Income
307 1 Middle Income
308 1 Middle Income
309 3 Middle Income
311 2 Middle Income
312 4 Middle Income
313 3 Middle Income
314 0 None
315 3 Middle Income
316 1 Middle Income
321 5 Middle Income
322 3 Middle Income
331 5 Middle Income
332 0 None
Outfall 2 Low Income
Tutorial - Sewer Design 3-19
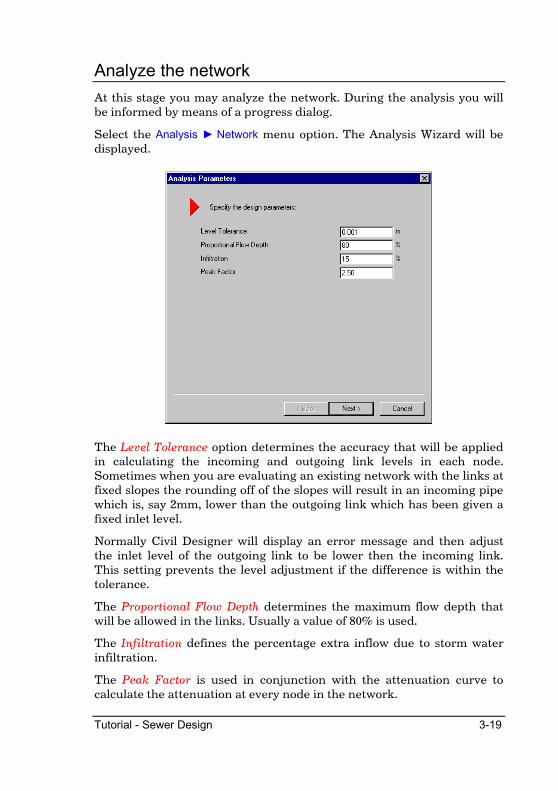
Analyze the network
At this stage you may analyze the network. During the analysis you will be informed by means of a progress dialog.
Select the Analysis ► Network menu option. The Analysis Wizard will be displayed.
The Level Tolerance option determines the accuracy that will be applied in calculating the incoming and outgoing link levels in each node. Sometimes when you are evaluating an existing network with the links at fixed slopes the rounding off of the slopes will result in an incoming pipe which is, say 2mm, lower than the outgoing link which has been given a fixed inlet level.
Normally Civil Designer will display an error message and then adjust the inlet level of the outgoing link to be lower then the incoming link. This setting prevents the level adjustment if the difference is within the tolerance.
The Proportional Flow Depth determines the maximum flow depth that will be allowed in the links. Usually a value of 80% is used.
The Infiltration defines the percentage extra inflow due to storm water infiltration.
The Peak Factor is used in conjunction with the attenuation curve to calculate the attenuation at every node in the network.
3-20 Sewer Reference
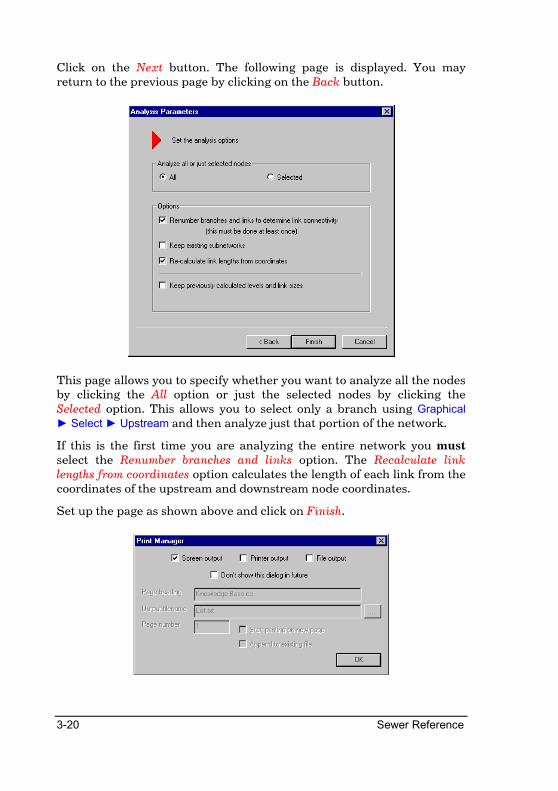
Click on the Next button. The following page is displayed. You may return to the previous page by clicking on the Back button.
This page allows you to specify whether you want to analyze all the nodes by clicking the All option or just the selected nodes by clicking the Selected option. This allows you to select only a branch using Graphical
► Select ► Upstream and then analyze just that portion of the network.
If this is the first time you are analyzing the entire network you must select the Renumber branches and links option. The Recalculate link lengths from coordinates option calculates the length of each link from the coordinates of the upstream and downstream node coordinates.
Set up the page as shown above and click on Finish.

Tutorial - Sewer Design 3-21
The Print Manager dialog will be displayed. This allows you to specify the destination of the log that will be generated during the analysis. In this instance direct the log to the Output Window by checking the Screen output option.
After the completion of the analysis the results windows will be displayed. Each window displays certain aspects of the results such as flows, overflows, levels and slopes, and the hydraulic gradient.
3-22 Sewer Reference
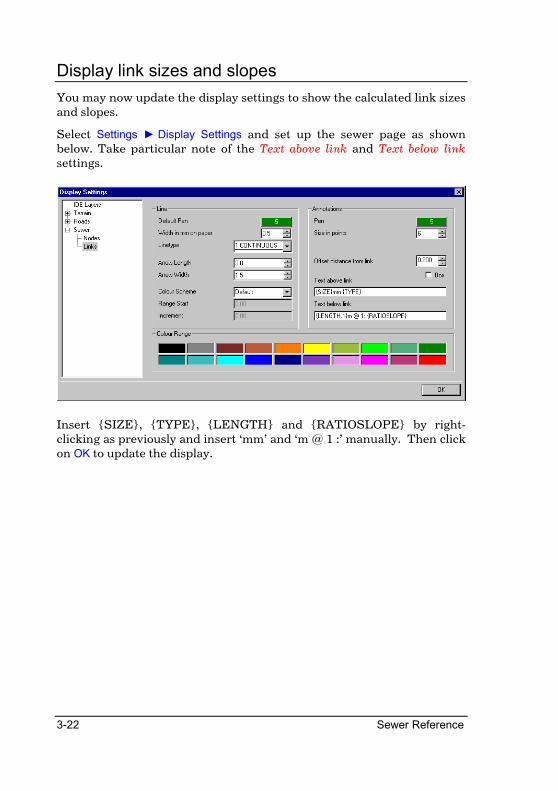
Display link sizes and slopes
You may now update the display settings to show the calculated link sizes and slopes.
Select Settings ► Display Settings and set up the sewer page as shown below. Take particular note of the Text above link and Text below link settings.
Insert {SIZE}, {TYPE}, {LENGTH} and {RATIOSLOPE} by right-clicking as previously and insert ‘mm’ and ‘m @ 1 :’ manually. Then click on OK to update the display.

Tutorial - Sewer Design 3-23
Calculate Quantities
Quantities are calculated according to the parameters specified in the Bedding Class and Depth Increment dialogs. These parameters can be changed from the Edit menu.
Select the Analysis ► Quantities option.
You may calculate the quantities of the entire network or just the selected links. Specify All.
After the analysis the quantities will be displayed in a series of windows. Each window contains the results of a particular quantity calculation.
3-24 Sewer Reference
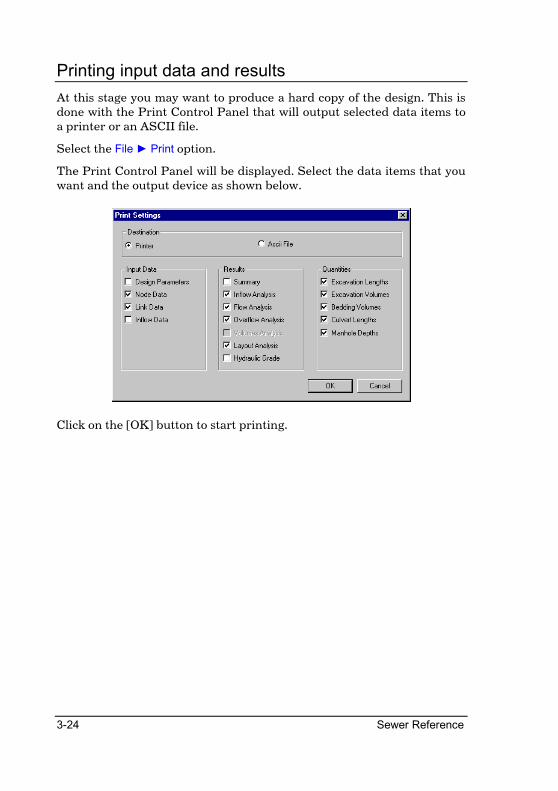
Printing input data and results
At this stage you may want to produce a hard copy of the design. This is done with the Print Control Panel that will output selected data items to a printer or an ASCII file.
Select the File ► Print option.
The Print Control Panel will be displayed. Select the data items that you want and the output device as shown below.
Click on the [OK] button to start printing.
Tutorial - Sewer Design 3-25
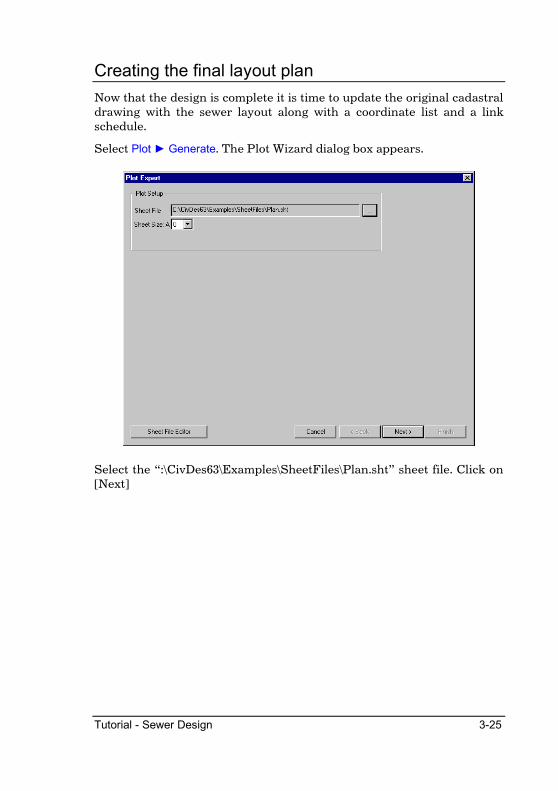
Creating the final layout plan
Now that the design is complete it is time to update the original cadastral drawing with the sewer layout along with a coordinate list and a link schedule.
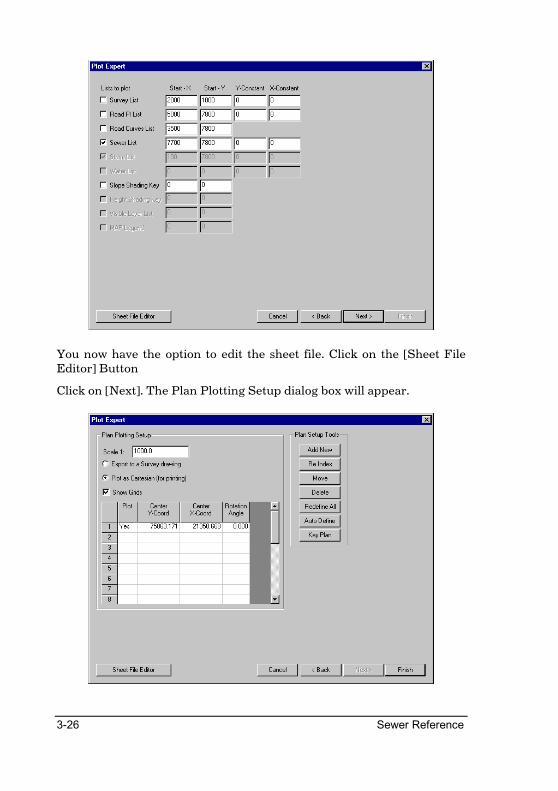
Select Plot ► Generate. The Plot Wizard dialog box appears.
Select the “:\CivDes63\Examples\SheetFiles\Plan.sht” sheet file. Click on [Next]
3-26 Sewer Reference
You now have the option to edit the sheet file. Click on the [Sheet File Editor] Button
Click on [Next]. The Plan Plotting Setup dialog box will appear.
Tutorial - Sewer Design 3-27
If the spreadsheet is empty click on the [Add New] button.
Click at the center of the drawing.
You can now position the paper.
Click again to indicate the desired position. Select [No] to keep the same rotation
Right click on any unwanted plots to change the plot column to [No].
The [Key Plan] option can now be selected if you have multiple sheets for your plan drawing and you would like to plot a key plan. Select scale and rotation of key plan as normal.
Click on [Finish] to generate the plan drawings.
Input a file name to save the drawings.
If you are plotting more than one plan drawing Civil Designer will save them sequentially i.e. “Filename1”, ”Filename2” ect.
To toggle between drawings and the Design Centre – choose the desired visible window from the Windows menu bar.
All additional changes can now be made in the CAD mode.
3-28 Sewer Reference
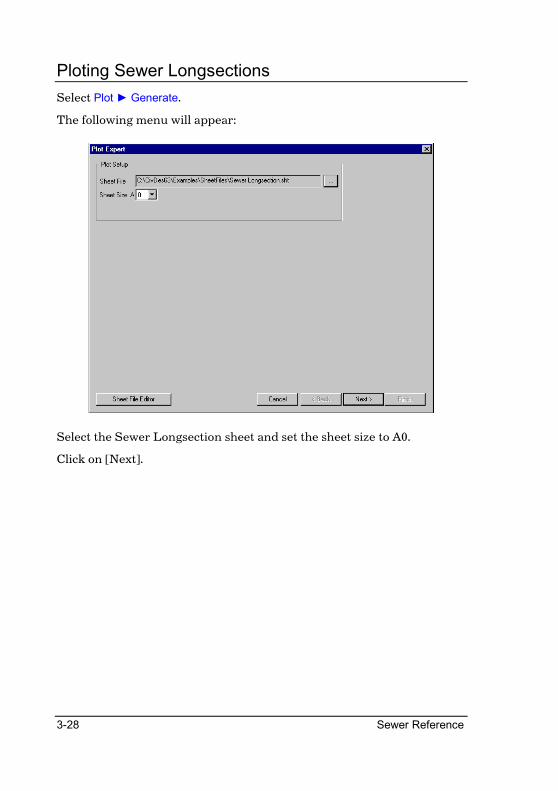
Ploting Sewer Longsections
Select Plot ► Generate.
The following menu will appear:
Select the Sewer Longsection sheet and set the sheet size to A0.
Click on [Next].
Tutorial - Sewer Design 3-29
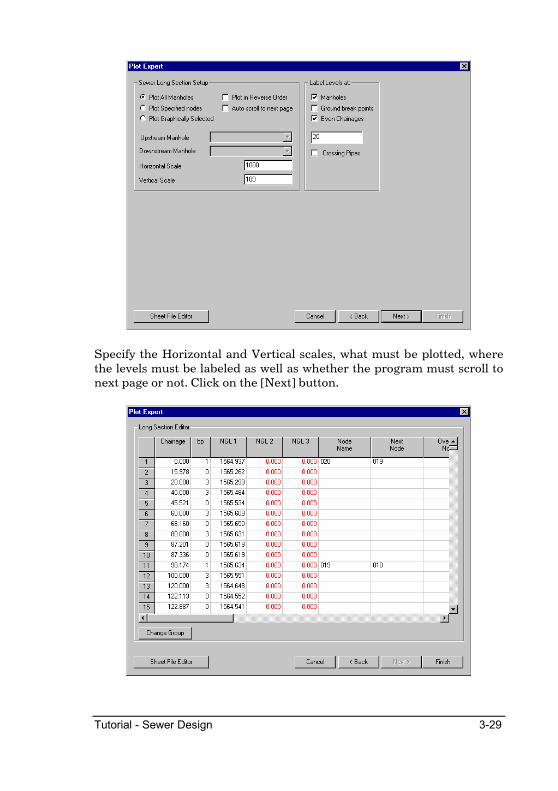
Specify the Horizontal and Vertical scales, what must be plotted, where the levels must be labeled as well as whether the program must scroll to next page or not. Click on the [Next] button.
3-30 Sewer Reference
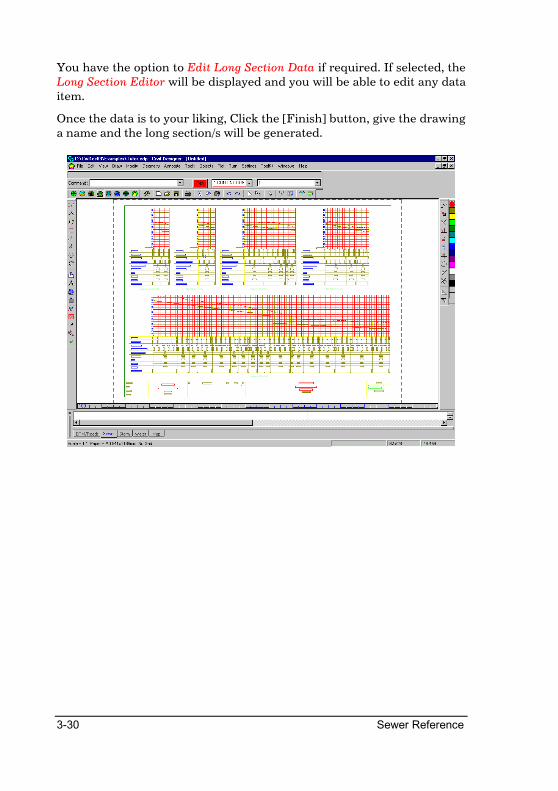
You have the option to Edit Long Section Data if required. If selected, the Long Section Editor will be displayed and you will be able to edit any data item.
Once the data is to your liking, Click the [Finish] button, give the drawing a name and the long section/s will be generated.
File Menu 4-1
File Menu
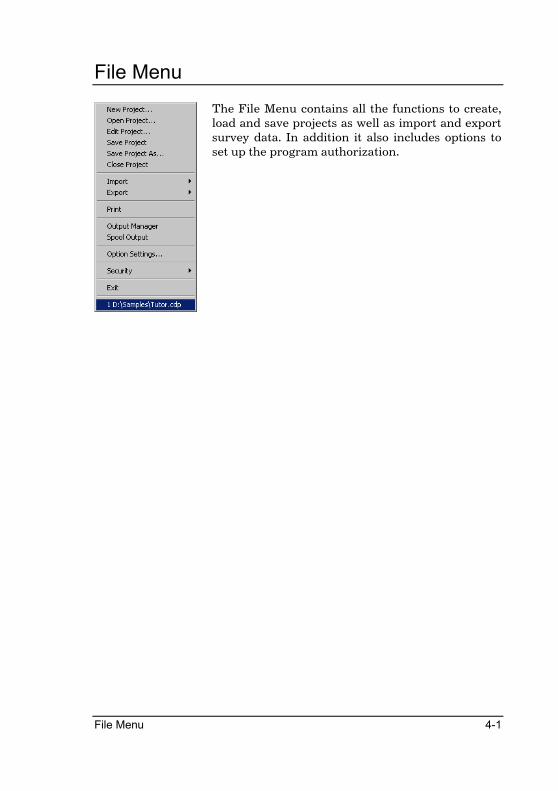
The File Menu contains all the functions to create, load and save projects as well as import and export survey data. In addition it also includes options to set up the program authorization.
4-2 Sewer Reference
New Project
Create a new project
Icon Button Toolbar Shortcut Command
ProjectNew
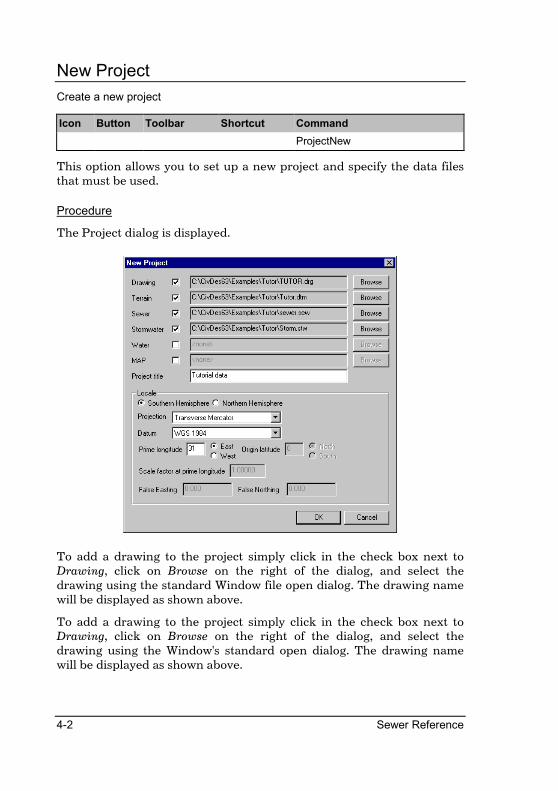
This option allows you to set up a new project and specify the data files that must be used.
Procedure
The Project dialog is displayed.
To add a drawing to the project simply click in the check box next to Drawing, click on Browse on the right of the dialog, and select the drawing using the standard Window file open dialog. The drawing name will be displayed as shown above.
To add a drawing to the project simply click in the check box next to Drawing, click on Browse on the right of the dialog, and select the drawing using the Window's standard open dialog. The drawing name will be displayed as shown above.
File Menu 4-3
Similarly, to add a data file to the project click in the check box next to the required data type and select the file to use with the [Browse] button. If the file does not exist it will be created.
To use the Survey, Terrain or Roads functions, you must select or create a Terrain data file.
Drawing File
You may only use an existing drawing file. The drawing may be an AllyCAD DRG, AutoCAD DWG, Caddie CEX or a DXF file.
Terrain File
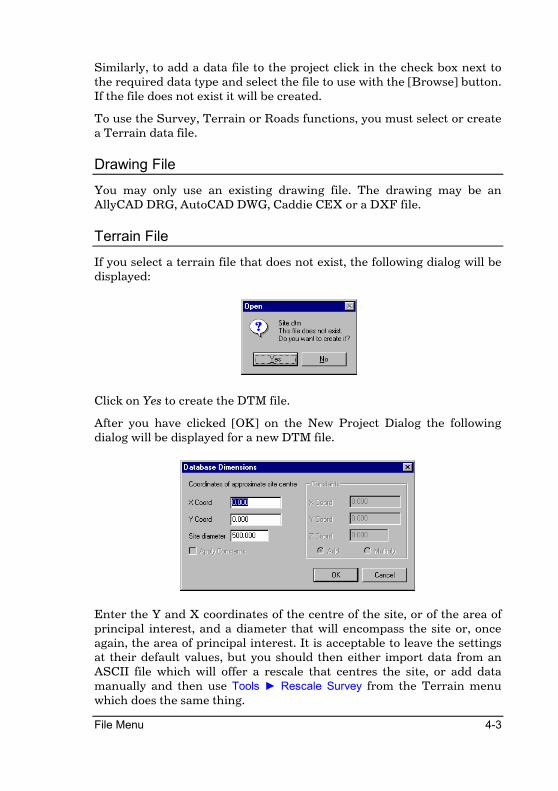
If you select a terrain file that does not exist, the following dialog will be displayed:
Click on Yes to create the DTM file.
After you have clicked [OK] on the New Project Dialog the following dialog will be displayed for a new DTM file.
Enter the Y and X coordinates of the centre of the site, or of the area of principal interest, and a diameter that will encompass the site or, once again, the area of principal interest. It is acceptable to leave the settings at their default values, but you should then either import data from an ASCII file which will offer a rescale that centres the site, or add data manually and then use Tools ► Rescale Survey from the Terrain menu which does the same thing.
4-4 Sewer Reference
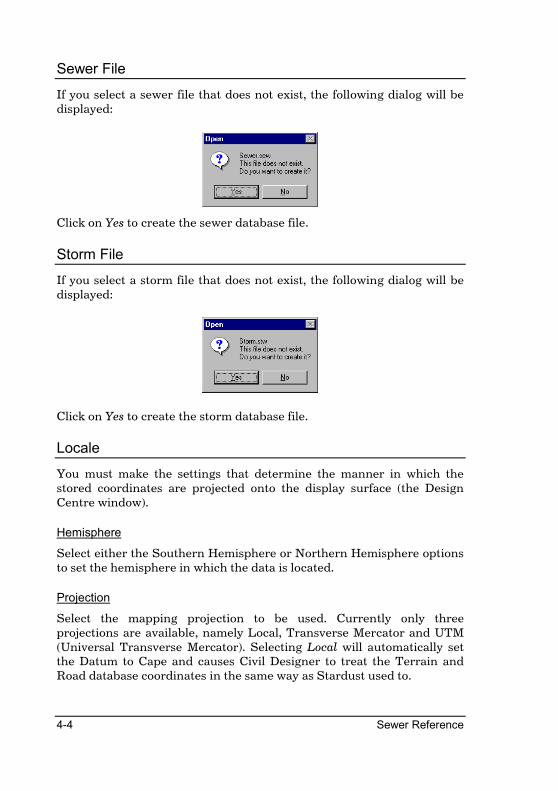
Sewer File
If you select a sewer file that does not exist, the following dialog will be displayed:
Click on Yes to create the sewer database file.
Storm File
If you select a storm file that does not exist, the following dialog will be displayed:
Click on Yes to create the storm database file.
Locale
You must make the settings that determine the manner in which the stored coordinates are projected onto the display surface (the Design Centre window).
Hemisphere
Select either the Southern Hemisphere or Northern Hemisphere options to set the hemisphere in which the data is located.
Projection
Select the mapping projection to be used. Currently only three projections are available, namely Local, Transverse Mercator and UTM (Universal Transverse Mercator). Selecting Local will automatically set the Datum to Cape and causes Civil Designer to treat the Terrain and Road database coordinates in the same way as Stardust used to.
File Menu 4-5
Datum
Select the datum on which the data is to be based. This determines the ellipsoid on which the projection is based and therefore the constants used for the mapping projection. Note that the Cape datum is the equivalent datum for that used by Stardust.
Prime Longitude
Enter the central LO of the panel in which the data falls (actually the longitude on which the 0 value of the horizontal ordinates of the coordinate system falls) and also select whether this LO is East or West of 0° longitude (Greenwich).
Origin Latitude
Enter the latitude on which the 0 value of the vertical ordinates of the coordinate system falls and also select whether this latitude is North or South of 0° latitude (the Equator). This should normally be set to 0° (origin at the equator where North or South are immaterial) but could be different for some projections.
Scale factor at prime longitude
Enter the factor by which coordinates are adjusted in order to fit the projection. This should normally be set to 1.0 except if you are using UTM coordinates (see Remarks below).
False Easting and False Northing
Enter the values to be subtracted/added to the LO coordinates during projection conversion. These should normally be set to 0 except if you are using UTM coordinates (see below).
DO NOT use the False Easting and False Northing settings to apply some constant to the data coordinates, as the projection calculations rely on full coordinates and will give incorrect values if these entries are used incorrectly.
Remarks
In order to use a UTM system the following settings should be made for Locale:
• Convert the UTM block number to LO using the formula (BLOCKNUMBER x 6°) - 183°. This calculates the Longitude of the central meridian in degrees.

4-6 Sewer Reference
• Set the scale factor at the central meridian to 0.9996.
• Enter the correct False Easting and False Northing values of +500 000m Easting, and 0m Northing for Northern Hemisphere or +10 000 000m Northing for Southern Hemisphere.
File Menu 4-7
Open Project
Load an existing project
Icon Button Toolbar Shortcut Command
ProjectOpen
You can select which project to open using the standard Windows Open dialog.
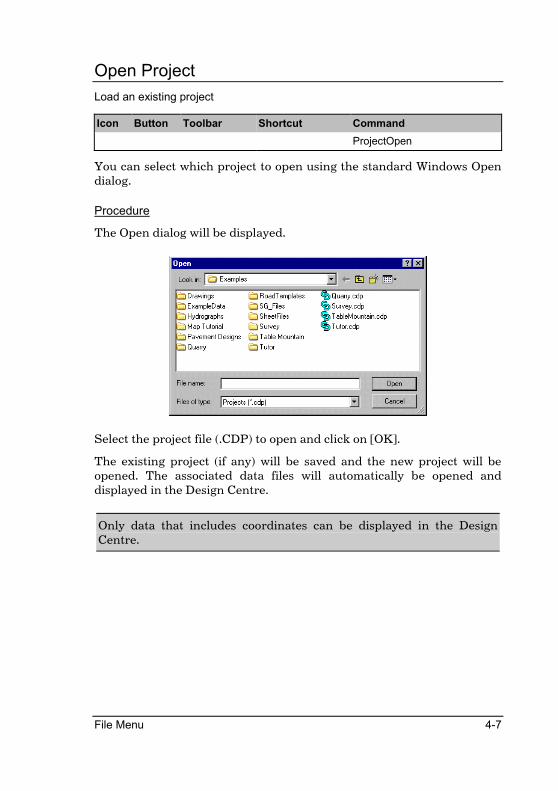
Procedure
The Open dialog will be displayed.
Select the project file (.CDP) to open and click on [OK].
The existing project (if any) will be saved and the new project will be opened. The associated data files will automatically be opened and displayed in the Design Centre.
Only data that includes coordinates can be displayed in the Design Centre.
4-8 Sewer Reference
Edit Project
Edit the current project
Icon Button Toolbar Shortcut Command
ProjectEdit
This option allows you to add design elements to the project or to change the data files associated with the project.
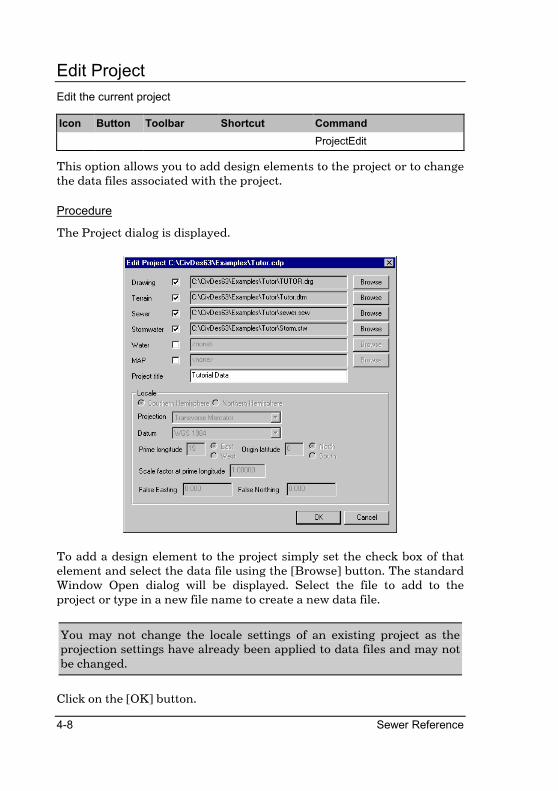
Procedure
The Project dialog is displayed.
To add a design element to the project simply set the check box of that element and select the data file using the [Browse] button. The standard Window Open dialog will be displayed. Select the file to add to the project or type in a new file name to create a new data file.
You may not change the locale settings of an existing project as the projection settings have already been applied to data files and may not be changed.
Click on the [OK] button.
File Menu 4-9
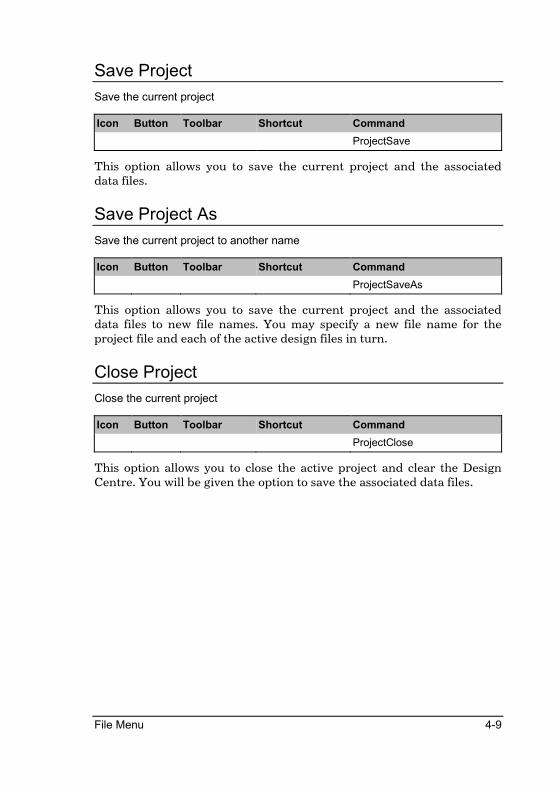
Save Project
Save the current project
Icon Button Toolbar Shortcut Command
ProjectSave
This option allows you to save the current project and the associated data files.
Save Project As
Save the current project to another name
Icon Button Toolbar Shortcut Command
ProjectSaveAs
This option allows you to save the current project and the associated data files to new file names. You may specify a new file name for the project file and each of the active design files in turn.
Close Project
Close the current project
Icon Button Toolbar Shortcut Command
ProjectClose
This option allows you to close the active project and clear the Design Centre. You will be given the option to save the associated data files.
4-10 Sewer Reference
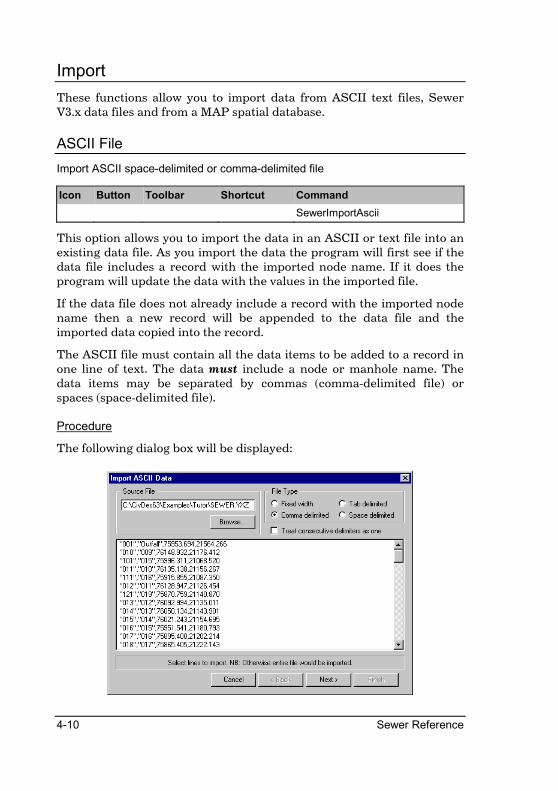
Import
These functions allow you to import data from ASCII text files, Sewer V3.x data files and from a MAP spatial database.
ASCII File
Import ASCII space-delimited or comma-delimited file
Icon Button Toolbar Shortcut Command
SewerImportAscii
This option allows you to import the data in an ASCII or text file into an existing data file. As you import the data the program will first see if the data file includes a record with the imported node name. If it does the program will update the data with the values in the imported file.
If the data file does not already include a record with the imported node name then a new record will be appended to the data file and the imported data copied into the record.
The ASCII file must contain all the data items to be added to a record in one line of text. The data must include a node or manhole name. The data items may be separated by commas (comma-delimited file) or spaces (space-delimited file).
Procedure
The following dialog box will be displayed:
File Menu 4-11
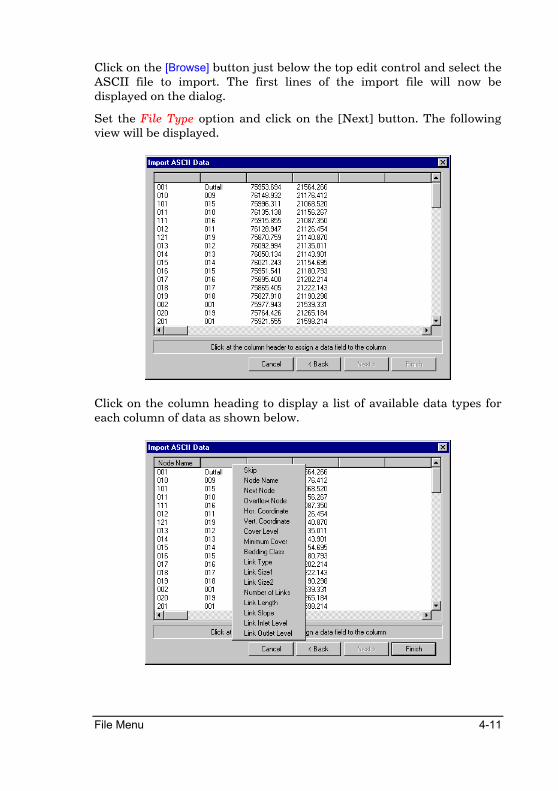
Click on the [Browse] button just below the top edit control and select the ASCII file to import. The first lines of the import file will now be displayed on the dialog.
Set the File Type option and click on the [Next] button. The following view will be displayed.
Click on the column heading to display a list of available data types for each column of data as shown below.
4-12 Sewer Reference
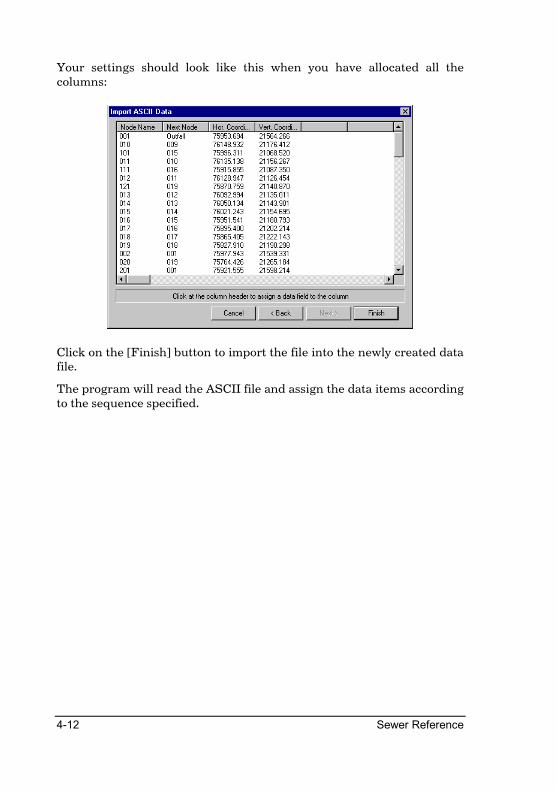
Your settings should look like this when you have allocated all the columns:
Click on the [Finish] button to import the file into the newly created data file.
The program will read the ASCII file and assign the data items according to the sequence specified.
File Menu 4-13
Version 3 Data
Import a sewer V3.x data file
Icon Button Toolbar Shortcut Command
SewerImportData3
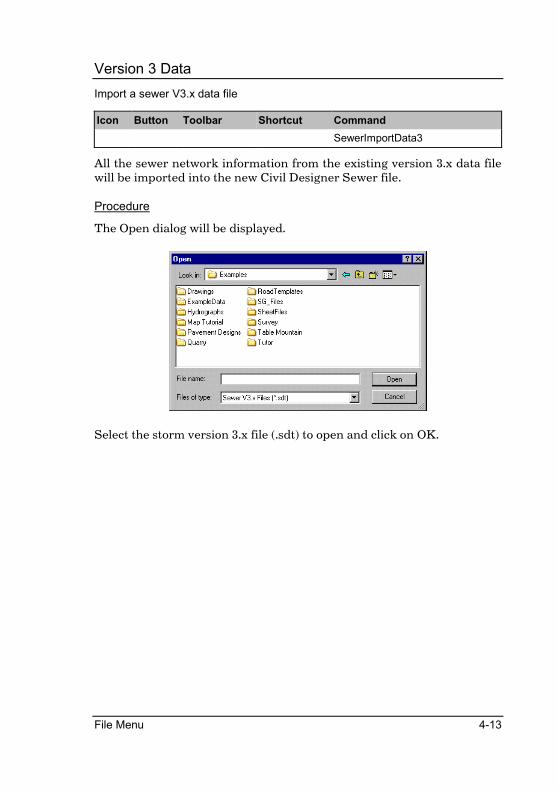
All the sewer network information from the existing version 3.x data file will be imported into the new Civil Designer Sewer file.
Procedure
The Open dialog will be displayed.
Select the storm version 3.x file (.sdt) to open and click on OK.
4-14 Sewer Reference
MAP Theme
Import data from a MAP theme
Icon Button Toolbar Shortcut Command
SewerImportMap
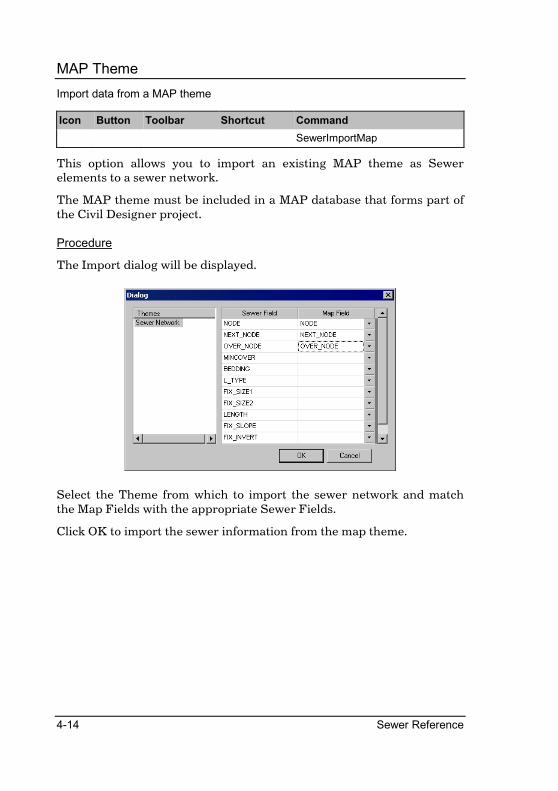
This option allows you to import an existing MAP theme as Sewer elements to a sewer network.
The MAP theme must be included in a MAP database that forms part of the Civil Designer project.
Procedure
The Import dialog will be displayed.
Select the Theme from which to import the sewer network and match the Map Fields with the appropriate Sewer Fields.
Click OK to import the sewer information from the map theme.
File Menu 4-15
Inflow Hydrograph
Import ASCII Hydrograph files
Icon Button Toolbar Shortcut Command
SewerImportHydro
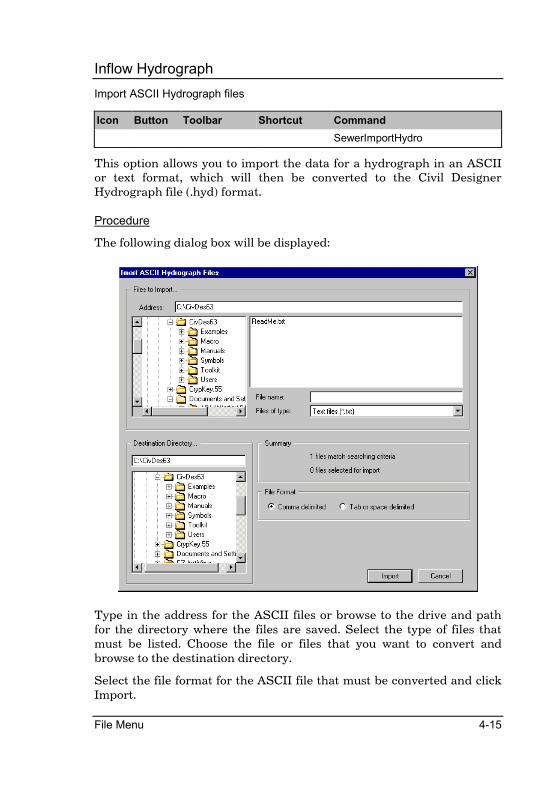
This option allows you to import the data for a hydrograph in an ASCII or text format, which will then be converted to the Civil Designer Hydrograph file (.hyd) format.
Procedure
The following dialog box will be displayed:
Type in the address for the ASCII files or browse to the drive and path for the directory where the files are saved. Select the type of files that must be listed. Choose the file or files that you want to convert and browse to the destination directory.
Select the file format for the ASCII file that must be converted and click Import.
4-16 Sewer Reference
Convert Drawing Entities
Convert drawing entities to sewer database
Icon Button Toolbar Shortcut Command
SewerConvertEntities
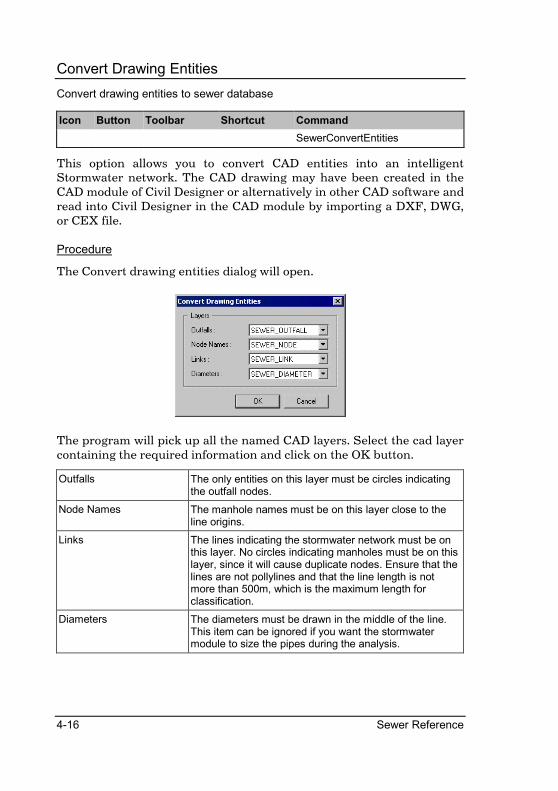
This option allows you to convert CAD entities into an intelligent Stormwater network. The CAD drawing may have been created in the CAD module of Civil Designer or alternatively in other CAD software and read into Civil Designer in the CAD module by importing a DXF, DWG, or CEX file.
Procedure
The Convert drawing entities dialog will open.
The program will pick up all the named CAD layers. Select the cad layer containing the required information and click on the OK button.
Outfalls The only entities on this layer must be circles indicating the outfall nodes.
Node Names The manhole names must be on this layer close to the line origins.
Links The lines indicating the stormwater network must be on this layer. No circles indicating manholes must be on this layer, since it will cause duplicate nodes. Ensure that the lines are not pollylines and that the line length is not more than 500m, which is the maximum length for classification.
Diameters The diameters must be drawn in the middle of the line. This item can be ignored if you want the stormwater module to size the pipes during the analysis.
File Menu 4-17
Export
The Export functions allow you to convert your sewer network into a GIS theme and to export the network to an ASCII text file.
MAP Theme
Export data to a Map theme
Icon Button Toolbar Shortcut Command
SewerExportMap
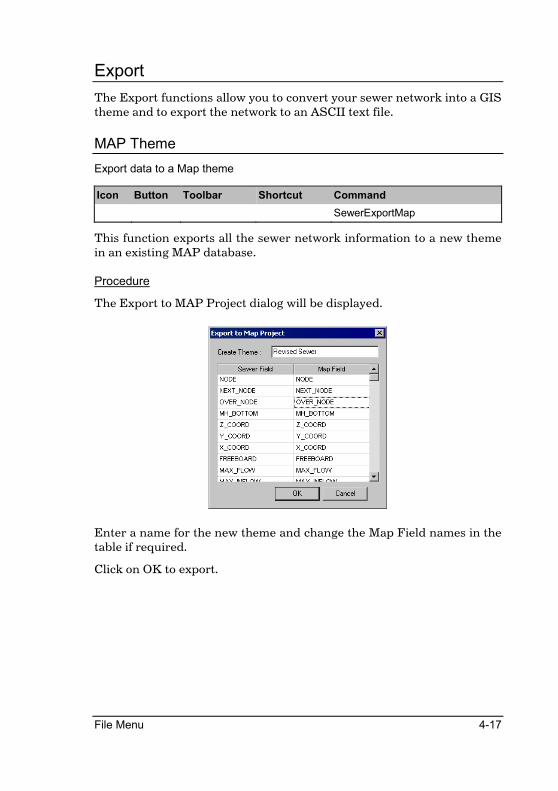
This function exports all the sewer network information to a new theme in an existing MAP database.
Procedure
The Export to MAP Project dialog will be displayed.
Enter a name for the new theme and change the Map Field names in the table if required.
Click on OK to export.
4-18 Sewer Reference
ASCII FILE
Export sewer data to an ASCII text file
Icon Button Toolbar Shortcut Command
SewerExportAscii
This function exports all the following sewer network information to an ASCII file.
Design Parameters Manhole conditions, i.e. culvert inverts or soffits common, drops, or a specified step in manholes.
Node Data The node, next node and overflow node names, branch and link numbers, Y and X coordinates, cover level, manhole bottom conditions, maximum inflow and maximum storage.
Link Data Link type, sizes, bedding, number, length, fixed inlet level and fixed slope / fixed outlet level.
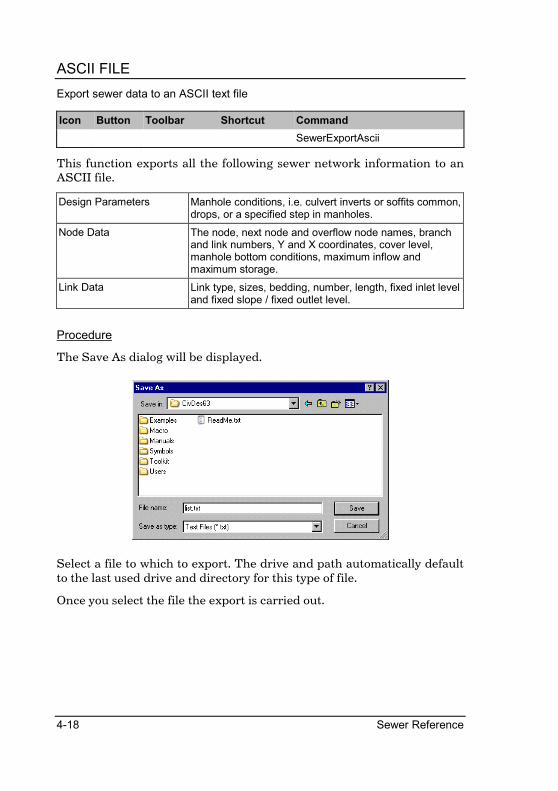
Procedure
The Save As dialog will be displayed.
Select a file to which to export. The drive and path automatically default to the last used drive and directory for this type of file.
Once you select the file the export is carried out.
File Menu 4-19
Output a selection of design parameters, input data and results to a printer or ASCII file
Icon Button Toolbar Shortcut Command
SewerPrint
This option allows you to output data to a printer or to an ASCII file. You can select which data types you want to print or export.
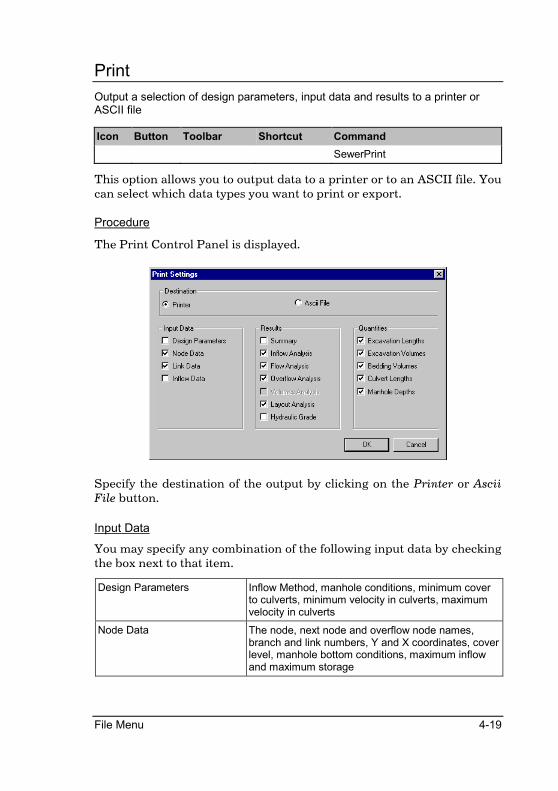
Procedure
The Print Control Panel is displayed.
Specify the destination of the output by clicking on the Printer or Ascii File button.
Input Data
You may specify any combination of the following input data by checking the box next to that item.
Design Parameters Inflow Method, manhole conditions, minimum cover to culverts, minimum velocity in culverts, maximum velocity in culverts
Node Data The node, next node and overflow node names, branch and link numbers, Y and X coordinates, cover level, manhole bottom conditions, maximum inflow and maximum storage
4-20 Sewer Reference
Link Data Link type, sizes, bedding, number, length, fixed inlet level and fixed slope/fixed outlet level
Inflow Data Depending on the inflow method
Unit Flow Inflow classes and units, plus point source inflow
Harmon Contributing units and point source inflow
Hydrograph Inflow hydrograph names and units
Results
You may specify any combination of the following results by checking the box next to that item.
Summary Active inflow method, number of nodes, outfall level and outflow
Inflow Analysis Depending on the inflow method:
Unit Flow Total point source, total inflow, contributing population, attenuation factor and design inflow
Harmon Total point source, contributing units, contributing population, average flow, peak factor and design inflow
Hydrograph Design inflow
Flow Analysis Link name, next link name, number of links, link type, calculated size, flow, capacity, velocity and percentage flow depth
Overflow Analysis Link name, next link name, inflow, point source inflow, design flow, actual flow, capacity and overflow.
Layout Analysis Link name, next link name, number of culverts, link type, calculated size, length, slope, inlet level, outlet level and cover to link.
Hydraulic Grade Link name, hydraulic grade level, cover level, soffit level, velocity and flow depth
Quantities
You may specify any combination of the following quantities by checking the box next to that item.
Excavation Lengths Length of excavation in depth increments for each culvert type and diameter for soft, medium and hard materials.
Excavation Volumes Excavation volumes in depth increments for each culvert type and diameter for soft, medium and hard materials.

File Menu 4-21
Bedding Volumes Bedding and backfill volumes for each bedding class
Culvert Lengths Cumulative lengths of each culvert type and size
Manhole Depths Number of manholes in each depth increment
Click on OK to print the data or create the output file.
4-22 Sewer Reference
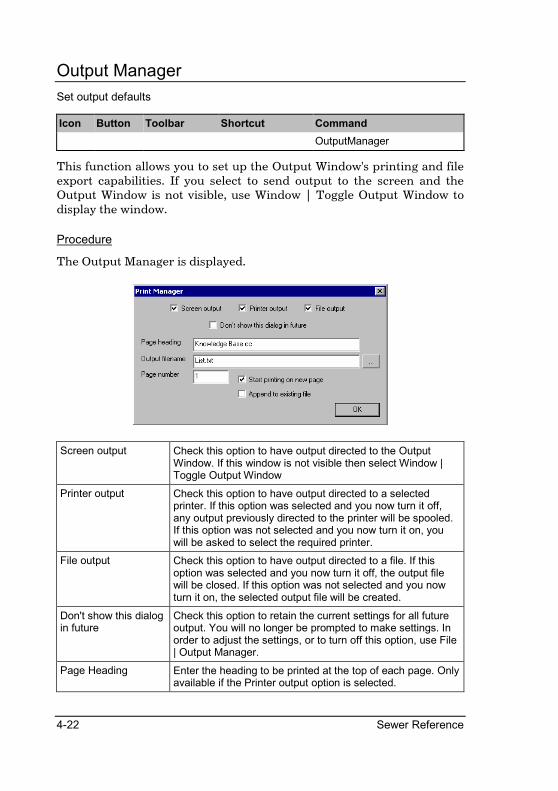
Output Manager
Set output defaults
Icon Button Toolbar Shortcut Command
OutputManager
This function allows you to set up the Output Window's printing and file export capabilities. If you select to send output to the screen and the Output Window is not visible, use Window | Toggle Output Window to display the window.
Procedure
The Output Manager is displayed.
Screen output Check this option to have output directed to the Output Window. If this window is not visible then select Window | Toggle Output Window
Printer output Check this option to have output directed to a selected printer. If this option was selected and you now turn it off, any output previously directed to the printer will be spooled. If this option was not selected and you now turn it on, you will be asked to select the required printer.
File output Check this option to have output directed to a file. If this option was selected and you now turn it off, the output file will be closed. If this option was not selected and you now turn it on, the selected output file will be created.
Don't show this dialog in future
Check this option to retain the current settings for all future output. You will no longer be prompted to make settings. In order to adjust the settings, or to turn off this option, use File | Output Manager.
Page Heading Enter the heading to be printed at the top of each page. Only available if the Printer output option is selected.
File Menu 4-23
Output filename Enter the path and name of the output file to be created. Only available if the File output option is selected.
Browse Button (...) Click this button to browse for the output file using the standard Windows Save As dialog. Only available if the File output option is selected.
Page Number Enter the page number to be printed at the top of the first page. The number will increment automatically for subsequent pages. Only available if the Printer output option is selected.
Start printing on new page
Check this option to have any printer output still in the print queue spooled before printing starts. If this option is not selected then printer output will be added to that currently in the print queue. Only available if the Printer output option is selected.
Append to existing file Check this option to have output appended to that which already exists in the selected file. If the selected file does not exist, it will be created. If this option is not selected then the selected file will be deleted (if it already exists) and then recreated. Only available if the File output option is selected.
Make the required settings and press [OK] to continue.
If [OK] is clicked and Printer output is not checked, but it was previously checked, any output that has not yet been spooled to the printer will be sent and the current document ended. If Printer output is now checked, and it was not previously checked, you will be asked to select the printer to which output should be directed and a new document will be started.
If [OK] is clicked and File output is not checked, but it was previously checked, the specified file is closed. If File output is now checked, and it was not previously checked, the specified file is opened and will overwrite an existing file of the same name if the Append to existing file option is not checked.
4-24 Sewer Reference
Spool Output
Spool unprinted data to the printer
Icon Button Toolbar Shortcut Command
OutputSpool
Any output (print) data that has been sent to the printer but not yet printed is spooled to the printer.
Windows tends to hold printed output in a spool file until the print job is complete. In order to end a print job in Civil Designer you must deselect the print option in the Output Manager, or exit the program. Alternatively, this function will carry out the same procedure.
File Menu 4-25
Option Settings
Set INI file defaults that are not set by the program
Icon Button Toolbar Shortcut Command
OptionSettings
The settings for various items in Civil Designer are stored in the file CivDes6.ini which is located in your User directory. While most settings in this file are manipulated from within the program itself, some settings have no menu option or dialog associated with them.
In order to facilitate the changing of these settings, we have implemented a dialog specifically for adjusting these settings. This saves you from having to edit the INI file and making the changes by hand.
The left side of the dialog displays a tree list of available items. Click on the top-level item to display the relevant page. Some of the top-level items have further pages implemented as sub-items. Click on the + sign to the left of any top-level item to display the sub-items. Click on a sub-item to display the relevant page.
Certain settings are only read at program startup. These items are marked with an asterisk (*). Changes to these settings will only be implemented once the program has been exited and restarted. All other settings are read at the start of relevant functions and changes to these settings will therefore be available the next time the relevant function is activated.
The possible top-level items and their respective sub-items are as follows:
• General • Southern Hemisphere • Northern Hemisphere
• Survey • Terrain
• Spreadsheets • Pens • View 3D
• Roads • Spreadsheets • Pens
• Plot • Output Window
4-26 Sewer Reference
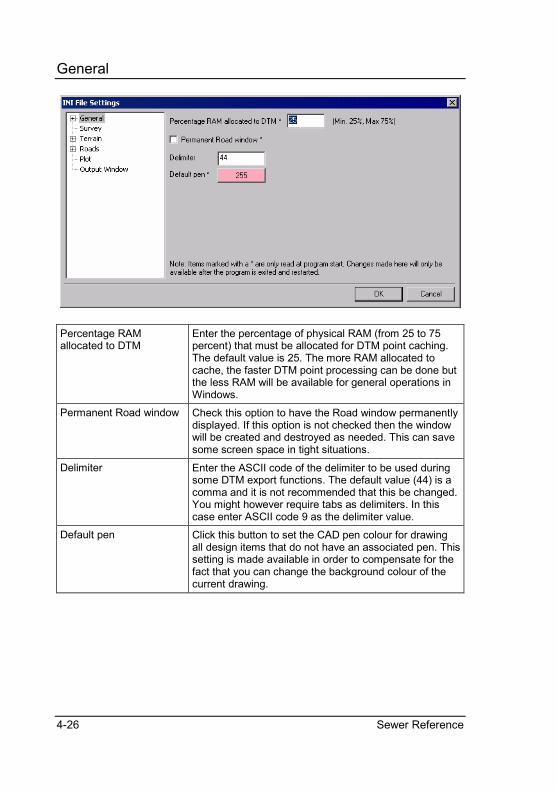
General
Percentage RAM allocated to DTM
Enter the percentage of physical RAM (from 25 to 75 percent) that must be allocated for DTM point caching. The default value is 25. The more RAM allocated to cache, the faster DTM point processing can be done but the less RAM will be available for general operations in Windows.
Permanent Road window Check this option to have the Road window permanently displayed. If this option is not checked then the window will be created and destroyed as needed. This can save some screen space in tight situations.
Delimiter Enter the ASCII code of the delimiter to be used during some DTM export functions. The default value (44) is a comma and it is not recommended that this be changed. You might however require tabs as delimiters. In this case enter ASCII code 9 as the delimiter value.
Default pen Click this button to set the CAD pen colour for drawing all design items that do not have an associated pen. This setting is made available in order to compensate for the fact that you can change the background colour of the current drawing.
File Menu 4-27
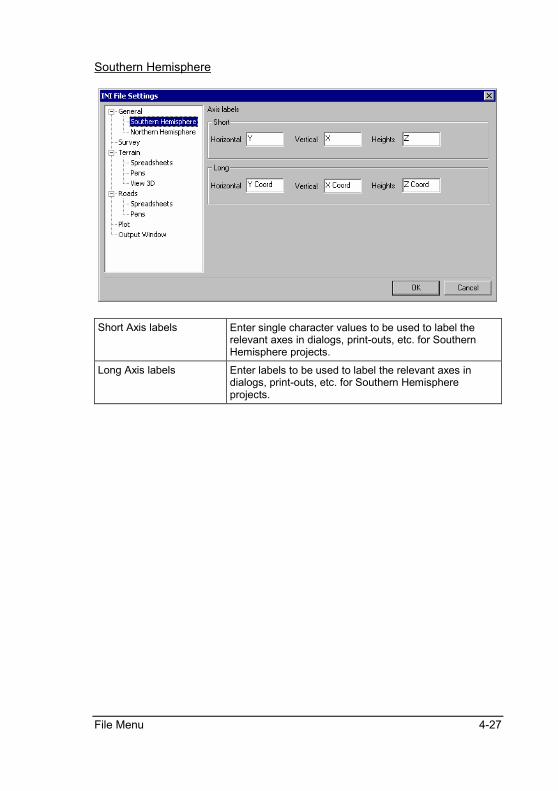
Southern Hemisphere
Short Axis labels Enter single character values to be used to label the relevant axes in dialogs, print-outs, etc. for Southern Hemisphere projects.
Long Axis labels Enter labels to be used to label the relevant axes in dialogs, print-outs, etc. for Southern Hemisphere projects.
4-28 Sewer Reference
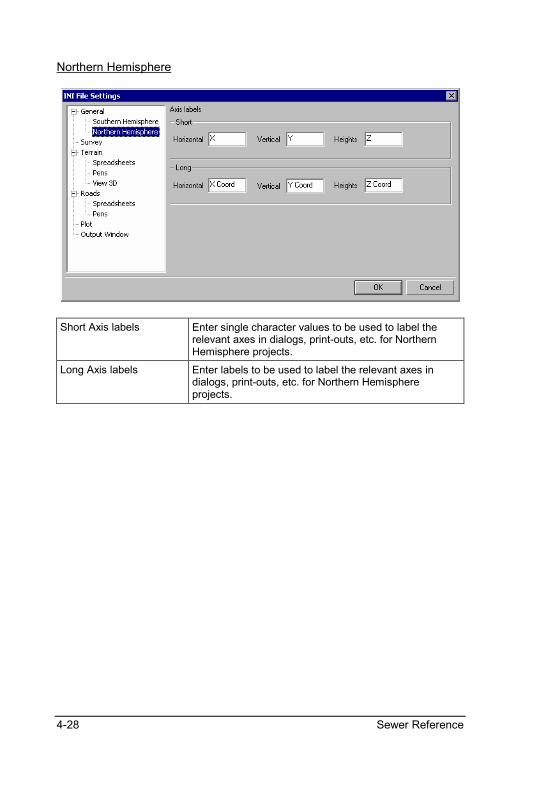
Northern Hemisphere
Short Axis labels Enter single character values to be used to label the relevant axes in dialogs, print-outs, etc. for Northern Hemisphere projects.
Long Axis labels Enter labels to be used to label the relevant axes in dialogs, print-outs, etc. for Northern Hemisphere projects.
File Menu 4-29
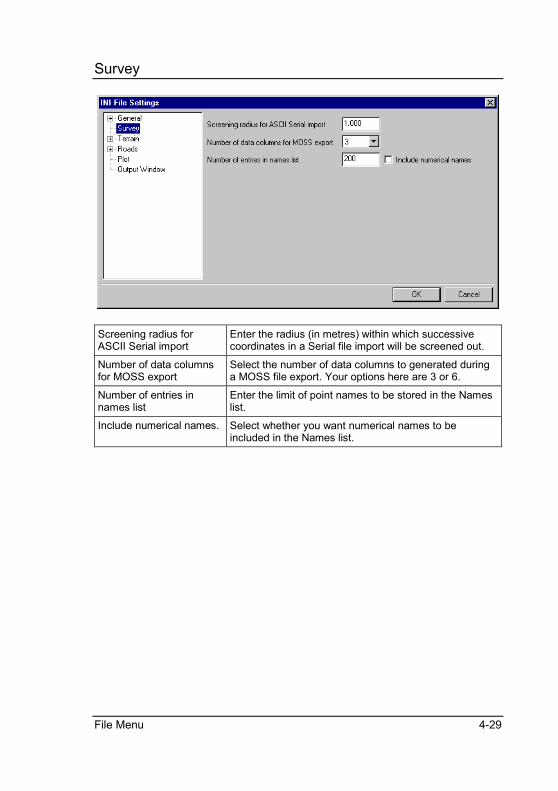
Survey
Screening radius for ASCII Serial import
Enter the radius (in metres) within which successive coordinates in a Serial file import will be screened out.
Number of data columns for MOSS export
Select the number of data columns to generated during a MOSS file export. Your options here are 3 or 6.
Number of entries in names list
Enter the limit of point names to be stored in the Names list.
Include numerical names. Select whether you want numerical names to be included in the Names list.
4-30 Sewer Reference
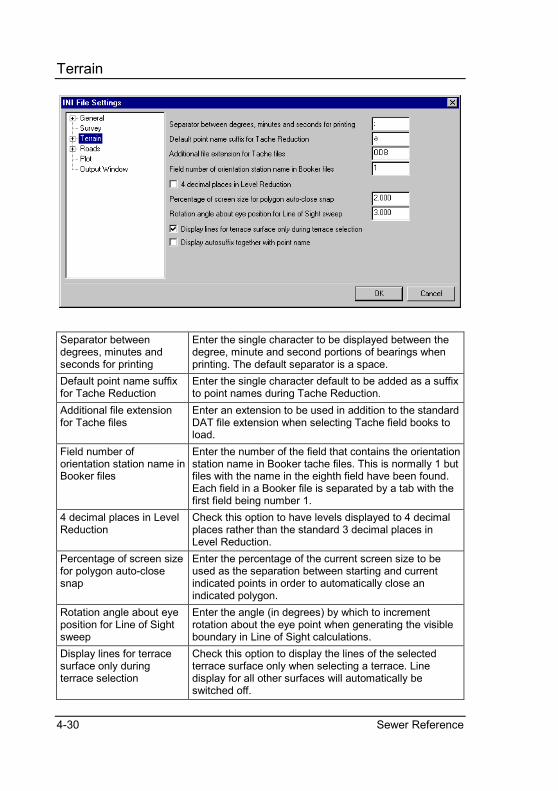
Terrain
Separator between degrees, minutes and seconds for printing
Enter the single character to be displayed between the degree, minute and second portions of bearings when printing. The default separator is a space.
Default point name suffix for Tache Reduction
Enter the single character default to be added as a suffix to point names during Tache Reduction.
Additional file extension for Tache files
Enter an extension to be used in addition to the standard DAT file extension when selecting Tache field books to load.
Field number of orientation station name in Booker files
Enter the number of the field that contains the orientation station name in Booker tache files. This is normally 1 but files with the name in the eighth field have been found. Each field in a Booker file is separated by a tab with the first field being number 1.
4 decimal places in Level Reduction
Check this option to have levels displayed to 4 decimal places rather than the standard 3 decimal places in Level Reduction.
Percentage of screen size for polygon auto-close snap
Enter the percentage of the current screen size to be used as the separation between starting and current indicated points in order to automatically close an indicated polygon.
Rotation angle about eye position for Line of Sight sweep
Enter the angle (in degrees) by which to increment rotation about the eye point when generating the visible boundary in Line of Sight calculations.
Display lines for terrace surface only during terrace selection
Check this option to display the lines of the selected terrace surface only when selecting a terrace. Line display for all other surfaces will automatically be switched off.
File Menu 4-31
Display autosuffix together with point name
Check this option to have any defined autosuffix appear as part of the point name in the screen display. It will not appear on a plot generation.
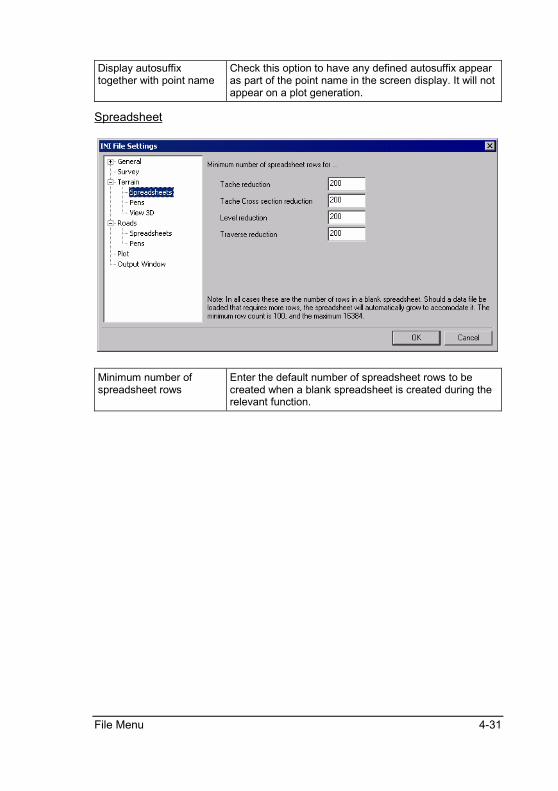
Spreadsheet
Minimum number of spreadsheet rows
Enter the default number of spreadsheet rows to be created when a blank spreadsheet is created during the relevant function.
4-32 Sewer Reference
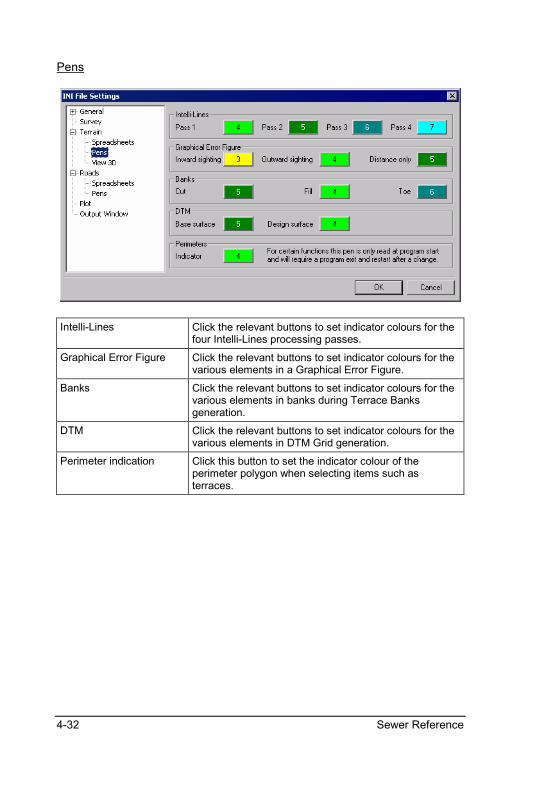
Pens
Intelli-Lines Click the relevant buttons to set indicator colours for the four Intelli-Lines processing passes.
Graphical Error Figure Click the relevant buttons to set indicator colours for the various elements in a Graphical Error Figure.
Banks Click the relevant buttons to set indicator colours for the various elements in banks during Terrace Banks generation.
DTM Click the relevant buttons to set indicator colours for the various elements in DTM Grid generation.
Perimeter indication Click this button to set the indicator colour of the perimeter polygon when selecting items such as terraces.
File Menu 4-33
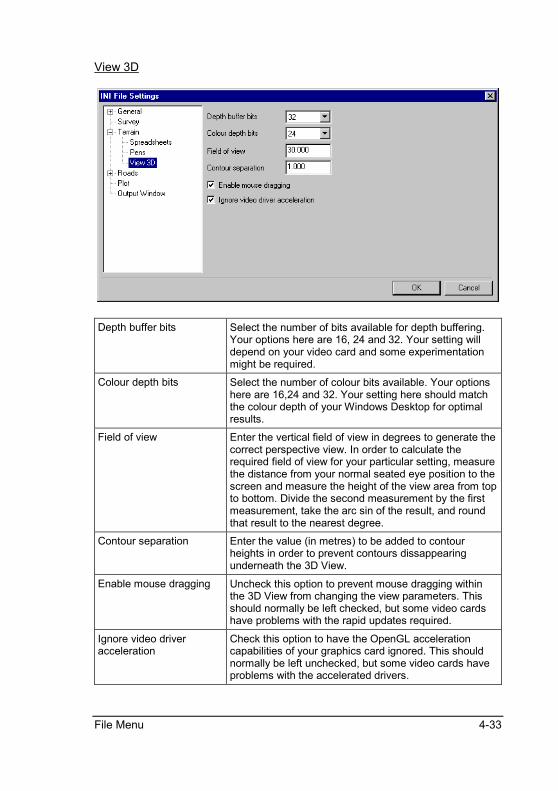
View 3D
Depth buffer bits Select the number of bits available for depth buffering. Your options here are 16, 24 and 32. Your setting will depend on your video card and some experimentation might be required.
Colour depth bits Select the number of colour bits available. Your options here are 16,24 and 32. Your setting here should match the colour depth of your Windows Desktop for optimal results.
Field of view Enter the vertical field of view in degrees to generate the correct perspective view. In order to calculate the required field of view for your particular setting, measure the distance from your normal seated eye position to the screen and measure the height of the view area from top to bottom. Divide the second measurement by the first measurement, take the arc sin of the result, and round that result to the nearest degree.
Contour separation Enter the value (in metres) to be added to contour heights in order to prevent contours dissappearing underneath the 3D View.
Enable mouse dragging Uncheck this option to prevent mouse dragging within the 3D View from changing the view parameters. This should normally be left checked, but some video cards have problems with the rapid updates required.
Ignore video driver acceleration
Check this option to have the OpenGL acceleration capabilities of your graphics card ignored. This should normally be left unchecked, but some video cards have problems with the accelerated drivers.
4-34 Sewer Reference
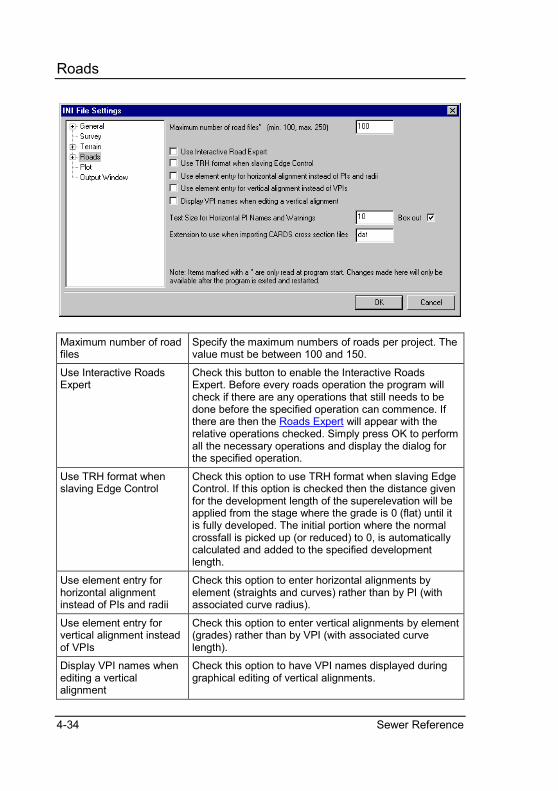
Roads
Maximum number of road files
Specify the maximum numbers of roads per project. The value must be between 100 and 150.
Use Interactive Roads Expert
Check this button to enable the Interactive Roads Expert. Before every roads operation the program will check if there are any operations that still needs to be done before the specified operation can commence. If there are then the Roads Expert will appear with the relative operations checked. Simply press OK to perform all the necessary operations and display the dialog for the specified operation.
Use TRH format when slaving Edge Control
Check this option to use TRH format when slaving Edge Control. If this option is checked then the distance given for the development length of the superelevation will be applied from the stage where the grade is 0 (flat) until it is fully developed. The initial portion where the normal crossfall is picked up (or reduced) to 0, is automatically calculated and added to the specified development length.
Use element entry for horizontal alignment instead of PIs and radii
Check this option to enter horizontal alignments by element (straights and curves) rather than by PI (with associated curve radius).
Use element entry for vertical alignment instead of VPIs
Check this option to enter vertical alignments by element (grades) rather than by VPI (with associated curve length).
Display VPI names when editing a vertical alignment
Check this option to have VPI names displayed during graphical editing of vertical alignments.
File Menu 4-35
Text size for Horizontal PI Names and Warnings
When Editing the Horizontal alignment, the PI names and Design Criteria warnings will be displayed using this text size (points). A text size of 0 will cause the PI names and warnings not to be displayed.
PI Names and Warnings Warnings will be displayed using this text size (points). A text size of 0 will cause the PI names and warnings not to be displayed.
Box out Check this option to box the Horizontal PI names and warnings. The text will be drawn within a rectangular frame, filled with the background colour.
Extension to use when importing CARDS cross section files
Enter the default extension to be used when selecting data files for CARDS cross section import.
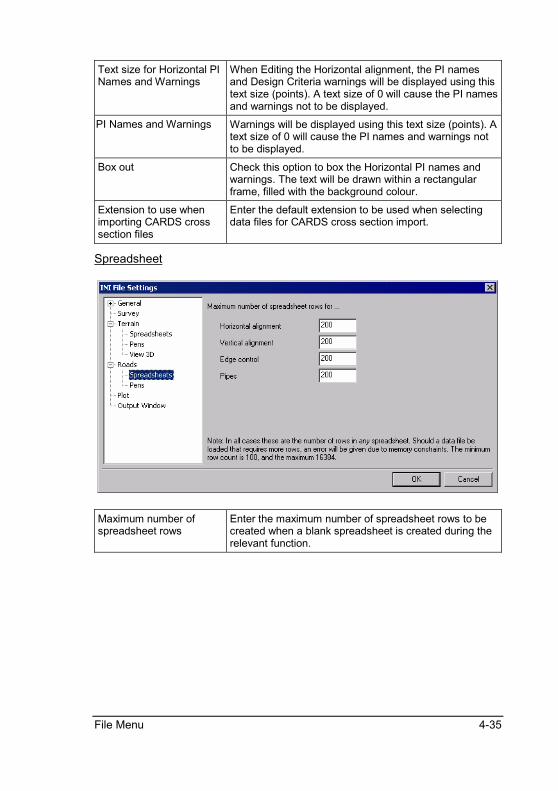
Spreadsheet
Maximum number of spreadsheet rows
Enter the maximum number of spreadsheet rows to be created when a blank spreadsheet is created during the relevant function.
4-36 Sewer Reference
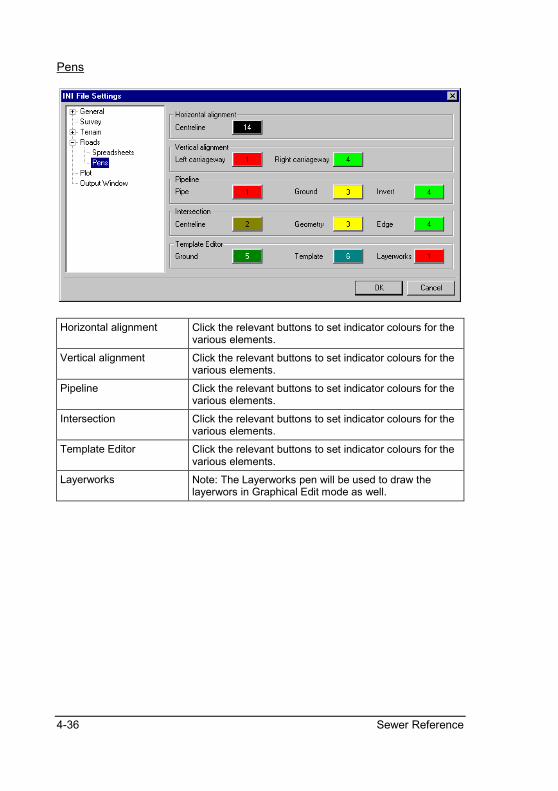
Pens
Horizontal alignment Click the relevant buttons to set indicator colours for the various elements.
Vertical alignment Click the relevant buttons to set indicator colours for the various elements.
Pipeline Click the relevant buttons to set indicator colours for the various elements.
Intersection Click the relevant buttons to set indicator colours for the various elements.
Template Editor Click the relevant buttons to set indicator colours for the various elements.
Layerworks Note: The Layerworks pen will be used to draw the layerwors in Graphical Edit mode as well.
File Menu 4-37
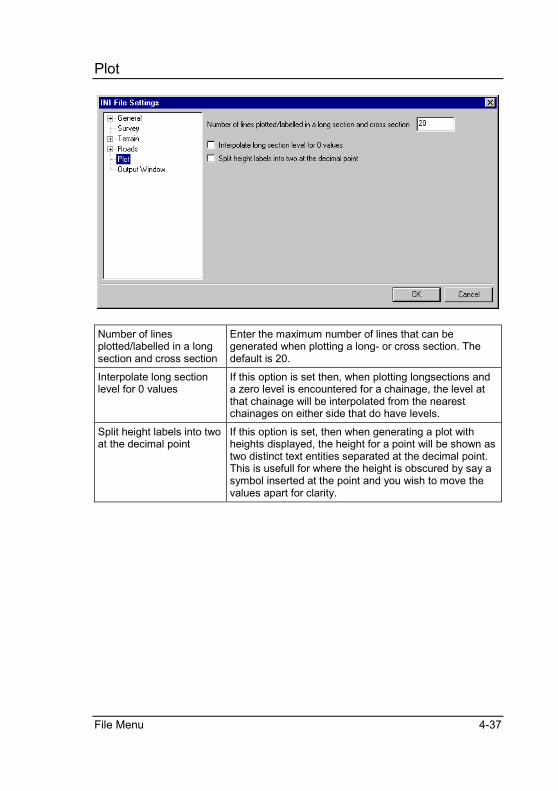
Plot
Number of lines plotted/labelled in a long section and cross section
Enter the maximum number of lines that can be generated when plotting a long- or cross section. The default is 20.
Interpolate long section level for 0 values
If this option is set then, when plotting longsections and a zero level is encountered for a chainage, the level at that chainage will be interpolated from the nearest chainages on either side that do have levels.
Split height labels into two at the decimal point
If this option is set, then when generating a plot with heights displayed, the height for a point will be shown as two distinct text entities separated at the decimal point. This is usefull for where the height is obscured by say a symbol inserted at the point and you wish to move the values apart for clarity.
4-38 Sewer Reference
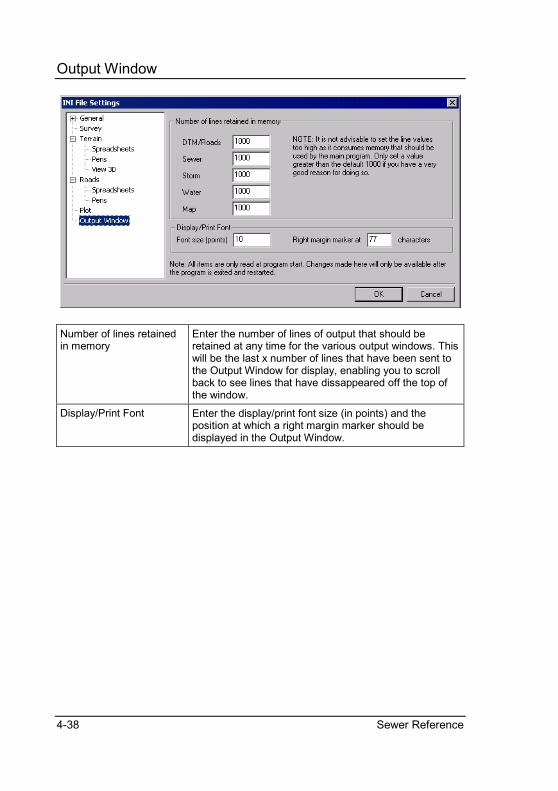
Output Window
Number of lines retained in memory
Enter the number of lines of output that should be retained at any time for the various output windows. This will be the last x number of lines that have been sent to the Output Window for display, enabling you to scroll back to see lines that have dissappeared off the top of the window.
Display/Print Font Enter the display/print font size (in points) and the position at which a right margin marker should be displayed in the Output Window.
File Menu 4-39
Security
When you first install your copy of Civil Designer, it will allocate a 30-day trial license, allowing you to run the full program for 30 days. During this time you must contact Knowledge Base for a permanent authorization code. Refer to the chapter on Security for more details.
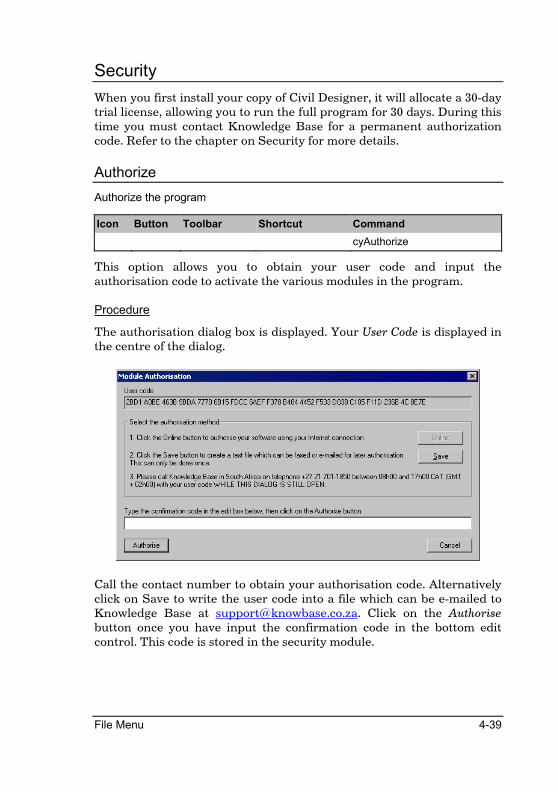
Authorize
Authorize the program
Icon Button Toolbar Shortcut Command
cyAuthorize
This option allows you to obtain your user code and input the authorisation code to activate the various modules in the program.
Procedure
The authorisation dialog box is displayed. Your User Code is displayed in the centre of the dialog.
Call the contact number to obtain your authorisation code. Alternatively click on Save to write the user code into a file which can be e-mailed to Knowledge Base at [email protected]. Click on the Authorise button once you have input the confirmation code in the bottom edit control. This code is stored in the security module.
4-40 Sewer Reference
Check Network Dongles
Toggle network security on/off
Icon Button Toolbar Shortcut Command
CheckNetworkSecurity
This function switches the search for a network security module on or off.
Exit
Quit Civil Designer
Icon Button Toolbar Shortcut Command
quit
This function closes down Civil Designer.
Edit Menu 5-1
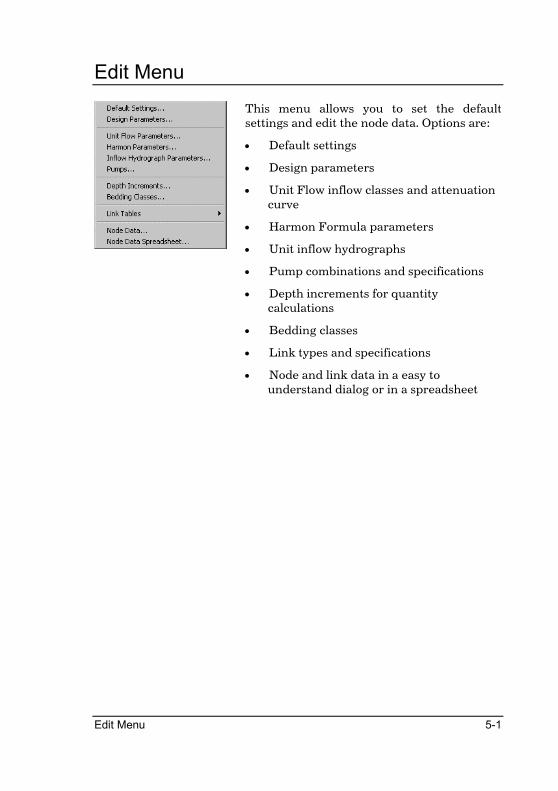
Edit Menu
This menu allows you to set the default settings and edit the node data. Options are:
• Default settings
• Design parameters
• Unit Flow inflow classes and attenuation curve
• Harmon Formula parameters
• Unit inflow hydrographs
• Pump combinations and specifications
• Depth increments for quantity calculations
• Bedding classes
• Link types and specifications
• Node and link data in a easy to understand dialog or in a spreadsheet
5-2 Sewer Reference
Default Settings
Set node and link parameters
Icon Button Toolbar Shortcut Command
SewerEditDefaults
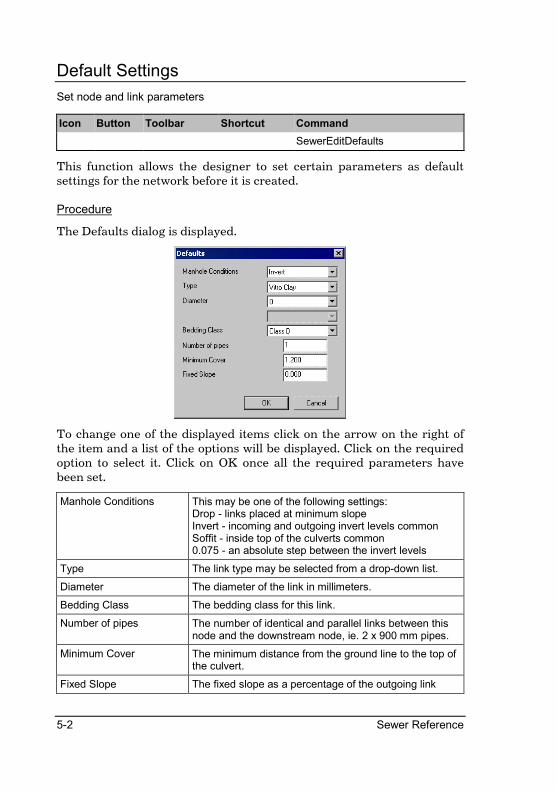
This function allows the designer to set certain parameters as default settings for the network before it is created.
Procedure
The Defaults dialog is displayed.
To change one of the displayed items click on the arrow on the right of the item and a list of the options will be displayed. Click on the required option to select it. Click on OK once all the required parameters have been set.
Manhole Conditions This may be one of the following settings: Drop - links placed at minimum slope Invert - incoming and outgoing invert levels common Soffit - inside top of the culverts common 0.075 - an absolute step between the invert levels
Type The link type may be selected from a drop-down list.
Diameter The diameter of the link in millimeters.
Bedding Class The bedding class for this link.
Number of pipes The number of identical and parallel links between this node and the downstream node, ie. 2 x 900 mm pipes.
Minimum Cover The minimum distance from the ground line to the top of the culvert.
Fixed Slope The fixed slope as a percentage of the outgoing link
Edit Menu 5-3
Design Parameters
Set the inflow method, minimum and maximum velocity, etc
Icon Button Toolbar Shortcut Command
SewerEditDesignParameters
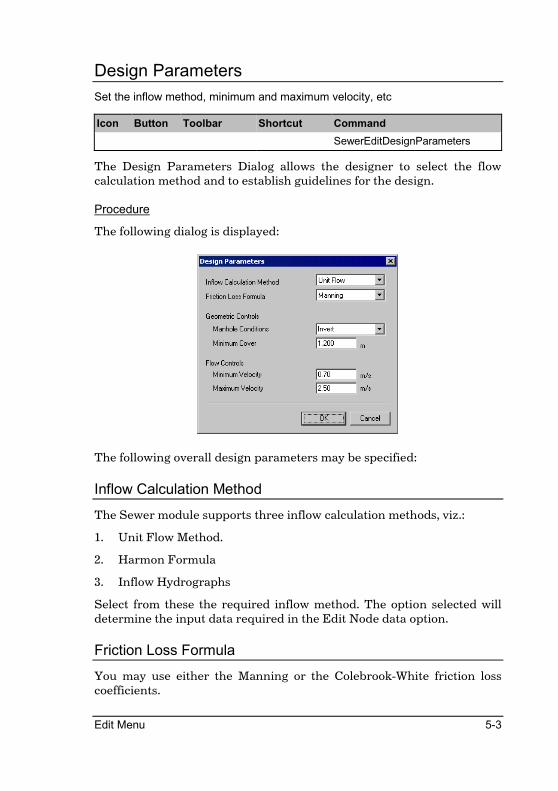
The Design Parameters Dialog allows the designer to select the flow calculation method and to establish guidelines for the design.
Procedure
The following dialog is displayed:
The following overall design parameters may be specified:
Inflow Calculation Method
The Sewer module supports three inflow calculation methods, viz.:
1. Unit Flow Method.
2. Harmon Formula
3. Inflow Hydrographs
Select from these the required inflow method. The option selected will determine the input data required in the Edit Node data option.
Friction Loss Formula
You may use either the Manning or the Colebrook-White friction loss coefficients.
5-4 Sewer Reference
Geometric Controls
The geometric controls affect the placing of links relative to the natural ground line and the calculation of node inverts.
Manhole Conditions
Specify whether incoming and outgoing culverts in the manhole should have their inverts at a common level (Inverts) or soffits at a common level (Soffits), be placed at the minimum depth possible given the other design parameters (Drops), or be placed with a user-defined step through the manhole. An entry of 0.075 will specify a step of 75 mm through each node.
Minimum Cover
This is the minimum distance from the manhole cover level to the top of the culvert.
Flow Controls
The flow controls set the hydraulic design parameters used in the calculation of link slopes and sizes.
Minimum Velocity
Culverts will be placed at a slope with the objective to try and maintain the minimum flow velocity specified here or the maximum slope specified in the Link Tables, whichever is the least.
In practice this results in the first (upstream) culverts being placed at the maximum link slope, typically 1 to 1.5%, and as the link flows become significant down the line the link slopes start flattening to the minimum slope specified in the Link Table.
Maximum Velocity
This setting will result in all links where the velocity exceeds the specified value being flagged in the results with the “**” symbol.
Edit Menu 5-5
Unit Flow Parameters
Set the inflow classes and attenuation curve for the Unit Flow method
Icon Button Toolbar Shortcut Command
SewerEditUnitFlowParameters
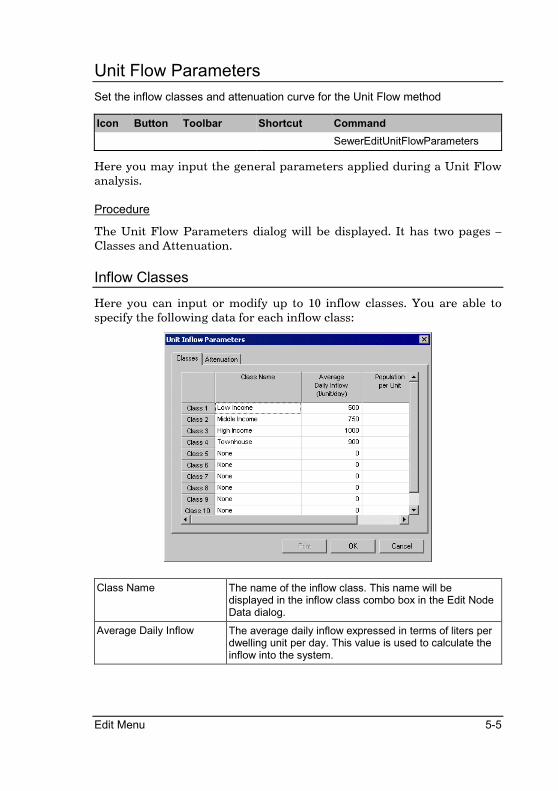
Here you may input the general parameters applied during a Unit Flow analysis.
Procedure
The Unit Flow Parameters dialog will be displayed. It has two pages – Classes and Attenuation.
Inflow Classes
Here you can input or modify up to 10 inflow classes. You are able to specify the following data for each inflow class:
Class Name The name of the inflow class. This name will be displayed in the inflow class combo box in the Edit Node Data dialog.
Average Daily Inflow The average daily inflow expressed in terms of liters per dwelling unit per day. This value is used to calculate the inflow into the system.
5-6 Sewer Reference
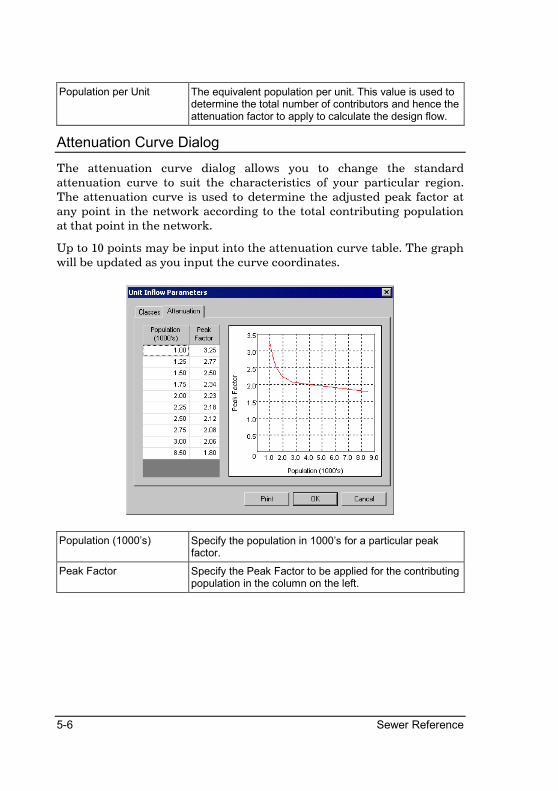
Population per Unit The equivalent population per unit. This value is used to determine the total number of contributors and hence the attenuation factor to apply to calculate the design flow.
Attenuation Curve Dialog
The attenuation curve dialog allows you to change the standard attenuation curve to suit the characteristics of your particular region. The attenuation curve is used to determine the adjusted peak factor at any point in the network according to the total contributing population at that point in the network.
Up to 10 points may be input into the attenuation curve table. The graph will be updated as you input the curve coordinates.
Population (1000’s) Specify the population in 1000’s for a particular peak factor.
Peak Factor Specify the Peak Factor to be applied for the contributing population in the column on the left.
Edit Menu 5-7
Harmon Parameters
Set the average daily inflow and equivalent population for the Harmon formula
Icon Button Toolbar Shortcut Command
SewerEditHarmonParameters
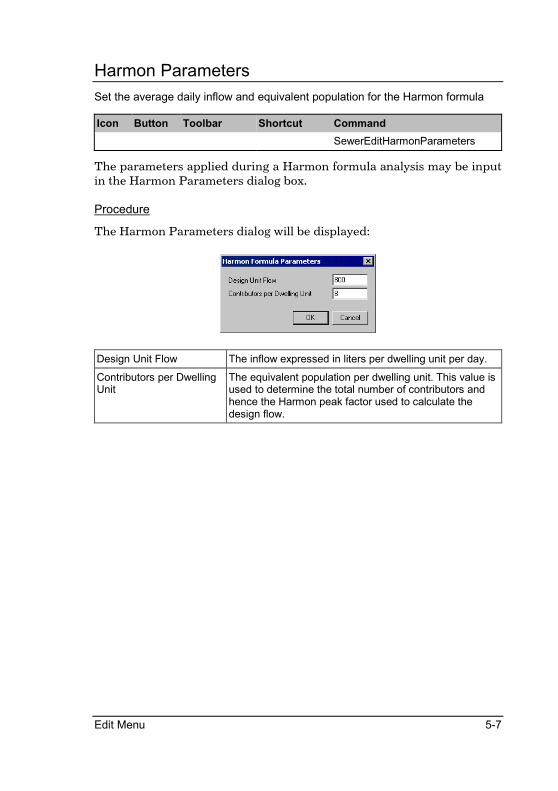
The parameters applied during a Harmon formula analysis may be input in the Harmon Parameters dialog box.
Procedure
The Harmon Parameters dialog will be displayed:
Design Unit Flow The inflow expressed in liters per dwelling unit per day.
Contributors per Dwelling Unit
The equivalent population per dwelling unit. This value is used to determine the total number of contributors and hence the Harmon peak factor used to calculate the design flow.
5-8 Sewer Reference
Inflow Hydrograph Parameters
Create and edit the inflow hydrographs
Icon Button Toolbar Shortcut Command
SewerEditInflowHydrograph
The Inflow Hydrograph method uses unit inflow hydrographs to determine the flow in the network over a period of time. The inflow hydrographs may be input with any time increment.
Procedure
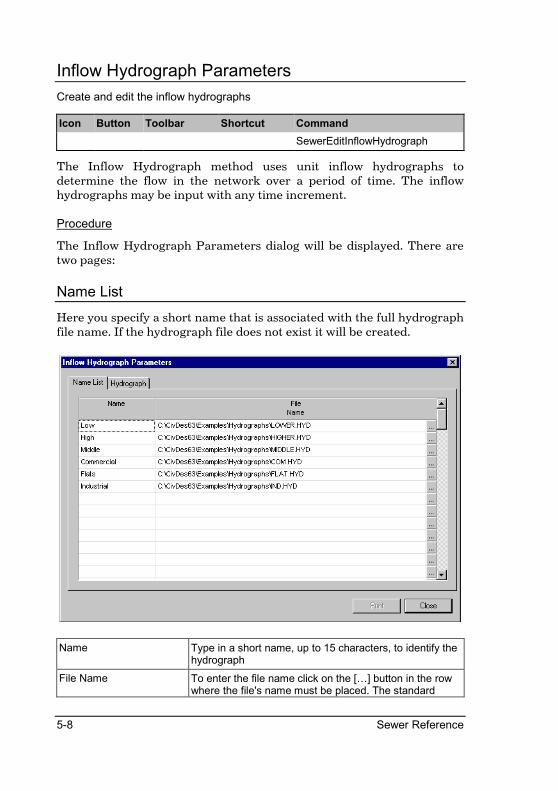
The Inflow Hydrograph Parameters dialog will be displayed. There are two pages:
Name List
Here you specify a short name that is associated with the full hydrograph file name. If the hydrograph file does not exist it will be created.
Name Type in a short name, up to 15 characters, to identify the hydrograph
File Name To enter the file name click on the […] button in the row where the file's name must be placed. The standard
Edit Menu 5-9
Windows Open dialog is displayed. Select the file you want or type in a new file name and click on OK.
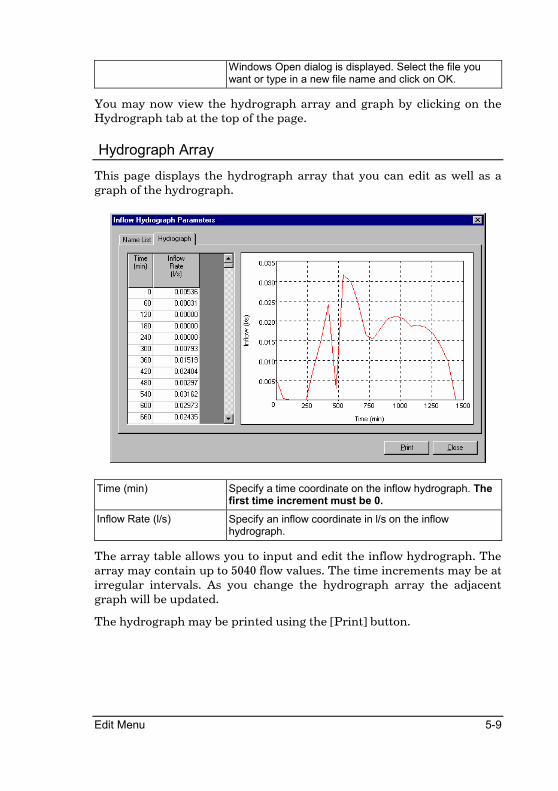
You may now view the hydrograph array and graph by clicking on the Hydrograph tab at the top of the page.
Hydrograph Array
This page displays the hydrograph array that you can edit as well as a graph of the hydrograph.
Time (min) Specify a time coordinate on the inflow hydrograph. The first time increment must be 0.
Inflow Rate (l/s) Specify an inflow coordinate in l/s on the inflow hydrograph.
The array table allows you to input and edit the inflow hydrograph. The array may contain up to 5040 flow values. The time increments may be at irregular intervals. As you change the hydrograph array the adjacent graph will be updated.
The hydrograph may be printed using the [Print] button.
5-10 Sewer Reference
Pumps
Create and edit pump data
Icon Button Toolbar Shortcut Command
SewerEditPumps
This dialog allows you to create and edit pump files, i.e. profiles that define the pump station hydraulic characteristics.
How it works
The inlet and outlet levels are calculated based on the incoming and next node levels. It is possible, but not necessary, to fix these levels. All sump dimensions (i.e. sump depth, overflow depth, on and off levels) are then set in relation to inlet level.
For each step of the analysis the water depth in the sump is obtained using the previous water depth, inflow, outflow and sump depth to volume curve. Water depth is used to automatically switch the pumps on or off, depending on the user settings.
The pumping head is than calculated as a difference between outlet level and water level in the sump (static head), and increased by friction losses. The resulting flow is then calculated for each pump and pump station as total.
After that the outflow hydrograph is passed on to the next node.
The capacity is calculated as the maximum flow with all the pumps running on minimum head i.e. with the maximum water level in the sump.
The following restrictions apply:
• If next node of the pump is the system outfall the invert level at the outfall must be fixed.
• Each node must use a unique pump file. If you use the same pump file on more than one node the results will be incorrect.
Edit Menu 5-11
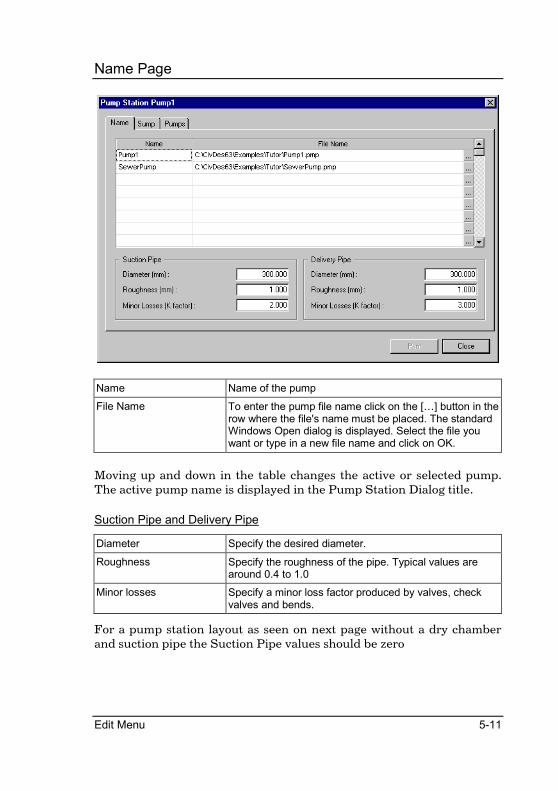
Name Page
Name Name of the pump
File Name To enter the pump file name click on the […] button in the row where the file's name must be placed. The standard Windows Open dialog is displayed. Select the file you want or type in a new file name and click on OK.
Moving up and down in the table changes the active or selected pump. The active pump name is displayed in the Pump Station Dialog title.
Suction Pipe and Delivery Pipe
Diameter Specify the desired diameter.
Roughness Specify the roughness of the pipe. Typical values are around 0.4 to 1.0
Minor losses Specify a minor loss factor produced by valves, check valves and bends.
For a pump station layout as seen on next page without a dry chamber and suction pipe the Suction Pipe values should be zero
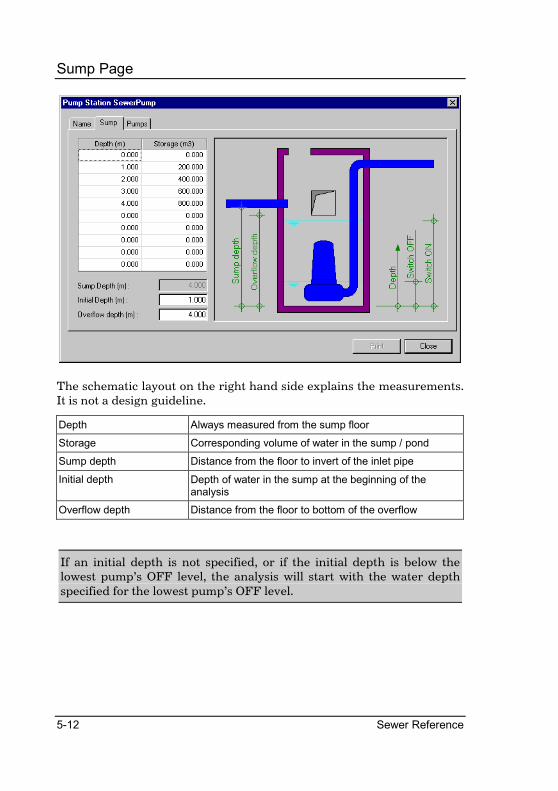
5-12 Sewer Reference
Sump Page
The schematic layout on the right hand side explains the measurements. It is not a design guideline.
Depth Always measured from the sump floor
Storage Corresponding volume of water in the sump / pond
Sump depth Distance from the floor to invert of the inlet pipe
Initial depth Depth of water in the sump at the beginning of the analysis
Overflow depth Distance from the floor to bottom of the overflow
If an initial depth is not specified, or if the initial depth is below the lowest pump’s OFF level, the analysis will start with the water depth specified for the lowest pump’s OFF level.
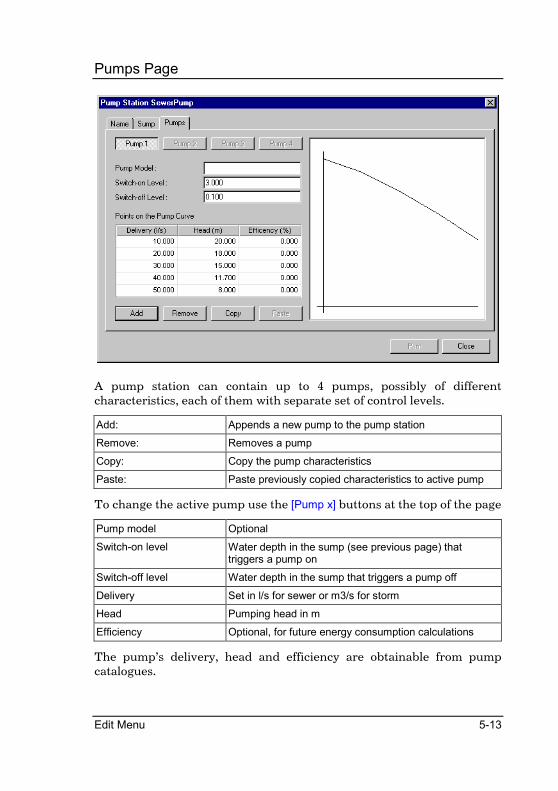
Edit Menu 5-13
Pumps Page
A pump station can contain up to 4 pumps, possibly of different characteristics, each of them with separate set of control levels.
Add: Appends a new pump to the pump station
Remove: Removes a pump
Copy: Copy the pump characteristics
Paste: Paste previously copied characteristics to active pump
To change the active pump use the [Pump x] buttons at the top of the page
Pump model Optional
Switch-on level Water depth in the sump (see previous page) that triggers a pump on
Switch-off level Water depth in the sump that triggers a pump off
Delivery Set in l/s for sewer or m3/s for storm
Head Pumping head in m
Efficiency Optional, for future energy consumption calculations
The pump’s delivery, head and efficiency are obtainable from pump catalogues.
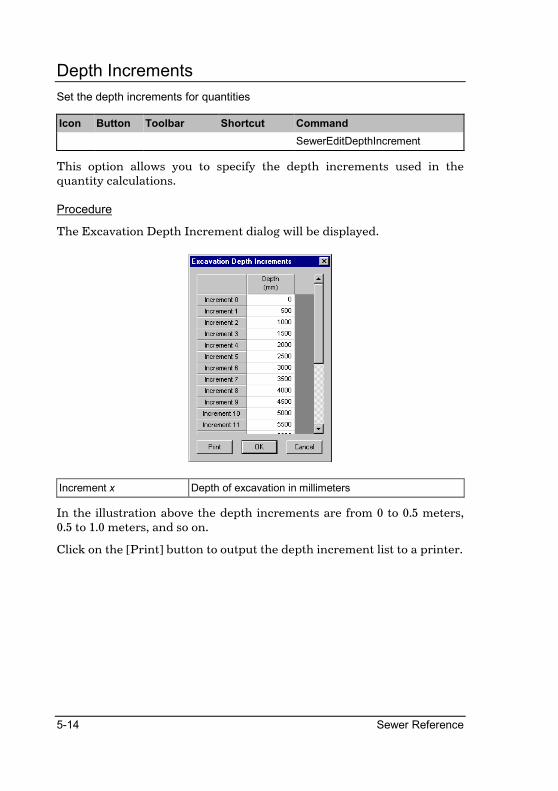
5-14 Sewer Reference
Depth Increments
Set the depth increments for quantities
Icon Button Toolbar Shortcut Command
SewerEditDepthIncrement
This option allows you to specify the depth increments used in the quantity calculations.
Procedure
The Excavation Depth Increment dialog will be displayed.
Increment x Depth of excavation in millimeters
In the illustration above the depth increments are from 0 to 0.5 meters, 0.5 to 1.0 meters, and so on.
Click on the [Print] button to output the depth increment list to a printer.
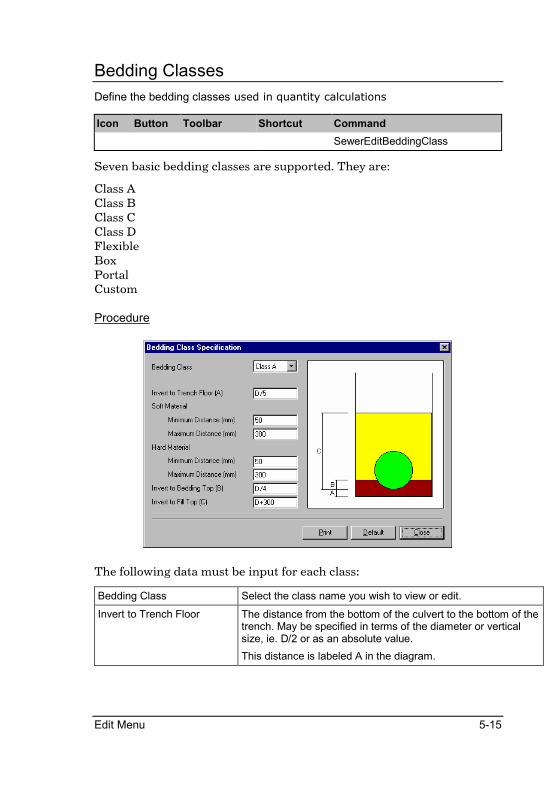
Edit Menu 5-15
Bedding Classes
Define the bedding classes used in quantity calculations
Icon Button Toolbar Shortcut Command
SewerEditBeddingClass
Seven basic bedding classes are supported. They are:
Class A Class B Class C Class D Flexible Box Portal Custom
Procedure
The following data must be input for each class:
Bedding Class Select the class name you wish to view or edit.
Invert to Trench Floor The distance from the bottom of the culvert to the bottom of the trench. May be specified in terms of the diameter or vertical size, ie. D/2 or as an absolute value.
This distance is labeled A in the diagram.
5-16 Sewer Reference
The minimum and maximum distances may be set for soft and hard materials as described below.
Soft Material
Minimum Distance The minimum distance between the bottom of the culvert and the bottom of the trench in soft material. This must be an absolute value.
Maximum Distance The maximum distance between the bottom of the culvert and the bottom of the trench in soft material. This must be an absolute value.
Hard Material
Minimum Distance The minimum distance between the bottom of the culvert and the bottom of the trench in hard material. This must be an absolute value.
Maximum Distance The maximum distance between the bottom of the culvert and the bottom of the trench in hard material. This must be an absolute value.
Thereafter the following parameters may be specified:
Invert to Bedding Top The distance from the bottom of the culvert to the top of the bedding specified in terms of the vertical size, ie. D+300, or as an absolute.
This distance is labeled as B in the diagram.
Invert to Fill Top
The distance from the bottom of the culvert to the top of the selected backfill specified in terms of the vertical size, ie. D+300, or as an absolute.
This distance must be greater than or equal to the invert to bedding top or 0.
This distance is labeled as C in the diagram.
The bedding diagram will be updated as you change any of the main data items. The [Default] button will reset the bedding parameters to the SABS 1200 specification.
Edit Menu 5-17
Link Tables
Icon Button Toolbar Shortcut Command
The Link Tables allow the designer to define up to 15 different link types or culverts between nodes. These links may be circular (pipes), rectangular (box culverts), portal/skew haunch, or custom link types.
Custom link types allow you to input the depth to proportional flow and depth to proportional area curves, thus enabling the use of non-standard culvert shapes such as egg-shaped pipes, portal culverts or even parabolic channels.
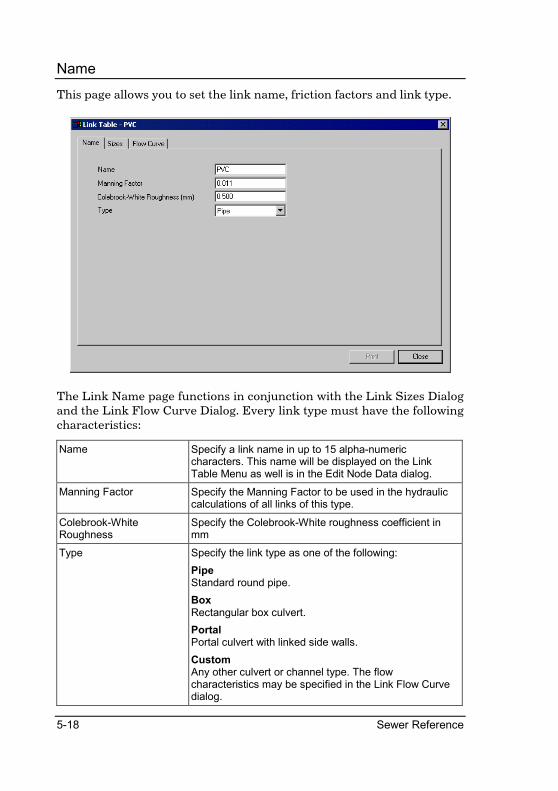
5-18 Sewer Reference
Name
This page allows you to set the link name, friction factors and link type.
The Link Name page functions in conjunction with the Link Sizes Dialog and the Link Flow Curve Dialog. Every link type must have the following characteristics:
Name Specify a link name in up to 15 alpha-numeric characters. This name will be displayed on the Link Table Menu as well is in the Edit Node Data dialog.
Manning Factor Specify the Manning Factor to be used in the hydraulic calculations of all links of this type.
Colebrook-White Roughness
Specify the Colebrook-White roughness coefficient in mm
Type Specify the link type as one of the following:
Pipe Standard round pipe.
Box Rectangular box culvert.
Portal Portal culvert with linked side walls.
Custom Any other culvert or channel type. The flow characteristics may be specified in the Link Flow Curve dialog.
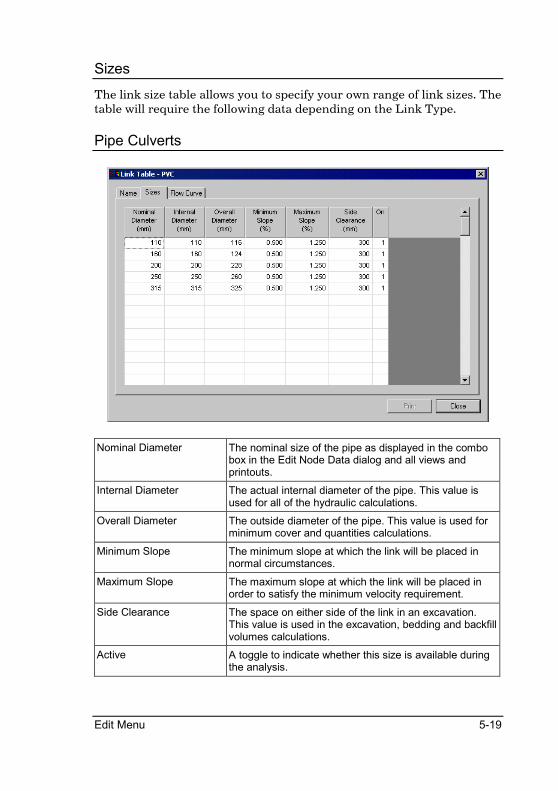
Edit Menu 5-19
Sizes
The link size table allows you to specify your own range of link sizes. The table will require the following data depending on the Link Type.
Pipe Culverts
Nominal Diameter The nominal size of the pipe as displayed in the combo box in the Edit Node Data dialog and all views and printouts.
Internal Diameter The actual internal diameter of the pipe. This value is used for all of the hydraulic calculations.
Overall Diameter The outside diameter of the pipe. This value is used for minimum cover and quantities calculations.
Minimum Slope The minimum slope at which the link will be placed in normal circumstances.
Maximum Slope The maximum slope at which the link will be placed in order to satisfy the minimum velocity requirement.
Side Clearance The space on either side of the link in an excavation. This value is used in the excavation, bedding and backfill volumes calculations.
Active A toggle to indicate whether this size is available during the analysis.
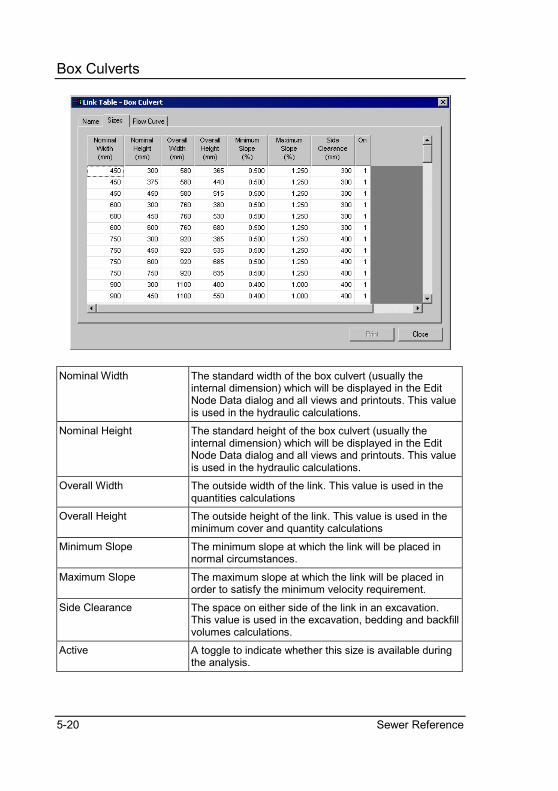
5-20 Sewer Reference
Box Culverts
Nominal Width The standard width of the box culvert (usually the internal dimension) which will be displayed in the Edit Node Data dialog and all views and printouts. This value is used in the hydraulic calculations.
Nominal Height The standard height of the box culvert (usually the internal dimension) which will be displayed in the Edit Node Data dialog and all views and printouts. This value is used in the hydraulic calculations.
Overall Width The outside width of the link. This value is used in the quantities calculations
Overall Height The outside height of the link. This value is used in the minimum cover and quantity calculations
Minimum Slope The minimum slope at which the link will be placed in normal circumstances.
Maximum Slope The maximum slope at which the link will be placed in order to satisfy the minimum velocity requirement.
Side Clearance The space on either side of the link in an excavation. This value is used in the excavation, bedding and backfill volumes calculations.
Active A toggle to indicate whether this size is available during the analysis.
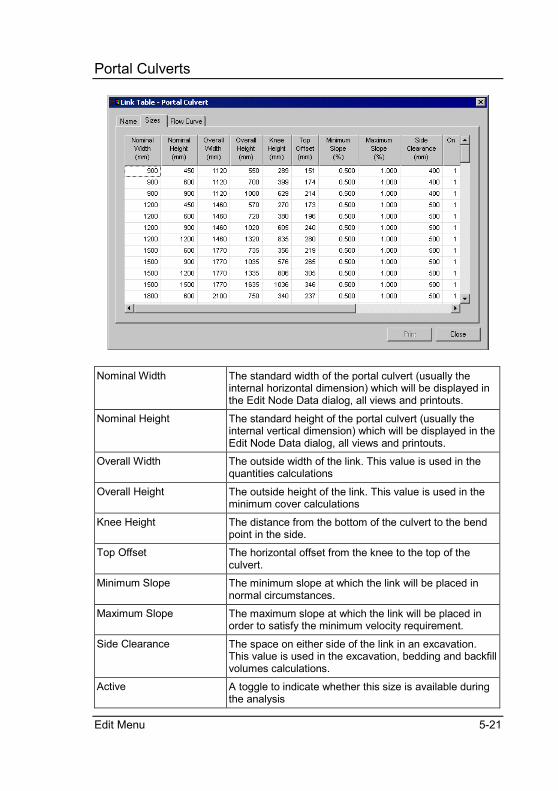
Edit Menu 5-21
Portal Culverts
Nominal Width The standard width of the portal culvert (usually the internal horizontal dimension) which will be displayed in the Edit Node Data dialog, all views and printouts.
Nominal Height The standard height of the portal culvert (usually the internal vertical dimension) which will be displayed in the Edit Node Data dialog, all views and printouts.
Overall Width The outside width of the link. This value is used in the quantities calculations
Overall Height The outside height of the link. This value is used in the minimum cover calculations
Knee Height The distance from the bottom of the culvert to the bend point in the side.
Top Offset The horizontal offset from the knee to the top of the culvert.
Minimum Slope The minimum slope at which the link will be placed in normal circumstances.
Maximum Slope The maximum slope at which the link will be placed in order to satisfy the minimum velocity requirement.
Side Clearance The space on either side of the link in an excavation. This value is used in the excavation, bedding and backfill volumes calculations.
Active A toggle to indicate whether this size is available during the analysis
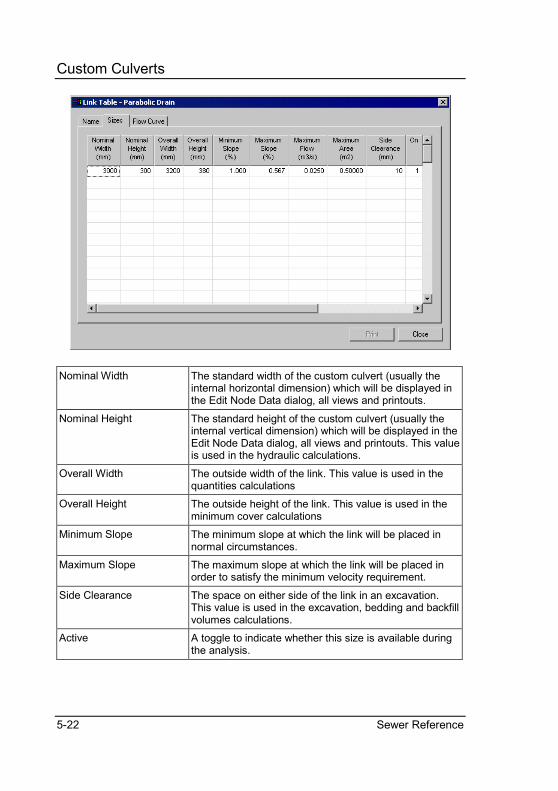
5-22 Sewer Reference
Custom Culverts
Nominal Width The standard width of the custom culvert (usually the internal horizontal dimension) which will be displayed in the Edit Node Data dialog, all views and printouts.
Nominal Height The standard height of the custom culvert (usually the internal vertical dimension) which will be displayed in the Edit Node Data dialog, all views and printouts. This value is used in the hydraulic calculations.
Overall Width The outside width of the link. This value is used in the quantities calculations
Overall Height The outside height of the link. This value is used in the minimum cover calculations
Minimum Slope The minimum slope at which the link will be placed in normal circumstances.
Maximum Slope The maximum slope at which the link will be placed in order to satisfy the minimum velocity requirement.
Side Clearance The space on either side of the link in an excavation. This value is used in the excavation, bedding and backfill volumes calculations.
Active A toggle to indicate whether this size is available during the analysis.
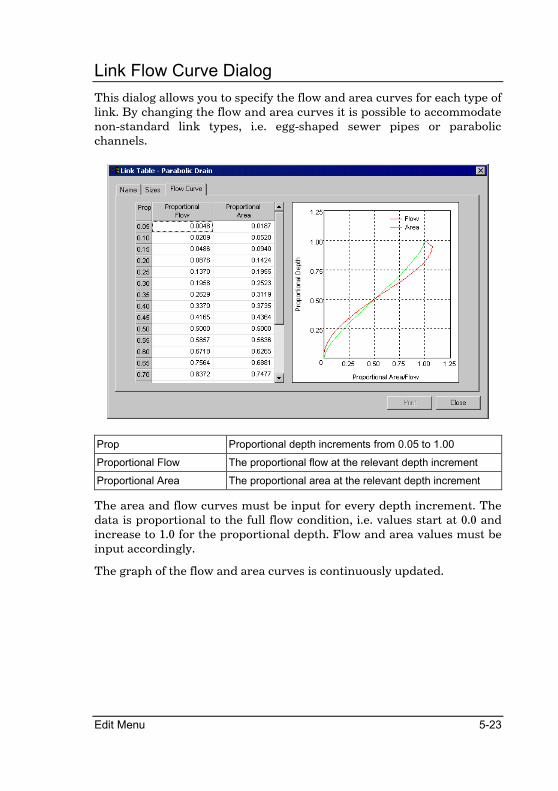
Edit Menu 5-23
Link Flow Curve Dialog
This dialog allows you to specify the flow and area curves for each type of link. By changing the flow and area curves it is possible to accommodate non-standard link types, i.e. egg-shaped sewer pipes or parabolic channels.
Prop Proportional depth increments from 0.05 to 1.00
Proportional Flow The proportional flow at the relevant depth increment
Proportional Area The proportional area at the relevant depth increment
The area and flow curves must be input for every depth increment. The data is proportional to the full flow condition, i.e. values start at 0.0 and increase to 1.0 for the proportional depth. Flow and area values must be input accordingly.
The graph of the flow and area curves is continuously updated.
5-24 Sewer Reference
Node Data
Edit the node data
Icon Button Toolbar Shortcut Command
SewerEditNodeData
The node data dialog allows you to input or edit node, link and inflow data. It also includes a page which displays the results relating to the node.
An overflow node is optional. If no overflow node is specified all overflows will be taken into local storage.
Use the arrow buttons to page through the database or click on the record number button to search for a particular node or record number.
Procedure
The Node Data dialog will be displayed. There are 5 data pages:
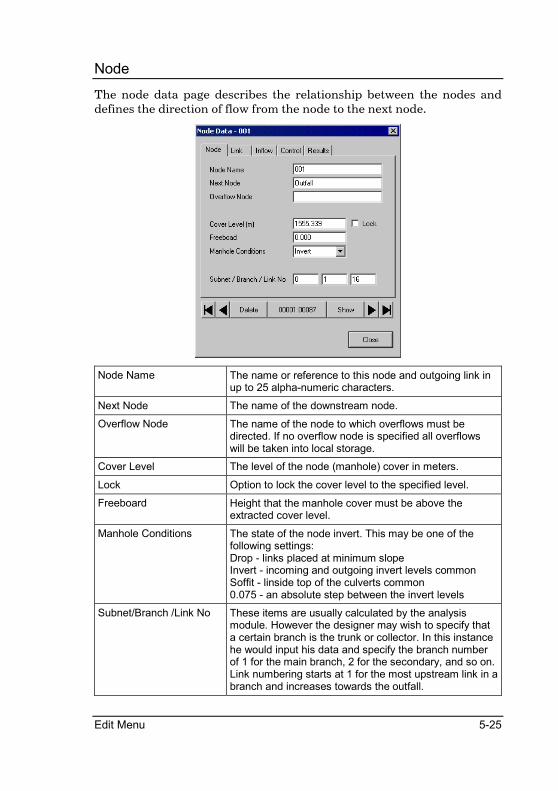
Edit Menu 5-25
Node
The node data page describes the relationship between the nodes and defines the direction of flow from the node to the next node.
Node Name The name or reference to this node and outgoing link in up to 25 alpha-numeric characters.
Next Node The name of the downstream node.
Overflow Node The name of the node to which overflows must be directed. If no overflow node is specified all overflows will be taken into local storage.
Cover Level The level of the node (manhole) cover in meters.
Lock Option to lock the cover level to the specified level.
Freeboard Height that the manhole cover must be above the extracted cover level.
Manhole Conditions The state of the node invert. This may be one of the following settings: Drop - links placed at minimum slope Invert - incoming and outgoing invert levels common Soffit - linside top of the culverts common 0.075 - an absolute step between the invert levels
Subnet/Branch /Link No These items are usually calculated by the analysis module. However the designer may wish to specify that a certain branch is the trunk or collector. In this instance he would input his data and specify the branch number of 1 for the main branch, 2 for the secondary, and so on. Link numbering starts at 1 for the most upstream link in a branch and increases towards the outfall.
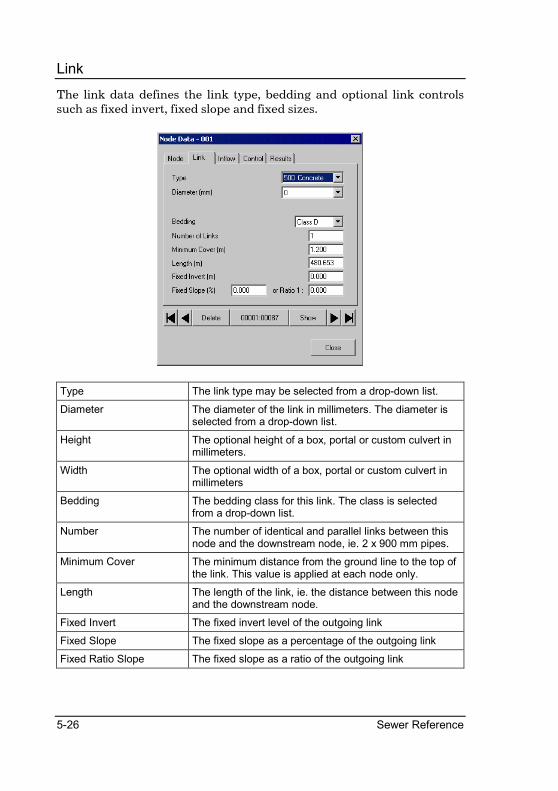
5-26 Sewer Reference
Link
The link data defines the link type, bedding and optional link controls such as fixed invert, fixed slope and fixed sizes.
Type The link type may be selected from a drop-down list.
Diameter The diameter of the link in millimeters. The diameter is selected from a drop-down list.
Height The optional height of a box, portal or custom culvert in millimeters.
Width The optional width of a box, portal or custom culvert in millimeters
Bedding The bedding class for this link. The class is selected from a drop-down list.
Number The number of identical and parallel links between this node and the downstream node, ie. 2 x 900 mm pipes.
Minimum Cover The minimum distance from the ground line to the top of the link. This value is applied at each node only.
Length The length of the link, ie. the distance between this node and the downstream node.
Fixed Invert The fixed invert level of the outgoing link
Fixed Slope The fixed slope as a percentage of the outgoing link
Fixed Ratio Slope The fixed slope as a ratio of the outgoing link
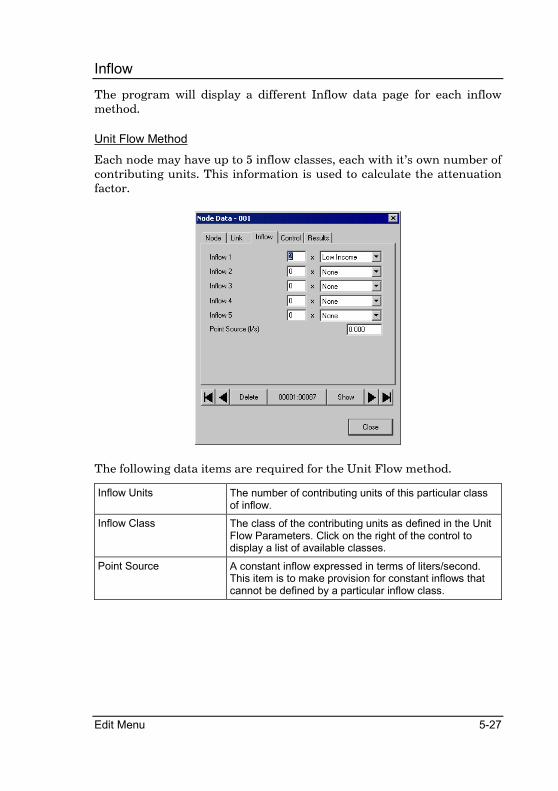
Edit Menu 5-27
Inflow
The program will display a different Inflow data page for each inflow method.
Unit Flow Method
Each node may have up to 5 inflow classes, each with it’s own number of contributing units. This information is used to calculate the attenuation factor.
The following data items are required for the Unit Flow method.
Inflow Units The number of contributing units of this particular class of inflow.
Inflow Class The class of the contributing units as defined in the Unit Flow Parameters. Click on the right of the control to display a list of available classes.
Point Source A constant inflow expressed in terms of liters/second. This item is to make provision for constant inflows that cannot be defined by a particular inflow class.
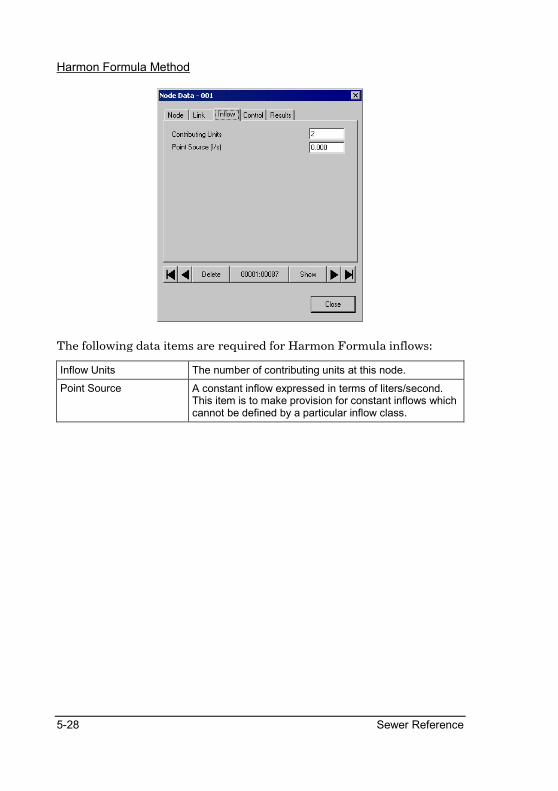
5-28 Sewer Reference
Harmon Formula Method
The following data items are required for Harmon Formula inflows:
Inflow Units The number of contributing units at this node.
Point Source A constant inflow expressed in terms of liters/second. This item is to make provision for constant inflows which cannot be defined by a particular inflow class.
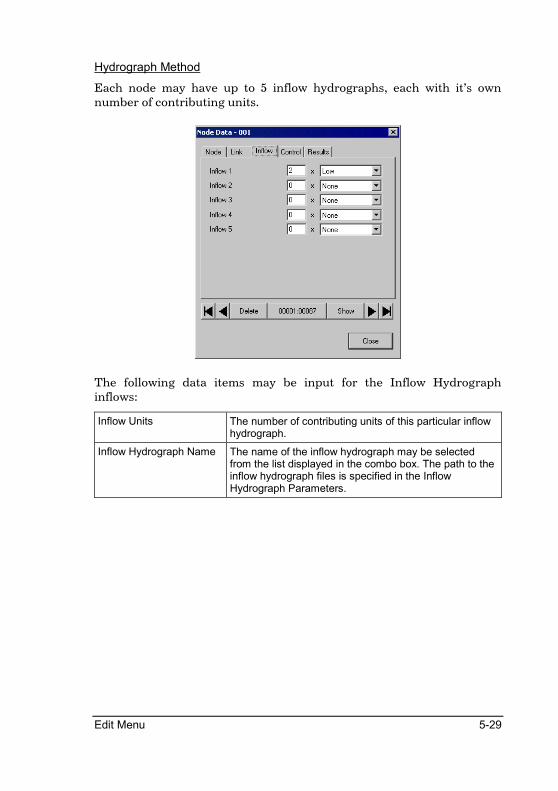
Edit Menu 5-29
Hydrograph Method
Each node may have up to 5 inflow hydrographs, each with it’s own number of contributing units.
The following data items may be input for the Inflow Hydrograph inflows:
Inflow Units The number of contributing units of this particular inflow hydrograph.
Inflow Hydrograph Name The name of the inflow hydrograph may be selected from the list displayed in the combo box. The path to the inflow hydrograph files is specified in the Inflow Hydrograph Parameters.
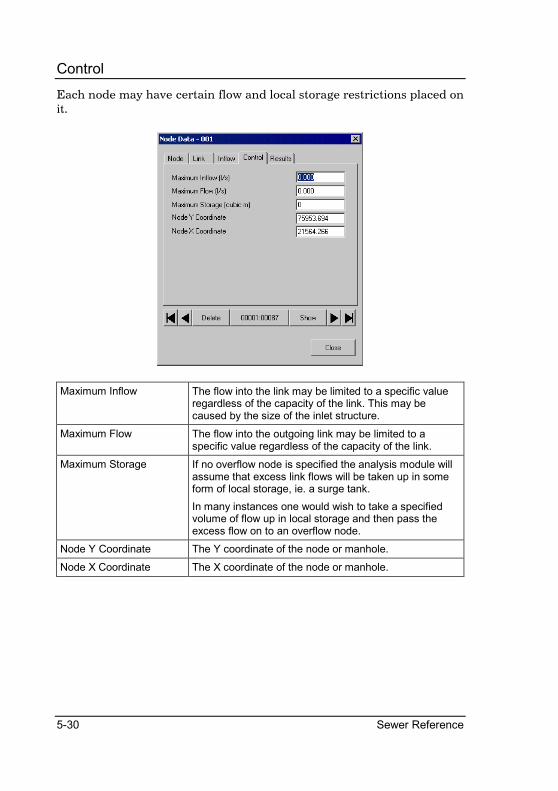
5-30 Sewer Reference
Control
Each node may have certain flow and local storage restrictions placed on it.
Maximum Inflow The flow into the link may be limited to a specific value regardless of the capacity of the link. This may be caused by the size of the inlet structure.
Maximum Flow The flow into the outgoing link may be limited to a specific value regardless of the capacity of the link.
Maximum Storage If no overflow node is specified the analysis module will assume that excess link flows will be taken up in some form of local storage, ie. a surge tank.
In many instances one would wish to take a specified volume of flow up in local storage and then pass the excess flow on to an overflow node.
Node Y Coordinate The Y coordinate of the node or manhole.
Node X Coordinate The X coordinate of the node or manhole.
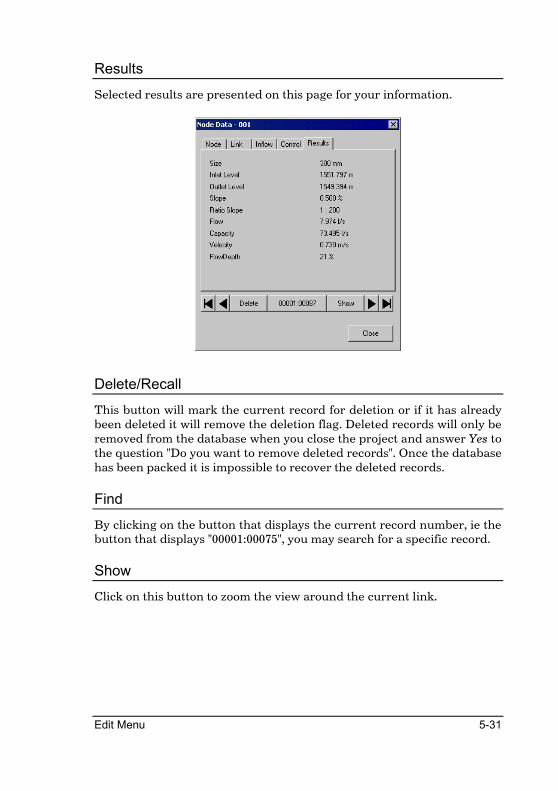
Edit Menu 5-31
Results
Selected results are presented on this page for your information.
Delete/Recall
This button will mark the current record for deletion or if it has already been deleted it will remove the deletion flag. Deleted records will only be removed from the database when you close the project and answer Yes to the question "Do you want to remove deleted records". Once the database has been packed it is impossible to recover the deleted records.
Find
By clicking on the button that displays the current record number, ie the button that displays "00001:00075", you may search for a specific record.
Show
Click on this button to zoom the view around the current link.
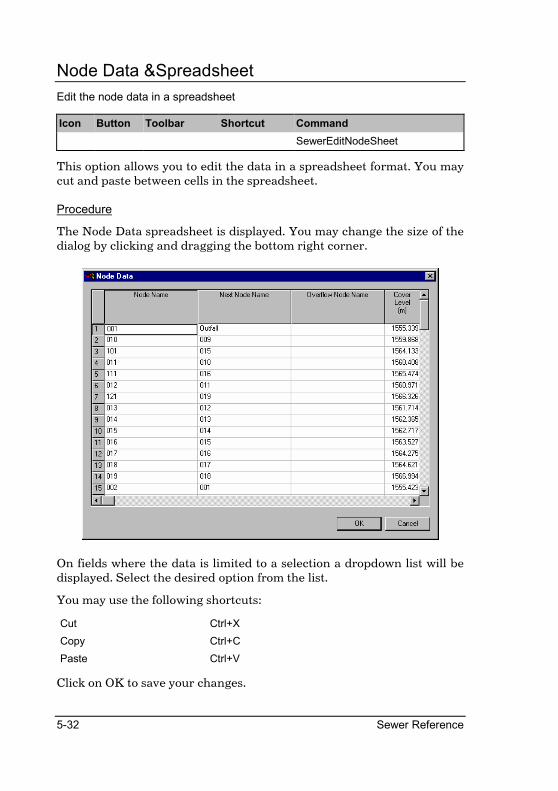
5-32 Sewer Reference
Node Data &Spreadsheet
Edit the node data in a spreadsheet
Icon Button Toolbar Shortcut Command
SewerEditNodeSheet
This option allows you to edit the data in a spreadsheet format. You may cut and paste between cells in the spreadsheet.
Procedure
The Node Data spreadsheet is displayed. You may change the size of the dialog by clicking and dragging the bottom right corner.
On fields where the data is limited to a selection a dropdown list will be displayed. Select the desired option from the list.
You may use the following shortcuts:
Cut Ctrl+X
Copy Ctrl+C
Paste Ctrl+V
Click on OK to save your changes.

Analysis Menu 6-1
Analysis Menu
This menu allows you to analyse or evaluate part or all the network and calculate the quantities according to SABS 1200 standards.
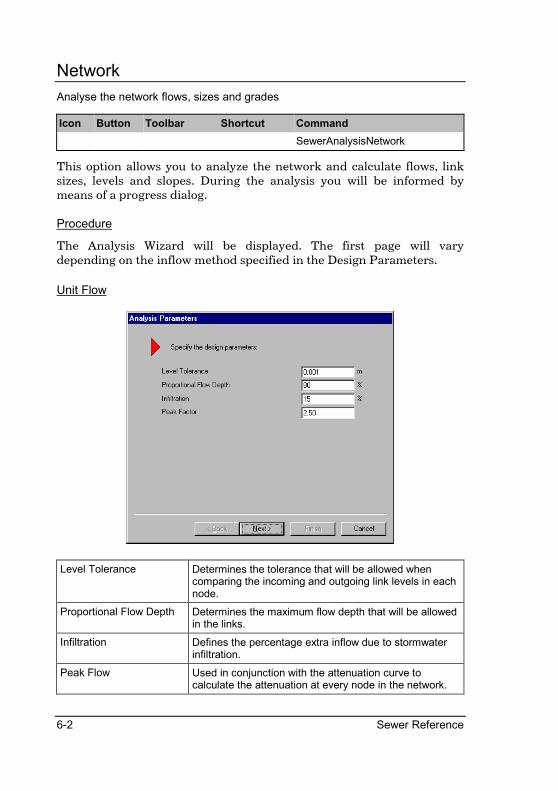
6-2 Sewer Reference
Network
Analyse the network flows, sizes and grades
Icon Button Toolbar Shortcut Command
SewerAnalysisNetwork
This option allows you to analyze the network and calculate flows, link sizes, levels and slopes. During the analysis you will be informed by means of a progress dialog.
Procedure
The Analysis Wizard will be displayed. The first page will vary depending on the inflow method specified in the Design Parameters.
Unit Flow
Level Tolerance Determines the tolerance that will be allowed when comparing the incoming and outgoing link levels in each node.
Proportional Flow Depth Determines the maximum flow depth that will be allowed in the links.
Infiltration Defines the percentage extra inflow due to stormwater infiltration.
Peak Flow Used in conjunction with the attenuation curve to calculate the attenuation at every node in the network.
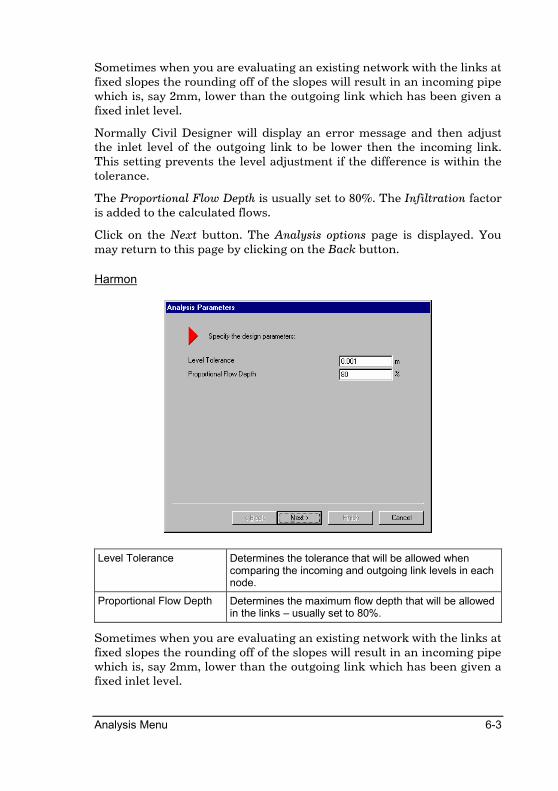
Analysis Menu 6-3
Sometimes when you are evaluating an existing network with the links at fixed slopes the rounding off of the slopes will result in an incoming pipe which is, say 2mm, lower than the outgoing link which has been given a fixed inlet level.
Normally Civil Designer will display an error message and then adjust the inlet level of the outgoing link to be lower then the incoming link. This setting prevents the level adjustment if the difference is within the tolerance.
The Proportional Flow Depth is usually set to 80%. The Infiltration factor is added to the calculated flows.
Click on the Next button. The Analysis options page is displayed. You may return to this page by clicking on the Back button.
Harmon
Level Tolerance Determines the tolerance that will be allowed when comparing the incoming and outgoing link levels in each node.
Proportional Flow Depth Determines the maximum flow depth that will be allowed in the links – usually set to 80%.
Sometimes when you are evaluating an existing network with the links at fixed slopes the rounding off of the slopes will result in an incoming pipe which is, say 2mm, lower than the outgoing link which has been given a fixed inlet level.
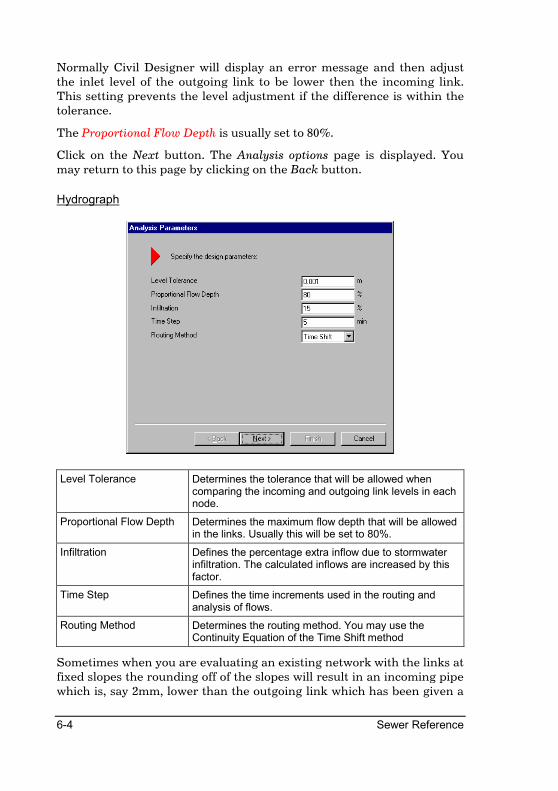
6-4 Sewer Reference
Normally Civil Designer will display an error message and then adjust the inlet level of the outgoing link to be lower then the incoming link. This setting prevents the level adjustment if the difference is within the tolerance.
The Proportional Flow Depth is usually set to 80%.
Click on the Next button. The Analysis options page is displayed. You may return to this page by clicking on the Back button.
Hydrograph
Level Tolerance Determines the tolerance that will be allowed when comparing the incoming and outgoing link levels in each node.
Proportional Flow Depth Determines the maximum flow depth that will be allowed in the links. Usually this will be set to 80%.
Infiltration Defines the percentage extra inflow due to stormwater infiltration. The calculated inflows are increased by this factor.
Time Step Defines the time increments used in the routing and analysis of flows.
Routing Method Determines the routing method. You may use the Continuity Equation of the Time Shift method
Sometimes when you are evaluating an existing network with the links at fixed slopes the rounding off of the slopes will result in an incoming pipe which is, say 2mm, lower than the outgoing link which has been given a
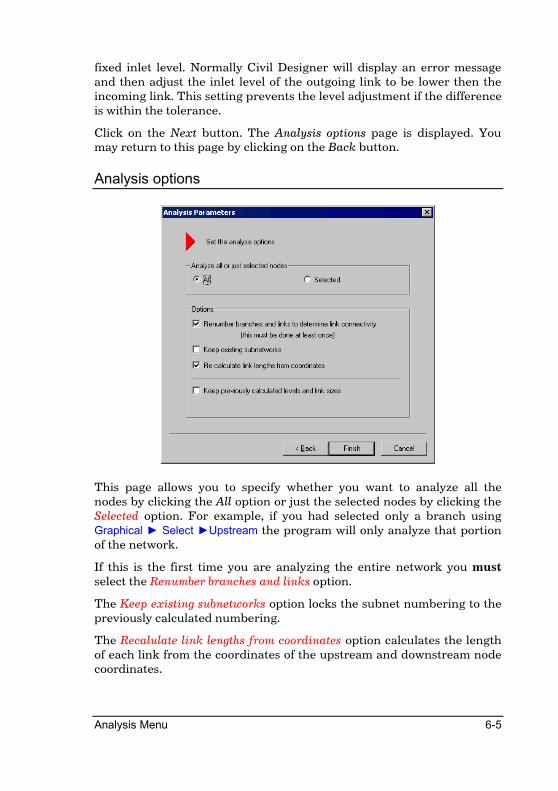
Analysis Menu 6-5
fixed inlet level. Normally Civil Designer will display an error message and then adjust the inlet level of the outgoing link to be lower then the incoming link. This setting prevents the level adjustment if the difference is within the tolerance.
Click on the Next button. The Analysis options page is displayed. You may return to this page by clicking on the Back button.
Analysis options
This page allows you to specify whether you want to analyze all the nodes by clicking the All option or just the selected nodes by clicking the Selected option. For example, if you had selected only a branch using Graphical ► Select ►Upstream the program will only analyze that portion of the network.
If this is the first time you are analyzing the entire network you must select the Renumber branches and links option.
The Keep existing subnetworks option locks the subnet numbering to the previously calculated numbering.
The Recalulate link lengths from coordinates option calculates the length of each link from the coordinates of the upstream and downstream node coordinates.

6-6 Sewer Reference
The Keep previously calculated levels and link sizes option locks the levels and link sizes to the previously calculated ones, although the inflow has been changed.
Click on the Finish button to proceed. The Output Manager dialog will be displayed. This allows you to specify the destination of the log that will be generated during the analysis. To direct the log to the Output Window check the Screen output option.
After the completion of the analysis the results windows will be displayed. Each window displays certain aspects of the results such as flows, overflows, levels and slopes, and the hydraulic gradient. These windows or views are discussed in the View Menu chapter.

Analysis Menu 6-7
Quantities
Calculate the quantities
Icon Button Toolbar Shortcut Command
SewerAnalysisQuantities
This option allows you to calculate the quantities of the selected links in the network according to the parameters defined in the depth increments and the Bedding Classes.
The Print Manager will be displayed. Specify where you want the output to be directed. Click on OK.
A progress window will be displayed during the calculation. You may terminate the quantity analysis at any time by clicking on the Cancel button. Thereafter the results will be displayed in a series of windows or views as discussed in the View Menu.

6-8 Sewer Reference
Notes:

Graphical Menu 7-1
View Menu
These functions allow you to view input data, results, quantities and link hydrographs if you are using the Inflow Hydrograph analysis method.
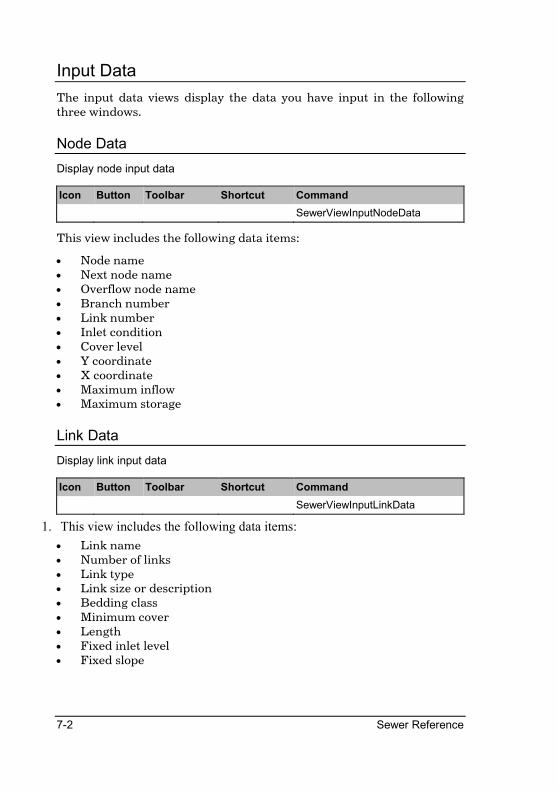
7-2 Sewer Reference
Input Data
The input data views display the data you have input in the following three windows.
Node Data
Display node input data
Icon Button Toolbar Shortcut Command
SewerViewInputNodeData
This view includes the following data items:
• Node name • Next node name • Overflow node name • Branch number • Link number • Inlet condition • Cover level • Y coordinate • X coordinate • Maximum inflow • Maximum storage
Link Data
Display link input data
Icon Button Toolbar Shortcut Command
SewerViewInputLinkData
1. This view includes the following data items:
• Link name • Number of links • Link type • Link size or description • Bedding class • Minimum cover • Length • Fixed inlet level • Fixed slope
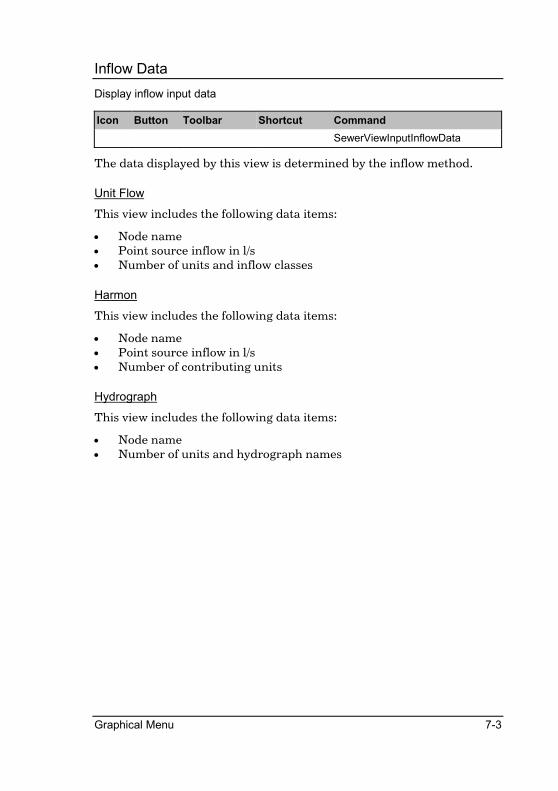
Graphical Menu 7-3
Inflow Data
Display inflow input data
Icon Button Toolbar Shortcut Command
SewerViewInputInflowData
The data displayed by this view is determined by the inflow method.
Unit Flow
This view includes the following data items:
• Node name • Point source inflow in l/s • Number of units and inflow classes
Harmon
This view includes the following data items:
• Node name • Point source inflow in l/s • Number of contributing units
Hydrograph
This view includes the following data items:
• Node name • Number of units and hydrograph names
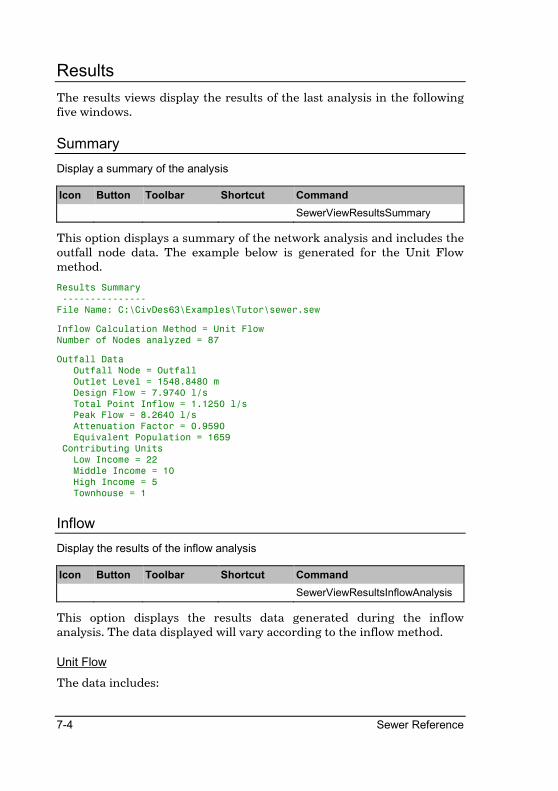
7-4 Sewer Reference
Results
The results views display the results of the last analysis in the following five windows.
Summary
Display a summary of the analysis
Icon Button Toolbar Shortcut Command
SewerViewResultsSummary
This option displays a summary of the network analysis and includes the outfall node data. The example below is generated for the Unit Flow method.
Results Summary
---------------
File Name: C:\CivDes63\Examples\Tutor\sewer.sew
Inflow Calculation Method = Unit Flow
Number of Nodes analyzed = 87
Outfall Data
Outfall Node = Outfall
Outlet Level = 1548.8480 m
Design Flow = 7.9740 l/s
Total Point Inflow = 1.1250 l/s
Peak Flow = 8.2640 l/s
Attenuation Factor = 0.9590
Equivalent Population = 1659
Contributing Units
Low Income = 22
Middle Income = 10
High Income = 5
Townhouse = 1
Inflow
Display the results of the inflow analysis
Icon Button Toolbar Shortcut Command
SewerViewResultsInflowAnalysis
This option displays the results data generated during the inflow analysis. The data displayed will vary according to the inflow method.
Unit Flow
The data includes:
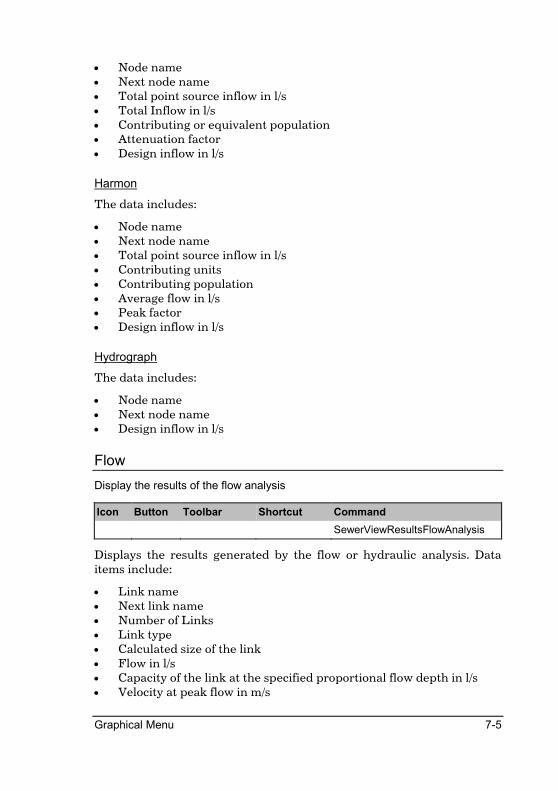
Graphical Menu 7-5
• Node name • Next node name • Total point source inflow in l/s • Total Inflow in l/s • Contributing or equivalent population • Attenuation factor • Design inflow in l/s
Harmon
The data includes:
• Node name • Next node name • Total point source inflow in l/s • Contributing units • Contributing population • Average flow in l/s • Peak factor • Design inflow in l/s
Hydrograph
The data includes:
• Node name • Next node name • Design inflow in l/s
Flow
Display the results of the flow analysis
Icon Button Toolbar Shortcut Command
SewerViewResultsFlowAnalysis
Displays the results generated by the flow or hydraulic analysis. Data items include:
• Link name • Next link name • Number of Links • Link type • Calculated size of the link • Flow in l/s • Capacity of the link at the specified proportional flow depth in l/s • Velocity at peak flow in m/s
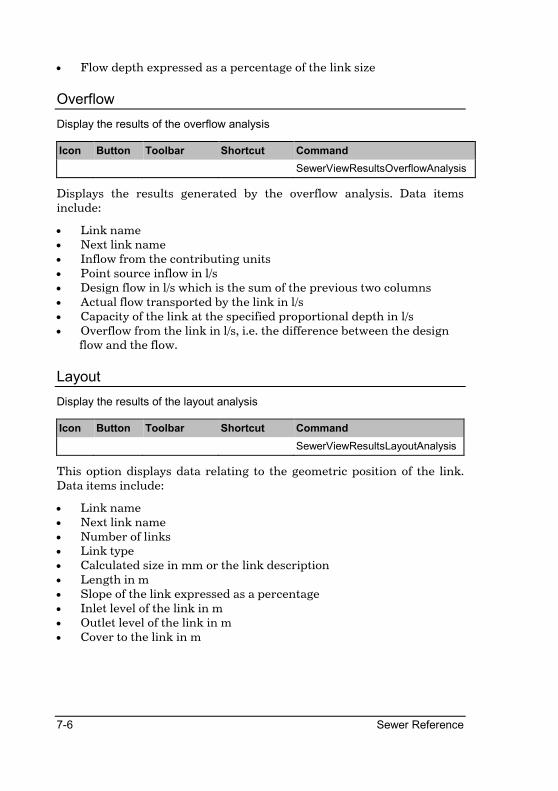
7-6 Sewer Reference
• Flow depth expressed as a percentage of the link size
Overflow
Display the results of the overflow analysis
Icon Button Toolbar Shortcut Command
SewerViewResultsOverflowAnalysis
Displays the results generated by the overflow analysis. Data items include:
• Link name • Next link name • Inflow from the contributing units • Point source inflow in l/s • Design flow in l/s which is the sum of the previous two columns • Actual flow transported by the link in l/s • Capacity of the link at the specified proportional depth in l/s • Overflow from the link in l/s, i.e. the difference between the design
flow and the flow.
Layout
Display the results of the layout analysis
Icon Button Toolbar Shortcut Command
SewerViewResultsLayoutAnalysis
This option displays data relating to the geometric position of the link. Data items include:
• Link name • Next link name • Number of links • Link type • Calculated size in mm or the link description • Length in m • Slope of the link expressed as a percentage • Inlet level of the link in m • Outlet level of the link in m • Cover to the link in m

Graphical Menu 7-7
Hydraulic Grade
Display the results of the hydraulic grade analysis
Icon Button Toolbar Shortcut Command
SewerViewResultsHydraulicAnalysis
This option displays the elevation of the hydraulic grade line as well as other hydraulic control data. Data items include:
• Link name • Hydraulic grade in m • Cover level of the node (manhole) in m • Soffit level of the link in m • Velocity of flow in m/s • Flow depth in the link in m
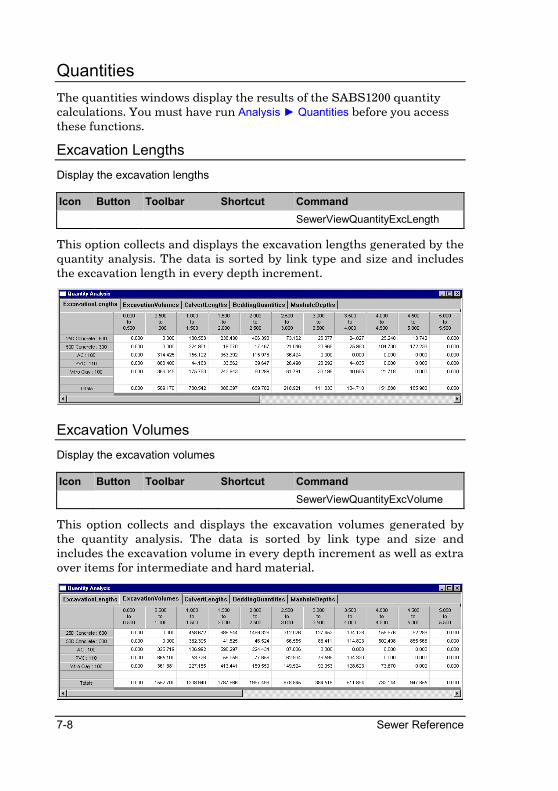
7-8 Sewer Reference
Quantities
The quantities windows display the results of the SABS1200 quantity calculations. You must have run Analysis ► Quantities before you access these functions.
Excavation Lengths
Display the excavation lengths
Icon Button Toolbar Shortcut Command
SewerViewQuantityExcLength
This option collects and displays the excavation lengths generated by the quantity analysis. The data is sorted by link type and size and includes the excavation length in every depth increment.
Excavation Volumes
Display the excavation volumes
Icon Button Toolbar Shortcut Command
SewerViewQuantityExcVolume
This option collects and displays the excavation volumes generated by the quantity analysis. The data is sorted by link type and size and includes the excavation volume in every depth increment as well as extra over items for intermediate and hard material.
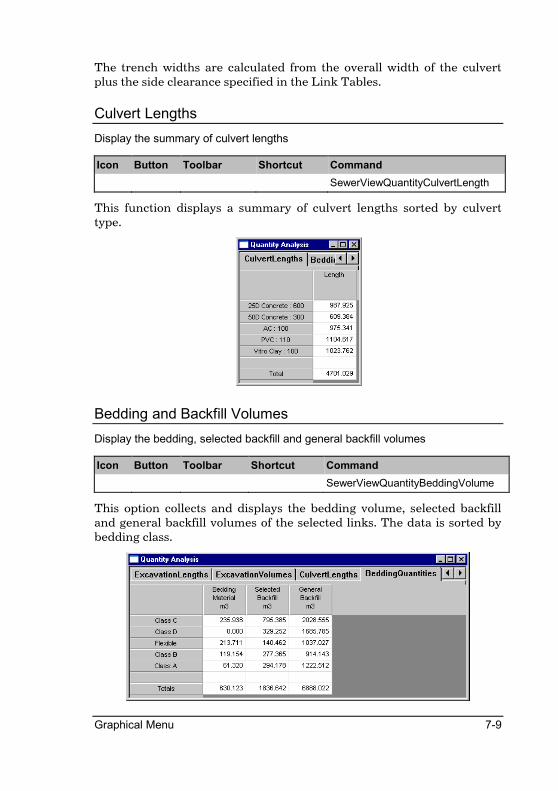
Graphical Menu 7-9
The trench widths are calculated from the overall width of the culvert plus the side clearance specified in the Link Tables.
Culvert Lengths
Display the summary of culvert lengths
Icon Button Toolbar Shortcut Command
SewerViewQuantityCulvertLength
This function displays a summary of culvert lengths sorted by culvert type.
Bedding and Backfill Volumes
Display the bedding, selected backfill and general backfill volumes
Icon Button Toolbar Shortcut Command
SewerViewQuantityBeddingVolume
This option collects and displays the bedding volume, selected backfill and general backfill volumes of the selected links. The data is sorted by bedding class.
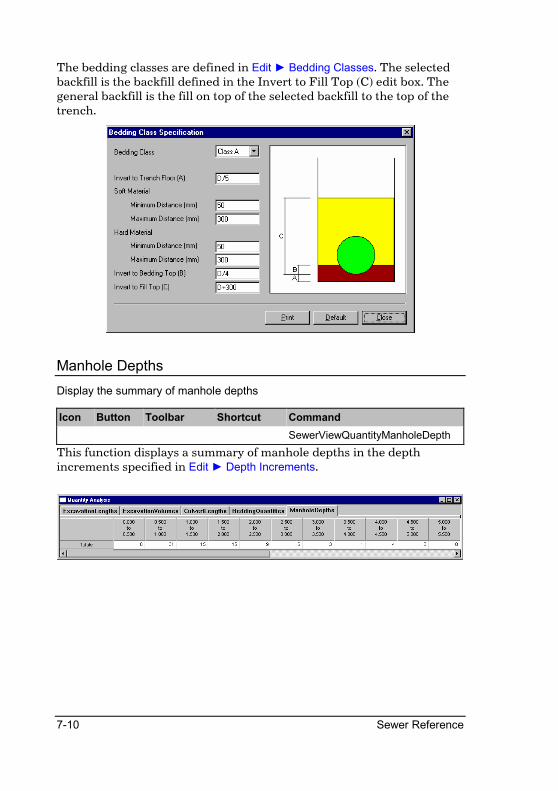
7-10 Sewer Reference
The bedding classes are defined in Edit ► Bedding Classes. The selected backfill is the backfill defined in the Invert to Fill Top (C) edit box. The general backfill is the fill on top of the selected backfill to the top of the trench.
Manhole Depths
Display the summary of manhole depths
Icon Button Toolbar Shortcut Command
SewerViewQuantityManholeDepth
This function displays a summary of manhole depths in the depth increments specified in Edit ► Depth Increments.
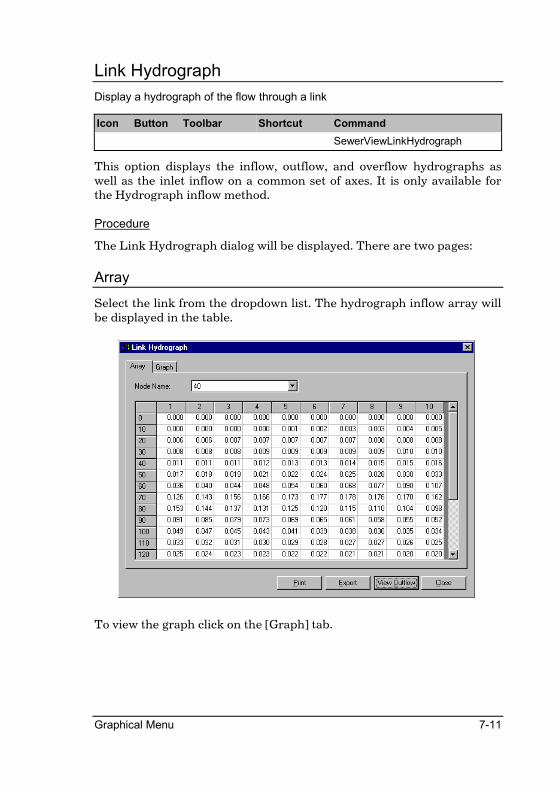
Graphical Menu 7-11
Link Hydrograph
Display a hydrograph of the flow through a link
Icon Button Toolbar Shortcut Command
SewerViewLinkHydrograph
This option displays the inflow, outflow, and overflow hydrographs as well as the inlet inflow on a common set of axes. It is only available for the Hydrograph inflow method.
Procedure
The Link Hydrograph dialog will be displayed. There are two pages:
Array
Select the link from the dropdown list. The hydrograph inflow array will be displayed in the table.
To view the graph click on the [Graph] tab.
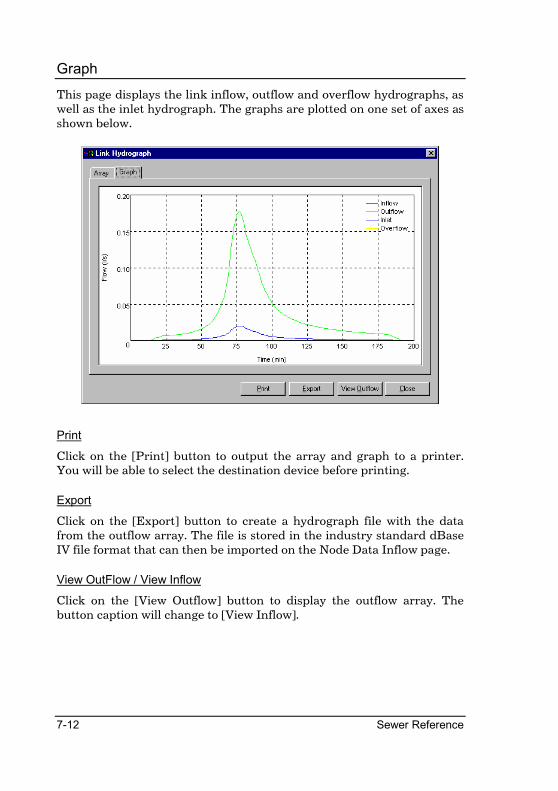
7-12 Sewer Reference
Graph
This page displays the link inflow, outflow and overflow hydrographs, as well as the inlet hydrograph. The graphs are plotted on one set of axes as shown below.
Click on the [Print] button to output the array and graph to a printer. You will be able to select the destination device before printing.
Export
Click on the [Export] button to create a hydrograph file with the data from the outflow array. The file is stored in the industry standard dBase IV file format that can then be imported on the Node Data Inflow page.
View OutFlow / View Inflow
Click on the [View Outflow] button to display the outflow array. The button caption will change to [View Inflow].
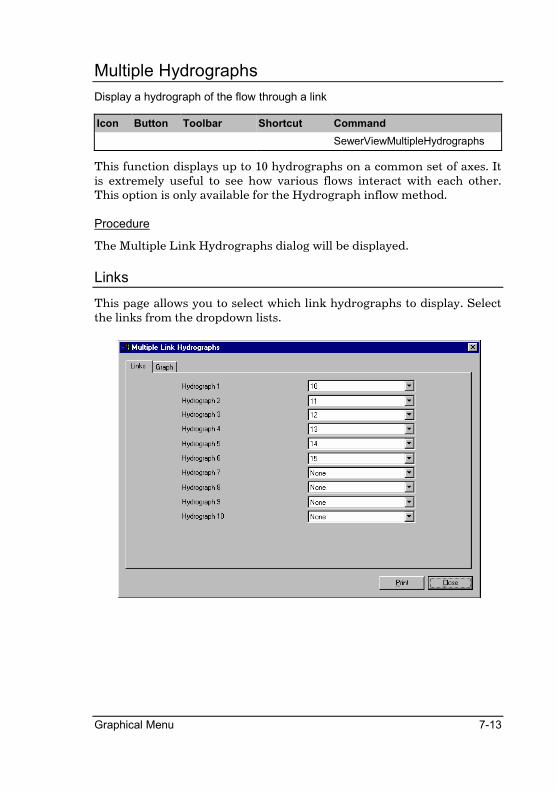
Graphical Menu 7-13
Multiple Hydrographs
Display a hydrograph of the flow through a link
Icon Button Toolbar Shortcut Command
SewerViewMultipleHydrographs
This function displays up to 10 hydrographs on a common set of axes. It is extremely useful to see how various flows interact with each other. This option is only available for the Hydrograph inflow method.
Procedure
The Multiple Link Hydrographs dialog will be displayed.
Links
This page allows you to select which link hydrographs to display. Select the links from the dropdown lists.
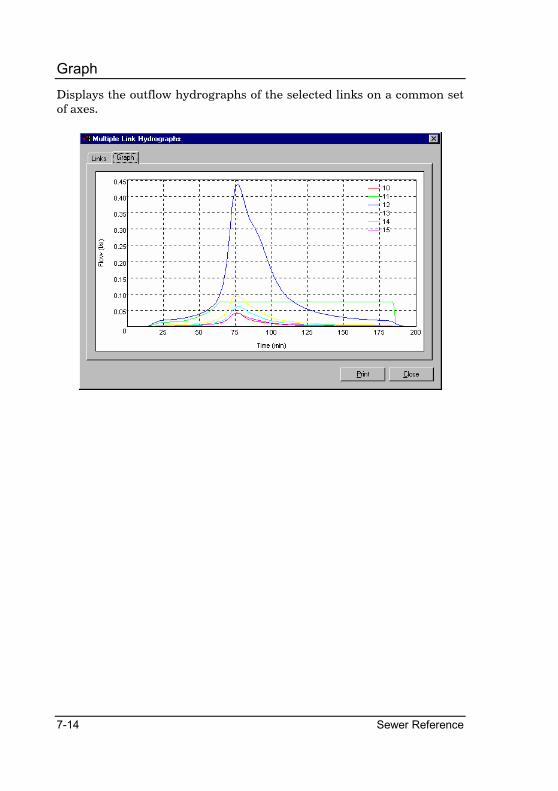
7-14 Sewer Reference
Graph
Displays the outflow hydrographs of the selected links on a common set of axes.
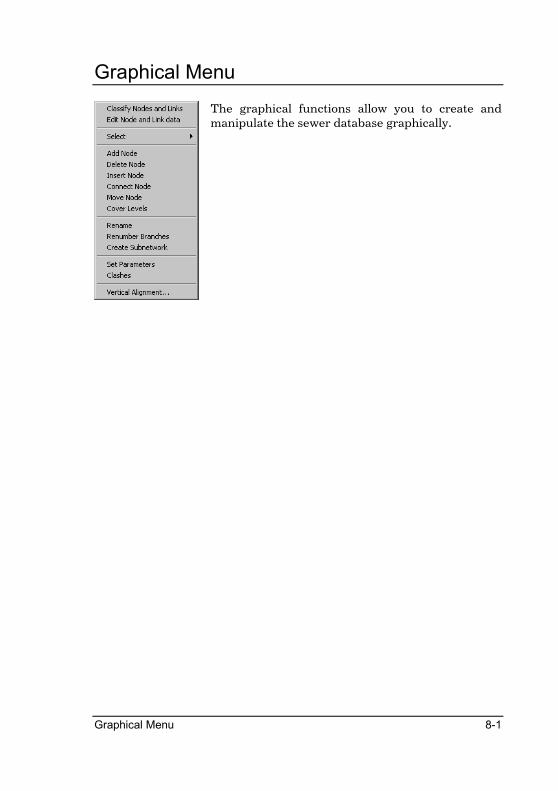
Graphical Menu 8-1
Graphical Menu
The graphical functions allow you to create and manipulate the sewer database graphically.
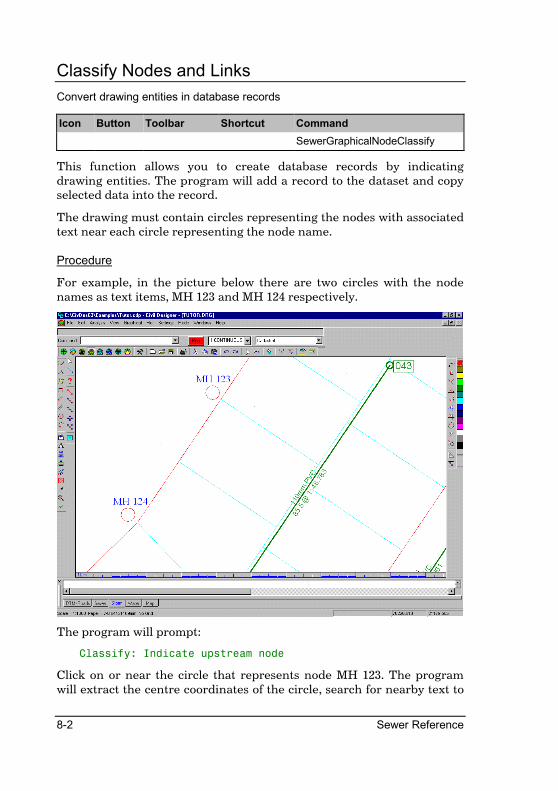
8-2 Sewer Reference
Classify Nodes and Links
Convert drawing entities in database records
Icon Button Toolbar Shortcut Command
SewerGraphicalNodeClassify
This function allows you to create database records by indicating drawing entities. The program will add a record to the dataset and copy selected data into the record.
The drawing must contain circles representing the nodes with associated text near each circle representing the node name.
Procedure
For example, in the picture below there are two circles with the node names as text items, MH 123 and MH 124 respectively.
The program will prompt:
Classify: Indicate upstream node
Click on or near the circle that represents node MH 123. The program will extract the centre coordinates of the circle, search for nearby text to
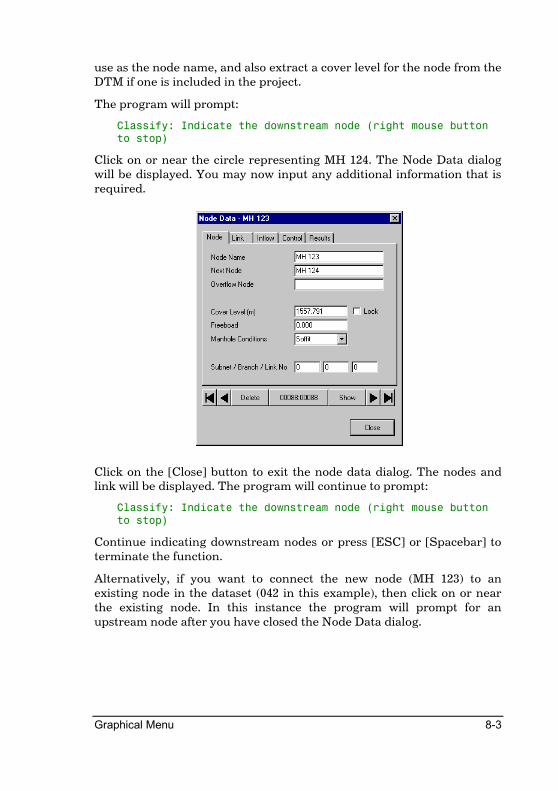
Graphical Menu 8-3
use as the node name, and also extract a cover level for the node from the DTM if one is included in the project.
The program will prompt:
Classify: Indicate the downstream node (right mouse button
to stop)
Click on or near the circle representing MH 124. The Node Data dialog will be displayed. You may now input any additional information that is required.
Click on the [Close] button to exit the node data dialog. The nodes and link will be displayed. The program will continue to prompt:
Classify: Indicate the downstream node (right mouse button
to stop)
Continue indicating downstream nodes or press [ESC] or [Spacebar] to terminate the function.
Alternatively, if you want to connect the new node (MH 123) to an existing node in the dataset (042 in this example), then click on or near the existing node. In this instance the program will prompt for an upstream node after you have closed the Node Data dialog.
8-4 Sewer Reference
Edit Node and Link Data
Query and edit node and link data
Icon Button Toolbar Shortcut Command
SewerGraphicalNodeEdit
This function allows you to query and edit existing node and link data.
Procedure
The program will prompt:
Query: Indicate node or link to query
Click on a node or link. The Node Data dialog will be displayed with the relevant data.
Press [ESC] or [Spacebar] to terminate the function.
Graphical Menu 8-5
Select
The select functions allow you to select nodes and links individually, upstream from a specific point, or all the nodes and links. You can also clear an existing selection.
The network analysis and the quantity calculations are only done on selected records. In addition, the Cover Level and Set Parameters functions only operate on selected records.
The display is updated when you activate the selection functions to highlight all the selected nodes and links. Upon completion of the selection functions the nodes and links will be re-drawn normally.
Single
Select a single node and link
Icon Button Toolbar Shortcut Command
SewerGraphicalSelectSingle
This function allows you to select or de-select a single node and link.
Procedure
The program will prompt:
Select: Indicate link to select
Click on the node or link you want to select or de-select. The display will be updated to reflect the status of the node and link.
Press [ESC] or [Spacebar] to terminate the function.
Branch
Select the nodes and links with the same Subnetwork and Branch numbers
Icon Button Toolbar Shortcut Command
SewerGraphicalSelectBranch
This function allows you to select all the nodes and links with the same subnetwork and branch numbers by selecting one of the links in the branch.
Procedure
The program will prompt:
8-6 Sewer Reference
Select Branch: Indicate link to start branch trace
Place the cursor on a link and click. All the nodes and links with the same subnet and branch number as the indicated node or link will be selected.
Upstream
Select the nodes and links upstream from a specified point
Icon Button Toolbar Shortcut Command
SewerGraphicalSelectUpstream
This function allows you to select all the nodes and links upstream from a specified point. The program will clear the existing selection and then track and select all nodes and links upstream of the indicated point.
Procedure
The program will prompt:
Select Upstream: Indicate link to start upstream trace
Place the cursor on a link and click. All the nodes and links upstream of the indicated node or link will be selected.
All
Select all the nodes and links
Icon Button Toolbar Shortcut Command
SewerGraphicalSelectAll
This function allows you to select all the nodes and links in a data set.
Procedure
The program will redraw the network in selected mode.
Clear
Clear all the selected nodes and links
Icon Button Toolbar Shortcut Command
SewerGraphicalSelectClear
This function allows you to de-select all the nodes and links in a data set.

Graphical Menu 8-7
Procedure
The program will redraw the network in normal mode.
Toggle Show Selected
Toggle between showing the selection highlighted or normal.
Icon Button Toolbar Shortcut Command
SewerToggleShowSelected
This function allows you to switch the display of the selected node and links on or off. The program will redraw the selected section of the network in normal mode and on the next click back in selected mode.
8-8 Sewer Reference
Add Node
Add a node and link
Icon Button Toolbar Shortcut Command
SewerGraphicalNodeAdd
This function allows you to graphically add a node and link to the data set.
Procedure
The program will prompt:
Add Node: Indicate position of new node
Indicate the position of the new node. You may use any of the snap modes to do so. Once you have clicked with the mouse or pressed Enter the program will prompt:
Add Node: Input New Node Name
Type in a new node name and click on �. The node will be drawn and the program will prompt:
Add Node: Indicate the next downstream node (right mouse
button to stop)
If you click on an existing node the program will insert the existing node's name into the next node field and display the Node Data dialog. If you click on a new node position the program will ask for the name of the second new node before displaying the Node Data dialog.
The program will extract the Cover Level from the specified terrain model surface and calculate the length of the link automatically. The program will continue to prompt:
Add Node: Indicate position of new node
Press [ESC] or [Spacebar] to terminate the function.
Graphical Menu 8-9
Delete Node
Delete an existing node
Icon Button Toolbar Shortcut Command
SewerGraphicalNodeDelete
This function allows you to graphically delete a node and it's associated link from the data set.
Procedure
The program will prompt:
Delete Node: Indicate node to delete
Position the cursor on the node to be deleted and click with the left mouse button. The node will be marked as deleted and the screen re-drawn.
The node may be recalled by opening the Node Data dialog, displaying the deleted record and clicking on the Recall button.
The program will continue to prompt:
Delete Node: Indicate node to delete
Indicate additional nodes or press [ESC] or the [Spacebar] to terminate the function.
8-10 Sewer Reference
Insert Node
Insert a node into an existing link
Icon Button Toolbar Shortcut Command
SewerGraphicalNodeInsert
This function allows you to graphically insert a node into an existing link.
Procedure
The program will prompt:
Insert Node: Indicate link to insert new node
Position the cursor near to the existing link to be "cut" and click. The cursor will snap onto the link and the program will prompt you for the name of the inserted node:
Insert Node: Input New Node Name
Type in the name of the inserted node and click on ü. The Node Data dialog will be displayed.
The program will extract the Cover Level from the specified terrain model surface and calculate the length of the link automatically. It will also adjust the length of the cut link.
The program will continue to prompt:
Insert Node: Indicate link to insert new node
Indicate additional nodes or press ESC or the Spacebar to terminate the function.
Graphical Menu 8-11
Connect Node
Define the connectivity between nodes
Icon Button Toolbar Shortcut Command
SewerGraphicalNodeConnect
This function allows you to graphically define or change the connectivity between nodes. If you change the connectivity of an existing link it will be removed.
Procedure
The program will prompt:
Connect Node: Indicate node
Position the cursor on the upstream node and click. The program will remove the existing link (if any) and prompt:
Connect Node: Indicate downstream node to connect to (right
mouse button to stop)
Position the cursor on the downstream node and click. The link will be drawn in the new position. The link from the downstream node will now be erased from the display.
The program will continue to prompt:
Connect Node: Indicate downstream node to connect to (right
mouse button to stop)
Continue to indicate additional downstream nodes or press [ESC] or the [Spacebar] to terminate the function.
8-12 Sewer Reference
Move Node
Move an existing node
Icon Button Toolbar Shortcut Command
SewerGraphicalNodeMove
This function allows you to graphically move a node and it's incoming and outgoing links. The program will automatically extract the Cover Level from the specified terrain model surface and re-calculate the lengths of all the links connected to the node.
Procedure
The program will prompt:
Move Node: Indicate node to move
Position the cursor close to the node to be moved and click. The cursor will snap to the centre of the node and the program will prompt:
Move Node: Indicate new position of node
As you move the cursor the display is updated to show the position of the node and it's attached links. Move the cursor to the new position and click or press [Enter]. You may use the snap modes to place the node accurately.
Graphical Menu 8-13
Cover Levels
Update node cover levels
Icon Button Toolbar Shortcut Command
SewerGraphicalNodeCoverLevels
This function will extract levels from the digital terrain model and update the node cover levels of all the selected nodes.
Procedure
The DTM Surfaces dialog will be displayed.
Specify the surface to be used to interpolate the cover level and click on [OK]. The program will scan the database and extract a cover level for each selected node. If no nodes have been selected the following error message will be displayed:
No nodes selected
Use the Graphical ► Select functions to select nodes.

8-14 Sewer Reference
Set Parameters
Update node and link parameters
Icon Button Toolbar Shortcut Command
SewerGraphicalSetParameters
This function allows you to set or change certain parameters of selected nodes and links.
Procedure
The Set Parameters dialog is displayed.
To change one of the displayed items click on the check box. Thereafter specify the value to set in the list or control on the right of the item. Once you have set all the items you wish to change click on [OK]. All the selected nodes and links will be updated.
If no nodes have been selected the following error message will be displayed:
No nodes or links selected
Use the Graphical ► Select functions to select nodes.
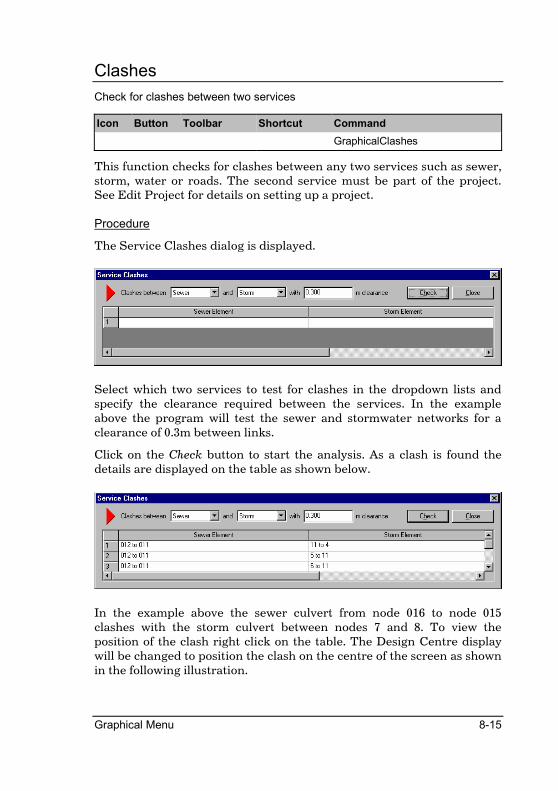
Graphical Menu 8-15
Clashes
Check for clashes between two services
Icon Button Toolbar Shortcut Command
GraphicalClashes
This function checks for clashes between any two services such as sewer, storm, water or roads. The second service must be part of the project. See Edit Project for details on setting up a project.
Procedure
The Service Clashes dialog is displayed.
Select which two services to test for clashes in the dropdown lists and specify the clearance required between the services. In the example above the program will test the sewer and stormwater networks for a clearance of 0.3m between links.
Click on the Check button to start the analysis. As a clash is found the details are displayed on the table as shown below.
In the example above the sewer culvert from node 016 to node 015 clashes with the storm culvert between nodes 7 and 8. To view the position of the clash right click on the table. The Design Centre display will be changed to position the clash on the centre of the screen as shown in the following illustration.
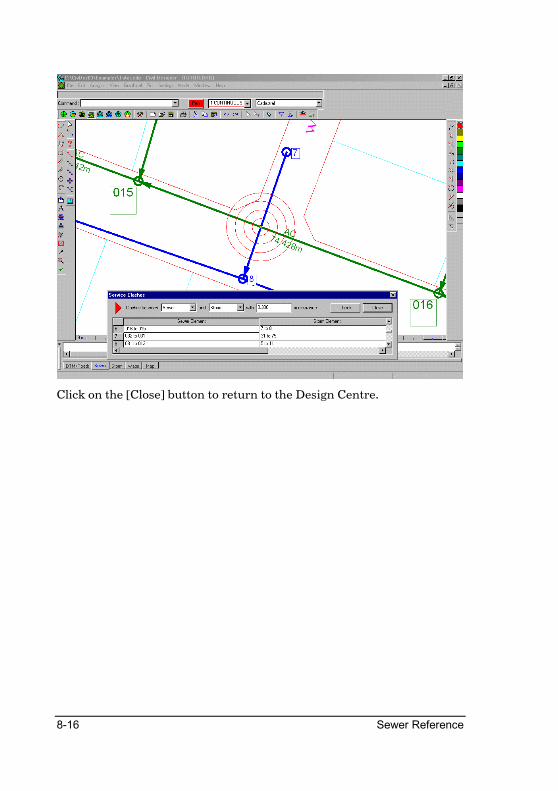
8-16 Sewer Reference
Click on the [Close] button to return to the Design Centre.
Graphical Menu 8-17
Rename
Rename existing node.
Icon Button Toolbar Shortcut Command
SewerGraphicalNodeRename
This option allows you to graphically change the node names.
Procedure
The program will prompt.
Rename : Indicate node to rename
Position the cursor on the node to rename and click. The program will read and show the existing node name and prompt:
Rename : Input new node name
Type in the new name for the node and click on the tick. The program will continue to prompt:
Rename : Indicate node to rename
Continue to change node names or press [ESC] to terminate the function.

8-18 Sewer Reference
Renumber Branches
Renumber existing branches.
Icon Button Toolbar Shortcut Command
SewerGraphicalBranchRenumber
This option allows you to graphically change the numbering of the branches.
Procedure
The program will prompt.
Renumber branches : Indicate branch to renumber
Position the cursor on the branch to renumber and click. The program will read and show the existing branch number and prompt:
Renumber : Input new branch number
Type in the new branch number for the branch and click on the tick. The program will continue to prompt:
Renumber branches : Indicate branch to renumber
Continue to change branch numbers or press [ESC] to terminate the function.
Graphical Menu 8-19
Create Subnetwork
Create new subnetworks from a selection in an existing network.
Icon Button Toolbar Shortcut Command
SewerCreateSubnet
This option allows you to graphically select a section of an existing network and create a new sub-network from it.
Procedure
The program will prompt.
Create subnetwork : Indicate link to start upstream trace
Position the cursor on the branch where upstream trace must start and click. The program will trace all the branches and links upstream from the link and highlight them. A confirmation window will be displayed asking:
Create subnetwork from selection?
Click on the YES button if you are happy with the selection. The print manager will open and you can select options for the output type. The renumbering of the subnetwork will be spooled to the specified output options. The program will continue to prompt:
Create subnetwork : Indicate link to start upstream trace
Continue to create another sub-network or press [ESC] to terminate the function.
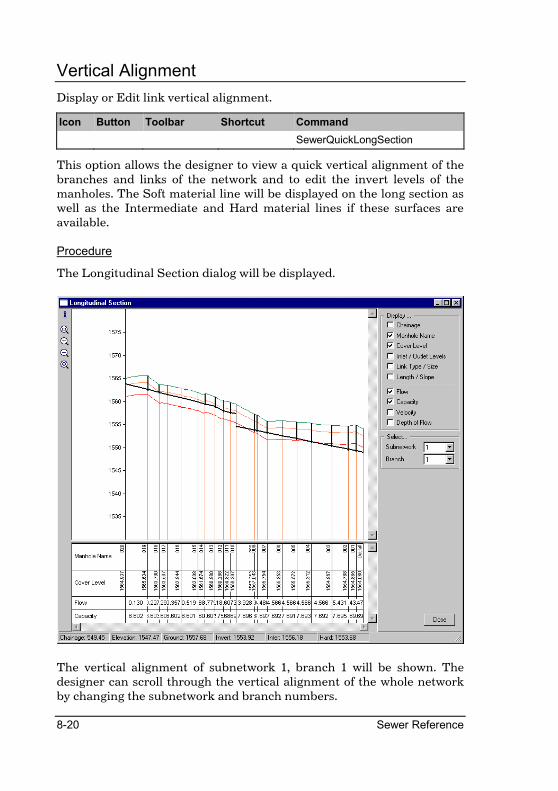
8-20 Sewer Reference
Vertical Alignment
Display or Edit link vertical alignment.
Icon Button Toolbar Shortcut Command
SewerQuickLongSection
This option allows the designer to view a quick vertical alignment of the branches and links of the network and to edit the invert levels of the manholes. The Soft material line will be displayed on the long section as well as the Intermediate and Hard material lines if these surfaces are available.
Procedure
The Longitudinal Section dialog will be displayed.
The vertical alignment of subnetwork 1, branch 1 will be shown. The designer can scroll through the vertical alignment of the whole network by changing the subnetwork and branch numbers.

Graphical Menu 8-21
Toolbar The toolbar on the left of the window allows the designer to move the invert level of the manholes up or down. There are also four zoom buttons for zoom functions in the graphical display. (Zoom Window, Zoom In, Zoom Out and Zoom All)
Display The designer can select the detail options that he want displayed in the legend at the bottom of the graphical presentation of the vertical alignment.
Select Change the Subnetwork and Branch numbers to view the vertical alignment of different sections of the network.

8-22 Sewer Reference
Notes:
Settings Menu 9-1
Settings Menu
The Settings Menu allows you to specify the index order of the input data or results views, rebuild the database index, specify the DTM surfaces from which to extract cover and other levels, and change the display settings.
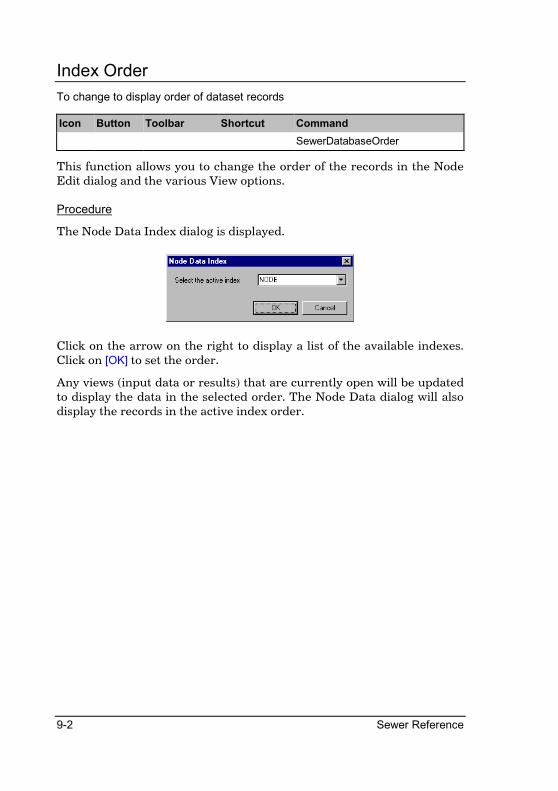
9-2 Sewer Reference
Index Order
To change to display order of dataset records
Icon Button Toolbar Shortcut Command
SewerDatabaseOrder
This function allows you to change the order of the records in the Node Edit dialog and the various View options.
Procedure
The Node Data Index dialog is displayed.
Click on the arrow on the right to display a list of the available indexes. Click on [OK] to set the order.
Any views (input data or results) that are currently open will be updated to display the data in the selected order. The Node Data dialog will also display the records in the active index order.
Settings Menu 9-3
Rebuild Index
To re-create the index files
Icon Button Toolbar Shortcut Command
SewerReIndex
This function rebuilds the database index and re-calculates the geographic index for each node and link.
You may sometimes have to run this function if the data is not being displayed correctly or if the Zoom ► All function is not displaying the entire network.
Procedure
The index will be rebuilt and the display refreshed to the extents of the network data.
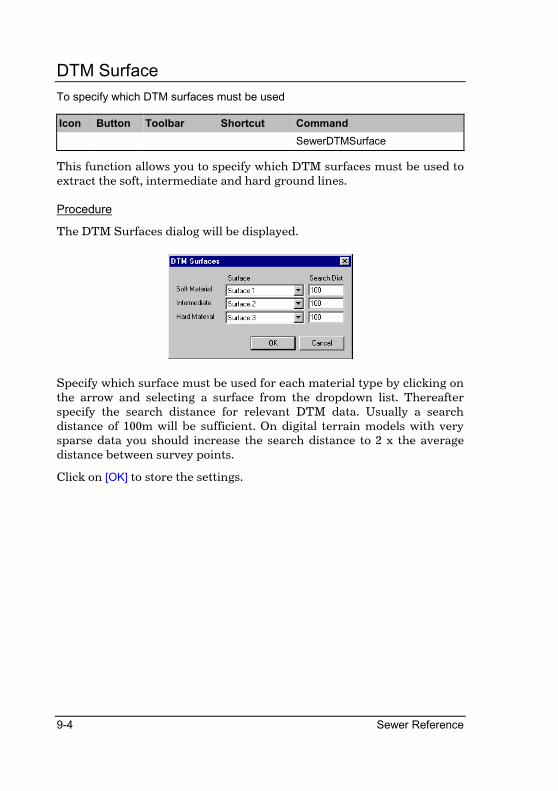
9-4 Sewer Reference
DTM Surface
To specify which DTM surfaces must be used
Icon Button Toolbar Shortcut Command
SewerDTMSurface
This function allows you to specify which DTM surfaces must be used to extract the soft, intermediate and hard ground lines.
Procedure
The DTM Surfaces dialog will be displayed.
Specify which surface must be used for each material type by clicking on the arrow and selecting a surface from the dropdown list. Thereafter specify the search distance for relevant DTM data. Usually a search distance of 100m will be sufficient. On digital terrain models with very sparse data you should increase the search distance to 2 x the average distance between survey points.
Click on [OK] to store the settings.
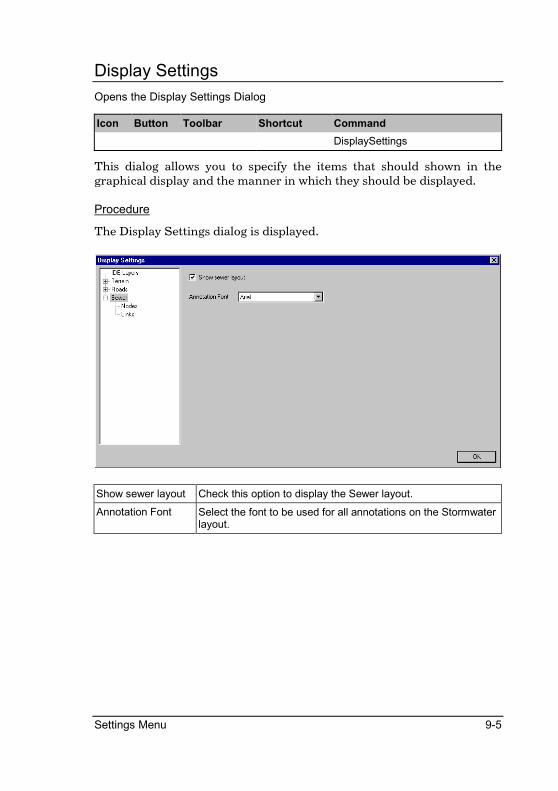
Settings Menu 9-5
Display Settings
Opens the Display Settings Dialog
Icon Button Toolbar Shortcut Command
DisplaySettings
This dialog allows you to specify the items that should shown in the graphical display and the manner in which they should be displayed.
Procedure
The Display Settings dialog is displayed.
Show sewer layout Check this option to display the Sewer layout.
Annotation Font Select the font to be used for all annotations on the Stormwater layout.
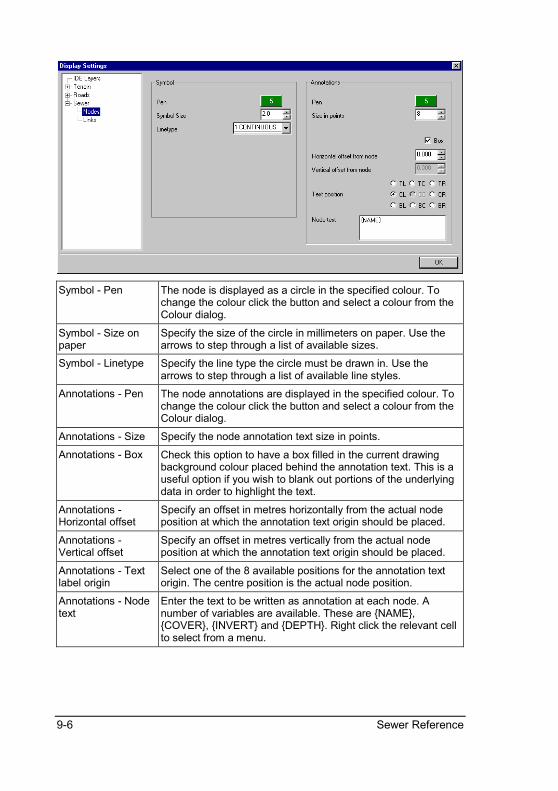
9-6 Sewer Reference
Symbol - Pen The node is displayed as a circle in the specified colour. To change the colour click the button and select a colour from the Colour dialog.
Symbol - Size on paper
Specify the size of the circle in millimeters on paper. Use the arrows to step through a list of available sizes.
Symbol - Linetype Specify the line type the circle must be drawn in. Use the arrows to step through a list of available line styles.
Annotations - Pen The node annotations are displayed in the specified colour. To change the colour click the button and select a colour from the Colour dialog.
Annotations - Size Specify the node annotation text size in points.
Annotations - Box Check this option to have a box filled in the current drawing background colour placed behind the annotation text. This is a useful option if you wish to blank out portions of the underlying data in order to highlight the text.
Annotations - Horizontal offset
Specify an offset in metres horizontally from the actual node position at which the annotation text origin should be placed.
Annotations - Vertical offset
Specify an offset in metres vertically from the actual node position at which the annotation text origin should be placed.
Annotations - Text label origin
Select one of the 8 available positions for the annotation text origin. The centre position is the actual node position.
Annotations - Node text
Enter the text to be written as annotation at each node. A number of variables are available. These are {NAME}, {COVER}, {INVERT} and {DEPTH}. Right click the relevant cell to select from a menu.
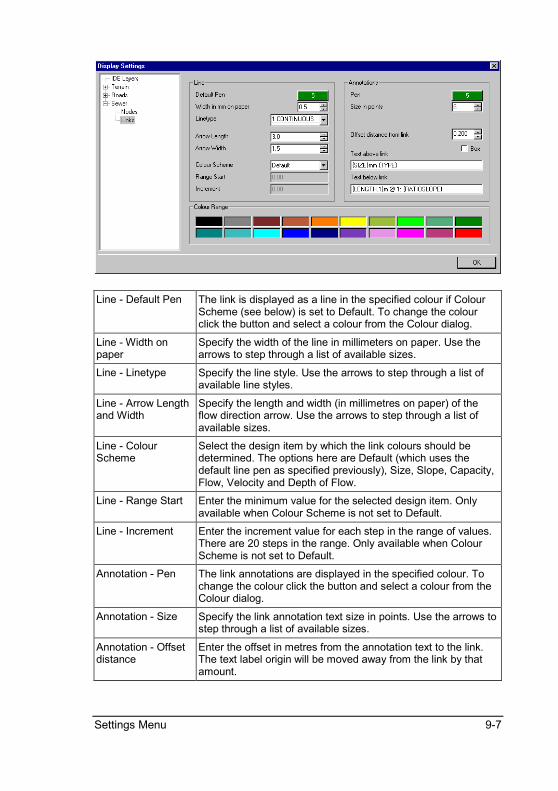
Settings Menu 9-7
Line - Default Pen The link is displayed as a line in the specified colour if Colour Scheme (see below) is set to Default. To change the colour click the button and select a colour from the Colour dialog.
Line - Width on paper
Specify the width of the line in millimeters on paper. Use the arrows to step through a list of available sizes.
Line - Linetype Specify the line style. Use the arrows to step through a list of available line styles.
Line - Arrow Length and Width
Specify the length and width (in millimetres on paper) of the flow direction arrow. Use the arrows to step through a list of available sizes.
Line - Colour Scheme
Select the design item by which the link colours should be determined. The options here are Default (which uses the default line pen as specified previously), Size, Slope, Capacity, Flow, Velocity and Depth of Flow.
Line - Range Start Enter the minimum value for the selected design item. Only available when Colour Scheme is not set to Default.
Line - Increment Enter the increment value for each step in the range of values. There are 20 steps in the range. Only available when Colour Scheme is not set to Default.
Annotation - Pen The link annotations are displayed in the specified colour. To change the colour click the button and select a colour from the Colour dialog.
Annotation - Size Specify the link annotation text size in points. Use the arrows to step through a list of available sizes.
Annotation - Offset distance
Enter the offset in metres from the annotation text to the link. The text label origin will be moved away from the link by that amount.
9-8 Sewer Reference
Annotation - Box Check this option to have a box filled in the current drawing background colour placed behind the annotation text. This is a useful option if you wish to blank out portions of the underlying data in order to highlight the text.
Annotation - Text above and below link
Enter the text to be written as annotation for each link. A number of variables are available. These are {SIZE}, {TYPE}, {LENGTH}, {BEDDING}, {SLOPE}, {RATIOSLOPE}, {FLOW}, {CAPACITY}, {VELOCITY}, {DEPTH}, {FIXEDSIZE}, {FIXEDSLOPE} and {FIXEDRATIOSLOPE}. Right click the relevant cell to select from a menu. You may also define the number of decimals for numeric items. For example, an item "{LENGTH.1}" will display the length of the link to 1 decimal. The default display is 3 decimals.
Colour Range Click the relevant button to change the colour assigned to that particular range item.
Fill in the relevant data and click the [OK] button to continue.
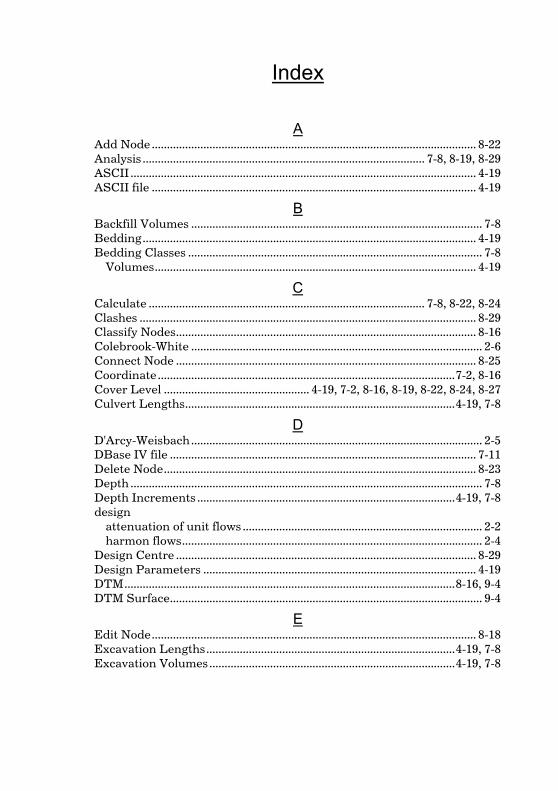
Index
A Add Node........................................................................................................... 8-22 Analysis ............................................................................................. 7-8, 8-19, 8-29 ASCII .................................................................................................................. 4-19 ASCII file ........................................................................................................... 4-19
B Backfill Volumes ................................................................................................ 7-8 Bedding.............................................................................................................. 4-19 Bedding Classes ................................................................................................. 7-8 Volumes.......................................................................................................... 4-19
C Calculate ........................................................................................... 7-8, 8-22, 8-24 Clashes ............................................................................................................... 8-29 Classify Nodes................................................................................................... 8-16 Colebrook-White ................................................................................................ 2-6 Connect Node ................................................................................................... 8-25 Coordinate..................................................................................................7-2, 8-16 Cover Level ................................................ 4-19, 7-2, 8-16, 8-19, 8-22, 8-24, 8-27 Culvert Lengths.........................................................................................4-19, 7-8
D D'Arcy-Weisbach................................................................................................ 2-5 DBase IV file ..................................................................................................... 7-11 Delete Node....................................................................................................... 8-23 Depth .................................................................................................................... 7-8 Depth Increments .....................................................................................4-19, 7-8 design attenuation of unit flows ............................................................................... 2-2 harmon flows................................................................................................... 2-4
Design Centre ................................................................................................... 8-29 Design Parameters .......................................................................................... 4-19 DTM.............................................................................................................8-16, 9-4 DTM Surface....................................................................................................... 9-4
E Edit Node........................................................................................................... 8-18 Excavation Lengths..................................................................................4-19, 7-8 Excavation Volumes.................................................................................4-19, 7-8
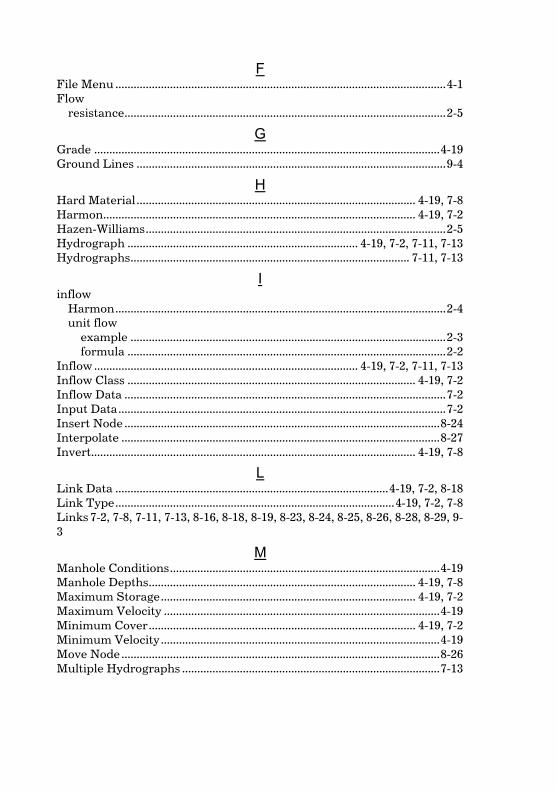
F File Menu .............................................................................................................4-1 Flow resistance..........................................................................................................2-5
G Grade ..................................................................................................................4-19 Ground Lines ......................................................................................................9-4
H Hard Material............................................................................................ 4-19, 7-8 Harmon....................................................................................................... 4-19, 7-2 Hazen-Williams...................................................................................................2-5 Hydrograph ............................................................................ 4-19, 7-2, 7-11, 7-13 Hydrographs............................................................................................ 7-11, 7-13
I inflow Harmon.............................................................................................................2-4 unit flow example ........................................................................................................2-3 formula .........................................................................................................2-2
Inflow ....................................................................................... 4-19, 7-2, 7-11, 7-13 Inflow Class ............................................................................................... 4-19, 7-2 Inflow Data ..........................................................................................................7-2 Input Data............................................................................................................7-2 Insert Node ........................................................................................................8-24 Interpolate .........................................................................................................8-27 Invert........................................................................................................... 4-19, 7-8
L Link Data ..........................................................................................4-19, 7-2, 8-18 Link Type............................................................................................4-19, 7-2, 7-8 Links7-2, 7-8, 7-11, 7-13, 8-16, 8-18, 8-19, 8-23, 8-24, 8-25, 8-26, 8-28, 8-29, 9-3
M Manhole Conditions.........................................................................................4-19 Manhole Depths........................................................................................ 4-19, 7-8 Maximum Storage.................................................................................... 4-19, 7-2 Maximum Velocity ...........................................................................................4-19 Minimum Cover........................................................................................ 4-19, 7-2 Minimum Velocity............................................................................................4-19 Move Node.........................................................................................................8-26 Multiple Hydrographs .....................................................................................7-13
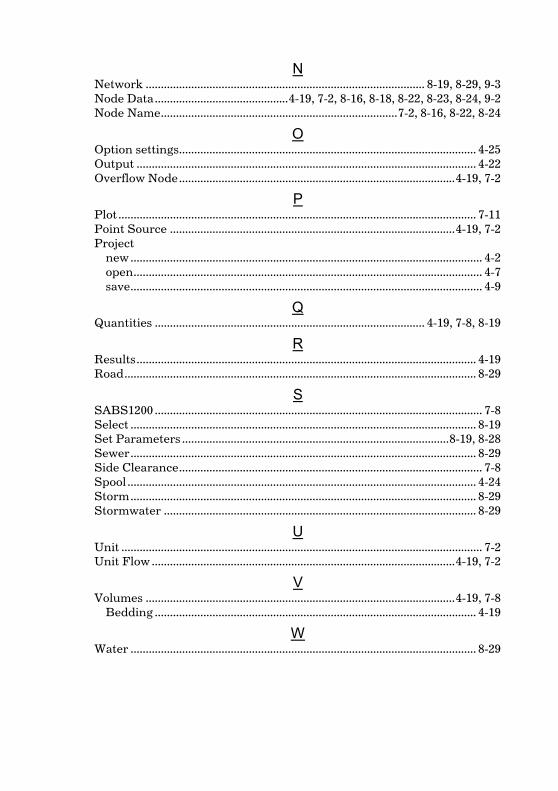
N Network ............................................................................................ 8-19, 8-29, 9-3 Node Data............................................4-19, 7-2, 8-16, 8-18, 8-22, 8-23, 8-24, 9-2 Node Name..............................................................................7-2, 8-16, 8-22, 8-24
O Option settings.................................................................................................. 4-25 Output ................................................................................................................ 4-22 Overflow Node...........................................................................................4-19, 7-2
P Plot ...................................................................................................................... 7-11 Point Source ..............................................................................................4-19, 7-2 Project new.................................................................................................................... 4-2 open................................................................................................................... 4-7 save.................................................................................................................... 4-9
Q Quantities ......................................................................................... 4-19, 7-8, 8-19
R Results................................................................................................................ 4-19 Road.................................................................................................................... 8-29
S SABS1200 ............................................................................................................ 7-8 Select .................................................................................................................. 8-19 Set Parameters ........................................................................................8-19, 8-28 Sewer.................................................................................................................. 8-29 Side Clearance.................................................................................................... 7-8 Spool ................................................................................................................... 4-24 Storm.................................................................................................................. 8-29 Stormwater ....................................................................................................... 8-29
U Unit ....................................................................................................................... 7-2 Unit Flow ....................................................................................................4-19, 7-2
V Volumes ......................................................................................................4-19, 7-8 Bedding .......................................................................................................... 4-19
W Water .................................................................................................................. 8-29