Embed Size (px)
Citation preview
PEMSEA/Manuscript Series/2006/03
L A O S
Sewerage Planning and
Wastewater Treatment for
Sabang, Puerto Galera
GEF/UNDP/IMO Regional Programme on Partnerships in Environmental Management for the Seas of East Asia
SEWERAGE PLANNING AND WASTEWATER TREATMENT FOR
SABANG, PUERTO GALERA
28 August 2006
This online document is made available as a free public service for environmental managers, researchers and institutions and anyone may view the information contained therein without any obligation to PEMSEA, unless otherwise stated. This online document may be reproduced in whole or in part and in any form for educational or non-profit purposes or to provide wider dissemination for public response, provided acknowledgment of the source is made and no commercial usage or sale of the material occurs. PEMSEA would appreciate receiving a copy of any publication that uses this document as a source. The use of this document for any purpose other than those given above must be agreed to in writing between PEMSEA and the requesting party. PEMSEA makes no express or implied warranty nor assumes responsibility in the use of this document or its contents for its accuracy, completeness, currency, or its use for any purpose. PEMSEA. 2006. “Sewerage Planning and Wastewater Treatment for Sabang, Puerto Galera.”
PEMSEA Manuscript Series No. 3. Global Environment Facility/United Nations Development Programme/International Maritime Organization Regional Programme on Building Partnerships in Environmental Management for the Seas of East Asia (PEMSEA), Quezon City, Philippines. www.pemsea.org. Unpublished.
This document was prepared by Gerardo F. Parco and Alan Guintibano
in fulfillment of a contract with PEMSEA.
A GEF Project Implemented by UNDP and Executed by IMO
The contents of this publication do not necessarily reflect the views or policies of the Global Environment Facility (GEF), the United Nations Development Programme (UNDP), the International Maritime Organization (IMO), and the other participating organizations. The designation employed and the presentation do not imply expression of opinion, whatsoever on the part of GEF, UNDP, IMO, or the Regional Programme on Building Partnerships in Environmental Management for the Seas of East Asia (PEMSEA) concerning the legal status of any country or territory, or its authority or concerning the delimitation of its territory or boundaries.
1
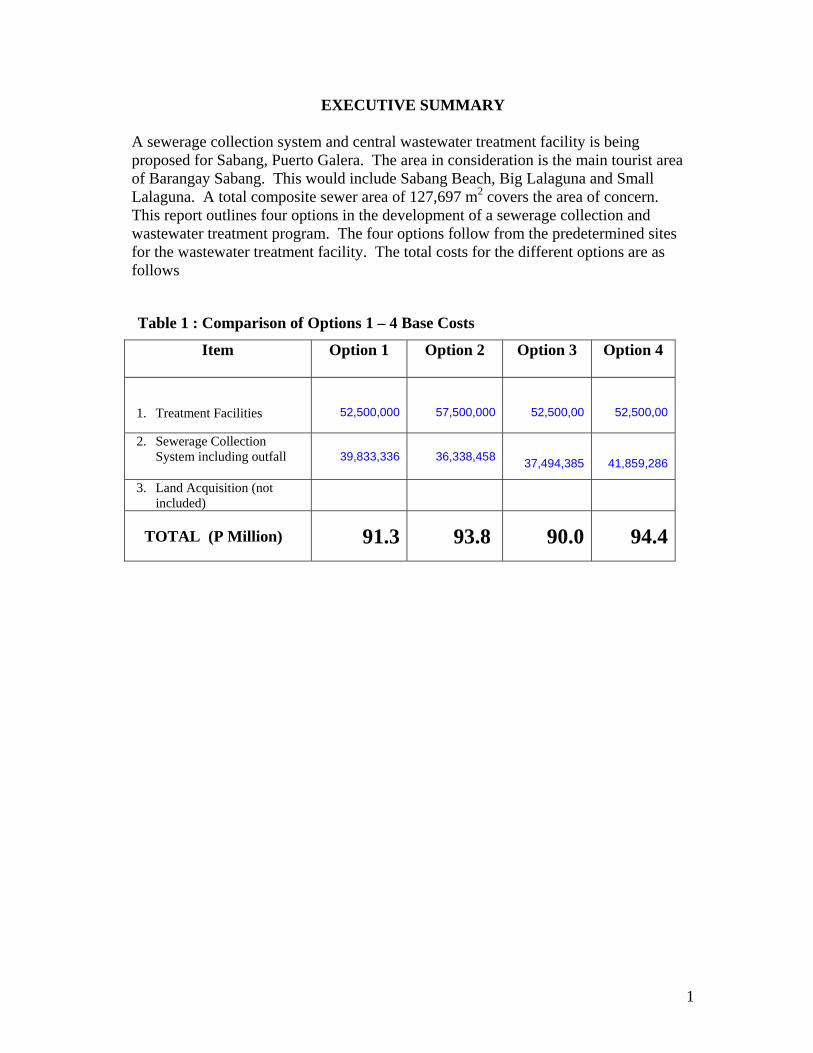
EXECUTIVE SUMMARY A sewerage collection system and central wastewater treatment facility is being proposed for Sabang, Puerto Galera. The area in consideration is the main tourist area of Barangay Sabang. This would include Sabang Beach, Big Lalaguna and Small Lalaguna. A total composite sewer area of 127,697 m2 covers the area of concern. This report outlines four options in the development of a sewerage collection and wastewater treatment program. The four options follow from the predetermined sites for the wastewater treatment facility. The total costs for the different options are as follows
Table 1 : Comparison of Options 1 – 4 Base Costs
Item Option 1 Option 2
Option 3 Option 4
1. Treatment Facilities
52,500,000
57,500,000
52,500,00
52,500,00
2. Sewerage Collection System including outfall
39,833,336
36,338,458 37,494,385 41,859,286
3. Land Acquisition (not included)
TOTAL (P Million) 91.3 93.8 90.0 94.4
2
INTRODUCTION This report details the preliminary costing of the sewerage collection system and wastewater treatment facility for Sabang, Puerto Galera. The details presented herein will serve as the basis for the pre-feasibility study and bidding documents to be prepared in the next phase of the project. The actual design of the sewerage collection system and wastewater treatment facility will be determined by the individual bidders in the course of their study on the most cost effective and efficient system for the area. Since sewerage planning follows the general contour and topography of the land, the route and pipe sizes for the collection system will not vary much from the schemes proposed in this report. The different sewerage pipe routing, follows the most cost effective paths as determined by the author of this report. There will be more latitude in the options available for the centralized wastewater treatment systems. For purposes of costing, sequencing batch reactor system is proposed. Benchmark costs for wastewater treatment systems in the Philippines will be used as the basis for the costs. SITE CHARACTERISTICS SABANG, PUERTO GALERA Sabang is one of the 13 barangays in the municipality of Puerto Galera. It is located at the northern tip of a promontory that juts out from Mainland Mindoro. White sandy beaches and proximity to dive sites has propelled this area as a prime tourist destination. Among the barangays in Puerto Galera, Sabang has developed quite extensively in terms of hotel and guest infrastructure. These are the site data for Sabang Table 2. Sabang Data Total Area 4.8 km2
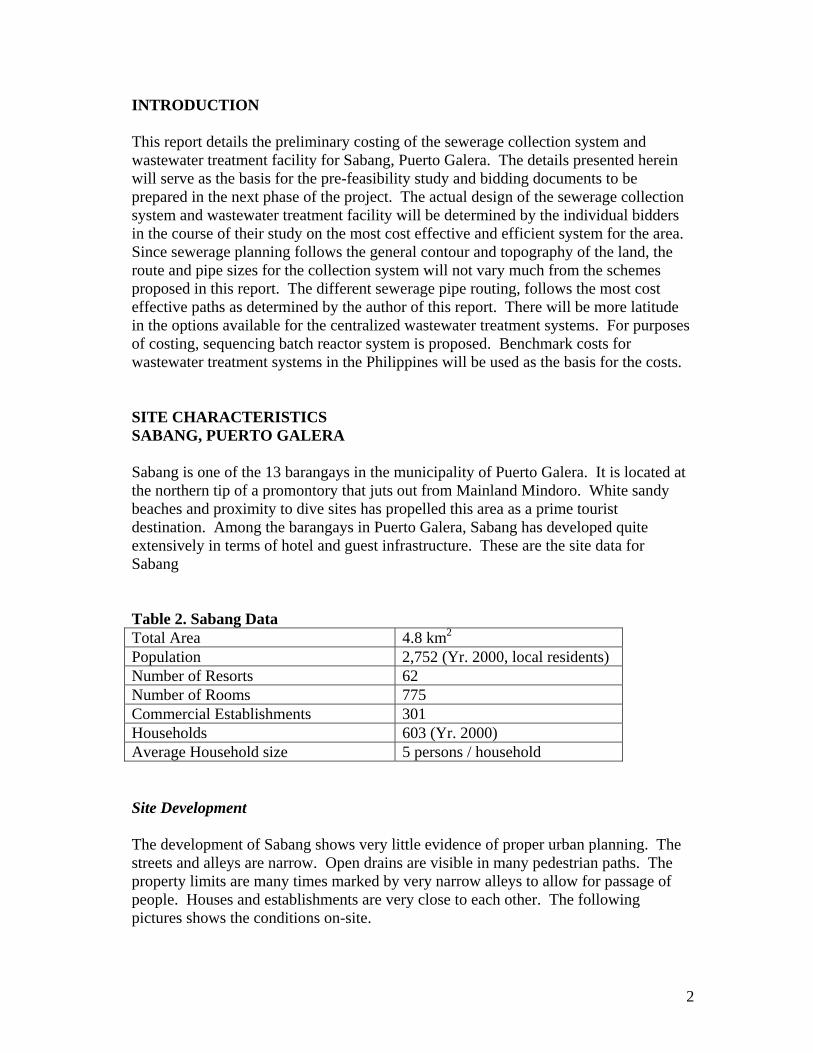
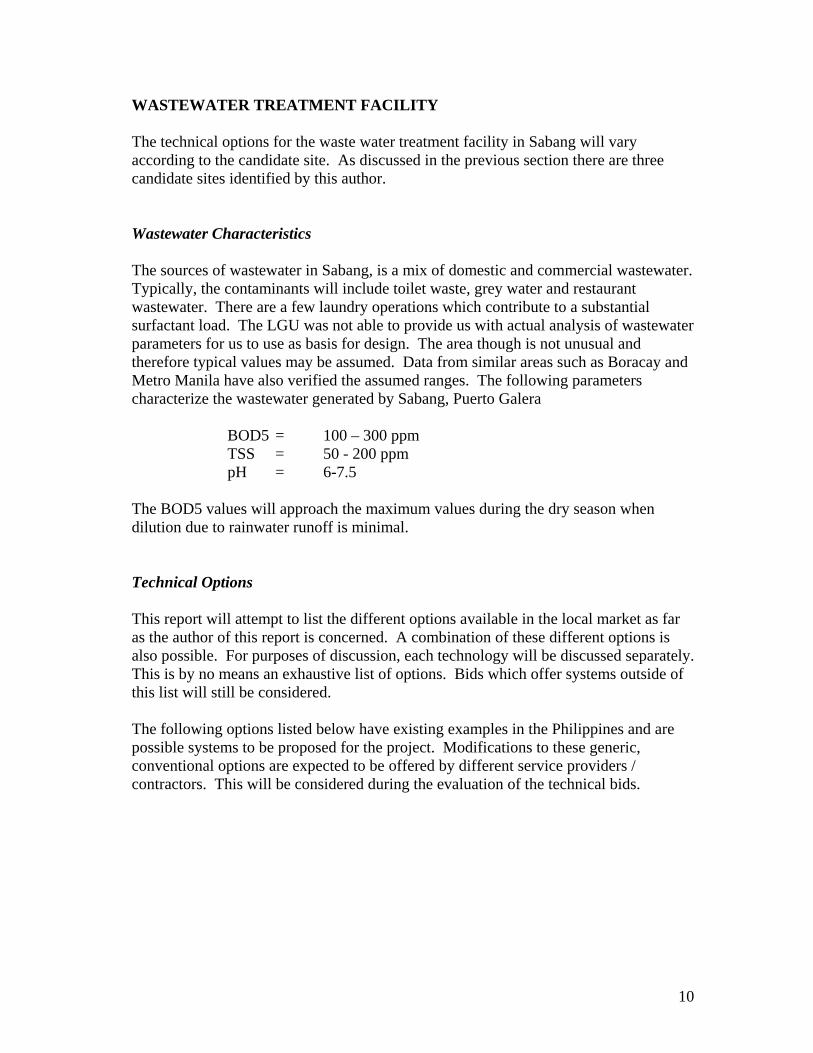
Population 2,752 (Yr. 2000, local residents) Number of Resorts 62 Number of Rooms 775 Commercial Establishments 301 Households 603 (Yr. 2000) Average Household size 5 persons / household Site Development The development of Sabang shows very little evidence of proper urban planning. The streets and alleys are narrow. Open drains are visible in many pedestrian paths. The property limits are many times marked by very narrow alleys to allow for passage of people. Houses and establishments are very close to each other. The following pictures shows the conditions on-site.
3
Figure 1. Public pedestrian pathways following property lines. The haphazard manner of development in the area has led to cramp conditions in Sabang area. Conditions are not as congested in Big Lalaguna and Small Lalaguna but similar conditions also exist in pocket areas in these areas. Wastewater projection Volumetric Flowrate is the most significant parameter in the design of the sewerage collection system. Wastewater engineering design gives a general, technical criteria for flow velocity to avoid the build-up of sediments:
Flow velocity > 0.6 m/sec
Maintaining this velocity within the sewer collection system will keep the pipes free from solid deposits. Slope of the pipe is the main determinant of velocity and will figure in the design of pipe layout.
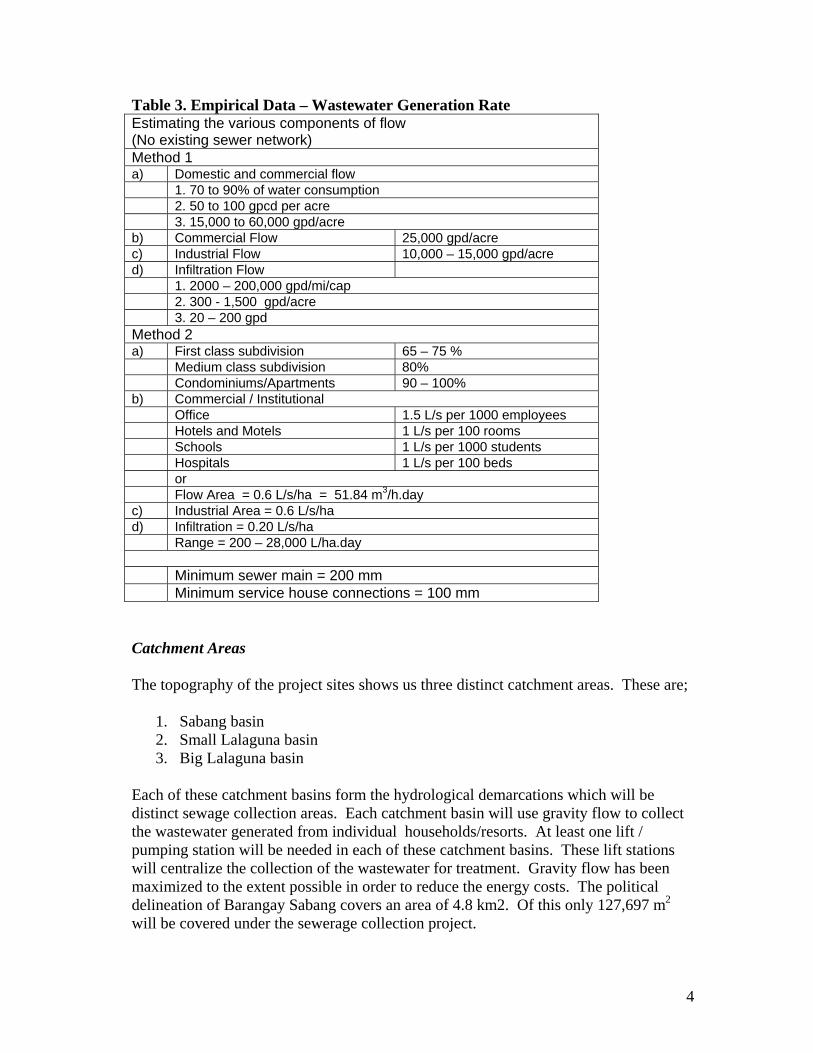
In actual design, empirical values are used in the design of the sewer collection system. Pipe size is determined by volumetric flowrate. This flowrate is determined from a study of the sources. The following table gives the different empirical parameters used in determining volumetric flowrate as gathered from different sources, and as used in the Philippines.
4
Table 3. Empirical Data – Wastewater Generation Rate Estimating the various components of flow (No existing sewer network) Method 1 a) Domestic and commercial flow 1. 70 to 90% of water consumption 2. 50 to 100 gpcd per acre 3. 15,000 to 60,000 gpd/acre b) Commercial Flow 25,000 gpd/acre c) Industrial Flow 10,000 – 15,000 gpd/acre d) Infiltration Flow 1. 2000 – 200,000 gpd/mi/cap 2. 300 - 1,500 gpd/acre 3. 20 – 200 gpd Method 2 a) First class subdivision 65 – 75 % Medium class subdivision 80% Condominiums/Apartments 90 – 100% b) Commercial / Institutional Office 1.5 L/s per 1000 employees Hotels and Motels 1 L/s per 100 rooms Schools 1 L/s per 1000 students Hospitals 1 L/s per 100 beds or Flow Area = 0.6 L/s/ha = 51.84 m3/h.day c) Industrial Area = 0.6 L/s/ha d) Infiltration = 0.20 L/s/ha Range = 200 – 28,000 L/ha.day Minimum sewer main = 200 mm Minimum service house connections = 100 mm Catchment Areas The topography of the project sites shows us three distinct catchment areas. These are;
1. Sabang basin 2. Small Lalaguna basin 3. Big Lalaguna basin
Each of these catchment basins form the hydrological demarcations which will be distinct sewage collection areas. Each catchment basin will use gravity flow to collect the wastewater generated from individual households/resorts. At least one lift / pumping station will be needed in each of these catchment basins. These lift stations will centralize the collection of the wastewater for treatment. Gravity flow has been maximized to the extent possible in order to reduce the energy costs. The political delineation of Barangay Sabang covers an area of 4.8 km2. Of this only 127,697 m2
will be covered under the sewerage collection project.
5
Soil characteristics The geology of the area shows a distinct metamorphic structure which is amenable to excavation. Several resorts along Sabang have employed excavation of the mountainside to provide more area for their structures. This is evident in the excavation work done in Adam’s resort located in the border of Big and Small Lalaguna. This has revealed a consistent homogenous consistency of the underlying rock. Placement and embedding of sewage collection pipes will be easier with such a soil structure. DESIGN PARAMETERS The following parameters are the basis for the design of the sewerage collection system and the wastewater treatment plant specifications. Topography – determination of the catchment areas is an important first step in the design of the sewerage collection system. Flow by gravity needs to be maximized to reduce operating costs. Volumetric Flowrate – In order to determine volumetric flowrate, the following data are needed: number of households, number of guest rooms, per capita water useage. In this report, the area method was seen to give a more conservative estimate of flow. In the case of sewer design, conservative is taken to mean, the higher approximation of flow. Therefore, this was used as the method of choice in determining the volumetric flowrate. Cost effectiveness – The system has to be done at the least cost but at the same time still has to be effective in its intended function. In this case the sewerage collection system needs to comprehensively collect the contaminated water and the wastewater treatment facility needs to effectively remove the contaminants. Type of Wastewater – The area in consideration is characterized as mixed domestic / commercial. In wastewater engineering, this translates to a definite range of contaminant concentrations. Values will not vary much from this range.
6
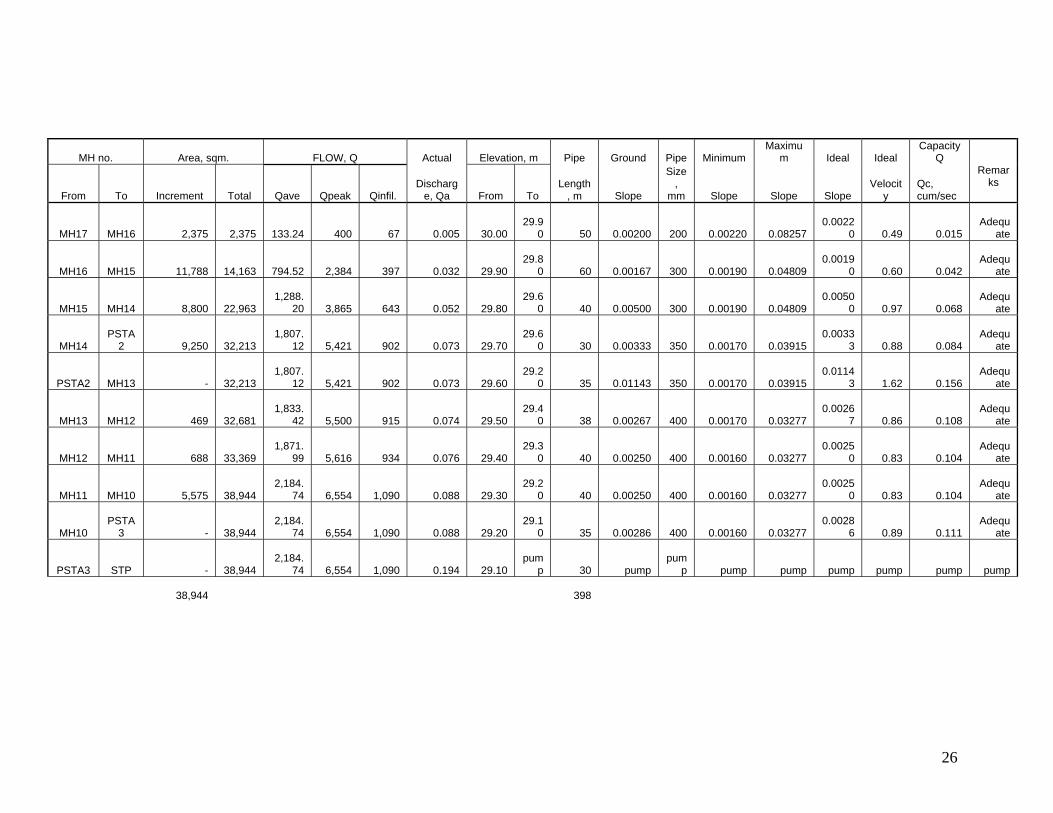
DETEMINATION OF VOLUMETRIC FLOWRATE The volumetric flowrate will determine the capacities of the wastewater treatment plant and the sewerage collection system. A 20 year design life of the system was used as a basis for design. For designing the capacity of the wastewater treatment facility, current wastewater flowrate will be estimated from sources. The table below shows the calculation for current wastewater flow. Table 4. Current Wastewater Volumetric Flowrate Source persons Wastewater li 1. 850 households x 5 pax per household
(120 li/cap.d) 4250 510,000
2. 800 guest rooms x 5 pax per room
(200 li/cap.d) 4000 800,000
3. 800 guest rooms
1 resort employee per guest room (120 li/cap.d)
800 96,000
4. 269 Non-resort establishments
5 employees / establishment (120 li/cap.d)
1345 161,400
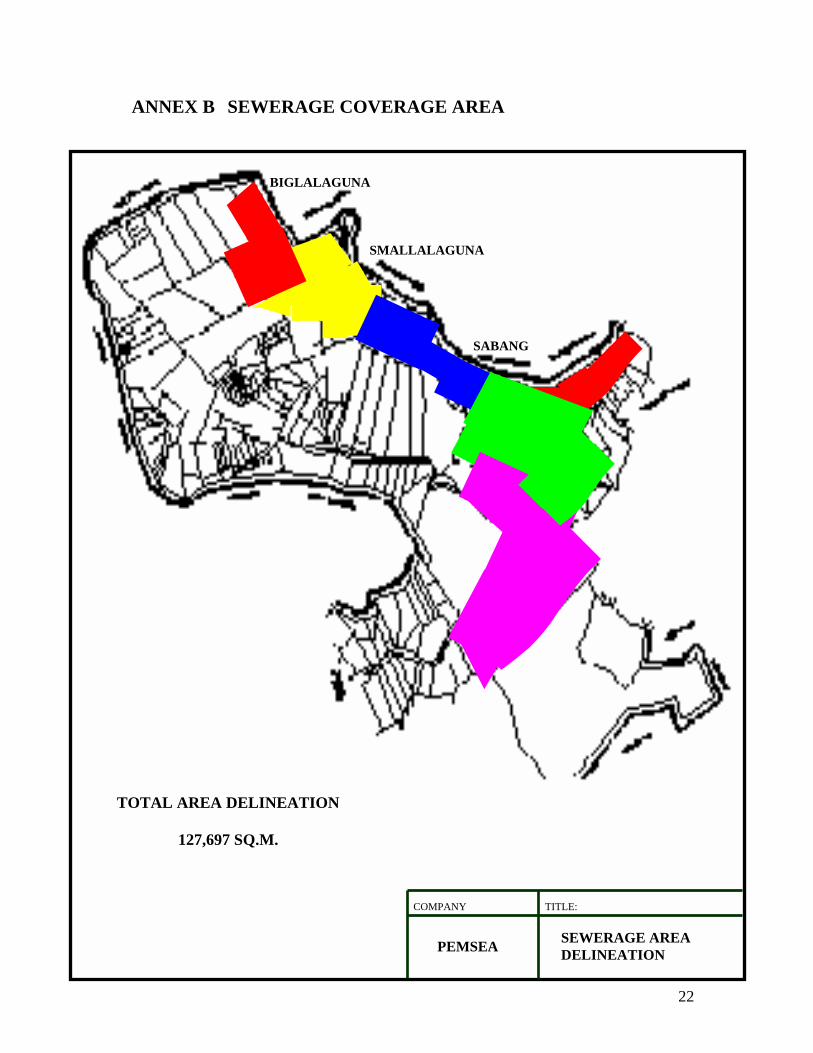
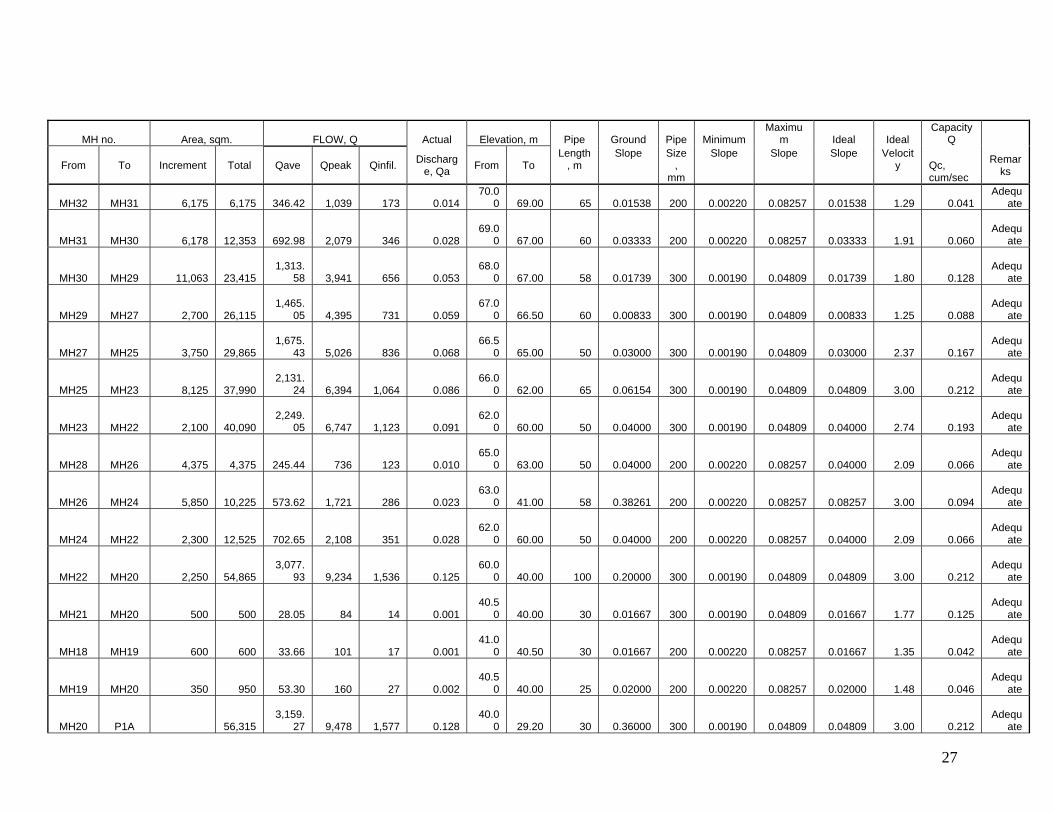
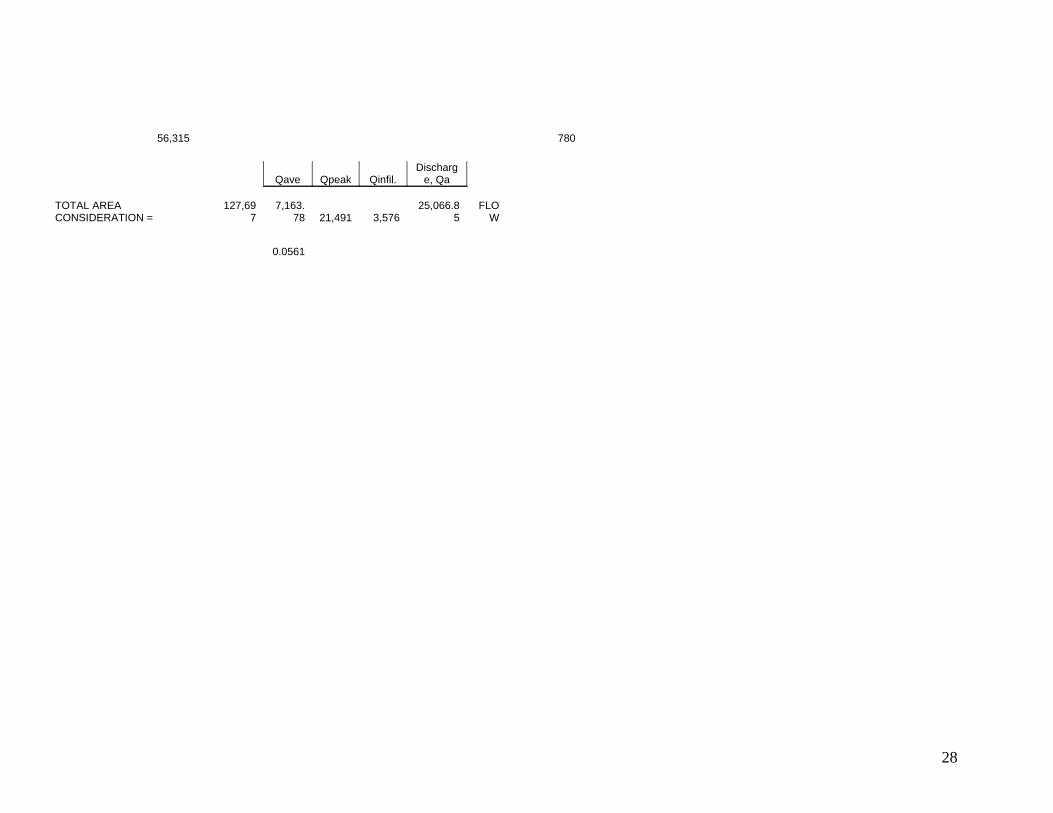
Sub Total 1,567.4 m3/day Infiltration X 2 TOTAL 3,134.8 m3/day A volumetric flowrate of 3500 m3/day will be used as basis for design of the wastewater treatment facility. The per capita wastewater generation are taken from benchmark figures for Metro Manila. For the sizing of the sewerage collection system, a 20 year design period will be used.The area method was used in the calculation of the maximum wastewater to be generated. Please refer to Annex D for the detailed calculations. Given the total area of the catchment area, and assuming full development of this area, the ultimate value for wastewater generation can be estimated. Annex B shows the total catchment area. Total area is computed to be 127,697 m2. Using the maximum benchmark figure for flow from domestic and commercial sources of 60,000 gpd/acre, a 20 year maximum wastewater flow of 7,163 m3 /day average flow. This figure will be used in the design of the sewerage collection system.
7
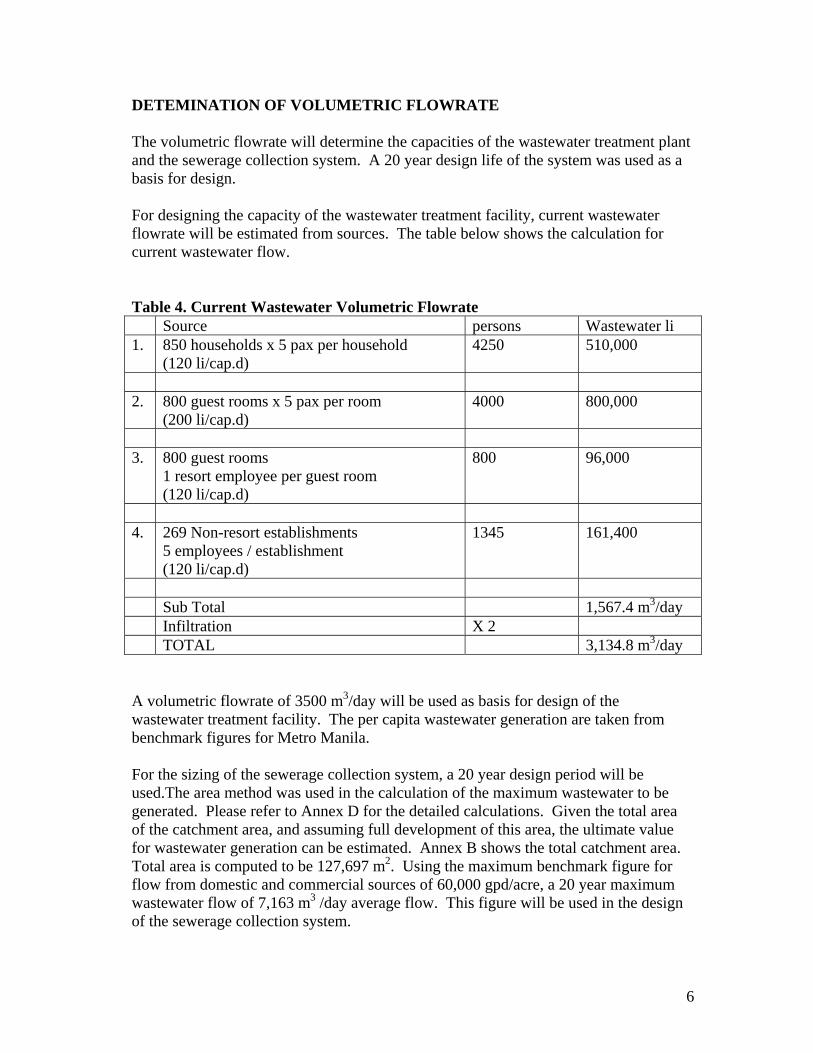
POSSIBLE SITES FOR WASTEWATER TREATMENT SYSTEM Determination of candidate sites was an important initial activity in the study. The LGU accompanied the author to do a site survey of available idle land in the area. The sewerage collection plan and therefore costs all proceed from this information. Based on a survey of the area, four candidate sites for the wastewater treatment facility were identified. Option 1 – Ridge top Small Lalaguna Option 2 - Cliffside of possible reclamation area is Small Lalaguna Option 3 - Empty lot behind Small Lalaguna Option 4 – Behind Big Lalaguna
Figure 1. Map of Sabang showing possible areas for site of wastewater treatment facility Option 1 and Option 3 – Empty lot behind Small Lalaguna. This site presents another option for locating a compact wastewater treatment facility. As seen in the picture, the
Swamp Behind Big Lalaguna
Vacant Lot Behind Small Lalaguna
Cliff side Reclamation
8
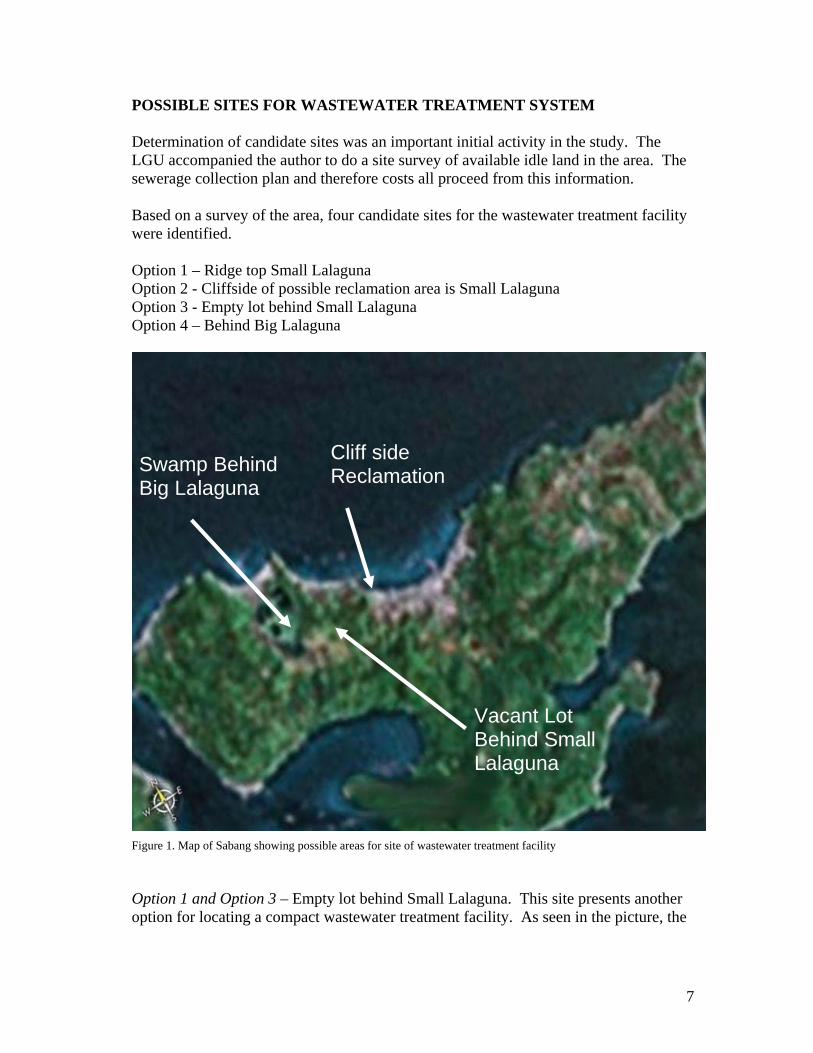
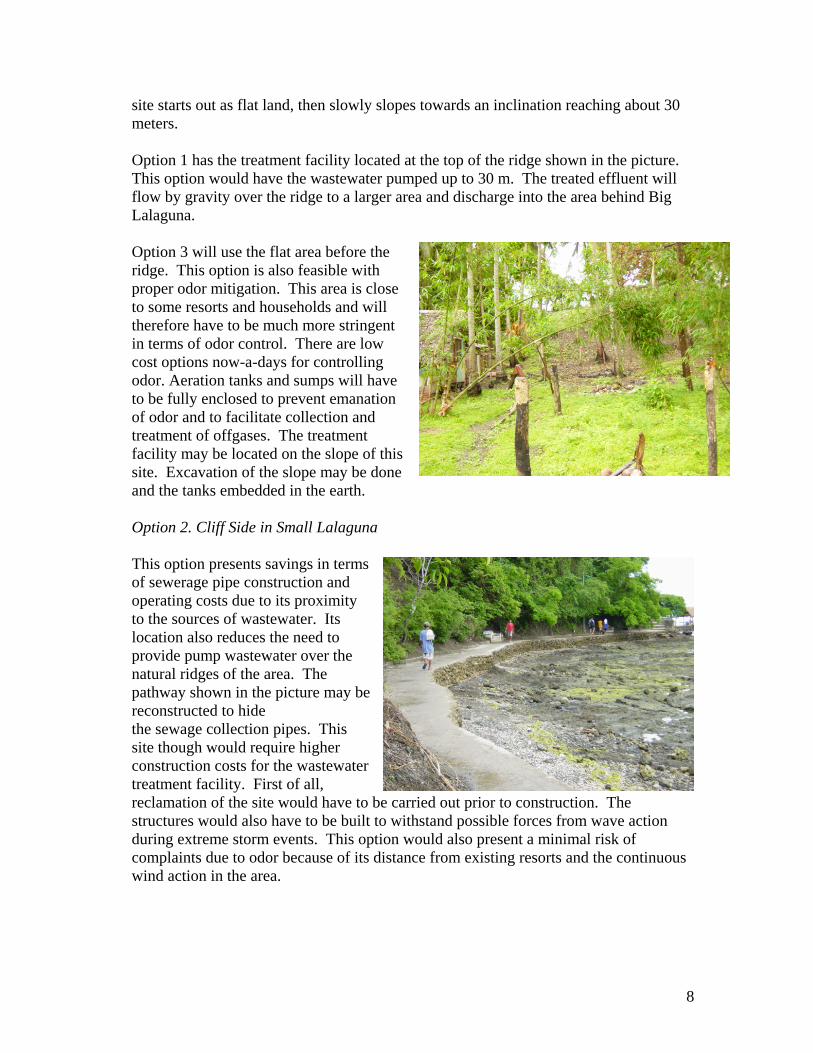
site starts out as flat land, then slowly slopes towards an inclination reaching about 30 meters. Option 1 has the treatment facility located at the top of the ridge shown in the picture. This option would have the wastewater pumped up to 30 m. The treated effluent will flow by gravity over the ridge to a larger area and discharge into the area behind Big Lalaguna. Option 3 will use the flat area before the ridge. This option is also feasible with proper odor mitigation. This area is close to some resorts and households and will therefore have to be much more stringent in terms of odor control. There are low cost options now-a-days for controlling odor. Aeration tanks and sumps will have to be fully enclosed to prevent emanation of odor and to facilitate collection and treatment of offgases. The treatment facility may be located on the slope of this site. Excavation of the slope may be done and the tanks embedded in the earth. Option 2. Cliff Side in Small Lalaguna This option presents savings in terms of sewerage pipe construction and operating costs due to its proximity to the sources of wastewater. Its location also reduces the need to provide pump wastewater over the natural ridges of the area. The pathway shown in the picture may be reconstructed to hide the sewage collection pipes. This site though would require higher construction costs for the wastewater treatment facility. First of all, reclamation of the site would have to be carried out prior to construction. The structures would also have to be built to withstand possible forces from wave action during extreme storm events. This option would also present a minimal risk of complaints due to odor because of its distance from existing resorts and the continuous wind action in the area.
9
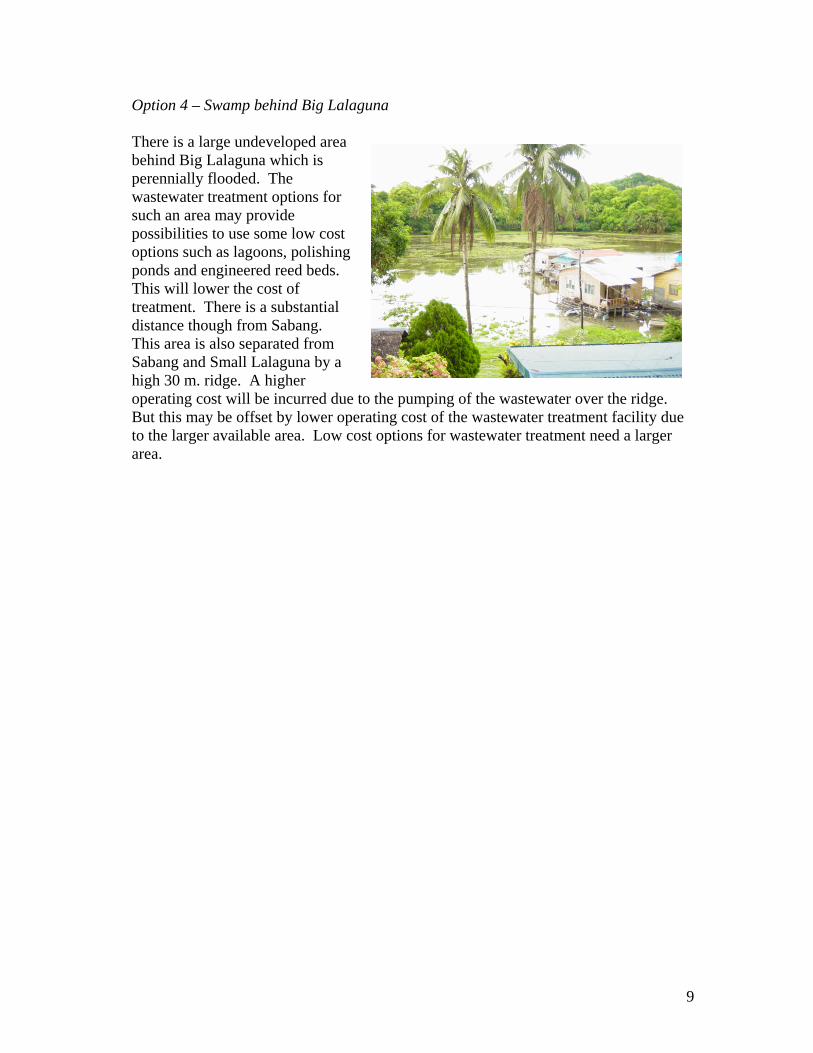
Option 4 – Swamp behind Big Lalaguna There is a large undeveloped area behind Big Lalaguna which is perennially flooded. The wastewater treatment options for such an area may provide possibilities to use some low cost options such as lagoons, polishing ponds and engineered reed beds. This will lower the cost of treatment. There is a substantial distance though from Sabang. This area is also separated from Sabang and Small Lalaguna by a high 30 m. ridge. A higher operating cost will be incurred due to the pumping of the wastewater over the ridge. But this may be offset by lower operating cost of the wastewater treatment facility due to the larger available area. Low cost options for wastewater treatment need a larger area.
10
WASTEWATER TREATMENT FACILITY The technical options for the waste water treatment facility in Sabang will vary according to the candidate site. As discussed in the previous section there are three candidate sites identified by this author. Wastewater Characteristics The sources of wastewater in Sabang, is a mix of domestic and commercial wastewater. Typically, the contaminants will include toilet waste, grey water and restaurant wastewater. There are a few laundry operations which contribute to a substantial surfactant load. The LGU was not able to provide us with actual analysis of wastewater parameters for us to use as basis for design. The area though is not unusual and therefore typical values may be assumed. Data from similar areas such as Boracay and Metro Manila have also verified the assumed ranges. The following parameters characterize the wastewater generated by Sabang, Puerto Galera
BOD5 = 100 – 300 ppm TSS = 50 - 200 ppm pH = 6-7.5
The BOD5 values will approach the maximum values during the dry season when dilution due to rainwater runoff is minimal. Technical Options This report will attempt to list the different options available in the local market as far as the author of this report is concerned. A combination of these different options is also possible. For purposes of discussion, each technology will be discussed separately. This is by no means an exhaustive list of options. Bids which offer systems outside of this list will still be considered. The following options listed below have existing examples in the Philippines and are possible systems to be proposed for the project. Modifications to these generic, conventional options are expected to be offered by different service providers / contractors. This will be considered during the evaluation of the technical bids.
11
Table 5. Wastewater Treatment Technologies in the Philippines 1. Activated Sludge System An aerobic flocculent sludge slurry system with many example in the Philippines. Occupies more area than the newer systems derived from Activated Sludge. Examples existing in the Philippines are Makati Sewage Treatment Plant and UP central wastewater treatment facility. The conventional system typically has an 8 – 10 hour aeration time. The extended aeration version of this system may have 20-24 hour hydraulic retention time. Facilities for returning sludge to the aeration system are an integral part of this system. 2. Batch-wise or Semi batch-wise processes Under this system are a number of processes, the most popular in the Philippines is the Sequencing Batch Reactor. Similar processes exist such as the Intermittently Decanted Extended Aeration (IDEA) System. These batch-wise processes offer space and energy savings. A 1000 m3/day facility may occupy as little as 200 m2. It is amenable to modular construction and therefore will adopt to the demand as it increases. Existing facilities; Ford Philippines, Nepomall Dagupan, Caltex Sta. Rosa, Century Park Hotel. 3. Attached Growth Processes Prime examples under this classification are Trickling Filters and Rotating Biological Contactors (RBC). These systems may offer space saving benefits if designed correctly. Aeration equipment such as blowers are not normally used. Energy savings may be realized. Existing facilities – Sta. Lucia Mall, ADB headquarters, Central Azucarera de Don Pedro. 4. Oxidation Ditch Processes (Carousel System in Europe) A very robust system which operates efficiently and consistently. Civil structures tend to be a quite expensive. Area requirement is quite high. Energy requirement is similar to SBR systems. There is an efficient removal of Nitrogen form the wastewater due to the alternating aerobic and anaerobic stages in the system. Existing Facilities: Baguio City Wastewater Treatment System, Boracay Wastewater Treatment System, Mactan International Airport Wastewater Treatment System. 5. Membrane Bioreactor Systems This system is similar to an SBR or Activated Sludge system. The difference is in the sludge separation system. A membrane is used to separate clarified/filtered effluent. Advantages of this system are the small space requirement and the direct reuse of the filtered water for non-potable uses. Disadvantage is the high cost of the replacement filter and the need for technical personnel to run the facility. Membranes are replaced at least once a year. Existing Facility: Lagen Resort, El Nido, Palawan. 6. DEWATS system This system is steadily gaining a following in the Philippines and Indonesia due to the savings in capital and operating cost. This system is being promoted by the Bremen Overseas Research and Development Agency (BORDA). It involves the development of improved anaerobic septic tank like systems for initial treatment, followed by more anaerobic filters and finally a natural aerobic bed or lagoon. The tanks are built underground with the exception of the polishing aerobic filters and lagoons. 7. Natural Treatment Systems These new systems offer an engineered option for the treatment of settled wastewater. The use of soil, plants, sun and water to filter and biooxidize contaminants is a well studied and demonstrated feature. Advantages; very low operating cost, aesthetic appeal. Disadvantages; Large area requirement, need for pretreatment (septic tanks). Existing Facilities: Bayawan Fishermans Village, Laba eh Laundry Service, Nasugbu, Absolut Distillery.
12
Minimum Criteria for Wastewater Treatment Facilities The following guidelines will apply as basis for assessing the various technical bids
1. Design Volumetric Flowrate is 3500 m3 /day. This figure represents average flow. Provisions for an increase of 100% of volumetric flowrate over 20 years should be included.
2. For Aerobic biological systems a. minimum of 6 hours hydraulic retention time. b. Design MLSS of at least 2000 ppm
3. Proposed systems using enzymes / bioactive substances by themselves will not be accepted.
4. Must have a proper plan for a. Sludge management b. Odor control c. Disinfection before discharge
5. Structural resistance to corrosion due to proximity to the sea 6. Compliance with Effluent Discharge Standards (current regulation is DENR
Administrative Order 35). Flexibility to adopt to more stringent standards as foreseen in the new IRR of the Philippine Clean Water Act.
Recommendations – Wastewater Treatment Facility The following recommendations are presented by the author as appropriate wastewater treatment facilities for each site considering the site conditions and space available. These recommendations are not binding and are merely the technical opinion of the author. Bidders may opt to present other options. Option 2 and 3 both present areas with very little land availability
SBR process. Modular tank construction. Underground sump tank as buffer tank.
DEWATS processes may be considered. Option 1. This ridge top site has more available area.
Aerobic Biological process such as SBR, Activated sludge. Roughing trickling filter may be used to reduce BOD as a pre treatment or post-treatment.
Polishing pond or other natural treatment process may be used to provide post treatment.
13
Option 4. The area behind Big Lalaguna is quite expansive. Low cost options may be considered.
Any of the Biological treatment processes (Activated Sludge, SBR, IDEA, Oxidation Ditch, RBC)
Polishing Ponds and Constructed Wetland Systems DEWATS systems. Roughing Trickling Filter may be considered as flows are coming from a height.
COST OF WASTEWATER TREATMENT FACILITY Benchmark cost of conventional systems in the Philippines is given as
P 10,000 to 30,000 / m3 installed capacity
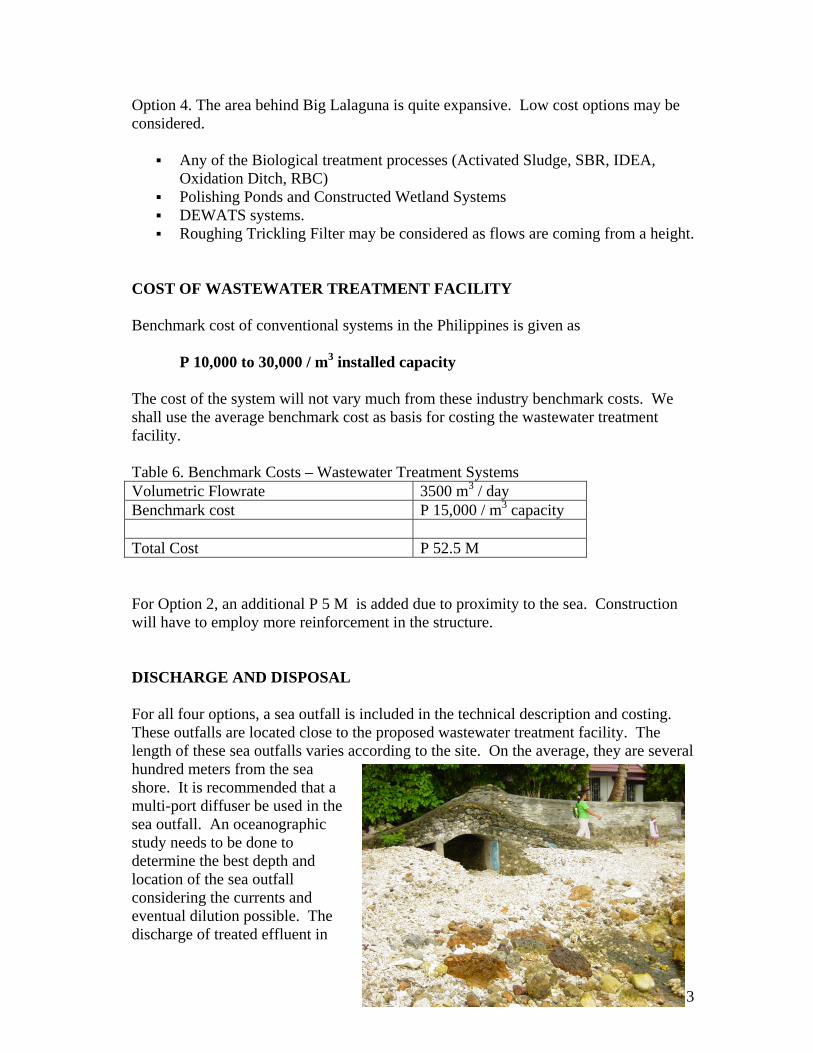
The cost of the system will not vary much from these industry benchmark costs. We shall use the average benchmark cost as basis for costing the wastewater treatment facility. Table 6. Benchmark Costs – Wastewater Treatment Systems Volumetric Flowrate 3500 m3 / day Benchmark cost P 15,000 / m3 capacity Total Cost P 52.5 M For Option 2, an additional P 5 M is added due to proximity to the sea. Construction will have to employ more reinforcement in the structure. DISCHARGE AND DISPOSAL For all four options, a sea outfall is included in the technical description and costing. These outfalls are located close to the proposed wastewater treatment facility. The length of these sea outfalls varies according to the site. On the average, they are several hundred meters from the sea shore. It is recommended that a multi-port diffuser be used in the sea outfall. An oceanographic study needs to be done to determine the best depth and location of the sea outfall considering the currents and eventual dilution possible. The discharge of treated effluent in
14
the area will have a much smaller impact than the current practice of direct discharge of untreated sewage in the near shore area. The photo on the right shows an existing discharge into the waters of Sabang. There are numerous discharges of this type currently existing along the coast of Sabang, Big Lalaguna and Small Lalaguna. REUSE AND RECYCLE There is also the option to reuse and recycle the treated wastewater coming from the wastewater treatment facility. The treated wastewater may be treated to a level such that it is appropriate for non-potable uses. Among the options under non-potable water useage are;
• Toilet flush water • Irrigation of public landscaped areas • Public use – fountains, firefighting
Caution must be exercised in the use of treated wastewater since there is still the risk of pathogen contamination. A disinfection process is an integral part of the design requirement of the wastewater treatment facility. This will render the treated wastewater fit for non-potable water use only as listed above. Other uses with a high risk of human contact should not be considered. There are numerous benefits in considering the option to reuse the treated wastewater. Total external water demand is reduced, water costs are lowered, less impact on the environment. There are also drawbacks in the reuse of treated wastewater. Additional infrastructure costs are required due to an additional distribution system exclusively for non-potable water, double piping system in the resorts and households, and occurrence of occasional discoloration of the reused wastewater. Reuse of wastewater as toilet flush is common. This has been practiced in Hong Kong and locally, the island resorts in El Nido reuse and recycle their wastewater as toilet flush. A recycling system would necessitate the construction of a service reservoir tank on one of the ridges to provide pressure for gravity flow.
15
SEWERAGE COLLECTION – TECHNICAL DESCRIPTION Current Practice in the Philippines In year 2002, basic sanitation services are accessible to only 81% of the urban populace while in the rural areas coverage is only 61%. Sewerage network connections is a mere 7% in Metro Manila; 2% nationwide (Year 2005). Sewerage is virtually non-existent in rural areas. The design practice adopted is for the life span of the pipe materials to approximate only the life of the loan, usually 25 years. It is actually unnecessary to design the sewer system for 25 years or more but the pipe is assumed to last more than 25 years. However, in present situation, the life span of sewer system being laid using Cast Iron Pipes, even shorter due to the extreme conditions of Metro Manila – clayey and polluted soil, flat and deltaic terrain, tropical temperature as well as high rainfall and frequent earthquakes. For underground pipelines, the main problem is corrosion. We define corrosion as the reaction between a material and its environment that produces a deterioration of the material and its properties. Replacement of deteriorated pipes are frequent after 15 years it was laid off and create traffic jams, dust, mud, noise etc. The underground pipelines must therefore be long lived to minimize the hardships and chaos they would create for the community in case of their replacements or repairs. The practice in the Design of pipes is to specify beforehand a uniform class or grade of pipes based on the requirements without specific regard for corrosion (i.e. soil, electrolysis and stress corrosion, etc) and other design conditions. Analysis of the corrosiveness of the soil is not being conducted before or after bid. The above practice may have arisen from a misunderstanding of the design paradigm of both ISO and AWWA. Under the ISO, only the minimum requirements are specified in the standard and it is the design engineer who is responsible for taking into consideration the various conditions, particularly underground corrosion, which affects the long term performance of the project. In present practice however, designs are general and not made specific for each varying condition within the project area and special condition such as encountered bridges and highways i.e. vibration, impact loading, etc. Under the AWWA paradigm, the design engineer is not encouraged to perform in depth design since the initial design process is already encapsulated into a look up table. That is, pipe thickness is already tabulated from a given set of pressure and external loading conditions. Consequently, corrosion the most important design parameter is overlooked.
16
OPTIONS AND COSTS
This section presents a comparison of the different technical alternatives for providing a sewerage system in the selected urbanized areas of the Municipality of Puerto Galera, Mindoro. The alternatives were selected based on the selected Barangays and areas in consideration.
DESIGN CRITERIA
The following major design criteria and standard adopted from the MWSS Design guidelines and other Standards for Sewer systems. This Design Guidelines and Standard is the primary basis for the formulation of the recommended technical option.
Sewer System
Existing and proposed road networks and concentration of prospective developments within the service area generally influence the sewer system layout. Pipe sizes are determined based on peak-hour requirements plus the infiltration inflow during high tide and wet weather condition. The minimum allowable pipe diameter for house service area is 100 mm dia. while for sewer main is 200mm dia. The maximum pipe diameter will vary depending on the velocity, slope and flow requirements in the proposed system. The types of pipes to be used in the systems are the High Density Polyethylene Spiral pipe (HDPE).
Flow Velocity in the Sewer System
The flow velocity in the sewer system will be limited to a maximum of 3m/s and a minimum of 0.6m/s during peak-hour conditions.
TECHNICAL OPTIONS
Proposed Service Area
The delineated service areas, which have been included in the preliminary design and cost analysis in this study, are Sabang, Big Lalaguna, Small Lalaguna.
Identification of Options
Four (4) technical options were prepared for considerations by the LGU and to select the option which will fall within the parameters of the financing scheme. The description of the individual sites is given in pages 5-6 of this report. A main determinant in the costs is the site of the wastewater treatment facility. Costs for the following options are summarized in the succeeding table.
17
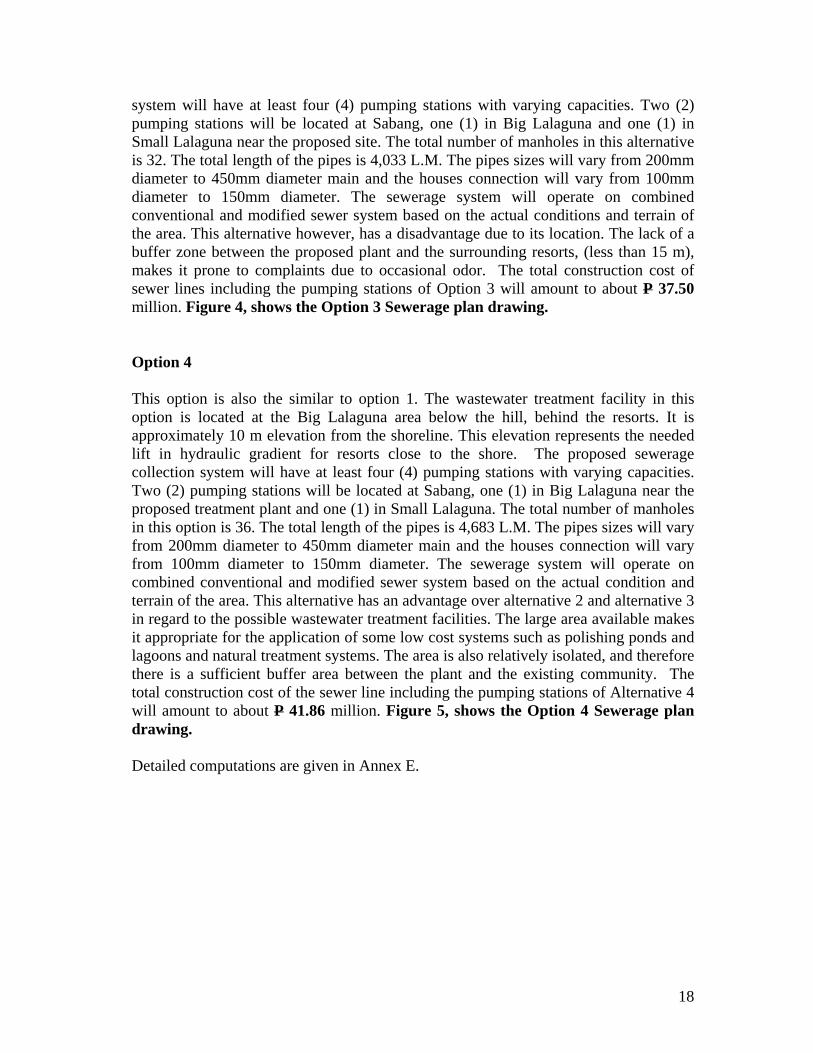
Option 1 This option covers the whole catchment area with a sewer area of approximately 127,697 sq.m. within the seashore. The development of a Wastewater treatment plant located at the top of the hill approximately 30 m elevation from the shoreline. The proposed sewerage system will have at least four (4) pumping stations with varying capacities. Two (2) pumping stations will be located at Barangay Sabang, one (1) in Big lalaguna and one (1) in Small lalaguna. The total number of manholes in this alternative is 32. The total length of the pipes is 4,383 L.M. The pipes sizes will vary from 200mm diameter to 450mm diameter main and the houses connection will vary from 100mm diameter to 150mm diameter. The sewerage system will operate on combined conventional and modified sewer system based on the actual conditions and terrain of the area. This is the more flexible alternative when it comes to the development of its wastewater facilities based on area, location, environmental aspects, economics and social aspects. The total construction cost of sewer line including the pumping stations of Alternative 1 will amount to about P 39.833 million. Figure 2, shows the Alternative 1 Sewerage plan drawing. Option 2 This option also covers the proposed sewerage collection area of approximately 127,697 sq.m. within the seashore. The proposed wastewater treatment plant in this option is located at the seashore beside the cliff in Sabang area. This area is potentially a good site for reclamation. The proposed sewerage system will also have at least four (4) pumping stations with varying capacities. Two (2) pumping stations will be located at Sabang, one (1) in Big Lalaguna and one (1) in Small Lalaguna. All pumping stations will be located along the seashore. Construction of a wastewater treatment plant in this area will cost more compared to the other sites. This is due to the need for reinforcements in the civil structures due to the proximity to the sea. The total number of manholes for this option is 31. The total length of the pipes is 3,904 L.M. The pipes sizes will vary from 200mm diameter to 450mm diameter main and the houses connection will vary from 100mm diameter to 150mm diameter. The sewerage system will operate on combined conventional and modified sewer system based on the actual conditions and terrain of the area. The total construction cost of sewer line including the pumping stations of Alternative 2 will amount to about P 36.340 million. Figure 3, shows the Option 2 Sewerage plan drawing. Option 3 This option is in the same site as option 1. The difference is in the site of the wastewater treatment plant which will be located at the back of small Lalaguna in the flat portion of the lot, below the proposed wastewater treatment plant of alternative 1. The elevation of the proposed wastewater is approximately 6 m elevation from the shoreline. This is below the 30 m height propose for option 1. The proposed sewerage
18
system will have at least four (4) pumping stations with varying capacities. Two (2) pumping stations will be located at Sabang, one (1) in Big Lalaguna and one (1) in Small Lalaguna near the proposed site. The total number of manholes in this alternative is 32. The total length of the pipes is 4,033 L.M. The pipes sizes will vary from 200mm diameter to 450mm diameter main and the houses connection will vary from 100mm diameter to 150mm diameter. The sewerage system will operate on combined conventional and modified sewer system based on the actual conditions and terrain of the area. This alternative however, has a disadvantage due to its location. The lack of a buffer zone between the proposed plant and the surrounding resorts, (less than 15 m), makes it prone to complaints due to occasional odor. The total construction cost of sewer lines including the pumping stations of Option 3 will amount to about P 37.50 million. Figure 4, shows the Option 3 Sewerage plan drawing. Option 4 This option is also the similar to option 1. The wastewater treatment facility in this option is located at the Big Lalaguna area below the hill, behind the resorts. It is approximately 10 m elevation from the shoreline. This elevation represents the needed lift in hydraulic gradient for resorts close to the shore. The proposed sewerage collection system will have at least four (4) pumping stations with varying capacities. Two (2) pumping stations will be located at Sabang, one (1) in Big Lalaguna near the proposed treatment plant and one (1) in Small Lalaguna. The total number of manholes in this option is 36. The total length of the pipes is 4,683 L.M. The pipes sizes will vary from 200mm diameter to 450mm diameter main and the houses connection will vary from 100mm diameter to 150mm diameter. The sewerage system will operate on combined conventional and modified sewer system based on the actual condition and terrain of the area. This alternative has an advantage over alternative 2 and alternative 3 in regard to the possible wastewater treatment facilities. The large area available makes it appropriate for the application of some low cost systems such as polishing ponds and lagoons and natural treatment systems. The area is also relatively isolated, and therefore there is a sufficient buffer area between the plant and the existing community. The total construction cost of the sewer line including the pumping stations of Alternative 4 will amount to about P 41.86 million. Figure 5, shows the Option 4 Sewerage plan drawing. Detailed computations are given in Annex E.
19
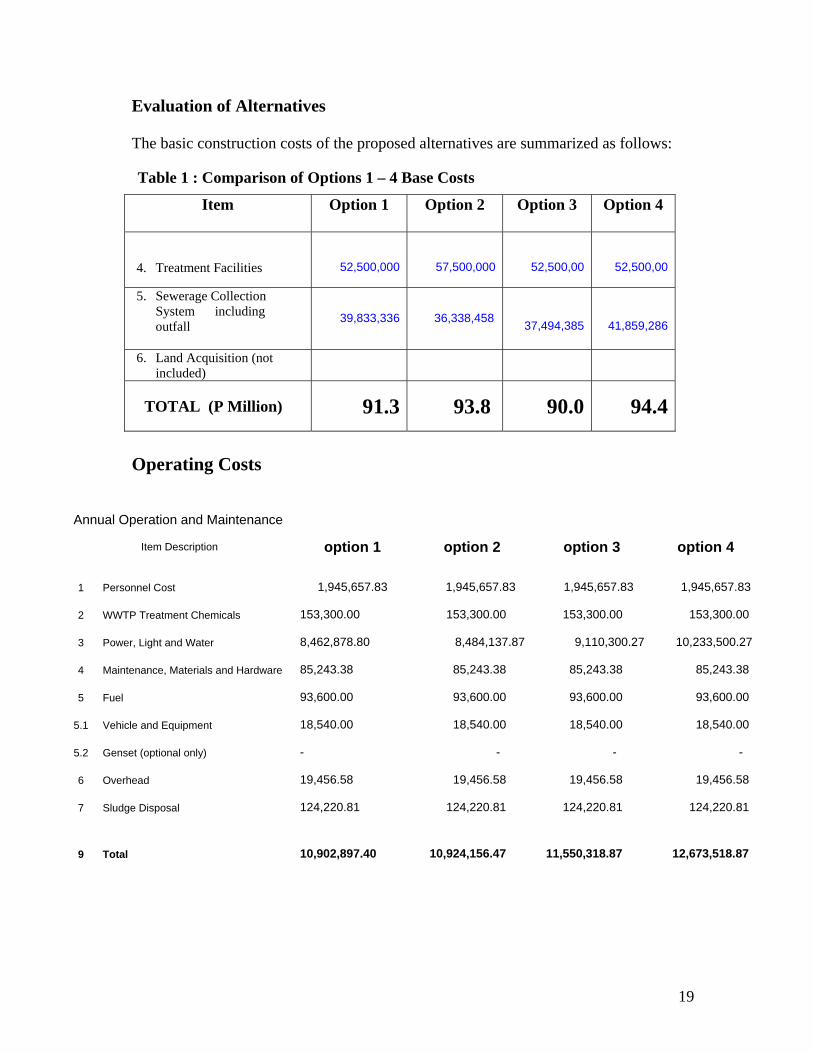
Evaluation of Alternatives The basic construction costs of the proposed alternatives are summarized as follows:
Table 1 : Comparison of Options 1 – 4 Base Costs
Item Option 1 Option 2
Option 3 Option 4
4. Treatment Facilities
52,500,000
57,500,000
52,500,00
52,500,00
5. Sewerage Collection System including outfall
39,833,336
36,338,458 37,494,385 41,859,286
6. Land Acquisition (not included)
TOTAL (P Million) 91.3 93.8 90.0 94.4
Operating Costs
Annual Operation and Maintenance
Item Description option 1 option 2 option 3 option 4
1 Personnel Cost
1,945,657.83 1,945,657.83 1,945,657.83 1,945,657.83
2 WWTP Treatment Chemicals 153,300.00 153,300.00 153,300.00 153,300.00
3 Power, Light and Water 8,462,878.80 8,484,137.87 9,110,300.27 10,233,500.27
4 Maintenance, Materials and Hardware 85,243.38 85,243.38 85,243.38 85,243.38
5 Fuel 93,600.00 93,600.00 93,600.00 93,600.00
5.1 Vehicle and Equipment 18,540.00 18,540.00 18,540.00 18,540.00
5.2 Genset (optional only) - - - -
6 Overhead 19,456.58 19,456.58 19,456.58 19,456.58
7 Sludge Disposal 124,220.81 124,220.81 124,220.81 124,220.81
9 Total 10,902,897.40 10,924,156.47 11,550,318.87 12,673,518.87
20
ANNEX A Scope of Work of Sewerage Planning and Wastewater Treatment
Specific tasks. The tasks expected from the consultant in the implementation of this SOW are as follows: Area : Sabang, Puerto Galera
1. Conduct site inspection of Sabang, Puerto Galera, in collaboration with the LGU engineering office and other LGU officials.
2. Obtain relevant maps such as topographical map, and other data as needed in sewerage and wastewater management planning
3. Determine sewerage collection design parameters from existing data and verify accuracy of this data.
4. Determine likely / possible sites for central wastewater treatment facility/ies. 5. Determine different configurations and options in the sewage collection plan for
Sabang. 6. Prepare preliminary drawings showing main sewerage collection pipes.
Different options may be shown including conventional, combined and simplified sewerage systems may be compared.
7. Determine appropriate wastewater treatment systems based on parameters such as area available, treatment efficiency, compliance with local standards, operating anad maintenance costs.
8. Determine total costs of the different technical options. 9. Prepare a comprehensive report in collaboration with the LGU engineering
office and other LGU officials to be submitted to PEMSEA. 10. Submission of draft report for review/acceptance by PEMSEA. 11. Submission of final report, taking into consideration the comments of
PEMSEA. Deliverables. The execution of the tasks described above will result in the following deliverables:
12. Comprehensive report on the different options for the management of wastewater from Sabang.
13. This report will include the following: a. Domestic/tourist population forecast to 2026 b. Hydraulic and organic loading estimates/characteristics, based on
domestic and tourist population forecasts, with validation of estimates/characterization based on data collected from similar locations elsewhere in the Philippines (e.g., Boracay)
c. Sewerage collection map detailing catchment areas with relevant appurtenances, based on forecast services to 2026, such as size/length of pipes, manholes, and pumping stations. Maps will be rendered in
21
AutoCad. d. Sites for possible wastewater treatment facilities e. Required technical performance standards for the proposed sewerage
system, in accordance with national regulations as well as local government standards and objectives regarding development and sustainability of a world class tourist destination
f. Technical options for achieving such standards with regard to the sewage treatment plant
g. Capital and operating costs for the different sewerage options mentioned above.
h. Recommended sewerage options based on economic considerations and in accordance with the expectations of the public sector.
22
ANNEX B SEWERAGE COVERAGE AREA
COMPANY TITLE:
SEWERAGE AREA DELINEATION PEMSEA
SABANG
SMALLALAGUNA
BIGLALAGUNA
TOTAL AREA DELINEATION
127,697 SQ.M.
23
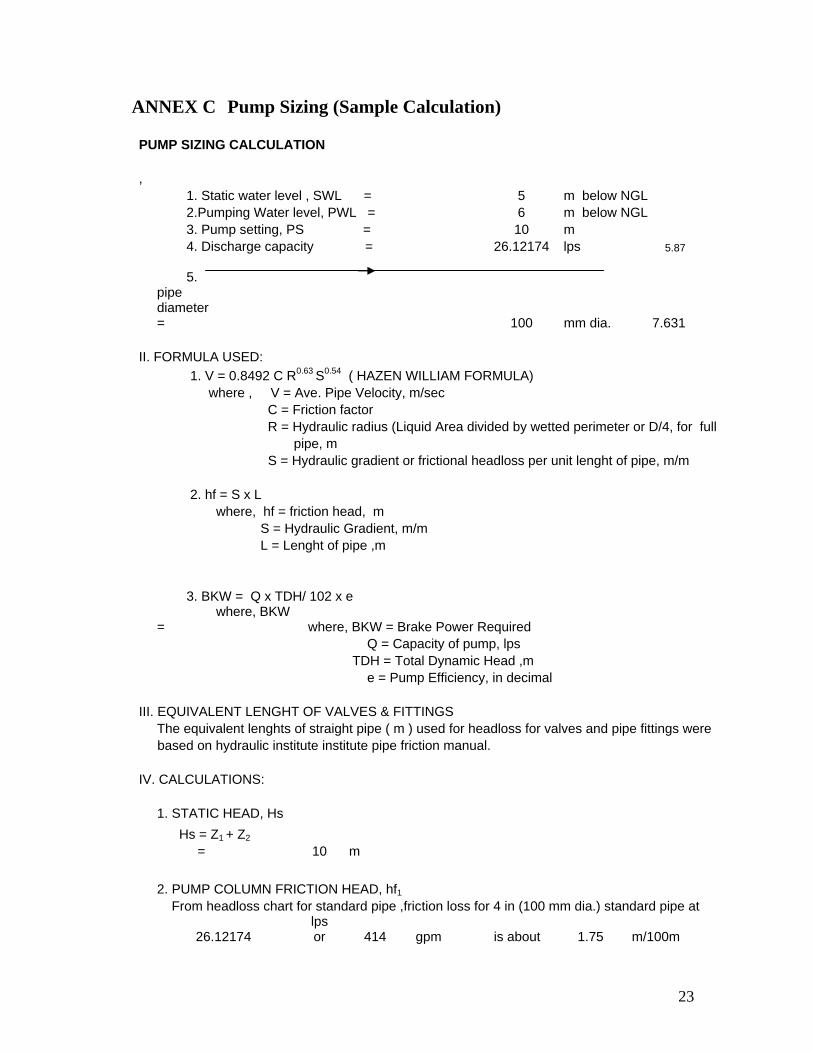
ANNEX C Pump Sizing (Sample Calculation) PUMP SIZING CALCULATION , 1. Static water level , SWL = 5 m below NGL 2.Pumping Water level, PWL = 6 m below NGL 3. Pump setting, PS = 10 m 4. Discharge capacity = 26.12174 lps 5.87
5. pipe diameter = 100 mm dia. 7.631
II. FORMULA USED: 1. V = 0.8492 C R0.63 S0.54 ( HAZEN WILLIAM FORMULA) where , V = Ave. Pipe Velocity, m/sec C = Friction factor R = Hydraulic radius (Liquid Area divided by wetted perimeter or D/4, for full pipe, m S = Hydraulic gradient or frictional headloss per unit lenght of pipe, m/m 2. hf = S x L where, hf = friction head, m S = Hydraulic Gradient, m/m L = Lenght of pipe ,m 3. BKW = Q x TDH/ 102 x e
where, BKW = where, BKW = Brake Power Required
Q = Capacity of pump, lps TDH = Total Dynamic Head ,m e = Pump Efficiency, in decimal III. EQUIVALENT LENGHT OF VALVES & FITTINGS The equivalent lenghts of straight pipe ( m ) used for headloss for valves and pipe fittings were based on hydraulic institute institute pipe friction manual. IV. CALCULATIONS: 1. STATIC HEAD, Hs
Hs = Z1 + Z2 = 10 m 2. PUMP COLUMN FRICTION HEAD, hf1 From headloss chart for standard pipe ,friction loss for 4 in (100 mm dia.) standard pipe at
26.12174 lps or 414 gpm is about 1.75 m/100m
24
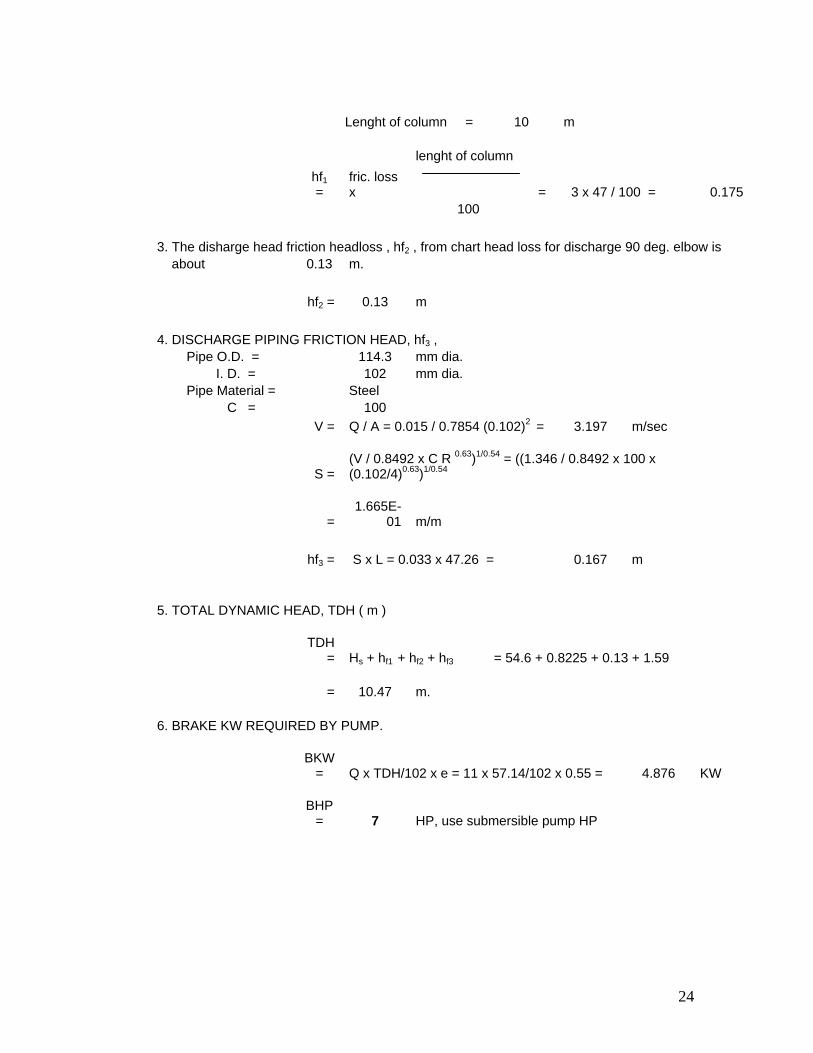
Lenght of column = 10 m lenght of column
hf1 =
fric. loss x
= 3 x 47 / 100 = 0.175
100
3. The disharge head friction headloss , hf2 , from chart head loss for discharge 90 deg. elbow is about 0.13 m. hf2 = 0.13 m 4. DISCHARGE PIPING FRICTION HEAD, hf3 , Pipe O.D. = 114.3 mm dia. I. D. = 102 mm dia. Pipe Material = Steel C = 100 V = Q / A = 0.015 / 0.7854 (0.102)2 = 3.197 m/sec
S =(V / 0.8492 x C R 0.63)1/0.54 = ((1.346 / 0.8492 x 100 x (0.102/4)0.63)1/0.54
=1.665E-
01 m/m hf3 = S x L = 0.033 x 47.26 = 0.167 m 5. TOTAL DYNAMIC HEAD, TDH ( m )
TDH
= Hs + hf1 + hf2 + hf3 = 54.6 + 0.8225 + 0.13 + 1.59 = 10.47 m. 6. BRAKE KW REQUIRED BY PUMP.
BKW
= Q x TDH/102 x e = 11 x 57.14/102 x 0.55 = 4.876 KW
BHP
= 7 HP, use submersible pump HP
25
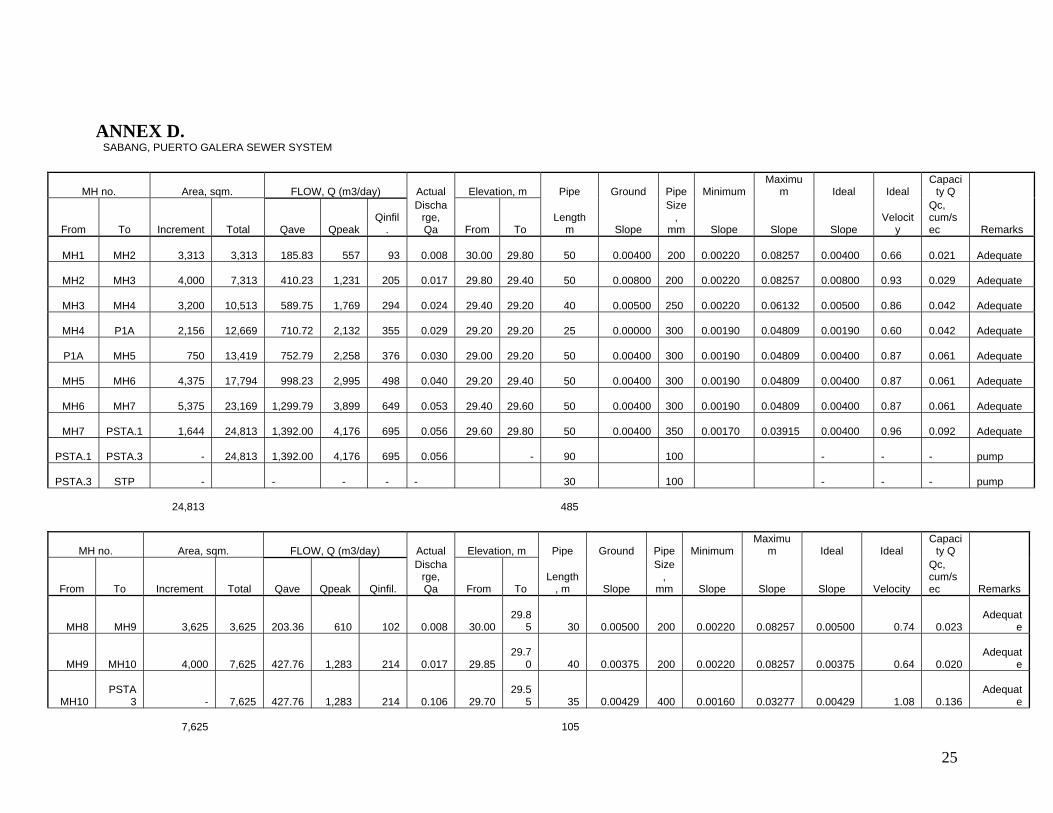
ANNEX D. SABANG, PUERTO GALERA SEWER SYSTEM
MH no. Area, sqm. FLOW, Q (m3/day) Actual Elevation, m Pipe Ground Pipe Minimum Maximu
m Ideal Ideal Capaci
ty Q
From To Increment Total Qave Qpeak Qinfil
.
Discharge, Qa From To
Length m Slope
Size,
mm Slope Slope Slope Velocit
y
Qc, cum/sec Remarks
MH1 MH2
3,313
3,313
185.83
557
93
0.008
30.00
29.80
50 0.00400
200 0.00220
0.08257
0.00400
0.66
0.021 Adequate
MH2 MH3
4,000
7,313
410.23
1,231
205
0.017
29.80
29.40 50 0.00800
200 0.00220
0.08257
0.00800
0.93
0.029 Adequate
MH3 MH4
3,200
10,513
589.75
1,769
294
0.024
29.40
29.20 40 0.00500
250 0.00220
0.06132
0.00500
0.86
0.042 Adequate
MH4 P1A
2,156
12,669
710.72
2,132
355
0.029
29.20
29.20 25 0.00000 300
0.00190
0.04809
0.00190
0.60
0.042 Adequate
P1A MH5
750
13,419
752.79
2,258
376
0.030
29.00
29.20 50 0.00400
300 0.00190
0.04809
0.00400
0.87
0.061 Adequate
MH5 MH6
4,375
17,794
998.23
2,995
498
0.040
29.20
29.40 50 0.00400
300 0.00190
0.04809
0.00400
0.87
0.061 Adequate
MH6 MH7
5,375
23,169
1,299.79
3,899
649
0.053
29.40
29.60 50 0.00400
300 0.00190
0.04809
0.00400
0.87
0.061 Adequate
MH7 PSTA.1
1,644
24,813
1,392.00
4,176
695
0.056
29.60
29.80 50 0.00400
350 0.00170
0.03915
0.00400
0.96
0.092 Adequate
PSTA.1 PSTA.3
-
24,813
1,392.00
4,176
695
0.056
- 90
100 -
-
- pump
PSTA.3 STP
- -
-
-
- 30
100
-
-
- pump
24,813 485
MH no. Area, sqm. FLOW, Q (m3/day) Actual Elevation, m Pipe Ground Pipe Minimum Maximu
m Ideal Ideal Capaci
ty Q
From To Increment Total Qave Qpeak Qinfil.
Discharge, Qa From To
Length, m Slope
Size,
mm Slope Slope Slope Velocity
Qc, cum/sec Remarks
MH8 MH9
3,625
3,625
203.36
610
102
0.008
30.00
29.8
5
30 0.00500
200
0.00220
0.08257
0.00500
0.74
0.023 Adequat
e
MH9 MH10
4,000
7,625
427.76
1,283
214
0.017
29.85
29.7
0
40 0.00375
200
0.00220
0.08257
0.00375
0.64
0.020 Adequat
e
MH10 PSTA
3 -
7,625
427.76
1,283
214
0.106
29.70
29.5
5
35 0.00429
400
0.00160
0.03277
0.00429
1.08
0.136 Adequat
e
7,625
105
26
MH no. Area, sqm. FLOW, Q Actual Elevation, m Pipe Ground Pipe Minimum Maximu
m Ideal Ideal Capacity
Q
From To Increment Total Qave Qpeak Qinfil. Discharg
e, Qa From To Length
, m Slope
Size,
mm Slope Slope Slope Velocit
y Qc, cum/sec
Remar
ks
MH17 MH16
2,375
2,375
133.24
400
67
0.005
30.00
29.9
0
50 0.00200
200
0.00220
0.08257
0.0022
0
0.49
0.015 Adequ
ate
MH16 MH15
11,788
14,163
794.52
2,384
397
0.032
29.90
29.8
0
60 0.00167
300
0.00190
0.04809
0.0019
0
0.60
0.042 Adequ
ate
MH15 MH14
8,800
22,963
1,288.
20
3,865
643
0.052
29.80
29.6
0
40 0.00500
300
0.00190
0.04809
0.0050
0
0.97
0.068 Adequ
ate
MH14 PSTA
2
9,250
32,213
1,807.
12
5,421
902
0.073
29.70
29.6
0
30 0.00333
350
0.00170
0.03915
0.0033
3
0.88
0.084 Adequ
ate
PSTA2 MH13 -
32,213
1,807.
12
5,421
902
0.073
29.60
29.2
0
35 0.01143
350
0.00170
0.03915
0.0114
3
1.62
0.156 Adequ
ate
MH13 MH12
469
32,681
1,833.
42
5,500
915
0.074
29.50
29.4
0
38 0.00267
400
0.00170
0.03277
0.0026
7
0.86
0.108 Adequ
ate
MH12 MH11
688
33,369
1,871.
99
5,616
934
0.076
29.40
29.3
0
40 0.00250
400
0.00160
0.03277
0.0025
0
0.83
0.104 Adequ
ate
MH11 MH10
5,575
38,944
2,184.
74
6,554
1,090
0.088
29.30
29.2
0
40 0.00250
400
0.00160
0.03277
0.0025
0
0.83
0.104 Adequ
ate
MH10 PSTA
3 -
38,944
2,184.
74
6,554
1,090
0.088
29.20
29.1
0
35 0.00286
400
0.00160
0.03277
0.0028
6
0.89
0.111 Adequ
ate
PSTA3 STP -
38,944
2,184.
74
6,554
1,090
0.194
29.10
pum
p
30 pump
pum
p pump pump pump pump pump pump
38,944
398
27
MH no. Area, sqm. FLOW, Q Actual Elevation, m Pipe Ground Pipe Minimum Maximu
m Ideal Ideal Capacity
Q
From To Increment Total Qave Qpeak Qinfil. Discharge, Qa From To
Length, m
Slope Size,
mm
Slope Slope Slope Velocity Qc,
cum/sec
Remarks
MH32 MH31
6,175
6,175
346.42
1,039
173
0.014 70.0
0
69.00
65 0.01538
200
0.00220
0.08257
0.01538
1.29
0.041 Adequ
ate
MH31 MH30
6,178
12,353
692.98
2,079
346
0.028
69.0
0
67.00
60 0.03333
200
0.00220
0.08257
0.03333
1.91
0.060 Adequ
ate
MH30 MH29
11,063
23,415
1,313.
58
3,941
656
0.053
68.0
0
67.00
58 0.01739
300
0.00190
0.04809
0.01739
1.80
0.128 Adequ
ate
MH29 MH27
2,700
26,115
1,465.
05
4,395
731
0.059
67.0
0
66.50
60 0.00833
300
0.00190
0.04809
0.00833
1.25
0.088 Adequ
ate
MH27 MH25
3,750
29,865
1,675.
43
5,026
836
0.068
66.5
0
65.00
50 0.03000
300
0.00190
0.04809
0.03000
2.37
0.167 Adequ
ate
MH25 MH23
8,125
37,990
2,131.
24
6,394
1,064
0.086
66.0
0
62.00
65 0.06154
300
0.00190
0.04809
0.04809
3.00
0.212 Adequ
ate
MH23 MH22
2,100
40,090
2,249.
05
6,747
1,123
0.091
62.0
0
60.00
50 0.04000
300
0.00190
0.04809
0.04000
2.74
0.193 Adequ
ate
MH28 MH26
4,375
4,375
245.44
736
123
0.010
65.0
0
63.00
50 0.04000
200
0.00220
0.08257
0.04000
2.09
0.066 Adequ
ate
MH26 MH24
5,850
10,225
573.62
1,721
286
0.023
63.0
0
41.00
58 0.38261
200
0.00220
0.08257
0.08257
3.00
0.094 Adequ
ate
MH24 MH22
2,300
12,525
702.65
2,108
351
0.028
62.0
0
60.00
50 0.04000
200
0.00220
0.08257
0.04000
2.09
0.066 Adequ
ate
MH22 MH20
2,250
54,865
3,077.
93
9,234
1,536
0.125
60.0
0
40.00
100 0.20000
300
0.00190
0.04809
0.04809
3.00
0.212 Adequ
ate
MH21 MH20
500
500
28.05
84
14
0.001
40.5
0
40.00
30 0.01667
300
0.00190
0.04809
0.01667
1.77
0.125 Adequ
ate
MH18 MH19
600
600
33.66
101
17
0.001
41.0
0
40.50
30 0.01667
200
0.00220
0.08257
0.01667
1.35
0.042 Adequ
ate
MH19 MH20
350
950
53.30
160
27
0.002
40.5
0
40.00
25 0.02000
200
0.00220
0.08257
0.02000
1.48
0.046 Adequ
ate
MH20 P1A 56,315
3,159.
27 9,478 1,577 0.128
40.0
0
29.20
30 0.36000
300
0.00190
0.04809
0.04809
3.00
0.212 Adequ
ate
28
56,315
780
Qave Qpeak Qinfil. Discharg
e, Qa
TOTAL AREA CONSIDERATION =
127,69
7
7,163.
78
21,491
3,576
25,066.8
5 FLO
W 0.0561
29
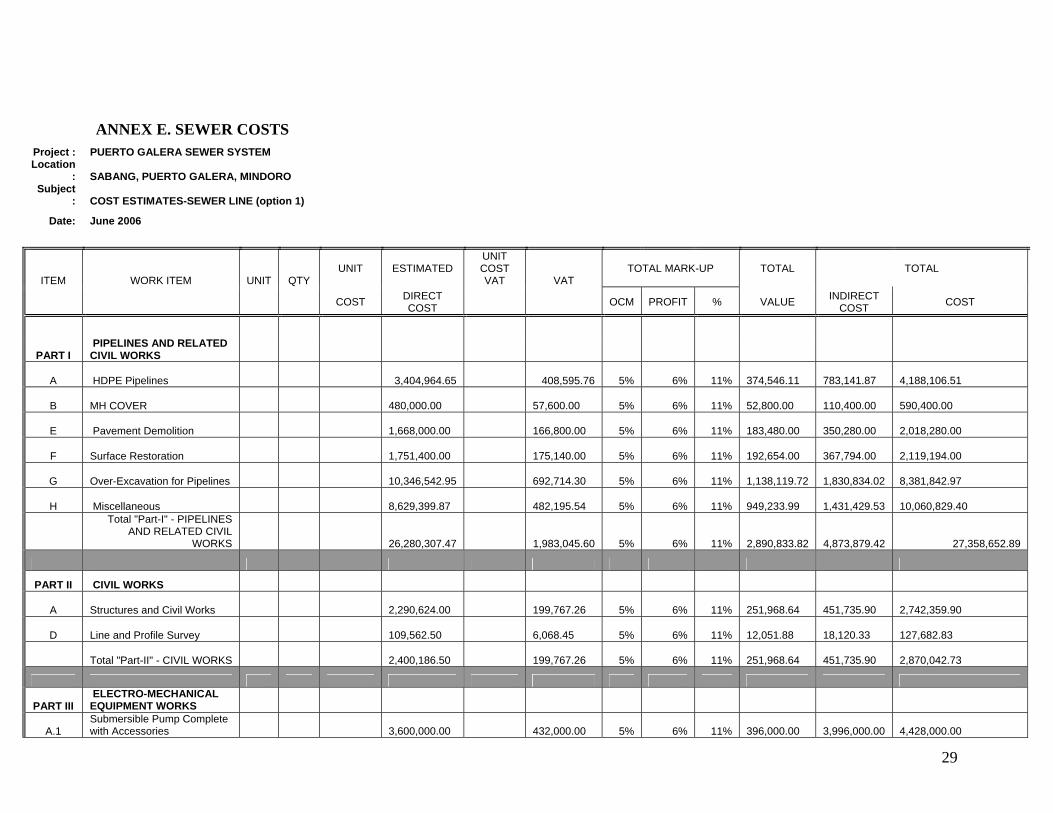
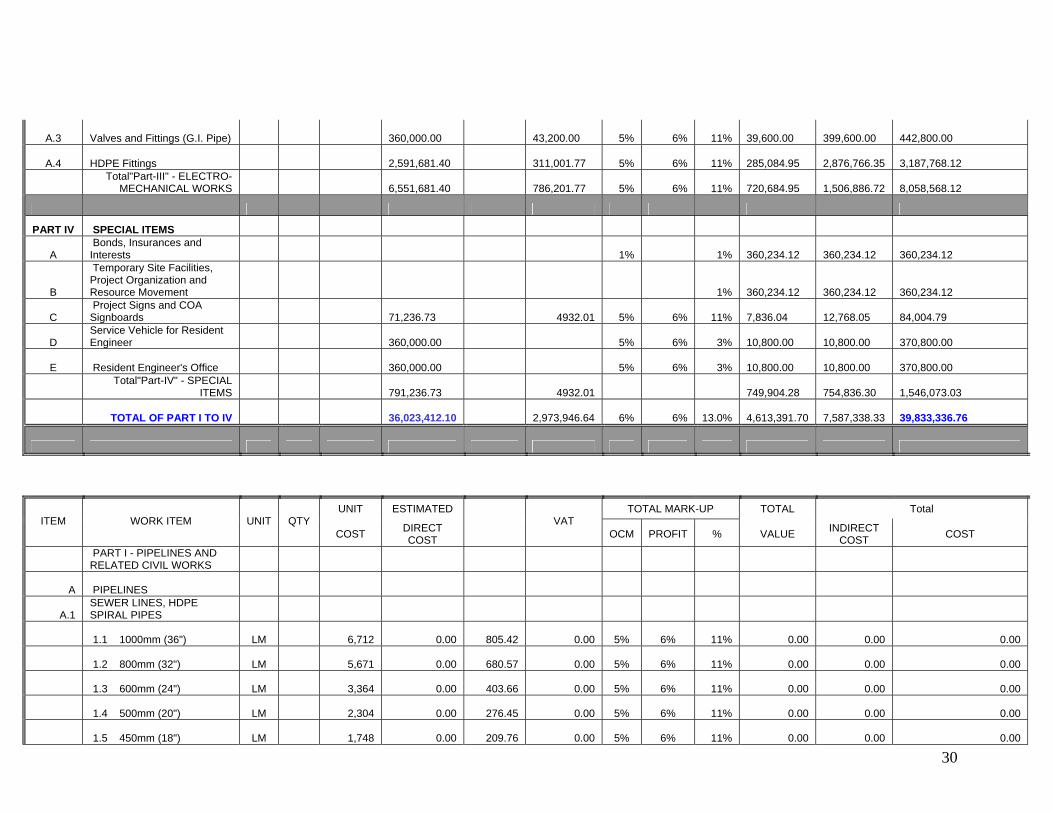
ANNEX E. SEWER COSTS Project : PUERTO GALERA SEWER SYSTEM Location
: SABANG, PUERTO GALERA, MINDORO Subject
: COST ESTIMATES-SEWER LINE (option 1)
Date: June 2006
UNIT ESTIMATED UNIT COST VAT
TOTAL MARK-UP TOTAL TOTAL ITEM WORK ITEM UNIT QTY
COST DIRECT COST
VAT
OCM PROFIT % VALUE INDIRECT COST COST
PART I PIPELINES AND RELATED CIVIL WORKS
A HDPE Pipelines 3,404,964.65 408,595.76 5% 6% 11% 374,546.11
783,141.87
4,188,106.51
B MH COVER 480,000.00
57,600.00 5% 6% 11%
52,800.00
110,400.00
590,400.00
E Pavement Demolition 1,668,000.00
166,800.00 5% 6% 11%
183,480.00
350,280.00
2,018,280.00
F Surface Restoration 1,751,400.00
175,140.00 5% 6% 11%
192,654.00
367,794.00
2,119,194.00
G Over-Excavation for Pipelines 10,346,542.95
692,714.30 5% 6% 11%
1,138,119.72
1,830,834.02
8,381,842.97
H Miscellaneous 8,629,399.87
482,195.54 5% 6% 11%
949,233.99
1,431,429.53
10,060,829.40
Total "Part-I" - PIPELINES AND RELATED CIVIL
WORKS 26,280,307.47 1,983,045.60 5% 6% 11% 2,890,833.82 4,873,879.42 27,358,652.89
PART II CIVIL WORKS
A Structures and Civil Works 2,290,624.00
199,767.26 5% 6% 11%
251,968.64
451,735.90
2,742,359.90
D Line and Profile Survey 109,562.50
6,068.45 5% 6% 11%
12,051.88
18,120.33
127,682.83
Total "Part-II" - CIVIL WORKS 2,400,186.50
199,767.26 5% 6% 11%
251,968.64
451,735.90
2,870,042.73
PART III ELECTRO-MECHANICAL EQUIPMENT WORKS
A.1 Submersible Pump Complete with Accessories
3,600,000.00
432,000.00 5% 6% 11%
396,000.00
3,996,000.00
4,428,000.00
30
A.3 Valves and Fittings (G.I. Pipe) 360,000.00
43,200.00 5% 6% 11%
39,600.00
399,600.00
442,800.00
A.4 HDPE Fittings 2,591,681.40
311,001.77 5% 6% 11%
285,084.95
2,876,766.35
3,187,768.12
Total"Part-III" - ELECTRO-
MECHANICAL WORKS 6,551,681.40
786,201.77 5% 6% 11%
720,684.95
1,506,886.72
8,058,568.12
PART IV SPECIAL ITEMS
A Bonds, Insurances and Interests 1% 1%
360,234.12
360,234.12
360,234.12
B
Temporary Site Facilities, Project Organization and Resource Movement 1%
360,234.12
360,234.12
360,234.12
C Project Signs and COA Signboards
71,236.73 4932.01 5% 6% 11%
7,836.04
12,768.05
84,004.79
D Service Vehicle for Resident Engineer
360,000.00 5% 6% 3%
10,800.00
10,800.00
370,800.00
E Resident Engineer's Office 360,000.00 5% 6% 3%
10,800.00
10,800.00
370,800.00
Total"Part-IV" - SPECIAL
ITEMS 791,236.73 4932.01
749,904.28
754,836.30
1,546,073.03
TOTAL OF PART I TO IV 36,023,412.10
2,973,946.64 6% 6% 13.0%
4,613,391.70
7,587,338.33
39,833,336.76
UNIT ESTIMATED TOTAL MARK-UP TOTAL Total ITEM WORK ITEM UNIT QTY
COST DIRECT COST
VAT OCM PROFIT % VALUE INDIRECT
COST COST
PART I - PIPELINES AND RELATED CIVIL WORKS
A PIPELINES
A.1 SEWER LINES, HDPE SPIRAL PIPES
1.1 1000mm (36") LM 6,712 0.00 805.42 0.00 5% 6% 11% 0.00 0.00 0.00
1.2 800mm (32") LM 5,671 0.00 680.57 0.00 5% 6% 11% 0.00 0.00 0.00
1.3 600mm (24") LM 3,364 0.00 403.66 0.00 5% 6% 11% 0.00 0.00 0.00
1.4 500mm (20") LM 2,304 0.00 276.45 0.00 5% 6% 11% 0.00 0.00 0.00
1.5 450mm (18") LM 1,748 0.00 209.76 0.00 5% 6% 11% 0.00 0.00 0.00
31
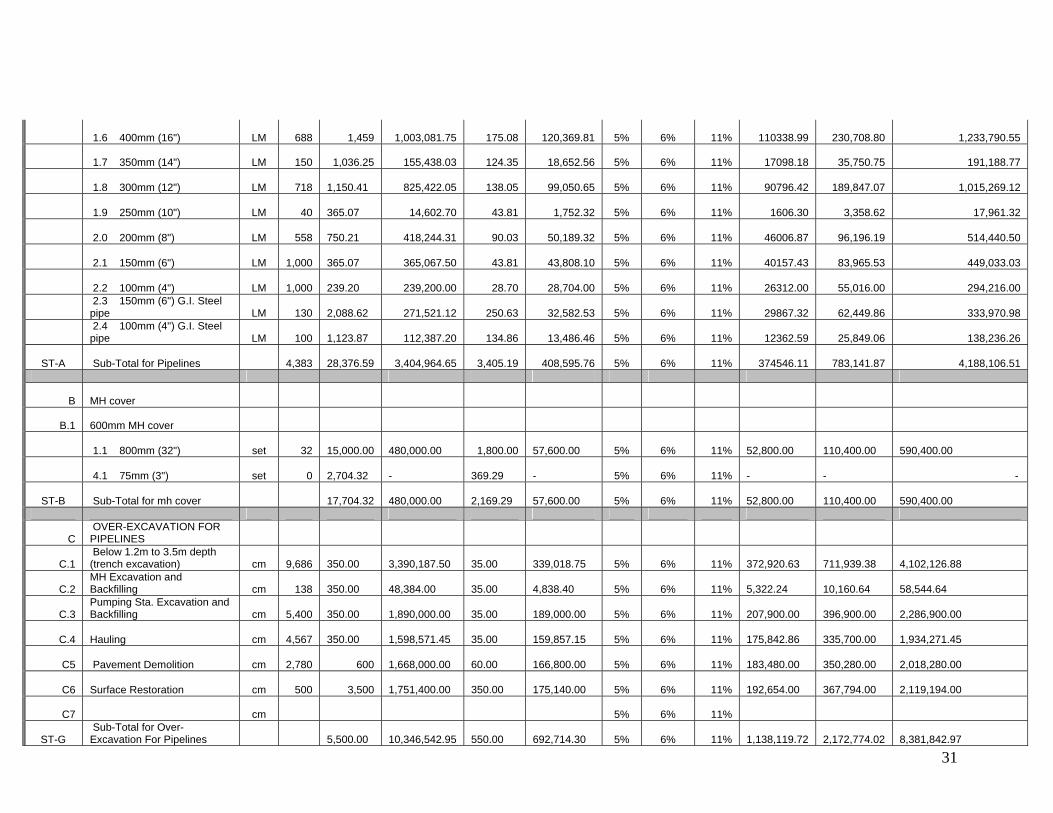
1.6 400mm (16") LM 688 1,459 1,003,081.75 175.08 120,369.81 5% 6% 11% 110338.99 230,708.80 1,233,790.55
1.7 350mm (14") LM 150 1,036.25 155,438.03 124.35 18,652.56 5% 6% 11% 17098.18 35,750.75 191,188.77
1.8 300mm (12") LM 718 1,150.41 825,422.05 138.05 99,050.65 5% 6% 11% 90796.42 189,847.07 1,015,269.12
1.9 250mm (10") LM 40 365.07 14,602.70 43.81 1,752.32 5% 6% 11% 1606.30 3,358.62 17,961.32
2.0 200mm (8") LM 558 750.21 418,244.31 90.03 50,189.32 5% 6% 11% 46006.87 96,196.19 514,440.50
2.1 150mm (6") LM 1,000 365.07 365,067.50 43.81 43,808.10 5% 6% 11% 40157.43 83,965.53 449,033.03
2.2 100mm (4") LM 1,000 239.20 239,200.00 28.70 28,704.00 5% 6% 11% 26312.00 55,016.00 294,216.00
2.3 150mm (6") G.I. Steel pipe LM 130
2,088.62 271,521.12 250.63 32,582.53 5% 6% 11% 29867.32 62,449.86 333,970.98
2.4 100mm (4") G.I. Steel pipe LM 100
1,123.87 112,387.20 134.86 13,486.46 5% 6% 11% 12362.59 25,849.06 138,236.26
ST-A Sub-Total for Pipelines 4,383 28,376.59 3,404,964.65 3,405.19 408,595.76 5% 6% 11% 374546.11 783,141.87 4,188,106.51
B MH cover
B.1 600mm MH cover
1.1 800mm (32") set 32 15,000.00
480,000.00 1,800.00
57,600.00 5% 6% 11%
52,800.00
110,400.00
590,400.00
4.1 75mm (3") set 0 2,704.32
-
369.29
- 5% 6% 11%
-
- -
ST-B Sub-Total for mh cover 17,704.32
480,000.00
2,169.29
57,600.00 5% 6% 11%
52,800.00
110,400.00
590,400.00
C OVER-EXCAVATION FOR PIPELINES
C.1 Below 1.2m to 3.5m depth (trench excavation) cm 9,686
350.00
3,390,187.50
35.00
339,018.75 5% 6% 11%
372,920.63
711,939.38
4,102,126.88
C.2 MH Excavation and Backfilling cm 138
350.00
48,384.00
35.00
4,838.40 5% 6% 11%
5,322.24
10,160.64
58,544.64
C.3 Pumping Sta. Excavation and Backfilling cm 5,400
350.00
1,890,000.00
35.00
189,000.00 5% 6% 11%
207,900.00
396,900.00
2,286,900.00
C.4 Hauling cm 4,567 350.00
1,598,571.45
35.00
159,857.15 5% 6% 11%
175,842.86
335,700.00
1,934,271.45
C5 Pavement Demolition cm 2,780 600 1,668,000.00
60.00
166,800.00 5% 6% 11%
183,480.00
350,280.00
2,018,280.00
C6 Surface Restoration cm 500 3,500 1,751,400.00
350.00
175,140.00 5% 6% 11%
192,654.00
367,794.00
2,119,194.00
C7 cm 5% 6% 11%
ST-G Sub-Total for Over-Excavation For Pipelines
5,500.00
10,346,542.95
550.00
692,714.30 5% 6% 11%
1,138,119.72
2,172,774.02
8,381,842.97
32
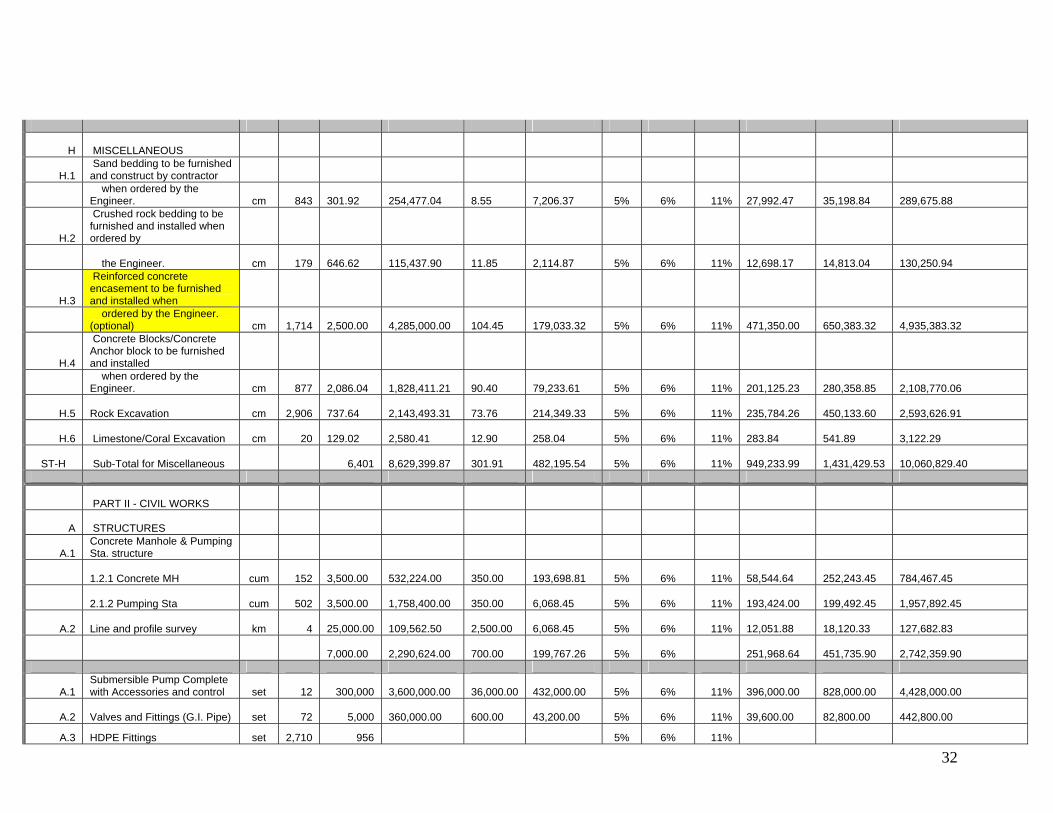
H MISCELLANEOUS
H.1 Sand bedding to be furnished and construct by contractor
when ordered by the Engineer. cm 843
301.92
254,477.04
8.55
7,206.37 5% 6% 11%
27,992.47
35,198.84
289,675.88
H.2
Crushed rock bedding to be furnished and installed when ordered by
the Engineer. cm 179 646.62
115,437.90
11.85
2,114.87 5% 6% 11%
12,698.17
14,813.04
130,250.94
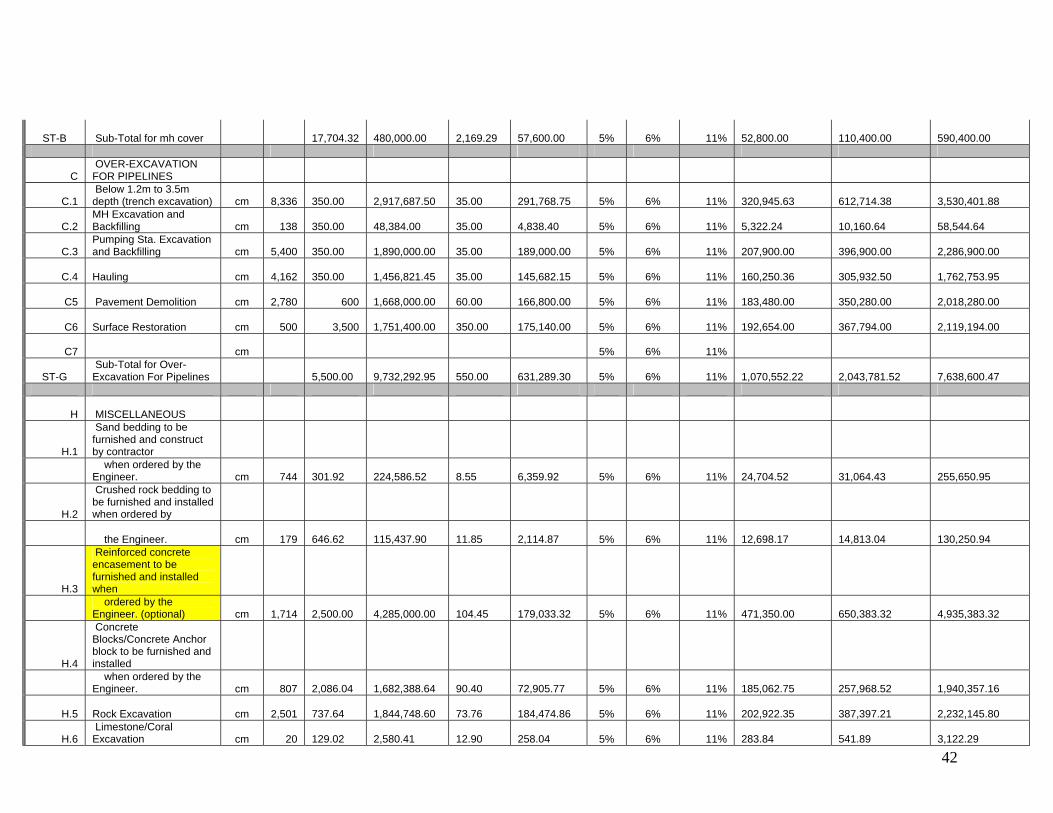
H.3
Reinforced concrete encasement to be furnished and installed when
ordered by the Engineer. (optional) cm 1,714
2,500.00
4,285,000.00
104.45
179,033.32 5% 6% 11%
471,350.00
650,383.32
4,935,383.32
H.4
Concrete Blocks/Concrete Anchor block to be furnished and installed
when ordered by the Engineer. cm 877
2,086.04
1,828,411.21
90.40
79,233.61 5% 6% 11%
201,125.23
280,358.85
2,108,770.06
H.5 Rock Excavation cm 2,906 737.64
2,143,493.31
73.76
214,349.33 5% 6% 11%
235,784.26
450,133.60
2,593,626.91
H.6 Limestone/Coral Excavation cm 20 129.02
2,580.41
12.90
258.04 5% 6% 11%
283.84
541.89
3,122.29
ST-H Sub-Total for Miscellaneous 6,401 8,629,399.87
301.91
482,195.54 5% 6% 11%
949,233.99
1,431,429.53
10,060,829.40
PART II - CIVIL WORKS
A STRUCTURES
A.1 Concrete Manhole & Pumping Sta. structure
1.2.1 Concrete MH cum 152 3,500.00
532,224.00
350.00
193,698.81 5% 6% 11%
58,544.64
252,243.45
784,467.45
2.1.2 Pumping Sta cum 502 3,500.00
1,758,400.00
350.00
6,068.45 5% 6% 11%
193,424.00
199,492.45
1,957,892.45
A.2 Line and profile survey km 4 25,000.00
109,562.50
2,500.00
6,068.45 5% 6% 11%
12,051.88
18,120.33
127,682.83
7,000.00
2,290,624.00
700.00
199,767.26 5% 6%
251,968.64
451,735.90
2,742,359.90
A.1 Submersible Pump Complete with Accessories and control set 12 300,000
3,600,000.00
36,000.00
432,000.00 5% 6% 11%
396,000.00
828,000.00
4,428,000.00
A.2 Valves and Fittings (G.I. Pipe) set 72 5,000 360,000.00
600.00
43,200.00 5% 6% 11%
39,600.00
82,800.00
442,800.00
A.3 HDPE Fittings set 2,710 956 5% 6% 11%
33
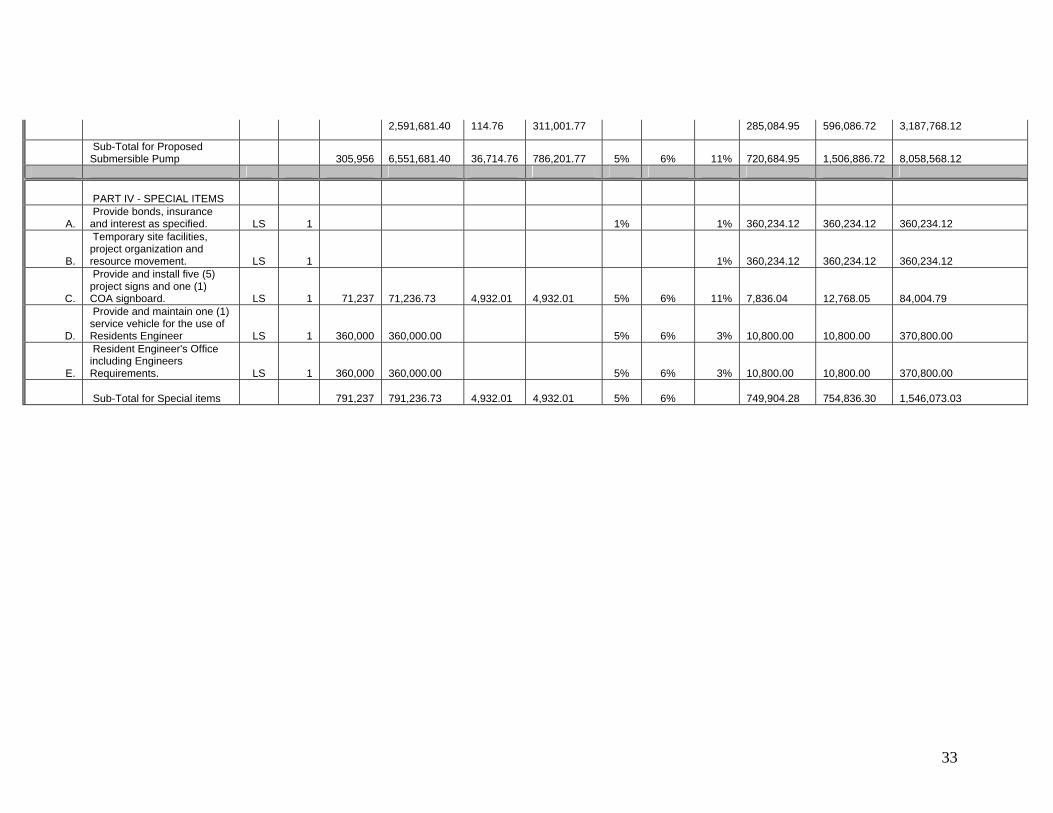
2,591,681.40 114.76 311,001.77 285,084.95 596,086.72 3,187,768.12
Sub-Total for Proposed Submersible Pump 305,956
6,551,681.40
36,714.76
786,201.77 5% 6% 11%
720,684.95
1,506,886.72
8,058,568.12
PART IV - SPECIAL ITEMS
A. Provide bonds, insurance and interest as specified. LS 1 1% 1%
360,234.12
360,234.12
360,234.12
B.
Temporary site facilities, project organization and resource movement. LS 1 1%
360,234.12
360,234.12
360,234.12
C.
Provide and install five (5) project signs and one (1) COA signboard. LS 1 71,237
71,236.73
4,932.01
4,932.01 5% 6% 11%
7,836.04
12,768.05
84,004.79
D.
Provide and maintain one (1) service vehicle for the use of Residents Engineer LS 1 360,000
360,000.00 5% 6% 3%
10,800.00
10,800.00
370,800.00
E.
Resident Engineer's Office including Engineers Requirements. LS 1 360,000
360,000.00 5% 6% 3%
10,800.00
10,800.00
370,800.00
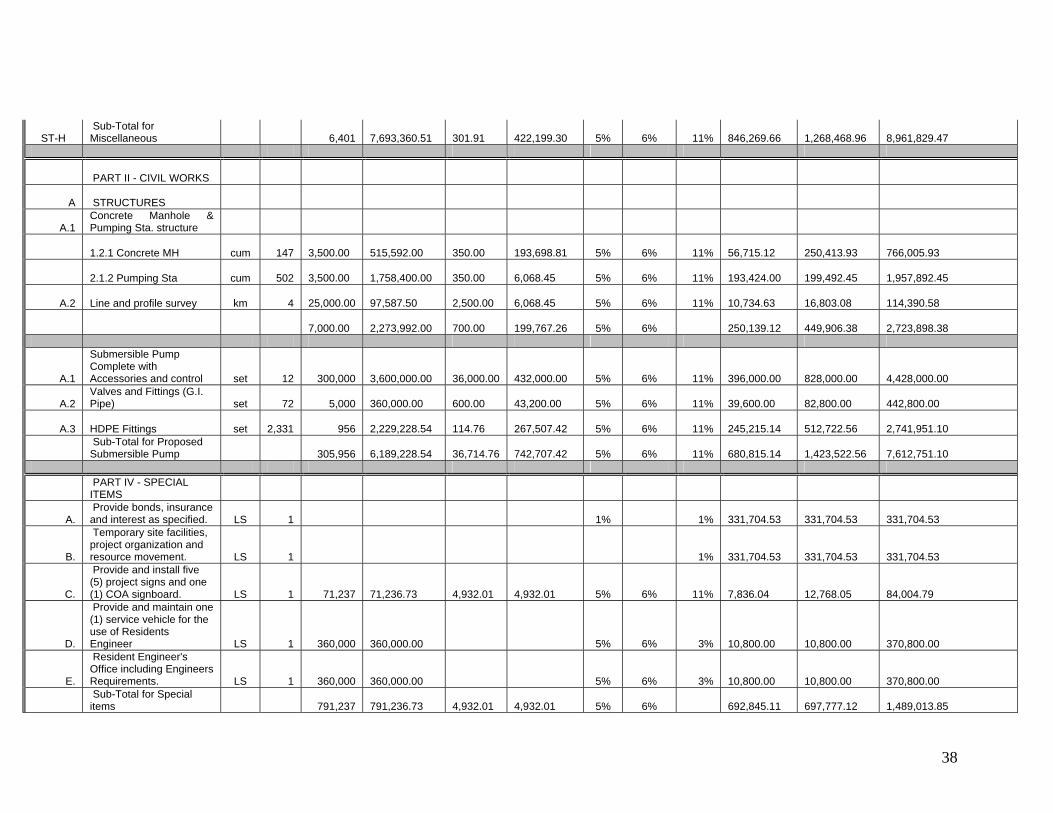
Sub-Total for Special items 791,237 791,236.73
4,932.01
4,932.01 5% 6%
749,904.28
754,836.30
1,546,073.03
34
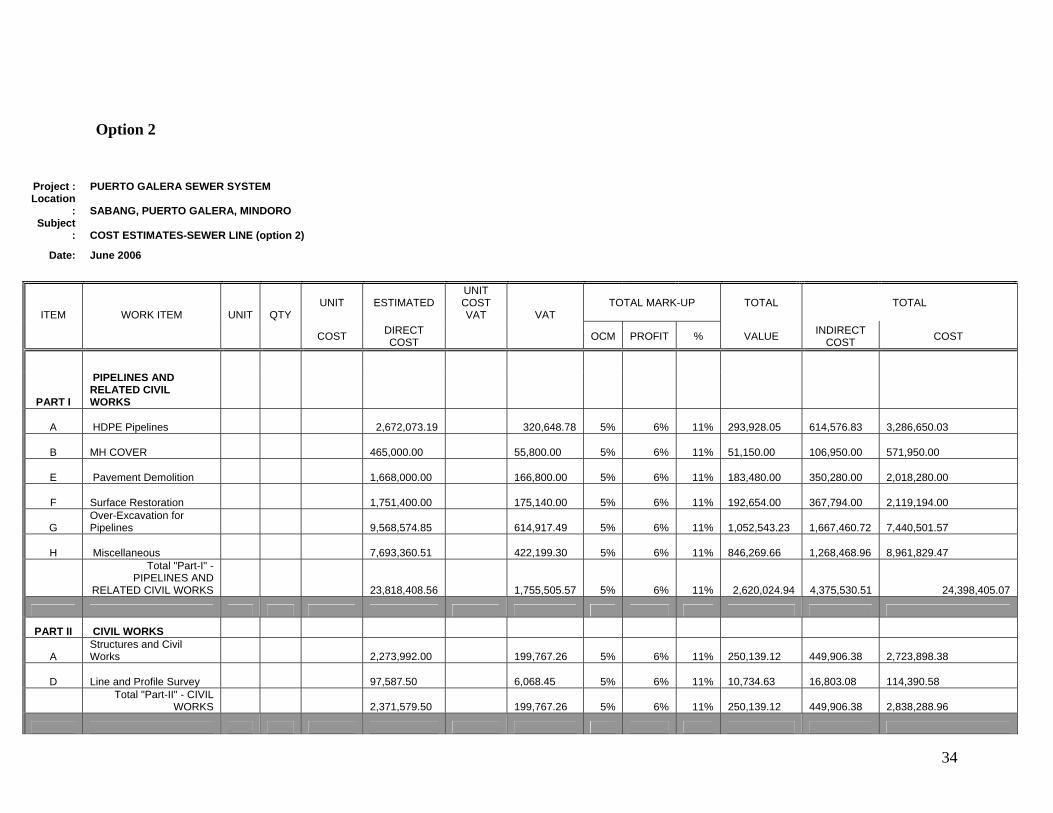
Option 2
Project : PUERTO GALERA SEWER SYSTEM Location
: SABANG, PUERTO GALERA, MINDORO Subject
: COST ESTIMATES-SEWER LINE (option 2)
Date: June 2006
UNIT ESTIMATED UNIT COST VAT
TOTAL MARK-UP TOTAL TOTAL ITEM WORK ITEM UNIT QTY
COST DIRECT COST
VAT
OCM PROFIT % VALUE INDIRECT COST COST
PART I
PIPELINES AND RELATED CIVIL WORKS
A HDPE Pipelines 2,672,073.19 320,648.78 5% 6% 11% 293,928.05
614,576.83
3,286,650.03
B MH COVER 465,000.00
55,800.00 5% 6% 11%
51,150.00
106,950.00
571,950.00
E Pavement Demolition 1,668,000.00
166,800.00 5% 6% 11%
183,480.00
350,280.00
2,018,280.00
F Surface Restoration 1,751,400.00
175,140.00 5% 6% 11%
192,654.00
367,794.00
2,119,194.00
G Over-Excavation for Pipelines
9,568,574.85
614,917.49 5% 6% 11%
1,052,543.23
1,667,460.72
7,440,501.57
H Miscellaneous 7,693,360.51
422,199.30 5% 6% 11%
846,269.66
1,268,468.96
8,961,829.47
Total "Part-I" - PIPELINES AND
RELATED CIVIL WORKS 23,818,408.56 1,755,505.57 5% 6% 11% 2,620,024.94 4,375,530.51 24,398,405.07
PART II CIVIL WORKS
A Structures and Civil Works
2,273,992.00
199,767.26 5% 6% 11%
250,139.12
449,906.38
2,723,898.38
D Line and Profile Survey 97,587.50
6,068.45 5% 6% 11%
10,734.63
16,803.08
114,390.58
Total "Part-II" - CIVIL
WORKS 2,371,579.50
199,767.26 5% 6% 11%
250,139.12
449,906.38
2,838,288.96
35
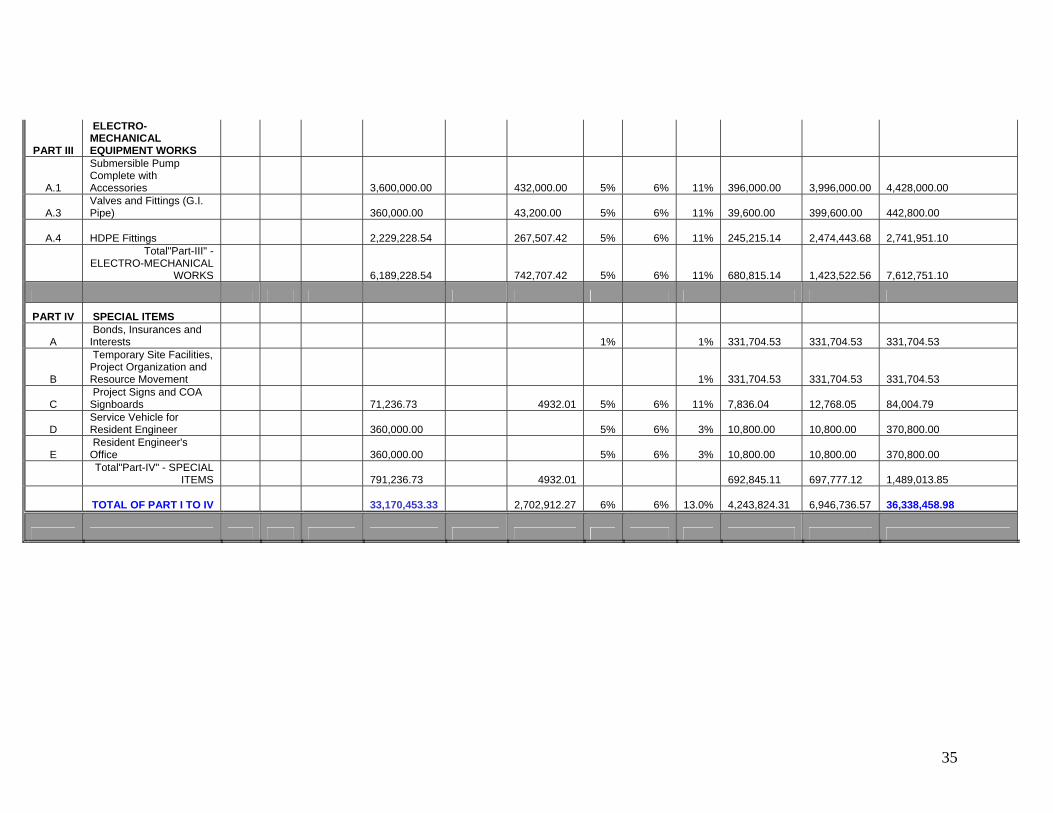
PART III
ELECTRO-MECHANICAL EQUIPMENT WORKS
A.1
Submersible Pump Complete with Accessories
3,600,000.00
432,000.00 5% 6% 11%
396,000.00
3,996,000.00
4,428,000.00
A.3 Valves and Fittings (G.I. Pipe)
360,000.00
43,200.00 5% 6% 11%
39,600.00
399,600.00
442,800.00
A.4 HDPE Fittings 2,229,228.54
267,507.42 5% 6% 11%
245,215.14
2,474,443.68
2,741,951.10
Total"Part-III" - ELECTRO-MECHANICAL
WORKS 6,189,228.54
742,707.42 5% 6% 11%
680,815.14
1,423,522.56
7,612,751.10
PART IV SPECIAL ITEMS
A Bonds, Insurances and Interests 1% 1%
331,704.53
331,704.53
331,704.53
B
Temporary Site Facilities, Project Organization and Resource Movement 1%
331,704.53
331,704.53
331,704.53
C Project Signs and COA Signboards
71,236.73 4932.01 5% 6% 11%
7,836.04
12,768.05
84,004.79
D Service Vehicle for Resident Engineer
360,000.00 5% 6% 3%
10,800.00
10,800.00
370,800.00
E Resident Engineer's Office
360,000.00 5% 6% 3%
10,800.00
10,800.00
370,800.00
Total"Part-IV" - SPECIAL
ITEMS 791,236.73 4932.01
692,845.11
697,777.12
1,489,013.85
TOTAL OF PART I TO IV 33,170,453.33
2,702,912.27 6% 6% 13.0%
4,243,824.31
6,946,736.57
36,338,458.98
36
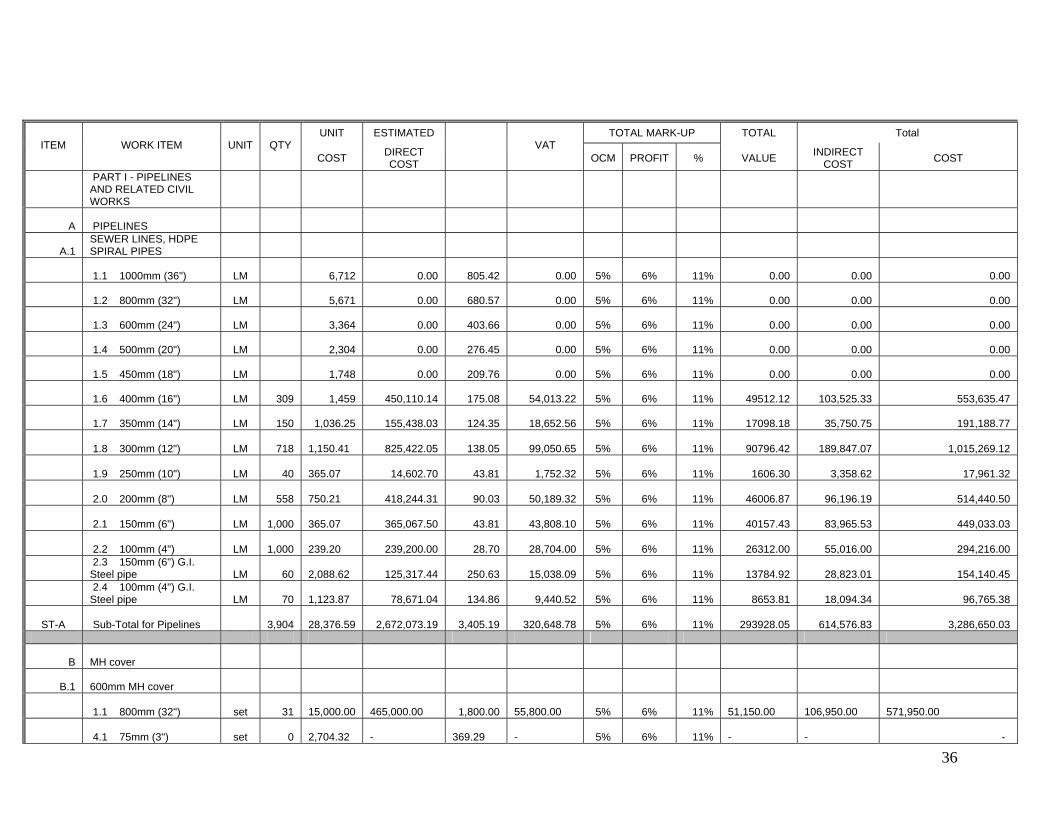
UNIT ESTIMATED TOTAL MARK-UP TOTAL Total ITEM WORK ITEM UNIT QTY
COST DIRECT COST
VAT OCM PROFIT % VALUE INDIRECT
COST COST
PART I - PIPELINES AND RELATED CIVIL WORKS
A PIPELINES
A.1 SEWER LINES, HDPE SPIRAL PIPES
1.1 1000mm (36") LM 6,712 0.00 805.42 0.00 5% 6% 11% 0.00 0.00 0.00
1.2 800mm (32") LM 5,671 0.00 680.57 0.00 5% 6% 11% 0.00 0.00 0.00
1.3 600mm (24") LM 3,364 0.00 403.66 0.00 5% 6% 11% 0.00 0.00 0.00
1.4 500mm (20") LM 2,304 0.00 276.45 0.00 5% 6% 11% 0.00 0.00 0.00
1.5 450mm (18") LM 1,748 0.00 209.76 0.00 5% 6% 11% 0.00 0.00 0.00
1.6 400mm (16") LM 309 1,459 450,110.14 175.08 54,013.22 5% 6% 11% 49512.12 103,525.33 553,635.47
1.7 350mm (14") LM 150 1,036.25 155,438.03 124.35 18,652.56 5% 6% 11% 17098.18 35,750.75 191,188.77
1.8 300mm (12") LM 718 1,150.41 825,422.05 138.05 99,050.65 5% 6% 11% 90796.42 189,847.07 1,015,269.12
1.9 250mm (10") LM 40 365.07 14,602.70 43.81 1,752.32 5% 6% 11% 1606.30 3,358.62 17,961.32
2.0 200mm (8") LM 558 750.21 418,244.31 90.03 50,189.32 5% 6% 11% 46006.87 96,196.19 514,440.50
2.1 150mm (6") LM 1,000 365.07 365,067.50 43.81 43,808.10 5% 6% 11% 40157.43 83,965.53 449,033.03
2.2 100mm (4") LM 1,000 239.20 239,200.00 28.70 28,704.00 5% 6% 11% 26312.00 55,016.00 294,216.00
2.3 150mm (6") G.I. Steel pipe LM 60
2,088.62 125,317.44 250.63 15,038.09 5% 6% 11% 13784.92 28,823.01 154,140.45
2.4 100mm (4") G.I. Steel pipe LM 70
1,123.87 78,671.04 134.86 9,440.52 5% 6% 11% 8653.81 18,094.34 96,765.38
ST-A Sub-Total for Pipelines 3,904 28,376.59 2,672,073.19 3,405.19 320,648.78 5% 6% 11% 293928.05 614,576.83 3,286,650.03
B MH cover
B.1 600mm MH cover
1.1 800mm (32") set 31 15,000.00
465,000.00 1,800.00
55,800.00 5% 6% 11%
51,150.00
106,950.00
571,950.00
4.1 75mm (3") set 0 2,704.32
-
369.29
- 5% 6% 11%
-
- -
37
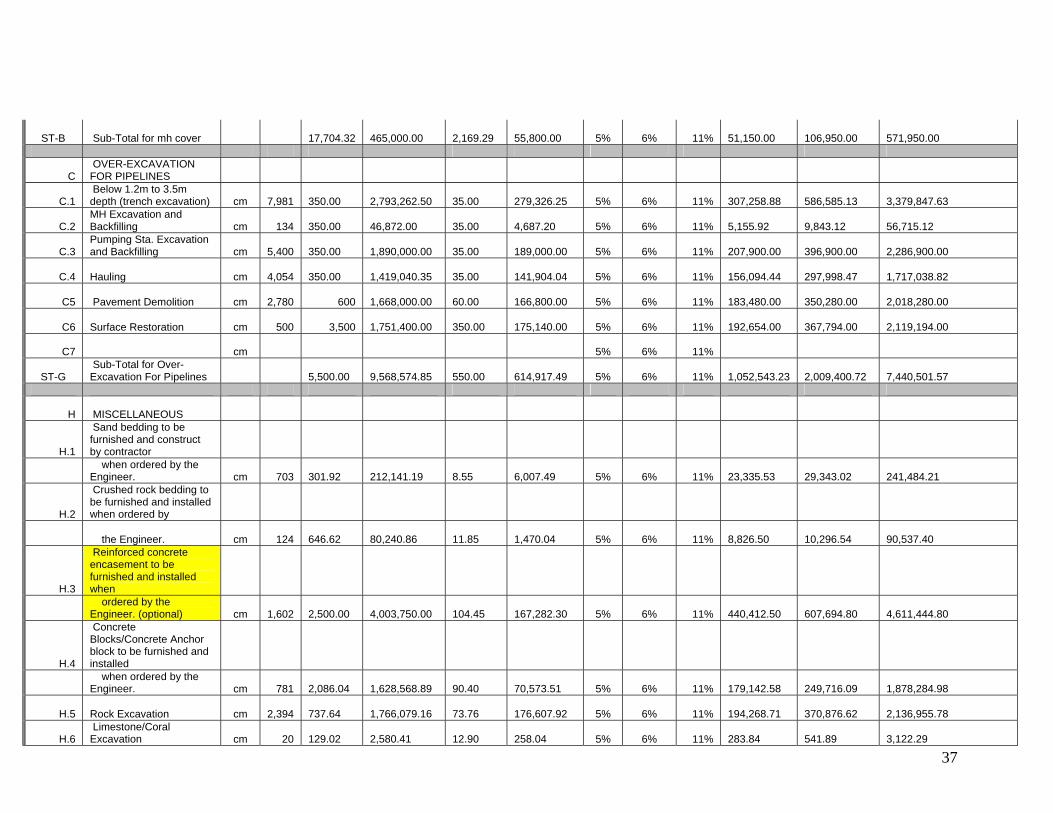
ST-B Sub-Total for mh cover 17,704.32
465,000.00
2,169.29
55,800.00 5% 6% 11%
51,150.00
106,950.00
571,950.00
C OVER-EXCAVATION FOR PIPELINES
C.1 Below 1.2m to 3.5m depth (trench excavation) cm 7,981
350.00
2,793,262.50
35.00
279,326.25 5% 6% 11%
307,258.88
586,585.13
3,379,847.63
C.2 MH Excavation and Backfilling cm 134
350.00
46,872.00
35.00
4,687.20 5% 6% 11%
5,155.92
9,843.12
56,715.12
C.3 Pumping Sta. Excavation and Backfilling cm 5,400
350.00
1,890,000.00
35.00
189,000.00 5% 6% 11%
207,900.00
396,900.00
2,286,900.00
C.4 Hauling cm 4,054 350.00
1,419,040.35
35.00
141,904.04 5% 6% 11%
156,094.44
297,998.47
1,717,038.82
C5 Pavement Demolition cm 2,780 600 1,668,000.00
60.00
166,800.00 5% 6% 11%
183,480.00
350,280.00
2,018,280.00
C6 Surface Restoration cm 500 3,500 1,751,400.00
350.00
175,140.00 5% 6% 11%
192,654.00
367,794.00
2,119,194.00
C7 cm 5% 6% 11%
ST-G Sub-Total for Over-Excavation For Pipelines
5,500.00
9,568,574.85
550.00
614,917.49 5% 6% 11%
1,052,543.23
2,009,400.72
7,440,501.57
H MISCELLANEOUS
H.1
Sand bedding to be furnished and construct by contractor
when ordered by the Engineer. cm 703
301.92
212,141.19
8.55
6,007.49 5% 6% 11%
23,335.53
29,343.02
241,484.21
H.2
Crushed rock bedding to be furnished and installed when ordered by
the Engineer. cm 124 646.62
80,240.86
11.85
1,470.04 5% 6% 11%
8,826.50
10,296.54
90,537.40
H.3
Reinforced concrete encasement to be furnished and installed when
ordered by the Engineer. (optional) cm 1,602
2,500.00
4,003,750.00
104.45
167,282.30 5% 6% 11%
440,412.50
607,694.80
4,611,444.80
H.4
Concrete Blocks/Concrete Anchor block to be furnished and installed
when ordered by the Engineer. cm 781
2,086.04
1,628,568.89
90.40
70,573.51 5% 6% 11%
179,142.58
249,716.09
1,878,284.98
H.5 Rock Excavation cm 2,394 737.64
1,766,079.16
73.76
176,607.92 5% 6% 11%
194,268.71
370,876.62
2,136,955.78
H.6 Limestone/Coral Excavation cm 20
129.02
2,580.41
12.90
258.04 5% 6% 11%
283.84
541.89
3,122.29
38
ST-H Sub-Total for Miscellaneous 6,401
7,693,360.51
301.91
422,199.30 5% 6% 11%
846,269.66
1,268,468.96
8,961,829.47
PART II - CIVIL WORKS
A STRUCTURES
A.1 Concrete Manhole & Pumping Sta. structure
1.2.1 Concrete MH cum 147 3,500.00
515,592.00
350.00
193,698.81 5% 6% 11%
56,715.12
250,413.93
766,005.93
2.1.2 Pumping Sta cum 502 3,500.00
1,758,400.00
350.00
6,068.45 5% 6% 11%
193,424.00
199,492.45
1,957,892.45
A.2 Line and profile survey km 4 25,000.00
97,587.50
2,500.00
6,068.45 5% 6% 11%
10,734.63
16,803.08
114,390.58
7,000.00
2,273,992.00
700.00
199,767.26 5% 6%
250,139.12
449,906.38
2,723,898.38
A.1
Submersible Pump Complete with Accessories and control set 12 300,000
3,600,000.00
36,000.00
432,000.00 5% 6% 11%
396,000.00
828,000.00
4,428,000.00
A.2 Valves and Fittings (G.I. Pipe) set 72 5,000
360,000.00
600.00
43,200.00 5% 6% 11%
39,600.00
82,800.00
442,800.00
A.3 HDPE Fittings set 2,331 956 2,229,228.54
114.76
267,507.42 5% 6% 11%
245,215.14
512,722.56
2,741,951.10
Sub-Total for Proposed Submersible Pump 305,956
6,189,228.54
36,714.76
742,707.42 5% 6% 11%
680,815.14
1,423,522.56
7,612,751.10
PART IV - SPECIAL ITEMS
A. Provide bonds, insurance and interest as specified. LS 1 1% 1%
331,704.53
331,704.53
331,704.53
B.
Temporary site facilities, project organization and resource movement. LS 1 1%
331,704.53
331,704.53
331,704.53
C.
Provide and install five (5) project signs and one (1) COA signboard. LS 1 71,237
71,236.73
4,932.01
4,932.01 5% 6% 11%
7,836.04
12,768.05
84,004.79
D.
Provide and maintain one (1) service vehicle for the use of Residents Engineer LS 1 360,000
360,000.00 5% 6% 3%
10,800.00
10,800.00
370,800.00
E.
Resident Engineer's Office including Engineers Requirements. LS 1 360,000
360,000.00 5% 6% 3%
10,800.00
10,800.00
370,800.00
Sub-Total for Special items 791,237
791,236.73
4,932.01
4,932.01 5% 6%
692,845.11
697,777.12
1,489,013.85
39
Option 3
Project : PUERTO GALERA SEWER SYSTEM Location
: SABANG, PUERTO GALERA, MINDORO
Subject : COST ESTIMATES-SEWER LINE (option 3)
Date: June 2006
UNIT ESTIMATED UNIT COST VAT
TOTAL MARK-UP TOTAL TOTAL ITEM WORK ITEM UNIT QTY
COST DIRECT COST
VAT
OCM PROFIT % VALUE INDIRECT COST COST
PART I
PIPELINES AND RELATED CIVIL WORKS
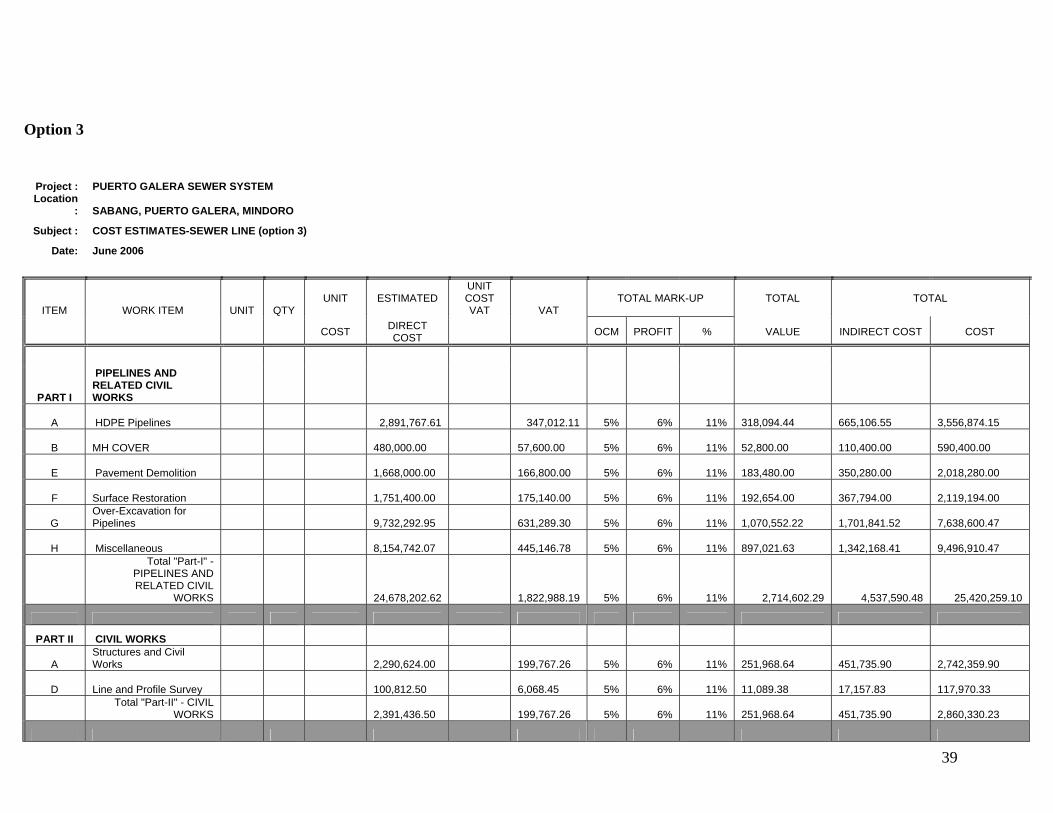
A HDPE Pipelines 2,891,767.61 347,012.11 5% 6% 11% 318,094.44
665,106.55
3,556,874.15
B MH COVER 480,000.00
57,600.00 5% 6% 11%
52,800.00
110,400.00
590,400.00
E Pavement Demolition 1,668,000.00
166,800.00 5% 6% 11%
183,480.00
350,280.00
2,018,280.00
F Surface Restoration 1,751,400.00
175,140.00 5% 6% 11%
192,654.00
367,794.00
2,119,194.00
G Over-Excavation for Pipelines
9,732,292.95
631,289.30 5% 6% 11%
1,070,552.22
1,701,841.52
7,638,600.47
H Miscellaneous 8,154,742.07
445,146.78 5% 6% 11%
897,021.63
1,342,168.41
9,496,910.47
Total "Part-I" - PIPELINES AND RELATED CIVIL
WORKS 24,678,202.62 1,822,988.19 5% 6% 11% 2,714,602.29 4,537,590.48 25,420,259.10
PART II CIVIL WORKS
A Structures and Civil Works
2,290,624.00
199,767.26 5% 6% 11%
251,968.64
451,735.90
2,742,359.90
D Line and Profile Survey 100,812.50
6,068.45 5% 6% 11%
11,089.38
17,157.83
117,970.33
Total "Part-II" - CIVIL
WORKS 2,391,436.50
199,767.26 5% 6% 11%
251,968.64
451,735.90
2,860,330.23
40
PART III
ELECTRO-MECHANICAL EQUIPMENT WORKS
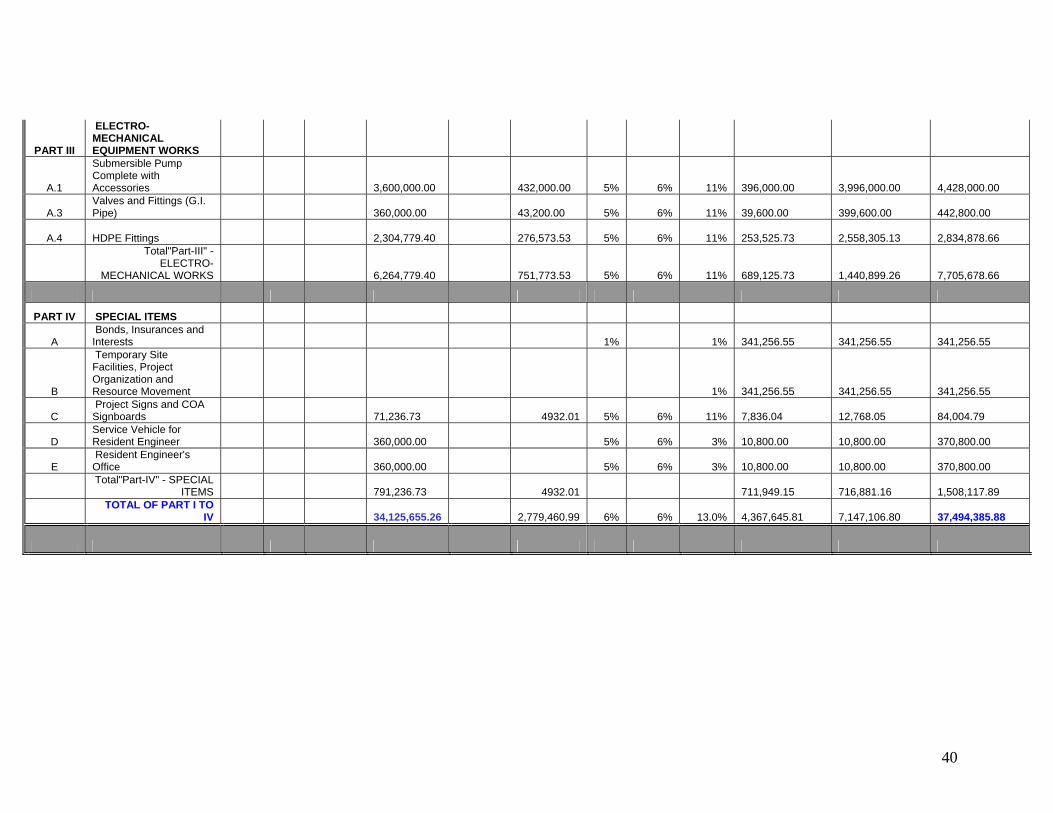
A.1
Submersible Pump Complete with Accessories
3,600,000.00
432,000.00 5% 6% 11%
396,000.00
3,996,000.00
4,428,000.00
A.3 Valves and Fittings (G.I. Pipe)
360,000.00
43,200.00 5% 6% 11%
39,600.00
399,600.00
442,800.00
A.4 HDPE Fittings 2,304,779.40
276,573.53 5% 6% 11%
253,525.73
2,558,305.13
2,834,878.66
Total"Part-III" - ELECTRO-
MECHANICAL WORKS 6,264,779.40
751,773.53 5% 6% 11%
689,125.73
1,440,899.26
7,705,678.66
PART IV SPECIAL ITEMS
A Bonds, Insurances and Interests 1% 1%
341,256.55
341,256.55
341,256.55
B
Temporary Site Facilities, Project Organization and Resource Movement 1%
341,256.55
341,256.55
341,256.55
C Project Signs and COA Signboards
71,236.73 4932.01 5% 6% 11%
7,836.04
12,768.05
84,004.79
D Service Vehicle for Resident Engineer
360,000.00 5% 6% 3%
10,800.00
10,800.00
370,800.00
E Resident Engineer's Office
360,000.00 5% 6% 3%
10,800.00
10,800.00
370,800.00
Total"Part-IV" - SPECIAL
ITEMS 791,236.73 4932.01
711,949.15
716,881.16
1,508,117.89
TOTAL OF PART I TO
IV 34,125,655.26
2,779,460.99 6% 6% 13.0%
4,367,645.81
7,147,106.80
37,494,385.88
41
UNIT ESTIMATED TOTAL MARK-UP TOTAL Total ITEM WORK ITEM UNIT QTY
COST DIRECT COST
VAT OCM PROFIT % VALUE INDIRECT COST COST
PART I - PIPELINES AND RELATED CIVIL WORKS
A PIPELINES
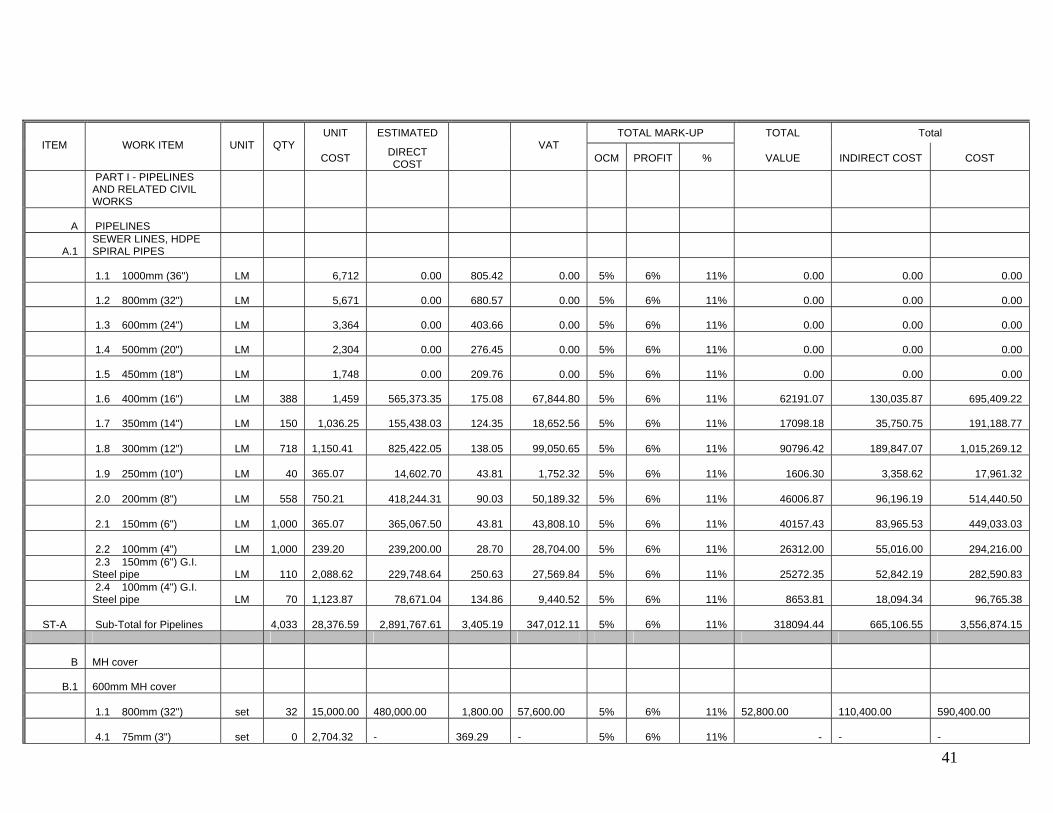
A.1 SEWER LINES, HDPE SPIRAL PIPES
1.1 1000mm (36") LM 6,712 0.00 805.42 0.00 5% 6% 11% 0.00 0.00 0.00
1.2 800mm (32") LM 5,671 0.00 680.57 0.00 5% 6% 11% 0.00 0.00 0.00
1.3 600mm (24") LM 3,364 0.00 403.66 0.00 5% 6% 11% 0.00 0.00 0.00
1.4 500mm (20") LM 2,304 0.00 276.45 0.00 5% 6% 11% 0.00 0.00 0.00
1.5 450mm (18") LM 1,748 0.00 209.76 0.00 5% 6% 11% 0.00 0.00 0.00
1.6 400mm (16") LM 388 1,459 565,373.35 175.08 67,844.80 5% 6% 11% 62191.07 130,035.87 695,409.22
1.7 350mm (14") LM 150 1,036.25 155,438.03 124.35 18,652.56 5% 6% 11% 17098.18 35,750.75 191,188.77
1.8 300mm (12") LM 718 1,150.41 825,422.05 138.05 99,050.65 5% 6% 11% 90796.42 189,847.07 1,015,269.12
1.9 250mm (10") LM 40 365.07 14,602.70 43.81 1,752.32 5% 6% 11% 1606.30 3,358.62 17,961.32
2.0 200mm (8") LM 558 750.21 418,244.31 90.03 50,189.32 5% 6% 11% 46006.87 96,196.19 514,440.50
2.1 150mm (6") LM 1,000 365.07 365,067.50 43.81 43,808.10 5% 6% 11% 40157.43 83,965.53 449,033.03
2.2 100mm (4") LM 1,000 239.20 239,200.00 28.70 28,704.00 5% 6% 11% 26312.00 55,016.00 294,216.00
2.3 150mm (6") G.I. Steel pipe LM 110
2,088.62 229,748.64 250.63 27,569.84 5% 6% 11% 25272.35 52,842.19 282,590.83
2.4 100mm (4") G.I. Steel pipe LM 70
1,123.87 78,671.04 134.86 9,440.52 5% 6% 11% 8653.81 18,094.34 96,765.38
ST-A Sub-Total for Pipelines 4,033 28,376.59 2,891,767.61 3,405.19 347,012.11 5% 6% 11% 318094.44 665,106.55 3,556,874.15
B MH cover
B.1 600mm MH cover
1.1 800mm (32") set 32 15,000.00
480,000.00 1,800.00
57,600.00 5% 6% 11%
52,800.00
110,400.00
590,400.00
4.1 75mm (3") set 0 2,704.32
-
369.29
- 5% 6% 11% -
-
-
42
ST-B Sub-Total for mh cover 17,704.32
480,000.00
2,169.29
57,600.00 5% 6% 11%
52,800.00
110,400.00
590,400.00
C OVER-EXCAVATION FOR PIPELINES
C.1 Below 1.2m to 3.5m depth (trench excavation) cm 8,336
350.00
2,917,687.50
35.00
291,768.75 5% 6% 11%
320,945.63
612,714.38
3,530,401.88
C.2 MH Excavation and Backfilling cm 138
350.00
48,384.00
35.00
4,838.40 5% 6% 11%
5,322.24
10,160.64
58,544.64
C.3 Pumping Sta. Excavation and Backfilling cm 5,400
350.00
1,890,000.00
35.00
189,000.00 5% 6% 11%
207,900.00
396,900.00
2,286,900.00
C.4 Hauling cm 4,162 350.00
1,456,821.45
35.00
145,682.15 5% 6% 11%
160,250.36
305,932.50
1,762,753.95
C5 Pavement Demolition cm 2,780 600 1,668,000.00
60.00
166,800.00 5% 6% 11%
183,480.00
350,280.00
2,018,280.00
C6 Surface Restoration cm 500 3,500 1,751,400.00
350.00
175,140.00 5% 6% 11%
192,654.00
367,794.00
2,119,194.00
C7 cm 5% 6% 11%
ST-G Sub-Total for Over-Excavation For Pipelines
5,500.00
9,732,292.95
550.00
631,289.30 5% 6% 11%
1,070,552.22
2,043,781.52
7,638,600.47
H MISCELLANEOUS
H.1
Sand bedding to be furnished and construct by contractor
when ordered by the Engineer. cm 744
301.92
224,586.52
8.55
6,359.92 5% 6% 11%
24,704.52
31,064.43
255,650.95
H.2
Crushed rock bedding to be furnished and installed when ordered by
the Engineer. cm 179 646.62
115,437.90
11.85
2,114.87 5% 6% 11%
12,698.17
14,813.04
130,250.94
H.3
Reinforced concrete encasement to be furnished and installed when
ordered by the Engineer. (optional) cm 1,714
2,500.00
4,285,000.00
104.45
179,033.32 5% 6% 11%
471,350.00
650,383.32
4,935,383.32
H.4
Concrete Blocks/Concrete Anchor block to be furnished and installed
when ordered by the Engineer. cm 807
2,086.04
1,682,388.64
90.40
72,905.77 5% 6% 11%
185,062.75
257,968.52
1,940,357.16
H.5 Rock Excavation cm 2,501 737.64
1,844,748.60
73.76
184,474.86 5% 6% 11%
202,922.35
387,397.21
2,232,145.80
H.6 Limestone/Coral Excavation cm 20
129.02
2,580.41
12.90
258.04 5% 6% 11%
283.84
541.89
3,122.29
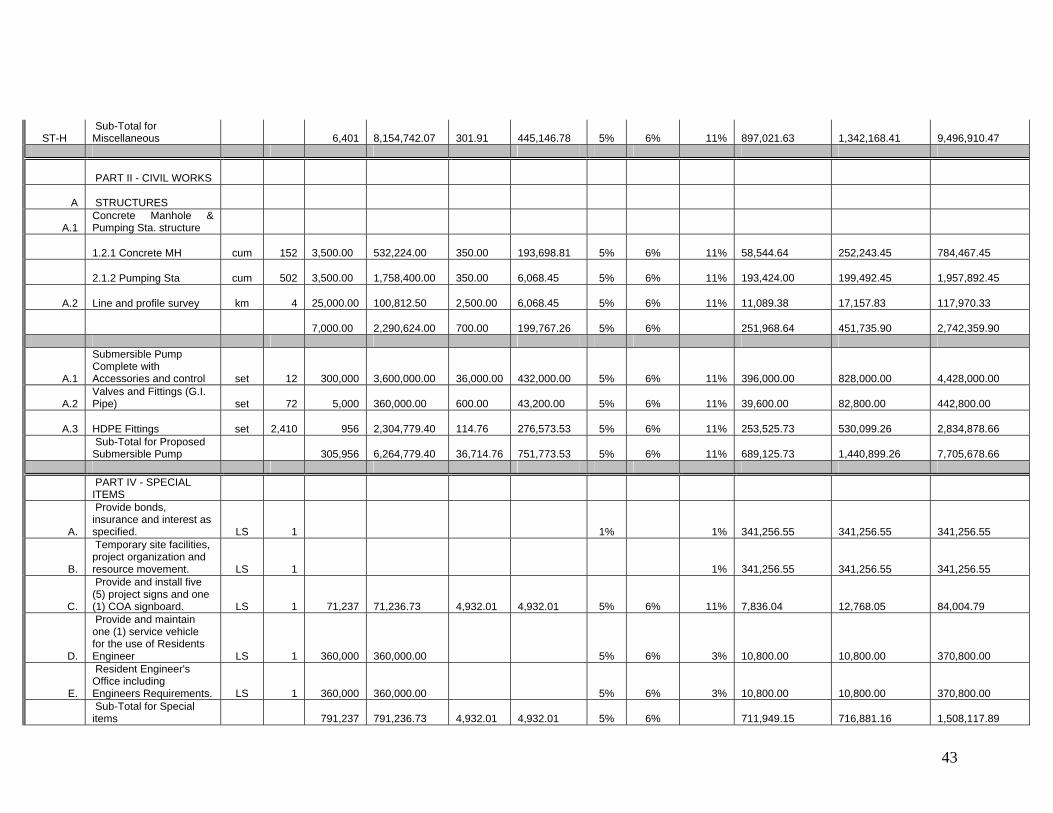
43
ST-H Sub-Total for Miscellaneous 6,401
8,154,742.07
301.91
445,146.78 5% 6% 11%
897,021.63
1,342,168.41
9,496,910.47
PART II - CIVIL WORKS
A STRUCTURES
A.1 Concrete Manhole & Pumping Sta. structure
1.2.1 Concrete MH cum 152 3,500.00
532,224.00
350.00
193,698.81 5% 6% 11%
58,544.64
252,243.45
784,467.45
2.1.2 Pumping Sta cum 502 3,500.00
1,758,400.00
350.00
6,068.45 5% 6% 11%
193,424.00
199,492.45
1,957,892.45
A.2 Line and profile survey km 4 25,000.00
100,812.50
2,500.00
6,068.45 5% 6% 11%
11,089.38
17,157.83
117,970.33
7,000.00
2,290,624.00
700.00
199,767.26 5% 6%
251,968.64
451,735.90
2,742,359.90
A.1
Submersible Pump Complete with Accessories and control set 12 300,000
3,600,000.00
36,000.00
432,000.00 5% 6% 11%
396,000.00
828,000.00
4,428,000.00
A.2 Valves and Fittings (G.I. Pipe) set 72 5,000
360,000.00
600.00
43,200.00 5% 6% 11%
39,600.00
82,800.00
442,800.00
A.3 HDPE Fittings set 2,410 956 2,304,779.40
114.76
276,573.53 5% 6% 11%
253,525.73
530,099.26
2,834,878.66
Sub-Total for Proposed Submersible Pump 305,956
6,264,779.40
36,714.76
751,773.53 5% 6% 11%
689,125.73
1,440,899.26
7,705,678.66
PART IV - SPECIAL ITEMS
A.
Provide bonds, insurance and interest as specified. LS 1 1% 1%
341,256.55
341,256.55
341,256.55
B.
Temporary site facilities, project organization and resource movement. LS 1 1%
341,256.55
341,256.55
341,256.55
C.
Provide and install five (5) project signs and one (1) COA signboard. LS 1 71,237
71,236.73
4,932.01
4,932.01 5% 6% 11%
7,836.04
12,768.05
84,004.79
D.
Provide and maintain one (1) service vehicle for the use of Residents Engineer LS 1 360,000
360,000.00 5% 6% 3%
10,800.00
10,800.00
370,800.00
E.
Resident Engineer's Office including Engineers Requirements. LS 1 360,000
360,000.00 5% 6% 3%
10,800.00
10,800.00
370,800.00
Sub-Total for Special items 791,237
791,236.73
4,932.01
4,932.01 5% 6%
711,949.15
716,881.16
1,508,117.89
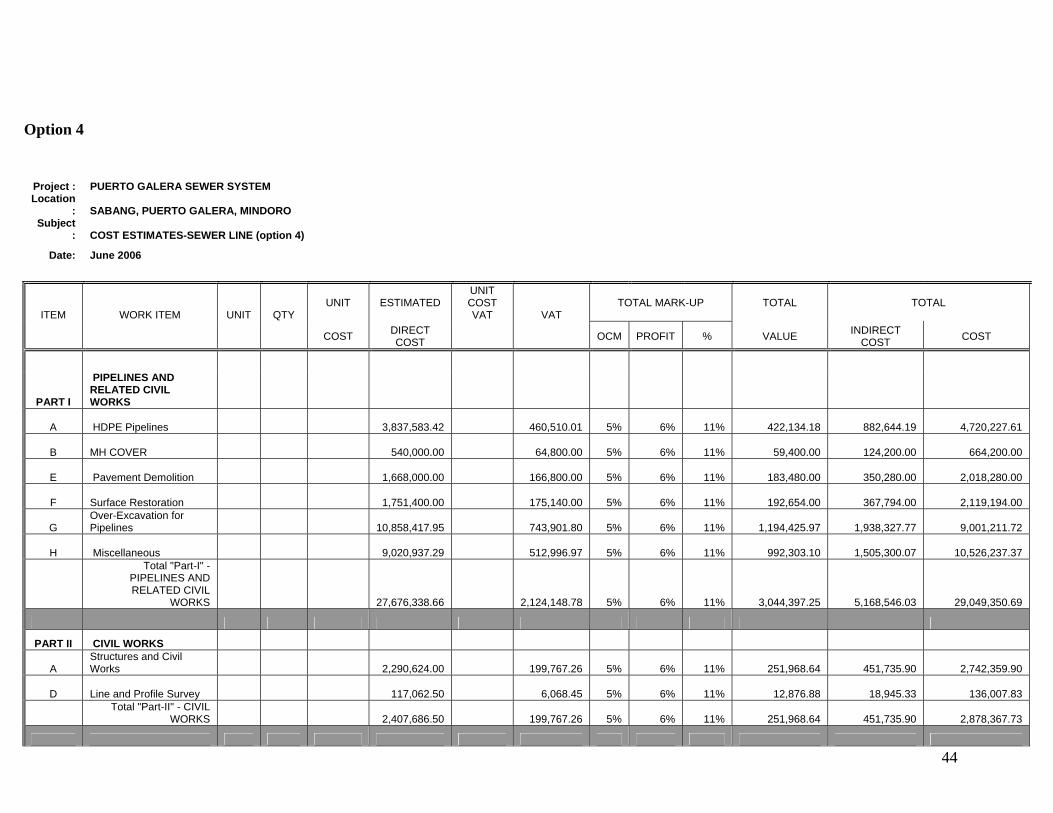
44
Option 4
Project : PUERTO GALERA SEWER SYSTEM Location
: SABANG, PUERTO GALERA, MINDORO Subject
: COST ESTIMATES-SEWER LINE (option 4)
Date: June 2006
UNIT ESTIMATED UNIT COST VAT
TOTAL MARK-UP TOTAL TOTAL ITEM WORK ITEM UNIT QTY
COST DIRECT COST
VAT
OCM PROFIT % VALUE INDIRECT COST COST
PART I
PIPELINES AND RELATED CIVIL WORKS
A HDPE Pipelines 3,837,583.42 460,510.01 5% 6% 11%
422,134.18
882,644.19
4,720,227.61
B MH COVER
540,000.00
64,800.00 5% 6% 11%
59,400.00
124,200.00
664,200.00
E Pavement Demolition
1,668,000.00
166,800.00 5% 6% 11%
183,480.00
350,280.00
2,018,280.00
F Surface Restoration
1,751,400.00
175,140.00 5% 6% 11%
192,654.00
367,794.00
2,119,194.00
G Over-Excavation for Pipelines
10,858,417.95
743,901.80 5% 6% 11%
1,194,425.97
1,938,327.77
9,001,211.72
H Miscellaneous
9,020,937.29
512,996.97 5% 6% 11%
992,303.10
1,505,300.07
10,526,237.37
Total "Part-I" - PIPELINES AND RELATED CIVIL
WORKS 27,676,338.66 2,124,148.78 5% 6% 11% 3,044,397.25 5,168,546.03 29,049,350.69
PART II CIVIL WORKS
A Structures and Civil Works
2,290,624.00
199,767.26 5% 6% 11%
251,968.64
451,735.90
2,742,359.90
D Line and Profile Survey
117,062.50
6,068.45 5% 6% 11%
12,876.88
18,945.33
136,007.83
Total "Part-II" - CIVIL
WORKS
2,407,686.50
199,767.26 5% 6% 11%
251,968.64
451,735.90
2,878,367.73
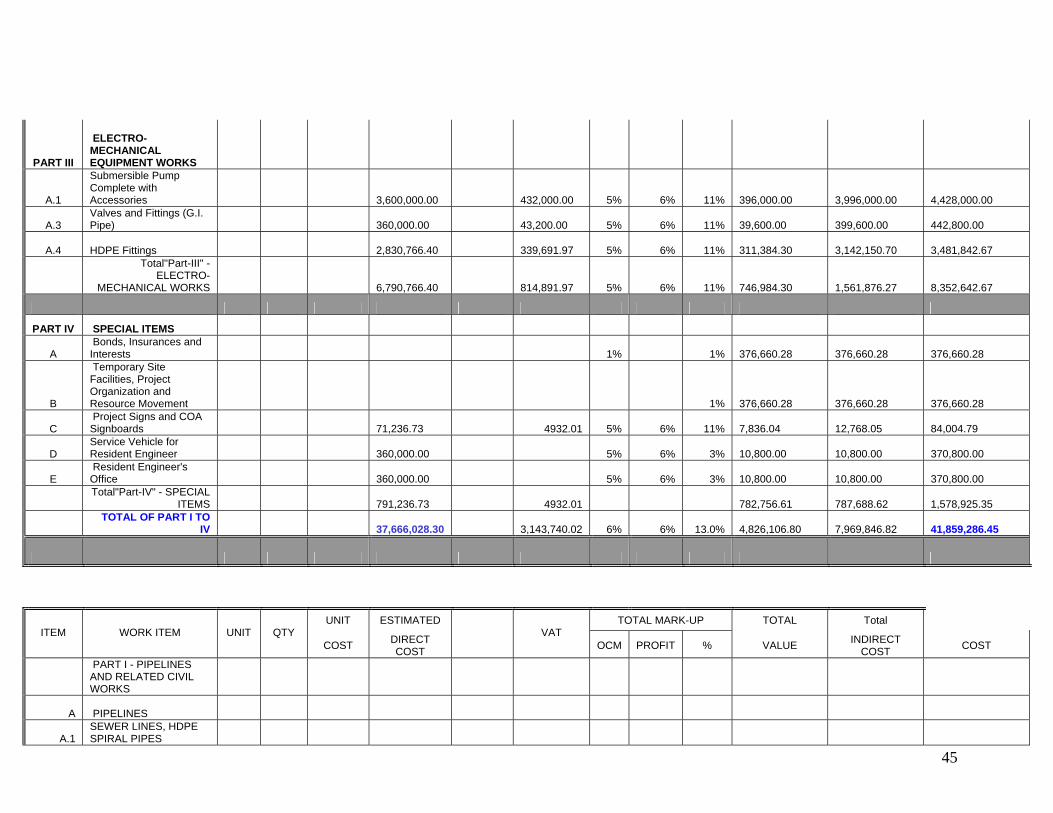
45
PART III
ELECTRO-MECHANICAL EQUIPMENT WORKS
A.1
Submersible Pump Complete with Accessories
3,600,000.00
432,000.00 5% 6% 11%
396,000.00
3,996,000.00
4,428,000.00
A.3 Valves and Fittings (G.I. Pipe)
360,000.00
43,200.00 5% 6% 11%
39,600.00
399,600.00
442,800.00
A.4 HDPE Fittings 2,830,766.40
339,691.97 5% 6% 11%
311,384.30
3,142,150.70
3,481,842.67
Total"Part-III" - ELECTRO-
MECHANICAL WORKS 6,790,766.40
814,891.97 5% 6% 11%
746,984.30
1,561,876.27
8,352,642.67
PART IV SPECIAL ITEMS
A Bonds, Insurances and Interests 1% 1%
376,660.28
376,660.28
376,660.28
B
Temporary Site Facilities, Project Organization and Resource Movement 1%
376,660.28
376,660.28
376,660.28
C Project Signs and COA Signboards
71,236.73 4932.01 5% 6% 11%
7,836.04
12,768.05
84,004.79
D Service Vehicle for Resident Engineer
360,000.00 5% 6% 3%
10,800.00
10,800.00
370,800.00
E Resident Engineer's Office
360,000.00 5% 6% 3%
10,800.00
10,800.00
370,800.00
Total"Part-IV" - SPECIAL
ITEMS 791,236.73 4932.01
782,756.61
787,688.62
1,578,925.35
TOTAL OF PART I TO
IV 37,666,028.30
3,143,740.02 6% 6% 13.0%
4,826,106.80
7,969,846.82
41,859,286.45
UNIT ESTIMATED TOTAL MARK-UP TOTAL Total ITEM WORK ITEM UNIT QTY
COST DIRECT COST
VAT OCM PROFIT % VALUE INDIRECT
COST COST
PART I - PIPELINES AND RELATED CIVIL WORKS
A PIPELINES
A.1 SEWER LINES, HDPE SPIRAL PIPES
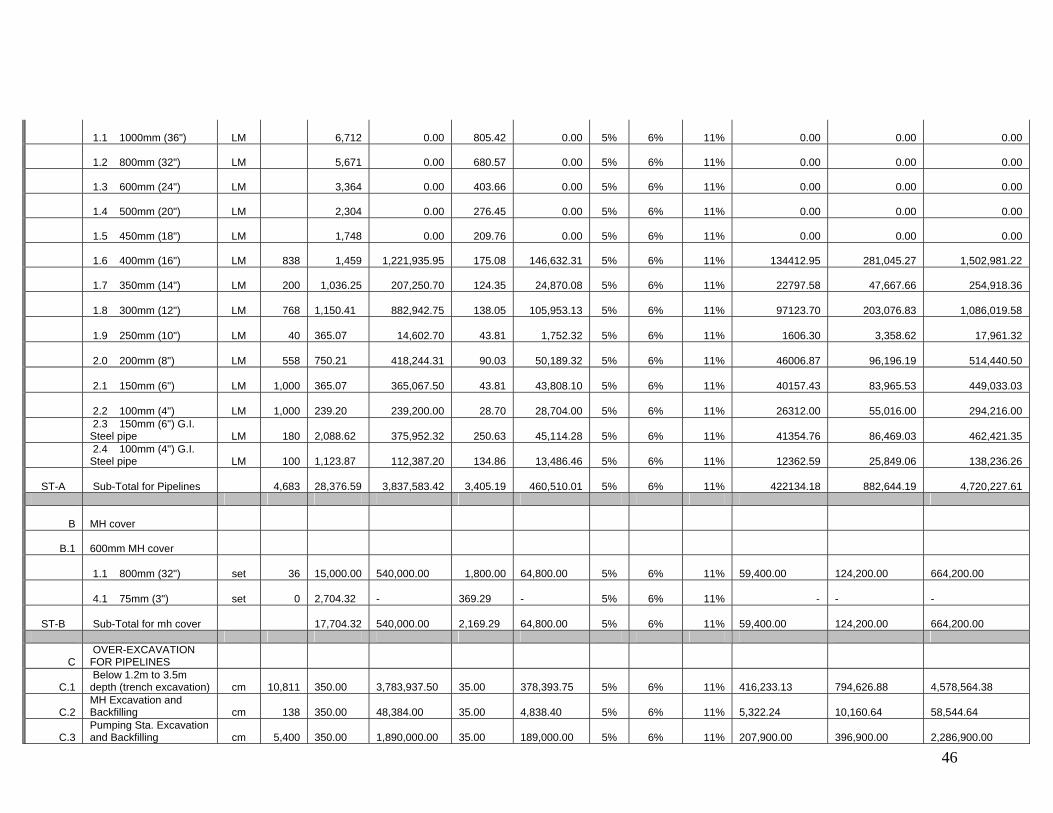
46
1.1 1000mm (36") LM 6,712 0.00 805.42 0.00 5% 6% 11% 0.00 0.00 0.00
1.2 800mm (32") LM 5,671 0.00 680.57 0.00 5% 6% 11% 0.00 0.00 0.00
1.3 600mm (24") LM 3,364 0.00 403.66 0.00 5% 6% 11% 0.00 0.00 0.00
1.4 500mm (20") LM 2,304 0.00 276.45 0.00 5% 6% 11% 0.00 0.00 0.00
1.5 450mm (18") LM 1,748 0.00 209.76 0.00 5% 6% 11% 0.00 0.00 0.00
1.6 400mm (16") LM 838 1,459 1,221,935.95 175.08 146,632.31 5% 6% 11% 134412.95 281,045.27 1,502,981.22
1.7 350mm (14") LM 200 1,036.25 207,250.70 124.35 24,870.08 5% 6% 11% 22797.58 47,667.66 254,918.36
1.8 300mm (12") LM 768 1,150.41 882,942.75 138.05 105,953.13 5% 6% 11% 97123.70 203,076.83 1,086,019.58
1.9 250mm (10") LM 40 365.07 14,602.70 43.81 1,752.32 5% 6% 11% 1606.30 3,358.62 17,961.32
2.0 200mm (8") LM 558 750.21 418,244.31 90.03 50,189.32 5% 6% 11% 46006.87 96,196.19 514,440.50
2.1 150mm (6") LM 1,000 365.07 365,067.50 43.81 43,808.10 5% 6% 11% 40157.43 83,965.53 449,033.03
2.2 100mm (4") LM 1,000 239.20 239,200.00 28.70 28,704.00 5% 6% 11% 26312.00 55,016.00 294,216.00
2.3 150mm (6") G.I. Steel pipe LM 180
2,088.62 375,952.32 250.63 45,114.28 5% 6% 11% 41354.76 86,469.03 462,421.35
2.4 100mm (4") G.I. Steel pipe LM 100
1,123.87 112,387.20 134.86 13,486.46 5% 6% 11% 12362.59 25,849.06 138,236.26
ST-A Sub-Total for Pipelines 4,683 28,376.59 3,837,583.42 3,405.19 460,510.01 5% 6% 11% 422134.18 882,644.19 4,720,227.61
B MH cover
B.1 600mm MH cover
1.1 800mm (32") set 36 15,000.00
540,000.00 1,800.00
64,800.00 5% 6% 11%
59,400.00
124,200.00
664,200.00
4.1 75mm (3") set 0 2,704.32
-
369.29
- 5% 6% 11% -
-
-
ST-B Sub-Total for mh cover 17,704.32
540,000.00
2,169.29
64,800.00 5% 6% 11%
59,400.00
124,200.00
664,200.00
C OVER-EXCAVATION FOR PIPELINES
C.1 Below 1.2m to 3.5m depth (trench excavation) cm 10,811
350.00
3,783,937.50
35.00
378,393.75 5% 6% 11%
416,233.13
794,626.88
4,578,564.38
C.2 MH Excavation and Backfilling cm 138
350.00
48,384.00
35.00
4,838.40 5% 6% 11%
5,322.24
10,160.64
58,544.64
C.3 Pumping Sta. Excavation and Backfilling cm 5,400
350.00
1,890,000.00
35.00
189,000.00 5% 6% 11%
207,900.00
396,900.00
2,286,900.00
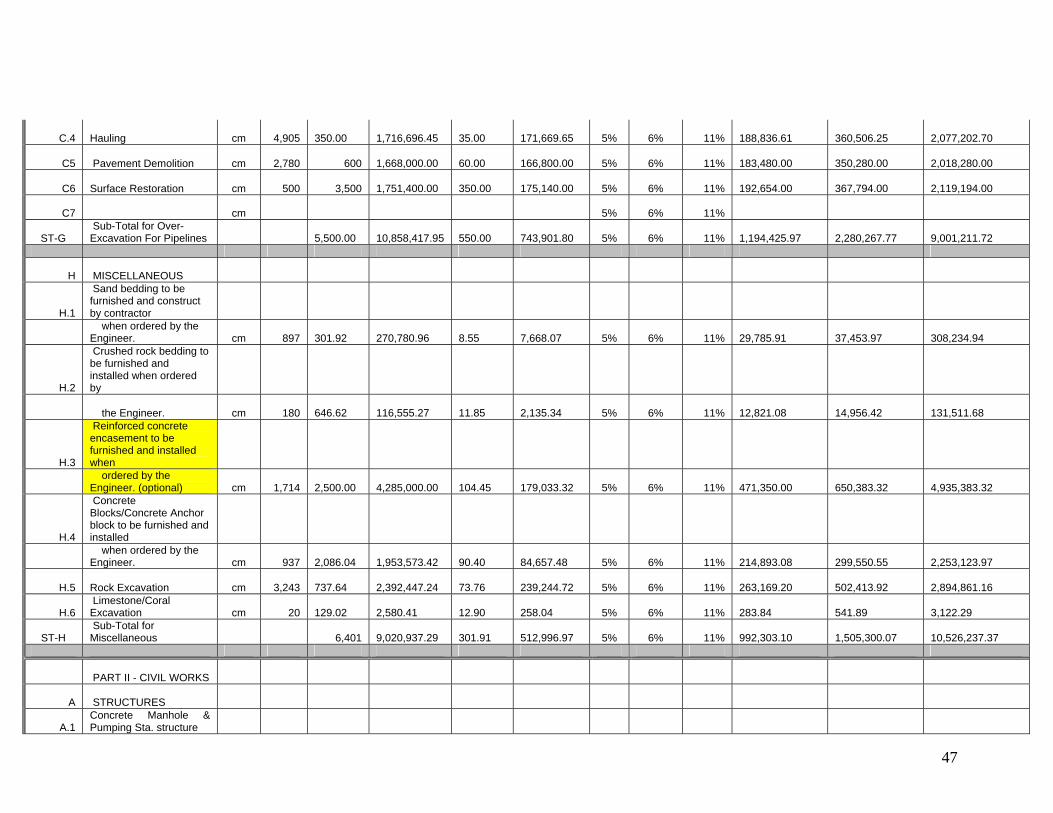
47
C.4 Hauling cm 4,905 350.00
1,716,696.45
35.00
171,669.65 5% 6% 11%
188,836.61
360,506.25
2,077,202.70
C5 Pavement Demolition cm 2,780 600 1,668,000.00
60.00
166,800.00 5% 6% 11%
183,480.00
350,280.00
2,018,280.00
C6 Surface Restoration cm 500 3,500 1,751,400.00
350.00
175,140.00 5% 6% 11%
192,654.00
367,794.00
2,119,194.00
C7 cm 5% 6% 11%
ST-G Sub-Total for Over-Excavation For Pipelines
5,500.00
10,858,417.95
550.00
743,901.80 5% 6% 11%
1,194,425.97
2,280,267.77
9,001,211.72
H MISCELLANEOUS
H.1
Sand bedding to be furnished and construct by contractor
when ordered by the Engineer. cm 897
301.92
270,780.96
8.55
7,668.07 5% 6% 11%
29,785.91
37,453.97
308,234.94
H.2
Crushed rock bedding to be furnished and installed when ordered by
the Engineer. cm 180 646.62
116,555.27
11.85
2,135.34 5% 6% 11%
12,821.08
14,956.42
131,511.68
H.3
Reinforced concrete encasement to be furnished and installed when
ordered by the Engineer. (optional) cm 1,714
2,500.00
4,285,000.00
104.45
179,033.32 5% 6% 11%
471,350.00
650,383.32
4,935,383.32
H.4
Concrete Blocks/Concrete Anchor block to be furnished and installed
when ordered by the Engineer. cm 937
2,086.04
1,953,573.42
90.40
84,657.48 5% 6% 11%
214,893.08
299,550.55
2,253,123.97
H.5 Rock Excavation cm 3,243 737.64
2,392,447.24
73.76
239,244.72 5% 6% 11%
263,169.20
502,413.92
2,894,861.16
H.6 Limestone/Coral Excavation cm 20
129.02
2,580.41
12.90
258.04 5% 6% 11%
283.84
541.89
3,122.29
ST-H Sub-Total for Miscellaneous 6,401
9,020,937.29
301.91
512,996.97 5% 6% 11%
992,303.10
1,505,300.07
10,526,237.37
PART II - CIVIL WORKS
A STRUCTURES
A.1 Concrete Manhole & Pumping Sta. structure
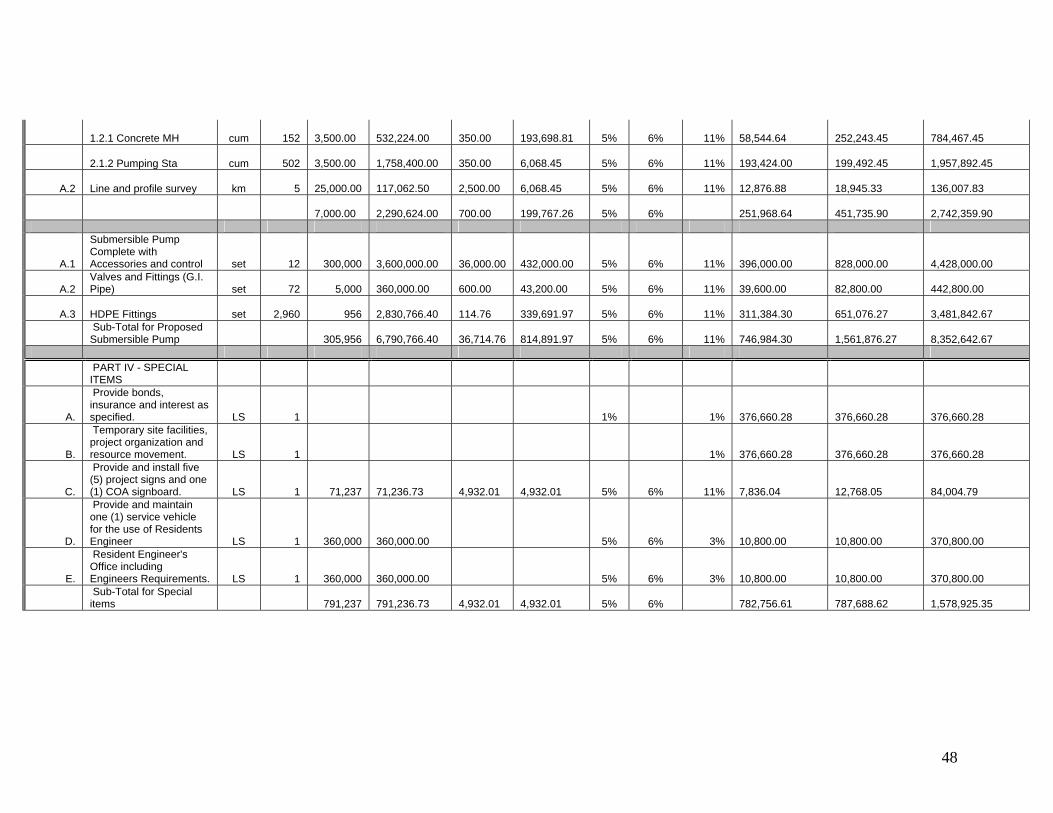
48
1.2.1 Concrete MH cum 152 3,500.00
532,224.00
350.00
193,698.81 5% 6% 11%
58,544.64
252,243.45
784,467.45
2.1.2 Pumping Sta cum 502 3,500.00
1,758,400.00
350.00
6,068.45 5% 6% 11%
193,424.00
199,492.45
1,957,892.45
A.2 Line and profile survey km 5 25,000.00
117,062.50
2,500.00
6,068.45 5% 6% 11%
12,876.88
18,945.33
136,007.83
7,000.00
2,290,624.00
700.00
199,767.26 5% 6%
251,968.64
451,735.90
2,742,359.90
A.1
Submersible Pump Complete with Accessories and control set 12 300,000
3,600,000.00
36,000.00
432,000.00 5% 6% 11%
396,000.00
828,000.00
4,428,000.00
A.2 Valves and Fittings (G.I. Pipe) set 72 5,000
360,000.00
600.00
43,200.00 5% 6% 11%
39,600.00
82,800.00
442,800.00
A.3 HDPE Fittings set 2,960 956 2,830,766.40
114.76
339,691.97 5% 6% 11%
311,384.30
651,076.27
3,481,842.67
Sub-Total for Proposed Submersible Pump 305,956
6,790,766.40
36,714.76
814,891.97 5% 6% 11%
746,984.30
1,561,876.27
8,352,642.67
PART IV - SPECIAL ITEMS
A.
Provide bonds, insurance and interest as specified. LS 1 1% 1%
376,660.28
376,660.28
376,660.28
B.
Temporary site facilities, project organization and resource movement. LS 1 1%
376,660.28
376,660.28
376,660.28
C.
Provide and install five (5) project signs and one (1) COA signboard. LS 1 71,237
71,236.73
4,932.01
4,932.01 5% 6% 11%
7,836.04
12,768.05
84,004.79
D.
Provide and maintain one (1) service vehicle for the use of Residents Engineer LS 1 360,000
360,000.00 5% 6% 3%
10,800.00
10,800.00
370,800.00
E.
Resident Engineer's Office including Engineers Requirements. LS 1 360,000
360,000.00 5% 6% 3%
10,800.00
10,800.00
370,800.00
Sub-Total for Special items 791,237
791,236.73
4,932.01
4,932.01 5% 6%
782,756.61
787,688.62
1,578,925.35
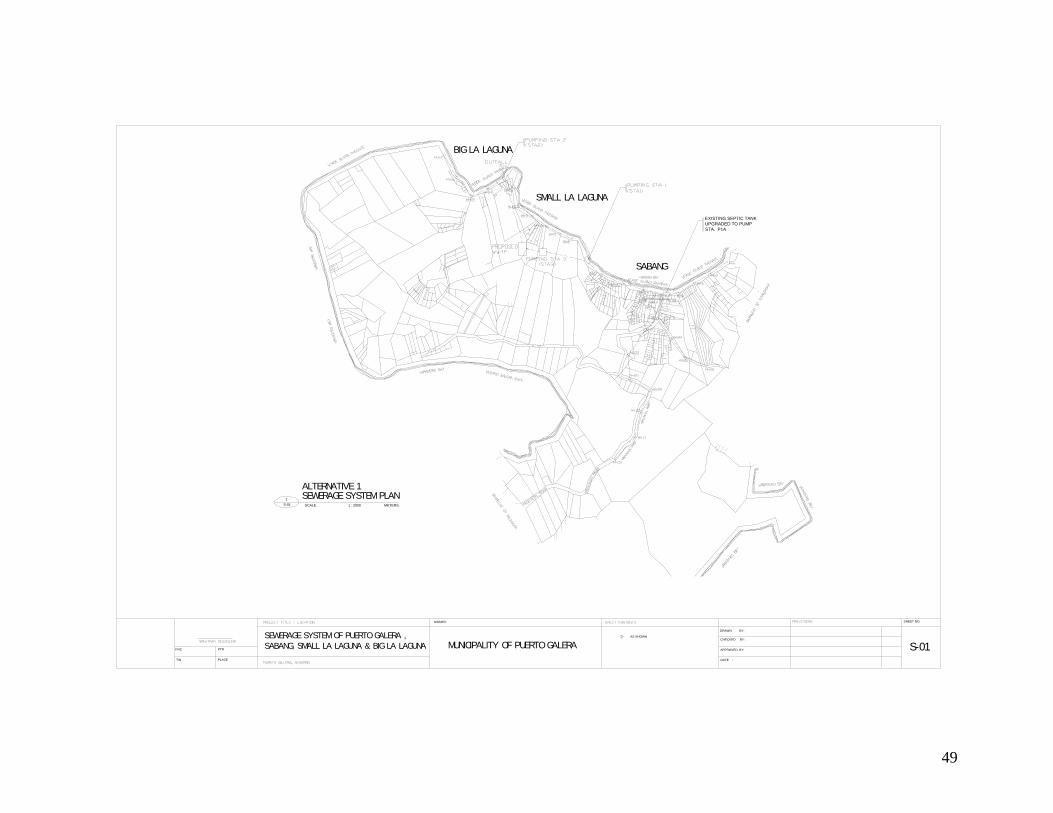
49
METERS.SCALE
SEWERAGE SYSTEM PLAN 1 : 2000S-01
1
S-01
SHEET NO.
APPROVED BY:
CHECKED BY:
DRAWN BY:
OWNER:
PTRPRC
DATE :PLACETIN
MUNICIPALITY OF PUERTO GALERAAS SHOWN
ALTERNATIVE 1
BIG LA LAGUNA
SMALL LA LAGUNA
SABANG
EXISTING SEPTIC TANK UPGRADED TO PUMP STA. P1A
SEWERAGE SYSTEM OF PUERTO GALERA ,SABANG, SMALL LA LAGUNA & BIG LA LAGUNA
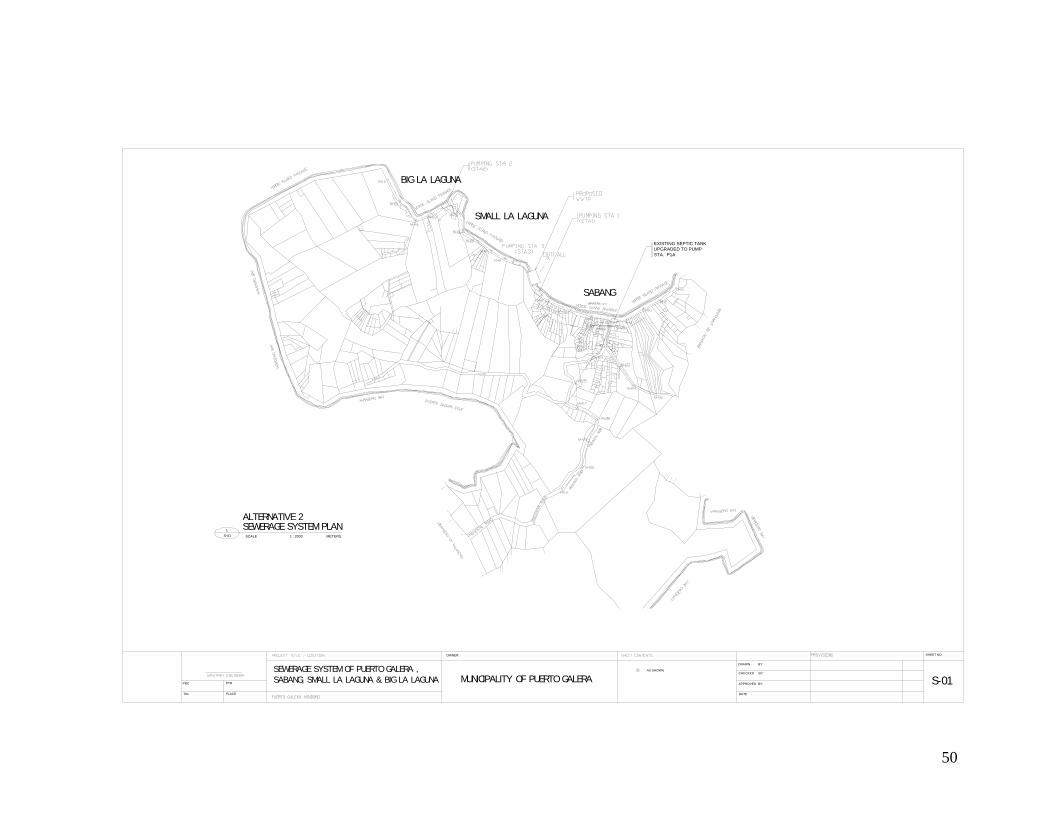
50
METERS.SCALE
SEWERAGE SYSTEM PLAN 1 : 2000S-01
1
S-01
SHEET NO.
APPROVED BY:
CHECKED BY:
DRAWN BY:
OWNER:
PTRPRC
DATE :PLACETIN
MUNICIPALITY OF PUERTO GALERAAS SHOWN
ALTERNATIVE 2
BIG LA LAGUNA
SMALL LA LAGUNA
SABANG
EXISTING SEPTIC TANK UPGRADED TO PUMP STA. P1A
SEWERAGE SYSTEM OF PUERTO GALERA ,SABANG, SMALL LA LAGUNA & BIG LA LAGUNA
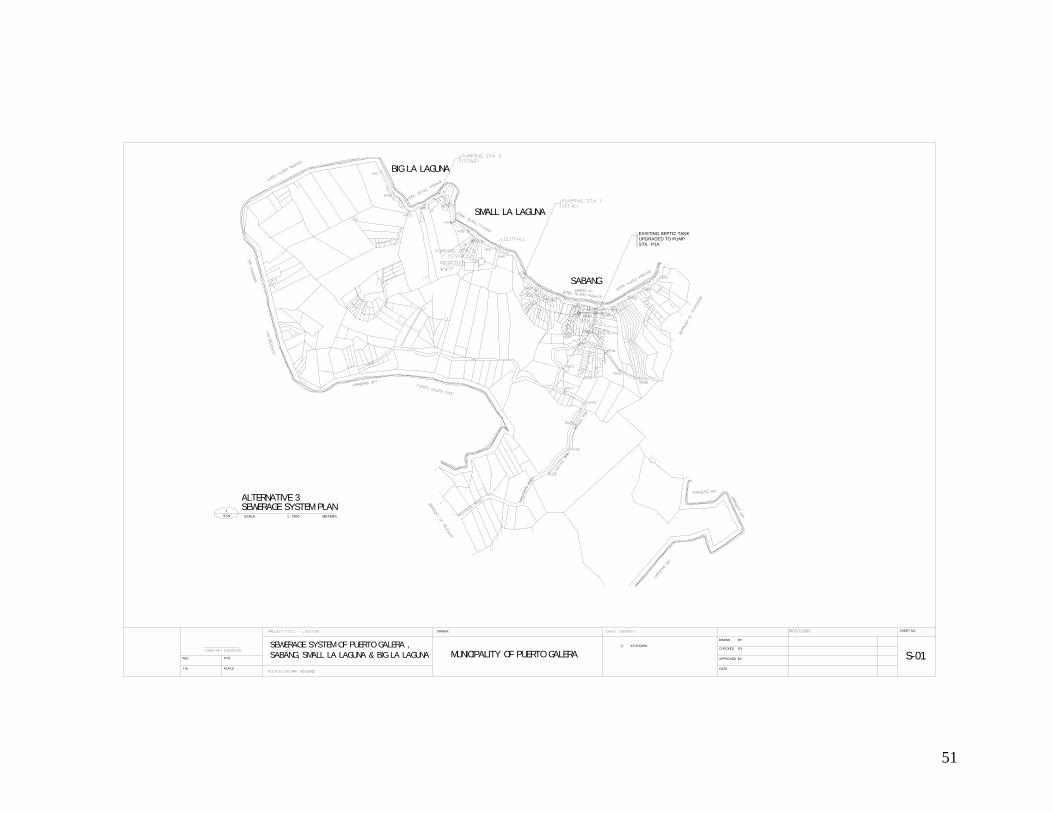
51
METERS.SCALE
SEWERAGE SYSTEM PLAN 1 : 2000S-01
1
S-01
SHEET NO.
APPROVED BY:
CHECKED BY:
DRAWN BY:
OWNER:
PTRPRC
DATE :PLACETIN
SEWERAGE SYSTEM OF PUERTO GALERA ,SABANG, SMALL LA LAGUNA & BIG LA LAGUNA MUNICIPALITY OF PUERTO GALERA
AS SHOWN
ALTERNATIVE 3
BIG LA LAGUNA
SMALL LA LAGUNA
SABANG
EXISTING SEPTIC TANK UPGRADED TO PUMP STA. P1A
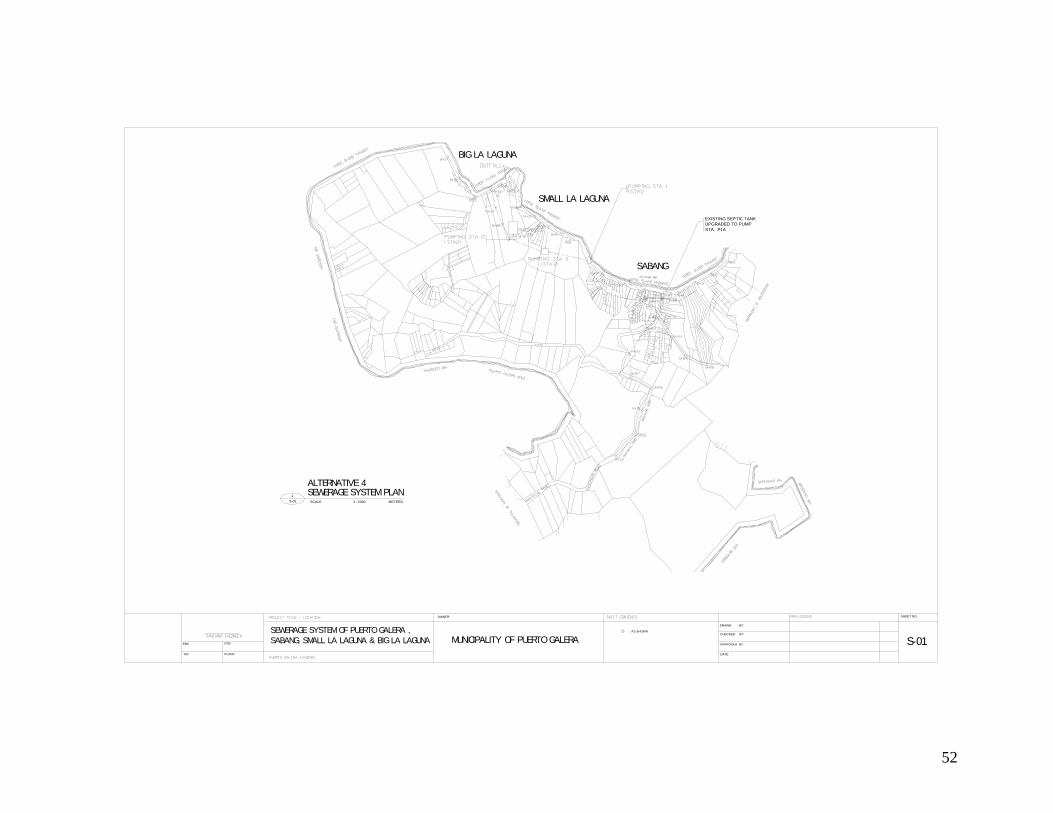
52
METERS.SCALE
SEWERAGE SYSTEM PLAN 1 : 2000S-01
1
S-01
SHEET NO.
APPROVED BY:
CHECKED BY:
DRAWN BY:
OWNER:
PTRPRC
DATE :PLACETIN
MUNICIPALITY OF PUERTO GALERAAS SHOWN
ALTERNATIVE 4
BIG LA LAGUNA
SMALL LA LAGUNA
SABANG
EXISTING SEPTIC TANK UPGRADED TO PUMP STA. P1A
SEWERAGE SYSTEM OF PUERTO GALERA ,SABANG, SMALL LA LAGUNA & BIG LA LAGUNA
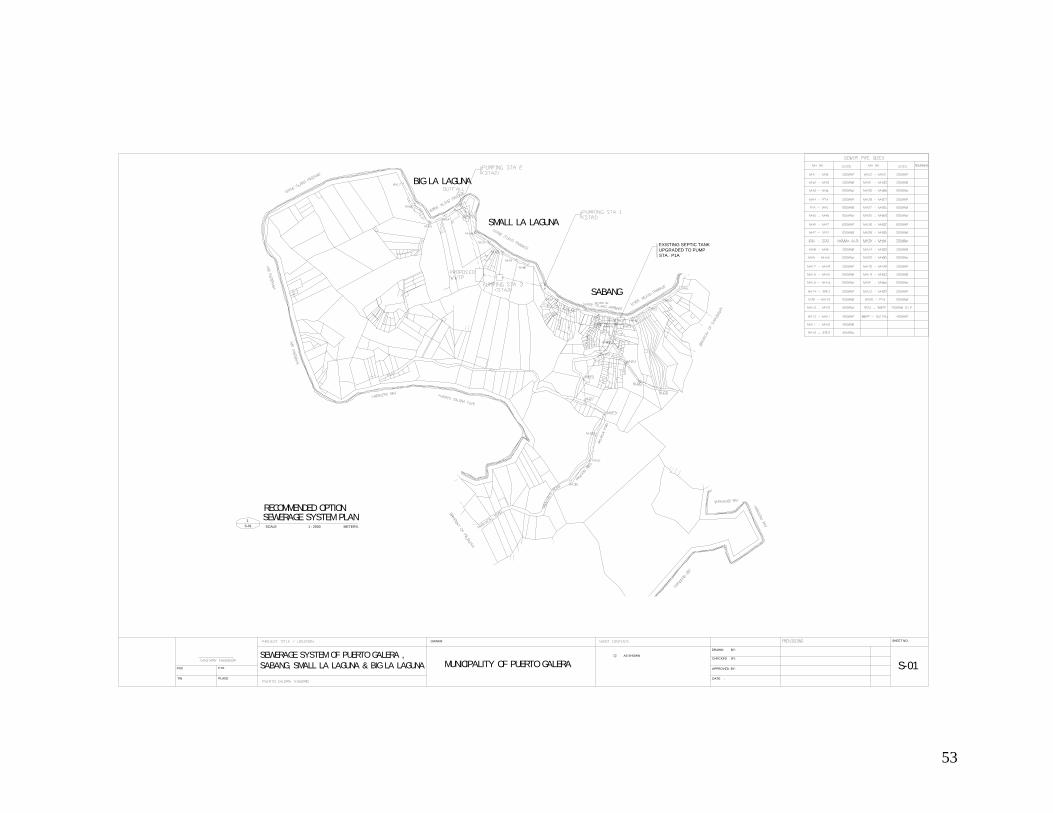
53
METERS.SCALE
SEWERAGE SYSTEM PLAN 1 : 2000S-01
1
S-01
SHEET NO.
APPROVED BY:
CHECKED BY:
DRAWN BY:
OWNER:
PTRPRC
DATE :PLACETIN
SEWERAGE SYSTEM OF PUERTO GALERA ,SABANG, SMALL LA LAGUNA & BIG LA LAGUNA MUNICIPALITY OF PUERTO GALERA
AS SHOWN
RECOMMENDED OPTION
BIG LA LAGUNA
SMALL LA LAGUNA
SABANG
EXISTING SEPTIC TANK UPGRADED TO PUMP STA. P1A