Embed Size (px)
Citation preview
Sex Differences in Pulse Pressure Trends With Age AreCross-Cultural
Joan H. Skurnick, Mordechay Aladjem, Abraham Aviv
Abstract—Sex differences in systolic and diastolic blood pressure levels and trends with age have been consistentlyobserved in both industrialized and unindustrialized populations. However, the impact of sex on pulse pressure, an indexof vascular aging, in unindustrialized populations has not been addressed. The objective of this report was to characterizesex differences in aging trends of pulse pressure within unindustrialized populations. Using PubMed and Medline, weidentified 60 articles with blood pressure data from unacculturated or partially acculturated populations. Data on 27populations from 22 articles were included for analysis, on the basis of adequate description of study design and bloodpressure measurement. Blood pressure means of adult age groups were modeled by linear and polynomial regression.The pulse pressure levels of women were lower than those of men in early adulthood and higher in older ages. Womenhad a steeper, steady increase in pulse pressure with age than men (P�0.001), whereas men had a stronger curvilinearupswing in pulse pressure with age (P�0.006). Partially acculturated populations had higher pulse pressures thanunacculturated populations. Sex had a stronger effect on pulse pressure than acculturation. Pulse pressure trajectories ofunindustrialized populations were slightly attenuated compared with those seen in National Health and NutritionalExamination Surveys III and IV of the US population. A sex effect on pulse pressure trends with age prevails acrossunacculturated and acculturated populations. Accordingly, the biological principles of arterial aging, as expressed inpulse pressure, are the same in all humans, regardless of demography. (Hypertension. 2010;55:40-47.)
Key Words: blood pressure � aging � sex factors � hypertension � humans
Sex differences in age-dependent systolic blood pressure(SBP) and diastolic blood pressure (DBP) trends have
been consistently observed in modern industrialized popula-tions.1,2 That men and women in less industrialized popula-tions also have different age trends in SBP and DBP has beenreported in numerous studies.3–5 Despite this wealth ofliterature, aging trends of pulse pressure (PP) in less indus-trialized populations have not been addressed.
In this study, we explicitly investigated the sex differencesin PP trajectories in less industrialized populations. The focuson PP stems from its recently recognized importance as a riskfactor for cardiovascular diseases.6–13 In the FraminghamHeart Study, neither SBP nor DBP added to the predictivevalue of PP for coronary heart disease.9 A study of Frenchmen demonstrated that PP predicted cardiovascular mortalityindependently of mean arterial pressure,11 although a meta-anal-ysis of Japanese studies found PP to be less predictive of strokeand myocardial infarction than SBP and mean blood pressure.14
PP is a surrogate of arterial stiffness and, hence, an indicator ofarterial aging in modern societies.15 Should less industrializedpopulations also exhibit sex differences in PP trends with age, asseen in industrialized societies, this would suggest physiologicalsex differences in arterial aging that are relatively impervious to
changes in environment or lifestyle, with implications for sex-specific differences in cardiovascular risk.
MethodsStudy SelectionUsing PubMed and Medline, followed by cross-references, we identi-fied 60 articles in which blood pressure data were available forpopulations that were judged as unacculturated or partially acculturated.Unacculturated societies were defined as remote, with minimal or nocontact with industrialized or Westernized (“acculturated”) societies.Partially unacculturated societies were defined as maintaining some contactwith acculturated societies. For instance, their locations were within walkingdistances from major roads, towns, hospitals, or missions.
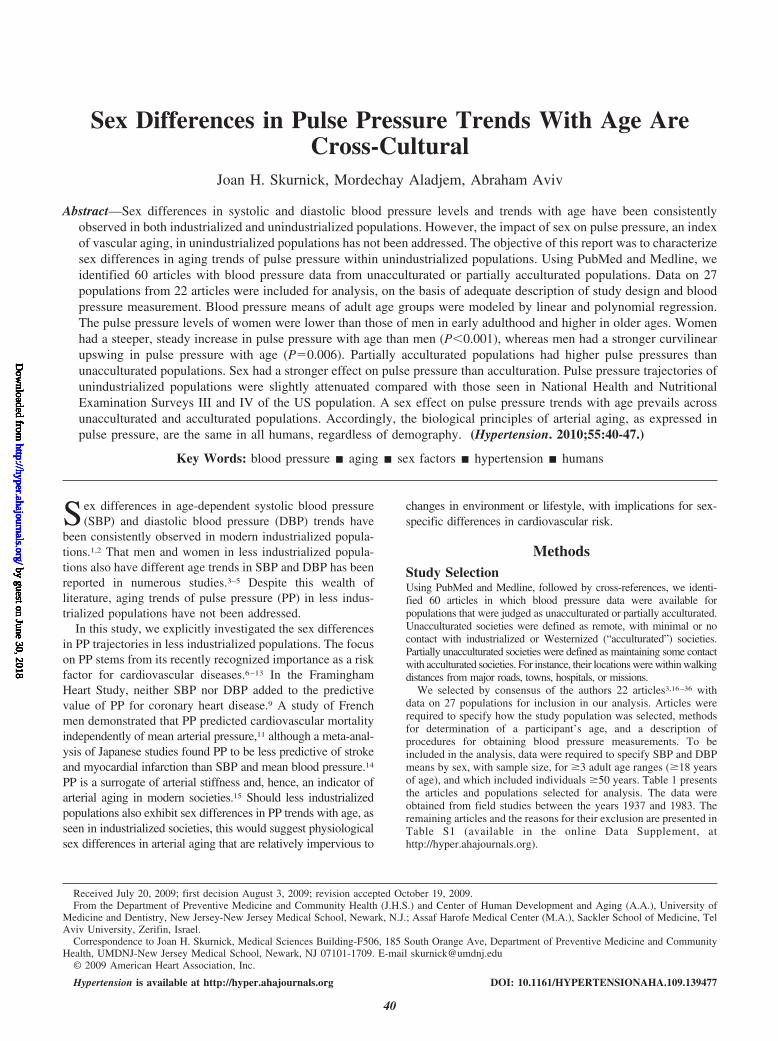
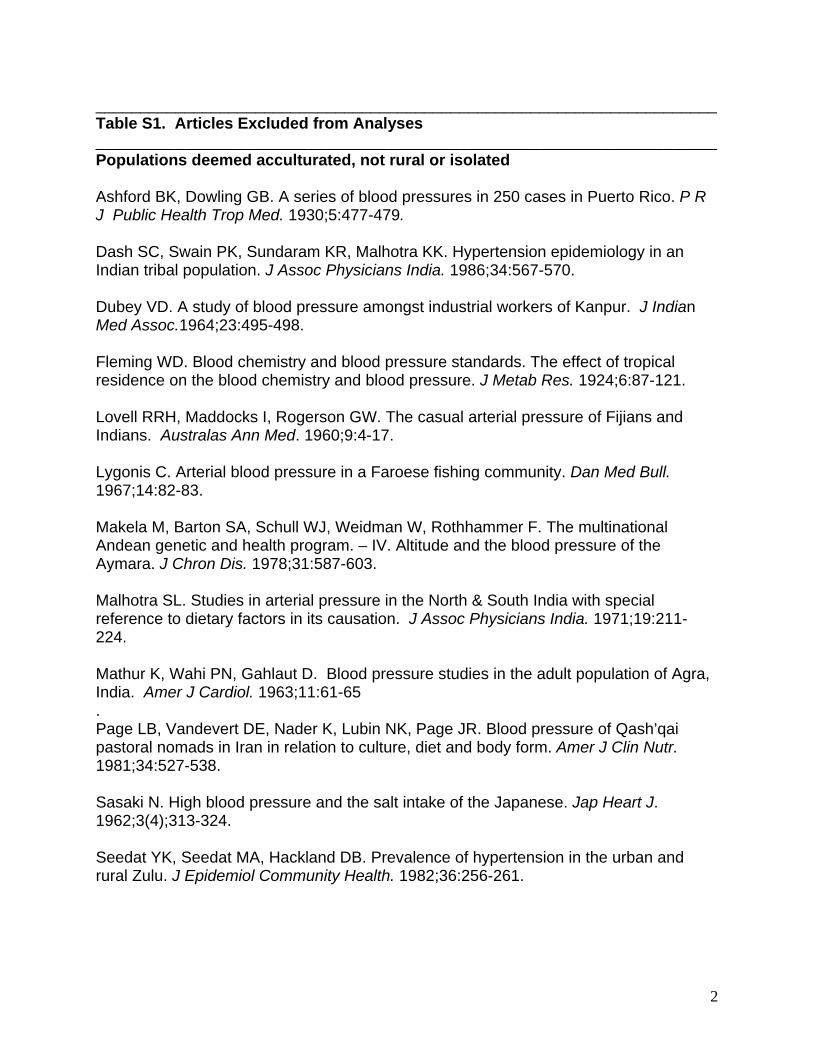
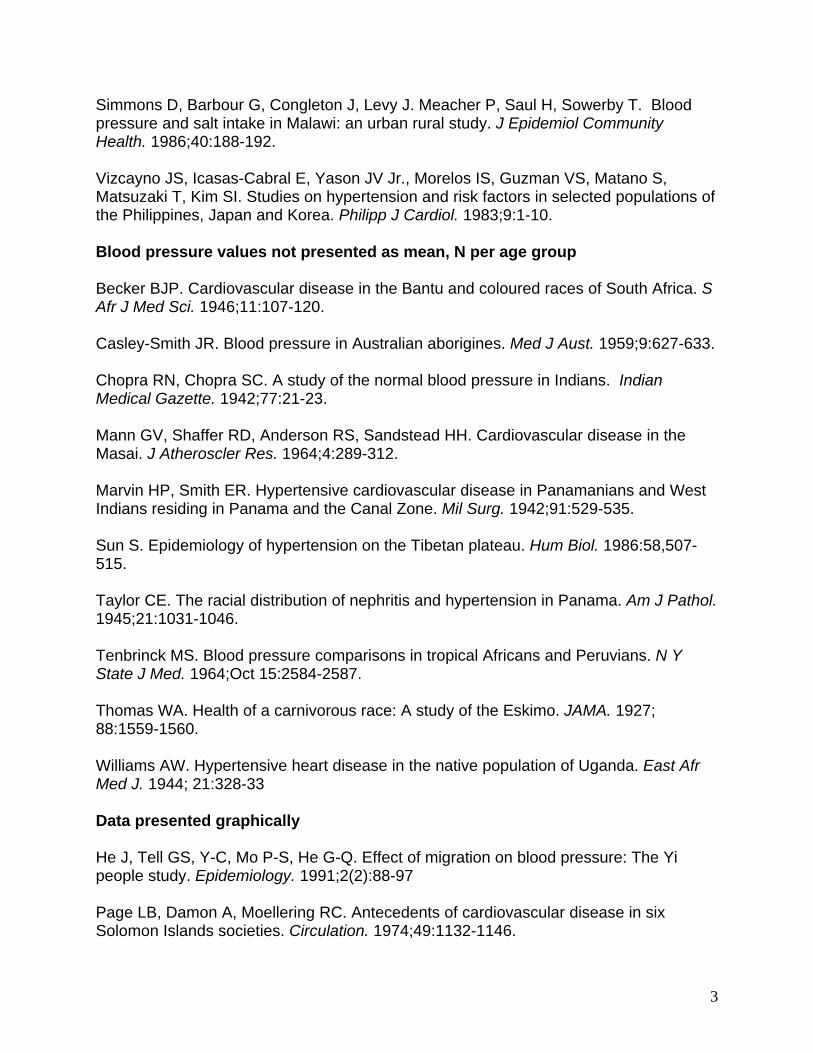
We selected by consensus of the authors 22 articles3,16–36 withdata on 27 populations for inclusion in our analysis. Articles wererequired to specify how the study population was selected, methodsfor determination of a participant’s age, and a description ofprocedures for obtaining blood pressure measurements. To beincluded in the analysis, data were required to specify SBP and DBPmeans by sex, with sample size, for �3 adult age ranges (�18 yearsof age), and which included individuals �50 years. Table 1 presentsthe articles and populations selected for analysis. The data wereobtained from field studies between the years 1937 and 1983. Theremaining articles and the reasons for their exclusion are presented inTable S1 (available in the online Data Supplement, athttp://hyper.ahajournals.org).
Received July 20, 2009; first decision August 3, 2009; revision accepted October 19, 2009.From the Department of Preventive Medicine and Community Health (J.H.S.) and Center of Human Development and Aging (A.A.), University of
Medicine and Dentistry, New Jersey-New Jersey Medical School, Newark, N.J.; Assaf Harofe Medical Center (M.A.), Sackler School of Medicine, TelAviv University, Zerifin, Israel.
Correspondence to Joan H. Skurnick, Medical Sciences Building-F506, 185 South Orange Ave, Department of Preventive Medicine and CommunityHealth, UMDNJ-New Jersey Medical School, Newark, NJ 07101-1709. E-mail [email protected]
© 2009 American Heart Association, Inc.
Hypertension is available at http://hyper.ahajournals.org DOI: 10.1161/HYPERTENSIONAHA.109.139477
40
by guest on June 30, 2018http://hyper.ahajournals.org/
Dow
nloaded from
by guest on June 30, 2018http://hyper.ahajournals.org/
Dow
nloaded from
by guest on June 30, 2018http://hyper.ahajournals.org/
Dow
nloaded from
by guest on June 30, 2018http://hyper.ahajournals.org/
Dow
nloaded from
by guest on June 30, 2018http://hyper.ahajournals.org/
Dow
nloaded from
by guest on June 30, 2018http://hyper.ahajournals.org/
Dow
nloaded from
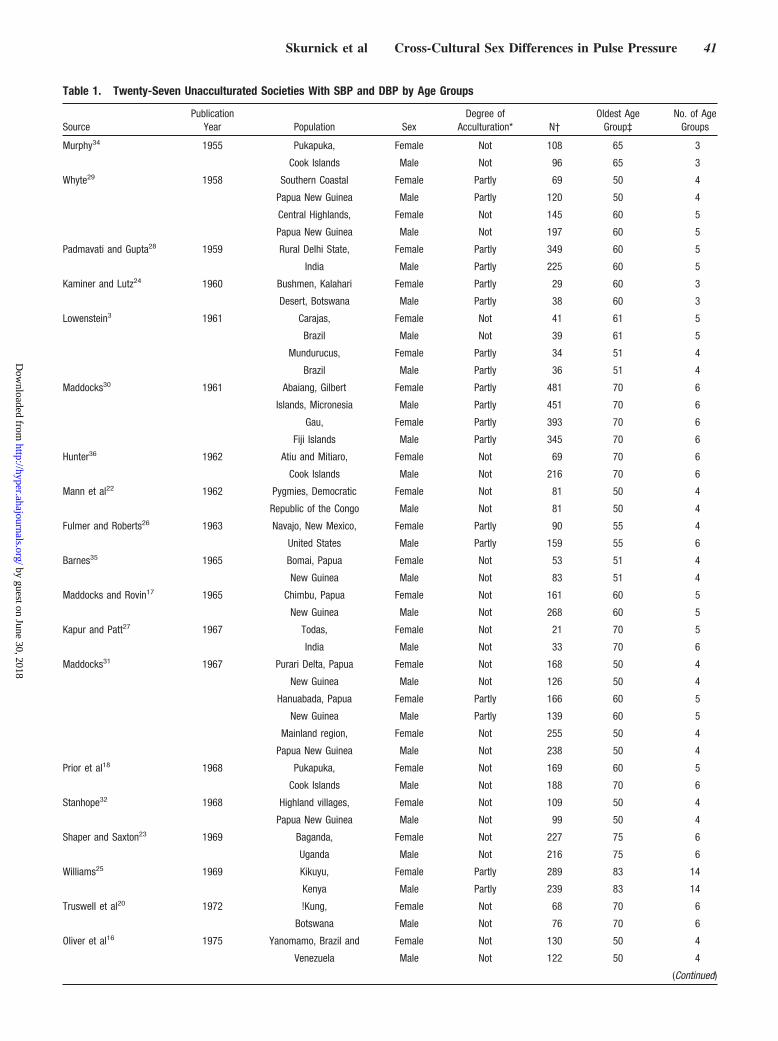
Table 1. Twenty-Seven Unacculturated Societies With SBP and DBP by Age Groups
SourcePublication
Year Population SexDegree of
Acculturation* N†Oldest Age
Group‡No. of Age
Groups
Murphy34 1955 Pukapuka, Female Not 108 65 3
Cook Islands Male Not 96 65 3
Whyte29 1958 Southern Coastal Female Partly 69 50 4
Papua New Guinea Male Partly 120 50 4
Central Highlands, Female Not 145 60 5
Papua New Guinea Male Not 197 60 5
Padmavati and Gupta28 1959 Rural Delhi State, Female Partly 349 60 5
India Male Partly 225 60 5
Kaminer and Lutz24 1960 Bushmen, Kalahari Female Partly 29 60 3
Desert, Botswana Male Partly 38 60 3
Lowenstein3 1961 Carajas, Female Not 41 61 5
Brazil Male Not 39 61 5
Mundurucus, Female Partly 34 51 4
Brazil Male Partly 36 51 4
Maddocks30 1961 Abaiang, Gilbert Female Partly 481 70 6
Islands, Micronesia Male Partly 451 70 6
Gau, Female Partly 393 70 6
Fiji Islands Male Partly 345 70 6
Hunter36 1962 Atiu and Mitiaro, Female Not 69 70 6
Cook Islands Male Not 216 70 6
Mann et al22 1962 Pygmies, Democratic Female Not 81 50 4
Republic of the Congo Male Not 81 50 4
Fulmer and Roberts26 1963 Navajo, New Mexico, Female Partly 90 55 4
United States Male Partly 159 55 6
Barnes35 1965 Bomai, Papua Female Not 53 51 4
New Guinea Male Not 83 51 4
Maddocks and Rovin17 1965 Chimbu, Papua Female Not 161 60 5
New Guinea Male Not 268 60 5
Kapur and Patt27 1967 Todas, Female Not 21 70 5
India Male Not 33 70 6
Maddocks31 1967 Purari Delta, Papua Female Not 168 50 4
New Guinea Male Not 126 50 4
Hanuabada, Papua Female Partly 166 60 5
New Guinea Male Partly 139 60 5
Mainland region, Female Not 255 50 4
Papua New Guinea Male Not 238 50 4
Prior et al18 1968 Pukapuka, Female Not 169 60 5
Cook Islands Male Not 188 70 6
Stanhope32 1968 Highland villages, Female Not 109 50 4
Papua New Guinea Male Not 99 50 4
Shaper and Saxton23 1969 Baganda, Female Not 227 75 6
Uganda Male Not 216 75 6
Williams25 1969 Kikuyu, Female Partly 289 83 14
Kenya Male Partly 239 83 14
Truswell et al20 1972 !Kung, Female Not 68 70 6
Botswana Male Not 76 70 6
Oliver et al16 1975 Yanomamo, Brazil and Female Not 130 50 4
Venezuela Male Not 122 50 4
(Continued)
Skurnick et al Cross-Cultural Sex Differences in Pulse Pressure 41
by guest on June 30, 2018http://hyper.ahajournals.org/
Dow
nloaded from
Statistical AnalysisPP means were presented by age group for 4 populations. For theremainder, mean PP was computed as the mean SBP minus the meanDBP, with identical sample sizes, indicating that the same individ-uals provided both SBP and DBP.
Linear Regressions Within PopulationsLinear regression analyses were performed within each population,stratified by sex. SBP, DBP, and PP age group means were regressedon the midpoint of the age interval, weighted by the age-groupsample size. Where the oldest age group was unbounded, a midpointwas imputed on the basis of the intervals between lower bounds. BPat age 20 years, a nominal onset of adulthood, was used as theintercept. The null hypotheses were as follows: (1) no differences inPP (or SBP or DBP) slopes between men and women withinunacculturated and partially acculturated societies; (2) no differencein PP slopes between unacculturated and partially acculturatedsocieties; and (3) no acculturation effect on sex differences in thechange in PP with age. Within-population differences betweenparameters for men and women were used to test for sex effects,given the paired structure of the data. Univariate comparisons of sex-and population-specific parameters were performed by t tests or ranktests. Within most populations, there were too few age groups toperform polynomial regression.
Regressions Pooled Across PopulationsTo summarize the overall trends of BP with age, a second set ofanalyses pooled data across all populations. Mixed-model analysesof covariance tested sex, acculturation, and their interaction asfactors in BP trends with age. The linear models included randompopulation-specific intercepts and slopes to model population vari-ability in BP patterns. Polynomial regression analyses also includeda 2nd-degree age term (age squared) for curvature and were centeredat age 40 years, the approximate overall mean age.
For comparison with PP trends in modern society, regression analyseswere performed on National Health and Nutritional Examination Sur-veys (NHANES) III (1988–1994) and IV (1999–2002)37 BP measure-ments for men and women aged �20 years, applying the NHANESsample weights to achieve representation of the US population.
Means are presented with 95% confidence limits. A P value �0.05is considered significant. SAS 9.1 software (SAS Institute) was usedfor computations.
Results
Regression Slopes by PopulationTable 2 presents the estimated BP at age 20 years and theslopes, summarized by sex and degree of acculturation. SBPat age 20 years among women was lower than among men,
Table 1. Continued
SourcePublication
Year Population SexDegree of
Acculturation* N†Oldest Age
Group‡No. of Age
Groups
Vaughan33 1979 Rural Tanzania Female Not 275 55 4
Male Not 333 55 4
Poulter et al19 1984 Luo, Kenya Female Partly 597 65 6
Male Partly 264 65 6
Zein and Assefa21 1986 Rural northwestern Female Partly 182 50 4
Ethiopian community Male Partly 202 50 4
*Not indicates unacculturated; partly, partially acculturated.†Data show the sample size.‡Data show the bottom of the age range.
Table 2. Change in Blood Pressure/Year of Aging: Linear Regression Slopes Within Unacculturated and PartiallyAcculturated Populations
Variable Degree of Acculturation* N† Sex
Blood Pressure at Age 20 y, mm Hg Slope: Annual Change in Blood Pressure, mm Hg/y
Minimum Median Maximum Mean Minimum Median Maximum MeanPercentage
�0, %
Systolic Not 16 Female 98.6 111.4 124.1 110.8 �0.08 0.24 0.79 0.28 13
Male 91.8 117.5 127.2 115.9 �0.56 �0.05 0.66 �0.01 56
Partly 11 Female 98.2 110.2 126.1 110.0 0.05 0.44 0.94 0.40 0
Male 108.3 116.1 133.9 117.3 �0.24 0.13 0.43 0.14 18
Diastolic Not; 16 Female 62.4 73.0 82.3 72.3 �0.23 0.06 0.41 0.05 44
Male 68.7 75.3 86.2 75.4 �0.34 �0.08 0.26 �0.07 75
Partly 11 Female 62.2 72.9 81.8 71.5 �0.26 0.08 0.26 0.09 9
Male 65.6 78.2 81.7 75.0 �0.11 0.02 0.16 0.02 27
Pulse pressure Not 16 Female 32.2 38.0 50.4 38.5 �0.16 0.23 0.55 0.24 6
Male 20.2 40.6 49.2 40.3 �0.47 0.03 0.55 0.07 44
Partly 11 Female 25.3 37.8 47.2 38.5 �0.03 0.23 0.72 0.31 9
Male 31.4 40.0 55.5 42.3 �0.21 0.11 0.54 0.12 18
Linear regression slopes weighted by number of observations per age group.*Not indicates unacculturated; partly, partially acculturated.†Data show the number of populations.
42 Hypertension January 2010
by guest on June 30, 2018http://hyper.ahajournals.org/
Dow
nloaded from
whereas SBP slopes among women were consistently higherthan those among men. There was considerable heterogeneityin slopes, within sex and acculturation category. The within-population differences of women’s minus men’s SBP at age20 years (mean difference: �6.0 mm Hg [95% CI: �8.0 to�4.0 mm Hg]) and the differences in the slopes of women’sminus men’s (mean difference: 0.28 mm Hg/y [95% CI: 0.16to 0.40 mm Hg/y]) were significantly different across popu-lations (P�0.001 and P�0.001) and also when stratified byacculturation (all Ps �0.01).
Women’s mean DBP at age 20 years was �3.3 mm Hglower than the mean for men (95% CI: �4.6 to �1.9 mm Hg;P�0.001). The median and mean slopes of DBP among menshowed little or no increase with age. The mean DBP slopes(change per year of age) of women were higher than those ofmen (mean difference: 0.10 mm Hg/y [95% CI: 0.05 to0.14 mm Hg/y]; P�0.001) but also showed little DBP in-crease with age. Higher DBP slopes and lower mean DBP atage 20 years among women than among men were also seenamong the subgroup of 16 unacculturated populations (both Pvalues �0.001). Among the 11 partially acculturated popu-lations, women’s DBP slopes were higher but not signifi-cantly (P�0.12), and women’s mean DBPs at age 20 yearswere lower (P�0.030).
The regression lines for PP are a composite reflection ofthe joint trends in SBP and DBP. Mean PP at age 20 yearswas lower among women than among men (mean difference:�2.6 mm Hg [95% CI: �4.6 to �0.6 mm Hg]; P�0.014). PPslopes of women were significantly higher than those of men(mean difference: 0.18 mm Hg/y [95% CI: 0.07 to0.29 mm Hg/y]; P�0.002). Within acculturation strata,women had higher PP slopes and lower mean PPs at age 20years, although the age 20 difference among unacculturatedwomen was not significant (unacculturated: difference at age20, P�0.20 and slope, P�0.030; partially acculturated:difference at age 20, P�0.022 and slope, P�0.042).
Unacculturated and partially acculturated populations didnot differ in SBP, DBP, or PP levels at age 20 years whentested within sexes. Partially acculturated populations showedhigher SBP, DBP, and PP slopes than unacculturated popu-lations within both sexes, but the differences were notsignificant.
Linear Regressions Pooled Across PopulationsTo examine further the differences in slopes and BP at age 20years, linear regressions were performed on BP levels pooledacross all of the populations. Table 3 again displays thatwomen had lower SBP, DBP, and PP at age 20 years andgreater increases with age within each acculturation group ofpopulations. Sex, degree of acculturation, and their interac-tion were tested jointly as factors affecting age trends in all ofthe populations, pooled across sexes. SBP and DBP at age 20years were both lower among women than men (P�0.001;P�0.001) by 2 to 5 mm Hg. Women had significantly higherslopes of increase in SBP and DBP with age (P�0.001 andP�0.006, respectively), although the slopes for DBP wereclose to 0. The difference in men’s and women’s PP at age 20years was not significant. However, women’s greater increase
in SBP with age carried over to a greater increase in PP peryear in women than in men (P�0.005).
Unacculturated and partially acculturated populations didnot differ in SBP, DBP, or PP levels at age 20 years. Partiallyacculturated populations had more positive SBP and DBPslopes than unacculturated populations, but the differenceswere not statistically significant. There was no synergisticeffect of sex and acculturation on age trends in SBP, DBP,or PP.
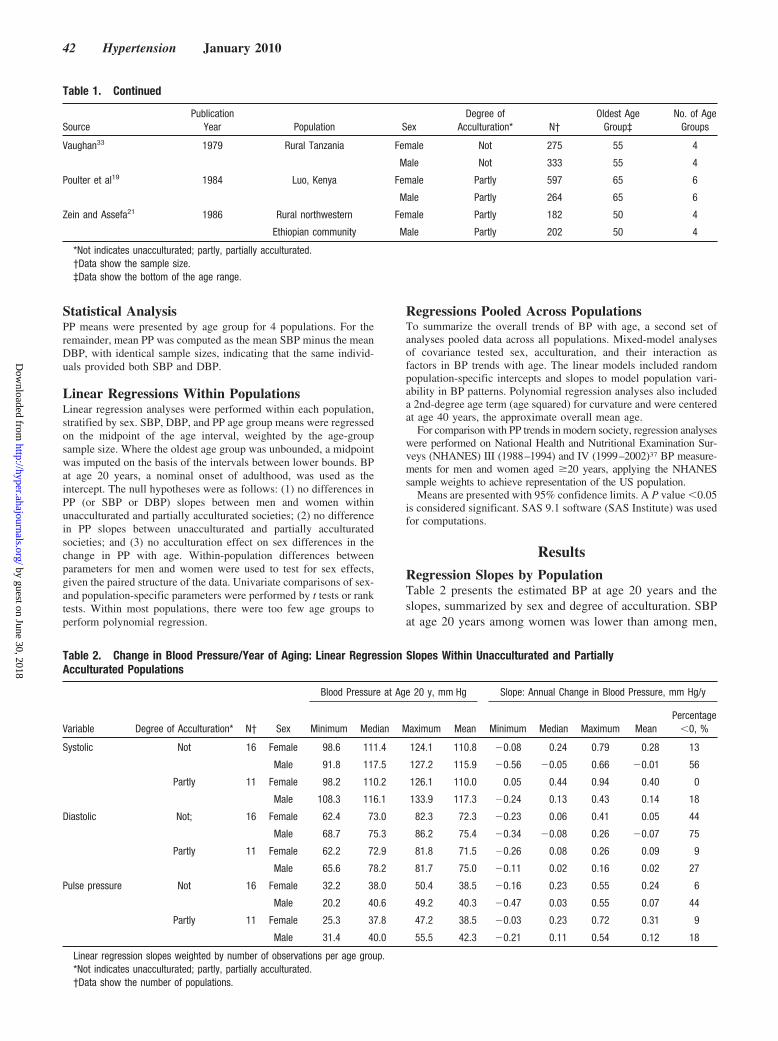
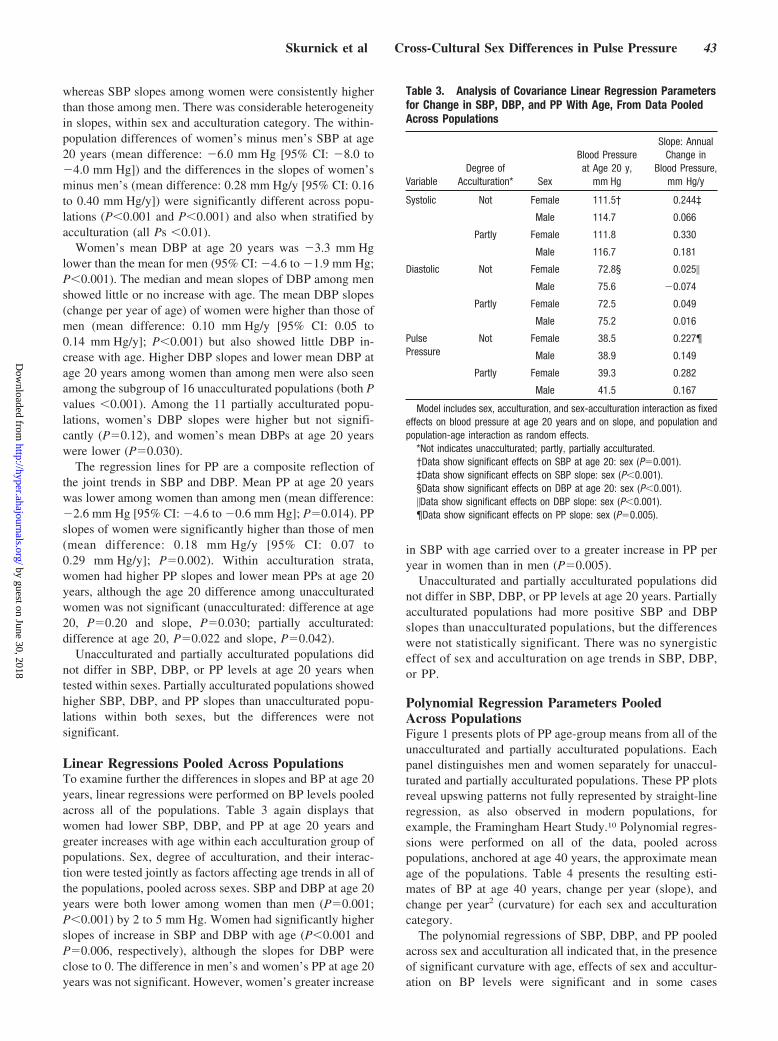
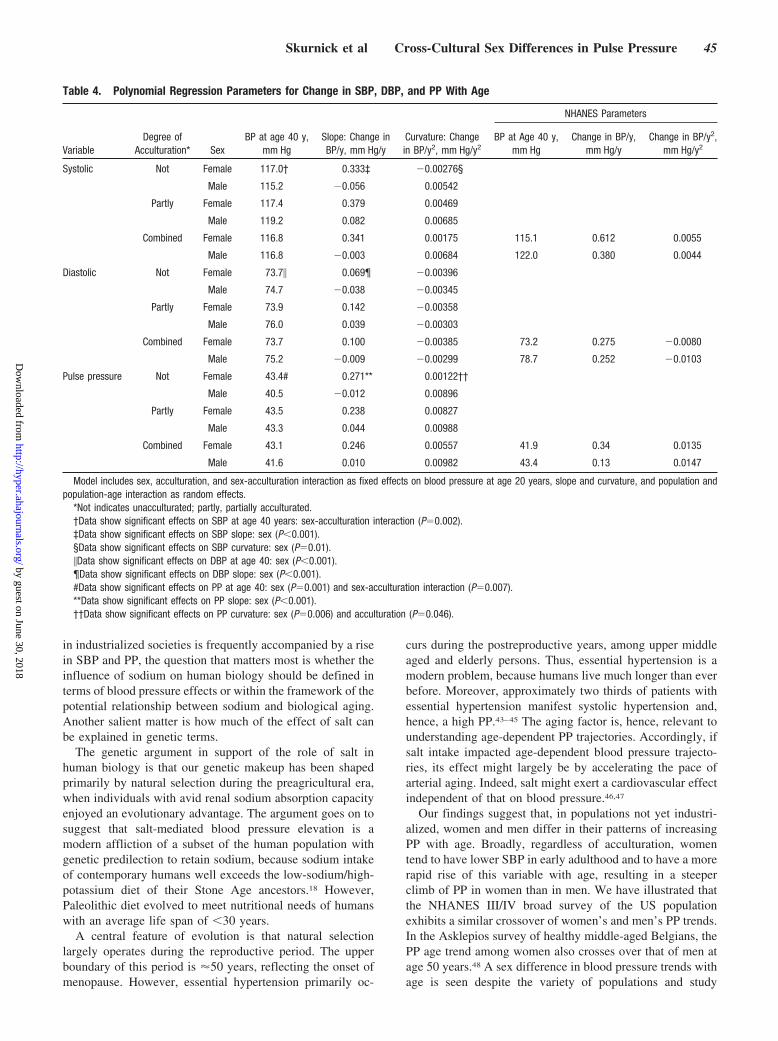
Polynomial Regression Parameters PooledAcross PopulationsFigure 1 presents plots of PP age-group means from all of theunacculturated and partially acculturated populations. Eachpanel distinguishes men and women separately for unaccul-turated and partially acculturated populations. These PP plotsreveal upswing patterns not fully represented by straight-lineregression, as also observed in modern populations, forexample, the Framingham Heart Study.10 Polynomial regres-sions were performed on all of the data, pooled acrosspopulations, anchored at age 40 years, the approximate meanage of the populations. Table 4 presents the resulting esti-mates of BP at age 40 years, change per year (slope), andchange per year2 (curvature) for each sex and acculturationcategory.
The polynomial regressions of SBP, DBP, and PP pooledacross sex and acculturation all indicated that, in the presenceof significant curvature with age, effects of sex and accultur-ation on BP levels were significant and in some cases
Table 3. Analysis of Covariance Linear Regression Parametersfor Change in SBP, DBP, and PP With Age, From Data PooledAcross Populations
VariableDegree of
Acculturation* Sex
Blood Pressureat Age 20 y,
mm Hg
Slope: AnnualChange in
Blood Pressure,mm Hg/y
Systolic Not Female 111.5† 0.244‡
Male 114.7 0.066
Partly Female 111.8 0.330
Male 116.7 0.181
Diastolic Not Female 72.8§ 0.025�
Male 75.6 �0.074
Partly Female 72.5 0.049
Male 75.2 0.016
PulsePressure
Not Female 38.5 0.227¶
Male 38.9 0.149
Partly Female 39.3 0.282
Male 41.5 0.167
Model includes sex, acculturation, and sex-acculturation interaction as fixedeffects on blood pressure at age 20 years and on slope, and population andpopulation-age interaction as random effects.
*Not indicates unacculturated; partly, partially acculturated.†Data show significant effects on SBP at age 20: sex (P�0.001).‡Data show significant effects on SBP slope: sex (P�0.001).§Data show significant effects on DBP at age 20: sex (P�0.001).�Data show significant effects on DBP slope: sex (P�0.001).¶Data show significant effects on PP slope: sex (P�0.005).
Skurnick et al Cross-Cultural Sex Differences in Pulse Pressure 43
by guest on June 30, 2018http://hyper.ahajournals.org/
Dow
nloaded from
interactive. SBP levels at age 40 years were higher amongunacculturated women than men, but SBP was higher amongmen than women in partially acculturated populations (inter-action P�0.002). Women had a significantly greater slope ofSBP with age than men (P�0.001), whereas men had agreater curvilinear upswing in SBP with age (P�0.013).Women had lower DBP at age 40 years (P�0.001) and asignificantly more positive linear increase in DBP(P�0.001).
The consequent age patterns of PP resulted in significantcurvilinear upswings in PP with age. The curves in Figure 1illustrate that mean PP levels for women were lower thanmen’s in early adulthood and then surpassed those of menthrough older ages. The PP of women at age 40 years wassignificantly higher than that of men (P�0.001), somewhatless so among partially acculturated populations (interactionP�0.007). Women had a significantly steeper steady increasein PP with age than men (P�0.001), with little curvilinearupswing. In contrast, men had a stronger upswing in PP with
age (P�0.006). The upswing was somewhat greater amongpartially acculturated populations (interaction: P�0.046). Ascan be discerned from Table 4, sex was a more influentialfactor in age-related trends in SBP, DBP, and PP thanacculturation.
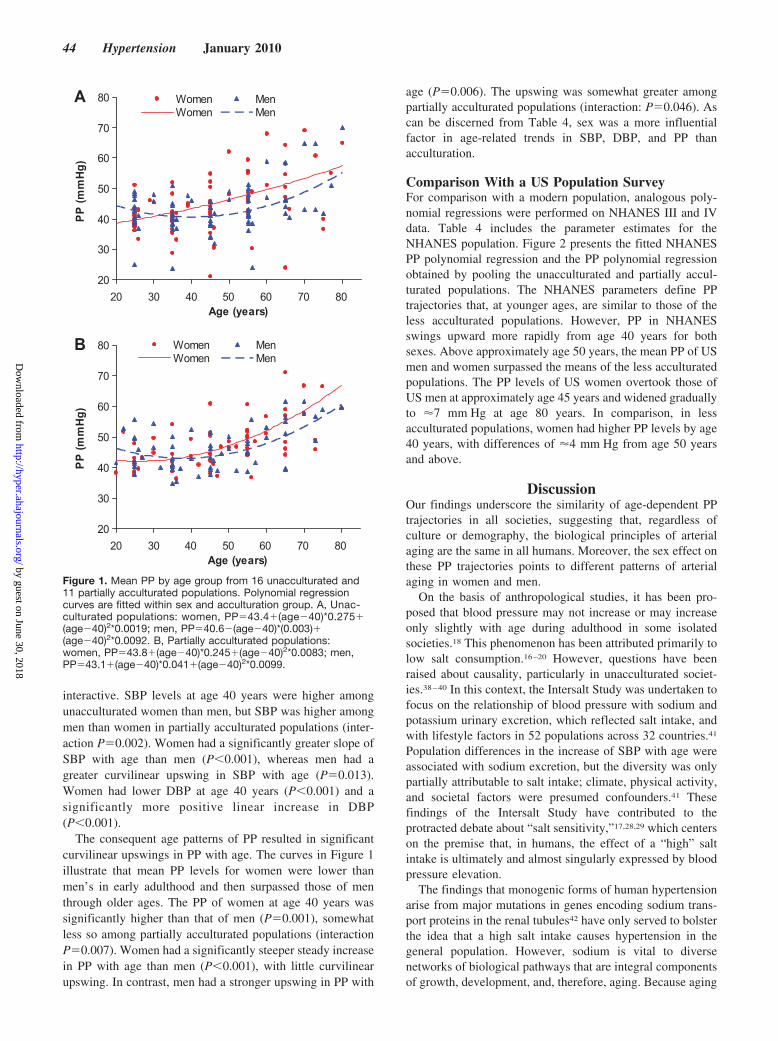
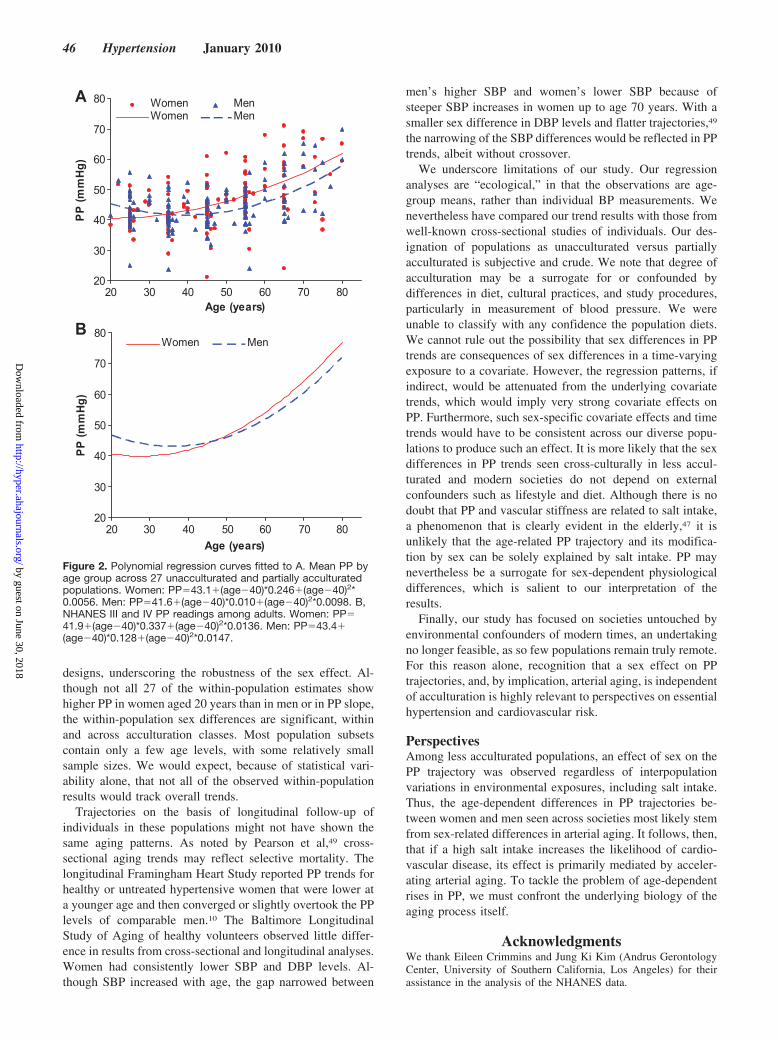
Comparison With a US Population SurveyFor comparison with a modern population, analogous poly-nomial regressions were performed on NHANES III and IVdata. Table 4 includes the parameter estimates for theNHANES population. Figure 2 presents the fitted NHANESPP polynomial regression and the PP polynomial regressionobtained by pooling the unacculturated and partially accul-turated populations. The NHANES parameters define PPtrajectories that, at younger ages, are similar to those of theless acculturated populations. However, PP in NHANESswings upward more rapidly from age 40 years for bothsexes. Above approximately age 50 years, the mean PP of USmen and women surpassed the means of the less acculturatedpopulations. The PP levels of US women overtook those ofUS men at approximately age 45 years and widened graduallyto �7 mm Hg at age 80 years. In comparison, in lessacculturated populations, women had higher PP levels by age40 years, with differences of �4 mm Hg from age 50 yearsand above.
DiscussionOur findings underscore the similarity of age-dependent PPtrajectories in all societies, suggesting that, regardless ofculture or demography, the biological principles of arterialaging are the same in all humans. Moreover, the sex effect onthese PP trajectories points to different patterns of arterialaging in women and men.
On the basis of anthropological studies, it has been pro-posed that blood pressure may not increase or may increaseonly slightly with age during adulthood in some isolatedsocieties.18 This phenomenon has been attributed primarily tolow salt consumption.16–20 However, questions have beenraised about causality, particularly in unacculturated societ-ies.38–40 In this context, the Intersalt Study was undertaken tofocus on the relationship of blood pressure with sodium andpotassium urinary excretion, which reflected salt intake, andwith lifestyle factors in 52 populations across 32 countries.41
Population differences in the increase of SBP with age wereassociated with sodium excretion, but the diversity was onlypartially attributable to salt intake; climate, physical activity,and societal factors were presumed confounders.41 Thesefindings of the Intersalt Study have contributed to theprotracted debate about “salt sensitivity,”17,28,29 which centerson the premise that, in humans, the effect of a “high” saltintake is ultimately and almost singularly expressed by bloodpressure elevation.
The findings that monogenic forms of human hypertensionarise from major mutations in genes encoding sodium trans-port proteins in the renal tubules42 have only served to bolsterthe idea that a high salt intake causes hypertension in thegeneral population. However, sodium is vital to diversenetworks of biological pathways that are integral componentsof growth, development, and, therefore, aging. Because aging
20
30
40
50
60
70
80
20 30 40 50 60 70 80Age (years)
PP
(mm
Hg)
Women MenWomen Men
A
20
30
40
50
60
70
80
20 30 40 50 60 70 80Age (years)
PP
(mm
Hg)
Women MenWomen Men
B
Figure 1. Mean PP by age group from 16 unacculturated and11 partially acculturated populations. Polynomial regressioncurves are fitted within sex and acculturation group. A, Unac-culturated populations: women, PP�43.4�(age�40)*0.275�(age�40)2*0.0019; men, PP�40.6�(age�40)*(0.003)�(age�40)2*0.0092. B, Partially acculturated populations:women, PP�43.8�(age�40)*0.245�(age�40)2*0.0083; men,PP�43.1�(age�40)*0.041�(age�40)2*0.0099.
44 Hypertension January 2010
by guest on June 30, 2018http://hyper.ahajournals.org/
Dow
nloaded from
in industrialized societies is frequently accompanied by a risein SBP and PP, the question that matters most is whether theinfluence of sodium on human biology should be defined interms of blood pressure effects or within the framework of thepotential relationship between sodium and biological aging.Another salient matter is how much of the effect of salt canbe explained in genetic terms.
The genetic argument in support of the role of salt inhuman biology is that our genetic makeup has been shapedprimarily by natural selection during the preagricultural era,when individuals with avid renal sodium absorption capacityenjoyed an evolutionary advantage. The argument goes on tosuggest that salt-mediated blood pressure elevation is amodern affliction of a subset of the human population withgenetic predilection to retain sodium, because sodium intakeof contemporary humans well exceeds the low-sodium/high-potassium diet of their Stone Age ancestors.18 However,Paleolithic diet evolved to meet nutritional needs of humanswith an average life span of �30 years.
A central feature of evolution is that natural selectionlargely operates during the reproductive period. The upperboundary of this period is �50 years, reflecting the onset ofmenopause. However, essential hypertension primarily oc-
curs during the postreproductive years, among upper middleaged and elderly persons. Thus, essential hypertension is amodern problem, because humans live much longer than everbefore. Moreover, approximately two thirds of patients withessential hypertension manifest systolic hypertension and,hence, a high PP.43–45 The aging factor is, hence, relevant tounderstanding age-dependent PP trajectories. Accordingly, ifsalt intake impacted age-dependent blood pressure trajecto-ries, its effect might largely be by accelerating the pace ofarterial aging. Indeed, salt might exert a cardiovascular effectindependent of that on blood pressure.46,47
Our findings suggest that, in populations not yet industri-alized, women and men differ in their patterns of increasingPP with age. Broadly, regardless of acculturation, womentend to have lower SBP in early adulthood and to have a morerapid rise of this variable with age, resulting in a steeperclimb of PP in women than in men. We have illustrated thatthe NHANES III/IV broad survey of the US populationexhibits a similar crossover of women’s and men’s PP trends.In the Asklepios survey of healthy middle-aged Belgians, thePP age trend among women also crosses over that of men atage 50 years.48 A sex difference in blood pressure trends withage is seen despite the variety of populations and study
Table 4. Polynomial Regression Parameters for Change in SBP, DBP, and PP With Age
VariableDegree of
Acculturation* SexBP at age 40 y,
mm HgSlope: Change inBP/y, mm Hg/y
Curvature: Changein BP/y2, mm Hg/y2
NHANES Parameters
BP at Age 40 y,mm Hg
Change in BP/y,mm Hg/y
Change in BP/y2,mm Hg/y2
Systolic Not Female 117.0† 0.333‡ �0.00276§
Male 115.2 �0.056 0.00542
Partly Female 117.4 0.379 0.00469
Male 119.2 0.082 0.00685
Combined Female 116.8 0.341 0.00175 115.1 0.612 0.0055
Male 116.8 �0.003 0.00684 122.0 0.380 0.0044
Diastolic Not Female 73.7� 0.069¶ �0.00396
Male 74.7 �0.038 �0.00345
Partly Female 73.9 0.142 �0.00358
Male 76.0 0.039 �0.00303
Combined Female 73.7 0.100 �0.00385 73.2 0.275 �0.0080
Male 75.2 �0.009 �0.00299 78.7 0.252 �0.0103
Pulse pressure Not Female 43.4# 0.271** 0.00122††
Male 40.5 �0.012 0.00896
Partly Female 43.5 0.238 0.00827
Male 43.3 0.044 0.00988
Combined Female 43.1 0.246 0.00557 41.9 0.34 0.0135
Male 41.6 0.010 0.00982 43.4 0.13 0.0147
Model includes sex, acculturation, and sex-acculturation interaction as fixed effects on blood pressure at age 20 years, slope and curvature, and population andpopulation-age interaction as random effects.
*Not indicates unacculturated; partly, partially acculturated.†Data show significant effects on SBP at age 40 years: sex-acculturation interaction (P�0.002).‡Data show significant effects on SBP slope: sex (P�0.001).§Data show significant effects on SBP curvature: sex (P�0.01).�Data show significant effects on DBP at age 40: sex (P�0.001).¶Data show significant effects on DBP slope: sex (P�0.001).#Data show significant effects on PP at age 40: sex (P�0.001) and sex-acculturation interaction (P�0.007).**Data show significant effects on PP slope: sex (P�0.001).††Data show significant effects on PP curvature: sex (P�0.006) and acculturation (P�0.046).
Skurnick et al Cross-Cultural Sex Differences in Pulse Pressure 45
by guest on June 30, 2018http://hyper.ahajournals.org/
Dow
nloaded from
designs, underscoring the robustness of the sex effect. Al-though not all 27 of the within-population estimates showhigher PP in women aged 20 years than in men or in PP slope,the within-population sex differences are significant, withinand across acculturation classes. Most population subsetscontain only a few age levels, with some relatively smallsample sizes. We would expect, because of statistical vari-ability alone, that not all of the observed within-populationresults would track overall trends.
Trajectories on the basis of longitudinal follow-up ofindividuals in these populations might not have shown thesame aging patterns. As noted by Pearson et al,49 cross-sectional aging trends may reflect selective mortality. Thelongitudinal Framingham Heart Study reported PP trends forhealthy or untreated hypertensive women that were lower ata younger age and then converged or slightly overtook the PPlevels of comparable men.10 The Baltimore LongitudinalStudy of Aging of healthy volunteers observed little differ-ence in results from cross-sectional and longitudinal analyses.Women had consistently lower SBP and DBP levels. Al-though SBP increased with age, the gap narrowed between
men’s higher SBP and women’s lower SBP because ofsteeper SBP increases in women up to age 70 years. With asmaller sex difference in DBP levels and flatter trajectories,49
the narrowing of the SBP differences would be reflected in PPtrends, albeit without crossover.
We underscore limitations of our study. Our regressionanalyses are “ecological,” in that the observations are age-group means, rather than individual BP measurements. Wenevertheless have compared our trend results with those fromwell-known cross-sectional studies of individuals. Our des-ignation of populations as unacculturated versus partiallyacculturated is subjective and crude. We note that degree ofacculturation may be a surrogate for or confounded bydifferences in diet, cultural practices, and study procedures,particularly in measurement of blood pressure. We wereunable to classify with any confidence the population diets.We cannot rule out the possibility that sex differences in PPtrends are consequences of sex differences in a time-varyingexposure to a covariate. However, the regression patterns, ifindirect, would be attenuated from the underlying covariatetrends, which would imply very strong covariate effects onPP. Furthermore, such sex-specific covariate effects and timetrends would have to be consistent across our diverse popu-lations to produce such an effect. It is more likely that the sexdifferences in PP trends seen cross-culturally in less accul-turated and modern societies do not depend on externalconfounders such as lifestyle and diet. Although there is nodoubt that PP and vascular stiffness are related to salt intake,a phenomenon that is clearly evident in the elderly,47 it isunlikely that the age-related PP trajectory and its modifica-tion by sex can be solely explained by salt intake. PP maynevertheless be a surrogate for sex-dependent physiologicaldifferences, which is salient to our interpretation of theresults.
Finally, our study has focused on societies untouched byenvironmental confounders of modern times, an undertakingno longer feasible, as so few populations remain truly remote.For this reason alone, recognition that a sex effect on PPtrajectories, and, by implication, arterial aging, is independentof acculturation is highly relevant to perspectives on essentialhypertension and cardiovascular risk.
PerspectivesAmong less acculturated populations, an effect of sex on thePP trajectory was observed regardless of interpopulationvariations in environmental exposures, including salt intake.Thus, the age-dependent differences in PP trajectories be-tween women and men seen across societies most likely stemfrom sex-related differences in arterial aging. It follows, then,that if a high salt intake increases the likelihood of cardio-vascular disease, its effect is primarily mediated by acceler-ating arterial aging. To tackle the problem of age-dependentrises in PP, we must confront the underlying biology of theaging process itself.
AcknowledgmentsWe thank Eileen Crimmins and Jung Ki Kim (Andrus GerontologyCenter, University of Southern California, Los Angeles) for theirassistance in the analysis of the NHANES data.
20
30
40
50
60
70
80
20 30 40 50 60 70 80Age (years)
PP
(mm
Hg)
Women MenWomen Men
A
20
30
40
50
60
70
80
20 30 40 50 60 70 80Age (years)
PP (m
mHg
)
Women MenB
Figure 2. Polynomial regression curves fitted to A. Mean PP byage group across 27 unacculturated and partially acculturatedpopulations. Women: PP�43.1�(age�40)*0.246�(age�40)2*0.0056. Men: PP�41.6�(age�40)*0.010�(age�40)2*0.0098. B,NHANES III and IV PP readings among adults. Women: PP�41.9�(age�40)*0.337�(age�40)2*0.0136. Men: PP�43.4�(age�40)*0.128�(age�40)2*0.0147.
46 Hypertension January 2010
by guest on June 30, 2018http://hyper.ahajournals.org/
Dow
nloaded from
DisclosuresNone.
References1. Gordon T. Discussion, In: Stamler J, Stamler R, Pullman TN, eds. The
Epidemiology of Hypertension. New York, NY: Grune & Stratton; 1967:117–118.
2. Rodriguez BL, Labarthe DR, Huang B, Lopez-Gomez J. Rise of bloodpressure with age: new evidence of population differences. Hypertension.1994;24:779–785.
3. Lowenstein FW. Blood pressure in relation to age and sex in the tropicsand subtropics: a review of the literature and an investigation in two tribesof Brazil Indians. Lancet. 1961;2:389–392.
4. Huizinga J. Casual blood pressure in populations. In: The Human Biologyof Environmental Change: Proceedings of a Conference Held in Blantyre,Malawi, April 5–12, 1971. London, United Kingdom: International Bio-logical Programme; 1972:164–167.
5. Epstein FH, Eckoff EG. The epidemiology of high blood pressure: geo-graphic distributions and etiological factors. In: Stamler J, Stamler R,Pullman TN, eds. The Epidemiology of Hypertension. New York, NY:Grune & Stratton; 1967:155–166.
6. O’Rourke MF, Mancia G. Arterial stiffness. J Hypertens. 1999;17:1–4.7. O’Rourke M, Frohlich ED. Pulse pressure: is this a clinically useful risk
factor? Hypertension. 1999;34:372–374.8. Aviv A. Pulse pressure and human longevity. Hypertension. 2001;37:
1060–1066.9. Franklin SS, Khan SA, Wong NO, Larson MG, Levy D. Is blood pressure
useful in predicting coronary heart disease? The Framingham HeartStudy. Circulation. 1999;100:354–360.
10. Franklin SS, Gustin W IV, Wong ND, Larson MG, Levy D. Hemodynamicpatterns of age-related changes in blood pressure: the Framingham HeartStudy. Circulation. 1997;96:308–315.
11. Benetos A, Safar M, Rudnichi A, Smulyan H, Richard JL, Ducimetiere P,Guize L. Pulse pressure: a predictor of long-term cardiovascular mortalityin a French male population. Hypertension. 1997;30:1410–1415.
12. Benetos A, Rudnichi A, Safar M, Guize L. Pulse pressure and cardiovas-cular mortality in normotensive and hypertensive subjects. Hypertension.1998;32:560–564.
13. Mitchell GF, Vasan RS, Keyes MJ, Parise H, Wang TJ, Larson MG,D’Agostini RB, Kannel WB, Levy D, Benjamin EJ. Pulse pressure andrisk of new-onset atrial fibrillation. JAMA. 2007;297:709–715.
14. Miura K, Nakagawa H, Ohashi Y, Harada A, Taguri M, Kushiro T,Takahashi A, Nishinaga M, Soejima H, Ueshima H; for the Japan Arte-riosclerosis Longitudinal Study (JALS) Group. Four blood pressureindexes and the risk of stroke and myocardial infarction in Japanese menand women: a meta-analysis of 16 cohort studies. Circulation. 2009;119:1892–1898.
15. Mitchell GF. Effects of central arterial aging on the structure and functionof the peripheral vasculature: implications for end-organ damage. J ApplPhysiol. 2008;105:1652–1660.
16. Oliver WJ, Cohen EL, Neel JV. Blood pressure, sodium intake andsodium related hormones in the Yanomamo Indians, a “no salt” culture.Circulation. 1975;52:146–151.
17. Maddocks I, Rovin L. A New Guinea population in which blood pressureappears to fall as age advances. P N G Med J. 1965;8:17–21.
18. Prior IAM, Evans JG, Harvey HPB, Davidson F, Lindsey M. Sodiumintake and blood pressure in two Polynesian populations. N Engl J Med.1968;279:515–520.
19. Poulter N, Khaw KT, Hopwood BEC, Mugambi M, Peart WS, Rose G,Sever PS. Blood pressure and its correlates in an African tribe in urbanand rural environments. J Epidemiol Community Health. 1984;38:181–186.
20. Truswell AS, Kennelly BM, Hansen JDL, Lee RB. Blood pressure of!Kung bushmen in Northern Botswana. Am Heart J. 1972;84:5–12.
21. Zein AZ, Assefa M. Blood pressure levels and hypertension in ruralEthiopian communities. Ethiop Med J. 1986;24:169–178.
22. Mann GV, Roels OA, Price DL, Merrill JM. Cardiovascular disease inAfrican Pygmies. J Chron Dis. 1962;15:341–371.
23. Shaper AG, Saxton GA. Blood pressure and body build in a rural com-munity in Uganda. E Afr Med J. 1969;46:228–245.
24. Kaminer B, Lutz WPW. Blood pressure in Bushman of the Kalaharidesert. Circulation. 1960;22:289–295.
25. Williams AW. Blood pressure differences in Kikuyu and Samburu com-munities in Kenya. E Afr Med J. 1969;46:262–272.
26. Fulmer HS, Roberts RW. Coronary heart disease among the NavajoIndians. Ann Int Med. 1963;59:740–764.
27. Kapur YP, Patt AJ. Hearing in Todas of South India. Arch Otolaryngol.1967;85:400–406.
28. Padmavati S, Gupta S. Blood pressure studies in rural and urban groupsin Delhi. Circulation. 1959;19:395–405.
29. Whyte HM. Body fat and blood pressure of natives in New Guinea:reflections on essential hypertension. Australas Ann Med. 1958;7:36–46.
30. Maddocks I. Possible absence of essential hypertension in two completePacific Islands populations. Lancet. 1961;2:396–399.
31. Maddocks I. Blood pressures in Melanesians. Med J Aust. 1967;54:1123–1126.
32. Stanhope JM. Blood pressures of the Tinam Aigram people, near Simbai,Madang district. P N G Med J. 1968;11:60–61.
33. Vaughan JP. Blood pressure and heart murmurs in a rural population inthe United Republic of Tanzania. Bull World Health Organ. 1979;57:89–97.
34. Murphy W. Some observations on blood pressure in the humid tropics.N Z Med J. 1955;54:64–73.
35. Barnes R. Comparison of blood pressure and blood cholesterol levels ofNew Guineans and Australians. Med J Aust. 1965;1:611–617.
36. Hunter JD. Diet, body build, blood pressure and serum cholesterol levelsin coconut eating Polynesians. Fed Proc. 1962:21;36–43.
37. Centers for Disease Control and Prevention. NHANES III and IV Documen-tation. Available at: www.cdc.gov/nchs/nhanes.htm. Accessed September 1,2005.
38. Law MR, Frost CD, Wald NJ. By how much does dietary salt reductionlower blood pressure? I: analysis of observational data among popu-lations. BMJ. 1991;302:811–815.
39. James GD, Baker PT. Human population biology and hypertension:evolutionary and ecological aspects of blood pressure. In: Laragh JH,Bremer BM, eds. Hypertension: Pathophysiology, Diagnosis and Man-agement. New York, NY: Raven Press; 1999:137–145.
40. Waldron I, Nowotarski M, Freimer M, Henry JP, Post N, Witten C.Cross-cultural variation in blood pressure: a quantitative analysis of therelationships of blood pressure to cultural characteristics, salt con-sumption and body weight. Soc Sci Med. 1982;16:419–420.
41. Intersalt Cooperative Research Group. Intersalt: an international study ofelectrolyte excretion and blood pressure–results for 24-hour urinarysodium and potassium excretion. BMJ. 1988;297:319–328.
42. Lifton RP, Gharval AG, Geller DS. Molecular mechanisms of humanhypertension. Cell. 2001;104:545–556.
43. Fagard RH. Epidemiology of hypertension in the elderly. Am J GeriatrCardiol. 2002;11:23–28.
44. Hall WD. Risk reduction associated with lowering systolic bloodpressure: review of clinical trial data. Am Heart J. 1999;138:225–230.
45. SHEP Cooperative Research Group. Prevention of stroke by antihyper-tensive drug treatment in older persons with isolated systolic hyper-tension: final results of the Systolic Hypertension in the Elderly Program(SHEP). JAMA. 1991;26:265:3255–3264.
46. Aviv A. Salt and hypertension: the debate that begs the bigger question.Arch Intern Med. 2001;161:507–511.
47. Safar ME,Temmar M, Kakou A, Lacolley P, Thornton SN. Sodium intakeand vascular stiffness in hypertension. Hypertension. 2009;54:203–209.
48. Segers P, Mahieu D, Kips J, Rietzschel E, De Buyzere M, De Bacquer D,Bakaert S, De Backer G, Gillebert T, Verdonck P, Van Bortel L; for theAsklepios investigators. Amplification of the pressure pulse in the upperlimb in healthy, middle-aged men and women. Hypertension. 2009;54:414–420.
49. Pearson JD, Morrell CH, Brant LH, Landis PK, Fleg JL. Age-associatedchanges in blood pressure in a longitudinal study of healthy men andwomen. J Gerontol. 1997;52A:M177–M183.
Skurnick et al Cross-Cultural Sex Differences in Pulse Pressure 47
by guest on June 30, 2018http://hyper.ahajournals.org/
Dow
nloaded from
Joan H. Skurnick, Mordechay Aladjem and Abraham AvivSex Differences in Pulse Pressure Trends With Age Are Cross-Cultural
Print ISSN: 0194-911X. Online ISSN: 1524-4563 Copyright © 2009 American Heart Association, Inc. All rights reserved.
is published by the American Heart Association, 7272 Greenville Avenue, Dallas, TX 75231Hypertension doi: 10.1161/HYPERTENSIONAHA.109.1394772010;55:40-47; originally published online November 16, 2009;Hypertension.
http://hyper.ahajournals.org/content/55/1/40World Wide Web at:
The online version of this article, along with updated information and services, is located on the
http://hyper.ahajournals.org/content/suppl/2009/11/17/HYPERTENSIONAHA.109.139477.DC1Data Supplement (unedited) at:
http://hyper.ahajournals.org//subscriptions/
is online at: Hypertension Information about subscribing to Subscriptions:
http://www.lww.com/reprints Information about reprints can be found online at: Reprints:
document. Permissions and Rights Question and Answer this process is available in the
click Request Permissions in the middle column of the Web page under Services. Further information aboutOffice. Once the online version of the published article for which permission is being requested is located,
can be obtained via RightsLink, a service of the Copyright Clearance Center, not the EditorialHypertensionin Requests for permissions to reproduce figures, tables, or portions of articles originally publishedPermissions:
by guest on June 30, 2018http://hyper.ahajournals.org/
Dow
nloaded from

1
ONLINE SUPPLEMENT
Sex Differences in Pulse Pressure Trends with Age Are Cross-Cultural
Joan H. Skurnick, PhD*, Mordechay Aladjem, MD†, Abraham Aviv, MD‡
*Department of Preventive Medicine and Community Health, University of Medicine and
Dentistry-New Jersey Medical School, Newark, NJ, †Assaf Harofe Medical Center,
Sackler School of Medicine, Tel Aviv University, Zerifin, Israel, ‡Center of Human
Development and Aging, University of Medicine and Dentistry-New Jersey Medical
School, Newark, NJ.
Address inquiries to:
Joan Skurnick, Medical Sciences Building – F506, 185 South Orange Avenue,
Department of Preventive Medicine and Community Health, UMDNJ-New Jersey
Medical School, Newark, NJ 07101-1709
E-mail: [email protected]
2
______________________________________________________________________ Table S1. Articles Excluded from Analyses ______________________________________________________________________ Populations deemed acculturated, not rural or isolated Ashford BK, Dowling GB. A series of blood pressures in 250 cases in Puerto Rico. P R J Public Health Trop Med. 1930;5:477-479. Dash SC, Swain PK, Sundaram KR, Malhotra KK. Hypertension epidemiology in an Indian tribal population. J Assoc Physicians India. 1986;34:567-570. Dubey VD. A study of blood pressure amongst industrial workers of Kanpur. J Indian Med Assoc.1964;23:495-498. Fleming WD. Blood chemistry and blood pressure standards. The effect of tropical residence on the blood chemistry and blood pressure. J Metab Res. 1924;6:87-121. Lovell RRH, Maddocks I, Rogerson GW. The casual arterial pressure of Fijians and Indians. Australas Ann Med. 1960;9:4-17. Lygonis C. Arterial blood pressure in a Faroese fishing community. Dan Med Bull. 1967;14:82-83. Makela M, Barton SA, Schull WJ, Weidman W, Rothhammer F. The multinational Andean genetic and health program. – IV. Altitude and the blood pressure of the Aymara. J Chron Dis. 1978;31:587-603. Malhotra SL. Studies in arterial pressure in the North & South India with special reference to dietary factors in its causation. J Assoc Physicians India. 1971;19:211-224. Mathur K, Wahi PN, Gahlaut D. Blood pressure studies in the adult population of Agra, India. Amer J Cardiol. 1963;11:61-65 . Page LB, Vandevert DE, Nader K, Lubin NK, Page JR. Blood pressure of Qash’qai pastoral nomads in Iran in relation to culture, diet and body form. Amer J Clin Nutr. 1981;34:527-538. Sasaki N. High blood pressure and the salt intake of the Japanese. Jap Heart J. 1962;3(4);313-324. Seedat YK, Seedat MA, Hackland DB. Prevalence of hypertension in the urban and rural Zulu. J Epidemiol Community Health. 1982;36:256-261.
3
Simmons D, Barbour G, Congleton J, Levy J. Meacher P, Saul H, Sowerby T. Blood pressure and salt intake in Malawi: an urban rural study. J Epidemiol Community Health. 1986;40:188-192. Vizcayno JS, Icasas-Cabral E, Yason JV Jr., Morelos IS, Guzman VS, Matano S, Matsuzaki T, Kim SI. Studies on hypertension and risk factors in selected populations of the Philippines, Japan and Korea. Philipp J Cardiol. 1983;9:1-10. Blood pressure values not presented as mean, N per age group Becker BJP. Cardiovascular disease in the Bantu and coloured races of South Africa. S Afr J Med Sci. 1946;11:107-120. Casley-Smith JR. Blood pressure in Australian aborigines. Med J Aust. 1959;9:627-633. Chopra RN, Chopra SC. A study of the normal blood pressure in Indians. Indian Medical Gazette. 1942;77:21-23. Mann GV, Shaffer RD, Anderson RS, Sandstead HH. Cardiovascular disease in the Masai. J Atheroscler Res. 1964;4:289-312. Marvin HP, Smith ER. Hypertensive cardiovascular disease in Panamanians and West Indians residing in Panama and the Canal Zone. Mil Surg. 1942;91:529-535. Sun S. Epidemiology of hypertension on the Tibetan plateau. Hum Biol. 1986:58,507-515. Taylor CE. The racial distribution of nephritis and hypertension in Panama. Am J Pathol. 1945;21:1031-1046. Tenbrinck MS. Blood pressure comparisons in tropical Africans and Peruvians. N Y State J Med. 1964;Oct 15:2584-2587. Thomas WA. Health of a carnivorous race: A study of the Eskimo. JAMA. 1927; 88:1559-1560. Williams AW. Hypertensive heart disease in the native population of Uganda. East Afr Med J. 1944; 21:328-33 Data presented graphically He J, Tell GS, Y-C, Mo P-S, He G-Q. Effect of migration on blood pressure: The Yi people study. Epidemiology. 1991;2(2):88-97 Page LB, Damon A, Moellering RC. Antecedents of cardiovascular disease in six Solomon Islands societies. Circulation. 1974;49:1132-1146.
4
Pandey MR. Upadhyaya LR, Dhungel S, Pillai KK, Regmi HN, Neupane RP. Prevalence of hypertension in a rural community in Nepal. Indian Heart J. 1981;33:284-289. Sinnett PF, Whyte MH. Epidemiologic studies in a total highland population, Tukisenta, New Guinea. Cardiovascular disease and relevant clinical, electrocardiographic, radiological and biochemical findings. J Chron Dis. 1973;26:265-290. Data not presented by sex Morse WR, McGill MD, Beh YT. Blood pressure amongst aboriginal ethnic groups of Szechwan province, West China. Lancet. 1937;I:966-967. Data for males only Donnison CP. Blood pressure in the African native. Lancet. 1929;i:6-7. Shaper AG, Williams AW, Spencer P. Blood-pressure and body build in an African tribe living on a diet of milk and meat. East Afr Med J. 1961;38:569-580. Williams AW. The blood pressure of Africans. East Afr Med J. 1941;18:109-117. Exclusion of subjects with hypertension Murrill RI. A blood pressure study of the natives of Ponape Island, Eastern Carolines. Human Biol. 1949;21:47-59. Data presented in other publications Poulter NR, Lury JD, Thompson AV. Blood pressures higher in the home than in the clinic in rural Kenya. J Epidemiol Community Health. 1986;40:186-187. Review articles with no original data Huizinga J. Casual blood pressure in populations. In: The Human Biology of Environmental Change: Proceedings of a Conference held in Blantyre, Malawi, April 5-12, 1971. London: International Biological Programme; 1972:164-167. Lovell RRH. The relationship between blood pressure and age in various races of mankind. Gerontologist. 1966;6:111-115. Nissinen A, Bothig S, Granroth H, Lopez AD. Hypertension in developing countries. World Health Stat Q. 1988;41(3-4);141-154. ______________________________________________________________________