Embed Size (px)
Citation preview
A S 0 9 4 0 5 0 6 6 SEC Registration Number
S W I F T F O O D S , I N C .
(Company’s Full Name)
S W I F T F O O D S I N C C O M P O U N D
S h e r i d a n S t r e e t , M a n d a l u y o n g
C i t y
(Business Address: No. Street City/Town/Province)
Atty. Jose A. Bernas 8110668/8101814 (Contact Person) (Company Telephone Number)
1 2 3 1 S E C 17 A Month Day (Form Type) Month Day (Calendar Year)
2013 (Annual
Meeting)
N/A
(Secondary License Type, If Applicable)
N/A Dept. Requiring this Doc. Amended Articles Number/Section Total Amount of Borrowings
10,916 Total No. of Stockholders Domestic Foreign
To be accomplished by SEC Personnel concerned
File Number LCU
Document ID Cashier
S T A M P S
Remarks: Please use BLACK ink for scanning purposes.
COVER SHEET
2
SECURITIES AND EXCHANGE COMMISSION
SEC FORM 17-A
ANNUAL REPORT UNDER SECTION 17 OF THE SECURITIES REGULATION CODE AND SECTION 141
OF THE CORPORATION CODE OF THE PHILIPPINES 1. For the calendar year ended December 31, 2013 2. SEC Identification Number AS094-005066 3. BIR Tax Identification Number 003-973-161
1. Exact name of registrant as specified in its charter SWIFT FOODS, INC.
2. Province, Country or other jurisdiction of incorporation or organization: Manila, Philippines
3. Industry Classification Code: (SEC Use Only)
4. Address of registrant’s principal office Swift Foods, Inc. Compound Sheridan Street, Highway Hills Mandaluyong City Postal Code 1603
5. Registrant's telephone number, including area code (632) 631-81-01
6. Former name, former address, and former fiscal year, if changed since last report Not applicable
7. Securities Registered pursuant to Sections 8 and 12 of the SRC or Sections 4 and 8 of the RSA Title of Each Class Number of Shares of Stock Outstanding Common 1,814,416,883 Preferred 49,035,671 Amount of Debt Outstanding -0- 11. Are any or all of these securities listed in the Philippine Stock Exchange? Yes [ X ] No [ ] 12. Check whether the registrant:
(a) has filed all reports required to be filed by Section 17 of the Securities Regulation Code (SRC) and SRC Rule 17 par. 2 thereunder and Sections 26 and 141 of The Corporation Code of the Philippines during the preceding 12 months (or for such shorter period that the registrant was required to file such reports);
Yes [ X ] No [ ] (b) has been subject to such filing requirements for the past 90 days Yes [ X ] No [ ] 13. State the aggregate market value of the voting stock held by non-affiliates of the registrant. (P97,555,254.70)

3
SWIFT FOODS, INC.
Supplementary Schedules Required By the Securities and Exchange Commission
As of and for the Year Ended December 31, 2013
TABLE OF CONTENTS Page No.
PART I - BUSINESS AND GENERAL INFORMATION
ITEM 1 BUSINESS 4 ITEM 2 PROPERTIES 9 ITEM 3 LEGAL PROCEEDINGS 9 ITEM 4 SUBMISSION OF MATTERS TO A VOTE OF SECURITY HOLDERS 9
PART II - OPERATIONAL AND FINANCIAL INFORMATION
ITEM 5 MARKET PRICE OF AND DIVIDENDS ON REGISTRANT’S COMMON EQUITY AND RELATED STOCKHOLDER MATTERS 10
ITEM 6 MANAGEMENT’S DISCUSSION AND ANALYSIS OR PLAN OF OPERATION 12 ITEM 7 FINANCIAL STATEMENTS 15 ITEM 8 CHANGES IN AND DISAGREEMENTS WITH ACCOUNTANTS
AND FINANCIAL DISCLOSURE 16
PART III - CONTROL AND COMPENSATION INFORMATION
ITEM 9 DIRECTORS AND EXECUTIVE OFFICERS 17 ITEM 10 EXECUTIVE COMPENSATION 19 ITEM 11 SECURITY OWNERSHIP OF CERTAIN BENEFICIAL OWNERS AND MANAGEMENT 22 ITEM 12 CERTAIN RELATIONSHIPS AND RELATED TRANSACTIONS 23
ITEM 13 CORPORATE GOVERNANCE 24
PART IV - EXHIBITS AND SCHEDULES 25
ITEM 14 A. EXHIBITS
SIGNATURES 26
INDEX TO FINANCIAL STATEMENTS AND SUPPLEMENTARY SCHEDULES 27
INDEX TO EXHIBITS 28
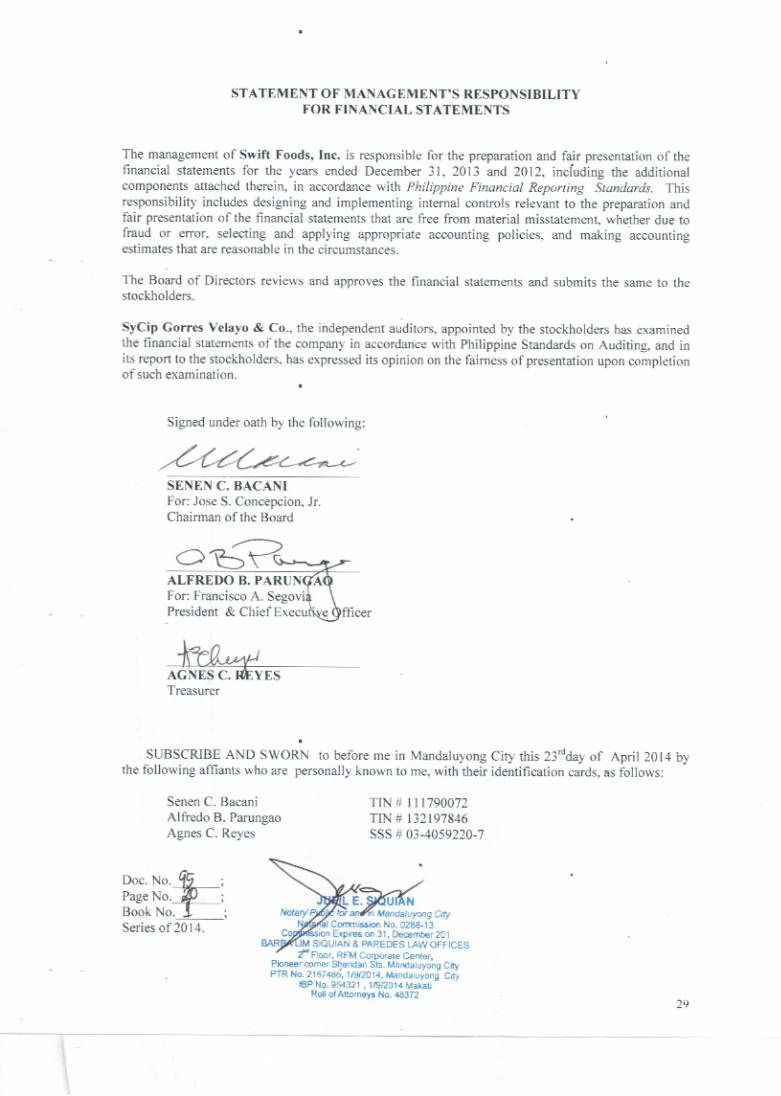
STATEMENT OF MANAGEMENT’S RESPONSIBILITY FOR FINANCIAL STATEMENTS SIGNED UNDER OATH 29
ADDITIONAL FINANCIAL DISCLOSURE CHECKLIST
ANNEX “A” - TOP 100 COMMON & PREFERRED STOCKHOLDERS
ANNEX “B” - AUDITED FINANCIAL STATEMENTS
ANNEX “C” - SUPPLEMENTARY SCHEDULES
4
Part 1 : Business and General Information Item 1. Business Swift Foods, Inc. (SFI or the “Company”) was incorporated on 6 June 1994 to assume RFM’s business of manufacturing, marketing, and distributing processed and canned meat products, poultry products, and commercial feeds.
The Company was primarily organized into two business divisions, namely, agribusiness (poultry and feeds) and meat (meat processing and sales & distribution) divisions. RFM Corporation began its agribusiness operations in 1965 when it diversified into feed milling. In 1970, it expanded into the poultry business when it entered into a licensing agreement with Peterson Industries and H & N Layers to breed day-old chicks in the Philippines. In 1977, the Company expanded its poultry business by establishing a broiler farm and dressing plant in Cebu. In June 1994, the Agribusiness and Meat Division of RFM were spun-off to Swift Foods, Inc. The Company undertook an extensive expansion program in 1987 in response to increased market demand. Integrated branches were established across the country. The Company has 10 integrated branches nationwide engaged in hatching, growing, dressing and distribution operations which supply poultry to customers within its geographic area. In November 2001, the employees of Meat Division went on strike, which effectively caused the closure of the Cabuyao plant. As a result, the Board of Directors decided to transfer the marketing, selling, and distribution activities of the Meat Division to RFM Corporation to join the latter’s branded food group business effective 1 October 2002. In April 2009, the company decided to shutdown all branch operation except for Palawan branch. In August 2011, the company formally ceased its GHQ operation due to severe losses The Company’s agribusiness division produces and sells poultry products: live and dressed/ processed chicken. In 2013, dressed chicken accounted for approximately 100% of volume sold. Dressed chicken branded as “Sariwanok” are sold either whole, cut-up into parts and/or customized and processed according to customers’ requirements.
About 65.38% of the Company’s products are sold to its distributors which sell mainly to down line accounts or wet markets. The balance of 34.62% are sold to Secondary Accounts Group representing mainly the supermarkets, groceries, hotels, restaurants including the food service/fast food segment and Live broiler and DOC . The Philippine poultry industry consists of members of the Philippine Association of Broiler Integrators (PABI) which account for about 70% of total production and commercial raisers, which represent about 30%. Members of PABI include San Miguel Foods, Inc., Swift Foods, Inc., Tyson’s Agro Ventures, Universal Robina, and Vitarich Corporation. Through the years, competition has become more intense, due not only to the increase in domestic production but increase in imports as well. The Government, recognizing the critical role of the industry in agricultural growth, has continued to provide support through the minimum access volume, safeguards law and other measures that give some level of protection to the industry from import surges, smuggling and unfair trade competition. Swift has 16 employees as of December 31, 2013, broken down as follows:
Executive 2 Managers/Supervisors 5 Rank and File 9

5
Swift’s poultry production involves four processes: breeding, hatching, broiler growing operations and dressing/processing operations. Parent stock breeders are raised for 21 weeks and then bred over a period of 41 weeks in Swift’s contract breeder farms to produce broiler-hatching eggs. The eggs are shipped to hatcheries where broiler chicks are hatched. The broiler chicks are placed in the Company’s broiler contract farms and mature in about 40 days. These are either sold live to traders or sent to Swift’s plants for slaughtering/processing. Under Swift’s contract growing arrangements, contract growers provide the following services: housing for the birds that meets Swift’s requirement and broiler specifications; labor for day-to-day operations of the farm; and overhead costs such as water, electricity and fuel. The contract also requires the farmer to comply with the vaccination programs and to provide bio-security measures specified by Swift. In return, Swift supplies day-old chicks, feeds, medication and technical assistance. Swift’s feeds are formulated using the Brill Feeds Formulation, a software program that identifies the formulation of feed that meets certain nutrient specifications. Feeds are either pre-ground or post-ground. In Swift’s pre-grinding feeds operations, bulk raw materials are ground and then mixed separately with micro-ingredients before batch mixing. In Swift’s post grinding feed operations, bulk raw materials are ground simultaneously and poured into the batch mixer where micro-ingredients are added. The primary raw materials used in Swift’s feeds are corn, soybean meal, and coconut oil. Raw materials are available when needed. The Company is not dependent upon one or a limited number of suppliers for essential raw materials and there are no existing supply contracts. The principal suppliers of the Company for its major raw materials are Cargill, Cathay Drug, Biosure, EJV Enterprises, Supervet International, Rising G and among others.
The Company secures the following government approval/permits for its principal products or services:
Product Activity Approval/Permits Being
Secured Government Agency
Feeds/Feeds Ingredients Manufacturing. Importing, etc. NFA, BAI Grandparent/Parent Stocks Import permit BAI. NEDA Chicken Leg Quarters Import permit. VQC BAI(Bureau of Animal
Industry) Dressing of broilers
Inspection fee-PO.15/head for ante-mortem &p0.25/kg for post mortem
National Meat Inspection Commission (NMIC)
Chicken products - Export permit. VQC NMIC. BAT Trademarks: The Company has registered trademarks and has also applied for trademark registration for its products. A trademark has a life of 20 years from registration date. It has a term of ten (10) years and is renewable for another ten (10) years. Once registered, a company is granted the exclusive right over the trademark. Filing of affidavit of use every 5th and 10th year anniversary is necessary to show proof that the trademarks are in use. While Swift retains ownership over the trademarks, RFM Corporation was granted the license to use some of the trademarks for its meat products. In 2009, the ownership of the trademarks for its meat products was assigned back to RFM Corporation. The Trade License Agreement between Swift Foods, Inc. and RFM Corporation was
6
finalized in year 2012. Hence, the Swift brand and name is now officially owned by RFM Corporation. However, the agreement provides that Swift Foods, Inc. shall cease to use Swift in its company name and chicken products if and when it discontinues its poultry business. RFM Corporation sold its Swift brands and logos last November 2012. Presently, the name ‘SWIFT’ is retained as company name but the chicken products are sold under the trademark of ‘SARIWANOK’. Financial Risk Management Objectives and Policies:
The Company’s principal financial instruments consist of cash and cash equivalents, trade receivables, due from related parties, due from employees, rental deposits, trust receipts and acceptances payable and bank loan. The main purpose of these financial instruments is to ensure adequate funds for the Company’s operations and capital expansion. The Company has other financial instruments such as receivables and accounts payable and accrued liabilities arising directly from its operations. It is the Company’s policy that no trading of financial instruments shall be undertaken. The Company’s management and the BOD review and approve policies for managing these risks. Management closely monitors the funds and financial transactions of the Company. The Company recognizes the fact that their business operations are always exposed, in one way or the other, to some level of uncertainties or risks which, if not properly addressed and managed, could be detrimental to the profitability of the Company. Listed below are the financial risks the Company is exposed to: Credit risk Credit risk is the risk that the Company will incur a loss because its counterparties failed to discharge their contractual obligations. The Company manages credit risk by transacting only with a few recognized and creditworthy customers with whom it has already firmly established a good business relationship. It is the Company’s policy that all customers who wish to contract on credit terms are subjected to credit verification procedures. In addition, receivable balances are monitored on an ongoing basis with the result that the Company’s exposure to bad debt is not significant.
The Company controls credit risk through strict monitoring procedures and regular coordination with customers. The Company has no significant concentration of credit risk.
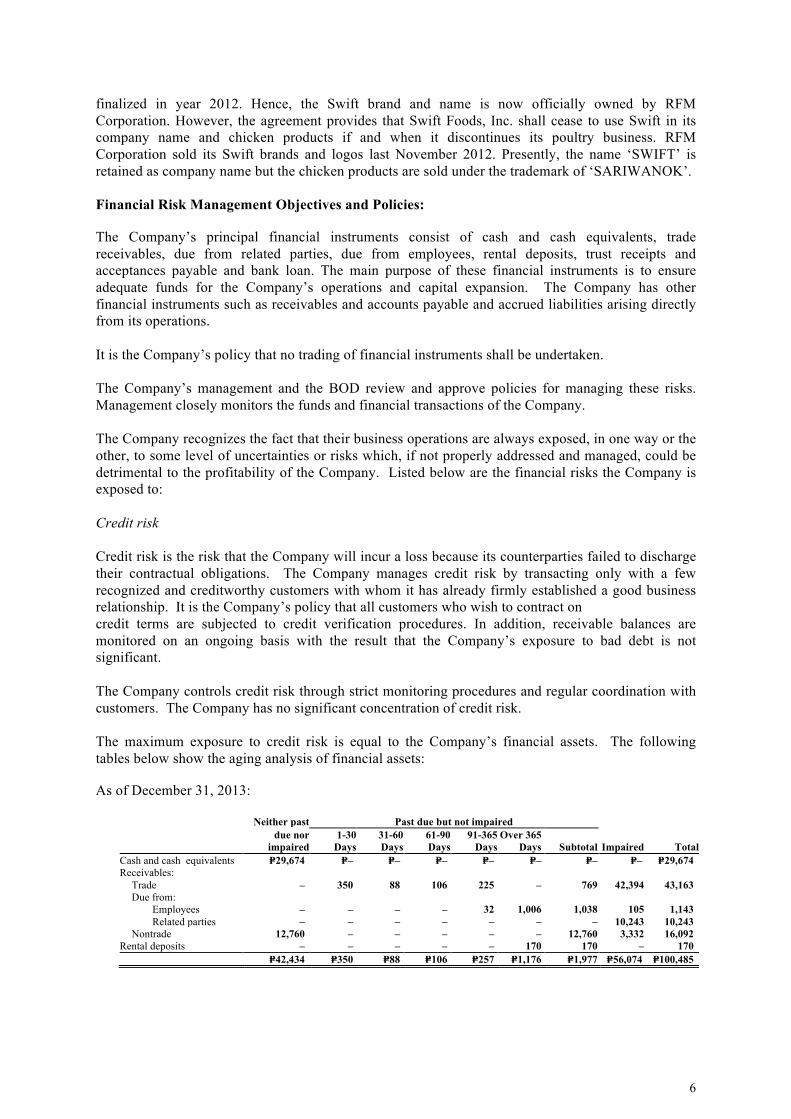
The maximum exposure to credit risk is equal to the Company’s financial assets. The following tables below show the aging analysis of financial assets:
As of December 31, 2013:
Neither past Past due but not impaired
due nor
impaired 1-30
Days 31-60 Days
61-90 Days
91-365 Days
Over 365 Days Subtotal Impaired Total
Cash and cash equivalents P=29,674 P=– P=– P=– P=– P=– P=– P=– P=29,674 Receivables: Trade – 350 88 106 225 – 769 42,394 43,163 Due from: Employees – – – – 32 1,006 1,038 105 1,143 Related parties – – – – – – – 10,243 10,243 Nontrade 12,760 – – – – – 12,760 3,332 16,092 Rental deposits – – – – – 170 170 – 170 P=42,434 P=350 P=88 P=106 P=257 P=1,176 P=1,977 P=56,074 P=100,485

7
As of December 31, 2012: Neither past Past due but not impaired
due nor
impaired 1-30 Days
31-60 Days
61-90 Days
91-365 Days
Over 365 Days Subtotal Impaired Total
Cash and cash equivalents P=84,074 P=– P=– P=– P=– P=– P=– P=– P=84,074 Receivables: Trade 1,526 307 219 11 66 586 1,189 40,800 43,515 Due from: Employees – – 10 – 710 701 1,421 105 1,526 Related parties – – – – – – – 10,243 10,243 Nontrade 153,217 – – – – – – 3,332 156,549 Rental deposits – – – – – 252 252 – 252 P=238,817 P=307 P=229 P=11 P=776 P=1,539 P=2,862 P=54,480 P=296,159
The following tables summarize the credit quality of the Company’s financial assets. As of December 31, 2013:
Neither past due nor impaired High grade Standard Grade Total Cash and cash equivalents P=29,674 P=– P=29,674 Nontrade receivables – 12,760 12,760 P=29,674 P=12,760 P=42,434
As of December 31, 2012:
Neither past due nor impaired High grade Standard Grade Total Cash and cash equivalents P=84,074 P=– P=84,074 Receivables: Trade – 1,526 1,526 Nontrade – 153,217 153,217 P=84,074 P=154,743 P=238,817
Cash and cash equivalents are classified as High grade since these are deposited and invested with reputable banks and can be withdrawn anytime. High grade receivables pertain to those receivables from clients or customers that consistently pay before the maturity date. Standard grade includes receivables that are collected on their due dates even without an effort from the Company to follow them up. Past due receivables and advances include those that are past due but are still collectible. The majority of these past due receivables are not considered to be impaired. Liquidity risk Liquidity risk is the risk that the Company will not be able to meet its obligations when they fall under normal and stress circumstances. To limit risk, the Company manages its liquid funds through cash planning on a monthly and weekly basis. The Company uses historical figures and experiences and forecasts from its collections and disbursements, as well as projections based on the annual business plan. Likewise, the Company places excess funds in short-term cash investments. The Company also enters into restructuring agreements with creditor banks, as the need arises. In 2012, the Company disposed of its investment properties to settle its obligations. The table below summarizes the Company’s maturity profile of financial assets held for managing liquidity and maturity profile of financial liabilities based on contractual undiscounted obligations.

8
As of December 31, 2013:
On Less than 3 to 12 Demand 3 months months 3 Total
Loans and receivables: Cash and cash equivalents P=29,674 P=– P=– P=29,674 Receivables: Trade – 544 225 769 Due from employees – 32 1,006 1,038 Nontrade – – 12,760 12,760 Total financial assets 29,674 576 13,991 44,421 Other financial liabilities: Accounts payable and accrued liabilities* P=67,899 P=– P=– P=67,899 Liquidity position (gap) (P=38,225) P=576 P=13,991 (P=23,478) *Excluding nonfinancial liabilities amounting to P=165.
As of December 31, 2012:
On Less than 3 to 12 Demand 3 months Months 3 Total
Loans and receivables: Cash and cash equivalents P=84,074 P=– P=– P=84,074 Receivables: Trade 1,189 1,526 – 2,715 Due from employees 1,421 – – 1,421 Nontrade 23,207 130,010 – 153,217 Total financial assets 109,891 131,536 – 241,427
Other financial liabilities: Accounts payable and accrued liabilities* 179,781 – – 179,781 Liquidity position (gap) (P=69,890) P=131,536 P=– P=61,646 *Excluding nonfinancial liabilities amounting to P=12,892.
Interest rate risk The Company’s exposure to changes in interest rates relates primarily to the Company’s short-term and bank loans, as well as interest on trust receipts and acceptances payable. The Company manages its exposure to interest rate risk by closely monitoring the same with various banks and other financial institutions and maximizing borrowing period based on market volatility of interest rates. The loans are subject to interest computed at either the bank’s prevailing market rate or on MART 1 rates and is repriced either on a monthly or quarterly basis (see Note 13). The sensitivity to a reasonably possible change in interest rates with all other variables held constant of the Company’s income before income tax in 2011 (nil in 2013 and 2012 as the Company has settled its interest-bearing loans) follows:
Increase / Decrease
Interest Rate Effect on Loss
Before Income Tax 2011 +0.5% (490)
-0.5% 490
There is no other impact on the Company’s equity other than those already affecting the statements of income. The Company’s only operation relates to agricultural activity and the financial instruments held by the Company only relates to such activity. As such, the financial risk management disclosure on credit

9
risk, liquidity risk, and interest rate risk are likewise the strategies related to agricultural activity as required by PAS 41. Financial risk management related to agricultural activities The Company is exposed to financial risk due to changes in the cost and supply of feed raw materials and also to the volatility of chicken selling price, and other products which are determined by the supply and demand in the market. There are other factors which contribute to this risk over which the Company has little control such as government regulations, climate and diseases that may affect the livestock. Such risks and mitigating factors are listed below. Inherent risk to food manufacturing particularly in the fresh meat processing is spoilage and contamination. Generally, food manufacturing is being regulated by government agencies. The Company employs controls in its manufacturing processes to ensure that all finished products passed through rigid quality control. In addition, government representatives which are deployed to all the Company’s dressing plants are always on the lookout to attest the quality of the finished product through issuance of corresponding certificates. The authorities, however, may impose additional regulatory requirements that may require significant capital investment at short notice. The Company ensures that this possibility is considered during the financial budgeting process.
Major raw materials for livestock production like yellow corn expose the Company to risk particularly with the supply and price. The fluctuation of the price of yellow corn is dependent on the harvest results. Production cost will be unfavorably affected if there will be shortage in the supply. The Company closely monitors production requirements particularly of bulk raw materials to avail of competitive prices. In case of shortages in certain areas, the Company sources the raw materials from other areas of the country if the prices are competitive. However, whenever domestic supply of yellow corn falls short of industry requirements, the government has been flexible in regulating the supply of corn by allowing importation of corn when domestic supply is short. Another option is to use a substitute feed ingredient like wheat, which is readily available in the international market and priced competitively. Item 2. Properties Swift’s poultry production facility consists of one broiler farm located in Tanay, Rizal. The Company also has leased properties as listed below:
PROPERTY LOCATION Pioneer Office Building Mandaluyong City Palawan – Office Puerto Princesa, Palawan Palawan-Feeds Warehouse Bgy. Tinigiban. Puerto Princesa. Palawan Palawan- Cold Storage Bgy. Masipag., Puerto Princesa, Palawan
Item 3. Legal Proceedings Based on the Company’s records, the Company has an outstanding tax assessment before the Court of Tax Appeals involving P11.95 million deficiency value added tax for the taxable year 2007.
Item 4. Submission of Matters to a Vote of Security Holders
There were no matters submitted to a vote of security holders during the calendar year covered by this report.

10
PART II – OPERATIONAL AND FINANCIAL INFORMATION Item 5. Market for Registrant’s Common/Preferred Equity and Related Stockholder Matters There were no dividends declared in favor of common stockholders for the years 2013 and 2012. Preferred shareholders are not entitled to receive dividends. (1) Market Information Common Stocks The common shares of stock of SFI are traded on the Philippine Stock Exchange (PSE). The high and low sales prices for each quarter within the last two calendar years are as follows:
Date High Low Close 2012: Quarter ended March 31 P=0.155 P=0.146 P=0.146 Quarter ended June 29 0.138 0.126 0.128 Quarter ended September 28 0.140 0.135 0.139 Quarter ended December 28 0.146 0.141 0.141 2013: Quarter ended March 27 0.139 0.139 0.139 Quarter ended June 27 0.121 0.119 0.121 Quarter ended September 30 0.134 0.124 0.124 Quarter ended December 27 0.120 0.120 0.120
The price as of the last trading date for this report is P0.12 on 27 December 2013.
There are 7,479 stockholders of 1,814,416,883 common shares of stock of the Company as of December 31, 2013.
Preferred Stocks The preferred shares of stock of the Company are traded on the Philippine Stock Exchange (PSE). There are 3,437 stockholders of 49,035,671 issued and outstanding preferred shares of stock of the Company as of December 31, 2013.
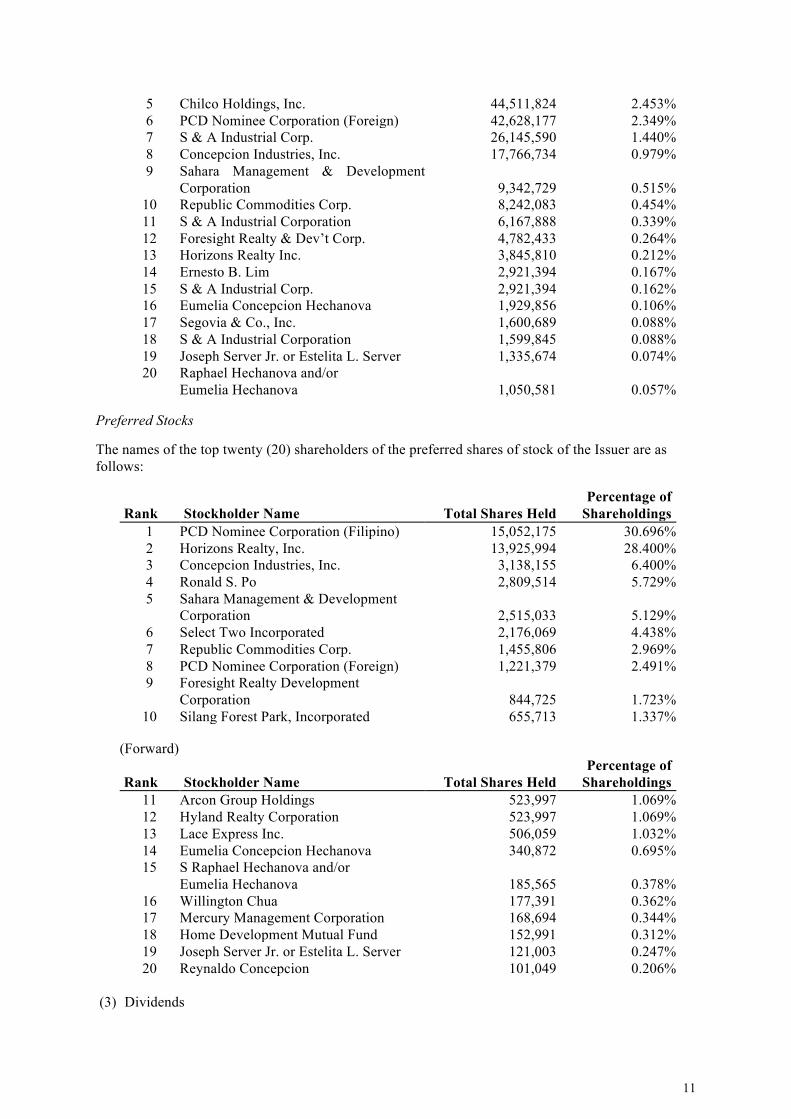
(2) Holders A list of the top one hundred (100) common and preferred stockholders of the Company as of December 31, 2012 is attached hereto as Annex “A”. Common Stocks The names of the top twenty (20) shareholders of the common shares of stock of the Issuer are as follows:
Rank Stockholder Name Total Shares Held Percentage of
Shareholdings 1 PCD Nominee Corporation (Filipino) 1,310,081,088 72.203% 2 Renaissance Property 117,292,756 6.464% 3 Li Chih-Hui 100,000,000 5.511% 4 Feati University 77,119,994 4.250%
11
5 Chilco Holdings, Inc. 44,511,824 2.453% 6 PCD Nominee Corporation (Foreign) 42,628,177 2.349% 7 S & A Industrial Corp. 26,145,590 1.440% 8 Concepcion Industries, Inc. 17,766,734 0.979% 9 Sahara Management & Development
Corporation 9,342,729 0.515% 10 Republic Commodities Corp. 8,242,083 0.454% 11 S & A Industrial Corporation 6,167,888 0.339% 12 Foresight Realty & Dev’t Corp. 4,782,433 0.264% 13 Horizons Realty Inc. 3,845,810 0.212% 14 Ernesto B. Lim 2,921,394 0.167% 15 S & A Industrial Corp. 2,921,394 0.162% 16 Eumelia Concepcion Hechanova 1,929,856 0.106% 17 Segovia & Co., Inc. 1,600,689 0.088% 18 S & A Industrial Corporation 1,599,845 0.088% 19 Joseph Server Jr. or Estelita L. Server 1,335,674 0.074% 20 Raphael Hechanova and/or
Eumelia Hechanova 1,050,581 0.057% Preferred Stocks The names of the top twenty (20) shareholders of the preferred shares of stock of the Issuer are as follows:
Rank Stockholder Name Total Shares Held Percentage of
Shareholdings 1 PCD Nominee Corporation (Filipino) 15,052,175 30.696% 2 Horizons Realty, Inc. 13,925,994 28.400% 3 Concepcion Industries, Inc. 3,138,155 6.400% 4 Ronald S. Po 2,809,514 5.729% 5 Sahara Management & Development
Corporation 2,515,033 5.129% 6 Select Two Incorporated 2,176,069 4.438% 7 Republic Commodities Corp. 1,455,806 2.969% 8 PCD Nominee Corporation (Foreign) 1,221,379 2.491% 9 Foresight Realty Development
Corporation 844,725 1.723% 10 Silang Forest Park, Incorporated 655,713 1.337%
(Forward)
Rank Stockholder Name Total Shares Held Percentage of
Shareholdings 11 Arcon Group Holdings 523,997 1.069% 12 Hyland Realty Corporation 523,997 1.069% 13 Lace Express Inc. 506,059 1.032% 14 Eumelia Concepcion Hechanova 340,872 0.695% 15 S Raphael Hechanova and/or
Eumelia Hechanova 185,565 0.378% 16 Willington Chua 177,391 0.362% 17 Mercury Management Corporation 168,694 0.344% 18 Home Development Mutual Fund 152,991 0.312% 19 Joseph Server Jr. or Estelita L. Server 121,003 0.247% 20 Reynaldo Concepcion 101,049 0.206%
(3) Dividends

12
Prior to 7 July 2004, the preferred stock earns cumulative dividends up to a maximum of 15%. The dividend rate is based on the issue price of P10 per share. The dividends are payable quarterly. One preferred share is convertible to 10 common shares at any time after the issuance up to 7 August 2003. The holders of the convertible preferred share have the option to put the said shares to the Company on any date commencing two years after the end of the offer period until 7 August 2003, which was extended until 27 February 2004. Upon the exercise of said right, the Company shall redeem the convertible preferred shares at the offer price plus any accumulated dividends. On 12 May 2004, the stockholders amended the terms of the convertible preferred shares by extending the conversion period until 7 August 2038, and the put option period until 7 August 2038. Likewise, the preferred shareholders shall not be entitled to receive dividend at any time and neither shall such shares participate in any other dividends declare in favor of common shares. The above amendment was approved by the stockholders during the annual stockholders’ meeting on 25 June 2004 approved by the Securities and Exchange Commission on 7 July 2004. On 1 September 2005, the stockholders further amended the terms of the convertible preferred shares by granting the Company as issuer the option to redeem the convertible preferred shares on any date commencing from the time of approval by the SEC of the amendments and until 7 August 2038 at the offer price. Previously, the holder has the option to put the convertible preferred shares to the Company but this option was removed in the September 1, 2005 amendments. The Company has no obligation to redeem any preferred shares that remain outstanding after 7 August 2038. These amendments were approved by the Securities and Exchange Commission on 19 October 2005. On 11 October 2006, the stockholders removed the term of the convertible preferred shares formerly set at 7 August 2038. Hence, the Corporation shall have the option to redeem the convertible preferred shares at the offer price on any date commencing from the time of the approval by the SEC of the amendment. SEC approved the amendment on 6 December 2006. (4) Recent Sales of Unregistered Securities There are no sales of unregistered securities in the last four (4) years.
Item 6. Management’s Discussion and Analysis of Financial Conditions and Results of Operations Results of Operations – CY2013 vs. CY2012 Results of Operations. The Company formally rested its business operation except for Palawan branch, which remains as the only company-operated facility. Proceeds from sale of company properties were used to settle its outstanding obligations to various suppliers, banks and business partners. A significant portion of company’s obligation had been settled. Only the unreconciled, unverified and undocumented obligations remain hanging in the books. Financial Position. The Company’s assets as of December 31, 2013 totaled to P158 million as compared to P357 million as of December 31, 2012 due to sale of various properties and payment of liabilities. Current ratio for the year 2013 is 0.731:1 against last year’s current ratio of 1.295:1. Available cash on hand and in banks decreased by 64.70% vs. last year due to payment of various suppliers. Accounts receivable decreased by P 143 million due to collections made. Inventories increased by 0.0248% due to increase of frozen dressed chicken. Biological assets decreased by 26.57% due to reduction of chick-in volume. The decrease in property, plant and equipment of 0.26% represents depreciation of company vehicle during the year. Accounts payable and accrued liabilities decreased by 64.50% mainly due to cash payments, offsetting and adjustments of accounts payables.. The retirement benefits obligation decreased by 89.08% due to payment of retirement benefits to employees.

13
Net cash used in operations amounted to P=54.40 million. There is no cash from investing activities. In summary, cash and cash equivalents for the year decreased by about 64.70% mainly due to payment various suppliers. Results of Operations – CY2012 vs. CY2011 Results of Operations. The Company decided to cease Luzon operation in 2011 due to continuous losses incurred by the Company. Only the Palawan branch remains operational. The company sold its Pioneer property to DMCI, Manggahan property to LBL Industries Inc., and San Jose Del Monte Farm to De Oro Khwa. Proceeds from these sales were used to settle outstanding obligations to various suppliers, banks and business partners. Financial Position The Company’s assets as of December 31, 2012 totaled to P357 million as compared to P1.029 billion as of December 31, 2011. Current ratio for the year 2012 is 1.289:1 against last year’s current ratio of 0.05:1. Available cash on hand and in banks increased by 112.5% vs. last year due to sale of various properties. Accounts receivable increased by 155,470 million due to sale of property. Inventories decreased by 54.37% due to sale of remaining stocks. Biological assets (current) increased by 31.09% due to purchases of day old chicks. Investment properties decrease by 99.95% due to sales of Pioneer and Manggahan property. The decrease in property, plant and equipment of 37.40% represents disposal of assets during the year. The Company disposed property, plant and equipment through sale to settle accountabilities of the Company to its suppliers and creditors. Other current assets decreased by 79.61% due to creditable withholding tax applied to income tax. Accounts payable and accrued liabilities decreased by 74.47% mainly due to cash payments, offsetting and adjustments of accounts payables. Trust receipts and acceptances payable and bank loans decreased by 100% due to cash payment of Land bank and UCPB loan. The retirement benefits obligation increased by 2.61% due to increase in current service cost and changes in discounted rate. Net cash used in operations amounted to P243.306 million. Net cash from investing activities amounted to P637,140 million. In summary, cash and cash equivalents for the year increased by about 112.5% mainly due to various collections of receivables. Results of Operations – CY2011 vs. CY2010 Results of Operations. The Year 2011 was the most critical year for the Company. The Company decided to cease Luzon operation in 2011 due to continuous losses incurred by the Company. As a result of this event, the Company’s cash position was affected, and consequently, its ability to pay debt was compromised. The management approached its suppliers/creditors/banks to offer for sale and/or payment in kind, its investment properties that are not utilized in the normal course of its business. This exercise will allow the Company to pay off all outstanding liabilities from its former operations and limit liabilities to its current operations. Only the Palawan branch remains operational. Financial Position The Company’s assets as of December 31, 2011 totaled to P=1.029 billion as compared to P=1.190 billion as of December 31, 2010. Current ratio for the year 2011 is 0.05:1 against last year’s current ratio of 0.15:1. Available cash on hand and in banks increased by 78.85% vs. last year due to collection of accounts receivables. Accounts receivable decreased by 96.98% due to collections made. Inventories decreased by 88.63% due to sale of remaining stocks. Biological assets (current) decreased by 90.66% and biological assets (non-current) decreased by 100.00% due to culling of all breeder livestock. The decrease in property, plant and equipment of 7.38% represents depreciation and disposal of assets during the year. The Company disposed property, plant and equipment through sale to settle accountabilities of the Company to its suppliers and creditors. Other non-current assets decreased by 46.87% due to amortization of intangible assets. Accounts payable and accrued liabilities decreased by 7.36% mainly due to cash payments, offsetting and adjustments of accounts payables. Trust receipts and acceptances payable and bank loans decreased by 0.007%

14
due to cash payment of UCPB loan. The retirement benefits obligation increased by 17.97% due to increase in current service cost and changes in discounted rate. Net cash used in operations amounted to P=12.359 million. Net cash from investing activities amounted to P5.043 million. In summary, cash and cash equivalents for the year increased by about 78.85% mainly due to various collections of receivables. Plan of Operation: The company continues to wait for better business opportunities and carefully evaluate various business plans. Presently, only the Palawan branch remains operational and continues to produce quality Sariwanok chicken. However, plans are underway to increase its production within the next twelve months. The management aims to sell its remaining assets to fund its plan to increase production of Palawan branch. There is no any product research and development at the moment.

15
Key Performance Indicators:
Key Performance Indicator Formula CY2013 CY2012
Sales Revenue Growth Sales this period
Sales in the prior period (99.03%) (24.50%)
Operating Margin Income from Operations
Net Sales (36.15%) (68.5%)
Net income/(loss) (55,050) 104,668
ROS Net income before tax after interest
Net sales (69.88%) 114.91%
Current Ratio Current assets
Current liabilities 72.13% 128.87%
Debt to equity Total liabilities 1.91 2.34
Asset to equity Total assets
Total equity 2.91 3.34
Solvency ratio Income before income tax + depreciation
Total liabilities (52.60%) (36.60%)
Interest coverage ratio EBIT
Interest expense – 957.72%
Profitability ratio Gross profit
Net sales 6.88% 12.27%
Item 7. Financial Statements
See Audited Financial Statements as of December 31, 2013, attached hereto as Annex “B”.
(Amounts in thousands) 2013 2012 Trade - net of allowance for doubtful accounts of P=42,394 in 2013 and P=40,800 in 2012 P=769 P=2,715 Employees - net of allowance for doubtful accounts of P=105 in 2013 and 2012 1,038 1,421 Related parties - net of allowance for doubtful accounts of P=10,243 in 2013 and 2012 (Note 19) – – Nontrade receivables - net of allowance for
doubtful accounts of P=3,332 in 2013 and 2012 (see Note 9) 12,760 153,217
P=14,567 P=157,353

16
There is no advance made to any director, stockholder, officer or related interests (DOSRI) or any affiliates as of December 31, 2013.
Prepaid Expenses and Other Current Assets (in thousands):
2013 2012 Creditable withholding tax P=17,072 P=17,081 Rental deposits 170 252 Others 22 39 17,264 17,372 Less allowance for probable losses 17,000 17,000 P=264 P=372
Item 8. Changes in and Disagreements with Accountants on Accounting and Financial Disclosure Independent Public Accountants The Company’s external auditors since incorporation have been Sycip, Gorres, Velayo & Co. In compliance with SEC Memorandum Circular No. series of 2003, changes were made in the assignment of SGV’s engagement partners. The election, approval or ratification of the registrant’s public accountant shall also be discussed during the Annual Meeting. Sycip Gorres and Velayo & Co., which is the principal accountant for the fiscal year ending December 31, 2012, has been selected and shall be recommended to stockholders for election, approval or ratification for the current year. Representatives of Sycip Gorres and Velayo & Co. are expected to be present at the Annual Meeting. They will have the opportunity to make a statement if they desire to do so and are expected to be available to respond to appropriate questions. There are no changes in or disagreements with accountants on accounting and financial disclosure. Under SRC Rule 68 (3)(b)(iv), the external auditors shall be rotated every five (5) years of engagement. In case of a firm, the signing partner shall be rotated every after said period. The reckoning date for such rotation shall commence in year 2002. The signing partner assigned to the corporation is changed or rotated every after five (5) years of engagement in accordance with SRC Rule 69 (3)(b)(iv) and SEC Memorandum Circular No. 8 Series 2003. The manual of corporate governance does not provide for the audit committee’s approval policies and procedures for the services of the external auditor. The annual Audit Fee for 2013 is P=330,000.00 only. The audit committee does not have any formal policies and procedures for the services of the external auditor.

17
PART III – CONTROL AND COMPENSATION INFORMATION
Item 9. Directors and Executive Officers of the Registrant (1) Directors and Executive Officers – The Directors of the Corporation are elected at the regular annual meeting of stockholders to serve for one (1) year until their successors are elected and qualified. The Officers of the Corporation are elected by a majority vote of the Board of Directors and are enumerated below, with a description of their business experience over the past five years.
Directors / Officers Designation Citizenship Term Jose Concepcion, Jr. Chairman of the Board Filipino 1 year Francisco A. Segovia President / CEO Filipino 1 year Luis Bernardo A. Concepcion Director Filipino 1 year Senen C. Bacani Director Filipino 1 year Antonette Palma-Angeles Director Filipino 1 year Alfredo Parungao Director Filipino 1 year Alejandrino Ferreria Director Filipino 1 year Agnes C. Reyes Treasurer Filipino 1 year Jose A. Bernas Corporate Secretary Filipino 1 year Marie Lourdes T. Sia-Bernas Asst. Corporate Secretary Filipino 1 year Nerissa L. Marasigan-Shaw Asst. Corporate Secretary Filipino 1 year
Jose S. Concepcion, Jr., 82, born on 29 December 1931, obtained an Associate’s Degree in Business Administration from De La Salle University and a Bachelor’s Degree in Agriculture from Araneta University. He is the Chairman of the Board of Swift Foods, Inc. He is also the Chairman of the Board of RFM Corporation, RFM Foundation Incorporated ,and Executive Committee of the ASEAN Chamber of Commerce and Industry. Mr. Concepcion also holds Co-Chairman position in the Bishops-Businessmen’s Conference. He was previously designated as the Secretary of the Department of Trade and Industry, Chairman of the Board of Investments, member of the Central Bank Monetary Board, National President of the Council of Laity (Philippines) and the Society of Vincent Paul, National Chairman of the National Citizens Movement for Free Elections, Founding President of the Pasay City Citizen League for Good Government, delegate to the 1971 Constitutional Convention of the first District of Rizal, the Charter President of the Capitol Jaycees, and Trustee of the Oblate Educational System, Notre Dame University. Mr. Jose S. Concepcion, Jr. is the father of Mr. Jose Ma. A. Concepcion III, the current President and Chief Executive Officer of RFM Corporation, Luis Bernardo, Ma. A. Concepcion, a Director of Swift Foods, Inc., and John Marie A. Concepcion, the Managing Director and Chief Executive Officer of Selecta. Francisco A. Segovia, 60, born on 17 January 1954, obtained a Bachelor of Science degree in Business Management from the Ateneo de Manila University. He is Vice Chairman and CEO of FEATI University, RPMC Holdings Inc., He is President of Segovia & Company., Inc., Fritz International Philippines, Inc., Intellicon, Inc., Chilco Holdings, Araneta Institute of Agriculture, Republic Dynamic Corporation, and Republic Consolidated Corporation. He is a director of RFM Corporation, Philippine Township, Inc., Invest Asia Corporation, and WWWExpress Corporation. Luis Bernardo A. Concepcion, 53, born on 20 August 1960, has a degree in Business Administration from St. Ambrose College and completed the International Course on Swine and Poultry Husbandry from the Barneveld College, The Netherlands. Mr. Concepcion was the President of Philippine Association of Broiler Integrators (PABI) in 1988-1989. He currently serves as Board Member of the Chamber of Agriculture & Food, Inc. Senen C. Bacani, 68, born on 30 July 1945 in Guagua, Pampanga, he obtained a Bachelor of Science in Commerce from De La Salle University in 1965, Summa cum Laude & class valedictorian. A Certified Public Accountant, he was granted an East-West Center Scholarship in 1966 and graduated
18
from the University of Hawaii with a Master of Business Administration in 1968. He started his career with Dole Company in Honolulu and for the next 22 years, he progressively occupied management positions of increasing responsibility in the Philippines, Thailand, Ecuador and Costa Rica. Former President Corazon C. Aquino appointed him Secretary of Agriculture in 1989. He holds several key positions in various companies & institutions as follows: President of Ultrex Management and Investments Corp., Chairman of La Frutera, Inc., Member of the Board of Directors of Roxas Holdings Inc., Franklin Baker Inc., and Icebox Services Inc. He is an independent director. Antonette Palma-Angeles, 57, born on 25 August 1956, she obtained a bachelor’s degree in Philosophy and Communication Arts, and a Master of Arts degree in Philosophy from Ateneo de Manila University. She likewise has a Ph.D. in Philosophy from the Katholieke Universteit Lueven. She is currently the Academic Vice-President of Ateneo de Manila University. She is an Associate Professor in the Ateneo de Manila University. She is a member of the Board of Trustees of the Asian Institute of Management. She is very active in public service as a Lecturer in Business Ethics for some Philippine corporations, as well as Lecturer in Ethics in Government for various government agencies, notably the Bureau of Internal Revenue and National Electrification Authority. She is an independent director. Alfredo B. Parungao, 76, born on 24 January 1938, obtained his Bachelor of Science Degree in Commerce at the Far Eastern University, graduated summa cum laude. A certified public accountant, he also got a Program for Management Development at Harvard Business School. He is at present the President of Ligaya Management Corporation, CIBI Foundation, Member Board of Trustees and Chairman of Insular Life Assurance Co., Ltd, Member Board of Director of Insular Investment and Trust Corporation and UBIX Corporation and Chief of Staff, Social Security Commission. Alejandrino J. Ferreria, 63, born on 18 February 1951, obtained a Bachelor of Science degree in Management from the Ateneo de Manila University, a Masters Degree in Business Administration from the University of the Philippine, and a Doctorate in Education Management from National University. He was also the Bank of America Foundation Professor of Business Management of Asian Institute of Management (“AIM”) and was school dean of 3 of the 4 schools of AIM. He currently sits on several board. Some of which are: Goodyear Philippines, Pascual Laboratories, Producers Savings Bank, G&S Transport (Avis Rent a Car), and Radiowealth Finance. Jose A. Bernas, 54, born on 22 January 1960, obtained a Bachelors Degree in Arts from Haverford College and a Juris Doctor Degree from Ateneo de Manila University – School of Law. He is a member of the Philippine and New York Bar. He is the Chairman of the Board of Dun and Bradstreet Philippines Inc. and Automation Specialists and Power Exponents, Inc. He is the President of Discovery Centre Condominium Corporation, Esquire Financial Management Corporation, and Esquire Traders and Merchants Corporation, and is a director of Micros-Fidelio Software Philippines Inc., Perdana Land Philippines Inc., and MSI-ECS Philippines Inc. He is the Corporate Secretary of Berjaya Philippines Inc., which is also a company listed at the Philippine Stock Exchange, of Steven Leach, Jr. + Associates (Consultants) Inc., Philippine Gaming Management Corporation, Perdana Land Philippines Inc., Perdana Hotel Philippines Inc., Berjaya Pizza (Philippines) Inc., Berjaya Foundation Inc., Friendster Philippines Inc., MOL AccessPortal Inc., Cosway Philippines Inc., and Uniwiz Trade Sales Inc. He is a Trustee for The Atrium of Makati Condominium Corporation. He is a professor at the Ateneo de Manila University School of Law. He is the Managing Partner of the Bernas Law Offices. Marie Lourdes T. Sia-Bernas, 48, born on 16 December 1965, obtained a Bachelors of Arts Degree in Politiacal Science from De La Salle University and a Juris Doctor Degree from Ateneo de Manila University - School of Law. She is a member of the Philippine Bar. She is the President of Deux Mille Trading Corporation, Silver Giggling Buddha Trading Inc., and Noblesse Instruments Philippines Inc. She is the President and Chairman of the Board of Sanpiro Realty & Development Corporation and of Landphil Management and Development Corporation. She is a Director and Corporate Secretary of Micros-Fidelio Software Philippines Inc., the Corporate Secretary of Juillet Trading Corporation,
19
Ultrasaurus Philippine Trading Inc., Discovery Centre Condominium Corporation, Fasolco Realty Corporation, Neptune Properties Inc., and Neptune Holdings Inc. She is the Corporate Secretary and Treasurer of Esquire Financial Management Corporation and Esquire Traders and Merchants Corporation. She is the Assistant Corporate Secretary of Berjaya Philippines Inc., which is also a company listed at the Philippine Stock Exchange, of Philippine Gaming Management Corporation, Perdana Land Philippines Inc., Perdana Hotel Philippines Inc., Berjaya Pizza (Philippines) Inc., Berjaya Auto Philippines Inc., Berjaya Foundation Inc., Friendster Philippines Inc., MOL AccessPortal Inc., Cosway Philippines Inc., and Uniwiz Trade Sales Inc.. She is the Administrative Partner at Bernas Law Offices. Nerissa L. Marasigan - Shaw, 33, born on 09 April 1981, obtained a Bachelor of Arts Degree in Economics and a Bachelor of Science Degree in Marketing Management from De La Salle University; and a Masters Degree in Business Administration and a Juris Doctor Degree from the MBA-JD Program of De La Salle University and Far Eastern University. She is a member of the Philippine Bar. She is a Trustee and Assistant Corporate Secretary of Discovery Center Condominium Corporation. She is a Director of Shaw Investments, Inc. She is a Director and Assistant Corporate Secretary of Sanpiro Realty & Development Corporation and Anvil International Holdings, Inc. She is a Director and Treasurer of Landphil Management and Development Corporation and Neptune Properties, Inc. She is an Associate Lawyer at Bernas Law Offices. Agnes C. Reyes, 59, born on 21 March 1955, obtained a Bachelor of Science Degree in Commerce from the University of Sto. Tomas. She was appointed Treasurer on 5 August 2013. (2) Significant Employees : None (3) Family Relationships Jose S. Concepcion, Jr. is the father of Jose Ma. A. Concepcion III and Luis Bernardo Ma. A. Concepcion. Francisco A. Segovia is the latter’s first cousin. Maria Lourdes T. Sia-Bernas is the wife of Jose A. Bernas. There are no other family relationships between and among the directors and officers of the corporation except for the ones mentioned above. (4) Involvement in Certain Legal Proceedings To the knowledge and information of the Company, the above-named directors and executive officers were not involved during the past five (5) years in any bankruptcy proceeding. Neither have they been convicted by final judgment in any criminal proceeding or have been subject to any order, judgment or decree of competent jurisdiction, permanently or temporarily enjoining, barring, suspending, or otherwise limiting their involvement in any type of business, securities, commodities or banking activities. Nor have they been found in action by any court or administrative bodies to have violated a securities or commodities law. (5) Independent Directors Messrs. Senen C. Bacani, Alfredo Parungao, and Alejandrino Ferreria, and Ms. Antonette Palma-Angeles are independent minority stockholders who are neither employees nor officers of the Corporation, and whose shareholdings are .00022% percent of the Corporation’s equity pursuant to Section 38 of the Securities Regulation Code. The Chairman of the Board nominated the candidates for independent directors. Item 10. Executive Compensation The Chief Executive Officer received a total of approximately P2,370,294 in year 2013 and P5,200,000 in CY 2012, broken down as follows:
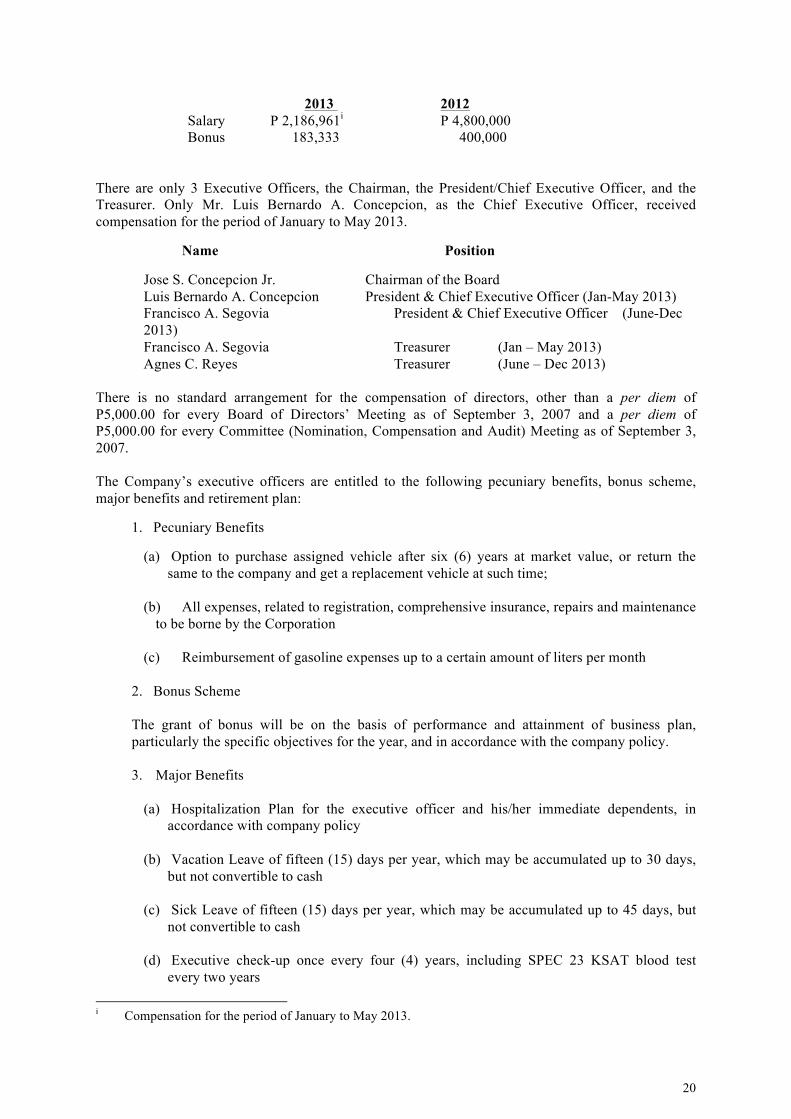
20
2013 2012 Salary P 2,186,961i P 4,800,000 Bonus 183,333 400,000 There are only 3 Executive Officers, the Chairman, the President/Chief Executive Officer, and the Treasurer. Only Mr. Luis Bernardo A. Concepcion, as the Chief Executive Officer, received compensation for the period of January to May 2013. Name Position Jose S. Concepcion Jr. Chairman of the Board Luis Bernardo A. Concepcion President & Chief Executive Officer (Jan-May 2013) Francisco A. Segovia President & Chief Executive Officer (June-Dec
2013) Francisco A. Segovia Treasurer (Jan – May 2013) Agnes C. Reyes Treasurer (June – Dec 2013) There is no standard arrangement for the compensation of directors, other than a per diem of P5,000.00 for every Board of Directors’ Meeting as of September 3, 2007 and a per diem of P5,000.00 for every Committee (Nomination, Compensation and Audit) Meeting as of September 3, 2007.
The Company’s executive officers are entitled to the following pecuniary benefits, bonus scheme, major benefits and retirement plan:
1. Pecuniary Benefits
(a) Option to purchase assigned vehicle after six (6) years at market value, or return the
same to the company and get a replacement vehicle at such time;
(b) All expenses, related to registration, comprehensive insurance, repairs and maintenance to be borne by the Corporation
(c) Reimbursement of gasoline expenses up to a certain amount of liters per month
2. Bonus Scheme
The grant of bonus will be on the basis of performance and attainment of business plan, particularly the specific objectives for the year, and in accordance with the company policy.
3. Major Benefits
(a) Hospitalization Plan for the executive officer and his/her immediate dependents, in
accordance with company policy
(b) Vacation Leave of fifteen (15) days per year, which may be accumulated up to 30 days, but not convertible to cash
(c) Sick Leave of fifteen (15) days per year, which may be accumulated up to 45 days, but
not convertible to cash
(d) Executive check-up once every four (4) years, including SPEC 23 KSAT blood test every two years
i Compensation for the period of January to May 2013.

21
4. Retirement Plan The retirement plan is available to any individual who has rendered at least five (5) years of service with the Company, which benefit is equivalent to twenty-five percent (25%) of the basic pay per year of service, to be increased by five percent (5%) per additional year of service up to a maximum of 125%. 5. Others The Company has no compensatory plan or arrangement, including payments to be received from the registrant, with respect to a named executive officer, if such plan or arrangement results or will result from the resignation, retirement or any other termination of such executive officer employment with the registrant and its subsidiaries or from a change-in-control of the registrant or a change in the named executive officer’s responsibilities following a change-in-control and the amount involved, including all periodic payment or installments, which exceeds P2,500,000. A. Commitments and Contingent Liabilities There are no significant commitments and contingencies involving the Company. Others The Philippines continues to experience economic difficulties relating to currency fluctuations, volatile stock markets and slowdown in growth. In addition, there are commitments, guarantees, litigations, and contingent liabilities that arise in the normal course of the Company’s operations which are not reflected in the accompanying financial statements. Management is of the opinion that losses, if any, from these commitments and contingencies will not have material effects on the Company’s financial statements.
1) Subsequent Events
The company already settled all labor cases in August 2013.
2) Earnings per share.
Earnings per share were computed as follows:
2013 2012 2011 Net income (loss) attributable to
common stockholders (P=55,050) P=104,668 (P=94,735) Divided by weighted average number
of common stock 1,811,006,013 1,629,023,513 1,038,823,700 Basic/diluted earnings (loss) per share (P=0.03) P=0.06 (P=0.09)
3) Capital Stock:
Information on capital stock in 2013 and 2012 follows:
Number of shares 2013 2012 Preferred stock - P=1 par value: Authorized shares 200,000,000 200,000,000 Issued shares 60,133,941 60,816,115 Outstanding shares 49,035,671 49,717,845

22
Common stock - P=1 par value: Authorized shares 2,500,000,000 2,500,000,000 Issued and outstanding shares 1,814,416,883 1,807,595,143
4) Deficit As of December 31, 2013 and 2012, the deficit of the Company (in thousands) amounted to P=2,994,225 and P=2,941,638, respectively. There is no stock purchase agreement, stock agreement, stock split or other dividends. 5) Treasury Stock Preferred shares as of December 31, 2013 and 2012 amounted to 11,098,270 shares. Supplementary Schedules F & I only, others are either not applicable or the information required to be presented is included in the Company’s financial statements or notes to financial statements. The Supplementary Schedules are attached hereto as Annex “C”. Item 11.1 Security Ownership of Certain Beneficial Owners Owners of more than five (5%) of the Corporation’s securities as of December 31, 2013 are as follows:
Title of Class
Name and Address of Record Owner
Name of Beneficial Owner
Citizenship Number of Shares Held
Percentage Held
Common PCD Nominee G/F Makati Stock Exchange 6767 Ayala Ave., Makati City
PCD Nominee Filipino 1,310,081,088 72.20%
Preferred PCD Nominee G/F Makati Stock Exchange 6767 Ayala Ave., Makati City
PCD Nominee Filipino 15,052,175 30.70%
Preferred Horizons Realty, Inc
Horizons realty, Inc Filipino 13,925,994 28.39%
Common Renaissance Property Management Corporation
Renaissance Property Filipino 117,292,756 6.46%
Preferred Concepcion Industries Concepcion Industries Filipino 3,138,155 6.39%
Preferred Ronald S. Po
Ronald S. Po
Filipino 2,809,514 5.73%
Common Li Chih Hui
Li Chih Hui
Filipino 100,000,000 5.51%
Preferred Sahara Mgt & Dev. Corp.
Sahara Mgt & Dev. Corp.
Filipino 2,515,033 5.13%

23
Item 11.2 Security Ownership of Management
Title of Class Name of Beneficial Owner
Amount & Nature of Beneficial Ownership Citizenship
% of Class
Common Jose Concepcion, Jr. 1,324,330 (“r”) Filipino 0.073% Common Luis Bernardo A. Concepcion 108,140 (“r”) Filipino 0.006% Common Francisco A. Segovia 3 (“b”) Filipino 0.000% Common Senen C. Bacani 1 (“b”) Filipino 0.000% Common Agnes C. Reyes 0 Filipino 0.000% Common Antonette Palma-Angeles 1,000 (“b”) Filipino 0.000% Common Alfredo Parungao 500 (“b”) Filipino 0.000% Common Alejandrino Ferreria 500 (“b”) Filipino 0.000% Common Jose A. Bernas 0 Filipino 0.000%
The total number of shares owned by the Directors and Executive Officers of the Corporation is 1,434,474 Common shares. Mr. Jose S. Concepcion, Jr. is authorized to vote the shares held by Horizons Realty Corporation. There are no persons holding more than 5% of a class under a voting trust or similar agreement. Item 12. Certain Relationships and Related Transactions Parties are considered to be related if one party has the ability, directly or indirectly, to control the other party or exercise significant influence over the other party in making financial and operating decisions. Parties are also considered to be related if they are subjected to common control or common significant influence. Related parties may be individuals or corporate entities. Related Party Transactions Related party relationships exist when the party has the ability to control, directly or indirectly, through one or more intermediaries, or exercise significant influence over the other party in making financial and operating decisions. Such relationships also exist between and/or among entities which are under common control with the reporting entity and its key management personnel, directors or stockholders. In considering each possible related party relationship, attention is directed to the substance of the relationships, and not merely to the legal form. The Company has transactions with related parties which consist mainly of the following:
2013:
Related Party
Category
Amount
Outstanding Balance of Receivable (Payable)
Terms and Conditions
Entities under common major shareholder group:
Invest Asia Corporation Rent and utilities (P=9) (P=5,570) On demand, non-interest bearing, unsecured
RFM Corporation Share in common expense
(P=177) (P=1,174) On demand, non-interest bearing, unsecured
RFM Insurance Brokers, Inc.
Insurance of livestock, building,
and car
(401) (20) On demand, non-interest bearing, unsecured
RFM Corporation Sale of engineering
supplies
– – On demand, non-interest bearing, unsecured, with impairment of P=362
Rent income – – On demand, non-interest bearing, unsecured, with impairment
24
of P=50 Filipinas Water Bottling
Company Inc. Rent income – – On demand, non-interest bearing,
unsecured, with impairment of P=1,034
Philippine Township, Inc. Other receivable – – On demand, non-interest bearing, unsecured, with impairment of P=473
Asia Food Franchise Trade receivables – – On demand, unsecured, with impairment of P=8,324
Total receivable (Note 5) P=– Total payable (Note 12) (P=6,764)
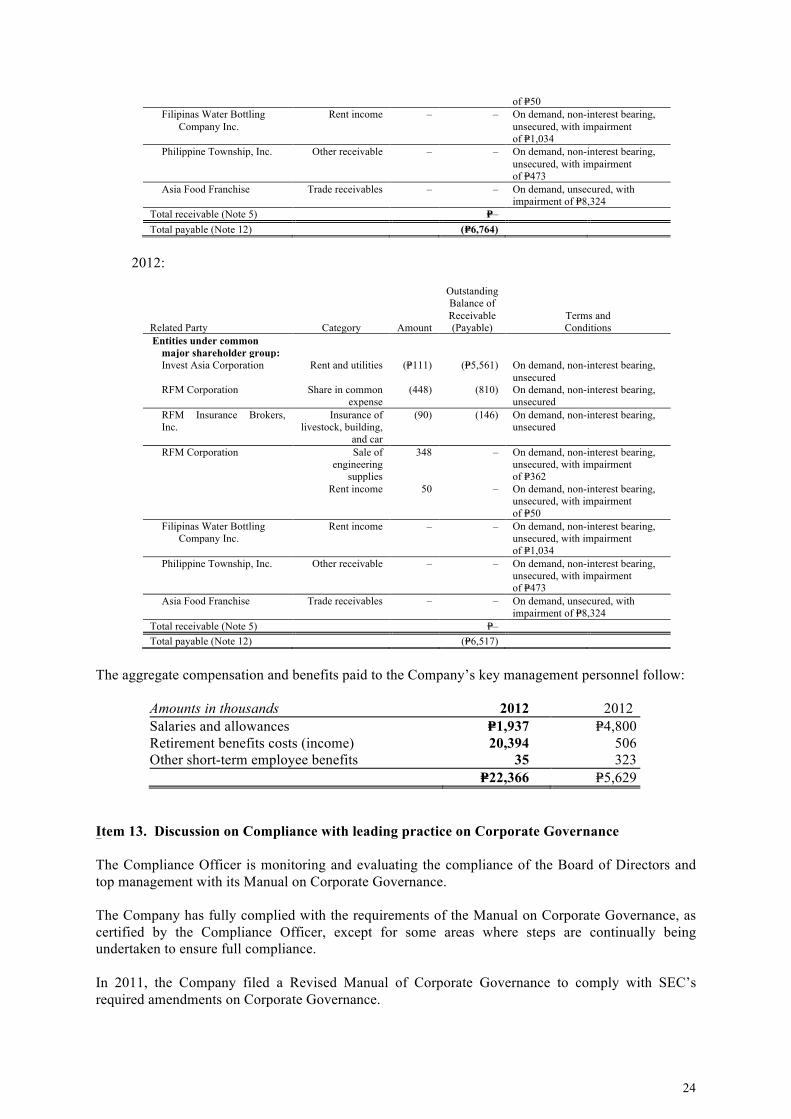
2012:
Related Party
Category
Amount
Outstanding Balance of Receivable (Payable)
Terms and Conditions
Entities under common major shareholder group:
Invest Asia Corporation Rent and utilities (P=111) (P=5,561) On demand, non-interest bearing, unsecured
RFM Corporation Share in common expense
(448) (810) On demand, non-interest bearing, unsecured
RFM Insurance Brokers, Inc.
Insurance of livestock, building,
and car
(90) (146) On demand, non-interest bearing, unsecured
RFM Corporation Sale of engineering
supplies
348 – On demand, non-interest bearing, unsecured, with impairment of P=362
Rent income 50 – On demand, non-interest bearing, unsecured, with impairment of P=50
Filipinas Water Bottling Company Inc.
Rent income – – On demand, non-interest bearing, unsecured, with impairment of P=1,034
Philippine Township, Inc. Other receivable – – On demand, non-interest bearing, unsecured, with impairment of P=473
Asia Food Franchise Trade receivables – – On demand, unsecured, with impairment of P=8,324
Total receivable (Note 5) P=– Total payable (Note 12) (P=6,517)
The aggregate compensation and benefits paid to the Company’s key management personnel follow:
Amounts in thousands 2012 2012 Salaries and allowances P=1,937 P=4,800 Retirement benefits costs (income) 20,394 506 Other short-term employee benefits 35 323 P=22,366 P=5,629
Item 13. Discussion on Compliance with leading practice on Corporate Governance The Compliance Officer is monitoring and evaluating the compliance of the Board of Directors and top management with its Manual on Corporate Governance. The Company has fully complied with the requirements of the Manual on Corporate Governance, as certified by the Compliance Officer, except for some areas where steps are continually being undertaken to ensure full compliance. In 2011, the Company filed a Revised Manual of Corporate Governance to comply with SEC’s required amendments on Corporate Governance.
25
There are no deviations from the Manual of Corporate Governance of the Company. Improvement of the Company’s corporate governance will be done when appropriate.
PART IV – EXHIBITS AND SCHEDULES
Item 14. Exhibits and Reports on SEC Form 17-A
(a) Exhibits
1. List of Top One Hundred (100) Stockholders as of December 31, 2013, referred to in Item 5(2) as Annex “A”
2. Audited Financial Statements & Report of Independent Auditors as of December 31, 2013, referred to in Item 7 as Annex “B”
3. Supplementary Schedules as Annex “C”

27
INDEX TO FINANCIAL STATEMENTS AND SUPPLEMENTARY SCHEDULES
Form 17-A
Page Report of Independent Public Accountants Balance Sheets as of December 31, 2013 and 2012 Statements of Income for the years ended December 31, 2013, 2012 and 2011 Statements of Comprehensive Income
for the years ended December 31, 2013, 2012 and 2011 Statements of Cash Flows for the years ended
December 31, 2013, 2012 and 2011 Notes to Financial Statements SUPPLEMENTARY SCHEDULES *
A. Financial Assets * B. Amounts Receivable from Directors, Officers, Employees
Related Parties and Principal Stockholders (Other than Related Parties) * C. Amounts Receivable from Related Parties which are eliminated
during consolidation of financial statements * D. Intangible assets – Other Assets * E. Long-term Debt * F. Indebtedness to Related Parties * G. Guarantees of Securities and Other Issuers * H. Capital Stock X
____________________ * - Not Applicable X - Attached
28
INDEX TO EXHIBITS
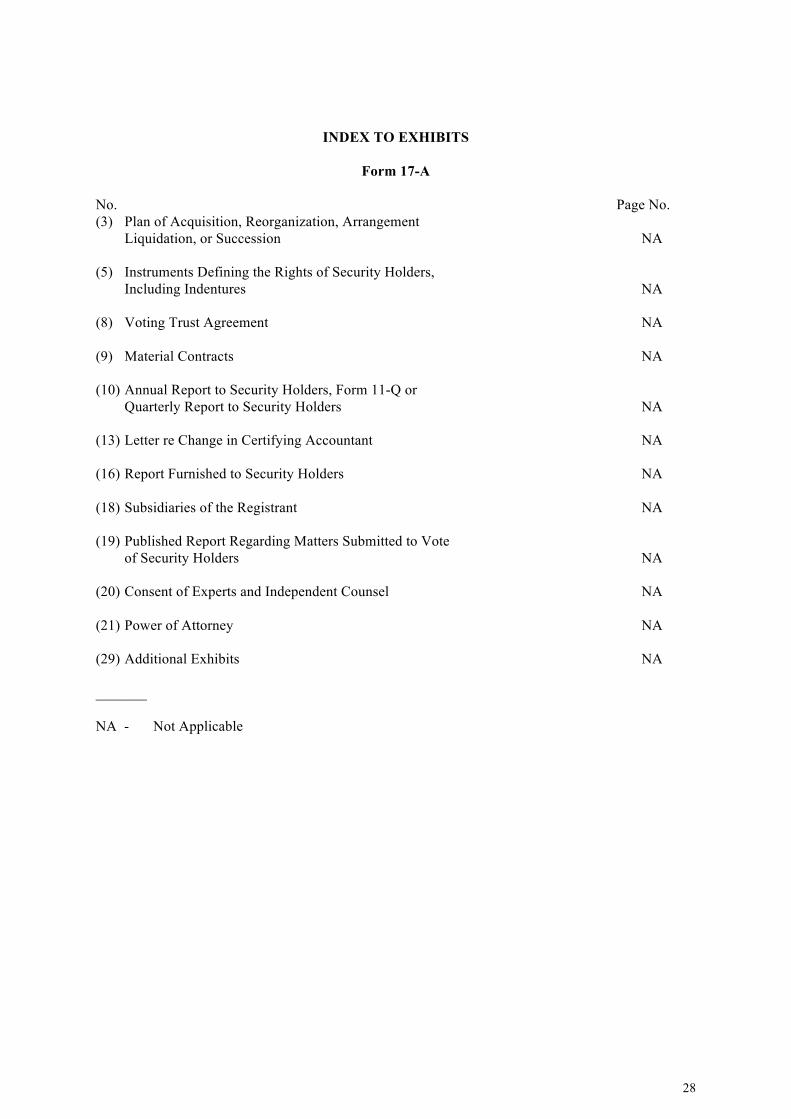
Form 17-A No. Page No. (3) Plan of Acquisition, Reorganization, Arrangement Liquidation, or Succession NA (5) Instruments Defining the Rights of Security Holders, Including Indentures NA (8) Voting Trust Agreement NA (9) Material Contracts NA (10) Annual Report to Security Holders, Form 11-Q or Quarterly Report to Security Holders NA (13) Letter re Change in Certifying Accountant NA (16) Report Furnished to Security Holders NA (18) Subsidiaries of the Registrant NA (19) Published Report Regarding Matters Submitted to Vote of Security Holders NA (20) Consent of Experts and Independent Counsel NA (21) Power of Attorney NA (29) Additional Exhibits NA _______ NA - Not Applicable
SWIFT FOODS, INC.
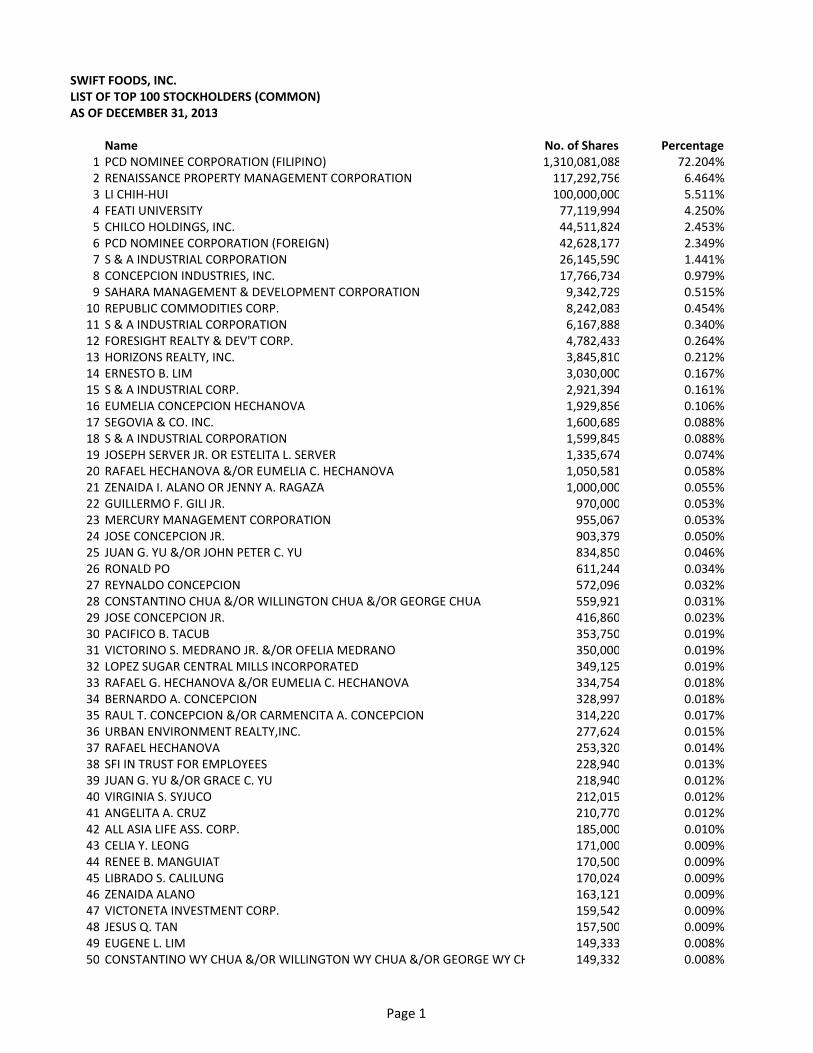
LIST OF TOP 100 STOCKHOLDERS (COMMON)
AS OF DECEMBER 31, 2013
Name No. of Shares Percentage
1 PCD NOMINEE CORPORATION (FILIPINO) 1,310,081,088 72.204%2 RENAISSANCE PROPERTY MANAGEMENT CORPORATION 117,292,756 6.464%3 LI CHIH-HUI 100,000,000 5.511%4 FEATI UNIVERSITY 77,119,994 4.250%5 CHILCO HOLDINGS, INC. 44,511,824 2.453%6 PCD NOMINEE CORPORATION (FOREIGN) 42,628,177 2.349%7 S & A INDUSTRIAL CORPORATION 26,145,590 1.441%8 CONCEPCION INDUSTRIES, INC. 17,766,734 0.979%9 SAHARA MANAGEMENT & DEVELOPMENT CORPORATION 9,342,729 0.515%
10 REPUBLIC COMMODITIES CORP. 8,242,083 0.454%11 S & A INDUSTRIAL CORPORATION 6,167,888 0.340%12 FORESIGHT REALTY & DEV'T CORP. 4,782,433 0.264%13 HORIZONS REALTY, INC. 3,845,810 0.212%14 ERNESTO B. LIM 3,030,000 0.167%15 S & A INDUSTRIAL CORP. 2,921,394 0.161%16 EUMELIA CONCEPCION HECHANOVA 1,929,856 0.106%17 SEGOVIA & CO. INC. 1,600,689 0.088%18 S & A INDUSTRIAL CORPORATION 1,599,845 0.088%19 JOSEPH SERVER JR. OR ESTELITA L. SERVER 1,335,674 0.074%20 RAFAEL HECHANOVA &/OR EUMELIA C. HECHANOVA 1,050,581 0.058%21 ZENAIDA I. ALANO OR JENNY A. RAGAZA 1,000,000 0.055%22 GUILLERMO F. GILI JR. 970,000 0.053%23 MERCURY MANAGEMENT CORPORATION 955,067 0.053%24 JOSE CONCEPCION JR. 903,379 0.050%25 JUAN G. YU &/OR JOHN PETER C. YU 834,850 0.046%26 RONALD PO 611,244 0.034%27 REYNALDO CONCEPCION 572,096 0.032%28 CONSTANTINO CHUA &/OR WILLINGTON CHUA &/OR GEORGE CHUA 559,921 0.031%29 JOSE CONCEPCION JR. 416,860 0.023%30 PACIFICO B. TACUB 353,750 0.019%31 VICTORINO S. MEDRANO JR. &/OR OFELIA MEDRANO 350,000 0.019%32 LOPEZ SUGAR CENTRAL MILLS INCORPORATED 349,125 0.019%33 RAFAEL G. HECHANOVA &/OR EUMELIA C. HECHANOVA 334,754 0.018%34 BERNARDO A. CONCEPCION 328,997 0.018%35 RAUL T. CONCEPCION &/OR CARMENCITA A. CONCEPCION 314,220 0.017%36 URBAN ENVIRONMENT REALTY,INC. 277,624 0.015%37 RAFAEL HECHANOVA 253,320 0.014%38 SFI IN TRUST FOR EMPLOYEES 228,940 0.013%39 JUAN G. YU &/OR GRACE C. YU 218,940 0.012%40 VIRGINIA S. SYJUCO 212,015 0.012%41 ANGELITA A. CRUZ 210,770 0.012%42 ALL ASIA LIFE ASS. CORP. 185,000 0.010%43 CELIA Y. LEONG 171,000 0.009%44 RENEE B. MANGUIAT 170,500 0.009%45 LIBRADO S. CALILUNG 170,024 0.009%46 ZENAIDA ALANO 163,121 0.009%47 VICTONETA INVESTMENT CORP. 159,542 0.009%48 JESUS Q. TAN 157,500 0.009%49 EUGENE L. LIM 149,333 0.008%50 CONSTANTINO WY CHUA &/OR WILLINGTON WY CHUA &/OR GEORGE WY CHUA 149,332 0.008%
Page 1
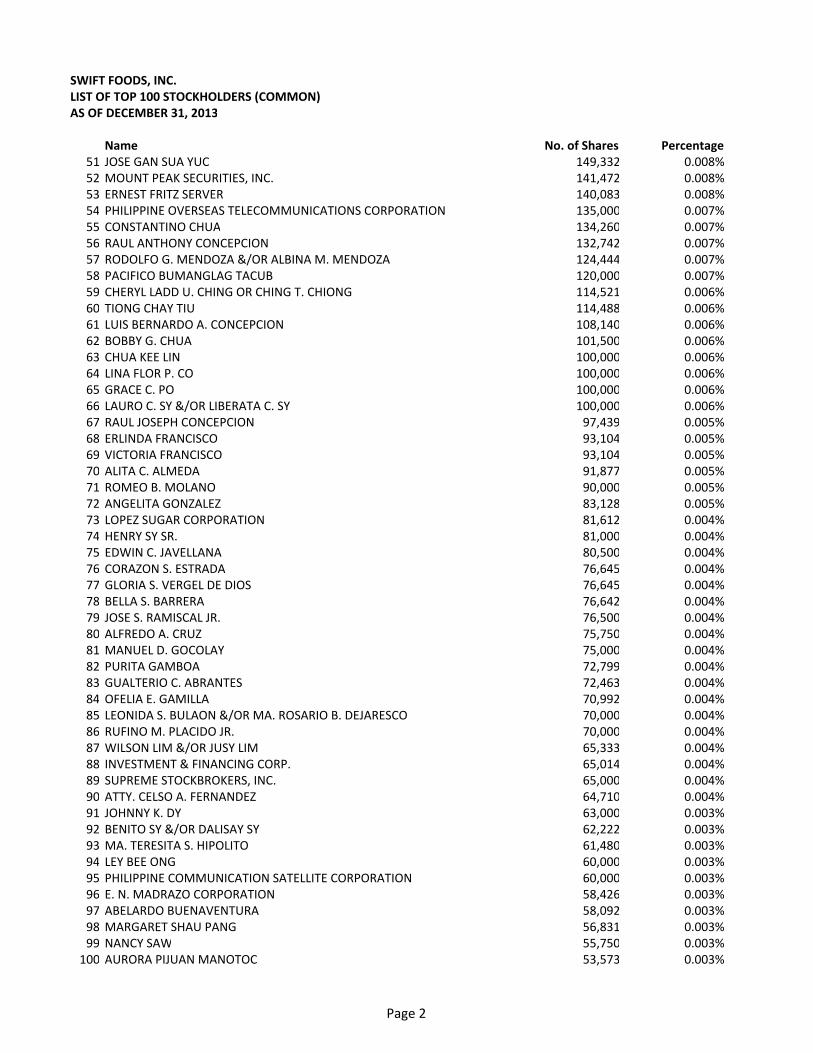
SWIFT FOODS, INC.
LIST OF TOP 100 STOCKHOLDERS (COMMON)
AS OF DECEMBER 31, 2013
Name No. of Shares Percentage
51 JOSE GAN SUA YUC 149,332 0.008%52 MOUNT PEAK SECURITIES, INC. 141,472 0.008%53 ERNEST FRITZ SERVER 140,083 0.008%54 PHILIPPINE OVERSEAS TELECOMMUNICATIONS CORPORATION 135,000 0.007%55 CONSTANTINO CHUA 134,260 0.007%56 RAUL ANTHONY CONCEPCION 132,742 0.007%57 RODOLFO G. MENDOZA &/OR ALBINA M. MENDOZA 124,444 0.007%58 PACIFICO BUMANGLAG TACUB 120,000 0.007%59 CHERYL LADD U. CHING OR CHING T. CHIONG 114,521 0.006%60 TIONG CHAY TIU 114,488 0.006%61 LUIS BERNARDO A. CONCEPCION 108,140 0.006%62 BOBBY G. CHUA 101,500 0.006%63 CHUA KEE LIN 100,000 0.006%64 LINA FLOR P. CO 100,000 0.006%65 GRACE C. PO 100,000 0.006%66 LAURO C. SY &/OR LIBERATA C. SY 100,000 0.006%67 RAUL JOSEPH CONCEPCION 97,439 0.005%68 ERLINDA FRANCISCO 93,104 0.005%69 VICTORIA FRANCISCO 93,104 0.005%70 ALITA C. ALMEDA 91,877 0.005%71 ROMEO B. MOLANO 90,000 0.005%72 ANGELITA GONZALEZ 83,128 0.005%73 LOPEZ SUGAR CORPORATION 81,612 0.004%74 HENRY SY SR. 81,000 0.004%75 EDWIN C. JAVELLANA 80,500 0.004%76 CORAZON S. ESTRADA 76,645 0.004%77 GLORIA S. VERGEL DE DIOS 76,645 0.004%78 BELLA S. BARRERA 76,642 0.004%79 JOSE S. RAMISCAL JR. 76,500 0.004%80 ALFREDO A. CRUZ 75,750 0.004%81 MANUEL D. GOCOLAY 75,000 0.004%82 PURITA GAMBOA 72,799 0.004%83 GUALTERIO C. ABRANTES 72,463 0.004%84 OFELIA E. GAMILLA 70,992 0.004%85 LEONIDA S. BULAON &/OR MA. ROSARIO B. DEJARESCO 70,000 0.004%86 RUFINO M. PLACIDO JR. 70,000 0.004%87 WILSON LIM &/OR JUSY LIM 65,333 0.004%88 INVESTMENT & FINANCING CORP. 65,014 0.004%89 SUPREME STOCKBROKERS, INC. 65,000 0.004%90 ATTY. CELSO A. FERNANDEZ 64,710 0.004%91 JOHNNY K. DY 63,000 0.003%92 BENITO SY &/OR DALISAY SY 62,222 0.003%93 MA. TERESITA S. HIPOLITO 61,480 0.003%94 LEY BEE ONG 60,000 0.003%95 PHILIPPINE COMMUNICATION SATELLITE CORPORATION 60,000 0.003%96 E. N. MADRAZO CORPORATION 58,426 0.003%97 ABELARDO BUENAVENTURA 58,092 0.003%98 MARGARET SHAU PANG 56,831 0.003%99 NANCY SAW 55,750 0.003%
100 AURORA PIJUAN MANOTOC 53,573 0.003%
Page 2

SWIFT FOODS, INC.
LIST OF TOP 100 STOCKHOLDERS (COMMON)
AS OF DECEMBER 31, 2013
Name No. of Shares Percentage
TOTAL OUTSTANDING - TOP 100 STOCKHOLDERS 1,797,496,982 99.067%
OTHER STOCKHOLDERS 16,919,901 0.933%TOTAL OUTSTANDING, ISSUED AND SUBSCRIBED 1,814,416,883 100.000%
Beneficial Owner Report
Swift Foods, Inc. (Common)
as of December 31, 2013 `
Participants Name Unit Percentage
CITISECURITIES, INC. 138,602,779 7.639%ABACUS SECURITIES CORPORATION 108,870,442 6.000%DAVID GO SECURITIES CORP. 103,059,352 5.680%EVERGREEN STOCK BROKERAGE & SEC., INC. 91,999,848 5.070%PAPA SECURITIES CORPORATION 77,827,537 4.289%PCCI SECURITIES BROKERS CORP. 68,496,402 3.775%COL Financial Group, Inc. 44,177,874 2.435%ANSALDO, GODINEZ & CO., INC. 43,795,845 2.414%GUILD SECURITIES, INC. 41,118,868 2.266%YAO & ZIALCITA, INC. 39,862,050 2.197%R. COYIUTO SECURITIES, INC. 39,182,606 2.160%BPI SECURITIES CORPORATION 35,885,505 1.978%FIRST METRO SECURITIES BROKERAGE CORP. 32,387,370 1.785%WESTLINK GLOBAL EQUITIES, INC. 31,605,972 1.742%WEALTH SECURITIES, INC. 31,179,959 1.718%MAYBANK ATR KIM ENG SECURITIES, INC. 23,990,414 1.322%QUALITY INVESTMENTS & SECURITIES CORPORATION 21,635,202 1.192%ACCORD CAPITAL EQUITIES CORPORATION 20,216,774 1.114%E. CHUA CHIACO SECURITIES, INC. 18,272,601 1.007%SB EQUITIES,INC. 18,168,227 1.001%VENTURE SECURITIES, INC. 16,338,247 0.900%BDO SECURITIES CORPORATION 14,224,860 0.784%B. H. CHUA SECURITIES CORPORATION 11,119,791 0.613%MERCANTILE SECURITIES CORP. 10,524,879 0.580%EASTERN SECURITIES DEVELOPMENT CORPORATION 10,498,064 0.579%BELSON SECURITIES, INC. 10,414,613 0.574%PNB SECURITIES, INC. 10,399,082 0.573%REGINA CAPITAL DEVELOPMENT CORPORATION 10,022,072 0.552%IGC SECURITIES INC. 9,759,207 0.538%OPTIMUM SECURITIES CORPORATION 9,205,476 0.507%VICSAL SECURITIES & STOCK BROKERAGE, INC. 9,112,077 0.502%B. H. CHUA SECURITIES CORPORATION 9,036,228 0.498%ANGPING & ASSOCIATES SECURITIES, INC. 8,563,168 0.472%G.D. TAN & COMPANY, INC. 7,993,014 0.441%DIVERSIFIED SECURITIES, INC. 7,108,322 0.392%I. ACKERMAN & CO., INC. 6,691,505 0.369%YU & COMPANY, INC. 6,591,999 0.363%SOLAR SECURITIES, INC. 6,458,918 0.356%EQUITIWORLD SECURITIES, INC. 6,218,326 0.343%UNICAPITAL SECURITIES INC. 5,968,164 0.329%
Page 3

SWIFT FOODS, INC.
LIST OF TOP 100 STOCKHOLDERS (COMMON)
AS OF DECEMBER 31, 2013
Name No. of Shares Percentage
TOWER SECURITIES, INC. 5,820,388 0.321%PAN ASIA SECURITIES CORP. 5,391,111 0.297%ALPHA SECURITIES CORP. 5,347,019 0.295%TANSENGCO & CO., INC. 5,268,611 0.290%A & A SECURITIES, INC. 5,261,850 0.290%IMPERIAL,DE GUZMAN,ABALOS & CO.,INC. 5,122,516 0.282%MERIDIAN SECURITIES, INC. 4,966,979 0.274%CAMPOS, LANUZA & COMPANY, INC. 4,877,430 0.269%SUMMIT SECURITIES, INC. 4,746,607 0.262%S.J. ROXAS & CO., INC. 4,604,658 0.254%JAKA SECURITIES CORP. 4,592,567 0.253%PCIB SECURITIES, INC. 4,568,977 0.252%SINCERE SECURITIES CORPORATION 4,455,306 0.246%AB CAPITAL SECURITIES, INC. 4,303,071 0.237%PREMIUM SECURITIES, INC. 4,143,163 0.228%VALUE QUEST SECURITIES CORPORATION 4,000,000 0.220%BA SECURITIES, INC. 3,647,616 0.201%ASIASEC EQUITIES, INC. 3,529,950 0.195%JSG SECURITIES, INC. 3,297,129 0.182%CUALOPING SECURITIES CORPORATION 3,124,007 0.172%R & L INVESTMENTS, INC. 3,058,491 0.169%MDR SECURITIES, INC. 2,966,073 0.163%GOLDSTAR SECURITIES, INC. 2,915,256 0.161%TRITON SECURITIES CORP. 2,676,724 0.148%GLOBALINKS SECURITIES & STOCKS, INC. 2,196,684 0.121%ASIA PACIFIC CAPITAL EQUITIES & SECURITIES CORP. 2,037,500 0.112%ALAKOR SECURITIES CORPORATION 1,901,495 0.105%NIEVES SECURITIES, INC. 1,668,819 0.092%GOLDEN TOWER SECURITIES & HOLDINGS, INC. 1,659,377 0.091%LUYS SECURITIES COMPANY, INC. 1,558,181 0.086%R. S. LIM & CO., INC. 1,490,960 0.082%UCPB SECURITIES, INC. 1,454,417 0.080%LUCKY SECURITIES, INC. 1,389,912 0.077%STRATEGIC EQUITIES CORP. 1,369,860 0.075%HDI SECURITIES, INC. 1,217,773 0.067%I. B. GIMENEZ SECURITIES, INC. 1,216,473 0.067%LARRGO SECURITIES CO., INC. 1,048,119 0.058%MOUNT PEAK SECURITIES, INC. 890,017 0.049%INVESTORS SECURITIES, INC, 876,882 0.048%FRANCISCO ORTIGAS SECURITIES, INC. 787,464 0.043%F. YAP SECURITIES, INC. 716,637 0.039%RTG & COMPANY, INC. 680,779 0.038%DBP-DAIWA CAPITAL MARKETS PHILPPINES, INC. 660,994 0.036%DW CAPITAL INC. 653,177 0.036%RCBC SECURITIES, INC. 621,012 0.034%AURORA SECURITIES, INC. 568,819 0.031%NEW WORLD SECURITIES CO., INC. 535,240 0.029%MANDARIN SECURITIES CORPORATION 526,978 0.029%KING'S POWER SECURITIES, INC. 462,250 0.025%PLATINUM SECURITIES, INC. 433,952 0.024%
Page 4

SWIFT FOODS, INC.
LIST OF TOP 100 STOCKHOLDERS (COMMON)
AS OF DECEMBER 31, 2013
Name No. of Shares Percentage
BENJAMIN CO CA & CO., INC. 428,626 0.024%STANDARD SECURITIES CORPORATION 378,420 0.021%AAA SOUTHEAST EQUITIES, INCORPORATED 377,195 0.021%THE FIRST RESOURCES MANAGEMENT & SECURITIES CORP. 309,519 0.017%DA MARKET SECURITIES, INC. 289,308 0.016%INTRA-INVEST SECURITIES, INC. 281,364 0.016%ATC SECURITIES, INC. 221,185 0.012%WONG SECURITIES CORPORATION 210,124 0.012%A. T. DE CASTRO SECURITIES CORP. 199,649 0.011%TRI-STATE SECURITIES, INC. 179,330 0.010%R. NUBLA SECURITIES, INC. 177,515 0.010%STANDARD CHARTERED BANK 163,263 0.009%FIRST ORIENT SECURITIES, INC. 159,501 0.009%LOPEZ, LOCSIN, LEDESMA & CO., INC. 156,411 0.009%THE HONGKONG AND SHANGHAI BANKING CORP. LTD. -CLIENTS' ACCT. 155,402 0.009%TRANS-ASIA SECURITIES, INC. 127,750 0.007%J.M. BARCELON & CO., INC. 125,347 0.007%EAGLE EQUITIES, INC. 105,739 0.006%PERLA COMPAÑA DE SEGUROS INC. 95,498 0.005%BERNAD SECURITIES, INC. 61,565 0.003%RCBC TRUST & INVESTMENT DIVISION 61,097 0.003%PCIB SECURITIES, INC. 57,244 0.003%MBTC - TRUST BANKING GROUP 50,026 0.003%H. E. BENNETT SECURITIES, INC. 41,652 0.002%ASTRA SECURITIES CORPORATION 33,981 0.002%FORTUNE LIFE INSURANCE CO., INC. 33,683 0.002%TRENDLINE SECURITIES CORPORATION 33,422 0.002%FORTUNE GENERAL INSURANCE CORPORATION 30,675 0.002%FIDELITY SECURITIES, INC. 28,714 0.002%EAST WEST CAPITAL CORPORATION 26,274 0.001%E.SECURITIES, INC. ITF VARIOUS CLIENTS 24,252 0.001%SUPREME STOCKBROKERS, INC 23,545 0.001%SALISBURY BKT SECURITIES CORPORATION 22,451 0.001%ASIAN CAPITAL EQUITIES, INC. 15,726 0.001%ARMSTRONG SECURITIES, INC. 14,193 0.001%EQUITABLE SECURIITES (PHILS.) INC. 13,746 0.001%CITIBANK N.A. 12,453 0.001%MACQUARIE CAPITAL SECURITIES (PHILIPPINES) INC. 12,444 0.001%CENTURY SECURITIES CORPORATION 9,902 0.001%E.SECURITIES, INC. ITF VARIOUS CLIENTS 9,678 0.001%UPCC SECURITIES CORP. 9,555 0.001%FIRST INTEGRATED CAPITAL SECURITIES, INC. 9,554 0.001%DEUTSCHE REGIS PARTNERS, INC. 8,527 0.000%SECURITIES SPECIALISTS, INC. 7,532 0.000%ALL ASIA SECURITIES MANAGEMENT CORP. 4,985 0.000%HK SECURITIES, INC. 4,364 0.000%MARIAN SECURITIES, INC. 2,488 0.000%PRYCE SECURITIES, INC. 1,985 0.000%S.J. ROXAS & CO.,INC. 1,500 0.000%HIGHLAND SECURITIES PHIL., INC. 1,369 0.000%
Page 5
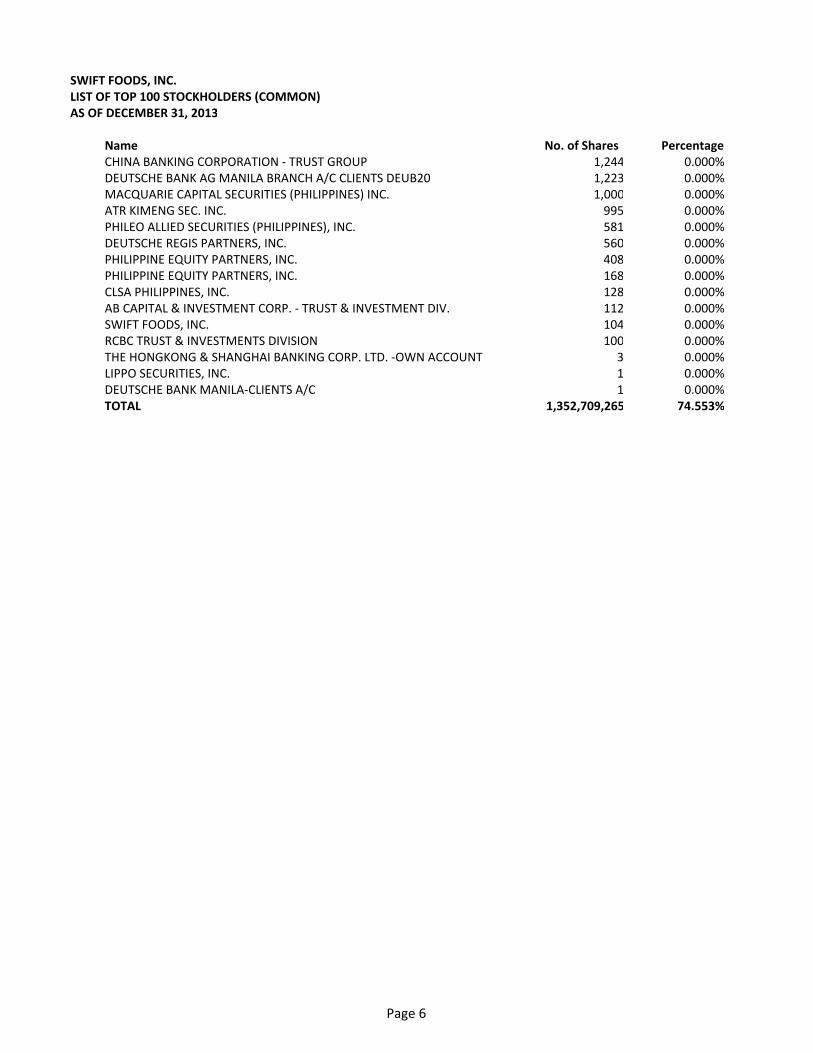
SWIFT FOODS, INC.
LIST OF TOP 100 STOCKHOLDERS (COMMON)
AS OF DECEMBER 31, 2013
Name No. of Shares Percentage
CHINA BANKING CORPORATION - TRUST GROUP 1,244 0.000%DEUTSCHE BANK AG MANILA BRANCH A/C CLIENTS DEUB20 1,223 0.000%MACQUARIE CAPITAL SECURITIES (PHILIPPINES) INC. 1,000 0.000%ATR KIMENG SEC. INC. 995 0.000%PHILEO ALLIED SECURITIES (PHILIPPINES), INC. 581 0.000%DEUTSCHE REGIS PARTNERS, INC. 560 0.000%PHILIPPINE EQUITY PARTNERS, INC. 408 0.000%PHILIPPINE EQUITY PARTNERS, INC. 168 0.000%CLSA PHILIPPINES, INC. 128 0.000%AB CAPITAL & INVESTMENT CORP. - TRUST & INVESTMENT DIV. 112 0.000%SWIFT FOODS, INC. 104 0.000%RCBC TRUST & INVESTMENTS DIVISION 100 0.000%THE HONGKONG & SHANGHAI BANKING CORP. LTD. -OWN ACCOUNT 3 0.000%LIPPO SECURITIES, INC. 1 0.000%DEUTSCHE BANK MANILA-CLIENTS A/C 1 0.000%TOTAL 1,352,709,265 74.553%
Page 6
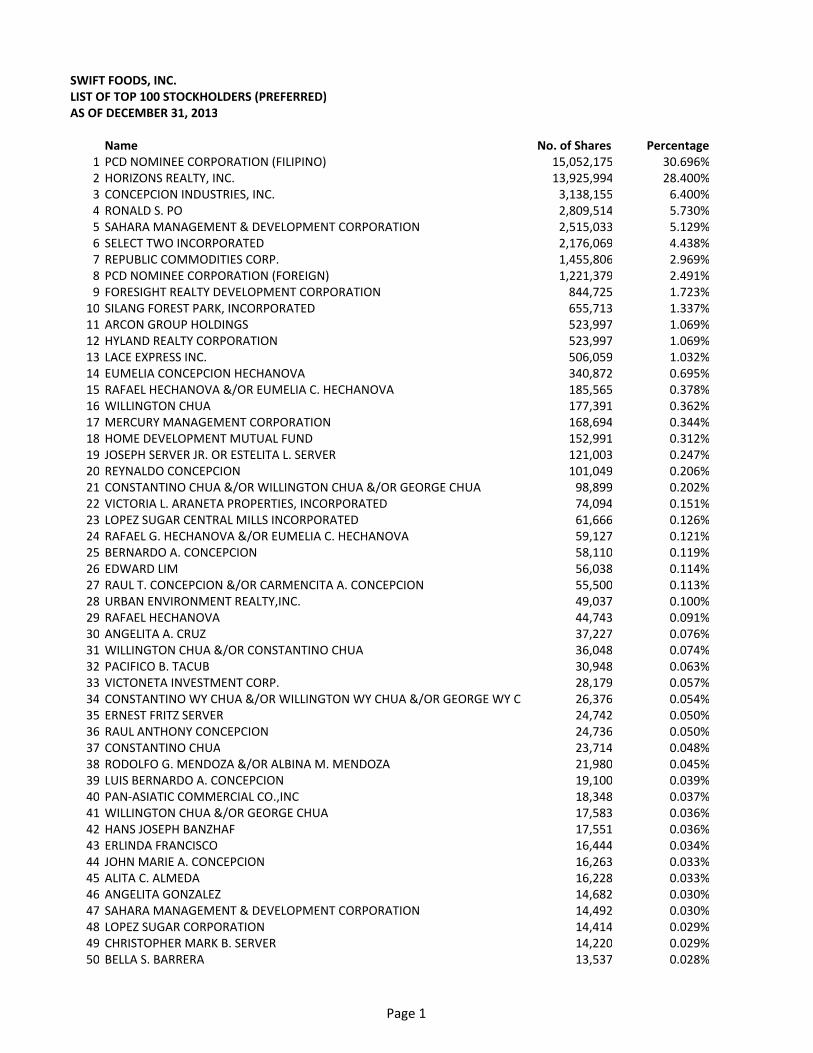
SWIFT FOODS, INC.
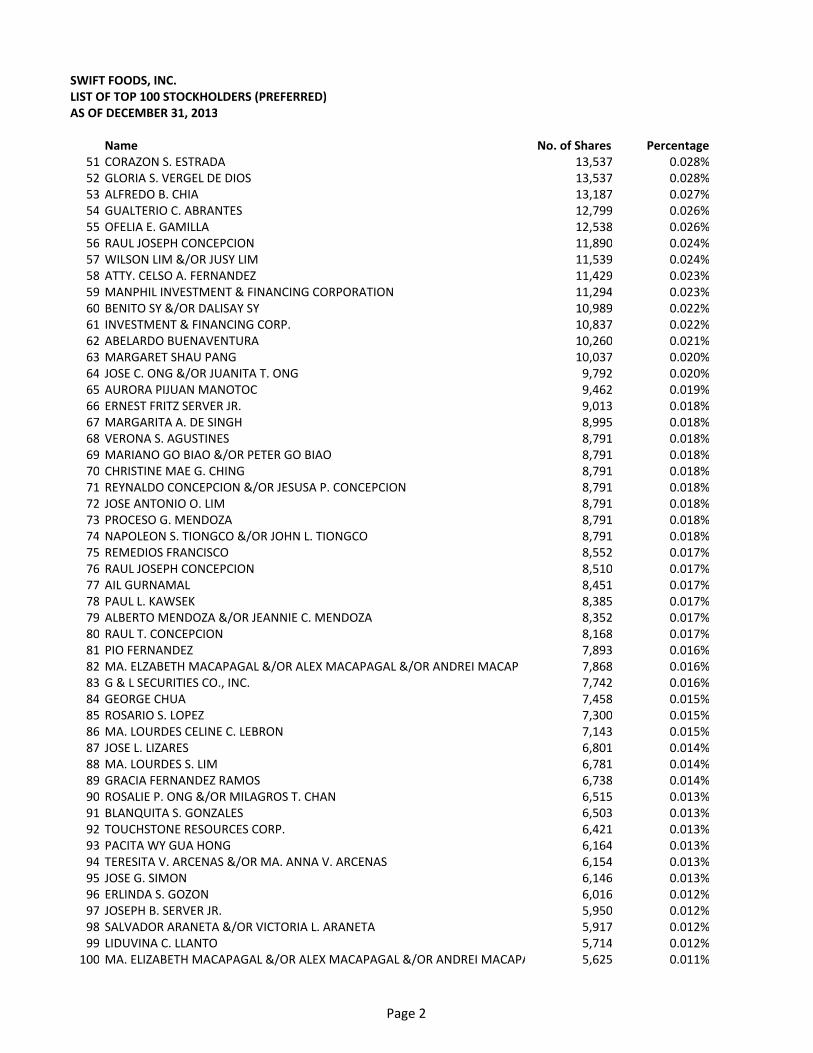
LIST OF TOP 100 STOCKHOLDERS (PREFERRED)
AS OF DECEMBER 31, 2013
Name No. of Shares Percentage
1 PCD NOMINEE CORPORATION (FILIPINO) 15,052,175 30.696%2 HORIZONS REALTY, INC. 13,925,994 28.400%3 CONCEPCION INDUSTRIES, INC. 3,138,155 6.400%4 RONALD S. PO 2,809,514 5.730%5 SAHARA MANAGEMENT & DEVELOPMENT CORPORATION 2,515,033 5.129%6 SELECT TWO INCORPORATED 2,176,069 4.438%7 REPUBLIC COMMODITIES CORP. 1,455,806 2.969%8 PCD NOMINEE CORPORATION (FOREIGN) 1,221,379 2.491%9 FORESIGHT REALTY DEVELOPMENT CORPORATION 844,725 1.723%
10 SILANG FOREST PARK, INCORPORATED 655,713 1.337%11 ARCON GROUP HOLDINGS 523,997 1.069%12 HYLAND REALTY CORPORATION 523,997 1.069%13 LACE EXPRESS INC. 506,059 1.032%14 EUMELIA CONCEPCION HECHANOVA 340,872 0.695%15 RAFAEL HECHANOVA &/OR EUMELIA C. HECHANOVA 185,565 0.378%16 WILLINGTON CHUA 177,391 0.362%17 MERCURY MANAGEMENT CORPORATION 168,694 0.344%18 HOME DEVELOPMENT MUTUAL FUND 152,991 0.312%19 JOSEPH SERVER JR. OR ESTELITA L. SERVER 121,003 0.247%20 REYNALDO CONCEPCION 101,049 0.206%21 CONSTANTINO CHUA &/OR WILLINGTON CHUA &/OR GEORGE CHUA 98,899 0.202%22 VICTORIA L. ARANETA PROPERTIES, INCORPORATED 74,094 0.151%23 LOPEZ SUGAR CENTRAL MILLS INCORPORATED 61,666 0.126%24 RAFAEL G. HECHANOVA &/OR EUMELIA C. HECHANOVA 59,127 0.121%25 BERNARDO A. CONCEPCION 58,110 0.119%26 EDWARD LIM 56,038 0.114%27 RAUL T. CONCEPCION &/OR CARMENCITA A. CONCEPCION 55,500 0.113%28 URBAN ENVIRONMENT REALTY,INC. 49,037 0.100%29 RAFAEL HECHANOVA 44,743 0.091%30 ANGELITA A. CRUZ 37,227 0.076%31 WILLINGTON CHUA &/OR CONSTANTINO CHUA 36,048 0.074%32 PACIFICO B. TACUB 30,948 0.063%33 VICTONETA INVESTMENT CORP. 28,179 0.057%34 CONSTANTINO WY CHUA &/OR WILLINGTON WY CHUA &/OR GEORGE WY C 26,376 0.054%35 ERNEST FRITZ SERVER 24,742 0.050%36 RAUL ANTHONY CONCEPCION 24,736 0.050%37 CONSTANTINO CHUA 23,714 0.048%38 RODOLFO G. MENDOZA &/OR ALBINA M. MENDOZA 21,980 0.045%39 LUIS BERNARDO A. CONCEPCION 19,100 0.039%40 PAN-ASIATIC COMMERCIAL CO.,INC 18,348 0.037%41 WILLINGTON CHUA &/OR GEORGE CHUA 17,583 0.036%42 HANS JOSEPH BANZHAF 17,551 0.036%43 ERLINDA FRANCISCO 16,444 0.034%44 JOHN MARIE A. CONCEPCION 16,263 0.033%45 ALITA C. ALMEDA 16,228 0.033%46 ANGELITA GONZALEZ 14,682 0.030%47 SAHARA MANAGEMENT & DEVELOPMENT CORPORATION 14,492 0.030%48 LOPEZ SUGAR CORPORATION 14,414 0.029%49 CHRISTOPHER MARK B. SERVER 14,220 0.029%50 BELLA S. BARRERA 13,537 0.028%
Page 1
SWIFT FOODS, INC.
LIST OF TOP 100 STOCKHOLDERS (PREFERRED)
AS OF DECEMBER 31, 2013
Name No. of Shares Percentage
51 CORAZON S. ESTRADA 13,537 0.028%52 GLORIA S. VERGEL DE DIOS 13,537 0.028%53 ALFREDO B. CHIA 13,187 0.027%54 GUALTERIO C. ABRANTES 12,799 0.026%55 OFELIA E. GAMILLA 12,538 0.026%56 RAUL JOSEPH CONCEPCION 11,890 0.024%57 WILSON LIM &/OR JUSY LIM 11,539 0.024%58 ATTY. CELSO A. FERNANDEZ 11,429 0.023%59 MANPHIL INVESTMENT & FINANCING CORPORATION 11,294 0.023%60 BENITO SY &/OR DALISAY SY 10,989 0.022%61 INVESTMENT & FINANCING CORP. 10,837 0.022%62 ABELARDO BUENAVENTURA 10,260 0.021%63 MARGARET SHAU PANG 10,037 0.020%64 JOSE C. ONG &/OR JUANITA T. ONG 9,792 0.020%65 AURORA PIJUAN MANOTOC 9,462 0.019%66 ERNEST FRITZ SERVER JR. 9,013 0.018%67 MARGARITA A. DE SINGH 8,995 0.018%68 VERONA S. AGUSTINES 8,791 0.018%69 MARIANO GO BIAO &/OR PETER GO BIAO 8,791 0.018%70 CHRISTINE MAE G. CHING 8,791 0.018%71 REYNALDO CONCEPCION &/OR JESUSA P. CONCEPCION 8,791 0.018%72 JOSE ANTONIO O. LIM 8,791 0.018%73 PROCESO G. MENDOZA 8,791 0.018%74 NAPOLEON S. TIONGCO &/OR JOHN L. TIONGCO 8,791 0.018%75 REMEDIOS FRANCISCO 8,552 0.017%76 RAUL JOSEPH CONCEPCION 8,510 0.017%77 AIL GURNAMAL 8,451 0.017%78 PAUL L. KAWSEK 8,385 0.017%79 ALBERTO MENDOZA &/OR JEANNIE C. MENDOZA 8,352 0.017%80 RAUL T. CONCEPCION 8,168 0.017%81 PIO FERNANDEZ 7,893 0.016%82 MA. ELZABETH MACAPAGAL &/OR ALEX MACAPAGAL &/OR ANDREI MACAP 7,868 0.016%83 G & L SECURITIES CO., INC. 7,742 0.016%84 GEORGE CHUA 7,458 0.015%85 ROSARIO S. LOPEZ 7,300 0.015%86 MA. LOURDES CELINE C. LEBRON 7,143 0.015%87 JOSE L. LIZARES 6,801 0.014%88 MA. LOURDES S. LIM 6,781 0.014%89 GRACIA FERNANDEZ RAMOS 6,738 0.014%90 ROSALIE P. ONG &/OR MILAGROS T. CHAN 6,515 0.013%91 BLANQUITA S. GONZALES 6,503 0.013%92 TOUCHSTONE RESOURCES CORP. 6,421 0.013%93 PACITA WY GUA HONG 6,164 0.013%94 TERESITA V. ARCENAS &/OR MA. ANNA V. ARCENAS 6,154 0.013%95 JOSE G. SIMON 6,146 0.013%96 ERLINDA S. GOZON 6,016 0.012%97 JOSEPH B. SERVER JR. 5,950 0.012%98 SALVADOR ARANETA &/OR VICTORIA L. ARANETA 5,917 0.012%99 LIDUVINA C. LLANTO 5,714 0.012%
100 MA. ELIZABETH MACAPAGAL &/OR ALEX MACAPAGAL &/OR ANDREI MACAPAGAL 5,625 0.011%
Page 2
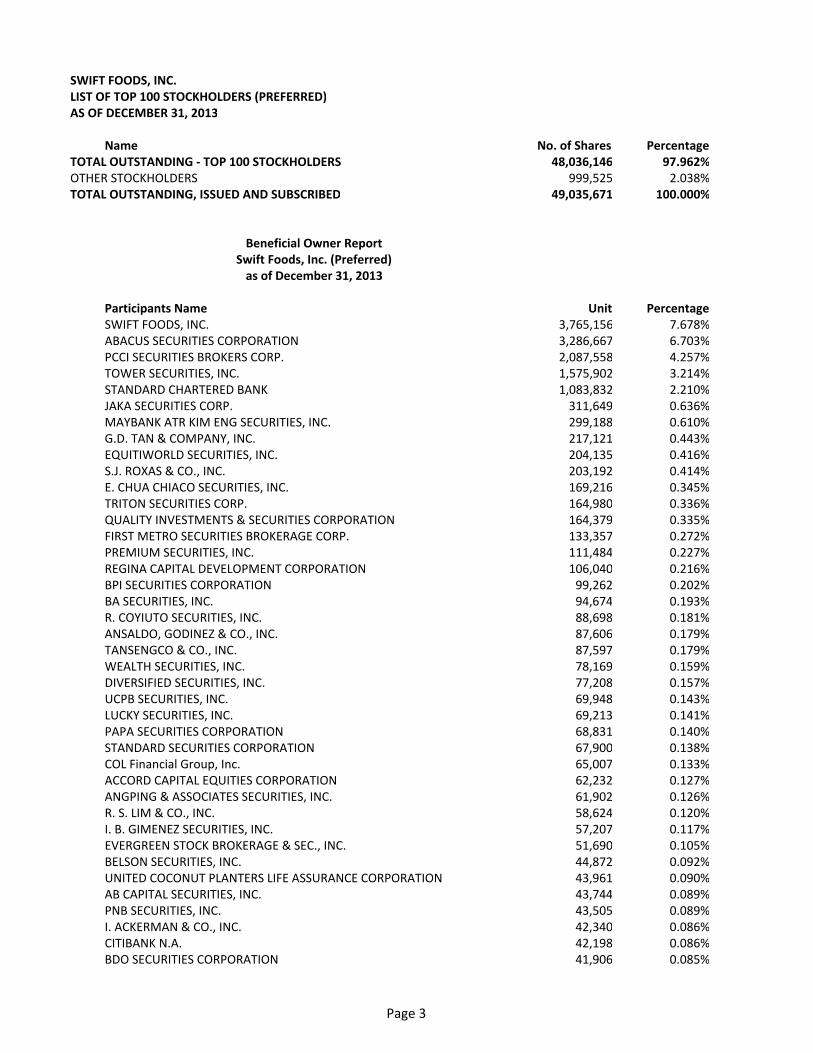
SWIFT FOODS, INC.
LIST OF TOP 100 STOCKHOLDERS (PREFERRED)
AS OF DECEMBER 31, 2013
Name No. of Shares Percentage
TOTAL OUTSTANDING - TOP 100 STOCKHOLDERS 48,036,146 97.962%
OTHER STOCKHOLDERS 999,525 2.038%TOTAL OUTSTANDING, ISSUED AND SUBSCRIBED 49,035,671 100.000%
Beneficial Owner Report
Swift Foods, Inc. (Preferred)
as of December 31, 2013
Participants Name Unit Percentage
SWIFT FOODS, INC. 3,765,156 7.678%ABACUS SECURITIES CORPORATION 3,286,667 6.703%PCCI SECURITIES BROKERS CORP. 2,087,558 4.257%TOWER SECURITIES, INC. 1,575,902 3.214%STANDARD CHARTERED BANK 1,083,832 2.210%JAKA SECURITIES CORP. 311,649 0.636%MAYBANK ATR KIM ENG SECURITIES, INC. 299,188 0.610%G.D. TAN & COMPANY, INC. 217,121 0.443%EQUITIWORLD SECURITIES, INC. 204,135 0.416%S.J. ROXAS & CO., INC. 203,192 0.414%E. CHUA CHIACO SECURITIES, INC. 169,216 0.345%TRITON SECURITIES CORP. 164,980 0.336%QUALITY INVESTMENTS & SECURITIES CORPORATION 164,379 0.335%FIRST METRO SECURITIES BROKERAGE CORP. 133,357 0.272%PREMIUM SECURITIES, INC. 111,484 0.227%REGINA CAPITAL DEVELOPMENT CORPORATION 106,040 0.216%BPI SECURITIES CORPORATION 99,262 0.202%BA SECURITIES, INC. 94,674 0.193%R. COYIUTO SECURITIES, INC. 88,698 0.181%ANSALDO, GODINEZ & CO., INC. 87,606 0.179%TANSENGCO & CO., INC. 87,597 0.179%WEALTH SECURITIES, INC. 78,169 0.159%DIVERSIFIED SECURITIES, INC. 77,208 0.157%UCPB SECURITIES, INC. 69,948 0.143%LUCKY SECURITIES, INC. 69,213 0.141%PAPA SECURITIES CORPORATION 68,831 0.140%STANDARD SECURITIES CORPORATION 67,900 0.138%COL Financial Group, Inc. 65,007 0.133%ACCORD CAPITAL EQUITIES CORPORATION 62,232 0.127%ANGPING & ASSOCIATES SECURITIES, INC. 61,902 0.126%R. S. LIM & CO., INC. 58,624 0.120%I. B. GIMENEZ SECURITIES, INC. 57,207 0.117%EVERGREEN STOCK BROKERAGE & SEC., INC. 51,690 0.105%BELSON SECURITIES, INC. 44,872 0.092%UNITED COCONUT PLANTERS LIFE ASSURANCE CORPORATION 43,961 0.090%AB CAPITAL SECURITIES, INC. 43,744 0.089%PNB SECURITIES, INC. 43,505 0.089%I. ACKERMAN & CO., INC. 42,340 0.086%CITIBANK N.A. 42,198 0.086%BDO SECURITIES CORPORATION 41,906 0.085%
Page 3

SWIFT FOODS, INC.
LIST OF TOP 100 STOCKHOLDERS (PREFERRED)
AS OF DECEMBER 31, 2013
Name No. of Shares Percentage
YAO & ZIALCITA, INC. 41,000 0.084%UNICAPITAL SECURITIES INC. 40,974 0.084%IGC SECURITIES INC. 38,372 0.078%CAMPOS, LANUZA & COMPANY, INC. 37,350 0.076%SB EQUITIES,INC. 36,982 0.075%THE FIRST RESOURCES MANAGEMENT & SECURITIES CORP. 31,876 0.065%GOLDSTAR SECURITIES, INC. 31,204 0.064%KING'S POWER SECURITIES, INC. 30,405 0.062%NIEVES SECURITIES, INC. 30,268 0.062%SOLAR SECURITIES, INC. 29,931 0.061%OPTIMUM SECURITIES CORPORATION 27,340 0.056%PCIB SECURITIES, INC. 26,714 0.054%TRI-STATE SECURITIES, INC. 25,526 0.052%F. YAP SECURITIES, INC. 22,175 0.045%VALUE QUEST SECURITIES CORPORATION 21,980 0.045%HDI SECURITIES, INC. 20,813 0.042%SUMMIT SECURITIES, INC. 18,399 0.038%EASTERN SECURITIES DEVELOPMENT CORPORATION 17,493 0.036%PERLA COMPAÑA DE SEGUROS INC. 16,851 0.034%R. NUBLA SECURITIES, INC. 16,246 0.033%CITISECURITIES, INC. 16,100 0.033%STRATEGIC EQUITIES CORP. 15,790 0.032%VENTURE SECURITIES, INC. 15,769 0.032%YU & COMPANY, INC. 15,508 0.032%FRANCISCO ORTIGAS SECURITIES, INC. 14,875 0.030%MANDARIN SECURITIES CORPORATION 14,069 0.029%PAN ASIA SECURITIES CORP. 13,615 0.028%RCBC SECURITIES, INC. 12,575 0.026%CUALOPING SECURITIES CORPORATION 11,874 0.024%ALPHA SECURITIES CORP. 11,437 0.023%LUYS SECURITIES COMPANY, INC. 10,297 0.021%ASIASEC EQUITIES, INC. 9,862 0.020%AAA SOUTHEAST EQUITIES, INCORPORATED 9,007 0.018%MBTC - TRUST BANKING GROUP 8,924 0.018%IMPERIAL,DE GUZMAN,ABALOS & CO.,INC. 8,139 0.017%INVESTORS SECURITIES, INC, 7,281 0.015%RTG & COMPANY, INC. 6,891 0.014%GOLDEN TOWER SECURITIES & HOLDINGS, INC. 6,869 0.014%FORTUNE LIFE INSURANCE CO., INC. 5,949 0.012%MERIDIAN SECURITIES, INC. 5,478 0.011%FORTUNE GENERAL INSURANCE CORPORATION 5,417 0.011%BENJAMIN CO CA & CO., INC. 4,587 0.009%VICSAL SECURITIES & STOCK BROKERAGE, INC. 4,393 0.009%LOPEZ, LOCSIN, LEDESMA & CO., INC. 4,177 0.009%MERCANTILE SECURITIES CORP. 3,602 0.007%A & A SECURITIES, INC. 3,514 0.007%JSG SECURITIES, INC. 3,435 0.007%THE HONGKONG AND SHANGHAI BANKING CORP. LTD. -CLIENTS' ACCT. 2,950 0.006%ATR KIMENG SEC. INC. 2,920 0.006%A. T. DE CASTRO SECURITIES CORP. 2,818 0.006%
Page 4

SWIFT FOODS, INC.
LIST OF TOP 100 STOCKHOLDERS (PREFERRED)
AS OF DECEMBER 31, 2013
Name No. of Shares Percentage
AURORA SECURITIES, INC. 2,456 0.005%MACQUARIE CAPITAL SECURITIES (PHILIPPINES) INC. 2,197 0.004%MDR SECURITIES, INC. 2,166 0.004%DA MARKET SECURITIES, INC. 1,785 0.004%SALISBURY BKT SECURITIES CORPORATION 1,733 0.004%PLATINUM SECURITIES, INC. 1,600 0.003%SunSecurities, Inc. 1,556 0.003%SINCERE SECURITIES CORPORATION 1,446 0.003%FIRST INTEGRATED CAPITAL SECURITIES, INC. 989 0.002%J.M. BARCELON & CO., INC. 985 0.002%ASTRA SECURITIES CORPORATION 702 0.001%SECURITIES SPECIALISTS, INC. 528 0.001%DAVID GO SECURITIES CORP. 459 0.001%GLOBALINKS SECURITIES & STOCKS, INC. 395 0.001%UPCC SECURITIES CORP. 341 0.001%PHILIPPINE EQUITY PARTNERS, INC. 335 0.001%DEUTSCHE BANK AG MANILA BRANCH A/C CLIENTS DEUB20 262 0.001%MARIAN SECURITIES, INC. 222 0.000%CHINA BANKING CORPORATION - TRUST GROUP 219 0.000%DBP-DAIWA CAPITAL MARKETS PHILPPINES, INC. 205 0.000%DEUTSCHE REGIS PARTNERS, INC. 172 0.000%B. H. CHUA SECURITIES CORPORATION 131 0.000%B. H. CHUA SECURITIES CORPORATION 108 0.000%FIDELITY SECURITIES, INC. 107 0.000%UNITED COCONUT PLANTERS BANK-TRUST BANKING 98 0.000%WONG SECURITIES CORPORATION 70 0.000%DEUTSCHE REGIS PARTNERS, INC. 65 0.000%GUILD SECURITIES, INC. 26 0.000%AB CAPITAL & INVESTMENT CORP. - TRUST & INVESTMENT DIV. 20 0.000%DEUTSCHE BANK MANILA-CLIENTS A/C 2 0.000%THE HONGKONG & SHANGHAI BANKING CORP. LTD. -OWN ACCOUNT 2 0.000%STANDARD CHARTERED BANK 1 0.000%TOTAL 16,273,554 33.187%
Page 5

*SGVFS004567*
A S 0 9 4 0 5 0 6 6SEC Registration Number
S W I F T F O O D S , I N C .
(Company’s Full Name)
S w i f t F o o d s , I n c . C o m p o u n d
S h e r i d a n S t . , H i g h w a y H i l l s ,
M a n d a l u y o n g C i t y
(Business Address: No. Street City/Town/Province)
Alex B. Lopez 631-8101(Contact Person) (Company Telephone Number)
1 2 3 1 A A F SMonth Day (Form Type) Month Day
(Calendar Year) (Annual Meeting)
Not Applicable(Secondary License Type, If Applicable)
Not ApplicableDept. Requiring this Doc. Amended Articles Number/Section
Total Amount of Borrowings
8,035 Not applicable Not ApplicableTotal No. of Stockholders Domestic Foreign
To be accomplished by SEC Personnel concerned
File Number LCU
Document ID Cashier
S T A M P S
Remarks: Please use BLACK ink for scanning purposes.
COVER SHEET

*SGVFS004567*
INDEPENDENT AUDITORS’ REPORT
The Stockholders and the Board of DirectorsSwift Foods, Inc.RFM Corporate CenterPioneer corner Sheridan StreetsMandaluyong City
Report on the Financial Statements
We have audited the accompanying financial statements of Swift Foods, Inc., which comprise thebalance sheets as at December 31, 2013 and 2012, and the statements of income, statements ofcomprehensive income, statements of changes in equity and statements of cash flows for each of thethree years in the period ended December 31, 2013, and a summary of significant accounting policiesand other explanatory information.
Management’s Responsibility for the Financial Statements
Management is responsible for the preparation and fair presentation of these financial statements inaccordance with Philippine Financial Reporting Standards, and for such internal control asmanagement determines is necessary to enable the preparation of financial statements that are freefrom material misstatement, whether due to fraud or error.
Auditors’ Responsibility
Our responsibility is to express an opinion on these financial statements based on our audits. Weconducted our audits in accordance with Philippine Standards on Auditing. Those standards requirethat we comply with ethical requirements and plan and perform the audit to obtain reasonableassurance about whether the financial statements are free from material misstatement.
An audit involves performing procedures to obtain audit evidence about the amounts and disclosuresin the financial statements. The procedures selected depend on the auditor’s judgment, including theassessment of the risks of material misstatement of the financial statements, whether due to fraud orerror. In making those risk assessments, the auditor considers internal control relevant to the entity’spreparation and fair presentation of the financial statements in order to design audit procedures that areappropriate in the circumstances, but not for the purpose of expressing an opinion on the effectivenessof the entity’s internal control. An audit also includes evaluating the appropriateness of accountingpolicies used and the reasonableness of accounting estimates made by management, as well asevaluating the overall presentation of the financial statements.
We believe that the audit evidence we have obtained is sufficient and appropriate to provide a basis forour audit opinion.
SyCip Gorres Velayo & Co.6760 Ayala Avenue1226 Makati CityPhilippines
Tel: (632) 891 0307Fax: (632) 819 0872ey.com/ph
BOA/PRC Reg. No. 0001, December 28, 2012, valid until December 31, 2015SEC Accreditation No. 0012-FR-3 (Group A), November 15, 2012, valid until November 16, 2015
A member firm of Ernst & Young Global Limited

*SGVFS004567*
- 2 -
Opinion
In our opinion, the financial statements present fairly, in all material respects, the financial position ofSwift Foods, Inc. as at December 31, 2013 and 2012, and its financial performance and its cash flowsfor each of the three years in the period ended December 31, 2013, in accordance with PhilippineFinancial Reporting Standards.
Emphasis of Matter
Without qualifying our opinion, we draw attention to Note 1 to the financial statements whichindicates that the Company has reported significant deficit which amounted to P=2.99 billion andP=2.94 billion as of December 31, 2013 and 2012, respectively, resulting from accumulated losses inprior years. These conditions, along with other matters as set forth in Note 1, indicate the existence ofa material uncertainty which may cast significant doubt about the Company’s ability to continue as agoing concern. To address this, the Company will continue operating its Palawan branch. We haveperformed audit procedures to evaluate management’s plans for future actions as to likelihood toimprove the situation and as to feasibility under the circumstances.
Report on the Supplementary Information Required Under Revenue Regulations 15-2010
Our audits were conducted for the purpose of forming an opinion on the basic financial statementstaken as a whole. The supplementary information required under Revenue Regulations 15-2010 inNote 29 to the financial statements is presented for purposes of filing with the Bureau of InternalRevenue and is not a required part of the basic financial statements. Such information is theresponsibility of the management of Swift Foods, Inc. The information has been subjected to theauditing procedures applied in our audit of the basic financial statements. In our opinion, theinformation is fairly stated, in all material respects, in relation to the basic financial statements takenas a whole.
SYCIP GORRES VELAYO & CO.
Djole S. GarciaPartnerCPA Certificate No. 0097907SEC Accreditation No. 1285-A (Group A), February 25, 2013, valid until February 24, 2016Tax Identification No. 201-960-347BIR Accreditation No. 08-001998-102-2013, January 28, 2013, valid until January 27, 2016PTR No. 4225176, January 2, 2014, Makati City
April 28, 2014
A member firm of Ernst & Young Global Limited
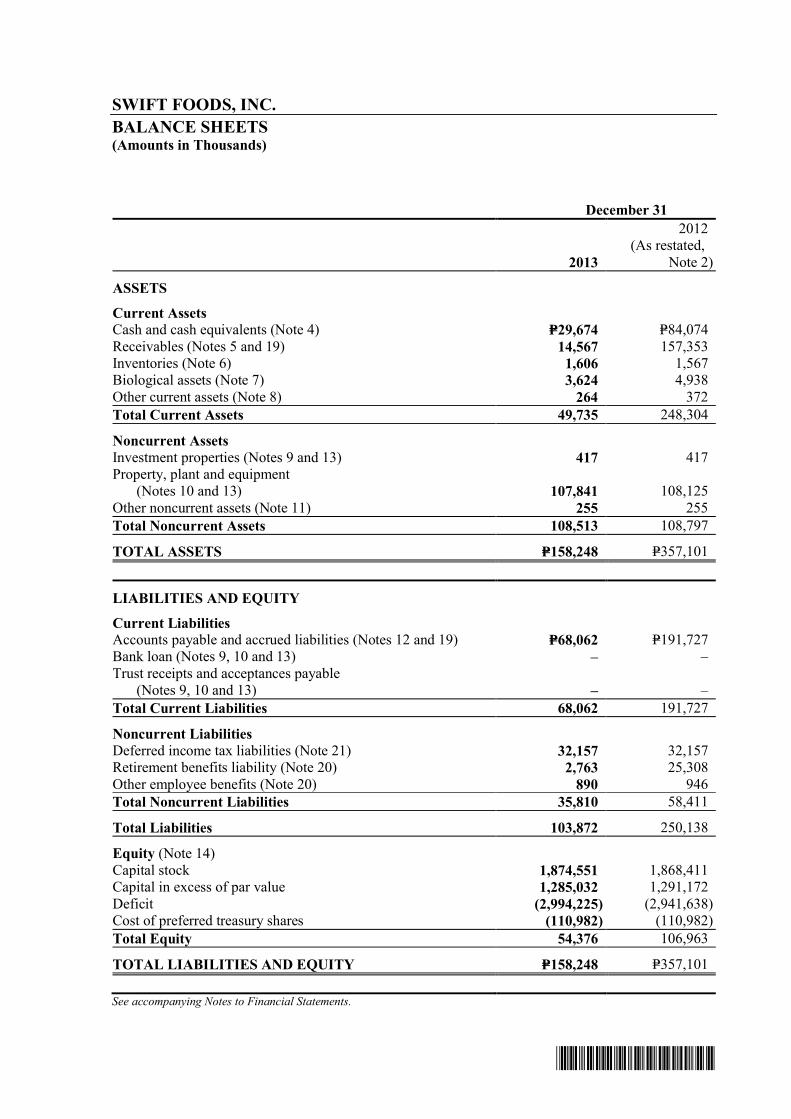
*SGVFS004567*
SWIFT FOODS, INC.BALANCE SHEETS(Amounts in Thousands)
December 31
2013
2012(As restated,
Note 2)
ASSETS
Current AssetsCash and cash equivalents (Note 4) P=29,674 P=84,074Receivables (Notes 5 and 19) 14,567 157,353Inventories (Note 6) 1,606 1,567Biological assets (Note 7) 3,624 4,938Other current assets (Note 8) 264 372Total Current Assets 49,735 248,304
Noncurrent AssetsInvestment properties (Notes 9 and 13) 417 417Property, plant and equipment
(Notes 10 and 13) 107,841 108,125Other noncurrent assets (Note 11) 255 255Total Noncurrent Assets 108,513 108,797
TOTAL ASSETS P=158,248 P=357,101
LIABILITIES AND EQUITY
Current LiabilitiesAccounts payable and accrued liabilities (Notes 12 and 19) P=68,062 P=191,727Bank loan (Notes 9, 10 and 13) – –Trust receipts and acceptances payable
(Notes 9, 10 and 13) – –Total Current Liabilities 68,062 191,727
Noncurrent LiabilitiesDeferred income tax liabilities (Note 21) 32,157 32,157Retirement benefits liability (Note 20) 2,763 25,308Other employee benefits (Note 20) 890 946Total Noncurrent Liabilities 35,810 58,411
Total Liabilities 103,872 250,138
Equity (Note 14)Capital stock 1,874,551 1,868,411Capital in excess of par value 1,285,032 1,291,172Deficit (2,994,225) (2,941,638)Cost of preferred treasury shares (110,982) (110,982)Total Equity 54,376 106,963
TOTAL LIABILITIES AND EQUITY P=158,248 P=357,101
See accompanying Notes to Financial Statements.
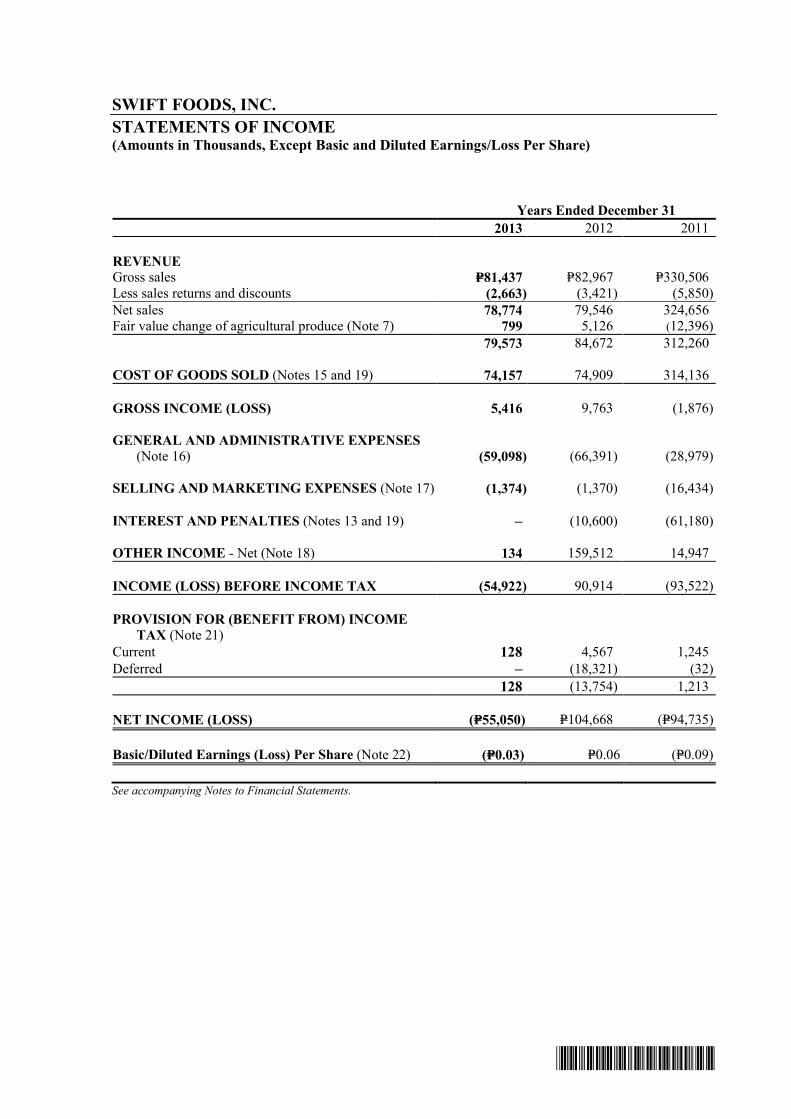
*SGVFS004567*
SWIFT FOODS, INC.STATEMENTS OF INCOME(Amounts in Thousands, Except Basic and Diluted Earnings/Loss Per Share)
Years Ended December 312013 2012 2011
REVENUEGross sales P=81,437 P=82,967 P=330,506Less sales returns and discounts (2,663) (3,421) (5,850)Net sales 78,774 79,546 324,656Fair value change of agricultural produce (Note 7) 799 5,126 (12,396)
79,573 84,672 312,260
COST OF GOODS SOLD (Notes 15 and 19) 74,157 74,909 314,136
GROSS INCOME (LOSS) 5,416 9,763 (1,876)
GENERAL AND ADMINISTRATIVE EXPENSES(Note 16) (59,098) (66,391) (28,979)
SELLING AND MARKETING EXPENSES (Note 17) (1,374) (1,370) (16,434)
INTEREST AND PENALTIES (Notes 13 and 19) – (10,600) (61,180)
OTHER INCOME - Net (Note 18) 134 159,512 14,947
INCOME (LOSS) BEFORE INCOME TAX (54,922) 90,914 (93,522)
PROVISION FOR (BENEFIT FROM) INCOMETAX (Note 21)
Current 128 4,567 1,245Deferred – (18,321) (32)
128 (13,754) 1,213
NET INCOME (LOSS) (P=55,050) P=104,668 (P=94,735)
Basic/Diluted Earnings (Loss) Per Share (Note 22) (P=0.03) P=0.06 (P=0.09)
See accompanying Notes to Financial Statements.
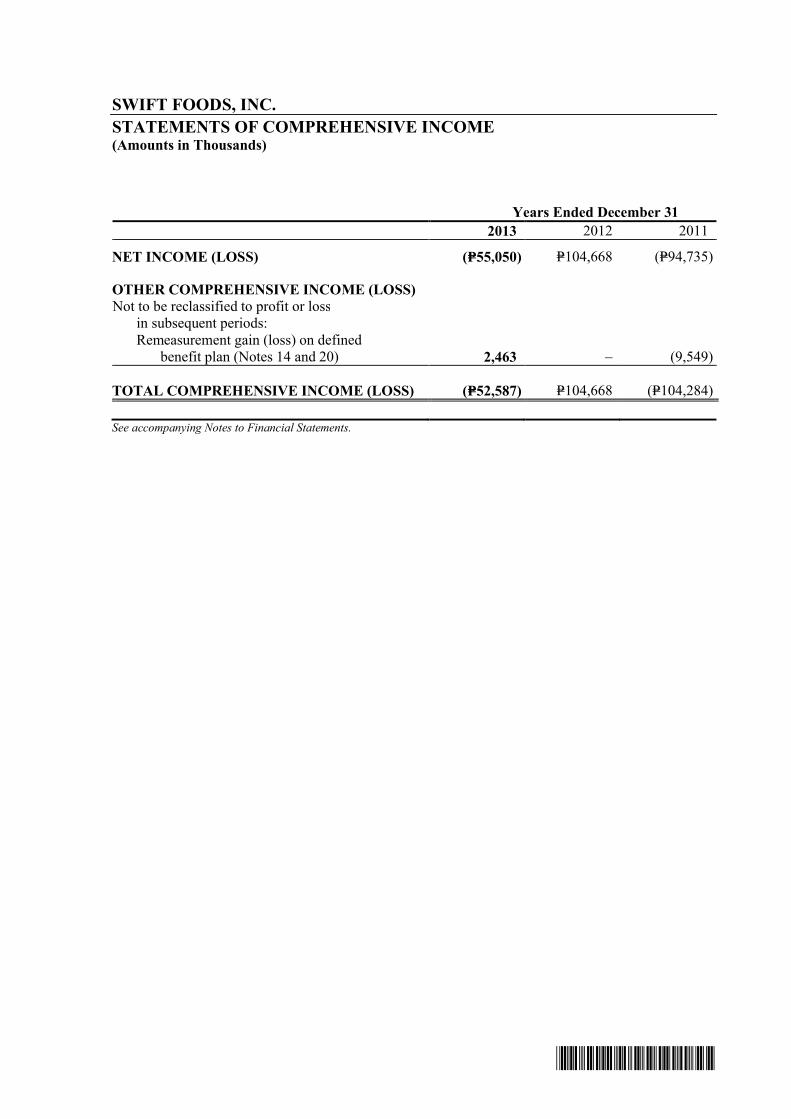
*SGVFS004567*
SWIFT FOODS, INC.STATEMENTS OF COMPREHENSIVE INCOME(Amounts in Thousands)
Years Ended December 312013 2012 2011
NET INCOME (LOSS) (P=55,050) P=104,668 (P=94,735)
OTHER COMPREHENSIVE INCOME (LOSS)Not to be reclassified to profit or loss in subsequent periods: Remeasurement gain (loss) on defined benefit plan (Notes 14 and 20) 2,463 – (9,549)
TOTAL COMPREHENSIVE INCOME (LOSS) (P=52,587) P=104,668 (P=104,284)
See accompanying Notes to Financial Statements.

*SGVFS004567*
SWIFT FOODS, INC.STATEMENTS OF CHANGES IN EQUITYFOR THE YEARS ENDED DECEMBER 31, 2013, 2012 AND 2011(Amounts in Thousands)
Capital Stock (Note 14)Capital in Excess ofPar Value (Note 14) Deficit
TreasuryShares -
PreferredPreferred Common Preferred Common (Note 14) (Note 14) Total
BALANCES AT DECEMBER 31, 2010 P=150,365 P=912,099 P=1,230,224 P=866,895 (P=2,942,022) (P=110,982) P=106,579Conversion of preferred shares to common shares (Note 14) (53,835) 538,353 (484,518) – – – –Net loss for the year – – – – (94,735) – (94,735)Other comprehensive loss for the year – – – – (9,549) – (9,549)
BALANCES AT DECEMBER 31, 2011 96,530 1,450,452 745,706 866,895 (3,046,306) (110,982) 2,295Conversion of preferred shares to common shares (Note 14) (35,714) 357,143 (321,429) – – – –Net income for the year 104,668 104,668Other comprehensive income for the year – – – – – – –
BALANCES AT DECEMBER 31, 2012 60,816 1,807,595 424,277 866,895 (2,941,638) (110,982) 106,963Conversion of preferred shares to common shares (Note 14) (682) 6,822 (6,140) – – – –Net income for the year – – – – (55,050) – (55,050)Other comprehensive income for the year – – – – 2,463 – 2,463
BALANCES AT DECEMBER 31, 2013 P=60,134 P=1,814,417 P=418,137 P=866,895 (P=2,994,225) (P=110,982) P=54,376
See accompanying Notes to Financial Statements.

*SGVFS004567*
SWIFT FOODS, INC.STATEMENTS OF CASH FLOWS(Amounts in Thousands)
Years Ended December 312013 2012 2011
CASH FLOWS FROM OPERATING ACTIVITIESIncome (loss) before income tax (P=54,922) P=90,914 (P=93,522)Adjustments for: Retirement benefits expense (Note 20) 312 805 2,915 Interest income (Notes 4 and 18) (304) (636) (8) Depreciation and amortization
(Notes 10, 11, 15, 16 and 17) 284 682 2,792 Gain on disposal of property and equipment
(Notes 10 and 18) – (129,223) – Loss on disposal of investment properties
(Notes 9 and 18) – 38,563 – Interest and penalties – 10,600 61,180 Fair value loss (gain) on investment properties
(Note 9) – – 35,511 Impairment loss on property, plant and equipment
(Note 10) – – 13,132 Unrealized foreign exchange gain – net – – (43)Operating income (loss) before working capital changes (54,630) 11,705 21,957Decrease (increase) in: Receivables 142,786 (25,460) 60,522 Inventories (39) 1,315 22,471 Biological assets 1,312 (1,171) 36,790 Other current assets 108 1,452 2,771Increase (decrease) in accounts payable and accrued liabilities (123,719) (227,054) (117,071)Fair value adjustment to: Beginning balance of agricultural produce (Note 6) – – (224) Ending balance of agricultural produce (Note 6) – – –Cash generated from (used in) operations (34,182) (239,213) 27,216Income taxes paid, including creditable
withholding taxes (128) (4,567) (1,245)Interest received 304 636 8Retirement benefits payment (Note 20) (20,394) (162) (8,704)Net cash from (used in) operating activities (54,400) (243,306) 17,275
CASH FLOWS FROM INVESTING ACTIVITIESProceeds from sale of investment properties – 637,140 –Additions to property, plant and equipment (Note 10) – – (1,933)Decrease (increase) in other noncurrent assets (Note 11) – – 6,976Net cash from investing activities – 637,140 5,043
(Forward)

- 2 -
*SGVFS004567*
Years Ended December 312013 2012 2011
CASH FLOWS FROM FINANCING ACTIVITIESInterest paid P=– (P=132,375) (P=4,247)Payment of trust receipts and acceptances payable – (98,865) (669)Payment of bank loans (Note 13) – (98,090) –Payment of advances from a stockholder (Note 19) – (20,000) –Net cash used in financing activities – (349,330) (4,916)
EFFECT OF EXCHANGE RATE CHANGES ONCASH AND CASH EQUIVALENTS – – 43
NET INCREASE (DECREASE) IN CASH ANDCASH EQUIVALENTS (54,400) 44,504 17,445
CASH AND CASH EQUIVALENTSAT BEGINNING OF YEAR 84,074 39,570 22,125
CASH AND CASH EQUIVALENTSAT END OF YEAR (Note 4) P=29,674 P=84,074 P=39,570
See accompanying Notes to Financial Statements.

*SGVFS004567*
SWIFT FOODS, INC.NOTES TO FINANCIAL STATEMENTS(Amounts in Thousands Except Number of Shares or When Otherwise Stated)
1. General
Corporate InformationSwift Foods, Inc. (SFI or the Company) was incorporated in the Philippines on June 6, 1994 toassume RFM Corporation’s business of manufacturing, marketing, and distributing processed andcanned meat products, poultry products and commercial feeds. In 2002, the production,marketing, and distribution activities of the meat division were transferred back to RFMCorporation. Starting 2006, the Company’s only business is the poultry business.
In 2012, the trade license agreement between the Company and RFM Corporation was finalizedgiving ownership of the “Swift” brand to RFM Corporation. In October 2012, RFM Corporationsold the trademark to a third party. As of December 31, 2013 and 2012, the Company continues tooperate under the brand name “Sariwanok”.
The Company’s registered office address is RFM Corporate Center, corner Pioneer SheridanStreets, Mandaluyong City.
Status of Operations and Management PlansThe Company has reported significant deficit which amounted to P=2.99 billion and P=2.94 billionas of December 31, 2013 and 2012, respectively, resulting from accumulated losses in prior years.Further, the Company reported negative operating cash flows amounting to P=54.40 million andP=243.31 million as of December 31, 2013 and 2012, respectively. These conditions indicate theexistence of a material uncertainty which may cast significant doubt about the Company’s abilityto continue as a going concern, and therefore, the Company may be unable to realize its assets andsettle its liabilities in the normal course of business.
The Company rested its production and operations nationwide towards the end of 2011 except forPalawan branch which remains as the only company-operated facility which continues to growday-old chicks from local suppliers and contract growers into broiler, and markets them as dressedchicken.
Towards the last quarter of 2012, the Company consummated the sale of its investment properties.The Pioneer properties were sold to DMCI Project Developers, Inc. and the Manggahan propertyto LBL Industries, Inc. (see Note 9). Proceeds from these transactions were used to fully settle theCompany’s bank obligations and partially settle majority of the Company’s payables.
The financial statements have been prepared assuming that the Company will continue as a goingconcern. To enable the Company to continue as a going concern, the Company will continue theoperation of the Palawan branch and will focus on the marketing of Sariwanok brand of chickenand this will support its current operations for the next twelve months from balance sheet date.The Company continues to wait for better business opportunities and carefully evaluate variousbusiness plans.
The financial statements do not include any adjustments that may result from the outcome of thisuncertainty.

- 2 -
*SGVFS004567*
Authorization for the Issuance of the Financial StatementsThe financial statements as of and for the year ended December 31, 2013 were authorized for issueby the Board of Directors (BOD) on April 28, 2014.
2. Summary of Significant Accounting and Financial Reporting Policies
Basis of PreparationThe financial statements were prepared on a historical cost basis, except for agricultural produceand investment properties, which are carried at fair value. The financial statements arepresented in Philippine peso (Peso), which is the Company’s functional and presentation currency.All values are rounded off to the nearest thousand (P=000), except for the number of shares andearnings/loss per share or when otherwise indicated.
Statement of ComplianceThe financial statements have been prepared in compliance with Philippine Financial ReportingStandards (PFRS).
Changes in Accounting Policies and DisclosuresThe accounting policies adopted are consistent with those of the previous financial year, except forthe following which were adopted as of January 1, 2013:
· Revised PAS 19, Employee BenefitsOn January 1, 2013, the Company adopted the Revised PAS 19, Employee Benefits. Fordefined benefit plans, the Revised PAS 19 requires all actuarial gains and losses to berecognized in other comprehensive income and unvested past service costs previouslyrecognized over the average vesting period to be recognized immediately in profit or losswhen incurred.
The Revised PAS 19 replaced the interest cost and expected return on plan assets with theconcept of net interest on defined benefit liability or asset which is calculated by multiplyingthe net balance sheet defined benefit liability or asset by the discount rate used to measure theemployee benefit obligation, each as at the beginning of the annual period.
Prior to adoption of the Revised PAS 19, the Company recognizes actuarial gains and losses inother comprehensive income in the current period. The amended standard has no significantimpact on the Company’s accounting for retirement benefits but would require additionaldisclosures in the financial statements (see Note 20).
The Revised PAS 19 also amended the definition of short-term employee benefits and requiresemployee benefits to be classified as short-term based on expected timing of settlement ratherthan the employee’s entitlement to the benefits. In addition, the Revised PAS 19 modifies thetiming of recognition for termination benefits. The modification requires the terminationbenefits to be recognized at the earlier of when the offer cannot be withdrawn or when therelated restructuring costs are recognized.
- 3 -
*SGVFS004567*
Changes to definition of short-term employee benefits and timing of recognition fortermination benefits do not have any significant impact to the Company’s financial positionand financial performance, except for the reclassification of portion of accrual for sick andvacation leave from current liability to noncurrent liability as follows:
(Amounts in thousands)December 31,
2013December 31,
2012Balance sheetIncrease (decrease) in:Accounts payable and accrued liabilities (P=890) (P=946)Other employee benefits 890 946
The adoption of Revised PAS 19 did not have an effect on the total assets, equity, and netincome previously reported. Also, the adoption of the standard did not have an impact on the2012 statement of cash flows.
· PFRS 13, Fair Value MeasurementThis establishes a single source of guidance under PFRS for all fair value measurements.PFRS 13 does not change when an entity is required to use fair value, but rather providesguidance on how to measure fair value under PFRS. PFRS 13 defines fair value as an exitprice and requires additional disclosures. As a result of the guidance in PFRS 13, theCompany reassessed its policies for measuring fair values, in particular, its valuation inputssuch as non-proforma risk for fair value measurement of liabilities. Application of PFRS 13has not materially impacted the fair value measurements of the Company. Additionaldisclosures, where required, are provided in the individual notes relating to the assets andliabilities whose fair values were determined. Fair value hierarchy is provided in Note 25.
The following amended PFRS and amendments to existing PAS and interpretations becameeffective on January 1, 2013 but have no significant impact on the Company’s financialstatements.
· PAS 1, Presentation of Financial Statements - Presentation of Items of Other ComprehensiveIncome (OCI)
· PFRS 7, Financial Instruments: Disclosures - Offsetting Financial Assets and FinancialLiabilities (Amendments)
· PFRS 1, First-time Adoption of International Financial Reporting Standards - GovernmentLoans (Amendments)
· PFRS 1, First-time Adoption of PFRS - Borrowing CostsPFRS 10, Consolidated FinancialStatements
· PFRS 11, Joint Arrangements· PFRS 12, Disclosure of Interests in Other Entities· Philippine Interpretation IFRIC 20, Stripping Costs in the Production Phase of a Surface Mine· PAS 1, Presentation of Financial Statements - Clarification of the requirements for
comparative information· PAS 16, Property, Plant and Equipment - Classification of servicing equipment· PAS 27, Separate Financial Statements (as revised in 2011)· PAS 28, Investments in Associates and Joint Ventures (as revised in 2011)· PAS 19, Employee Benefits (Revised)· PAS 32, Financial Instruments: Presentation - Tax effect of distribution to holders of equity
instruments

- 4 -
*SGVFS004567*
· PAS 34, Interim Financial Reporting - Interim financial reporting and segment informationfor total assets and liabilities
The significant accounting policies adopted in the preparation of the financial statements are setout below:
Cash and Cash EquivalentsCash includes cash on hand and in banks. Cash in banks earn interest at the respective bankdeposit rates. Cash equivalents are short-term, highly liquid investments that are readilyconvertible to known amounts of cash with original maturities of up to three months or less fromdates of acquisition and are subject to an insignificant risk of change in value.
Fair Value MeasurementFair value is the price that would be received to sell an asset or paid to transfer a liability in anorderly transaction between market participants at the measurement date. The fair valuemeasurement is based on the presumption that the transaction to sell the asset or transfer theliability takes place either:
· In the principal market for the asset or liability, or· In the absence of a principal market, in the most advantageous market for the asset or liability
The principal or the most advantageous market must be accessible to by the Company.
The fair value of an asset or a liability is measured using the assumptions that market participantswould use when pricing the asset or liability, assuming that market participants act in theireconomic best interest. A fair value measurement of a non-financial asset takes into account amarket participant's ability to generate economic benefits by using the asset in its highest and bestuse or by selling it to another market participant that would use the asset in its highest and bestuse.
The Company uses valuation techniques that are appropriate in the circumstances and for whichsufficient data are available to measure fair value, maximizing the use of relevant observableinputs and minimizing the use of unobservable inputs.
All assets and liabilities for which fair value is measured or disclosed in the financial statementsare categorized within the fair value hierarchy, described as follows, based on the lowest levelinput that is significant to the fair value measurement as a whole:
· Level 1 - Quoted (unadjusted) market prices in active markets for identical assets or liabilities· Level 2 - Valuation techniques for which the lowest level input that is significant to the fair
value measurement is directly or indirectly observable· Level 3 - Valuation techniques for which the lowest level input that is significant to the fair
value measurement is unobservable
For assets and liabilities that are recognized in the financial statements on a recurring basis, theCompany determines whether transfers have occurred between levels in the hierarchy by re-assessing categorization (based on the lowest level input that is significant to the fair valuemeasurement as a whole) at the end of each reporting period.
- 5 -
*SGVFS004567*
For the purpose of fair value disclosures, the Company has determined classes of assets andliabilities on the basis of the nature, characteristics and risks of the asset or liability and the levelof the fair value hierarchy as explained above.
As of December 31, 2013 and 2012, the Company’s investment property is carried at fair valueand with recurring fair value measurements.
Financial Assets and Financial LiabilitiesDate of recognitionThe Company recognizes a financial asset or a financial liability in the balance sheet when itbecomes a party to the contractual provisions of the instrument. Purchases and sales of financialassets that require delivery of assets within the time frame established by regulation or conventionin the market place are recognized on the settlement date.
Initial recognition of financial instrumentsAll financial assets and financial liabilities are recognized initially at fair value. Except forsecurities at fair value through profit or loss (FVPL), the initial measurement of financial assetsincludes transaction costs. Subsequent to initial recognition, the Company classifies its financialassets in the following categories: financial assets at FVPL, loans and receivables, held-to-maturity (HTM) investments, and available-for-sale (AFS) investments. The classificationdepends on the purpose for which the investments were acquired or whether they are quoted in anactive market. The Company also classifies its financial liabilities into financial liabilities atFVPL and other financial liabilities.
The Company determines the classification of its financial assets at initial recognition and, whereallowed and appropriate, reevaluates such designation at each balance sheet date.
Financial instruments are classified as liabilities or equity in accordance with the substance of thecontractual arrangement. Interest, dividends, gains and losses relating to a financial instrument ora component that is a financial liability, are reported as an expense or income. Distributions toholders of financial instruments classified as equity are charged directly to equity, net of anyrelated income tax benefits.
As of December 31, 2013 and 2012, the Company’s financial assets and financial liabilitiesconsist of loans and receivables and other financial liabilities. The Company does not havecontracts identified as having embedded derivatives characteristics.
Loans and receivablesLoans and receivables are nonderivative financial assets with fixed or determinable payments thatare not quoted in an active market. They arise when the Company provides money, goods orservices directly to a debtor with no intention of trading the receivables. After initialmeasurement, loans and receivables are subsequently carried at cost or amortized cost using theeffective interest method less any allowance for impairment. Gains and losses are recognized inthe statement of income when the loans and receivables are derecognized or impaired, as well asthrough the amortization process.
Loans and receivables are classified as current assets if maturity is within 12 months from thebalance sheet date. Otherwise, these are classified as noncurrent assets.
This category primarily includes the Company’s cash and cash equivalents, trade receivables,amounts due from related parties, employees, and other receivables and rental deposits.

- 6 -
*SGVFS004567*
Other financial liabilitiesThis category pertains to financial liabilities that are not held for trading or not designated as atFVPL at inception. These include liabilities arising from operations or borrowings.
Other financial liabilities are recognized initially at fair value and are subsequently carried atamortized cost, taking into account the impact of applying the effective interest method ofamortization for any related premium, discount and any directly attributable transaction cost.The Company’s other financial liabilities include accounts payable and accrued liabilities, trustreceipts and acceptances payable and bank loans.
Impairment of Financial AssetsAn assessment is made at each balance sheet date to determine whether there is objective evidencethat a financial asset or group of financial assets is impaired.
Loans and receivablesThe Company first assesses whether an objective evidence of impairment exists individually forfinancial assets that are individually significant, and individually or collectively for financialassets that are not individually significant. If there is objective evidence that an impairment losson loans and receivables carried at amortized cost has been incurred, the amount of the loss ismeasured as the difference between the asset’s carrying amount and the present value of estimatedfuture cash flows (excluding future credit losses that have not been incurred) discounted at thefinancial asset’s original effective interest rate (i.e., the effective interest rate computed at initialrecognition). The carrying amount of the asset shall be reduced through the use of an allowanceaccount and the amount of the loss shall be recognized in the statement of income. If it isdetermined that no objective evidence of impairment exists for an individually assessed financialasset, whether significant or not, the asset is included in a group of financial assets with similarcredit risk characteristics and that group of financial assets is collectively assessed for impairment.Assets that are individually assessed for impairment and for which an impairment loss is orcontinues to be recognized are not included in a collective assessment of impairment. Interestincome continues to be accrued on the reduced carrying amount based on the original effectiveinterest rate of the asset.
If, in a subsequent period, the amount of the impairment loss decreases and the decrease can berelated objectively to an event occurring after the impairment was recognized, the previouslyrecognized impairment loss is reversed. Any subsequent reversal is recognized in the statement ofincome, to the extent that the carrying value of the asset does not exceed its amortized cost at thereversal date.
Loans and receivables, together with the associated allowance, are written off when there is norealistic prospect of future recovery and all collateral, if any, has been realized or has beentransferred to the Company. If in a subsequent year, the amount of the estimated impairment lossincreases or decreases because of an event occurring after the impairment was recognized, thepreviously recognized impairment loss is increased or reduced by adjusting the allowance forimpairment losses account. If a future write-off is later recovered, the recovery is recognized inthe statement of income under “Other income” account. Any subsequent reversal of animpairment loss is recognized in the statement of income under “Provision for (reversal of)impairment losses” account, to the extent that the carrying value of the asset does not exceed itsamortized cost at reversal date.

- 7 -
*SGVFS004567*
In relation to trade receivables, a provision for doubtful accounts is made when there is objectiveevidence (such as the probability of insolvency or significant financial difficulties of the debtor)that the Company will not be able to collect all of the amounts due under the original terms of theinvoice. The carrying amount of the receivable is reduced through the use of an allowanceaccount. Impaired receivables are written off when assessed as uncollectible.
Derecognition of Financial Assets and Financial LiabilitiesFinancial assetsA financial asset (or, where applicable, a part of a financial asset or part of a group of similarfinancial assets) is derecognized when:
· the right to receive cash flows from the financial asset has expired; or· the Company retains the right to receive cash flows from the financial asset, but has assumed
an obligation to pay them in full without material delay to a third party under a “pass-through”arrangement; or
· the Company has transferred its right to receive cash flows from the financial asset, and either(a) has transferred substantially all the risks and rewards of the financial asset, or (b) hasneither transferred nor retained substantially all the risks and rewards of the asset, but havetransferred control of the financial asset.
Where the Company has transferred its right to receive cash flows from a financial asset or hasentered into a pass-through agreement and has neither transferred nor retained substantially all therisks and rewards of the financial asset nor transferred control of the financial asset, the financialasset is recognized to the extent of the Company’s continuing involvement. Continuinginvolvement that takes the form of a guarantee over the transferred financial asset is measured atthe lower of the original carrying amount of the financial asset and the maximum amount ofconsideration that the Company could be required to repay.
Financial liabilitiesA financial liability is derecognized when the obligation under the liability is discharged,cancelled or has expired.
Where an existing financial liability is replaced by another from the same lender on substantiallydifferent terms, or the terms of an existing liability are substantially modified, such an exchange ormodification is treated as a derecognition of the original liability and the recognition of a newliability, and the difference in the respective carrying amounts is recognized in the statement ofincome.
Offsetting Financial InstrumentsFinancial assets and financial liabilities are offset and the net amount reported in the balance sheetif, and only if, there is a currently enforceable legal right to offset the recognized amounts andthere is an intention to settle on a net basis, or to realize the asset and settle the liabilitysimultaneously. This is not generally the case with master netting agreements, and the relatedfinancial assets and financial liabilities are presented at gross in the balance sheet.

- 8 -
*SGVFS004567*
InventoriesInventories are valued at the lower of cost and net realizable value (NRV). Costs incurred inbringing each product to its present location and condition are accounted for as follows:
Raw materials, packaging materialsand spare parts and supplies
- purchase cost using the moving averagemethod.
Finished goods - the initial cost of finished goods is the fairvalue less costs to sell of agriculturalproduce at point of harvest (see relatedpolicy on Agricultural Produce).
NRV, except for spare parts and supplies, is the selling price in the ordinary course of business,less the estimated costs necessary to make the sale. For spare parts and supplies, NRV is the valueof the inventories when sold at their condition at the balance sheet date.
Agricultural ProduceAgricultural produce, which consists of live broilers harvested from the Company’s biologicalassets, are carried at fair value less estimated point-of-sale costs at the point of harvest. The fairvalue is determined based on the most recent market price at the point of harvest based on relevantmarket prices published by the Philippine Bureau of Agricultural Statistics (BAS). The Company,generally, does not maintain any inventory of agricultural produce at any given time as these areeither sold as live chicken or are immediately transferred as live broilers to the Company’sdressing plants for processing as dressed chicken.
Biological AssetsThe Company’s biological assets include breeding stocks, growing livestock (broilers beforereaching harvestable weight) and goods in process (i.e., hatching eggs and day-old chicks), whichare grouped mainly according to their transformation capacity (growing or laying) as well as theirparticular stage in the production process. These biological assets are categorized according totheir inherent characteristics in the production cycle.
The Company’s growing breeding stocks are raised until they reach the laying stage where theyproduce day-old chicks. These day-old chicks will be grown as livestock, which will either besold as live chicken or transferred to the dressing plant for processing as dressed chicken.
Growing livestock and hatching eggs are classified as current assets while growing and layingbreeding stocks are classified as noncurrent.
Growing livestock and goods in process are carried at accumulated cost while breeding stocks arecarried at accumulated cost less accumulated amortization and any accumulated impairmentlosses. This measurement is adopted by the Company since fair value cannot be determined dueto the absence of a relevant active market and other reliable market basis to measure at fair value.Moreover, estimates necessary to compute for the current value of expected net cash flows involvevarious data which may not result in a reliable basis for the fair value.
Amortization of laying breeding stocks is calculated using the unit-of-production method wherebyall costs and expenses incurred by the Company during the approximately 25-week growing stageof its breeding stock are accumulated and amortized starting on about the 26th week over theexpected total egg production of such breeders until the 65th week on the average (65 weeksuseful life). Amortization is included under the cost of goods sold account in the statement ofincome.

- 9 -
*SGVFS004567*
Biological assets are assessed for any indication of impairment at each balance sheet date.
Creditable Withholding TaxCreditable withholding tax, which is included under “Other current assets” account in the balancesheet, represents the amount withheld by customers from income payments to the Company andmay be applied against the Company’s income tax payable. Estimates of amounts that arepotentially unrecoverable are provided with allowance for probable losses through charges tostatement of income.
Investment PropertiesInvestment properties, which pertain to land and buildings held for capital appreciation or forrentals, are measured at fair value. These are measured initially at cost, including transactioncosts. Fair value changes of investment property are included in the profit or loss in the period inwhich they arise.
The fair value of the land is determined based on appraisal reports conducted by independentappraisers or on the basis of recent sales of similar properties in the same areas as the investmentproperties and taking into account the economic conditions prevailing at the time the valuationswere made. The independent appraisers hold a recognized and relevant professional qualificationand have a recent experience in the location and category of the investment properties beingvalued.
An investment property is derecognized when either it has been disposed of or when it ispermanently withdrawn from use and no future economic benefit is expected from its disposal.Any gain or loss in the derecognition on an investment property is recognized in the statement ofincome in the year of derecognition.
Expenditures incurred after the investment properties have been put into operations, such asrepairs and maintenance costs, are normally charged to income in the period in which the costs areincurred.
Transfers are made to investment properties when, and only when, there is a change in use,commencement of an operating lease to another party or ending of construction or development.Transfers are made from investment properties when, and only when, there is a change in use,evidenced by commencement of the Company’s occupation or commencement of developmentwith a view to sale.
For a transfer from investment property to owner-occupied property, the deemed cost of theproperty for subsequent accounting is its fair value at the date of change in use. If an owner-occupied property becomes an investment property, the Company accounts for such property inaccordance with the policy stated under property, plant, and equipment up to the date of change inuse. The difference between the fair value of the property, plant and equipment transferred toinvestment property and its carrying value is credited to the revaluation increment account.
Property, Plant and EquipmentProperty, plant and equipment, except land, are stated at cost, net of accumulated depreciation andaccumulated impairment losses, if any. The initial cost of property, plant and equipment consistsof its purchase price, including import duties, taxes and any directly attributable costs of bringingthe asset to its working condition and location for its intended use. Expenditures incurred after theproperty, plant and equipment have been put into operation, such as repairs and maintenance costs,are normally charged to current operation. In situations where it can be clearly demonstrated thatthe expenditures have resulted in an increase in the future economic benefits expected to be

- 10 -
*SGVFS004567*
obtained from the use of an item of property, plant and equipment beyond its originally assessedstandard of performance, the expenditures are capitalized as an additional cost of property, plantand equipment.
Land is measured initially at fair value as of January 1, 2004 as permitted by PFRS 1, First TimeAdoption of Philippine Financial Reporting Standards. This fair value is the “deemed cost” of theland, which is subjected to impairment testing. The fair value of the land has been determinedbased on the appraisal reports conducted by independent appraisers and taking into account theeconomic conditions prevailing at the time the valuations were made. The difference between thefair value of the land and the carrying value was credited to deficit.
Depreciation and amortization of property, plant and equipment begins when it becomes availablefor use (i.e., when it is in the location and condition necessary for it to be capable of operating inthe manner intended by management). It ceases at the earlier of the date that it is classified asheld-for-sale or derecognized. Depreciation and amortization is computed using the straight-linemethod over the estimated useful lives of the assets as follows:
Number of YearsSilos, buildings and improvements 20Machinery and equipment 10Transportation and delivery equipment 5Office furniture, fixtures and equipment 5
The estimated useful lives of the assets and depreciation and amortization methods are reviewedperiodically to ensure that the periods and method of depreciation and amortization are consistentwith the expected pattern of economic benefits from items of property, plant and equipment.
An item of property, plant and equipment is derecognized upon disposal or when no futureeconomic benefits are expected to arise from the continued use of the asset. Any gain or lossarising from the derecognition of the asset (computed as the difference between the net disposalproceeds and the carrying amount of the item) is included in the statement of income in the yearthe item is derecognized.
When assets are retired or otherwise disposed of, the cost and the related accumulated depreciationand amortization and any impairment losses are removed from the accounts. Any resulting gain orloss is recognized in the statement of income.
Borrowing CostsBorrowing costs are capitalized to the extent that is directly attributable to the acquisition orconstruction of a qualifying asset. Capitalization of borrowing costs commences when theactivities to prepare the asset are in progress and expenditures and borrowing costs are beingincurred. Borrowing costs are capitalized until the assets are substantially ready for their intendeduse. If the carrying amount of the asset exceeds its recoverable amount, an impairment loss isrecorded. Borrowing cost consists of interest and other costs that an entity incurs in connectionwith the borrowing of fund.
Other borrowing costs are recognized as an expense when incurred.
Impairment of Nonfinancial AssetsThe carrying values of property, plant and equipment and biological assets are reviewed forimpairment when events or changes in circumstances indicate that the carrying value may not berecoverable. If any such indication exists and where the carrying values exceed the estimated
- 11 -
*SGVFS004567*
recoverable amount, the assets or cash-generating units are written down to their recoverableamount. An asset’s recoverable amount is the higher of an asset’s or cash-generating unit’s fairvalue less costs to sell and its value-in-use and is determined for an individual asset, unless theasset does not generate cash inflows that are largely independent of those from other assets orgroups of assets.
Where the carrying amount of an asset (or cash generating unit) exceeds its recoverable amount,the asset is considered impaired and is written down to its recoverable amount. In assessing value-in-use, the estimated future cash flows are discounted to their present value using a pre-taxdiscount rate that reflects current market assessments of the time value of money and the risksspecific to the asset. For an asset that does not generate largely independent cash inflows, therecoverable amount is determined for the cash-generating unit to which the asset belongs.Impairment losses are recognized in the statement of income in those expense categoriesconsistent with the function of the impaired asset.
An assessment is made at each reporting date as to whether there is any indication that previouslyrecognized impairment losses may no longer exist or may have decreased. If such indicationexists, the recoverable amount is estimated. A previously recognized impairment loss is reversedonly if there has been a change in the estimates used to determine the asset’s recoverable amountsince the last impairment loss was recognized. If that is the case, the carrying amount of the assetis increased to its recoverable amount. That increased amount cannot exceed the carrying amountthat would have been determined, net of depreciation, had no impairment loss been recognized forthe asset in prior years. Such reversal is recognized in the statement of income unless the asset iscarried at revalued amount in which the reversal is treated as a revaluation increase. After suchreversal, the depreciation expense is adjusted in future periods to allocate the asset’s revisedcarrying amount, on a systematic basis over its remaining useful life.
Revenue RecognitionRevenue is recognized to the extent that it is probable that the economic benefits associated withthe transaction will flow to the Company and the amount of revenue can be reliably measured.Revenue is measured at the fair value of the consideration received, excluding discounts andoutput value-added tax (VAT). The Company assesses its revenue arrangements against specificcriteria in order to determine if it is acting as principal or agent. The Company has concluded thatit is acting as principal in all of its revenue arrangements. The following specific recognitioncriteria must also be met before revenue is recognized:
Sale of goodsRevenue from sale of goods is recognized when delivery has taken place and the significant risksand rewards of ownership have passed to the buyer and the amount of revenue can be measuredreliably, which is normally upon delivery or acceptance by the customer.
Fair valuation of agricultural produceGain from fair value change of agricultural produce is recognized at the point of harvest. Fairvalue is based on the most recent relevant market price (see related policy on AgriculturalProduce) at transaction date.
Rental incomeRental income on leased properties under operating lease arrangements is recognized on a straight-line basis over the lease contracts.
Interest incomeInterest income is recognized as the interest accrues using the effective interest yield on the asset.

- 12 -
*SGVFS004567*
Other incomeAll other income are recognized when earned or when the right to receive payment is established.
Costs and ExpensesCosts and expenses are recognized as incurred when decrease in future economic benefits relatedto a decrease in an asset or an increase of a liability, other than equity transactions with equityholders, has arisen that can be measured reliably.
Cost of goods soldCost of goods sold is recognized as expense when the related goods are sold.
General, administrative, selling and marketing expensesGeneral and administrative expenses constitute costs of administering the business. Selling andmarketing expenses are costs incurred to sell or distribute the merchandise. These expenses areexpensed when incurred.
Interest expenseInterest expense is recognized in profit or loss as the interest accrues taking into account theeffective yield on the related liability. The Company’s interest expense pertains mainly to its bankloans and trust receipts and acceptances payable.
Other Comprehensive Income (Loss)Other comprehensive income (loss) comprises items of income and expense (including itemspreviously presented under the statement of changes in equity) that are not recognized in thestatement of income for the year in accordance with PFRS.
LeasesThe determination of whether an arrangement is, or contains a lease as provided in PhilippineInterpretation IFRIC 4, Determining Whether an Arrangement Contains a Lease, is based on thesubstance of the arrangement and requires an assessment of whether the fulfillment of thearrangement is dependent on the use of a specific asset or assets and the arrangement conveys aright to use the asset. A reassessment is made after inception of the lease only if one of thefollowing applies:
a. there is a change in contractual terms, other than a renewal or extension of the arrangement;b. a renewal option is exercised or extension granted, unless that term of the renewal or extension
was initially included in the lease term;c. there is a change in the determination of whether fulfillment is dependent on a specific
asset; ord. there is a substantial change to the asset.
Where a reassessment is made, lease accounting shall commence or cease from the date when thechange in circumstances gives rise to the reassessment for scenarios (a), (c), or (d) above, and atthe date of renewal or extension period for scenario (b).
The determination whether a lease agreement is a finance or an operating lease is dependent on theretention or transfer of substantially all the risks and rewards incidental to ownership to the leasedasset.

- 13 -
*SGVFS004567*
Company as lesseeLeases were the lessor retains substantially all the risk and rewards of ownership of the asset areclassified as operating lease. Operating leases are recognized as an expense in the statement ofincome on a straight-line basis over the term of the lease.
Retirement Benefits CostThe Company accrues retirement benefits cost for all regular full-time employees based on therequirements of Republic Act (RA) No. 7641. Retirement benefits cost is actuarially determinedusing the projected unit credit method. This method considers each period of service as givingrise to an additional unit of benefit entitlement and measures each separately to build up the finalobligation.
Retirement benefit costs comprise the following:· Service cost· Net interest on the net defined benefit liability or asset· Re-measurements of net defined benefit liability or asset
Service costs which include current service costs, past service costs and gains or losses on non-routine settlements are recognized as expense in profit or loss. Past service costs are recognizedwhen plan amendment or curtailment occurs. These amounts are calculated periodically byindependent qualified actuaries.
Net interest on the net defined benefit liability or asset is the change during the period in the netdefined benefit liability or asset that arises from the passage of time which is determined byapplying the discount rate based on government bonds to the net defined benefit liability or asset.Net interest on the net defined benefit liability or asset is recognized as expense or income inprofit or loss.
Re-measurements comprising actuarial gains and losses, return on plan assets and any change inthe effect of the asset ceiling (excluding net interest on defined benefit liability) are recognizedimmediately in other comprehensive income in the period in which they arise. Re-measurementsare not reclassified to profit or loss in subsequent periods.
The amount recognized as retirement benefits liability is the aggregate of the present value of thedefined benefit obligation at the end of the reporting period reduced by the fair value of planassets, if any, adjusted for any effect of limiting a net defined benefit asset to the asset ceiling. Theasset ceiling is the present value of any economic benefits available in the form of refunds fromthe plan or reductions in future contributions to the plan.
Actuarial valuations are made with sufficient regularity that the amounts recognized in thefinancial statements do not differ materially from the amounts that would be determined atreporting date.
Employee leave entitlementEmployee entitlements to annual leave are recognized as a liability when they are accrued to theemployees. The undiscounted liability for leave expected to be settled wholly before twelvemonths after the end of the annual reporting period is recognized for services rendered byemployees up to the end of the reporting period.

- 14 -
*SGVFS004567*
Foreign Currency-denominated TransactionsTransactions denominated in foreign currencies are initially recorded in Peso at the functionalcurrency exchange rate at the date of the transaction. Outstanding monetary assets and liabilitiesdenominated in foreign currencies are restated using the functional currency exchange rate at thereporting date. Exchange gains or losses arising from foreign currency transactions and balancesare credited to or charged against current operations. Nonmonetary items that are measured interms of historical cost in a foreign currency are translated using the exchange rates as at the dateof initial transaction.
Income TaxesCurrent income taxCurrent income tax assets and liabilities for the current and prior periods are measured at theamount expected to be recovered from or paid to the taxation authorities. The tax rates and taxlaws used to compute the amount are those that are enacted or substantively enacted at the eachbalance sheet date.
Deferred income taxDeferred income tax is provided, using balance sheet liability method, on all temporarydifferences at the balance sheet date between the tax bases of assets and liabilities and theircarrying amounts for financial reporting purposes.
Deferred income tax liabilities are recognized for all taxable temporary differences. Deferredincome tax assets are recognized for all deductible temporary differences, carryforward benefits ofunused tax credits from excess minimum corporate income tax (MCIT) over the regular corporateincome tax (RCIT) and unused net operating loss carryover (NOLCO), to the extent that it isprobable that sufficient future taxable profits will be available against which the deductibletemporary differences, carryforward benefits of unused MCIT and NOLCO can be utilized.
The carrying amount of deferred income tax assets is reviewed at each balance sheet date andreduced to the extent that it is no longer probable that sufficient future taxable profits will beavailable to allow all or part of the deferred income tax assets to be utilized. Unrecognizeddeferred income tax assets are reassessed at each balance sheet date and are recognized to theextent that it has become probable that sufficient future taxable profits will allow the deferredincome tax assets to be recovered.
Deferred income tax relating to items recognized directly in equity is recognized in equity and notin the statement of income.
Deferred income tax assets and deferred income tax liabilities are measured at the tax rates that areexpected to apply to the period when the asset is realized or the liability is settled, based on taxrates and tax laws that have been enacted or substantively enacted at each balance sheet date.
Capital StockCapital stock is measured at par value for all shares issued. Common and preferred shares areclassified as equity. The proceeds from the issuance of common shares and preferred shares arepresented in equity as capital stock to the extent of the par value of issued shares. When the sharesare sold at a premium, the difference between the proceeds and the par value is credited to the“Capital in excess of par value” account.
- 15 -
*SGVFS004567*
Retained Earnings (Deficit)Retained earnings (deficit) represent the cumulative balance of total comprehensive income(losses) and effects of changes in accounting policy. A deficit is not an asset but a deduction fromequity.
Shares Held in TreasuryThe Company’s own equity instruments reacquired are carried at cost and deducted from equity.No gain or loss is recognized in the statement of income on the purchase, sale, issuance orcancellation of the Company’s own equity instruments.
Basic/Diluted Earnings (Loss) Per ShareBasic earnings (loss) per share is calculated through dividing the net income (loss) by theweighted average number of common shares issued and outstanding during the year.
Diluted earnings (loss) per share is calculated through dividing the net income (loss) by theweighted average number of common shares outstanding during the year, excluding treasuryshares and adjusted for the effects of all potentially dilutive common shares, if any. Where thebasic earnings (loss) per share effect of the assumed conversion of preferred shares on net income(loss) would be anti-dilutive, no diluted earnings per share is presented.
Provisions and ContingenciesProvisions are recognized when the Company has a present obligation (legal or constructive) as aresult of a past event, it is probable that an outflow of resources embodying economic benefits willbe required to settle the obligation and a reliable estimate can be made of the amount of theobligation.
Contingent liabilities are not recognized in the financial statements. They are disclosed in thenotes to financial statements unless the possibility of an outflow of resources embodyingeconomic benefits is remote. Contingent assets are not recognized in the financial statements butdisclosed in the notes to financial statements when an inflow of economic benefits is probable.
Events After the Balance Sheet DatePost year-end events that provide additional information about the Company’s position at thebalance sheet date (adjusting events) are reflected in the financial statements. Post year-endevents that are not adjusting events are disclosed in the notes to financial statements whenmaterial.
Segment ReportingThe Company’s operating business is organized and managed according to the nature of theproducts and services provided to represent a strategic business unit that offers different productsand serves different markets. The Company’s asset producing revenues are located in thePhilippines.
Events after the Reporting PeriodPost year-end events that provide additional information about the Company’s position at balancesheet date (adjusting events) are reflected in the financial statements. Post year-end events that arenot adjusting events are disclosed in the notes to the financial statements when material.
Future Changes in Accounting PoliciesStandards issued and effective after December 31, 2013 are listed below. This listing of standardsand interpretations issued are those that the Company reasonably expects to be applicable at afuture date. The Company intends to adopt these standards when these become effective. Except

- 16 -
*SGVFS004567*
as otherwise indicated, the Company does not expect the adoption of these new and amendedstandards and interpretations to have a significant impact on its financial statements.
Effective in 2014
· PAS 36, Impairment of Assets - Recoverable Amount Disclosures for Non-Financial Assets(Amendments), remove the unintended consequences of PFRS 13 on the disclosures requiredunder PAS 36. In addition, these amendments require disclosure of the recoverable amountsfor the assets or cash-generating units (CGUs) for which impairment loss has been recognizedor reversed during the period. These amendments are effective retrospectively for annualperiods beginning on or after January 1, 2014 with earlier application permitted, providedPFRS 13 is also applied. The amendments have no impact on the Company’s financialposition or performance.
· Investment Entities (Amendments to PFRS 10, PFRS 12 and PAS 27), are effective for annualperiods beginning on or after January 1, 2014. They provide an exception to the consolidationrequirement for entities that meet the definition of an investment entity under PFRS 10. Theexception to consolidation requires investment entities to account for subsidiaries at fair valuethrough profit or loss. The amendments have no impact on the Company’s financial positionor performance.
· Philippine Interpretation IFRIC 21, Levies, clarifies that an entity recognizes a liability for alevy when the activity that triggers payment, as identified by the relevant legislation, occurs.For a levy that is triggered upon reaching a minimum threshold, the interpretation clarifies thatno liability should be anticipated before the specified minimum threshold is reached. IFRIC 21is effective for annual periods beginning on or after January 1, 2014. The interpretation has noimpact on the Company’s financial position or performance.
· PAS 39, Financial Instruments: Recognition and Measurement - Novation of Derivatives andContinuation of Hedge Accounting (Amendments), provide relief from discontinuing hedgeaccounting when novation of a derivative designated as a hedging instrument meets certaincriteria. These amendments are effective for annual periods beginning on or afterJanuary 1, 2014. The amendments have no impact on the Company’s financial position orperformance.
· PAS 32, Financial Instruments: Presentation - Offsetting Financial Assets and FinancialLiabilities (Amendments), clarify the meaning of “currently has a legally enforceable right toset-off” and also clarify the application of the PAS 32 offsetting criteria to settlement systems(such as central clearing house systems) which apply gross settlement mechanisms that are notsimultaneous. The amendments have no impact on the Company’s financial position orperformance. The amendments to PAS 32 are to be retrospectively applied for annual periodsbeginning on or after January 1, 2014.
Effective in 2015
· PAS 19, Employee Benefits - Defined Benefit Plans: Employee Contributions (Amendments),apply to contributions from employees or third parties to defined benefit plans. Contributionsthat are set out in the formal terms of the plan shall be accounted for as reductions to currentservice costs if they are linked to service or as part of the remeasurements of the net definedbenefit asset or liability if they are not linked to service.
- 17 -
*SGVFS004567*
Contributions that are discretionary shall be accounted for as reductions of current service costupon payment of these contributions to the plans. The amendments to PAS 19 are to beretrospectively applied for annual periods beginning on or after July 1, 2014. Theamendments have no impact on the Company’s financial position or performance.
Annual Improvements to PFRSThese improvements contain non-urgent but necessary amendments to PFRSs. The amendmentsare effective for annual periods beginning on or after July 1, 2014.
2010-2012 Cycle
· PFRS 2, Share-based Payment - Definition of Vesting Condition, revised the definitions ofvesting condition and market condition and added the definitions of performance conditionand service condition to clarify various issues. This amendment shall be prospectively appliedto share-based payment transactions for which the grant date is on or after July 1, 2014. Thisamendment does not apply to the Company as it has no share-based payments.
· PFRS 3, Business Combinations - Accounting for Contingent Consideration in a BusinessCombination, clarifies that a contingent consideration that meets the definition of a financialinstrument should be classified as a financial liability or as equity in accordance with PAS 32.Contingent consideration that is not classified as equity is subsequently measured at fair valuethrough profit or loss whether or not it falls within the scope of PFRS 9 (or PAS 39, if PFRS 9is not yet adopted). The amendment shall be prospectively applied to business combinationsfor which the acquisition date is on or after July 1, 2014. The Company shall consider thisamendment for future business combinations.
· PFRS 8, Operating Segments - Aggregation of Operating Segments and Reconciliation of theTotal of the Reportable Segments’ Assets to the Entity’s Assets, require entities to disclose thejudgment made by management in aggregating two or more operating segments. Thisdisclosure should include a brief description of the operating segments that have beenaggregated in this way and the economic indicators that have been assessed in determiningthat the aggregated operating segments share similar economic characteristics. Theamendments also clarify that an entity shall provide reconciliations of the total of thereportable segments’ assets to the entity’s assets if such amounts are regularly provided to thechief operating decision maker. These amendments are effective for annual periods beginningon or after July 1, 2014 and are applied retrospectively. The Company expects that thisamendment will not have any impact on its financial position or performance.
· PFRS 13, Fair Value Measurement - Short-term Receivables and Payables, clarifies thatshort-term receivables and payables with no stated interest rates can be held at invoiceamounts when the effect of discounting is immaterial.
· PAS 16, Property, Plant and Equipment - Revaluation Method - Proportionate Restatement ofAccumulated Depreciation, clarifies that, upon revaluation of an item of property, plant andequipment, the carrying amount of the asset shall be adjusted to the revalued amount, and theasset shall be treated in one of the following ways:
a. The gross carrying amount is adjusted in a manner that is consistent with the revaluationof the carrying amount of the asset. The accumulated depreciation at the date ofrevaluation is adjusted to equal the difference between the gross carrying amount and thecarrying amount of the asset after taking into account any accumulated impairment losses.

- 18 -
*SGVFS004567*
b. The accumulated depreciation is eliminated against the gross carrying amount of the asset.
The amendment is effective for annual periods beginning on or after July 1, 2014. Theamendment shall apply to all revaluations recognized in annual periods beginning on or afterthe date of initial application of this amendment and in the immediately preceding annualperiod. The amendment has no impact on the Company’s financial position or performance.
· PAS 24, Related Party Disclosures - Key Management Personnel, clarifies that an entity is arelated party of the reporting entity if the said entity, or any member of a group for which it isa part of, provides key management personnel services to the reporting entity or to the parentcompany of the reporting entity. The amendments also clarify that a reporting entity thatobtains management personnel services from another entity (also referred to as managemententity) is not required to disclose the compensation paid or payable by the management entityto its employees or directors. The reporting entity is required to disclose the amounts incurredfor the key management personnel services provided by a separate management entity. Theamendments are effective for annual periods beginning on or after July 1, 2014 and areapplied retrospectively. The amendments affect disclosures only and have no impact on theCompany’s financial position or performance.
· PAS 38, Intangible Assets - Revaluation Method - Proportionate Restatement of AccumulatedAmortization, clarifies that, upon revaluation of an intangible asset, the carrying amount of theasset shall be adjusted to the revalued amount, and the asset shall be treated in one of thefollowing ways:
a. The gross carrying amount is adjusted in a manner that is consistent with the revaluationof the carrying amount of the asset. The accumulated amortization at the date ofrevaluation is adjusted to equal the difference between the gross carrying amount and thecarrying amount of the asset after taking into account any accumulated impairment losses.
b. The accumulated amortization is eliminated against the gross carrying amount of the asset.
The amendments also clarify that the amount of the adjustment of the accumulatedamortization should form part of the increase or decrease in the carrying amount accounted forin accordance with the standard.
The amendments are effective for annual periods beginning on or after July 1, 2014. Theamendments shall apply to all revaluations recognized in annual periods beginning on or afterthe date of initial application of this amendment and in the immediately preceding annualperiod. The amendments have no impact on the Company’s financial position or performance.
2011-2013 cycle
· PFRS 1, First-time Adoption of Philippine Financial Reporting Standards - Meaning of‘Effective PFRSs’, clarifies that an entity may choose to apply either a current standard or anew standard that is not yet mandatory, but that permits early application, provided eitherstandard is applied consistently throughout the periods presented in the entity’s first PFRSfinancial statements. This amendment is not applicable to the Company as it is not a first-timeadopter of PFRS.
- 19 -
*SGVFS004567*
· PFRS 3, Business Combinations - Scope Exceptions for Joint Arrangements, clarifies thatPFRS 3 does not apply to the accounting for the formation of a joint arrangement in thefinancial statements of the joint arrangement itself. The amendment is effective for annualperiods beginning on or after July 1 2014 and is applied prospectively.
· PFRS 13, Fair Value Measurement - Portfolio Exception, clarifies that the portfolio exceptionin PFRS 13 can be applied to financial assets, financial liabilities and other contracts. Theamendment is effective for annual periods beginning on or after July 1 2014 and is appliedprospectively. The amendment has no significant impact on the Company’s financial positionor performance.
· PAS 40, Investment Property, clarifies the interrelationship between PFRS 3 and PAS 40when classifying property as investment property or owner-occupied property. Theamendment stated that judgment is needed when determining whether the acquisition ofinvestment property is the acquisition of an asset or a group of assets or a businesscombination within the scope of PFRS 3. This judgment is based on the guidance of PFRS 3.This amendment is effective for annual periods beginning on or after July 1, 2014 and isapplied prospectively. The amendment has no significant impact on the Company’s financialposition or performance.
Effectivity not yet determined
· PFRS 9, Financial Instruments, as issued, reflects the first and third phases of the project toreplace PAS 39 and applies to the classification and measurement of financial assets andliabilities and hedge accounting, respectively. Work on the second phase, which relate toimpairment of financial instruments, and the limited amendments to the classification andmeasurement model is still ongoing, with a view to replace PAS 39 in its entirety. PFRS 9requires all financial assets to be measured at fair value at initial recognition. A debt financialasset may, if the fair value option (FVO) is not invoked, be subsequently measured atamortized cost if it is held within a business model that has the objective to hold the assets tocollect the contractual cash flows and its contractual terms give rise, on specified dates, tocash flows that are solely payments of principal and interest on the principal outstanding. Allother debt instruments are subsequently measured at fair value through profit or loss. Allequity financial assets are measured at fair value either through other comprehensive income(OCI) or profit or loss. Equity financial assets held for trading must be measured at fair valuethrough profit or loss. For liabilities designated as at FVPL using the fair value option, theamount of change in the fair value of a liability that is attributable to changes in credit riskmust be presented in OCI. The remainder of the change in fair value is presented in profit orloss, unless presentation of the fair value change relating to the entity’s own credit risk in OCIwould create or enlarge an accounting mismatch in profit or loss. All other PAS 39classification and measurement requirements for financial liabilities have been carried forwardto PFRS 9, including the embedded derivative bifurcation rules and the criteria for using theFVO. The adoption of the first phase of PFRS 9 will have an effect on the classification andmeasurement of the Company’s financial assets, but will potentially have no impact on theclassification and measurement of financial liabilities.
On hedge accounting, PFRS 9 replaces the rules-based hedge accounting model of PAS 39with a more principles-based approach. Changes include replacing the rules-based hedgeeffectiveness test with an objectives-based test that focuses on the economic relationshipbetween the hedged item and the hedging instrument, and the effect of credit risk on thateconomic relationship; allowing risk components to be designated as the hedged item, not

- 20 -
*SGVFS004567*
only for financial items, but also for non-financial items, provided that the risk component isseparately identifiable and reliably measurable; and allowing the time value of an option, theforward element of a forward contract and any foreign currency basis spread to be excludedfrom the designation of a financial instrument as the hedging instrument and accounted for ascosts of hedging. PFRS 9 also requires more extensive disclosures for hedge accounting.PFRS 9 currently has no mandatory effective date. PFRS 9 may be applied before thecompletion of the limited amendments to the classification and measurement model andimpairment methodology. The Company will not adopt the standard before the completion ofthe limited amendments and the second phase of the project.
· Philippine Interpretation IFRIC 15, Agreements for the Construction of Real Estate, coversaccounting for revenue and associated expenses by entities that undertake the construction ofreal estate directly or through subcontractors. The SEC and the FRSC have deferred theeffectivity of this interpretation until the final Revenue standard is issued by the IASB and anevaluation of the requirements of the final Revenue standard against the practices of thePhilippine real estate industry is completed. Adoption of the interpretation when it becomeseffective will not have any impact on the financial statements of the Company.
3. Management’s Use of Significant Judgments and Accounting Estimates
The preparation of the financial statements in accordance with PFRS requires management toexercise judgments and make accounting estimates that affect the amounts reported in thefinancial statements and related notes to the financial statements. The judgments, estimates andassumptions used are based upon management’s evaluation of the relevant facts andcircumstances as of the date of the financial statements. Actual results could differ from theseestimates and assumptions used. Judgments and estimates are continually evaluated and are basedon historical experience and other factors, including expectations of future events that are believedto be reasonable under the circumstances.
JudgmentsIn the process of applying the Company’s accounting policies, management has made thefollowing judgments, apart from those involving estimations and assumptions, which have themost significant effect on the amounts recognized in the financial statements:
Dgetermination of the Company’s functional currencyThe Company, based on the relevant economic substance of the underlying circumstances, hasdetermined its functional currency to be the Peso. It is the currency of the primary economicenvironment in which the Company operates.
Classification of biological assetsThe Company classifies its biological assets as current or noncurrent in accordance with theprovision of PAS 1, Presentation of Financial Statements, which provides the base criteria forclassifying assets and liabilities as current or noncurrent based on existing conditions at eachbalance sheet date.
Consequently, the Company classifies as current the biological assets, such as growing stocks andgoods in process (hatching eggs) which are expected to be realized or utilized within a very shortperiod of time (less than one year). Laying breeding stocks, which are expected to be productivefor an average of 65 weeks (more than one year) and growing breeders, which will become layingbreeders after 25 weeks, are classified as noncurrent biological assets.

- 21 -
*SGVFS004567*
As of December 31, 2013 and 2012, the carrying value of biological assets amounted toP=3.63 million and P=4.94 million, respectively. There are no outstanding breeding stocks as ofDecember 31, 2013 and 2012 (see Note 7).
Valuation of biological assetsGrowing livestock and goods in process are carried at accumulated cost while breeding stocks arecarried at cost less accumulated amortization and any accumulated impairment losses. Thismeasurement is adopted by the Company since fair value cannot be determined due to the absenceof a relevant active market and other reliable market basis to measure at fair value. Moreover,estimates necessary to compute for the current value of expected net cash flows involve variousdata which may not result in a reliable basis for the fair value.
As of December 31, 2013 and 2012, the carrying value of biological assets amounted toP=3.63 million and P=4.94 million, respectively (see Note 7).
Operating lease commitmentsThe Company entered into various lease agreements on its office space and warehouse, where theyhave determined that the significant risks and rewards of ownership of the properties are retainedwith the lessors. As such, the lease agreements were accounted for as operating leases. Rentexpense amounted to P=2.13 million, P=1.44 million and P=4.08 million in 2013, 2012 and 2011,respectively (see Notes 15, 16, 17 and 19).
Provisions and contingenciesThe Company is a party to certain claims. The Company makes provisions on the basis ofmanagement’s and its legal counsel’s opinion and assessment on the outcome of the claims(see Notes 12 and 27).
Estimates and AssumptionsThe key assumptions concerning the future and other key sources of estimation at each balancesheet date that have significant risks of covering a material adjustment to the carrying amount ofassets and liabilities within the next financial year are discussed as follow:
Estimating allowance for doubtful accountsProvisions are made for specific and groups of accounts identified to be doubtful of collection.Recoverability of specific receivables and other noncurrent asset items are evaluated based on thebest available facts and circumstances, the length of the Company’s relationship with thecustomer, the customer’s payment behavior, known market factors and historical loss experiences.The Company makes an individual assessment of financial assets that are specifically identified asimpaired and are individually significant. Then a collective assessment is done by grouping thefinancial assets according to its market segments. This market segment as defined by theCompany is the group of debtors with similar line of business. Accordingly, these groupingswould reflect their own credit risk characteristics. Moreover, the historical loss experience persegment was determined for purposes of assessing the impairment for each segment.
The allowance for doubtful accounts amounted to P=56.07 million and P=54.48 million as ofDecember 31, 2013 and 2012, respectively. The carrying value of accounts receivable amountedto P=14.57 million and P=157.35 million as of December 31, 2013 and 2012, respectively (seeNote 5).
Estimation of allowance for probable losses on creditable withholding taxesAllowance for probable loss on creditable withholding tax is based on the ability of the Companyto recover the carrying value of the assets. Amounts estimated to be potentially unrecoverable are

- 22 -
*SGVFS004567*
provided with allowance for probable losses. The Company estimates the level of provision forprobable losses based on the factors that affect realizability such as future income tax due. As ofDecember 31, 2013 and 2012, the Company has creditable withholding taxes, net of allowance forprobable losses, amounting to P=0.07 million and P=0.08 million, respectively. Allowance forprobable losses amounted to P=17.00 million as of December 31, 2013 and 2012 (see Note 8).
Fair value of agricultural produceThe Company determines the fair value of its agricultural produce based on the most recentmarket transaction price at the date which approximates the point of harvest, provided that therehas been no significant change in economic circumstances between the date of transactions and thebalance sheet date. Point-of-sale cost is estimated based on most recent transaction and isdeducted from the fair value in order to measure agricultural produce at point of harvest.
Market price is obtained from the monthly commercial farmgate prices of chicken issued by theBAS for provinces which the Company considered as its relevant markets. Management believesthat the monthly market prices from BAS are the only available reliable basis of fair value ofagricultural produce at the point of harvest.
Fair value adjustment of inventories that were harvested and sold during the year amounted to again (loss) of P=0.80 million, P=5.13 million and (P=12.40 million) for each of the three years in theperiod ended December 31, 2013.
Estimating NRV of inventoriesThe Company determines the NRV of inventories by reference to the current selling price of theproduct and the estimated cost to sell, which is based on the Company’s budget for the succeedingyear.
The carrying amount of inventories amounted to P=1.61 million and P=1.57 million as ofDecember 31, 2013 and 2012, respectively (see Note 6).
Estimating the fair value of investment propertiesThe Company determines the fair value of the investment properties based on the report preparedby independent appraisers or actual offers from prospective buyers, if any. The appraisers areindustry specialists in valuing these types of investment properties. Fair value is the price thatwould be received to sell an asset or paid to transfer a liability in an orderly transaction betweenmarket participants at the measurement date.
The carrying value of investment properties amounted to P=0.42 million as of December 31, 2013and 2012 (see Note 9).
Estimating the useful lives of property, plant and equipmentThe Company estimates the useful lives of property, plant and equipment based on a collectiveassessment of similar business, internal technical evaluation and experience with similar assets.The useful lives of the property, plant and equipment are estimated based on the period over whichthese assets are expected to be available for use. The estimated useful lives of property, plant andequipment are reviewed periodically and are updated if expectations differ from previousestimates due to physical wear and tear, technical and commercial obsolescence and other limitson the use of the assets.
There is no change in the estimated useful lives of property, plant and equipment in both years.The carrying value of property, plant and equipment, net of accumulated depreciation andimpairment of P=74.63 million and P=74.35 million as of December 31, 2013 and 2012, respectively,

- 23 -
*SGVFS004567*
amounted to P=107.84 million and P=108.13 million as of December 31, 2013 and 2012,respectively (see Note 10).
Estimating impairment of nonfinancial assetsAn asset impairment test is performed when events or changes in circumstances indicate that thecarrying value of the property, plant and equipment, and biological assets may be impaired. Thisrequires an estimation of the recoverable amount of the asset which is the higher of its fair valueless cost to sell or its value-in-use. The Company determines the value-in-use of these assets,which require the determination of future cash flows expected to be generated from the continueduse and ultimate disposition of such assets, and fair value less cost to sell to make estimates andassumptions that can materially affect the financial statements. The preparation of the estimatedfuture cash flows involves significant judgment and estimations. While management believes thatthe assumptions made are appropriate and reasonable, significant changes in managementassumptions may materially affect the assessment of recoverable values and may lead to futureadditional impairment charges. Any resulting impairment loss could have a material adverseimpact on the Company’s financial position and financial performance.
In 2013, 2012 and 2011, an impairment test on the Company’s nonfinancial assets, includingproperty, plant and equipment and biological assets (breeding stocks), was made due to certainimpairment indicators primarily the declining financial performance of the Company. Fair valueless cost to sell assessment was made by management in 2013, 2012 and 2011, respectively, todetermine whether the carrying values of these assets are below its recoverable amounts. Based onmanagement’s evaluation and testing, there is no impairment loss on biological assets andproperty, plant and equipment in 2013, 2012 and 2011 (see Notes 7, 9, 10 and 11).
Recognizing deferred income tax assetsDeferred income tax assets are recognized for all temporary deductible differences, NOLCO andMCIT to the extent that it is probable that sufficient future taxable profits will be available toallow all or part of the deferred income tax assets to be utilized. The Company considered thedeferred income tax assets that will reverse on the same period as the deferred income taxliabilities. As of December 31, 2013 and 2012, no deferred income tax asset was recognized sincethe Company believes that there are no sufficient taxable profits against which the deductibletemporary differences, NOLCO and MCIT can be realized (see Note 21).
Estimating retirement benefits liability and costsThe cost of defined benefit pension plans, as well as the present value of the pension obligation is,determined using actuarial valuations. The actuarial valuation involves making variousassumptions. These include the determination of the discount rates and future salary increases.Due to the complexity of the valuation, the underlying assumptions and its long-term nature,defined benefit obligations are highly sensitive to changes in these assumptions. All significantassumptions are reviewed at each reporting date.
In determining the appropriate discount rate, management considers the interest rates ofgovernment bonds, adjusted to zero coupon rates, with term consistent with the obligation of theplan.
As of December 31, 2013 and 2012, the retirement benefits liability amounted to P=2.76 millionand P=25.31 million, respectively. Retirement benefits costs amounted to P=0.31 million,P=0.81 million and P=2.92 million in 2013, 2012 and 2011, respectively (see Note 20).
- 24 -
*SGVFS004567*
4. Cash and Cash Equivalents
2013 2012Cash on hand and in banks P=22,863 P=33,516Temporary cash investments 6,811 50,558
P=29,674 P=84,074
Cash in banks earn interest at the prevailing bank deposit rates. Temporary cash investments aremade for varying periods of up to three months depending on the immediate cash requirements ofthe Company. Interest earned amounted to P=0.30 million, P=0.64 million and P=0.08 million in 2013,2012 and 2011, respectively (see Note 18).
5. Receivables
2013 2012Trade - net of allowance for doubtful accounts of P=42,394 in 2013 and P=40,800 in 2012 P=769 P=2,715Employees - net of allowance for doubtful accounts of P=105 in 2013 and 2012 1,038 1,421Related parties - net of allowance for doubtful accounts of P=10,243 in 2013 and 2012 (Note 19) – –Nontrade receivables - net of allowance for
doubtful accounts of P=3,332 in 2013 and2012 (see Note 9) 12,760 153,217
P=14,567 P=157,353
Movements in the allowance for doubtful accounts of receivables individually determined to beimpaired are as follows:
As of December 31, 2013:
Trade EmployeesRelatedParties Nontrade Total
At January 1, 2013 P=40,800 P=105 P=10,243 P=3,332 P=54,480Provisions (reversal) (Note 16) 1,594 – – – 1,594At December 31, 2013 P=42,394 P=105 P=10,243 P=3,332 P=56,074
As of December 31, 2012:
Trade EmployeesRelatedParties Nontrade Total
At January 1, 2012 P=40,901 P=101 P=9,836 P=2,071 P=52,909Provisions (reversal) (Note 16) (101) 4 407 1,261 1,571At December 31, 2012 P=40,800 P=105 P=10,243 P=3,332 P=54,480
In 2013, the Company directly wrote-off non-trade receivables which amounted toP=23.21 million (see Note 16).

- 25 -
*SGVFS004567*
6. Inventories
2013 2012At cost: Raw materials- feeds and feeds ingredients P=903 P=973 Raw materials - medicine and vaccine 486 287 Packaging materials 149 261 Spare parts and others 68 46
P=1,606 P=1,567
There are no inventories carried at NRV as of December 31, 2013 and 2012.
7. Biological Assets
As of December 31, 2013 and 2012, biological assets amounted to P=3.62 million andP=4.94 million, respectively, which consist of growing stocks.
Changes in the carrying value of biological assets are as follows:
2013 2012At January 1 P=4,938 P=3,767Increase due to purchases 68,308 74,428Decrease due to harvest (69,279) (73,257)Decrease due to sales (343) –
P=3,624 P=4,938
As of December 31, 2013 and 2012, there are no outstanding breeding stocks (see Note 1). Theestimated physical quantities of the growing stocks are 48,174 and 61,753 units as of December 31,2013 and 2012, respectively.
The Company harvested approximately 0.81 million kilograms in 2013 and 0.93 millionkilograms in 2012. The fair value less estimated point-of-sale costs at the date of harvestamounted to P=66.81 million and P=73.53 million in 2013 and 2012, respectively.
8. Other Current Assets
2013 2012Creditable withholding tax P=17,072 P=17,081Rental deposits 170 252Others 22 39
17,264 17,372Less allowance for probable losses 17,000 17,000
P=264 P=372
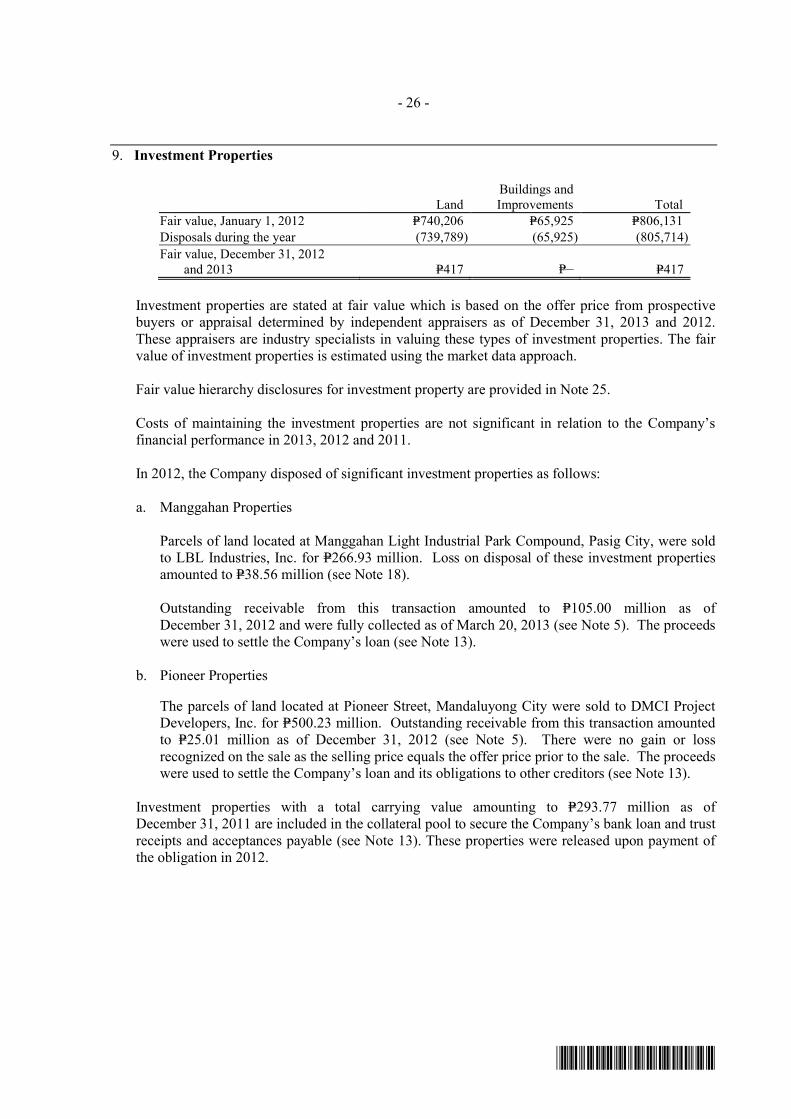
- 26 -
*SGVFS004567*
9. Investment Properties
LandBuildings andImprovements Total
Fair value, January 1, 2012 P=740,206 P=65,925 P=806,131Disposals during the year (739,789) (65,925) (805,714)Fair value, December 31, 2012
and 2013 P=417 P=– P=417
Investment properties are stated at fair value which is based on the offer price from prospectivebuyers or appraisal determined by independent appraisers as of December 31, 2013 and 2012.These appraisers are industry specialists in valuing these types of investment properties. The fairvalue of investment properties is estimated using the market data approach.
Fair value hierarchy disclosures for investment property are provided in Note 25.
Costs of maintaining the investment properties are not significant in relation to the Company’sfinancial performance in 2013, 2012 and 2011.
In 2012, the Company disposed of significant investment properties as follows:
a. Manggahan Properties
Parcels of land located at Manggahan Light Industrial Park Compound, Pasig City, were soldto LBL Industries, Inc. for P=266.93 million. Loss on disposal of these investment propertiesamounted to P=38.56 million (see Note 18).
Outstanding receivable from this transaction amounted to P=105.00 million as ofDecember 31, 2012 and were fully collected as of March 20, 2013 (see Note 5). The proceedswere used to settle the Company’s loan (see Note 13).
b. Pioneer Properties
The parcels of land located at Pioneer Street, Mandaluyong City were sold to DMCI ProjectDevelopers, Inc. for P=500.23 million. Outstanding receivable from this transaction amountedto P=25.01 million as of December 31, 2012 (see Note 5). There were no gain or lossrecognized on the sale as the selling price equals the offer price prior to the sale. The proceedswere used to settle the Company’s loan and its obligations to other creditors (see Note 13).
Investment properties with a total carrying value amounting to P=293.77 million as ofDecember 31, 2011 are included in the collateral pool to secure the Company’s bank loan and trustreceipts and acceptances payable (see Note 13). These properties were released upon payment ofthe obligation in 2012.

- 27 -
*SGVFS004567*
10. Property, Plant and Equipment
As of December 31, 2013:
OfficeSilos, Machinery Transportation Furniture,
Buildings and and and Delivery Fixtures andLand Improvements Equipment Equipment Equipment Total
CostAt January 1 and
December 31 P=107,841 P=28,733 P=43,529 P=2,288 P=84 P=182,475Accumulated Depreciation and ImpairmentAt January 1 – 28,733 43,529 2,004 84 74,350Depreciation (Note 17) – – – 284 – 284At December 31 – 28,733 43,529 2,288 84 74,634Net Book Values at
December 31 P=107,841 P=– P=– P=– P=– P=107,841
As of December 31, 2012:
OfficeSilos, Machinery Transportation Furniture,
Buildings and and and Delivery Fixtures andLand Improvements Equipment Equipment Equipment Total
CostAt January 1 P=171,754 P=77,082 P=72,011 P=2,480 P=84 P=323,411Disposals and retirements (63,913) (48,349) (28,482) (192) – (140,936)At December 31 107,841 28,733 43,529 2,288 84 182,475Accumulated Depreciation and ImpairmentAt January 1 – 77,082 72,011 1,514 84 150,691Depreciation (Note 17) – – – 682 – 682Disposals and retirements – (48,349) (28,482) (192) – (77,023)At December 31 – 28,733 43,529 2,004 84 74,350Net Book Values at December 31 P=107,841 P=– P=– P=284 P=– P=108,125
The cost of fully depreciated property, plant and equipment that are still used in operationsamounted to P=9.65 million and P=8.68 million as of December 31, 2013 and 2012, respectively.
Land with total carrying value of P=171.75 million as of December 31, 2011 were included in thecollateral pool to secure the Company’s bank loan and trust receipts and acceptances payable(see Note 13). The collateral was released in 2012 upon payment by the Company of itsobligations from which the properties were attached to.
In 2012, the Company disposed through dacion en pago various land and properties with a totalnet carrying value of P=64.17 million to settle outstanding liabilities amounting to P=193.39 million.Gain on disposal of the said assets amounted to P=129.22 million in 2012 (see Note 18).
11. Other Noncurrent Assets
2013 2012Software Cost At January 1 P=32,603 P=34,061 Disposal – (1,458) At December 31 32,603 32,603
(Forward)

- 28 -
*SGVFS004567*
2013 2012 Accumulated Depreciation At January 1 P=32,603 P=34,061 Disposal – (1,458) At December 31 32,603 32,603 Net book value at December 31 – –Input VAT, net of allowance for probable loss of P=630 in 2013 (nil in 2012) (Note 18) – –Others 255 255
P=255 P=255
12. Accounts Payable and Accrued Liabilities
2013
2012(As restated,
Note 2)Trade payables: Third parties P=20,611 P=93,526 Related parties (Note 19) 5,590 5,707Provisions (Note 27) 28,206 53,860Nontrade payables 11,097 16,584Payable to related parties (Note 19) 1,174 810Accrued liabilities 731 7,706Accrued personnel costs 460 1,122Capital gains tax payable (Note 9) – 12,412Others 193 –
P=68,062 P=191,727
Provision represents management’s best estimate of probable cost of claims arising from thenormal course of business that has been developed in consultation with the Company’s legalcounsel and is based upon an analysis of potential results. The information usually required byPAS 37, Provisions, Contingent Liabilities and Contingent Assets, is not disclosed as it mayprejudice the Company’s negotiation with the third party.
Movement in the provisions follows:
2013 2012At January 1 P=53,860 P=53,860Payments during the year (25,654) –
P=28,206 P=53,860
13. Bank Loan and Trust Receipts and Acceptances Payable
a. Bank loan, which amounted to P=98.10 million as of December 31, 2011, consisted of peso-denominated restructured promissory notes obtained from local banks with interest rate basedon bank’s prevailing rate at time of repricing (monthly interest repricing). Prior to 2012, theCompany had not been able to pay the principal payments and interest due thus, theoutstanding bank loan balance had been classified as current since 2008. The original

- 29 -
*SGVFS004567*
maturity of the loan was November 2010. This loan was fully settled on June 29, 2012 usingthe proceeds from sale of the Company’s investment properties (see Note 9).
The bank loan was secured by a collateral pool consisting of the Company’s parcels of land,buildings and improvements and machinery and equipment included under “Property, plantand equipment” and “Investment properties” accounts with a total carrying valueof P=477.24 million as of December 31, 2011 (see Notes 9 and 10). These properties werereleased in 2012 upon settlement by the Company of the obligations from which the propertieswere attached to. Interest and penalties incurred in 2012 and 2011 amounted to P=4.23 millionand P=33.79 million, respectively.
b. The trust receipts and acceptances payable, which amounted to P=98.87 million as ofDecember 31, 2011, were secured under the Mortgage Trust Indenture with local trustee banksby a collateral pool consisting of the Company’s parcels of land, buildings and improvementsand machinery and equipment included under “Property, plant and equipment” and“Investment properties” accounts with a total carrying value of P=477.24 million as ofDecember 31, 2011 (see Notes 9 and 10). The trust receipts and acceptances payable and itscorresponding interest and penalties payables were fully settled as of December 31, 2012using the proceeds from the sale of its investment properties (see Note 9). Interest andpenalties incurred in 2012 and 2011 amounted to P=6.37 million and P=25.98 million,respectively.
14. Equity
Capital StockIssued and outstanding preferred stock are held by 3,437 and 3,466 stockholders as ofDecember 31, 2013 and 2012, respectively. Issued and outstanding common stocks are held by7,479 and 7,559 stockholders as of December 31, 2013 and 2012, respectively.
In 2011, a preferred stockholder declared its preferred shares in the Company as property dividendto its stockholders, resulting in the increase in the number of the Company’s preferredstockholders.
Information on capital stock in 2013 and 2012 follows:
Number of shares 2013 2012Preferred stock - P=1 par value: Authorized shares 200,000,000 200,000,000 Issued shares 60,133,941 60,816,115 Outstanding shares 49,035,671 49,717,845Common stock - P=1 par value: Authorized shares 2,500,000,000 2,500,000,000 Issued and outstanding shares 1,814,416,883 1,807,595,143
In 2013 and 2012, some holders of preferred shares exercised their right to convert their 682,174and 35,714,326 preferred shares, respectively, into 6,821,740 and 357,143,260 common shares,respectively, based on the ratio of ten common shares for every one preferred share. Theconversion resulted in increase in common stock by P=6,821 and P=357,143 in 2013 and 2012,respectively. The conversion further resulted in the decrease in preferred stock of P=682 andP=35,714 in 2013 and 2012, respectively, and the related capital in excess of par value of preferredstock amounting to P=6,139 and P=321,429 in 2013 and 2012, respectively.
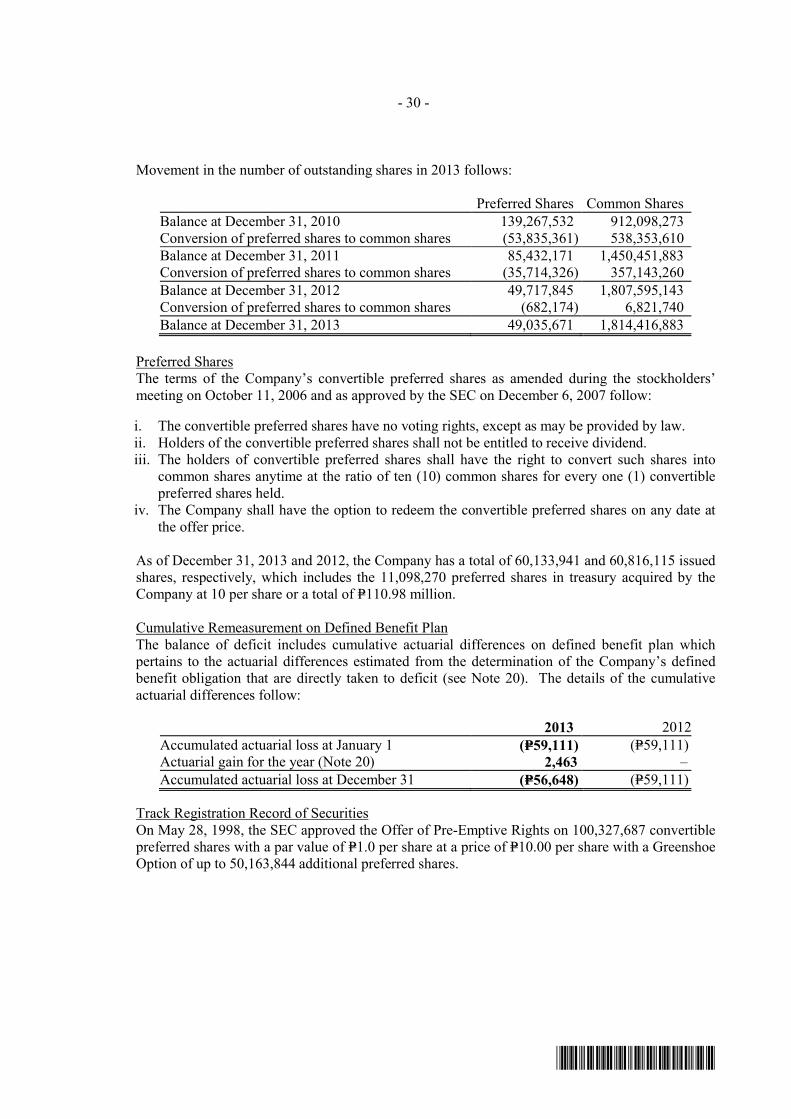
- 30 -
*SGVFS004567*
Movement in the number of outstanding shares in 2013 follows:
Preferred Shares Common SharesBalance at December 31, 2010 139,267,532 912,098,273Conversion of preferred shares to common shares (53,835,361) 538,353,610Balance at December 31, 2011 85,432,171 1,450,451,883Conversion of preferred shares to common shares (35,714,326) 357,143,260Balance at December 31, 2012 49,717,845 1,807,595,143Conversion of preferred shares to common shares (682,174) 6,821,740Balance at December 31, 2013 49,035,671 1,814,416,883
Preferred SharesThe terms of the Company’s convertible preferred shares as amended during the stockholders’meeting on October 11, 2006 and as approved by the SEC on December 6, 2007 follow:
i. The convertible preferred shares have no voting rights, except as may be provided by law.ii. Holders of the convertible preferred shares shall not be entitled to receive dividend.iii. The holders of convertible preferred shares shall have the right to convert such shares into
common shares anytime at the ratio of ten (10) common shares for every one (1) convertiblepreferred shares held.
iv. The Company shall have the option to redeem the convertible preferred shares on any date atthe offer price.
As of December 31, 2013 and 2012, the Company has a total of 60,133,941 and 60,816,115 issuedshares, respectively, which includes the 11,098,270 preferred shares in treasury acquired by theCompany at 10 per share or a total of P=110.98 million.
Cumulative Remeasurement on Defined Benefit PlanThe balance of deficit includes cumulative actuarial differences on defined benefit plan whichpertains to the actuarial differences estimated from the determination of the Company’s definedbenefit obligation that are directly taken to deficit (see Note 20). The details of the cumulativeactuarial differences follow:
2013 2012Accumulated actuarial loss at January 1 (P=59,111) (P=59,111)Actuarial gain for the year (Note 20) 2,463 –Accumulated actuarial loss at December 31 (P=56,648) (P=59,111)
Track Registration Record of SecuritiesOn May 28, 1998, the SEC approved the Offer of Pre-Emptive Rights on 100,327,687 convertiblepreferred shares with a par value of P=1.0 per share at a price of P=10.00 per share with a GreenshoeOption of up to 50,163,844 additional preferred shares.

- 31 -
*SGVFS004567*
On June 24, 1998, the Philippine Stock Exchange approved the listing of the following shares ofthe Company:
a. 100,327,687 convertible preferred shares, with a par value of P=1.00 per share, to cover the 1:8preemptive rights offering to stockholders as of the proposed record date of July 15, 1998, atan offer price of P=10.0 per share;
b. 50,163,844 convertible preferred shares, with a par value of P=1.00 per share, to cover theGreenshoe option shares granted to stockholders as of the proposed record date of July 15,1998, at an offer price of P=10.0 per share;
c. 1,504,915,310 common shares, with a par value of P=1.0 per share, to cover the underlyingshares of the convertible preferred shares.
15. Cost of Goods Sold
2013 2012 2011Raw materials used (Note 6) P=55,970 P=57,965 P=197,010Freight and handling 7,593 7,942 15,291Supplies and facilities 3,762 3,135 17,255Outside services 3,036 2,904 48,352Rental 1,525 973 2,630Personnel costs (Notes 17 and 20) 783 637 10,088Taxes and licenses 333 271 3,530Insurance 254 258 1,325Communication, light and water 221 137 7,873Repairs and maintenance 101 124 3,104Depreciation and amortization (Note 17) – – 1,310Others 579 563 6,368
P=74,157 P=74,909 P=314,136
16. General and Administrative Expenses
2013 2012 2011Bad debts expense (Note 5) P=23,206 P=– P=–Taxes and licenses 18,322 37,220 3,541Outside services 7,617 6,053 4,164Personnel costs (Notes 17 and 20) 6,083 15,491 13,260Provision for doubtful accounts (Note 5) 1,594 1,571 –Communication, light and water 625 1,016 921Transportation and travel 435 491 1,022Depreciation and amortization (Note 17) 284 682 797Rental (Note 19) 239 207 1,146Insurance 184 323 516Repairs and maintenance 150 133 361Supplies and facilities 90 418 529Bank charges 21 774 789Advertising and promoting 9 9 264Others 239 2,003 1,669
P=59,098 P=66,391 P=28,979

- 32 -
*SGVFS004567*
17. Selling and Marketing Expenses
2013 2012 2011Rental P=370 P=255 P=307Repairs and maintenance 285 190 164Communication, light and water 249 215 3,331Outside services 226 351 2,039Transportation and travel 148 180 500Supplies and facilities 90 142 1,510Taxes and licenses 4 – 6Personnel costs (Note 20) 1 8 5,461Freight and handling – – 2,375Depreciation and amortization – – 685Others 1 29 56
P=1,374 P=1,370 P=16,434
Depreciation and amortization expenses charged to cost of goods sold, general and administrativeand selling and marketing expenses pertain to:
2013 2012 2011Property, plant and equipment (Note 10) P=284 P=682 P=2,567Software (Note 11) – – 225
P=284 P=682 P=2,792
Depreciation and amortization expenses were booked under:
2013 2012 2011Cost of goods sold (Note 15) P=– P=– P=1,310General and administrative expenses
(Note 16) 284 682 797Selling and marketing expenses – – 685
P=284 P=682 P=2,792
Personnel costs pertain to:
2013 2012 2011Salaries and wages P=6,555 P=15,331 P=25,894Retirement benefits costs (Note 20) 312 805 2,915
P=6,867 P=16,136 P=28,809
Personnel costs were booked under:
2013 2012 2011General and administrative expenses (Note 16) P=6,083 P=15,491 P=13,260Cost of goods sold (Note 15) 783 637 10,088Selling and marketing expenses 1 8 5,461
P=6,867 P=16,136 P=28,809

- 33 -
*SGVFS004567*
18. Other Income - Net
2013 2012 2011Reversal of provision (provision) for
probable losses (Notes 8 and 11) (P=652) P=3 P=–Rental income 479 5,633 10,617Interest income (Note 5) 304 636 8Gain (loss) on disposal of: Land (Note 10) – 129,223 – Investment property (Note 9) – (38,563) –Reversal of payables and accruals – 58,836 47,759Fair value gain (loss) on investment properties (Note 9) – – (35,511)Impairment loss on property, plant and
equipment (Note 10) – – (13,132)Reversal of allowance for doubtful accounts (Note 5) – – 5,161Foreign exchange gain – net – – 43Others 3 3,744 2
P=134 P=159,512 P=14,947
In 2011, the Company performed a detailed analysis of its accounts pertaining to the Luzonoperations in line with the resting of its production. This exercise resulted in the recognition ofgain on reversal of payables and accruals which amounted to P=47.76 million that no longer meetthe definition of a liability.
In 2012, gain on reversal of payables and accruals include accrued interest and penalties whichamounted to P=49.89 million as a result of waived penalties on bank loan and discounts granted bycreditors which amounted to P=8.94 million.
19. Related Party Transactions
Related party relationships exist when the party has the ability to control, directly or indirectly,through one or more intermediaries, or exercise significant influence over the other party inmaking financial and operating decisions. Such relationships also exist between and/or amongentities which are under common control with the reporting entity and its key managementpersonnel, directors or stockholders. In considering each possible related party relationship,attention is directed to the substance of the relationships, and not merely to the legal form.
The Company has transactions with related parties which consist mainly of the following:
2013:
Related Party Category Amount
OutstandingBalance ofReceivable(Payable)
Terms andConditions
Entities under commonmajor shareholder group:
Invest Asia Corporation Rent and utilities (P=9) (P=5,570) On demand, non-interest bearing,unsecured
(Forward)
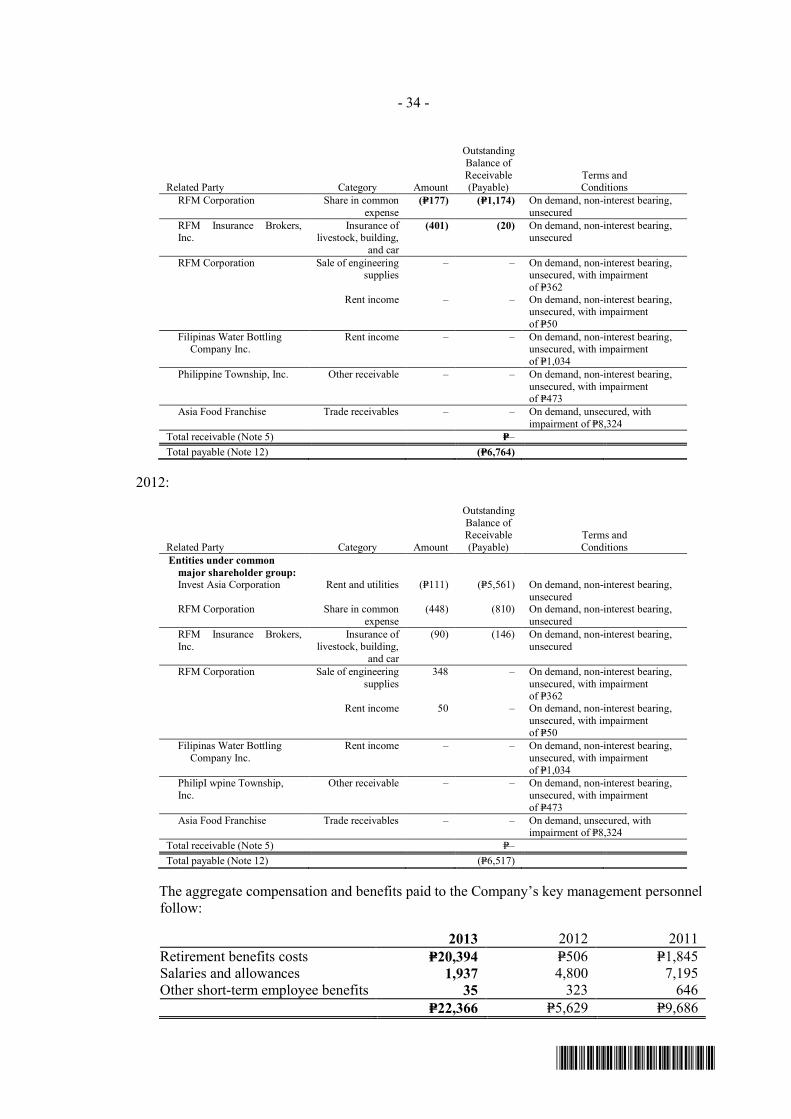
- 34 -
*SGVFS004567*
Related Party Category Amount
OutstandingBalance ofReceivable(Payable)
Terms andConditions
RFM Corporation Share in commonexpense
(P=177) (P=1,174) On demand, non-interest bearing,unsecured
RFM Insurance Brokers,Inc.
Insurance oflivestock, building,
and car
(401) (20) On demand, non-interest bearing,unsecured
RFM Corporation Sale of engineeringsupplies
– – On demand, non-interest bearing,unsecured, with impairmentof P=362
Rent income – – On demand, non-interest bearing,unsecured, with impairmentof P=50
Filipinas Water Bottling Company Inc.
Rent income – – On demand, non-interest bearing,unsecured, with impairmentof P=1,034
Philippine Township, Inc. Other receivable – – On demand, non-interest bearing,unsecured, with impairmentof P=473
Asia Food Franchise Trade receivables – – On demand, unsecured, withimpairment of P=8,324
Total receivable (Note 5) P=–Total payable (Note 12) (P=6,764)
2012:
Related Party Category Amount
OutstandingBalance ofReceivable(Payable)
Terms andConditions
Entities under commonmajor shareholder group:
Invest Asia Corporation Rent and utilities (P=111) (P=5,561) On demand, non-interest bearing,unsecured
RFM Corporation Share in commonexpense
(448) (810) On demand, non-interest bearing,unsecured
RFM Insurance Brokers,Inc.
Insurance oflivestock, building,
and car
(90) (146) On demand, non-interest bearing,unsecured
RFM Corporation Sale of engineeringsupplies
348 – On demand, non-interest bearing,unsecured, with impairmentof P=362
Rent income 50 – On demand, non-interest bearing,unsecured, with impairmentof P=50
Filipinas Water Bottling Company Inc.
Rent income – – On demand, non-interest bearing,unsecured, with impairmentof P=1,034
PhilipI wpine Township,Inc.
Other receivable – – On demand, non-interest bearing,unsecured, with impairmentof P=473
Asia Food Franchise Trade receivables – – On demand, unsecured, withimpairment of P=8,324
Total receivable (Note 5) P=–Total payable (Note 12) (P=6,517)
The aggregate compensation and benefits paid to the Company’s key management personnelfollow:
2013 2012 2011Retirement benefits costs P=20,394 P=506 P=1,845Salaries and allowances 1,937 4,800 7,195Other short-term employee benefits 35 323 646
P=22,366 P=5,629 P=9,686
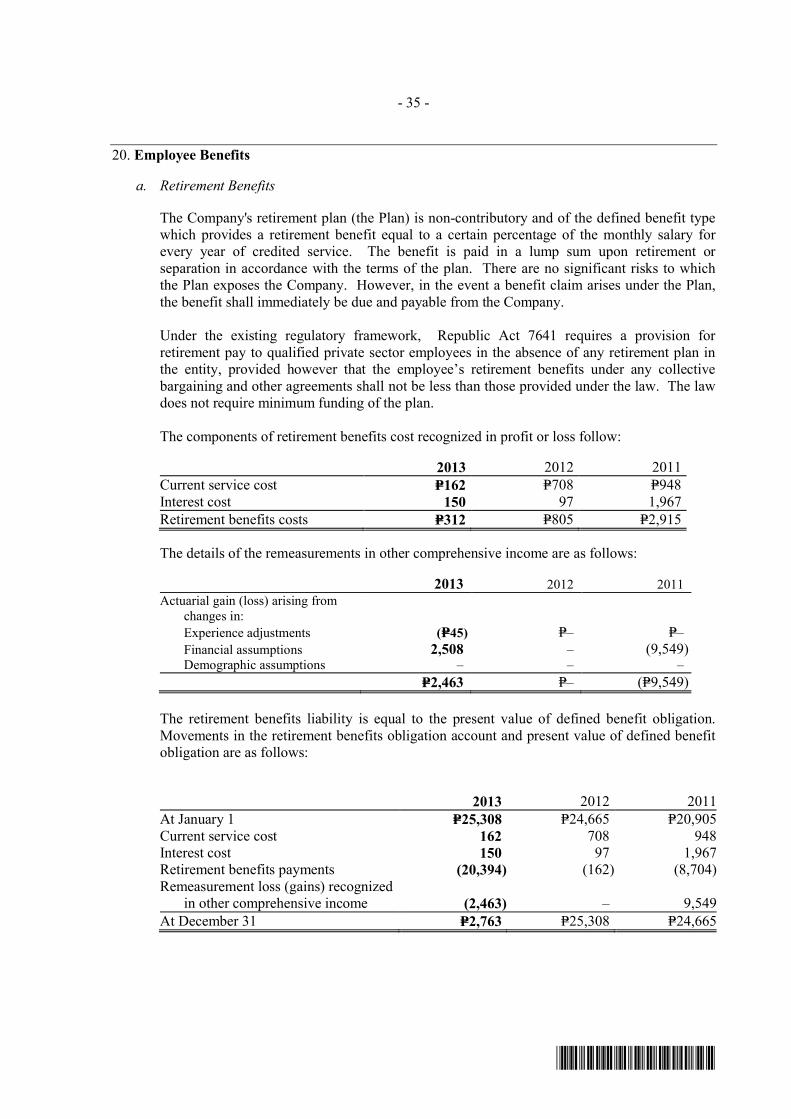
- 35 -
*SGVFS004567*
20. Employee Benefits
a. Retirement Benefits
The Company's retirement plan (the Plan) is non-contributory and of the defined benefit typewhich provides a retirement benefit equal to a certain percentage of the monthly salary forevery year of credited service. The benefit is paid in a lump sum upon retirement orseparation in accordance with the terms of the plan. There are no significant risks to whichthe Plan exposes the Company. However, in the event a benefit claim arises under the Plan,the benefit shall immediately be due and payable from the Company.
Under the existing regulatory framework, Republic Act 7641 requires a provision forretirement pay to qualified private sector employees in the absence of any retirement plan inthe entity, provided however that the employee’s retirement benefits under any collectivebargaining and other agreements shall not be less than those provided under the law. The lawdoes not require minimum funding of the plan.
The components of retirement benefits cost recognized in profit or loss follow:
2013 2012 2011Current service cost P=162 P=708 P=948Interest cost 150 97 1,967Retirement benefits costs P=312 P=805 P=2,915
The details of the remeasurements in other comprehensive income are as follows:
2013 2012 2011Actuarial gain (loss) arising from
changes in: Experience adjustments (P=45) P=– P=–
Financial assumptions 2,508 – (9,549) Demographic assumptions – – –
P=2,463 P=– (P=9,549)
The retirement benefits liability is equal to the present value of defined benefit obligation.Movements in the retirement benefits obligation account and present value of defined benefitobligation are as follows:
2013 2012 2011At January 1 P=25,308 P=24,665 P=20,905Current service cost 162 708 948Interest cost 150 97 1,967Retirement benefits payments (20,394) (162) (8,704)Remeasurement loss (gains) recognized in other comprehensive income (2,463) – 9,549At December 31 P=2,763 P=25,308 P=24,665

- 36 -
*SGVFS004567*
The principal assumptions used to determine retirement benefits cost and obligation are asfollows:
2013 2012 2011Discount rate 5.52% 1.81% 9.41%Salary increase 2.00% – 5.00%
Sensitivity analysis of the present value of defined benefit obligation as of December 31, 2013to changes in assumptions follows:
Movement
Increase (decrease) inpresent value of defined
benefit obligation
Percentageincrease
(decrease)Discount rate +100 basis points (P=378) (13.70%)
-100 basis points 32 1.20%Salary rate +100 basis points 12 0.40%
-100 basis points (364) (13.20%)
Shown below is the maturity analysis of the undiscounted benefit payments:
Expected benefit PercentagePayable on financial year
2014 P=– 0%2015 434 36%2016 759 64%
P=1,193 100%
The average duration of the defined benefit obligation at the end of the reporting period is9.6 years.
b. Other employee benefits
Employees can accumulate earned leave credits, which can be used anytime when needed bythe employee or converted to cash, computed based on the employee’s final rate uponseparation (i.e., resignation or retirement). Accumulated leave credits are presented as “Otheremployee benefits” which amounted to P=0.89 million and P=0.95 million as of December 31,2013 and 2012, respectively.
21. Income Taxes
a. The provision for current income tax represents the MCIT in 2013, 2012 and 2011.
b. The components of the Company’s net deferred income tax liabilities follow:
2013 2012Deferred income tax liabilities on:
Deemed cost adjustment on land under property and equipment P=32,112 P=32,112
Unrealized foreign exchange gain – net 45 45Net deferred income tax liabilities P=32,157 P=32,157
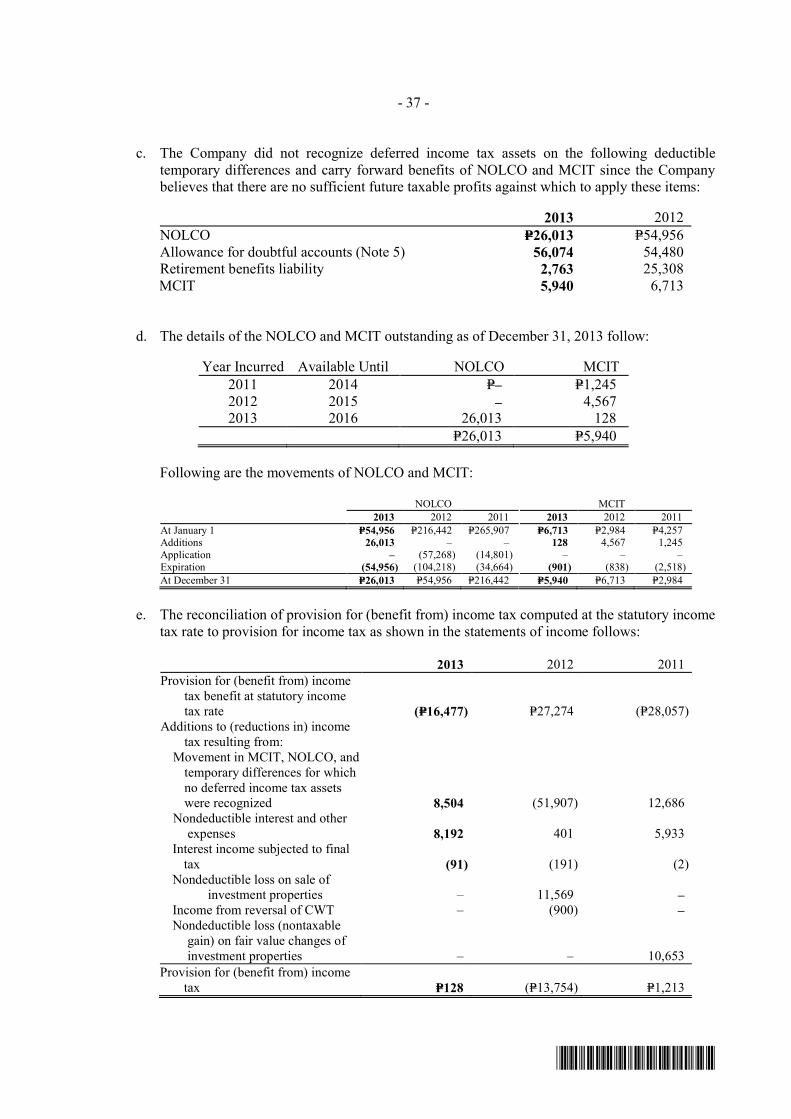
- 37 -
*SGVFS004567*
c. The Company did not recognize deferred income tax assets on the following deductibletemporary differences and carry forward benefits of NOLCO and MCIT since the Companybelieves that there are no sufficient future taxable profits against which to apply these items:
2013 2012NOLCO P=26,013 P=54,956Allowance for doubtful accounts (Note 5) 56,074 54,480Retirement benefits liability 2,763 25,308MCIT 5,940 6,713
d. The details of the NOLCO and MCIT outstanding as of December 31, 2013 follow:
Year Incurred Available Until NOLCO MCIT2011 2014 P=– P=1,2452012 2015 – 4,5672013 2016 26,013 128
P=26,013 P=5,940
Following are the movements of NOLCO and MCIT:
NOLCO MCIT2013 2012 2011 2013 2012 2011
At January 1 P=54,956 P=216,442 P=265,907 P=6,713 P=2,984 P=4,257Additions 26,013 – – 128 4,567 1,245Application – (57,268) (14,801) – – –Expiration (54,956) (104,218) (34,664) (901) (838) (2,518)At December 31 P=26,013 P=54,956 P=216,442 P=5,940 P=6,713 P=2,984
e. The reconciliation of provision for (benefit from) income tax computed at the statutory incometax rate to provision for income tax as shown in the statements of income follows:
2013 2012 2011Provision for (benefit from) income
tax benefit at statutory incometax rate (P=16,477) P=27,274 (P=28,057)
Additions to (reductions in) incometax resulting from:
Movement in MCIT, NOLCO, andtemporary differences for whichno deferred income tax assetswere recognized 8,504 (51,907) 12,686
Nondeductible interest and otherexpenses 8,192 401 5,933
Interest income subjected to finaltax (91) (191) (2)
Nondeductible loss on sale of investment properties – 11,569 –
Income from reversal of CWT – (900) – Nondeductible loss (nontaxable
gain) on fair value changes ofinvestment properties – – 10,653
Provision for (benefit from) incometax P=128 (P=13,754) P=1,213

- 38 -
*SGVFS004567*
22. Basic and Diluted Earnings (Loss) Per Share
Basic/diluted earnings (loss) per share are computed as follows:
2013 2012 2011Net income (loss) attributable to
common stockholders (P=55,050) P=104,668 (P=94,735)Divided by weighted average
number of common stock 1,811,006,013 1,629,023,513 1,038,823,700Basic/diluted earnings (loss) per
share (P=0.03) P=0.06 (P=0.09)
The effect of convertible preferred shares is antidilutive for 2013, 2012 and 2011. Accordingly,the basic and dilutive earnings per share presented are the same.
23. Operating Segment Information
The Company only has one reportable segment - poultry business - which is its only activity.
The Company has only one geographical segment as all of its assets are located in the Philippines.The Company operates and derives principally all of its revenue from domestic operations. Thusgeographical business operation is not required.
Operating results of the Company is regularly reviewed by the Company’s BOD for the purpose ofmaking decisions about resource allocation and performance assessment. Segment assets,liabilities and revenue and expenses are measured in accordance with PFRS. The presentation andclassification of segment revenue and expenses are consistent with the statements of income. Thepresentation and classification of segment assets and liabilities are consistent with the balancesheets.
Segment information are as follows:
2013 2012 2011Segment revenue P=79,573 P=84,672 P=312,260Segment net income (loss) (55,050) 104,668 (94,735)Total assets 158,248 357,101 1,029,032Total liabilities 103,874 250,138 1,026,737Total revenue 79,573 84,672 312,260
In 2013, revenue from local agricultural produce amounting to P=44.33 million and representing56.28% was derived from two customers. In 2012 and 2011, the Company does not have acustomer for which 10% or more of the revenue were derived from.
24. Financial Risk Management Objectives and Policies
The Company’s principal financial instruments consist of cash and cash equivalents, tradereceivables, due from related parties, due from employees, rental deposits, trust receipts andacceptances payable and bank loan. The main purpose of these financial instruments is to ensureadequate funds for the Company’s operations and capital expansion. The Company has other
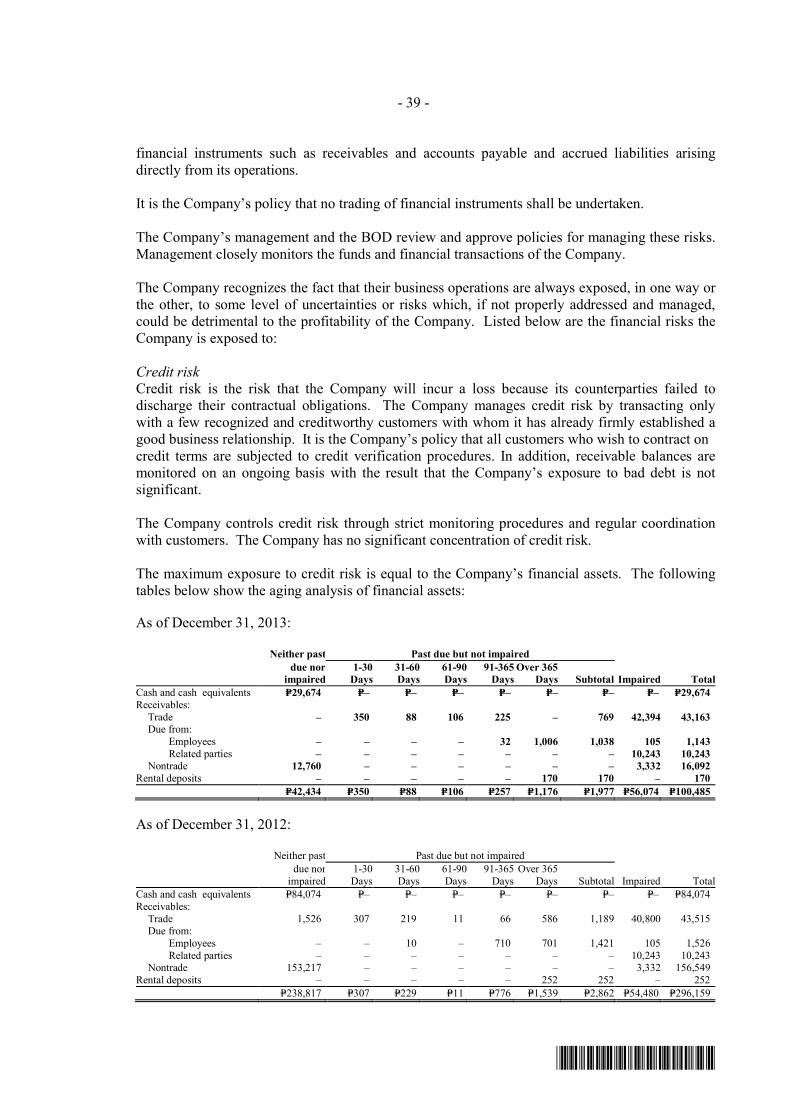
- 39 -
*SGVFS004567*
financial instruments such as receivables and accounts payable and accrued liabilities arisingdirectly from its operations.
It is the Company’s policy that no trading of financial instruments shall be undertaken.
The Company’s management and the BOD review and approve policies for managing these risks.Management closely monitors the funds and financial transactions of the Company.
The Company recognizes the fact that their business operations are always exposed, in one way orthe other, to some level of uncertainties or risks which, if not properly addressed and managed,could be detrimental to the profitability of the Company. Listed below are the financial risks theCompany is exposed to:
Credit riskCredit risk is the risk that the Company will incur a loss because its counterparties failed todischarge their contractual obligations. The Company manages credit risk by transacting onlywith a few recognized and creditworthy customers with whom it has already firmly established agood business relationship. It is the Company’s policy that all customers who wish to contract oncredit terms are subjected to credit verification procedures. In addition, receivable balances aremonitored on an ongoing basis with the result that the Company’s exposure to bad debt is notsignificant.
The Company controls credit risk through strict monitoring procedures and regular coordinationwith customers. The Company has no significant concentration of credit risk.
The maximum exposure to credit risk is equal to the Company’s financial assets. The followingtables below show the aging analysis of financial assets:
As of December 31, 2013:
Neither past Past due but not impaireddue nor
impaired1-30
Days31-60Days
61-90Days
91-365Days
Over 365Days Subtotal Impaired Total
Cash and cash equivalents P=29,674 P=– P=– P=– P=– P=– P=– P=– P=29,674Receivables: Trade – 350 88 106 225 – 769 42,394 43,163 Due from: Employees – – – – 32 1,006 1,038 105 1,143 Related parties – – – – – – – 10,243 10,243 Nontrade 12,760 – – – – – – 3,332 16,092Rental deposits – – – – – 170 170 – 170
P=42,434 P=350 P=88 P=106 P=257 P=1,176 P=1,977 P=56,074 P=100,485
As of December 31, 2012:
Neither past Past due but not impaireddue nor
impaired1-30Days
31-60Days
61-90Days
91-365Days
Over 365Days Subtotal Impaired Total
Cash and cash equivalents P=84,074 P=– P=– P=– P=– P=– P=– P=– P=84,074Receivables: Trade 1,526 307 219 11 66 586 1,189 40,800 43,515 Due from: Employees – – 10 – 710 701 1,421 105 1,526 Related parties – – – – – – – 10,243 10,243 Nontrade 153,217 – – – – – – 3,332 156,549Rental deposits – – – – – 252 252 – 252
P=238,817 P=307 P=229 P=11 P=776 P=1,539 P=2,862 P=54,480 P=296,159

- 40 -
*SGVFS004567*
The following tables summarize the credit quality of the Company’s financial assets.
As of December 31, 2013:
Neither past due nor impairedHigh grade Standard Grade Total
Cash and cash equivalents P=29,674 P=– P=29,674Nontrade receivables – 12,760 12,760
P=29,674 P=12,760 P=42,434
As of December 31, 2012:
Neither past due nor impairedHigh grade Standard Grade Total
Cash and cash equivalents P=84,074 P=– P=84,074Receivables: Trade – 1,526 1,526 Nontrade – 153,217 153,217
P=84,074 P=154,743 P=238,817
Cash and cash equivalents are classified as High grade since these are deposited and invested withreputable banks and can be withdrawn anytime.
High grade receivables pertain to those receivables from clients or customers that consistently paybefore the maturity date. Standard grade includes receivables that are collected on their due dateseven without an effort from the Company to follow them up. Past due receivables and advancesinclude those that are past due but are still collectible. The majority of these past due receivablesare not considered to be impaired.
Liquidity riskLiquidity risk is the risk that the Company will not be able to meet its obligations when they fallunder normal and stress circumstances. To limit risk, the Company manages its liquid fundsthrough cash planning on a monthly and weekly basis. The Company uses historical figures andexperiences and forecasts from its collections and disbursements, as well as projections based onthe annual business plan. Likewise, the Company places excess funds in short-term cashinvestments. The Company also enters into restructuring agreements with creditor banks, as theneed arises. In 2012, the Company disposed of its investment properties to settle its obligations.
The table below summarizes the Company’s maturity profile of financial assets held for managingliquidity and maturity profile of financial liabilities based on contractual undiscounted obligations.
As of December 31, 2013:
On Less than 3 to 12Demand 3 months months 3 Total
Loans and receivables: Cash and cash equivalents P=29,674 P=– P=– P=29,674 Receivables: Trade – 544 225 769 Due from employees – 32 1,006 1,038 Nontrade – – 12,760 12,760Total financial assets 29,674 576 13,991 44,241
(Forward)
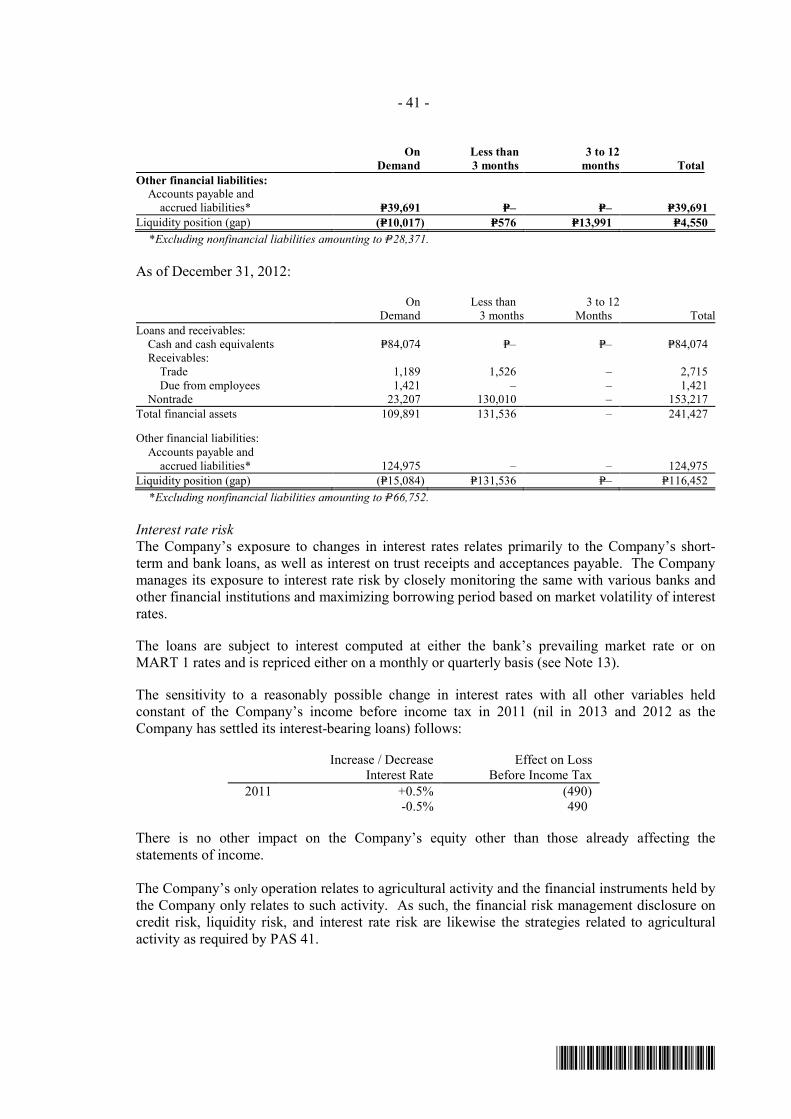
- 41 -
*SGVFS004567*
On Less than 3 to 12Demand 3 months months 3 Total
Other financial liabilities: Accounts payable and accrued liabilities* P=39,691 P=– P=– P=39,691Liquidity position (gap) (P=10,017) P=576 P=13,991 P=4,550
*Excluding nonfinancial liabilities amounting to P=28,371.
As of December 31, 2012:
On Less than 3 to 12Demand 3 months Months 3 Total
Loans and receivables: Cash and cash equivalents P=84,074 P=– P=– P=84,074 Receivables: Trade 1,189 1,526 – 2,715 Due from employees 1,421 – – 1,421 Nontrade 23,207 130,010 – 153,217Total financial assets 109,891 131,536 – 241,427
Other financial liabilities: Accounts payable and accrued liabilities* 124,975 – – 124,975Liquidity position (gap) (P=15,084) P=131,536 P=– P=116,452
*Excluding nonfinancial liabilities amounting to P=66,752.
Interest rate riskThe Company’s exposure to changes in interest rates relates primarily to the Company’s short-term and bank loans, as well as interest on trust receipts and acceptances payable. The Companymanages its exposure to interest rate risk by closely monitoring the same with various banks andother financial institutions and maximizing borrowing period based on market volatility of interestrates.
The loans are subject to interest computed at either the bank’s prevailing market rate or onMART 1 rates and is repriced either on a monthly or quarterly basis (see Note 13).
The sensitivity to a reasonably possible change in interest rates with all other variables heldconstant of the Company’s income before income tax in 2011 (nil in 2013 and 2012 as theCompany has settled its interest-bearing loans) follows:
Increase / Decrease Interest Rate
Effect on LossBefore Income Tax
2011 +0.5% (490)-0.5% 490
There is no other impact on the Company’s equity other than those already affecting thestatements of income.
The Company’s only operation relates to agricultural activity and the financial instruments held bythe Company only relates to such activity. As such, the financial risk management disclosure oncredit risk, liquidity risk, and interest rate risk are likewise the strategies related to agriculturalactivity as required by PAS 41.
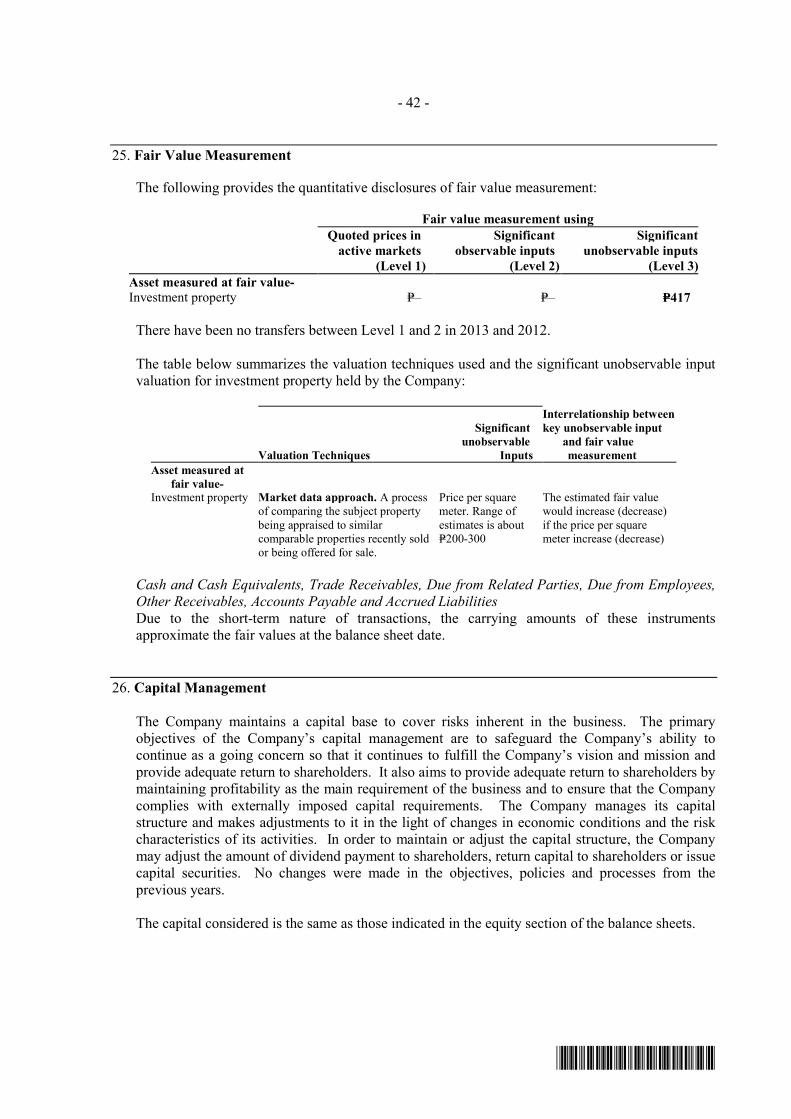
- 42 -
*SGVFS004567*
25. Fair Value Measurement
The following provides the quantitative disclosures of fair value measurement:
Fair value measurement usingQuoted prices in
active markets(Level 1)
Significantobservable inputs
(Level 2)
Significantunobservable inputs
(Level 3)Asset measured at fair value-Investment property P=– P=– P=417
There have been no transfers between Level 1 and 2 in 2013 and 2012.
The table below summarizes the valuation techniques used and the significant unobservable inputvaluation for investment property held by the Company:
Valuation Techniques
Significantunobservable
Inputs
Interrelationship betweenkey unobservable input
and fair valuemeasurement
Asset measured atfair value-
Investment property Market data approach. A processof comparing the subject propertybeing appraised to similarcomparable properties recently soldor being offered for sale.
Price per squaremeter. Range ofestimates is aboutP=200-300
The estimated fair valuewould increase (decrease)if the price per squaremeter increase (decrease)
Cash and Cash Equivalents, Trade Receivables, Due from Related Parties, Due from Employees,Other Receivables, Accounts Payable and Accrued LiabilitiesDue to the short-term nature of transactions, the carrying amounts of these instrumentsapproximate the fair values at the balance sheet date.
26. Capital Management
The Company maintains a capital base to cover risks inherent in the business. The primaryobjectives of the Company’s capital management are to safeguard the Company’s ability tocontinue as a going concern so that it continues to fulfill the Company’s vision and mission andprovide adequate return to shareholders. It also aims to provide adequate return to shareholders bymaintaining profitability as the main requirement of the business and to ensure that the Companycomplies with externally imposed capital requirements. The Company manages its capitalstructure and makes adjustments to it in the light of changes in economic conditions and the riskcharacteristics of its activities. In order to maintain or adjust the capital structure, the Companymay adjust the amount of dividend payment to shareholders, return capital to shareholders or issuecapital securities. No changes were made in the objectives, policies and processes from theprevious years.
The capital considered is the same as those indicated in the equity section of the balance sheets.

- 43 -
*SGVFS004567*
27. Other Matters
The Company, in the normal course of business, is involved in certain claims, the outcome ofwhich are presently not determinable. In the opinion of management and its legal counsel, theCompany has strong legal basis on the cases, and the liability on these lawsuits, if any, will nothave a material effect on the financial statements. For those cases where management, inconsultation with the legal counsel, believes that the Company may eventually be obligated tosettle, accruals have been made in the financial statements (see Note 12).
28. Note to Statements of Cash Flows
In 2013 and 2012, the Company’s noncash financing activity pertains to the conversion ofpreferred shares to common shares which amounted to P=6.82 million and P=357.14 million,respectively.
In 2012, the non-cash investing activity pertains to disposal of property and equipment throughdacion en pago which amounted to P=64.17 million.
29. Supplementary Information Required Under Revenue Regulations 15-2010
In compliance with RR 15-2010 issued by the BIR on November 25, 2010, mandating alltaxpayers to disclose information on taxes, duties and licenses paid and accrued during the taxableyear, summarized below are the taxes paid and accrued during the year:
The following information reflects the taxes, duties and license fees paid or accrued by theCompany during 2013:
a. Net Sales/Receipts and Output VAT declared in the Company’s VAT returns filed for theperiod.
Net Sales/Receipt Output VATVatable sales P=153 P=18Zero rated sales 78,775 –
P=78,928 P=18
b. Input VAT
The following table shows the sources of input VAT claimed:
Beginning balance P=–Purchases of: Goods for resale 320 Services lodged under cost of goods sold and general and administrative expenses 1,122Total 1,442Less: Input VAT allocated to exempt sales 794 Input VAT claimed as deduction against output VAT 18Ending balance P=630

- 44 -
*SGVFS004567*
c. The taxes, duties and license fees paid or accrued in 2013 follow:
Business taxes P=6,487Deficiency taxes 5,523Capital gains tax 5,189Real property tax 914Community tax certificate 11Registration fee and others 535
P=18,659
d. The withholding taxes paid or accrued in 2013 are categorized into:
Withholding tax on compensation P=2,366Expanded withholding tax 1,211
e. Tax cases
As of December 31, 2013, the Company has an outstanding tax assessment before the Court ofTax Appeals involving P=11.95 million deficiency value-added tax for taxable year 2007,which is being contested by the Company.

*SGVFS004567*
INDEPENDENT AUDITORS’ REPORTON SUPPLEMENTARY SCHEDULES
The Stockholders and the Board of DirectorsSwift Foods, Inc.RFM Corporate CenterCorner Pioneer and Sheridan StreetsMandaluyong City
We have audited in accordance with Philippine Standards on Auditing, the accompanying financialstatements of Swift Foods, Inc. as at December 31, 2013 and 2012 and for each of the three years inthe period ended December 31, 2013, included in this Form 17-A, and have issued our report thereondated April 28, 2014. Our audits were made for the purpose of forming an opinion on the basicfinancial statements taken as a whole. The schedules listed in the Index to the Financial Statementsand Supplementary Schedules are the responsibility of the Company’s management. These schedulesare presented for purposes of complying with Securities Regulation Code Rule 68, As Amended(2011), and are not part of the basic financial statements. These schedules have been subjected to theauditing procedures applied in the audit of the basic financial statements and, in our opinion, fairlystate in all material respects the information required to be set forth therein in relation to the basicfinancial statements taken as a whole.
SYCIP GORRES VELAYO & CO.
Djole S. GarciaPartnerCPA Certificate No. 0097907SEC Accreditation No. 1285-A (Group A), February 25, 2013, valid until February 24, 2016Tax Identification No. 201-960-347BIR Accreditation No. 08-001998-102-2013, January 28, 2013, valid until January 27, 2016PTR No. 4225176, January 2, 2014, Makati City
April 28, 2014
SyCip Gorres Velayo & Co.6760 Ayala Avenue1226 Makati CityPhilippines
Tel: (632) 891 0307Fax: (632) 819 0872ey.com/ph
BOA/PRC Reg. No. 0001, December 28, 2012, valid until December 31, 2015SEC Accreditation No. 0012-FR-3 (Group A), November 15, 2012, valid until November 16, 2015
A member firm of Ernst & Young Global Limited

*SGVFS004567*
SWIFT FOODS, INC.INDEX TO THE FINANCIAL STATEMENTS ANDSUPPLEMENTARY SCHEDULESDECEMBER 31, 2013
Schedule I: Schedule of All the Effective Standards and Interpretations (Part 1, 4J)Schedule II: Schedule of Retained Earnings Available for Dividend Declaration (Part 1, 4C, Annex 68-C)

*SGVFS004567*
SCHEDULE ISWIFT FOODS, INC.SUPPLEMENTARY SCHEDULE OF ALL THE EFFECTIVESTANDARDS AND INTERPRETATIONS (PART 1, 4J)
PHILIPPINE FINANCIAL REPORTING STANDARDS ANDINTERPRETATIONSEffective as of December 31, 2013 Adopted
NotEarly
AdoptedNot
Applicable
Framework for the Preparation and Presentation of Financial StatementsConceptual Framework Phase A: Objectives and qualitative characteristics 4
PFRSs Practice Statement Management Commentary 4
Philippine Financial Reporting Standards
PFRS 1 (Revised) First-time Adoption of Philippine Financial ReportingStandards 4
Amendments to PFRS 1 and PAS 27: Cost of an Investmentin a Subsidiary, Jointly Controlled Entity or Associate 4
Amendments to PFRS 1: Additional Exemptions for First-time Adopters 4
Amendment to PFRS 1: Limited Exemption fromComparative PFRS 7 Disclosures for First-time Adopters 4
Amendments to PFRS 1: Severe Hyperinflation and Removalof Fixed Date for First-time Adopters 4
Amendments to PFRS 1: Government Loans 4
PFRS 2 Share-based Payment 4
Amendments to PFRS 2: Vesting Conditions andCancellations 4
Amendments to PFRS 2: Group Cash-settled Share-basedPayment Transactions 4
PFRS 3 (Revised) Business Combinations 4
PFRS 4 Insurance Contracts 4
Amendments to PAS 39 and PFRS 4: Financial GuaranteeContracts 4
PFRS 5 Non-current Assets Held for Sale and DiscontinuedOperations 4
PFRS 6 Exploration for and Evaluation of Mineral Resources 4
PFRS 7 Financial Instruments: Disclosures 4
Amendments to PAS 39 and PFRS 7: Reclassification ofFinancial Assets 4
Amendments to PAS 39 and PFRS 7: Reclassification ofFinancial Assets - Effective Date and Transition 4
Amendments to PFRS 7: Improving Disclosures aboutFinancial Instruments 4
Amendments to PFRS 7: Disclosures - Transfers of FinancialAssets 4
Amendments to PFRS 7: Disclosures – Offsetting FinancialAssets and Financial Liabilities 4

- 2 -
*SGVFS004567*
PHILIPPINE FINANCIAL REPORTING STANDARDS ANDINTERPRETATIONSEffective as of December 31, 2013 Adopted
NotEarly
AdoptedNot
Applicable
Amendments to PFRS 7: Mandatory Effective Date of PFRS9 and Transition Disclosures 4
PFRS 8 Operating Segments 4
PFRS 9 Financial Instruments 4
Amendments to PFRS 9: Mandatory Effective Date ofPFRS 9 and Transition Disclosures 4
PFRS 10 Consolidated Financial Statements 4
Amendments to PFRS 10: Investment Entities 4
PFRS 11 Joint Arrangements 4
PFRS 12 Disclosure of Interests in Other Entities 4
Amendments to PFRS 12: Investment Entities
PFRS 13 Fair Value Measurement 4
Philippine Accounting Standards
PAS 1 (Revised) Presentation of Financial Statements 4
Amendment to PAS 1: Capital Disclosures 4
Amendments to PAS 32 and PAS 1: Puttable FinancialInstruments and Obligations Arising on Liquidation 4
Amendments to PAS 1: Presentation of Items of OtherComprehensive Income 4
PAS 2 Inventories 4
PAS 7 Statement of Cash Flows 4
PAS 8 Accounting Policies, Changes in Accounting Estimates andErrors 4
PAS 10 Events after the Reporting Period 4
PAS 11 Construction Contracts 4
PAS 12 Income Taxes 4
Amendment to PAS 12 - Deferred Tax: Recovery ofUnderlying Assets 4
PAS 16 Property, Plant and Equipment 4
PAS 17 Leases 4
PAS 18 Revenue 4
PAS 19 (Amended) Employee Benefits 4
Amendments to PAS 19: Defined Benefit Plans: EmployeeContributions 4
PAS 20 Accounting for Government Grants and Disclosure ofGovernment Assistance 4
PAS 21 The Effects of Changes in Foreign Exchange Rates 4
Amendment: Net Investment in a Foreign Operation 4
PAS 23 (Revised) Borrowing Costs 4
PAS 24 (Revised) Related Party Disclosures 4
PAS 26 Accounting and Reporting by Retirement Benefit Plans 4
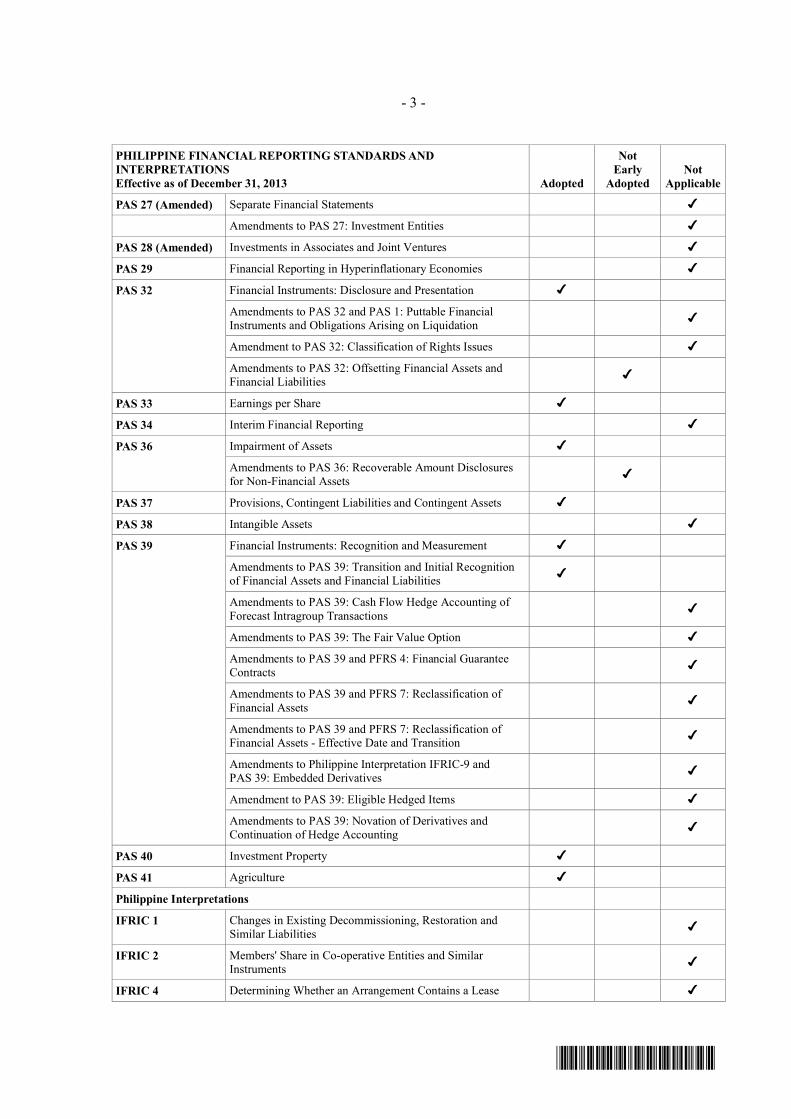
- 3 -
*SGVFS004567*
PHILIPPINE FINANCIAL REPORTING STANDARDS ANDINTERPRETATIONSEffective as of December 31, 2013 Adopted
NotEarly
AdoptedNot
Applicable
PAS 27 (Amended) Separate Financial Statements 4
Amendments to PAS 27: Investment Entities 4
PAS 28 (Amended) Investments in Associates and Joint Ventures 4
PAS 29 Financial Reporting in Hyperinflationary Economies 4
PAS 32 Financial Instruments: Disclosure and Presentation 4
Amendments to PAS 32 and PAS 1: Puttable FinancialInstruments and Obligations Arising on Liquidation 4
Amendment to PAS 32: Classification of Rights Issues 4
Amendments to PAS 32: Offsetting Financial Assets andFinancial Liabilities 4
PAS 33 Earnings per Share 4
PAS 34 Interim Financial Reporting 4
PAS 36 Impairment of Assets 4
Amendments to PAS 36: Recoverable Amount Disclosuresfor Non-Financial Assets 4
PAS 37 Provisions, Contingent Liabilities and Contingent Assets 4
PAS 38 Intangible Assets 4
PAS 39 Financial Instruments: Recognition and Measurement 4
Amendments to PAS 39: Transition and Initial Recognitionof Financial Assets and Financial Liabilities 4
Amendments to PAS 39: Cash Flow Hedge Accounting ofForecast Intragroup Transactions 4
Amendments to PAS 39: The Fair Value Option 4
Amendments to PAS 39 and PFRS 4: Financial GuaranteeContracts 4
Amendments to PAS 39 and PFRS 7: Reclassification ofFinancial Assets 4
Amendments to PAS 39 and PFRS 7: Reclassification ofFinancial Assets - Effective Date and Transition 4
Amendments to Philippine Interpretation IFRIC-9 andPAS 39: Embedded Derivatives 4
Amendment to PAS 39: Eligible Hedged Items 4
Amendments to PAS 39: Novation of Derivatives andContinuation of Hedge Accounting 4
PAS 40 Investment Property 4
PAS 41 Agriculture 4
Philippine Interpretations
IFRIC 1 Changes in Existing Decommissioning, Restoration andSimilar Liabilities 4
IFRIC 2 Members' Share in Co-operative Entities and SimilarInstruments 4
IFRIC 4 Determining Whether an Arrangement Contains a Lease 4

- 4 -
*SGVFS004567*
PHILIPPINE FINANCIAL REPORTING STANDARDS ANDINTERPRETATIONSEffective as of December 31, 2013 Adopted
NotEarly
AdoptedNot
Applicable
IFRIC 5 Rights to Interests arising from Decommissioning,Restoration and Environmental Rehabilitation Funds 4
IFRIC 6 Liabilities arising from Participating in a Specific Market -Waste Electrical and Electronic Equipment 4
IFRIC 7 Applying the Restatement Approach under PAS 29 FinancialReporting in Hyperinflationary Economies 4
IFRIC 9 Reassessment of Embedded Derivatives 4
Amendments to Philippine Interpretation IFRIC-9 andPAS 39: Embedded Derivatives 4
IFRIC 10 Interim Financial Reporting and Impairment 4
IFRIC 12 Service Concession Arrangements 4
IFRIC 13 Customer Loyalty Programmes 4
IFRIC 14 The Limit on a Defined Benefit Asset, Minimum FundingRequirements and their Interaction 4
Amendments to Philippine Interpretations IFRIC- 14,Prepayments of a Minimum Funding Requirement 4
IFRIC 16 Hedges of a Net Investment in a Foreign Operation 4
IFRIC 17 Distributions of Non-cash Assets to Owners 4
IFRIC 18 Transfers of Assets from Customers 4
IFRIC 19 Extinguishing Financial Liabilities with Equity Instruments 4
IFRIC 20 Stripping Costs in the Production Phase of a Surface Mine 4
IFRIC 21 Levies 4
SIC-7 Introduction of the Euro 4
SIC-10 Government Assistance - No Specific Relation to OperatingActivities 4
SIC-15 Operating Leases - Incentives 4
SIC-25 Income Taxes - Changes in the Tax Status of an Entity or itsShareholders 4
SIC-27 Evaluating the Substance of Transactions Involving the LegalForm of a Lease 4
SIC-29 Service Concession Arrangements: Disclosures 4
SIC-31 Revenue - Barter Transactions Involving AdvertisingServices 4
SIC-32 Intangible Assets - Web Site Costs 4
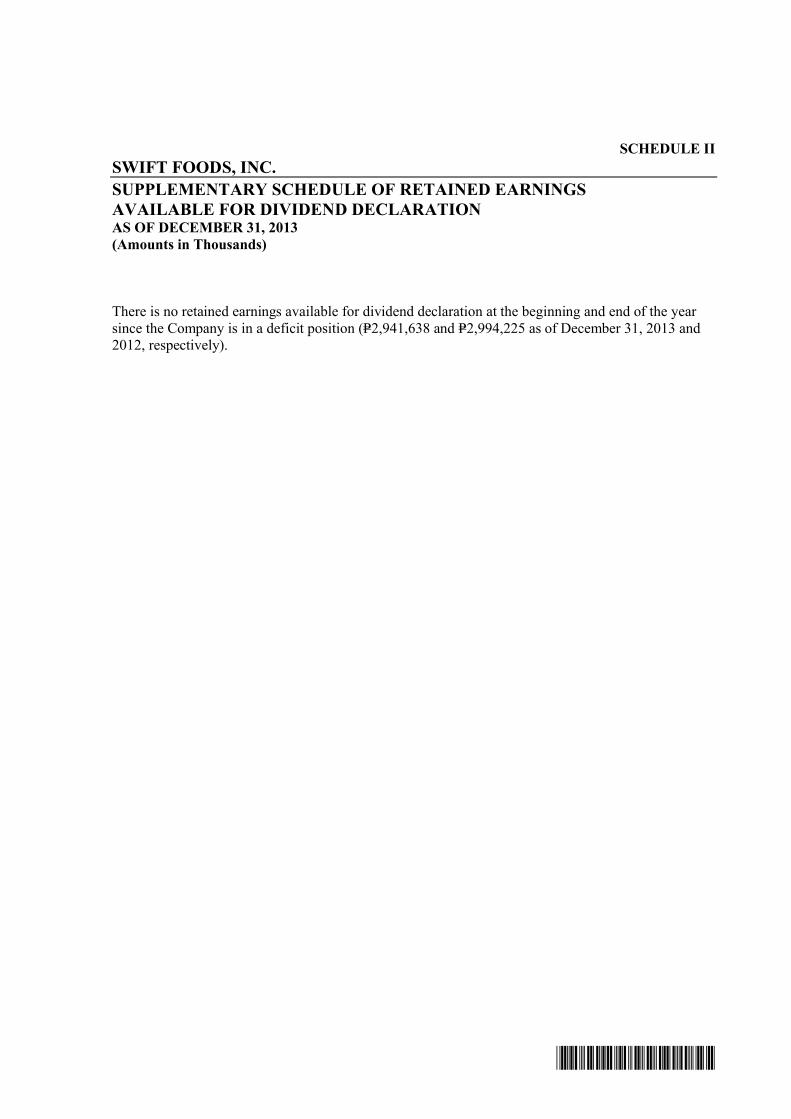
*SGVFS004567*
SCHEDULE IISWIFT FOODS, INC.SUPPLEMENTARY SCHEDULE OF RETAINED EARNINGSAVAILABLE FOR DIVIDEND DECLARATIONAS OF DECEMBER 31, 2013(Amounts in Thousands)
There is no retained earnings available for dividend declaration at the beginning and end of the yearsince the Company is in a deficit position (P=2,941,638 and P=2,994,225 as of December 31, 2013 and2012, respectively).
SWIFT FOODS, INC.SCHEDULE A - FINANCIAL ASSETS
FOR THE YEAR ENDED DECEMBER 31, 2013
Number of shares or Amount Valued based onName of Issuing entity principal amount of shown in the market quotation Income receivedand description of Investment bond and notes Additions balance sheet at balance sheet and accrued
date
*The Company has no financial assets that needs to be disclosed.
NOT APPLICABLE*

SWIFT FOODS, INC.SCHEDULE B - AMOUNTS RECEIVABLE FROM DIRECTORS, OFFICERS, EMPLOYEES, RELATED PARTIES AND
PRINCIPAL STOCKHOLDERS (OTHER THAN RELATED PARTIES)
FOR THE YEAR ENDED DECEMBER 31, 2013
Amounts AmountsName and designation of debtor Beginning Balance Additions Collected Written off Current Not Current Ending Balance
* The Company has no directors, officers, employees, and principal stockholders (other than related parties) from whom an aggregate indebtedness of more than P100,000 or one per cent of total assets, whichever is less, is owed
NOT APPLICABLE*

SWIFT FOODS, INC.
SCHEDULE C - AMOUNTS RECEIVABLE FROM RELATED RELATED PARTIES WHICH ARE ELIMINATED DURING THE CONSOLIDATION OF FINANCIAL STATEMENTS
FOR THE YEAR ENDED DECEMBER 31, 2013
*The Company is not part of any conglomerate thus there is no consolidation and the financial statements submitted is a stand-alone financial statement.
Not Current Balance at end of the period
Name and Designation of
Debtor
Balance at beginning of period Additions Amounts collected Amounts written off Current
NOT APPLICABLE*
SWIFT FOODS, INC.SCHEDULE D - INTANGIBLE ASSETS - OTHER ASSETS
FOR THE YEAR ENDED DECEMBER 31, 2013
Additions Charged to Charged toDescription Beginning Balance at cost cost and expense other accounts Other changes Ending Balance
* The Company has no intangible assets as of December 31, 2012.
NOT APPLICABLE*

SWIFT FOODS, INC.SCHEDULE E - LONG-TERM DEBT
DECEMBER 31, 2013
Amount Authorized Amount Shown Amount ShownTitle of Issuer and Type of Obligation by Indenture as Current as Long-Term Remarks
*The Company has no long term debt as all debts are due and demandable for the year ended December 31, 2012.
NOT APPLICABLE*
SWIFT FOODS, INC.SCHEDULE F - INDEBTEDNESS TO AFFILIATES AND RELATED PARTIES
FOR THE YEAR ENDED DECEMBER 31, 2013
Name of Affiliate Beginning Balance Ending Balance
*The Company has no noncurrent indebtedness to affiliates and related parties for the year ended December 31, 2012.
NOT APPLICABLE*

SWIFT FOODS, INC.SCHEDULE G - GUARANTEES OF SECURITIES OF OTHER ISSUERS
DECEMBER 31, 2013
Name of issuing entity of Title of issue of Total amount Amount owedsecurities guaranteed by the each class of guarantted and by person for Naturecompany for which this statement securities outstanding which statement of is filed guaranteed is filed guarantee
NOT APPLICABLE

SWIFT FOODS, INC.SCHEDULE H - CAPITAL STOCK
DECEMBER 31, 2013
Number of Shares Number of Shares Held ByReserved for
Number of Number of Options, Warrants,Shares Shares Issued Conversions, Directors, Officers
Title of Issue Authorized and Outstanding and Other Rights Affiliates and Employees Others
PREFRRED STOCK 200,000,000 49,035,671 0 0 0 0
COMMON STOCK 2,500,000,000 1,814,416,883 0 0 1,434,474 1,812,982,409