Embed Size (px)
Citation preview
SGEM Research Report D6.10.4 Jarkko Tiirikainen Jukka Saarenpää Harri Niska
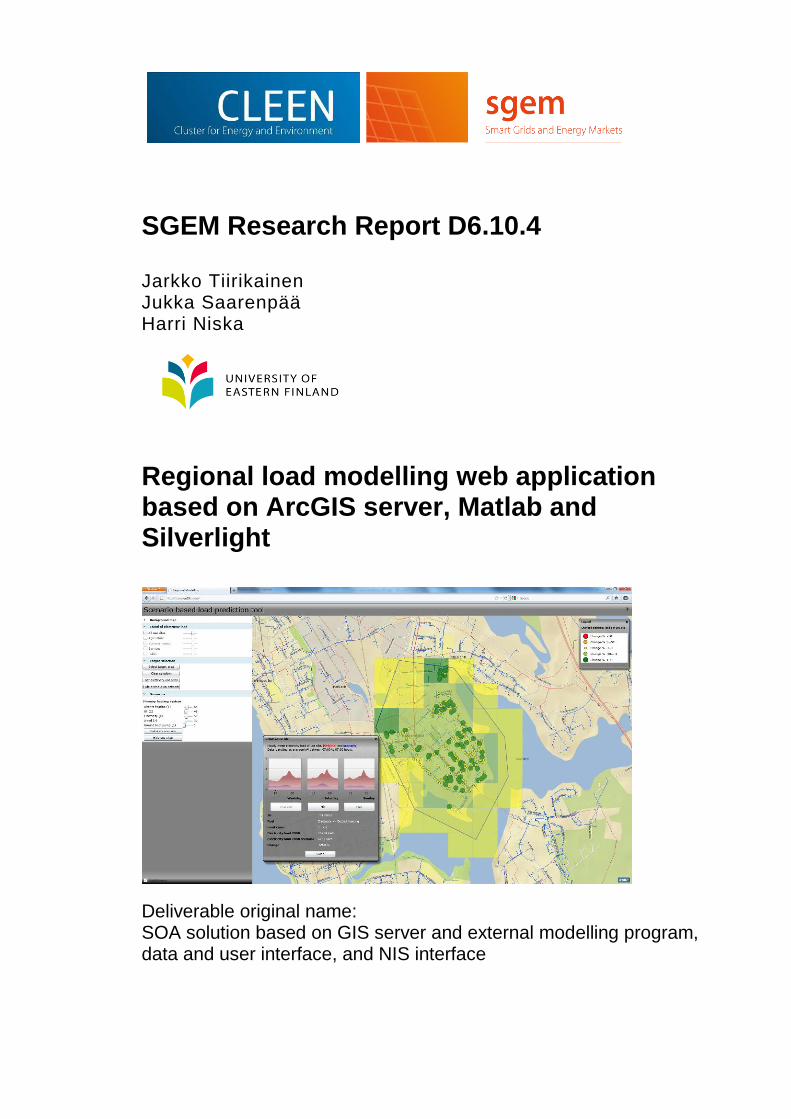
Regional load modelling web application based on ArcGIS server, Matlab and Silverlight
Deliverable original name: SOA solution based on GIS server and external modelling program, data and user interface, and NIS interface
SGEM report D6.10.4 WP6 Task 10 Network analysis and planning mehtods
1
Abstract
The report summarizes the technical work related to the 2nd SGEM funding
period, WP6.10 (Network analysis and planning methods). The main objective
has been to investigate the possibilities and integrity issues related to the use of
external data in new types of computational approaches and services for
strategic network planning.
Based on that work, a technical demonstration based on ArcGIS Server, Matlab
and Silverlight web application framework is presented. It represents a novel
solution for building up user-defined regional heating system scenarios for
executing hourly based load predictions and for assessing scenarios using the
map-based interface.
The research activities were performed in parallel with WP6.1 (Next generation
ICT-solutions for network management) and WP4.2.1 (Novel load modelling
methods).
SGEM report D6.10.4 WP6 Task 10 Network analysis and planning mehtods
2
Table of contents
Preface ........................................................................................................... 3
1 Motivation ................................................................................................ 5
2 Possibilities of external (public sector) data ........................................ 7
2.1 Data sources ..................................................................................................... 7
2.2 Terms of usage and legislative trends ............................................................ 7
3 Common standards for data exchange ................................................. 9
3.1 Common Information Model ............................................................................ 9
3.1.1 IEC 61970 ...................................................................................................... 9
3.1.2 IEC 61968 .................................................................................................... 10
3.2 Other standards .............................................................................................. 10
3.2.1 Web Map Service (OGC WMS) .................................................................... 10
3.2.2 Web Feature Service (OGC WFS) ............................................................... 11
3.3 Processing services ....................................................................................... 11
3.3.1 Web Processing Service (OGC WPS) .......................................................... 11
3.3.2 ArcGIS Geoprocessing Service .................................................................... 12
4 DSO data and system integration ........................................................ 13
4.1 Network Information System, NIS.................................................................. 13
4.2 Customer Information System, CIS ............................................................... 14
4.3 System integration ......................................................................................... 14
4.3.1 Point-to-point integration .............................................................................. 14
4.3.2 ESB architecture .......................................................................................... 15
5 Regional modelling as a tool for strategic planning of electricity
networks ................................................................................................ 17
5.1 The main components .................................................................................... 17
5.2 The web-based regional modelling tool ........................................................ 18
5.3 Architectural considerations ......................................................................... 20
6 Conclusions ........................................................................................... 22
7 References ............................................................................................. 23

SGEM report D6.10.4 WP6 Task 10 Network analysis and planning mehtods
3
Preface
The work presented in this report is part of the project Smart Grids and Energy
Marketing (SGEM). The SGEM project belongs to Cluster of Energy and
Environment (CLEEN), financed by Finnish Funding Agency for Technology and
Innovation, TEKES industrial partners, universities, and research institutes.
We wish to thank the funding organizations and the steering group of SGEM
programme for making this work possible to carry out.
The authors
SGEM report D6.10.4 WP6 Task 10 Network analysis and planning mehtods
4
Abbreviations
CIM Common Information Model
CIS Customer Information System
DER Distributed Energy Resource
DG Distributed Generation
DSO Distribution System Operator
DSS Decision Support System
ESB Enterprise Service Bus
GIS Geographic Information System
NIS Network Information System
SOA Service Oriented Architecture
WPS Web Processing Service
SGEM report D6.10.4 WP6 Task 10 Network analysis and planning mehtods
5
1 Motivation
New computational approaches and services, which better utilize the possibilities
of IT and external (public sector) data sources, are needed in management and
planning of Smart Grids. Whenever the methods and tools are developed, they
should be user-friendly, understandable and computationally powerful, enabling
interactive functionalities for end-users.
From strategic planning point of view, the assessment of regional loads and their
long term development is a relevant question, and can be used as a
representative test case for piloting new computational approaches and services
based on regional data. Over the years, multitudes of methods have been used
for predicting regional (or spatial) electricity load, covering various temporal and
spatial scale, i.e., short, medium or long term forecasts on neighbourhood,
municipal or national scale [1]. In strategic planning of the grid, the estimation of
the future needs must be made on long term. This can mean predictions
spanning from 1 to even 30 years ahead. Most of the models, however, are
developed for short or medium term forecasts which better server daily or weekly
management decisions [2]. Intuitively a conclusion can be drawn that, the longer
time span a prediction covers, the more uncertainty it involves.
Usually models try to forecast the future quantitatively. These include
computationally intelligent (CI) methods such as artificial neural networks, fuzzy
logic and genetic algorithms, among others [3-4]. However, they are criticized for
their poor performance on long term forecasting. The results of pure quantitative
methods have been particularly unsatisfactory in cases where there are
complicated and surprising phenomena of the society involved [5].
One way of controlling the inherent uncertainty that is always present when
making predictions or forecasts is to analyze various possible decisions, events
and their consequences more closely. Scenario analysis is a technique that fills
this requirement. Scenarios are alternative views of possible future events and
their outcomes. It is different from predicting and forecasting in that the aim is not
to produce only one correct outcome but to present many different alternatives by
analyzing possible future prospects. Scenarios stress especially uncertainties
which are not controllable. Thereby it is possible to better take into consideration
the new unknown factors that a pure statistics-based model could never
anticipate. Many long term forecasts are done by taking into account different
scenarios but to really harness the full potential of the approach it should be
possible to quickly and conveniently produce a series of “what if?” –type
experiments. This way scenario analysis can be more of an everyday tool.
SGEM report D6.10.4 WP6 Task 10 Network analysis and planning mehtods
6
Moreover, the scenarios should be applied to the variables that are most
uncertain.
Often the modelling of load growth as a whole is not based on realistic regional
estimates. For example, two commonly used NIS in Finnish electricity companies
consider the load growth via global growth percentage which affects all the use
sites and regions equally. [6], [7]. In reality the load growth can have high
geographical variation and without considering the changes on more specific
regional level the modelling error can be significant.
Economists have been using techniques labelled as geo-demographic analysis
to classify people to segments by their socio-spatial characteristics. The theory of
geo-demographics is based on a notion that knowing where someone lives
provides useful information about how someone lives. There exists some
relationship between people and places and between individuals and who they
regularly meet. The renowned and widely accepted Tobler’s first law of
geography also suggests that:”Everything is related to everything else, but near
things are more related than distant things”. [8] Thus the spatial dimension
should not be dismissed when modelling the consumer behaviour.
In the strategic planning, the modelling of new Smart Grid related components
and their regional adoption (e.g. PHEV/EV, heat pumps, solar panels) is
essential, remembering that they have a significant influence on the patterns and
the magnitude of electricity loads at regional level. Being able to estimate at what
rate and in what areas the new Smart Grid related components are being
adopted has a potential not only to guarantee the uninterrupted delivery of
electricity but also to gain significant financial savings. The benefits are evident
for DSOs but, as a consequence, the effect is likely to be seen also in the
consumer electricity distribution prices.
In this report, the possibilities of external data, overview on DSO data and
system integration and common standards for data exchange are first shortly
reviewed. This is followed by the presentation of the concept of regional
modelling for load prediction. In this context, the technical issues, including
especially data integration/interfaces, are considered. The general vision has
been in ideating new type computational approaches and services, that can be
used to support decision-making related to the planning of the grids.
SGEM report D6.10.4 WP6 Task 10 Network analysis and planning mehtods
7
2 Possibilities of external (public sector) data
The external data sources provide interesting possibilities for several operations
of the electricity sector. Utilization of the data however requires addressing
several restrictions the data and data sources impose. This chapter lists briefly
such data sources and their general problems.
2.1 Data sources
A range of available external data sources exist, which can be exploited for many
purposes, in parallel NIS/CIS databases, in the management and planning of the
grids. Following the list included in SGEM Research Report D1.2 (2011), the
most promising public sector data sources in Finland include:
Population register centre, Building and dwelling register
Statistics Finland, Grid database
Finnish meteorological institute, Temperature statistics and forecasts
Finnish transport safety agency, Vehicular and driver data register
Ministry of agriculture and forestry, Agricultural statistics and registers
Finnish environment institute, CORINE land use data
Finnish environment institute and the regional councils, Regional land
usage plans
National land survey of Finland, SLICES land usage information
In broad line, these datasets include regional specific geographic information
about socio-economic and environmental factors, the latter representing
heterogeneous data from various physical, biological and built environments.
Such regional information could be of significant use to the strategic planning of
the grids.
2.2 Terms of usage and legislative trends
The exploitation of the data are restricted in many ways, which can be seen to be
due to: (i) data protection and security (privacy issues), (ii) data resolution (often
related to privacy issues), (iii) terms and pricing policy for research and
commercial purposes and (iv) technical issues (e.g. data interfaces).
SGEM report D6.10.4 WP6 Task 10 Network analysis and planning mehtods
8
The general trend is globally that the data produced by public funding are
opening for research and commercial purposes. This is mainly due to its
significant value on information content. As on example, in Europe, the value of
the public sector data has been estimated to be approx. 27 billion euros [9]. In
EU level, there are INSPIRE and PSI Directives (2003/98/EC) which mainly
define common legislative frameworks for release and use of public sector data.
However, until now, the Directives have not enabled significant re-use the data. A
significant obstacle in this has been that the public sector is allowed to use
information disposition pricing to cover their short-term costs. The situation is
however going about to change. The European Comission is preparing
significant changes to the PSI Directive until 2013. Furthermore, there are
significant national-level initiatives and decisions under work. For instance, in
Finland a decision in principle has been given by the Council of the State, which
aims at releasing the data free of charge.
SGEM report D6.10.4 WP6 Task 10 Network analysis and planning mehtods
9
3 Common standards for data exchange
Standard information models are needed for efficient management of information
across different systems. Many companies in the electric sector use different
systems side by side. Integrating these separate systems brings obvious benefits
but without standard information model, the integration process can be very
complex and costly operation. This chapter covers the industry standards for
information handling and processing
3.1 Common Information Model
Electrical power industry has adopted Common Information Model (CIM) to be
used as a general model for various applications. CIM is defined as industry
standard by International Electrotechnical Commission (IEC). The purpose of
CIM in the electric grid context is to allow different applications to exchange
information about configuration and status of thel network. [10]
In IT-product level, CIM is still in very early phase at 2011. Software providers for
electricity industry do not have all the needed functionality implemented for all the
software to work via standard interfaces.
3.1.1 IEC 61970
The IEC 61970 is an abstract data model for electricity network operations. This
series of standards defines application program for energy management systems
(EMS). These standards include guidelines for integration of applications
developed by different suppliers into the control centre environment. Also the
exchange of information between external IT-systems and the control centre
environment is described. This includes systems dealing transmission,
distribution and generation which are external to the control centre, but need to
exchange real-time data with it. Interfaces for communication between new and
legacy systems are described as well.
The IEC 61970 series of standards is originally developed for needs of
transmission system operators. The standard that defines the core packages of
the CIM is IEC 61970-301.
SGEM report D6.10.4 WP6 Task 10 Network analysis and planning mehtods
10
3.1.2 IEC 61968
The IEC 61968 is a series of standards under development that will define
standards for information exchanges between electrical distribution systems. This
series of standards extends CIM to be used also with distribution system
operators.
IEC 61968 defines following packages:
Common
WiresExt
Assets
AssetModels
Work
Customers
Metering
LoadControl
Payment Metering
3.2 Other standards
Computing environments are currently moving towards service based approach
for both data and processing. For GIS-data there are two widely used standards
maintained by Open GIS Consortium (OGC), namely OGC WMS and OGC WFS.
3.2.1 Web Map Service (OGC WMS)
Web Map Service (WMS) provides standard way for serving spatial raster data in
network environments. WMS is mainly used for providing background maps and
application specific map layers for web applications. WMS can be also used to
provide any georeferenced images over web. WMS specification includes two
requests that any WMS server has to respond. GetCababilities –request returns
basic information and metadata about service. GetMap –request is used to
retrieve actual map image.[11]
There are several web map server implementations that respect WMS standard.
On open source projects WMS is used without exception. During the last years
also commercial server developers have enabled WMS in their map services.[11]
SGEM report D6.10.4 WP6 Task 10 Network analysis and planning mehtods
11
3.2.2 Web Feature Service (OGC WFS)
Web Feature Service provides interface for requesting spatial data across
networks. Difference to WMS is feature/vector data instead of raster/imagery
data. Geography Markup Language (GML) is most often used for payload
encoding in WFS responses. In WFS specification three required operations are
listed. GetCapabilities requests metadata about the service itself in a same
manner as in WMS. GetFeature-request performs the actual query and returns
encoded feature or featureset. DescribeFeatureType returns XML Schema for
client to be able to process resultset.[12]
3.3 Processing services
3.3.1 Web Processing Service (OGC WPS)
Web Processing Service (OGC WPS) is a definition for requesting data
manipulation operations across network. WPS is originally designed for
interfacing GIS tools and algorithms on server side from a client application. In
addition, WPS can be used to publish interface to any calculation process.
Subject and data does not need to be in spatial context. WPS only sets rules for
calculation inputs and outputs. It does not describe how calculations are
performed.[13]
In GIS context, WPS allows both vector and raster data to be exchanged in
requests and responses. WPS requests can be either synchronous or
asynchronous. Asynchronous requests can be used if processing is
computationally time consuming and response cannot be given right after
request. WPS defines three operations: GetCapabilities –request is used to
retrieve service-level metadata. Execute-operation returns the output(s) and
DescribeProcess is used to get description of a given calculation process.
DescribeProcess also returns information about process’s inputs and outputs.[5]
WPS specification is relatively new. Before 2010 only few public projects have
reported to implement WPS on server side. In 2011 Esri inc. announced that
WPS capability will be added to GeoprocessingServices of upcoming version
10.1 of ArcGIS Server.[14]
SGEM report D6.10.4 WP6 Task 10 Network analysis and planning mehtods
12
3.3.2 ArcGIS Geoprocessing Service
ArcGIS Geoprocessing Service is Esri inc’s implementation for providing
interface to GIS tools via network. A single geoprocessing service exposes
interface for predefined geoprocessing task(s) to be executed on server side.[3]
New geoprocessing services are defined using Esri’s desktop application,
ArcGIS Desktop. Interface for processing (inputs and outputs), as well as
calculation logic or model are first defined as a toolbox in ArcGIS Desktop. These
toolboxes are created using graphical Model builder –tool in ArcGIS Desktop.
Other way to implement toolboxes inner functionalities is to use Python
programming language. Python can be used in general to extend ArcGIS
Desktop or Server functionalities. Prepared toolboxes are finally published to
ArcGIS Server. Server acts as a host for toolboxes and provides their
functionality as Geoprocessing Service.[15]
ArcGIS Geoprocessing Services are mainly targeted to Esri’s own client
applications. For example, multiple ArcGIS Desktop users can use same
Geoprocessing Service and server machine’s computing resources for certain
routine calculations. ArcGIS Server also exposes REST and SOAP interfaces to
these services. These are technology-independed services and can be used also
with custom applications. [15]
In ArcGIS Server version 10.1 also WPS capability is added as additional feature
to Geoprocessing Services. [14]
SGEM report D6.10.4 WP6 Task 10 Network analysis and planning mehtods
13
4 DSO data and system integration
In Finland there were 89 local electricity distribution companies at 2009. All those
companies have their own range of IT-systems in operations. Distribution system
operators have different opinions about needed functionality and properties for
their own operations. [16]
Different operators have also different needs for communication between
systems. If two operators have exact same range of IT-systems, they may still
have different customized connections between systems.[16]
IT-system providers have also different functionality in their products. The
definition for certain application is not clear across markets. For example all
available network information systems (AM/FM/GIS) don’t have some particular
functionality which others have, but system providers have implemented this
same functionality in different product. [16]
Choices of used IT-systems in one company have been typically done in very
long period of time and range of systems may have been changed over time.
This chapter describes the relevant information systems used in the Finnish
distribution companies and their integration.
4.1 Network Information System, NIS
In Finland, term “verkkotietojärjestelmä” or VTJ in short is used for a system
which is responsible for management of network assets. Also English term
Network Information System (NIS) is used but mainly in Finland. Worldwide
these systems are known as Automated Mapping / Facilities Management /
Geographic Information System (AM/FM/GIS). There are also differences in
systems functionalities between different market areas.
Main features include network documentation, reporting, statistics, technical
calculations and mapping. System may also have other functionalities for
supporting eg. maintenance and construction.
Most common products in Finnish markets are:
ABB Oy, DMS 600 NE (Integra)
Tekla Oyj, Xpower
Tieto Oyj (TietoEnator Oyj), PowerGrid
SGEM report D6.10.4 WP6 Task 10 Network analysis and planning mehtods
14
4.2 Customer Information System, CIS
Distribution system operators use CIS for customer relation management (CRM).
Finnish term for this system is “Asiakastietojärjestelmä” or “ATJ”. System
provides functionalities for invoicing, customer service, agreement management
and marketing.
CIS is database driven system, and it uses customer database for storing all
customer related information. This information contains identification of place of
electricity use, customer/consumer group and annual energy consumption. Also
metering, tariff and billing information is stored in CIS.
Changes in electricity markets have pushed new applications for CIS data. For
example web-based customer service-/helpdesk –applications are developed to
communicate with CIS.
Most common products in the Finnish markets are:
Tieto Oyj (TietoEnator Oyj), Forum
Logica (WM-Data Utilities Oyj), Kolibri (APM)
CCC Group, Ellarex
4.3 System integration
Typical distribution system operator has a variety of different IT-systems. One
system contains information which is crucial for another system to operate. Need
for systems to co-operate is obvious.
4.3.1 Point-to-point integration
Lack of industry standards in data exchange has lead to situation where each
communication need is handled as custom integration between systems. This
approach is called point-to-point integration. When number of different systems
inside a company increases also number of needed integrations increases
vastly.[16]
SGEM report D6.10.4 WP6 Task 10 Network analysis and planning mehtods
15
System1
System3System2
System4
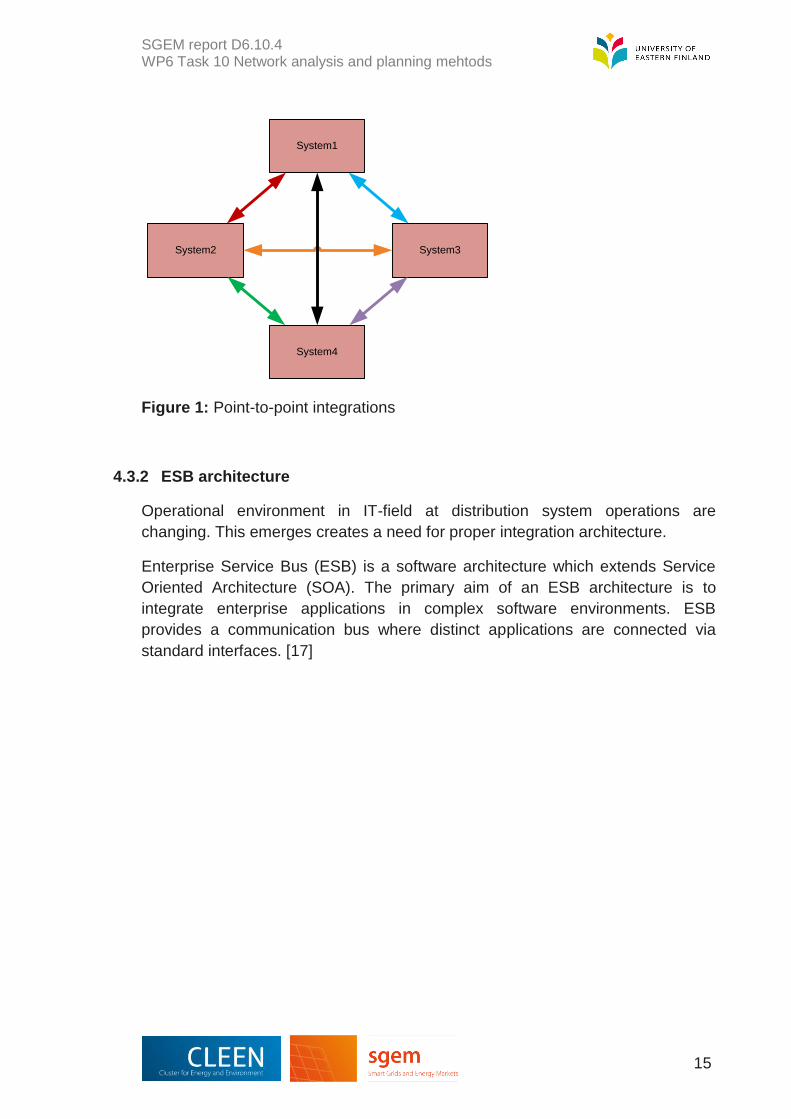
Figure 1: Point-to-point integrations
4.3.2 ESB architecture
Operational environment in IT-field at distribution system operations are
changing. This emerges creates a need for proper integration architecture.
Enterprise Service Bus (ESB) is a software architecture which extends Service
Oriented Architecture (SOA). The primary aim of an ESB architecture is to
integrate enterprise applications in complex software environments. ESB
provides a communication bus where distinct applications are connected via
standard interfaces. [17]
SGEM report D6.10.4 WP6 Task 10 Network analysis and planning mehtods
16
ESB
System1 System2
System3 System4
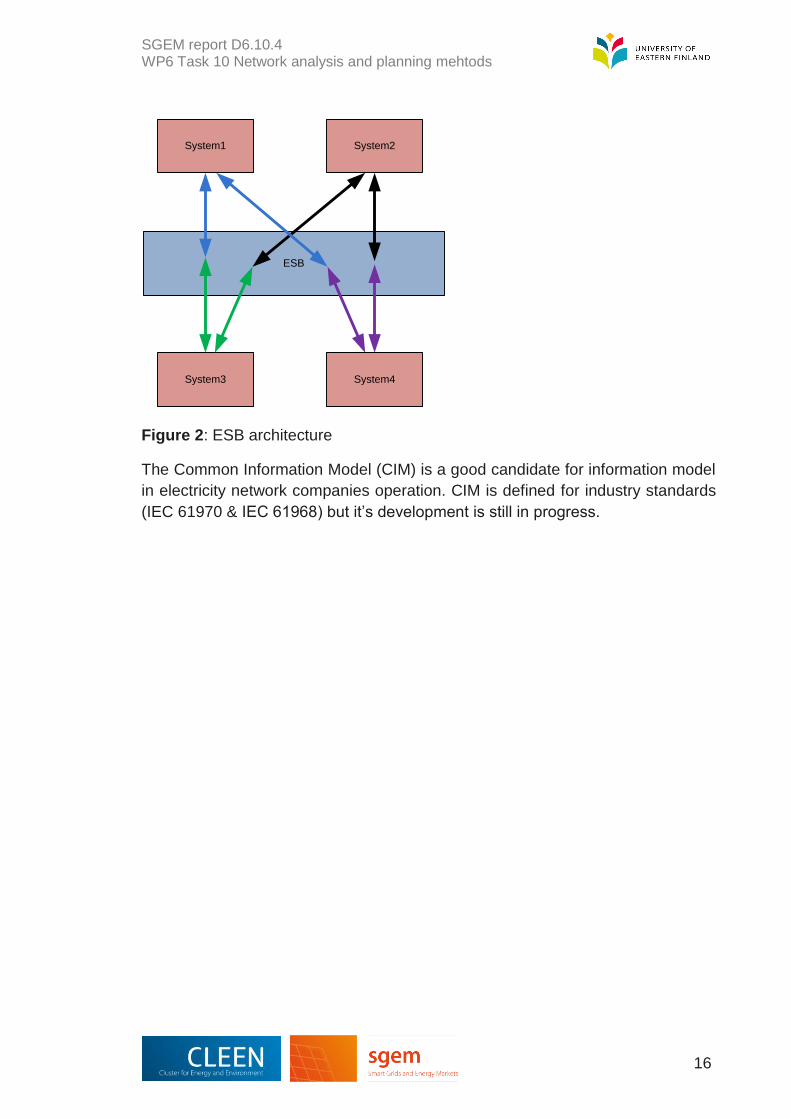
Figure 2: ESB architecture
The Common Information Model (CIM) is a good candidate for information model
in electricity network companies operation. CIM is defined for industry standards
(IEC 61970 & IEC 61968) but it’s development is still in progress.
SGEM report D6.10.4 WP6 Task 10 Network analysis and planning mehtods
17
5 Regional modelling as a tool for strategic planning of
electricity networks
Long term planning of distribution network is carried out to secure the grid’s
functionality in the future. The investments made on the network infrastructure
can be costly. Good planning capability can therefore help in acquiring significant
financial savings in addition to the reliable functionality of the grid. This chapter
presents an implementation of web based regional modelling tool. The tool
currently allows modelling electricity loads in different residential heating system
scenarios.
5.1 The main components
The main components of the regional modelling system are:
(i) The database
(ii) The computing engine
(iii) The user-interface
The overall system can be described, i.e. not paying attention to the details of the
implementation, using the scheme illustrated in Figure 3. The system includes (i)
the GIS/regional database, which is spatially integrated with CIS/AMR data, (ii)
the regional model which performs the modelling at some spatial resolution (e.g.
250x250m, 1x1km, 5x5km or polygon/subarea representing similar region) and
(iii) the regional scenarios which can defined e.g. the expected heating systems
and (iv) the optimization between the scenarios.
SGEM report D6.10.4 WP6 Task 10 Network analysis and planning mehtods
18
3.45 3.5 3.55 3.6
x 106
6.9
6.92
6.94
6.96
6.98
7
7.02
7.04
7.06
7.08
x 106 Regional energy balance (GJ/a)
0.2
0.4
0.6
0.8
1
1.2
1.4
1.6
1.8
x 104
AMR
Regional modeling
Current
status
Regional
data
Regional
scenarios (e.g.
EV)
Optimization
Modeling and simulation (a
regional model)
GIS
Best alternative
Case 0
Load models/curves
Adoption models
Building information, socio-
economic, temperatures, land-
use, etc.
End-user
DER/DG models
MO-ranking
Preferences
End-user
CIS data
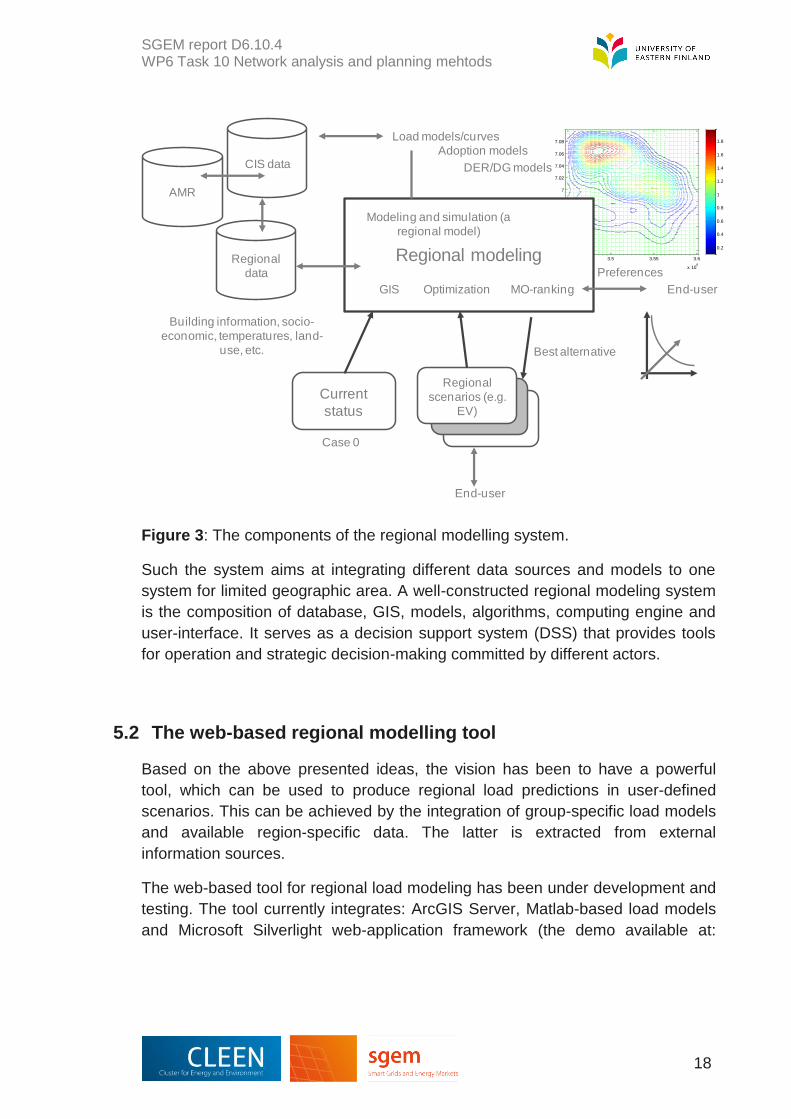
Figure 3: The components of the regional modelling system.
Such the system aims at integrating different data sources and models to one
system for limited geographic area. A well-constructed regional modeling system
is the composition of database, GIS, models, algorithms, computing engine and
user-interface. It serves as a decision support system (DSS) that provides tools
for operation and strategic decision-making committed by different actors.
5.2 The web-based regional modelling tool
Based on the above presented ideas, the vision has been to have a powerful
tool, which can be used to produce regional load predictions in user-defined
scenarios. This can be achieved by the integration of group-specific load models
and available region-specific data. The latter is extracted from external
information sources.
The web-based tool for regional load modeling has been under development and
testing. The tool currently integrates: ArcGIS Server, Matlab-based load models
and Microsoft Silverlight web-application framework (the demo available at:
SGEM report D6.10.4 WP6 Task 10 Network analysis and planning mehtods
19
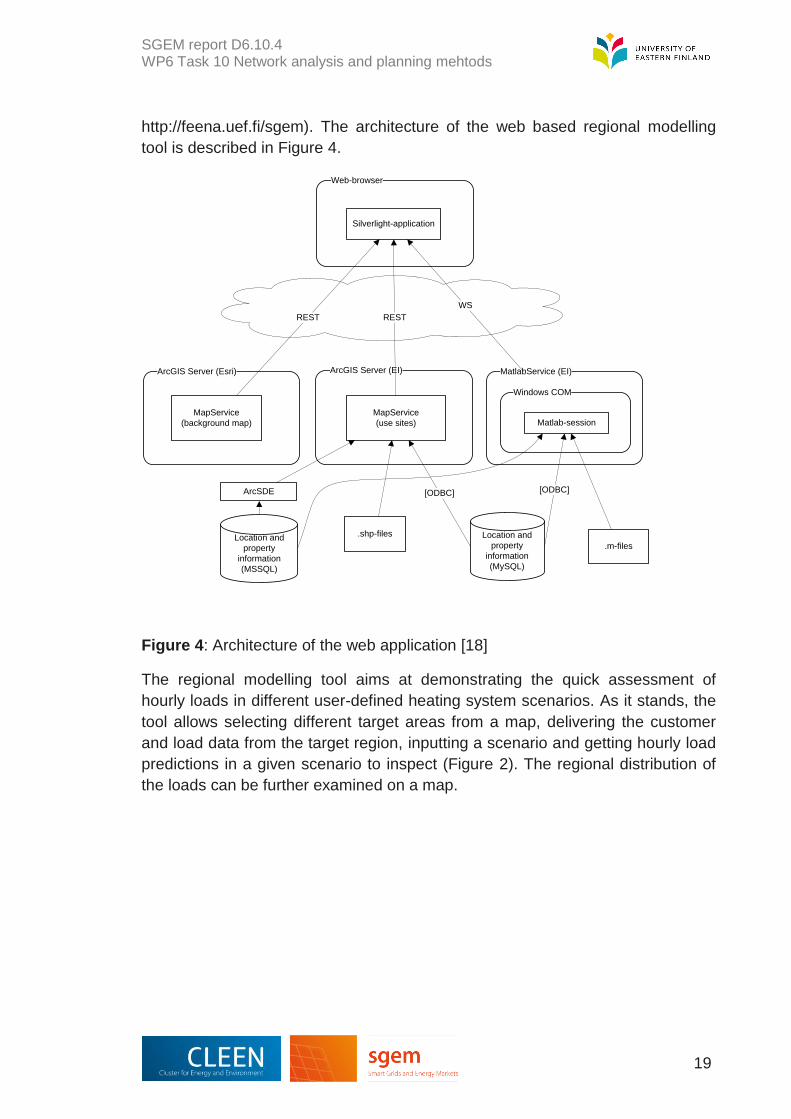
http://feena.uef.fi/sgem). The architecture of the web based regional modelling
tool is described in Figure 4.
Location and
property
information
(MySQL)
ArcGIS Server (EI)
MapService
(use sites)
MatlabService (EI)
Windows COM
Matlab-session
[ODBC]
Web-browser
Silverlight-application
REST
[ODBC]
WS
ArcGIS Server (Esri)
MapService
(background map)
REST
.shp-files
.m-filesLocation and
property
information
(MSSQL)
ArcSDE
Figure 4: Architecture of the web application [18]
The regional modelling tool aims at demonstrating the quick assessment of
hourly loads in different user-defined heating system scenarios. As it stands, the
tool allows selecting different target areas from a map, delivering the customer
and load data from the target region, inputting a scenario and getting hourly load
predictions in a given scenario to inspect (Figure 2). The regional distribution of
the loads can be further examined on a map.
SGEM report D6.10.4 WP6 Task 10 Network analysis and planning mehtods
20
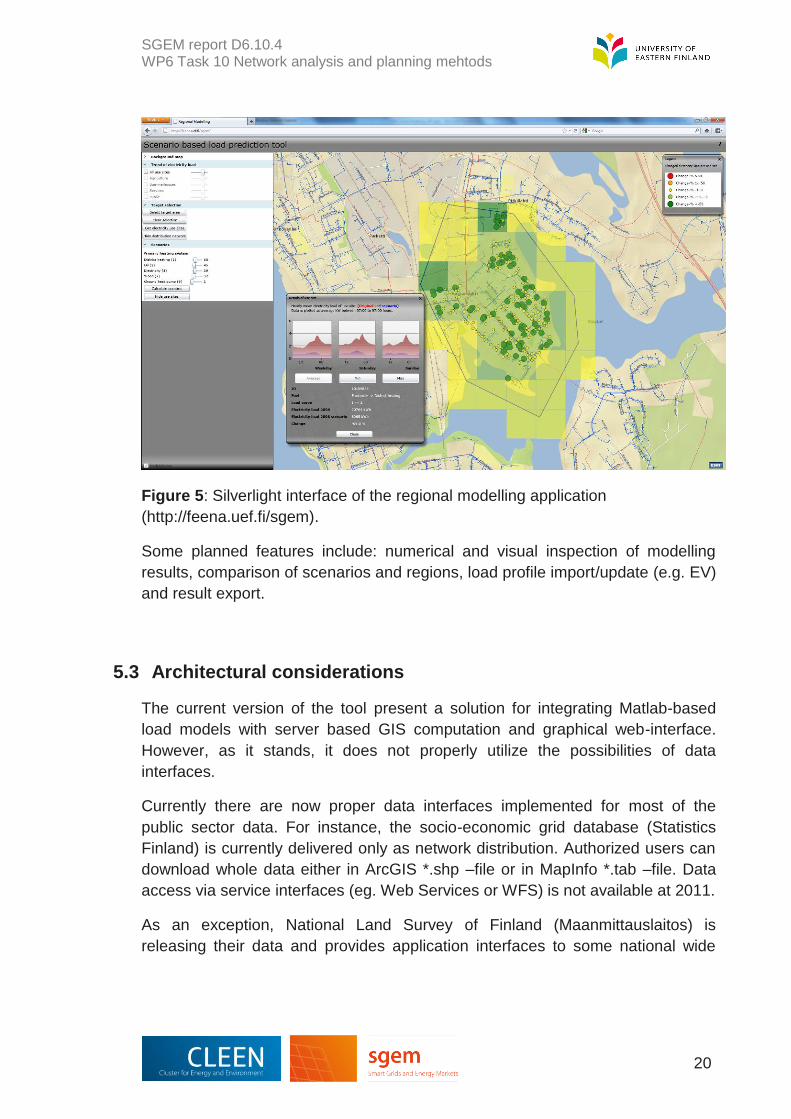
Figure 5: Silverlight interface of the regional modelling application
(http://feena.uef.fi/sgem).
Some planned features include: numerical and visual inspection of modelling
results, comparison of scenarios and regions, load profile import/update (e.g. EV)
and result export.
5.3 Architectural considerations
The current version of the tool present a solution for integrating Matlab-based
load models with server based GIS computation and graphical web-interface.
However, as it stands, it does not properly utilize the possibilities of data
interfaces.
Currently there are now proper data interfaces implemented for most of the
public sector data. For instance, the socio-economic grid database (Statistics
Finland) is currently delivered only as network distribution. Authorized users can
download whole data either in ArcGIS *.shp –file or in MapInfo *.tab –file. Data
access via service interfaces (eg. Web Services or WFS) is not available at 2011.
As an exception, National Land Survey of Finland (Maanmittauslaitos) is
releasing their data and provides application interfaces to some national wide
SGEM report D6.10.4 WP6 Task 10 Network analysis and planning mehtods
21
data as WMS and WFS services. The data can be accessed via WFS interface,
but currently it is accessible only for authorities. It can be also accessed for
research purposes, providing that raw data is not published.
Furthermore, there are some open questions related to computational efficiency
i.e. how to transfer huge amount of the GIS data without losing computational
performance and user interactivity. A possible solution can be found through
cache-like temporary data storing. Application should anyway manage situations
where no data is found locally (cache), but it has to be fetched runtime from
another systems.
Further work should be focused particularly on testing data interfaces and their
combination with the modelling. Main goal is to proceed towards on software as a
serivice (SaaS) i.e. software delivery model, in which software and its associated
data are hosted centrally (in Internet cloud) with the following properties and sub
objectives:
The user is for example DSO network planning engineer
The application provider can be separate IT-company, which provides
application/modelling logic to user
External data is fetched via standard interfaces from providers (WFS,
WMS, Web Services)
Business data from DSO is fetched from DSO service bus or similar
Queries are executed on basis of spatial location (coordinate boundaries,
municipality code, post office number, street address)
Data includes places of electricity use, customer information, load curves
and hourly metered consumption data for certain time period
The modelling application performs computations for selected scenario
and returns output to user
The computation engine can be diversified from main application service
via standard interface like WPS
The user interface can be implemented as thin client, like RIA web-
application. Another approach is to implement user interface as a plugin or
extension to AM/FM/GIS system in use.
The computation output may be used as a design parameter for network
planning

SGEM report D6.10.4 WP6 Task 10 Network analysis and planning mehtods
22
6 Conclusions
External, public sector data are beginning more accessible, offering significant
possibilities for developing new computational approaches and services in the
domain of Smart Grids. Better spatial accuracy of the data (socio-economic,
building information etc) could yield significant enhancements in several problem
domains of Smart Grids, as exemplified here for long-term load modelling. As a
recommendation further work is required especially for data interfaces. Practical
demonstrations about the potential solutions are needed as such activities can
show new possibilities and can thus lead both to open data interfaces and to the
development of new methods and services.

SGEM report D6.10.4 WP6 Task 10 Network analysis and planning mehtods
23
7 References
[1] Willis, H. L. Spatial Electric Load Forecasting, 2002. Second Edition Revised and Expanded. New York, Marcel Dekker. [2] H. Hahn, S. Meyer-Nieberg, S. Pickl, 2009. Electric load forecasting methods:
Tools for decision making, European Journal of Operational Research, vol. 199,
902-907.
[3] Kandil M. S. 2001. Overview and comparison of long-term forecasting techniques for a fast developing utility: part i. Electric Power Systems Research, 58(1), 11–17.
[4] Feinberg, E.A., Genethliou, D. 2005. Load forecasting. In: Chow, J.H., Wu, F.F., Momoh, J.J. (Eds.), Applied Mathematics for Restructered Electric Power Systems: Optimization, Control and Computational Intelligence, Power Electronics and Power Systems. Springer, US, pp. 269–285. [5] V. Smil, 2000. Perils of long-range energy forecasting: Reflections on looking
far ahead, Technological Forecasting and Social Change, vol. 65, 251–264.
[6] Vierimaa, H. 2007. Verkkotietojärjestelmän kehittämistarpeet yleissuunnittelun
näkökulmasta. Diplomityö, Teknillinen korkeakoulu, Sähkö ja
tietoliikennetekniikan osasto, Espoo.
[7] Kaartio, T. 2010. Alueellisen sähkökuorman ennustamisen kehittäminen.
Diplomityö, Aalto Yliopisto, Teknillinen Korkeakoulu, Sähkötekniikan laitos,
Espoo.
[8] Tobler W. 1970. A computer movie simulating urban growth in the Detroit region. Economic Geography, 46(2): 234-240.
[9] Mepsir, 2006. Measuring European Public Sector Information Resources.
Final Report of Study on Exploitation of public sector information – benchmarking
of EU framework conditions.
[10] Wikipedia, Common Information Model (electricity)
http://en.wikipedia.org/wiki/Common_Information_Model_%28electricity%29
[11] OGC WMS 1.3.0 http://www.opengeospatial.org/standards/wms
[12] OGC WFS 2.0 http://www.opengeospatial.org/standards/wfs
[13] OGC WPS 1.0 http://www.opengeospatial.org/standards/wps

SGEM report D6.10.4 WP6 Task 10 Network analysis and planning mehtods
24
[14] Leveraging OGC Services in ArcGIS Server,
http://proceedings.esri.com/library/userconf/devsummit11/papers/tech/leveraging
_ogc_devsummit_2011_final.pdf
[15] ArcGIS Server 10.0 Help
[16] Koto Antti, Diplomityö
http://webhotel2.tut.fi/units/set/opetus/pdf%20julkiset%20dtyot/Koto_Antti_julk.pd
f
[17] Wikipedia, Enterprise Service Bus,
http://en.wikipedia.org/wiki/Enterprise_service_bus
[18] Niska Harri, Saarenpää Jukka, Räsänen Teemu, Tiirikainen Jarkko,
Kolehmainen Mikko. 2011. Scenario based Electricity Load Prediction Tool for
Distribution Planning and Management. In: (ed.), Proceedings of CIRED 2011 -
The 21st International Conference and Exhibition on Electricity Distribution,
Frankfurt. ss. Paper 0833.