Embed Size (px)
Citation preview

- 23 -
Appendix 2.
ŌTAKI CUSTOMER SURVEY REPORT

Otaki Customer Survey:
Draft Report of Pedestrian Intercept Surveys
conducted in March 2011
Otaki Customer Survey:
Draft Report of Pedestrian
Intercept Surveys conducted in
March 2011
Opus International Consultants Limited Prepared By Central Laboratories Dr Jared Thomas 138 Hutt Park Road, Gracefield Grace Rive PO Box 30 845, Lower Hutt 5040, New Zealand
Telephone: +64 4 587 0600 Reviewed By Facsimile: +64 4 587 0604 Dr Felicity Powell
Kate Mora Date: 05-07-11 Reference: 355537.68.1 Status: Draft final report
© Opus International Consultants Limited 2011
Otaki Customer Survey
Doc Ref
Date i
Contents
1 Executive summary ............................................................................................................. ii
2 Introduction .......................................................................................................................... 1
2.1 Background .................................................................................................................. 1
2.2 Purpose ........................................................................................................................ 1
3 Method .................................................................................................................................. 2
3.1 Pedestrian Survey ........................................................................................................ 2
3.2 Retail store survey ........................................................................................................ 3
3.3 Data analysis ................................................................................................................ 3
4 Findings ................................................................................................................................ 5
4.1 Sample ......................................................................................................................... 5
4.2 Willingness to stop in Otaki ........................................................................................... 7
4.3 Comparison of Otaki residents, ‘willing to stop’ and ‘Expressway’ groups ..................... 8
4.3.1 Travel Behaviour and Expressway Use ........................................................... 10
4.3.2 Trip purpose .................................................................................................... 11
4.3.3 Characteristics that encouraged shopping in Otaki .......................................... 12
4.3.4 Economic impacts ........................................................................................... 14
4.4 Comparison of ‘purposeful’, ‘passing through’ and Otaki residents groups .................. 15
4.5 Comparison of weekday versus weekend groups ....................................................... 16
4.6 Comparison of Railway Precinct versus Main Street groups ....................................... 18
4.7 Travel origin characteristics ........................................................................................ 20
4.8 What is the one thing you would change about Otaki? ................................................ 23
4.8.1 General comments .......................................................................................... 25
4.9 Retail store survey ...................................................................................................... 25
4.9.1 Limitations ....................................................................................................... 26
4.9.2 Retail store survey sample characteristics ....................................................... 27
4.9.3 Retail Store Survey Comparison of Otaki residents, ‘Willing to stop’ and
‘Expressway’ groups ................................................................................................... 29
4.9.4 Retail Store Survey Economic Impacts ............................................................ 30
5 Discussion.......................................................................................................................... 31
5.1 Purchase types most affected ..................................................................................... 31
5.2 Learning from international solutions .......................................................................... 31
5.3 Key characteristics for improvement ........................................................................... 32
5.4 Location-based findings .............................................................................................. 32
5.5 Travel behaviour and travel origin ............................................................................... 33
5.6 Acceptable time sacrifices and Willingness to Detour ................................................. 33
5.7 Conclusion .................................................................................................................. 33
6 References ......................................................................................................................... 34
7 Appendices ........................................................................................................................ 35
Appendix A: Otaki pedestrian questionnaire......................................................................... 35
Appendix B: Otaki/Te Horo retail store questionnaire ........................................................... 38
Otaki Customer Survey
Doc Ref
Date ii
1 Executive summary
This report is a component of a broader study examining the business impacts of the proposed
Peka Peka to Otaki Expressway (hereafter referred to as the Expressway). The information is also
intended to inform social and transportation impact assessments of the Expressway. Using survey
data collected from a sample of 500 pedestrians intercepted in the retail areas of Otaki by Opus
Central Laboratories, this report:
• Reveals the characteristics of people who currently shop in Otaki, and details of their
shopping and travel behaviour;
• Predicts the likelihood that people will deviate from the proposed Expressway so that they
continue to come to Otaki;
• Estimates the impact on the number of shopping transactions and sales values based on a
shift in traffic to the proposed Expressway;
• Evaluates the features of Otaki’s retail areas that are particularly important to customers;
and
• Describes the potential enhancements to Otaki that would make it more likely that people
would return to shop.
A unique feature of this particular study is the inclusion of a Stated Preference Survey of shoppers’
Willingness to Detour to Otaki, which is the first known use of this technique in New Zealand. The
innovative approach follows Willingness to Pay methodology, making people trade the value of
stopping in Otaki against the time they would be willing to accept to take the detour, or in other
words, Willingness to Detour.
For those respondents that valued travel time as a critical factor in their decision to detour, about
60% reported that they would be willing to sacrifice the improved travel time savings offered by an
Expressway and continue to stop and shop in Otaki. Overall, only 11% of those surveyed would no
longer stop in Otaki after the Expressway is constructed, with the remainder continuing to use the
shopping facilities either because they were residents (42%) or because they valued the stop in
Otaki so much that they would continue to stop even with the Expressway (47%).
Those that would be willing to stop in Otaki are estimated to spend significantly more on average
per person ($70.57) than either Otaki Residents ($56.66) or those who would choose to remain on
the Expressway ($53.02). So even though there may be an 11% reduction in foot traffic in the retail
area, estimated spending suggests that only about 9% of overall sales would be lost by the
introduction of the Expressway. When examined by the specific retail location, the State Highway 1
(Railway Precinct) was more heavily impacted, with an estimated 14% reduction in foot traffic and
a 12% reduction in overall sales post-Expressway. However, the Main Street retail area was less
heavily impacted after the proposed Expressway, with an estimated 5% reduction in foot traffic and
a 3% reduction in overall sales.
The frequency of purchase types that are most likely to be affected by the loss of sales to the
Expressway group are:
Otaki Customer Survey
Doc Ref
Date iii
• Convenience foods: Results suggest that coffee, bakery and takeaway foods are the worst affected, with about 15% of sales transactions being made by future Expressway users.
• Petrol: The Expressway users are no more likely to purchase petrol than any other group, however we still estimate an 11% drop in the number of petrol transactions. This does not take into account any compounding impact from convenience food sales at the three petrol stations (that may also drop by 15%).
• Clothing: Expressway users are also no more likely to purchase clothes than other shoppers, but we still estimate that shops selling clothing, shoes and accessories will experience a decline in sales of about 12%.
The key characteristics that currently cause people to stop to shop in Otaki are accessibility, ease
of parking, pedestrian safety, atmosphere and good facilities (such as toilets). Shopping
characteristics, such as the variety and uniqueness of the shops available in Otaki, did not rank as
highly as these features in the decision to stop. Respondents suggested that improving the
perception of what Otaki retail stores offer would make it a more attractive destination for
shoppers, particularly with regard to eating establishments and outlet shops.
The findings suggest that the completion of the Peka Peka to Otaki Expressway is likely to provide
several of the key improvements desired that would make Otaki a more vibrant retail destination,
such as reduced traffic congestion. Similarly, the characteristics that currently cause people to
choose Otaki are likely to be reinforced by the Expressway, such as the safe, attractive pedestrian
environment identified by shoppers.
Otaki Customer Survey
1
2 Introduction
2.1 Background
The overall goal of the proposed Expressway is to alleviate transport issues in the Peka Peka to
Otaki route, which has been identified as one of eight sections in the Wellington Northern Corridor
(Wellington Airport to Levin) road of national significance requiring improvement to:
1. Ease congestion; and,
2. Improve travel time reliability (NZ Transport Agency, 2011).
2.2 Purpose
The purpose of this report is to assess current use and perceived continued use of facilities in
Otaki, in particular businesses in Otaki. This information will form a key part of a business impact
study being undertaken along with Market Economics that will predict the likely effects of the
proposed Peka Peka to Otaki Expressway on businesses. It will also be used to inform social and
transportation assessments.
In order to do this, people who were visiting key facilities (such as petrol stations and
supermarkets) or walking within Otaki, were approached to engage in a short “intercept” survey
that examined:
1. Baseline use of Otaki facilities: Including how frequently they passed through, and how
much time and money they spent within Otaki;
2. Preference Indicators: Key characteristics of Otaki that encouraged shopping here, such as
variety of shops, ease of parking, pedestrian safety, and atmosphere; and,
3. Perceived willingness to stop: Measured by willingness to continue to stop in Otaki in a
post-Expressway scenario where the Expressway would likely offer travel time savings.
Otaki Customer Survey
2
3 Method
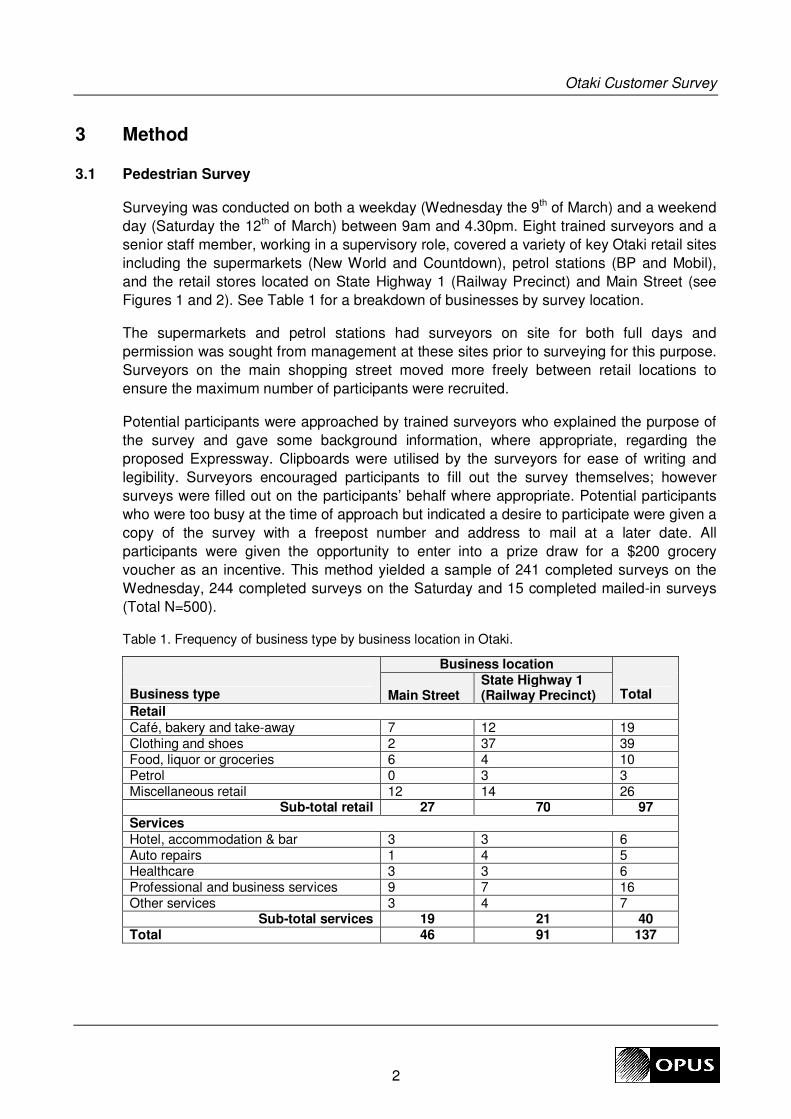
3.1 Pedestrian Survey
Surveying was conducted on both a weekday (Wednesday the 9th of March) and a weekend
day (Saturday the 12th of March) between 9am and 4.30pm. Eight trained surveyors and a
senior staff member, working in a supervisory role, covered a variety of key Otaki retail sites
including the supermarkets (New World and Countdown), petrol stations (BP and Mobil),
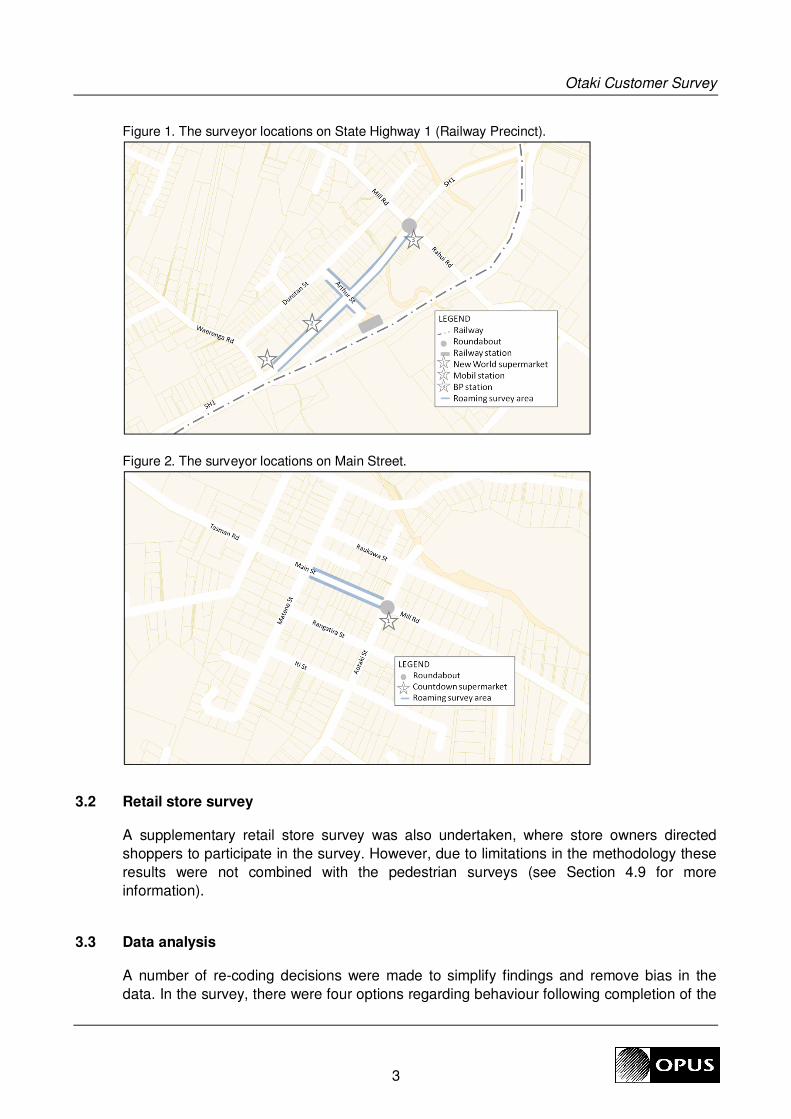
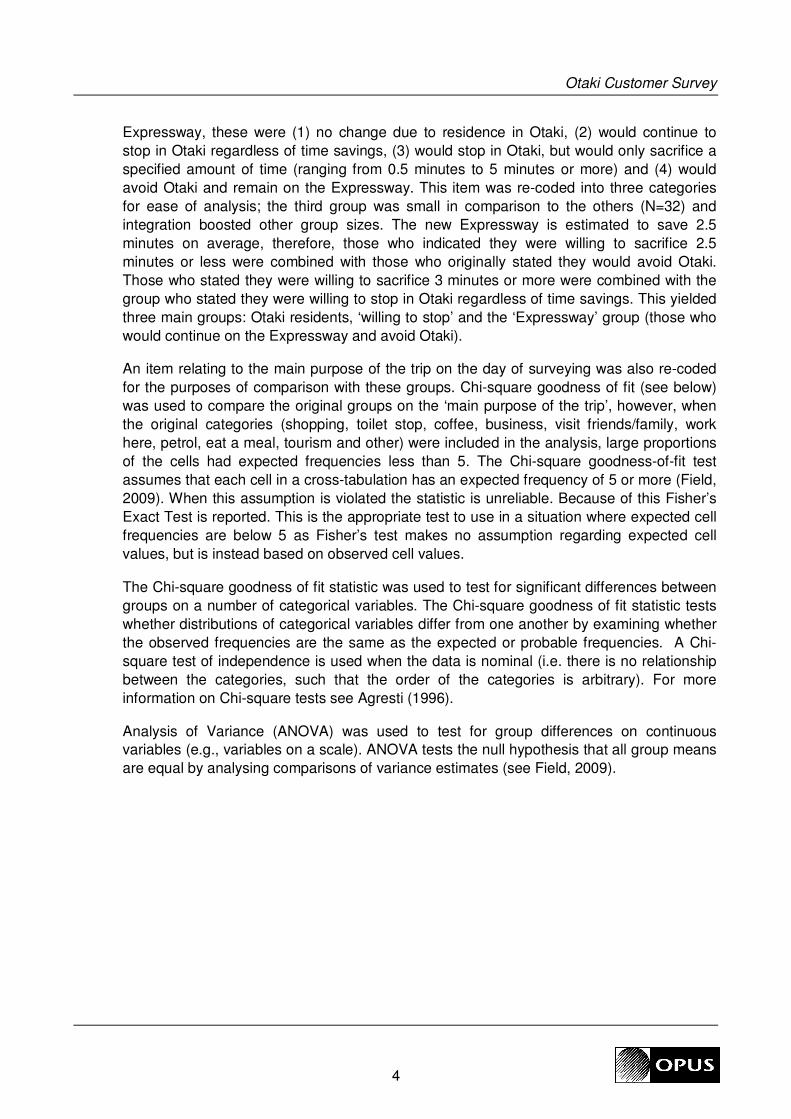
and the retail stores located on State Highway 1 (Railway Precinct) and Main Street (see
Figures 1 and 2). See Table 1 for a breakdown of businesses by survey location.
The supermarkets and petrol stations had surveyors on site for both full days and
permission was sought from management at these sites prior to surveying for this purpose.
Surveyors on the main shopping street moved more freely between retail locations to
ensure the maximum number of participants were recruited.
Potential participants were approached by trained surveyors who explained the purpose of
the survey and gave some background information, where appropriate, regarding the
proposed Expressway. Clipboards were utilised by the surveyors for ease of writing and
legibility. Surveyors encouraged participants to fill out the survey themselves; however
surveys were filled out on the participants’ behalf where appropriate. Potential participants
who were too busy at the time of approach but indicated a desire to participate were given a
copy of the survey with a freepost number and address to mail at a later date. All
participants were given the opportunity to enter into a prize draw for a $200 grocery
voucher as an incentive. This method yielded a sample of 241 completed surveys on the
Wednesday, 244 completed surveys on the Saturday and 15 completed mailed-in surveys
(Total N=500).
Table 1. Frequency of business type by business location in Otaki.
Business type
Business location
Total Main Street State Highway 1 (Railway Precinct)
Retail Café, bakery and take-away 7 12 19 Clothing and shoes 2 37 39 Food, liquor or groceries 6 4 10 Petrol 0 3 3 Miscellaneous retail 12 14 26
Sub-total retail 27 70 97 Services
Hotel, accommodation & bar 3 3 6 Auto repairs 1 4 5 Healthcare 3 3 6 Professional and business services 9 7 16 Other services 3 4 7
Sub-total services 19 21 40 Total 46 91 137
Otaki Customer Survey
3
Figure 1. The surveyor locations on State Highway 1 (Railway Precinct).
Figure 2. The surveyor locations on Main Street.
3.2 Retail store survey
A supplementary retail store survey was also undertaken, where store owners directed
shoppers to participate in the survey. However, due to limitations in the methodology these
results were not combined with the pedestrian surveys (see Section 4.9 for more
information).
3.3 Data analysis
A number of re-coding decisions were made to simplify findings and remove bias in the
data. In the survey, there were four options regarding behaviour following completion of the
Otaki Customer Survey
4
Expressway, these were (1) no change due to residence in Otaki, (2) would continue to
stop in Otaki regardless of time savings, (3) would stop in Otaki, but would only sacrifice a
specified amount of time (ranging from 0.5 minutes to 5 minutes or more) and (4) would
avoid Otaki and remain on the Expressway. This item was re-coded into three categories
for ease of analysis; the third group was small in comparison to the others (N=32) and
integration boosted other group sizes. The new Expressway is estimated to save 2.5
minutes on average, therefore, those who indicated they were willing to sacrifice 2.5
minutes or less were combined with those who originally stated they would avoid Otaki.
Those who stated they were willing to sacrifice 3 minutes or more were combined with the
group who stated they were willing to stop in Otaki regardless of time savings. This yielded
three main groups: Otaki residents, ‘willing to stop’ and the ‘Expressway’ group (those who
would continue on the Expressway and avoid Otaki).
An item relating to the main purpose of the trip on the day of surveying was also re-coded
for the purposes of comparison with these groups. Chi-square goodness of fit (see below)
was used to compare the original groups on the ‘main purpose of the trip’, however, when
the original categories (shopping, toilet stop, coffee, business, visit friends/family, work
here, petrol, eat a meal, tourism and other) were included in the analysis, large proportions
of the cells had expected frequencies less than 5. The Chi-square goodness-of-fit test
assumes that each cell in a cross-tabulation has an expected frequency of 5 or more (Field,
2009). When this assumption is violated the statistic is unreliable. Because of this Fisher’s
Exact Test is reported. This is the appropriate test to use in a situation where expected cell
frequencies are below 5 as Fisher’s test makes no assumption regarding expected cell
values, but is instead based on observed cell values.
The Chi-square goodness of fit statistic was used to test for significant differences between
groups on a number of categorical variables. The Chi-square goodness of fit statistic tests
whether distributions of categorical variables differ from one another by examining whether
the observed frequencies are the same as the expected or probable frequencies. A Chi-
square test of independence is used when the data is nominal (i.e. there is no relationship
between the categories, such that the order of the categories is arbitrary). For more
information on Chi-square tests see Agresti (1996).
Analysis of Variance (ANOVA) was used to test for group differences on continuous
variables (e.g., variables on a scale). ANOVA tests the null hypothesis that all group means
are equal by analysing comparisons of variance estimates (see Field, 2009).
Otaki Customer Survey
5
4 Findings
4.1 Sample
The characteristics of the total sample in relation to a number of key variables are displayed
in Table 2. As can be seen, just over half of those surveyed were female, and those aged
45-54 and 55-64 years were surveyed at a higher rate than other age groups. Just over half
the sample travelled from outside Otaki on the day of surveying, and the primary travel
mode was car driver, followed by car passenger. Many of the trips were less than 30
minutes.
In regards to the origin of the trip on the day of surveying for those from outside the Otaki
region, the Kapiti Coast was most common, followed by Wellington, Manawatu/Wanganui
and the Horowhenua. Other origins included Hawkes Bay, Auckland, Bay of Plenty,
Coromandel, Taranaki, Waikato and Wairarapa. Therefore, travellers from a large cross-
section of New Zealand’s regions were surveyed.
Table 2: Summary of key demographic and travel behaviour frequencies (N=500).
Key variable Frequency
Gender
Male 212 (42.7%)
Female 284 (57.3%)
Age group
16-24 54 (10.9%)
24-34 51 (10.3%)
35-44 71 (14.3%)
45-54 118 (23.7%)
55-64 107 (21.5%)
65-74 64 (12.9%)
75+ 32 (6.4%)
Travel origin
Within Otaki 236 (47.2%)
Outside Otaki 264 (52.8%)
Travel mode
Car driver 385 (77.8%)
Car passenger 54 (10.9%)
Bus 7 (1.4%)
Walking 34 (6.9%)
Cycling 9 (1.8%)
Other 6 (1.2%)
Journey length
Less than 30 minutes 284 (57.4%)
30-60 minutes 65 (13.1%)
60-90 minutes 38 (7.7%)
90-120 minutes 27 (5.5%)
2-3 hours 34 (6.9%)
3-4 hours 16 (3.2%)
4 or more hours 31 (6.3%)
Otaki Customer Survey
6
Shopping was the most commonly reported main purpose of the trip, followed by
purchasing petrol and working in Otaki (see Table 3). Eating meals and drinking coffee
were other common secondary purposes.
Table 3: Frequency count of trip by purpose (N=500).
Key variable Frequency
Purposeful versus passing through visitor
Purposeful – returning to original location following
trip to Otaki retail centre
182 (61.7%)
Passing through – returning to a different location
following trip to Otaki retail centre
113 (38.3%)
Main purpose of trip
Shopping 219 (47.8%)
Toilet stop 7 (1.5%)
Coffee 22 (4.8%)
Business 32 (7.0%)
Visit friends/family 19 (4.1%)
Work here 55 (12.0%)
Petrol 55 (12.0%)
Eat a meal 7 (1.5%)
Tourism 3 (.7%)
Other1 39 (8.5%)
Secondary purpose for trip2
Shopping 167 (33.4%)
Toilet stop 41 (8.2%)
Coffee 100 (20.0%)
Business 45 (9.0%)
Visit friends/family 74 (14.8%)
Work here 55 (11.0%)
Petrol 104 (20.8%)
Eat a meal 81 (16.2%)
Tourism 11 (2.2%)
Other 42 (8.4%)
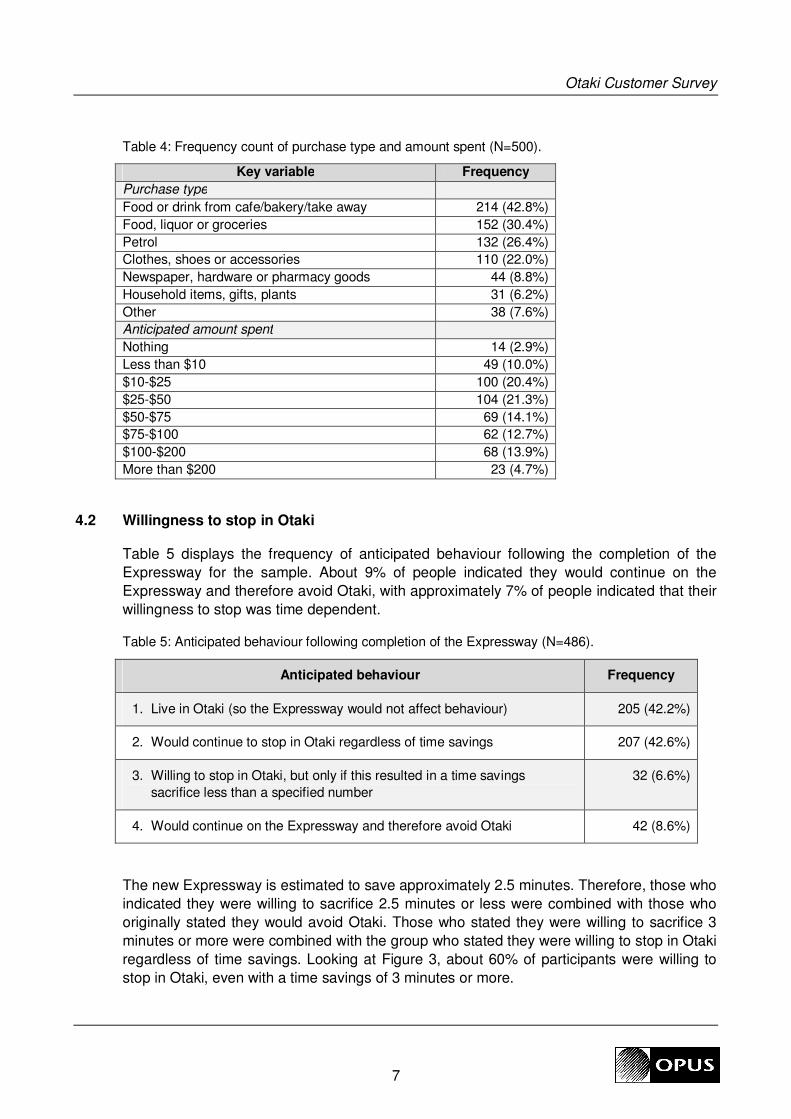
The most common types of purchase were take away foods and drink, groceries, petrol and
clothes (see Table 4). Almost all (97%) of the pedestrians surveyed had made or were
planning to make some form of purchase. Just over half of the sample anticipated spending
less than $50 on these items on the day of surveying.
1 Sport was often reported as the main reason for the trip for this group.
2 These percentages do not add to 100 because respondents could endorse more than one option. Where
other percentages also do not add to 100 similar question formats were utilised.
Otaki Customer Survey
7
Table 4: Frequency count of purchase type and amount spent (N=500).
Key variable Frequency
Purchase type
Food or drink from cafe/bakery/take away 214 (42.8%)
Food, liquor or groceries 152 (30.4%)
Petrol 132 (26.4%)
Clothes, shoes or accessories 110 (22.0%)
Newspaper, hardware or pharmacy goods 44 (8.8%)
Household items, gifts, plants 31 (6.2%)
Other 38 (7.6%)
Anticipated amount spent
Nothing 14 (2.9%)
Less than $10 49 (10.0%)
$10-$25 100 (20.4%)
$25-$50 104 (21.3%)
$50-$75 69 (14.1%)
$75-$100 62 (12.7%)
$100-$200 68 (13.9%)
More than $200 23 (4.7%)
4.2 Willingness to stop in Otaki
Table 5 displays the frequency of anticipated behaviour following the completion of the
Expressway for the sample. About 9% of people indicated they would continue on the
Expressway and therefore avoid Otaki, with approximately 7% of people indicated that their
willingness to stop was time dependent.
Table 5: Anticipated behaviour following completion of the Expressway (N=486).
Anticipated behaviour Frequency
1. Live in Otaki (so the Expressway would not affect behaviour) 205 (42.2%)
2. Would continue to stop in Otaki regardless of time savings 207 (42.6%)
3. Willing to stop in Otaki, but only if this resulted in a time savings
sacrifice less than a specified number
32 (6.6%)
4. Would continue on the Expressway and therefore avoid Otaki 42 (8.6%)
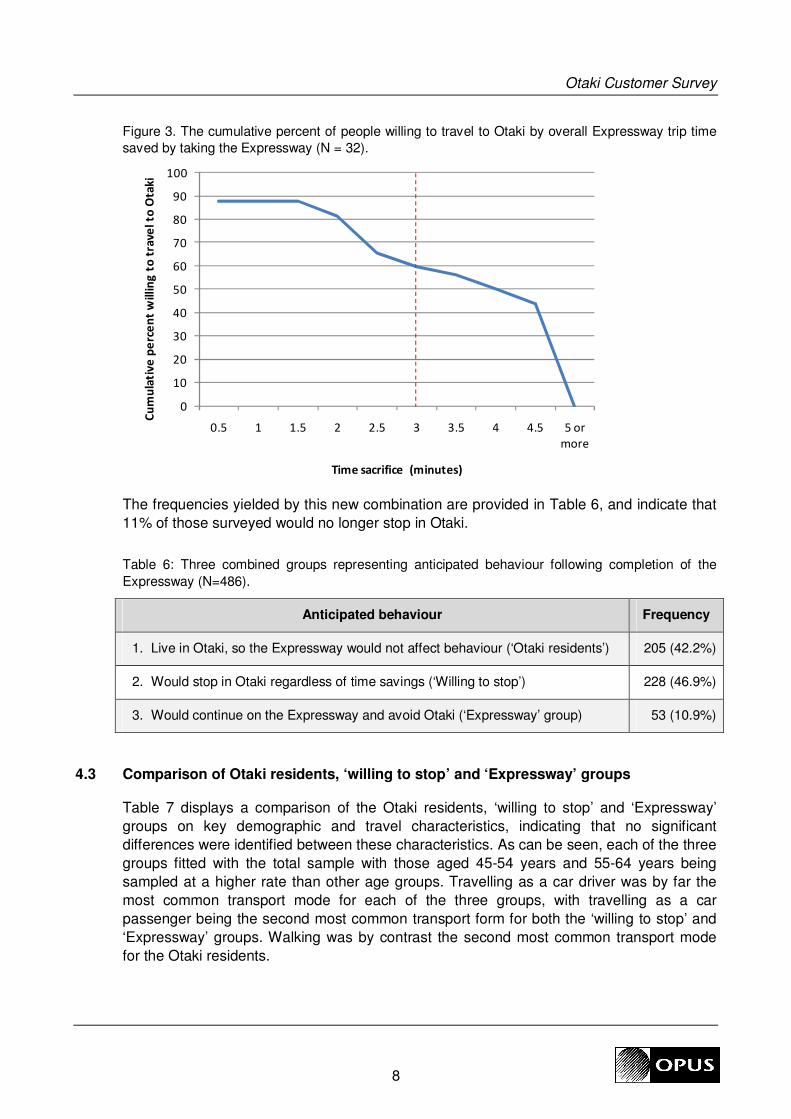
The new Expressway is estimated to save approximately 2.5 minutes. Therefore, those who
indicated they were willing to sacrifice 2.5 minutes or less were combined with those who
originally stated they would avoid Otaki. Those who stated they were willing to sacrifice 3
minutes or more were combined with the group who stated they were willing to stop in Otaki
regardless of time savings. Looking at Figure 3, about 60% of participants were willing to
stop in Otaki, even with a time savings of 3 minutes or more.
Otaki Customer Survey
8
Figure 3. The cumulative percent of people willing to travel to Otaki by overall Expressway trip time
saved by taking the Expressway (N = 32).
The frequencies yielded by this new combination are provided in Table 6, and indicate that
11% of those surveyed would no longer stop in Otaki.
Table 6: Three combined groups representing anticipated behaviour following completion of the
Expressway (N=486).
Anticipated behaviour Frequency
1. Live in Otaki, so the Expressway would not affect behaviour (‘Otaki residents’) 205 (42.2%)
2. Would stop in Otaki regardless of time savings (‘Willing to stop’) 228 (46.9%)
3. Would continue on the Expressway and avoid Otaki (‘Expressway’ group) 53 (10.9%)
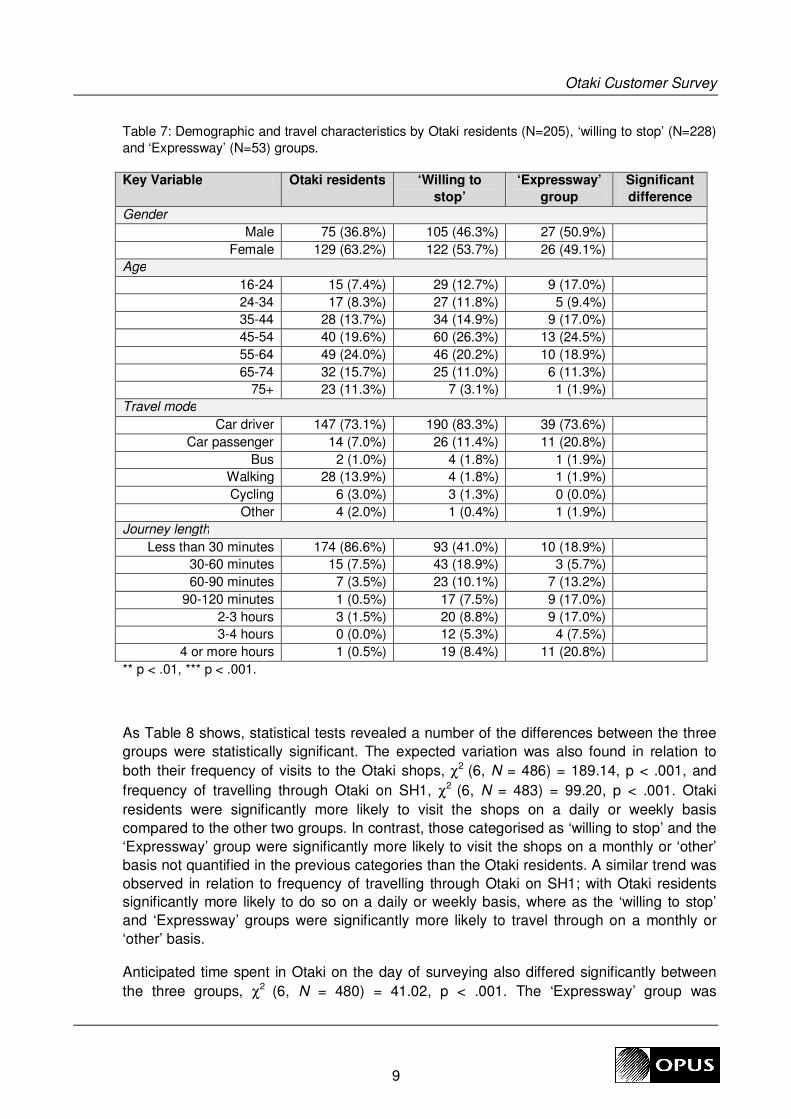
4.3 Comparison of Otaki residents, ‘willing to stop’ and ‘Expressway’ groups
Table 7 displays a comparison of the Otaki residents, ‘willing to stop’ and ‘Expressway’
groups on key demographic and travel characteristics, indicating that no significant
differences were identified between these characteristics. As can be seen, each of the three
groups fitted with the total sample with those aged 45-54 years and 55-64 years being
sampled at a higher rate than other age groups. Travelling as a car driver was by far the
most common transport mode for each of the three groups, with travelling as a car
passenger being the second most common transport form for both the ‘willing to stop’ and
‘Expressway’ groups. Walking was by contrast the second most common transport mode
for the Otaki residents.
0
10
20
30
40
50
60
70
80
90
100
0.5 1 1.5 2 2.5 3 3.5 4 4.5 5 or
more
Cu
mu
lati
ve
pe
rce
nt
willi
ng
to
tra
ve
l to
Ota
ki
Time sacrifice (minutes)
Otaki Customer Survey
9
Table 7: Demographic and travel characteristics by Otaki residents (N=205), ‘willing to stop’ (N=228)
and ‘Expressway’ (N=53) groups.
Key Variable Otaki residents ‘Willing to
stop’
‘Expressway’
group
Significant
difference
Gender
Male 75 (36.8%) 105 (46.3%) 27 (50.9%)
Female 129 (63.2%) 122 (53.7%) 26 (49.1%)
Age
16-24 15 (7.4%) 29 (12.7%) 9 (17.0%)
24-34 17 (8.3%) 27 (11.8%) 5 (9.4%)
35-44 28 (13.7%) 34 (14.9%) 9 (17.0%)
45-54 40 (19.6%) 60 (26.3%) 13 (24.5%)
55-64 49 (24.0%) 46 (20.2%) 10 (18.9%)
65-74 32 (15.7%) 25 (11.0%) 6 (11.3%)
75+ 23 (11.3%) 7 (3.1%) 1 (1.9%)
Travel mode
Car driver 147 (73.1%) 190 (83.3%) 39 (73.6%)
Car passenger 14 (7.0%) 26 (11.4%) 11 (20.8%)
Bus 2 (1.0%) 4 (1.8%) 1 (1.9%)
Walking 28 (13.9%) 4 (1.8%) 1 (1.9%)
Cycling 6 (3.0%) 3 (1.3%) 0 (0.0%)
Other 4 (2.0%) 1 (0.4%) 1 (1.9%)
Journey length
Less than 30 minutes 174 (86.6%) 93 (41.0%) 10 (18.9%)
30-60 minutes 15 (7.5%) 43 (18.9%) 3 (5.7%)
60-90 minutes 7 (3.5%) 23 (10.1%) 7 (13.2%)
90-120 minutes 1 (0.5%) 17 (7.5%) 9 (17.0%)
2-3 hours 3 (1.5%) 20 (8.8%) 9 (17.0%)
3-4 hours 0 (0.0%) 12 (5.3%) 4 (7.5%)
4 or more hours 1 (0.5%) 19 (8.4%) 11 (20.8%)
** p < .01, *** p < .001.
As Table 8 shows, statistical tests revealed a number of the differences between the three
groups were statistically significant. The expected variation was also found in relation to
both their frequency of visits to the Otaki shops, χ2 (6, N = 486) = 189.14, p < .001, and
frequency of travelling through Otaki on SH1, χ2 (6, N = 483) = 99.20, p < .001. Otaki
residents were significantly more likely to visit the shops on a daily or weekly basis
compared to the other two groups. In contrast, those categorised as ‘willing to stop’ and the
‘Expressway’ group were significantly more likely to visit the shops on a monthly or ‘other’
basis not quantified in the previous categories than the Otaki residents. A similar trend was
observed in relation to frequency of travelling through Otaki on SH1; with Otaki residents
significantly more likely to do so on a daily or weekly basis, where as the ‘willing to stop’
and ‘Expressway’ groups were significantly more likely to travel through on a monthly or
‘other’ basis.
Anticipated time spent in Otaki on the day of surveying also differed significantly between
the three groups, χ2 (6, N = 480) = 41.02, p < .001. The ‘Expressway’ group was
Otaki Customer Survey
10
significantly more likely to anticipate their visit lasting ‘15 minutes or less’ than either the
Otaki residents or those ‘willing to stop’. The ‘Expressway’ group was also significantly less
likely to anticipate their visit lasting ‘more than 60 minutes’ than the other two groups.
Table 8. Exposure to Otaki by Otaki residents (N=205), ‘willing to stop’ (N=228) and ‘Expressway’
(N=53) groups.
Key Variable Otaki residents ‘Willing to
stop’
‘Expressway’
group
Significant
difference
Anticipated time spent in Otaki
Under 15 minutes 34 (17.1%) 25 (11.0%) 23 (43.4%) ***
15-30 minutes 33 (16.6%) 45 (19.7%) 12 (22.6%) ***
30-60 minutes 26 (13.1%) 47 (20.6%) 7 (13.2%) ***
More than 60 minutes 106 (53.3%) 111 (48.7%) 11 (20.8%) ***
Frequency visit Otaki shops
Daily 126 (61.5%) 32 (14.0%) 3 (5.7%) ***
Weekly 61 (29.8%) 52 (22.8%) 8 (15.1%) ***
Monthly 6 (2.9%) 47 (20.6%) 10 (18.9%) ***
Other3 12 (5.9%) 97 (42.5%) 32 (60.4%) ***
Frequency travel through Otaki on SH1
Daily 102 (50.2%) 37 (16.3%) 3 (5.7%) ***
Weekly 54 (26.6%) 47 (20.7%) 12 (22.6%) ***
Monthly 14 (6.9%) 53 (23.3%) 14 (26.4%) ***
Other 33 (16.3%) 90 (39.6%) 24 (45.3%) ***
** p < .01, *** p < .001.
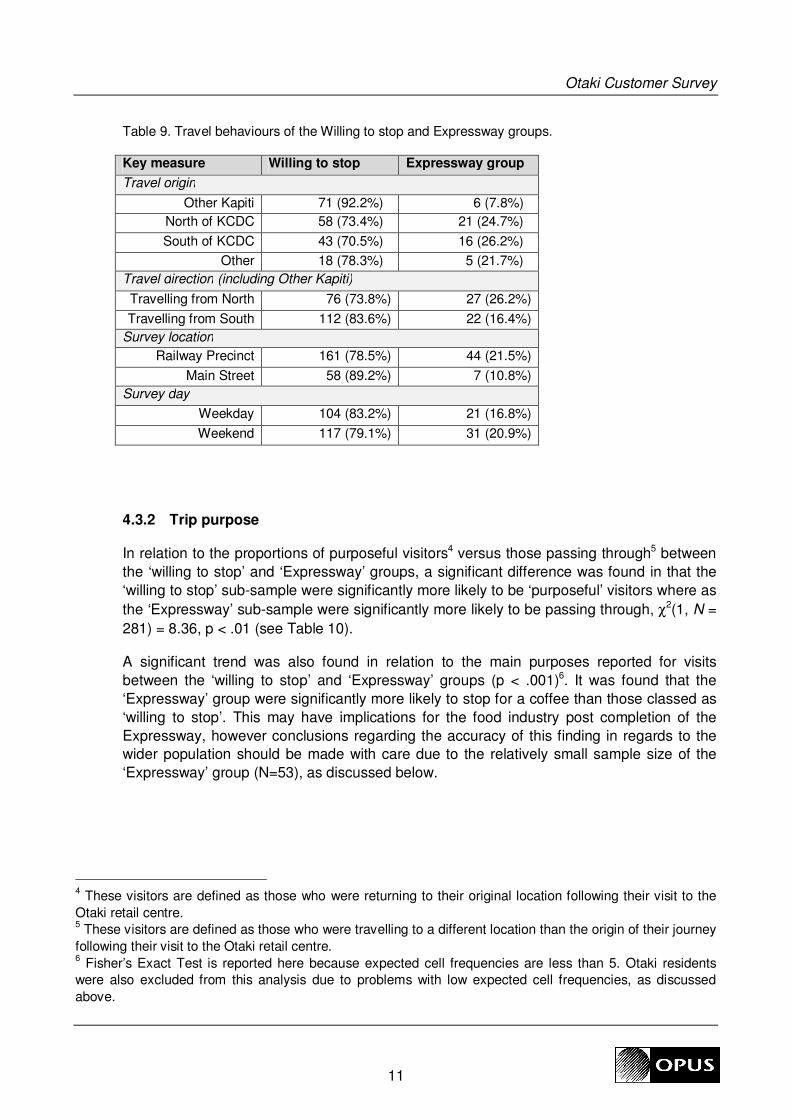
4.3.1 Travel Behaviour and Expressway Use
The estimated percentage of shoppers that will no longer stop in Otaki after the introduction
of the proposed Peka Peka to Otaki Expressway is outlined in the Table 9 by key travel
behaviour. Otaki residents have not been included in these figures, as the focus here is on
people currently travelling to Otaki that may utilise the proposed Expressway in the future.
People that were more likely to use the Expressway included those travelling 1) from the
North, 2) on weekend days, and 3) to the Railway Precinct (SH1). The only significant
difference is for the Railway Precinct, where businesses within this retail area are likely to
be more greatly impacted than other businesses. These findings also have implications for
transport demand and congestion modelling.
3 Respondents classed in the ‘willing to stop’ and ‘Expressway’ groups who gave an explanation for
endorsing the ‘Other’ option for both frequency of visiting the Otaki shops and frequency of travelling through
Otaki on SH1 commonly stated that trips were annual or bi annual, indicating that trips are likely generally on
annual holidays, for example.
Otaki Customer Survey
11
Table 9. Travel behaviours of the Willing to stop and Expressway groups.
Key measure Willing to stop Expressway group
Travel origin
Other Kapiti 71 (92.2%) 6 (7.8%)
North of KCDC 58 (73.4%) 21 (24.7%)
South of KCDC 43 (70.5%) 16 (26.2%)
Other 18 (78.3%) 5 (21.7%)
Travel direction (including Other Kapiti)
Travelling from North 76 (73.8%) 27 (26.2%)
Travelling from South 112 (83.6%) 22 (16.4%)
Survey location
Railway Precinct 161 (78.5%) 44 (21.5%)
Main Street 58 (89.2%) 7 (10.8%)
Survey day
Weekday 104 (83.2%) 21 (16.8%)
Weekend 117 (79.1%) 31 (20.9%)
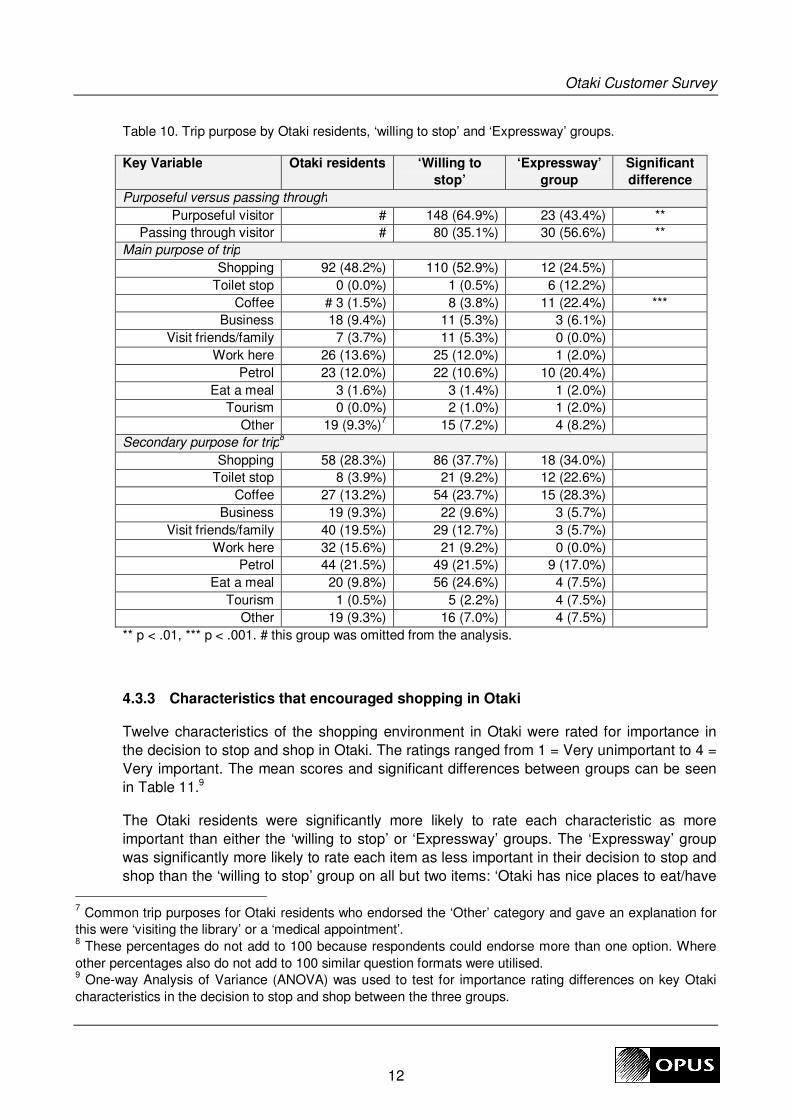
4.3.2 Trip purpose
In relation to the proportions of purposeful visitors4 versus those passing through5 between
the ‘willing to stop’ and ‘Expressway’ groups, a significant difference was found in that the
‘willing to stop’ sub-sample were significantly more likely to be ‘purposeful’ visitors where as
the ‘Expressway’ sub-sample were significantly more likely to be passing through, χ2(1, N =
281) = 8.36, p < .01 (see Table 10).
A significant trend was also found in relation to the main purposes reported for visits
between the ‘willing to stop’ and ‘Expressway’ groups (p < .001)6. It was found that the
‘Expressway’ group were significantly more likely to stop for a coffee than those classed as
‘willing to stop’. This may have implications for the food industry post completion of the
Expressway, however conclusions regarding the accuracy of this finding in regards to the
wider population should be made with care due to the relatively small sample size of the
‘Expressway’ group (N=53), as discussed below.
4 These visitors are defined as those who were returning to their original location following their visit to the
Otaki retail centre. 5 These visitors are defined as those who were travelling to a different location than the origin of their journey
following their visit to the Otaki retail centre. 6 Fisher’s Exact Test is reported here because expected cell frequencies are less than 5. Otaki residents
were also excluded from this analysis due to problems with low expected cell frequencies, as discussed
above.
Otaki Customer Survey
12
Table 10. Trip purpose by Otaki residents, ‘willing to stop’ and ‘Expressway’ groups.
Key Variable Otaki residents ‘Willing to
stop’
‘Expressway’
group
Significant
difference
Purposeful versus passing through
Purposeful visitor # 148 (64.9%) 23 (43.4%) **
Passing through visitor # 80 (35.1%) 30 (56.6%) **
Main purpose of trip
Shopping 92 (48.2%) 110 (52.9%) 12 (24.5%)
Toilet stop 0 (0.0%) 1 (0.5%) 6 (12.2%)
Coffee # 3 (1.5%) 8 (3.8%) 11 (22.4%) ***
Business 18 (9.4%) 11 (5.3%) 3 (6.1%)
Visit friends/family 7 (3.7%) 11 (5.3%) 0 (0.0%)
Work here 26 (13.6%) 25 (12.0%) 1 (2.0%)
Petrol 23 (12.0%) 22 (10.6%) 10 (20.4%)
Eat a meal 3 (1.6%) 3 (1.4%) 1 (2.0%)
Tourism 0 (0.0%) 2 (1.0%) 1 (2.0%)
Other 19 (9.3%)7 15 (7.2%) 4 (8.2%)
Secondary purpose for trip8
Shopping 58 (28.3%) 86 (37.7%) 18 (34.0%)
Toilet stop 8 (3.9%) 21 (9.2%) 12 (22.6%)
Coffee 27 (13.2%) 54 (23.7%) 15 (28.3%)
Business 19 (9.3%) 22 (9.6%) 3 (5.7%)
Visit friends/family 40 (19.5%) 29 (12.7%) 3 (5.7%)
Work here 32 (15.6%) 21 (9.2%) 0 (0.0%)
Petrol 44 (21.5%) 49 (21.5%) 9 (17.0%)
Eat a meal 20 (9.8%) 56 (24.6%) 4 (7.5%)
Tourism 1 (0.5%) 5 (2.2%) 4 (7.5%)
Other 19 (9.3%) 16 (7.0%) 4 (7.5%)
** p < .01, *** p < .001. # this group was omitted from the analysis.
4.3.3 Characteristics that encouraged shopping in Otaki
Twelve characteristics of the shopping environment in Otaki were rated for importance in
the decision to stop and shop in Otaki. The ratings ranged from 1 = Very unimportant to 4 =
Very important. The mean scores and significant differences between groups can be seen
in Table 11.9
The Otaki residents were significantly more likely to rate each characteristic as more
important than either the ‘willing to stop’ or ‘Expressway’ groups. The ‘Expressway’ group
was significantly more likely to rate each item as less important in their decision to stop and
shop than the ‘willing to stop’ group on all but two items: ‘Otaki has nice places to eat/have
7 Common trip purposes for Otaki residents who endorsed the ‘Other’ category and gave an explanation for
this were ‘visiting the library’ or a ‘medical appointment’. 8 These percentages do not add to 100 because respondents could endorse more than one option. Where
other percentages also do not add to 100 similar question formats were utilised. 9 One-way Analysis of Variance (ANOVA) was used to test for importance rating differences on key Otaki
characteristics in the decision to stop and shop between the three groups.
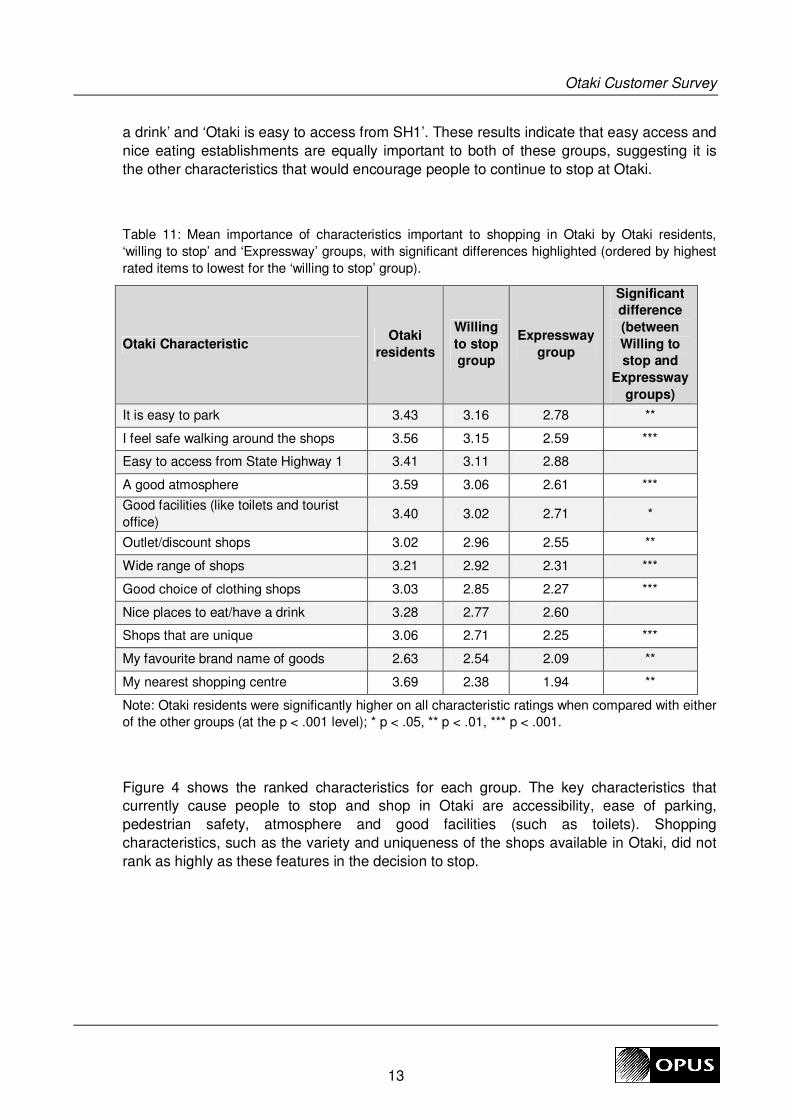
Otaki Customer Survey
13
a drink’ and ‘Otaki is easy to access from SH1’. These results indicate that easy access and
nice eating establishments are equally important to both of these groups, suggesting it is
the other characteristics that would encourage people to continue to stop at Otaki.
Table 11: Mean importance of characteristics important to shopping in Otaki by Otaki residents,
‘willing to stop’ and ‘Expressway’ groups, with significant differences highlighted (ordered by highest
rated items to lowest for the ‘willing to stop’ group).
Otaki Characteristic Otaki
residents
Willing
to stop
group
Expressway
group
Significant
difference
(between
Willing to
stop and
Expressway
groups)
It is easy to park 3.43 3.16 2.78 **
I feel safe walking around the shops 3.56 3.15 2.59 ***
Easy to access from State Highway 1 3.41 3.11 2.88
A good atmosphere 3.59 3.06 2.61 ***
Good facilities (like toilets and tourist
office) 3.40 3.02 2.71 *
Outlet/discount shops 3.02 2.96 2.55 **
Wide range of shops 3.21 2.92 2.31 ***
Good choice of clothing shops 3.03 2.85 2.27 ***
Nice places to eat/have a drink 3.28 2.77 2.60
Shops that are unique 3.06 2.71 2.25 ***
My favourite brand name of goods 2.63 2.54 2.09 **
My nearest shopping centre 3.69 2.38 1.94 **
Note: Otaki residents were significantly higher on all characteristic ratings when compared with either
of the other groups (at the p < .001 level); * p < .05, ** p < .01, *** p < .001.
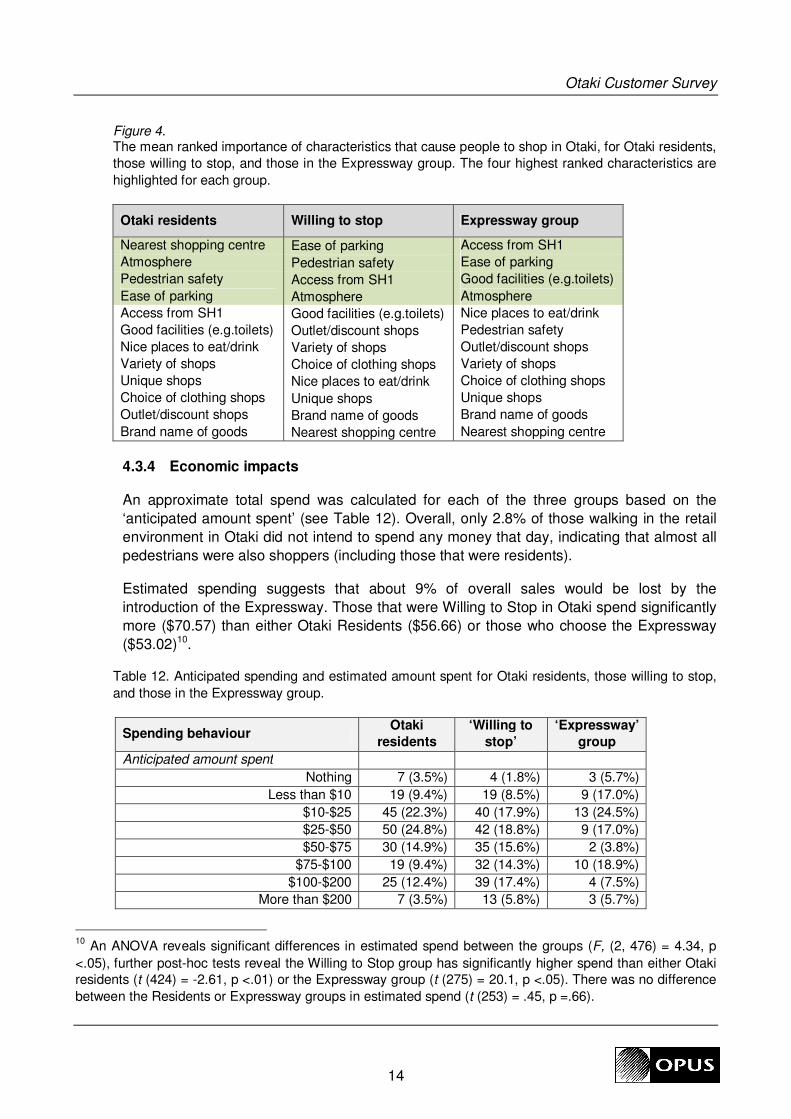
Figure 4 shows the ranked characteristics for each group. The key characteristics that
currently cause people to stop and shop in Otaki are accessibility, ease of parking,
pedestrian safety, atmosphere and good facilities (such as toilets). Shopping
characteristics, such as the variety and uniqueness of the shops available in Otaki, did not
rank as highly as these features in the decision to stop.
Otaki Customer Survey
14
Figure 4. The mean ranked importance of characteristics that cause people to shop in Otaki, for Otaki residents,
those willing to stop, and those in the Expressway group. The four highest ranked characteristics are
highlighted for each group.
Otaki residents Willing to stop Expressway group
Nearest shopping centre Ease of parking Access from SH1
Atmosphere Pedestrian safety Ease of parking
Pedestrian safety Access from SH1 Good facilities (e.g.toilets)
Ease of parking Atmosphere Atmosphere
Access from SH1 Good facilities (e.g.toilets) Nice places to eat/drink
Good facilities (e.g.toilets) Outlet/discount shops Pedestrian safety
Nice places to eat/drink Variety of shops Outlet/discount shops
Variety of shops Choice of clothing shops Variety of shops
Unique shops Nice places to eat/drink Choice of clothing shops
Choice of clothing shops Unique shops Unique shops
Outlet/discount shops Brand name of goods Brand name of goods
Brand name of goods Nearest shopping centre Nearest shopping centre
4.3.4 Economic impacts
An approximate total spend was calculated for each of the three groups based on the
‘anticipated amount spent’ (see Table 12). Overall, only 2.8% of those walking in the retail
environment in Otaki did not intend to spend any money that day, indicating that almost all
pedestrians were also shoppers (including those that were residents).
Estimated spending suggests that about 9% of overall sales would be lost by the
introduction of the Expressway. Those that were Willing to Stop in Otaki spend significantly
more ($70.57) than either Otaki Residents ($56.66) or those who choose the Expressway
($53.02)10.
Table 12. Anticipated spending and estimated amount spent for Otaki residents, those willing to stop,
and those in the Expressway group.
Spending behaviour Otaki
residents
‘Willing to
stop’
‘Expressway’
group
Anticipated amount spent
Nothing 7 (3.5%) 4 (1.8%) 3 (5.7%)
Less than $10 19 (9.4%) 19 (8.5%) 9 (17.0%)
$10-$25 45 (22.3%) 40 (17.9%) 13 (24.5%)
$25-$50 50 (24.8%) 42 (18.8%) 9 (17.0%)
$50-$75 30 (14.9%) 35 (15.6%) 2 (3.8%)
$75-$100 19 (9.4%) 32 (14.3%) 10 (18.9%)
$100-$200 25 (12.4%) 39 (17.4%) 4 (7.5%)
More than $200 7 (3.5%) 13 (5.8%) 3 (5.7%)
10
An ANOVA reveals significant differences in estimated spend between the groups (F, (2, 476) = 4.34, p
<.05), further post-hoc tests reveal the Willing to Stop group has significantly higher spend than either Otaki residents (t (424) = -2.61, p <.01) or the Expressway group (t (275) = 20.1, p <.05). There was no difference
between the Residents or Expressway groups in estimated spend (t (253) = .45, p =.66).
Otaki Customer Survey
15
Spending behaviour Otaki
residents
‘Willing to
stop’
‘Expressway’
group
Estimated spending11
Estimated mean spend (per person) $56.66 $70.57 $53.02
Estimated total spend $11,445.00 $15,807.50 $2,810.00
Percentage of total spend by group 38.1% 52.7% 9.2%
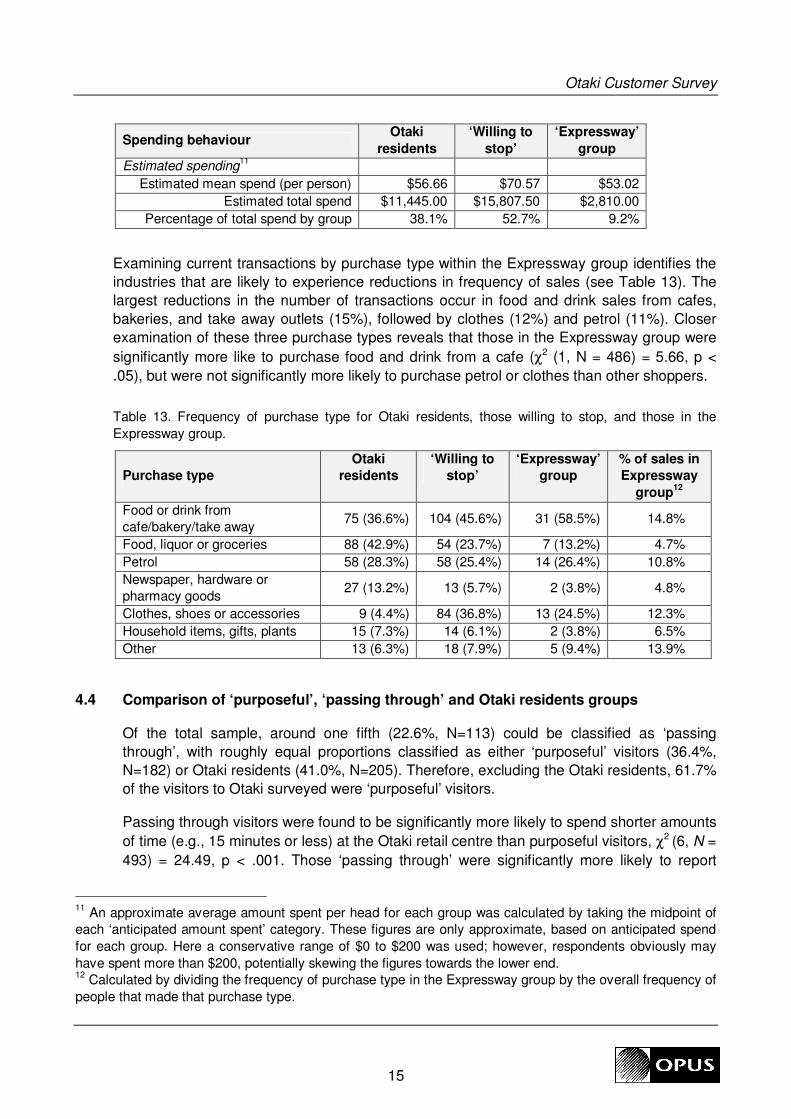
Examining current transactions by purchase type within the Expressway group identifies the
industries that are likely to experience reductions in frequency of sales (see Table 13). The
largest reductions in the number of transactions occur in food and drink sales from cafes,
bakeries, and take away outlets (15%), followed by clothes (12%) and petrol (11%). Closer
examination of these three purchase types reveals that those in the Expressway group were
significantly more like to purchase food and drink from a cafe (χ2 (1, N = 486) = 5.66, p <
.05), but were not significantly more likely to purchase petrol or clothes than other shoppers.
Table 13. Frequency of purchase type for Otaki residents, those willing to stop, and those in the
Expressway group.
Purchase type
Otaki
residents
‘Willing to
stop’
‘Expressway’
group
% of sales in
Expressway
group12
Food or drink from
cafe/bakery/take away 75 (36.6%) 104 (45.6%) 31 (58.5%) 14.8%
Food, liquor or groceries 88 (42.9%) 54 (23.7%) 7 (13.2%) 4.7%
Petrol 58 (28.3%) 58 (25.4%) 14 (26.4%) 10.8%
Newspaper, hardware or
pharmacy goods 27 (13.2%) 13 (5.7%) 2 (3.8%) 4.8%
Clothes, shoes or accessories 9 (4.4%) 84 (36.8%) 13 (24.5%) 12.3%
Household items, gifts, plants 15 (7.3%) 14 (6.1%) 2 (3.8%) 6.5%
Other 13 (6.3%) 18 (7.9%) 5 (9.4%) 13.9%
4.4 Comparison of ‘purposeful’, ‘passing through’ and Otaki residents groups
Of the total sample, around one fifth (22.6%, N=113) could be classified as ‘passing
through’, with roughly equal proportions classified as either ‘purposeful’ visitors (36.4%,
N=182) or Otaki residents (41.0%, N=205). Therefore, excluding the Otaki residents, 61.7%
of the visitors to Otaki surveyed were ‘purposeful’ visitors.
Passing through visitors were found to be significantly more likely to spend shorter amounts
of time (e.g., 15 minutes or less) at the Otaki retail centre than purposeful visitors, χ2 (6, N =
493) = 24.49, p < .001. Those ‘passing through’ were significantly more likely to report
11
An approximate average amount spent per head for each group was calculated by taking the midpoint of
each ‘anticipated amount spent’ category. These figures are only approximate, based on anticipated spend
for each group. Here a conservative range of $0 to $200 was used; however, respondents obviously may
have spent more than $200, potentially skewing the figures towards the lower end. 12
Calculated by dividing the frequency of purchase type in the Expressway group by the overall frequency of
people that made that purchase type.
Otaki Customer Survey
16
purchasing coffee, petrol or a meal as the main purpose of the trip, when compared with
purposeful visitors, χ2 (8, N = 458) = 40.22, p < .001.
Differences were also found in relation to the spending patterns of these three groups. The
most common purchases for the ‘purposeful’ visitors were food or drink at a cafe and
clothes. Common purchases for the ‘passing through’ visitors also included food or drink at
a cafe and clothes, however, petrol was also a relatively frequent purchase. As previously
mentioned, common purchases for the Otaki residents included food, liquor or groceries,
food or drink at a cafe and petrol.
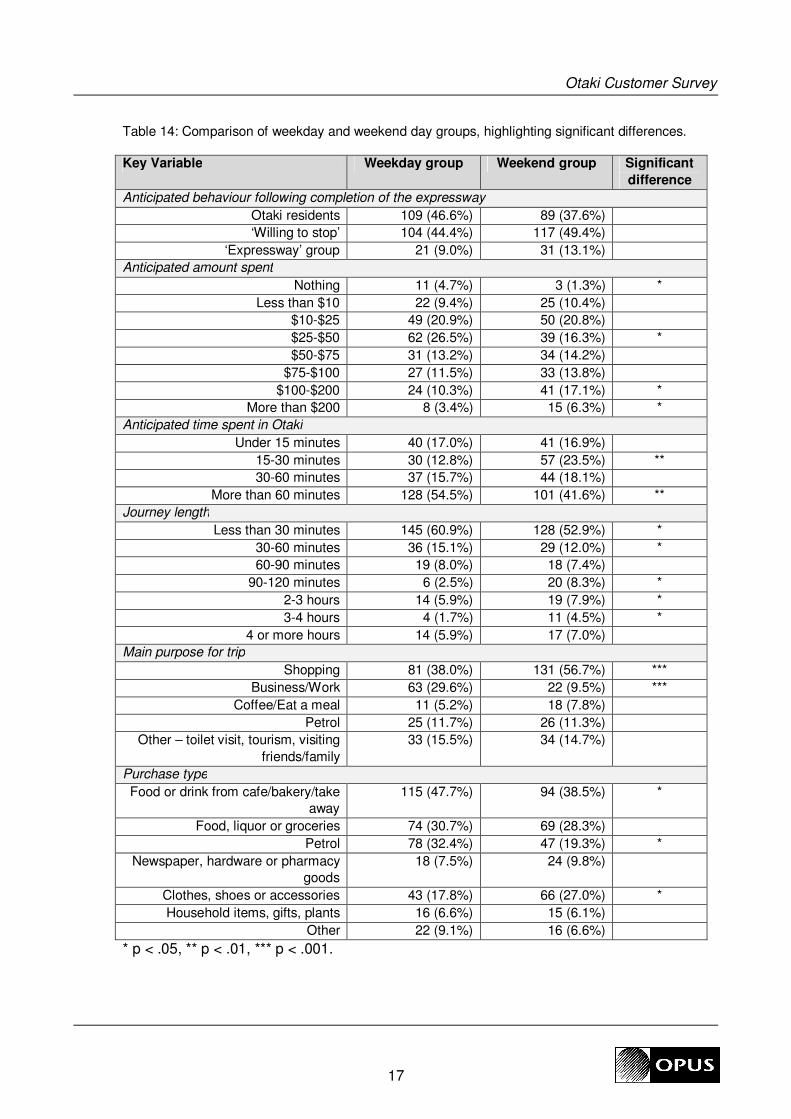
4.5 Comparison of weekday versus weekend groups
Comparison of the weekday (N=241) versus weekend day (N=244) sub-samples reveals
several trends. A summary of the differences found between the two groups are provided in
Table 14, indicating the significant differences that were found. No significant difference
was found between the two groups in terms of anticipated behaviour following completion of
the Expressway, χ2(2, N = 471) = 4.69, p = .09, therefore no one group (Otaki residents,
‘willing to stop’ or ‘Expressway’) were more likely to be sampled on either day.
Spending patterns were found to differ significantly between the two groups, χ2 (7, N = 474)
= 17.25, p < .05. Those sampled on the weekday were significantly more likely to spend
smaller amounts (e.g., nothing or $25-$50), where as those sampled on the weekend day
were significantly more likely to spend larger amounts (e.g., $100-$200 or more than $200).
In relation to the duration of the visit to the Otaki shops, a significant difference was found
(χ2(3, N = 478) = 12.05, p < .05) in that those sampled on the weekday were significantly
more likely to spend longer periods (e.g., ‘60 minutes or more’) in the retail centre than
those sampled on the weekend day. The opposite was found in terms of journey length
between the two sampling days, with weekend day respondents being significantly more
likely to have longer trip lengths (e.g., 90-120 minutes, 2-3 hours and 3-4 hours) than
weekday respondents, χ2(6, N = 480) = 13.66, p < .05.
A significant difference was also found between the two groups in terms of the main
purposes reported for their trips, χ2 (4, N = 444) = 35.30, p < .001. Weekday respondents
were significantly more likely to report business or work as the main purpose of their trip,
where as weekend day respondents were significantly more likely to report shopping as the
main purpose for their trip.
Finally, in terms of purchase types, the weekend sub-sample was more likely to report
clothes as a purchase than the weekday sub-sample, whereas the weekday sub-sample
was more likely to purchase food or drink at a cafe and petrol than the weekend sub-
sample.
Otaki Customer Survey
17
Table 14: Comparison of weekday and weekend day groups, highlighting significant differences.
Key Variable Weekday group Weekend group Significant
difference
Anticipated behaviour following completion of the expressway
Otaki residents 109 (46.6%) 89 (37.6%)
‘Willing to stop’ 104 (44.4%) 117 (49.4%)
‘Expressway’ group 21 (9.0%) 31 (13.1%)
Anticipated amount spent
Nothing 11 (4.7%) 3 (1.3%) *
Less than $10 22 (9.4%) 25 (10.4%)
$10-$25 49 (20.9%) 50 (20.8%)
$25-$50 62 (26.5%) 39 (16.3%) *
$50-$75 31 (13.2%) 34 (14.2%)
$75-$100 27 (11.5%) 33 (13.8%)
$100-$200 24 (10.3%) 41 (17.1%) *
More than $200 8 (3.4%) 15 (6.3%) *
Anticipated time spent in Otaki
Under 15 minutes 40 (17.0%) 41 (16.9%)
15-30 minutes 30 (12.8%) 57 (23.5%) **
30-60 minutes 37 (15.7%) 44 (18.1%)
More than 60 minutes 128 (54.5%) 101 (41.6%) **
Journey length
Less than 30 minutes 145 (60.9%) 128 (52.9%) *
30-60 minutes 36 (15.1%) 29 (12.0%) *
60-90 minutes 19 (8.0%) 18 (7.4%)
90-120 minutes 6 (2.5%) 20 (8.3%) *
2-3 hours 14 (5.9%) 19 (7.9%) *
3-4 hours 4 (1.7%) 11 (4.5%) *
4 or more hours 14 (5.9%) 17 (7.0%)
Main purpose for trip
Shopping 81 (38.0%) 131 (56.7%) ***
Business/Work 63 (29.6%) 22 (9.5%) ***
Coffee/Eat a meal 11 (5.2%) 18 (7.8%)
Petrol 25 (11.7%) 26 (11.3%)
Other – toilet visit, tourism, visiting
friends/family
33 (15.5%) 34 (14.7%)
Purchase type
Food or drink from cafe/bakery/take
away
115 (47.7%) 94 (38.5%) *
Food, liquor or groceries 74 (30.7%) 69 (28.3%)
Petrol 78 (32.4%) 47 (19.3%) *
Newspaper, hardware or pharmacy
goods
18 (7.5%) 24 (9.8%)
Clothes, shoes or accessories 43 (17.8%) 66 (27.0%) *
Household items, gifts, plants 16 (6.6%) 15 (6.1%)
Other 22 (9.1%) 16 (6.6%)
* p < .05, ** p < .01, *** p < .001.
Otaki Customer Survey
18
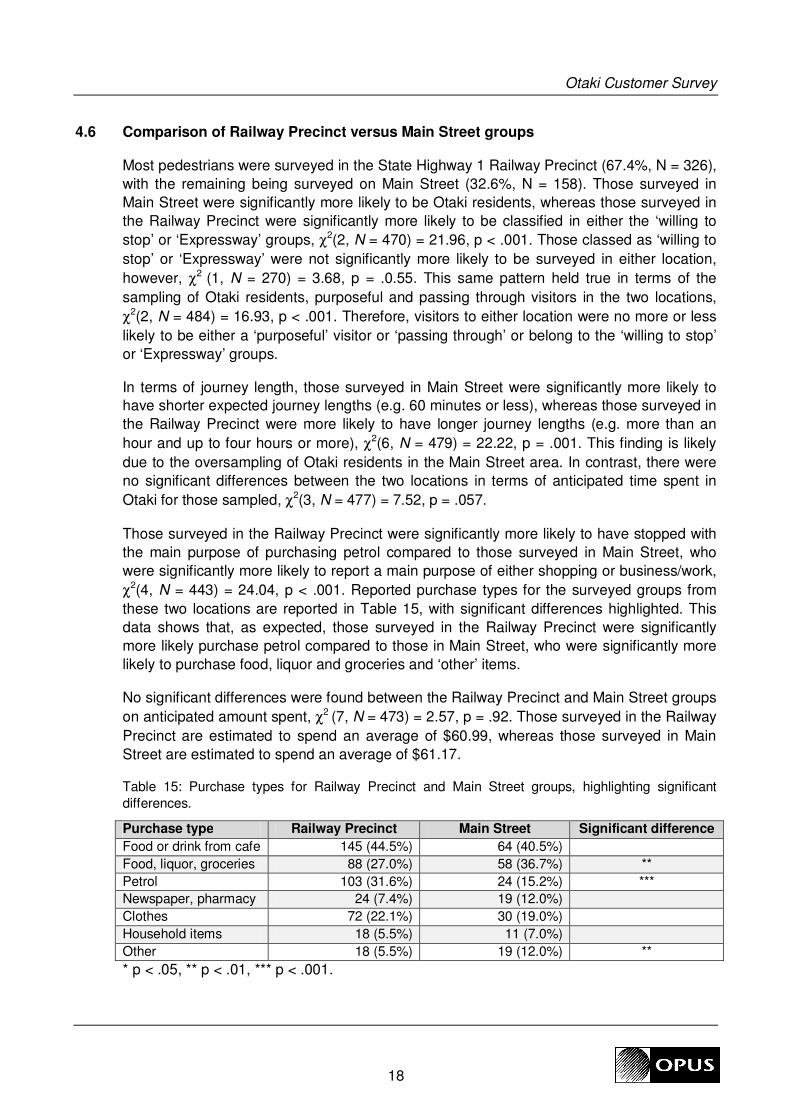
4.6 Comparison of Railway Precinct versus Main Street groups
Most pedestrians were surveyed in the State Highway 1 Railway Precinct (67.4%, N = 326),
with the remaining being surveyed on Main Street (32.6%, N = 158). Those surveyed in
Main Street were significantly more likely to be Otaki residents, whereas those surveyed in
the Railway Precinct were significantly more likely to be classified in either the ‘willing to
stop’ or ‘Expressway’ groups, χ2(2, N = 470) = 21.96, p < .001. Those classed as ‘willing to
stop’ or ‘Expressway’ were not significantly more likely to be surveyed in either location,
however, χ2 (1, N = 270) = 3.68, p = .0.55. This same pattern held true in terms of the
sampling of Otaki residents, purposeful and passing through visitors in the two locations,
χ2(2, N = 484) = 16.93, p < .001. Therefore, visitors to either location were no more or less
likely to be either a ‘purposeful’ visitor or ‘passing through’ or belong to the ‘willing to stop’
or ‘Expressway’ groups.
In terms of journey length, those surveyed in Main Street were significantly more likely to
have shorter expected journey lengths (e.g. 60 minutes or less), whereas those surveyed in
the Railway Precinct were more likely to have longer journey lengths (e.g. more than an
hour and up to four hours or more), χ2(6, N = 479) = 22.22, p = .001. This finding is likely
due to the oversampling of Otaki residents in the Main Street area. In contrast, there were
no significant differences between the two locations in terms of anticipated time spent in
Otaki for those sampled, χ2(3, N = 477) = 7.52, p = .057.
Those surveyed in the Railway Precinct were significantly more likely to have stopped with
the main purpose of purchasing petrol compared to those surveyed in Main Street, who
were significantly more likely to report a main purpose of either shopping or business/work,
χ2(4, N = 443) = 24.04, p < .001. Reported purchase types for the surveyed groups from
these two locations are reported in Table 15, with significant differences highlighted. This
data shows that, as expected, those surveyed in the Railway Precinct were significantly
more likely purchase petrol compared to those in Main Street, who were significantly more
likely to purchase food, liquor and groceries and ‘other’ items.
No significant differences were found between the Railway Precinct and Main Street groups
on anticipated amount spent, χ2 (7, N = 473) = 2.57, p = .92. Those surveyed in the Railway
Precinct are estimated to spend an average of $60.99, whereas those surveyed in Main
Street are estimated to spend an average of $61.17.
Table 15: Purchase types for Railway Precinct and Main Street groups, highlighting significant
differences.
Purchase type Railway Precinct Main Street Significant difference
Food or drink from cafe 145 (44.5%) 64 (40.5%)
Food, liquor, groceries 88 (27.0%) 58 (36.7%) **
Petrol 103 (31.6%) 24 (15.2%) ***
Newspaper, pharmacy 24 (7.4%) 19 (12.0%)
Clothes 72 (22.1%) 30 (19.0%)
Household items 18 (5.5%) 11 (7.0%)
Other 18 (5.5%) 19 (12.0%) **
* p < .05, ** p < .01, *** p < .001.
Otaki Customer Survey
19
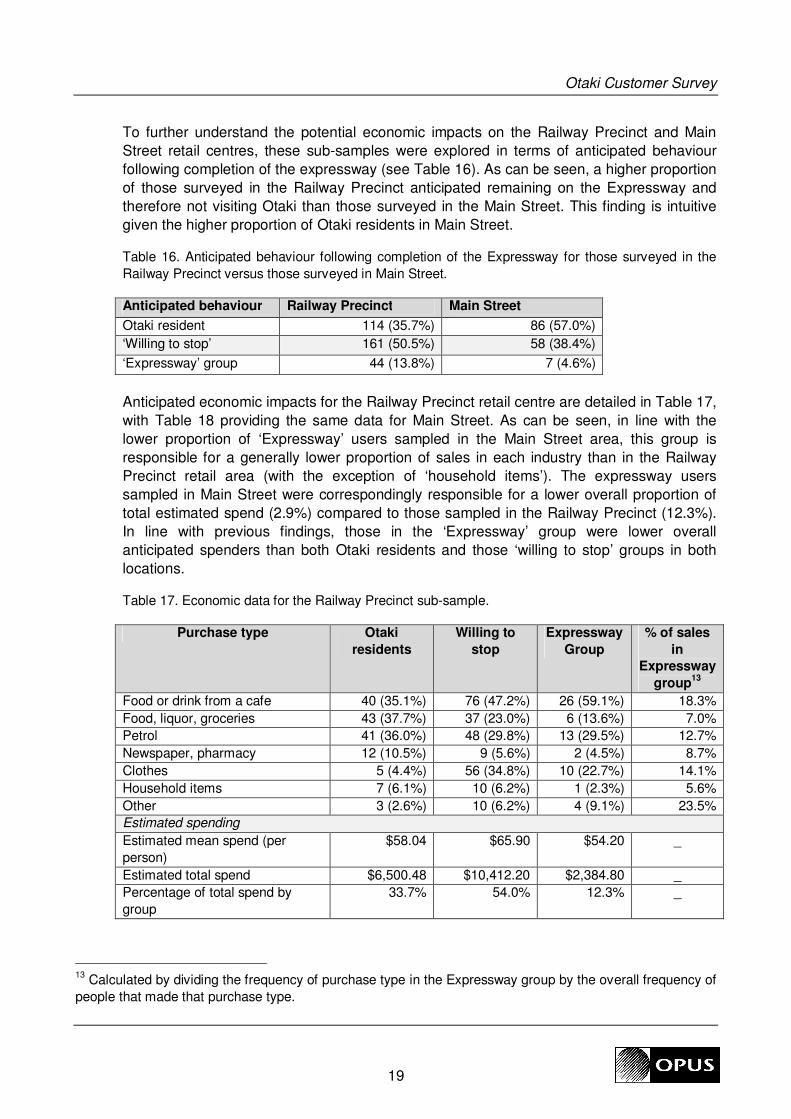
To further understand the potential economic impacts on the Railway Precinct and Main
Street retail centres, these sub-samples were explored in terms of anticipated behaviour
following completion of the expressway (see Table 16). As can be seen, a higher proportion
of those surveyed in the Railway Precinct anticipated remaining on the Expressway and
therefore not visiting Otaki than those surveyed in the Main Street. This finding is intuitive
given the higher proportion of Otaki residents in Main Street.
Table 16. Anticipated behaviour following completion of the Expressway for those surveyed in the
Railway Precinct versus those surveyed in Main Street.
Anticipated behaviour Railway Precinct Main Street
Otaki resident 114 (35.7%) 86 (57.0%)
‘Willing to stop’ 161 (50.5%) 58 (38.4%)
‘Expressway’ group 44 (13.8%) 7 (4.6%)
Anticipated economic impacts for the Railway Precinct retail centre are detailed in Table 17,
with Table 18 providing the same data for Main Street. As can be seen, in line with the
lower proportion of ‘Expressway’ users sampled in the Main Street area, this group is
responsible for a generally lower proportion of sales in each industry than in the Railway
Precinct retail area (with the exception of ‘household items’). The expressway users
sampled in Main Street were correspondingly responsible for a lower overall proportion of
total estimated spend (2.9%) compared to those sampled in the Railway Precinct (12.3%).
In line with previous findings, those in the ‘Expressway’ group were lower overall
anticipated spenders than both Otaki residents and those ‘willing to stop’ groups in both
locations.
Table 17. Economic data for the Railway Precinct sub-sample.
Purchase type Otaki
residents
Willing to
stop
Expressway
Group
% of sales
in
Expressway
group13
Food or drink from a cafe 40 (35.1%) 76 (47.2%) 26 (59.1%) 18.3%
Food, liquor, groceries 43 (37.7%) 37 (23.0%) 6 (13.6%) 7.0%
Petrol 41 (36.0%) 48 (29.8%) 13 (29.5%) 12.7%
Newspaper, pharmacy 12 (10.5%) 9 (5.6%) 2 (4.5%) 8.7%
Clothes 5 (4.4%) 56 (34.8%) 10 (22.7%) 14.1%
Household items 7 (6.1%) 10 (6.2%) 1 (2.3%) 5.6%
Other 3 (2.6%) 10 (6.2%) 4 (9.1%) 23.5%
Estimated spending
Estimated mean spend (per
person)
$58.04 $65.90 $54.20 _
Estimated total spend $6,500.48 $10,412.20 $2,384.80 _
Percentage of total spend by
group
33.7% 54.0% 12.3% _
13
Calculated by dividing the frequency of purchase type in the Expressway group by the overall frequency of
people that made that purchase type.
Otaki Customer Survey
20
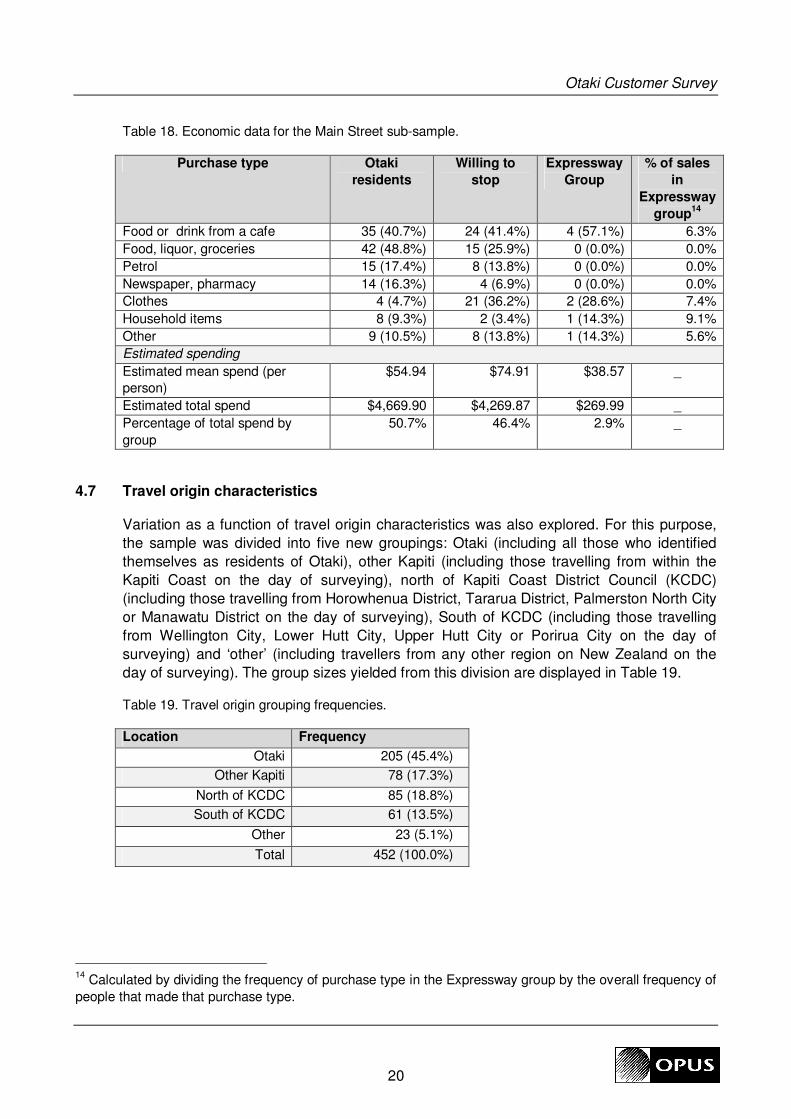
Table 18. Economic data for the Main Street sub-sample.
Purchase type Otaki
residents
Willing to
stop
Expressway
Group
% of sales
in
Expressway
group14
Food or drink from a cafe 35 (40.7%) 24 (41.4%) 4 (57.1%) 6.3%
Food, liquor, groceries 42 (48.8%) 15 (25.9%) 0 (0.0%) 0.0%
Petrol 15 (17.4%) 8 (13.8%) 0 (0.0%) 0.0%
Newspaper, pharmacy 14 (16.3%) 4 (6.9%) 0 (0.0%) 0.0%
Clothes 4 (4.7%) 21 (36.2%) 2 (28.6%) 7.4%
Household items 8 (9.3%) 2 (3.4%) 1 (14.3%) 9.1%
Other 9 (10.5%) 8 (13.8%) 1 (14.3%) 5.6%
Estimated spending
Estimated mean spend (per
person)
$54.94 $74.91 $38.57 _
Estimated total spend $4,669.90 $4,269.87 $269.99 _
Percentage of total spend by
group
50.7% 46.4% 2.9% _
4.7 Travel origin characteristics
Variation as a function of travel origin characteristics was also explored. For this purpose,
the sample was divided into five new groupings: Otaki (including all those who identified
themselves as residents of Otaki), other Kapiti (including those travelling from within the
Kapiti Coast on the day of surveying), north of Kapiti Coast District Council (KCDC)
(including those travelling from Horowhenua District, Tararua District, Palmerston North City
or Manawatu District on the day of surveying), South of KCDC (including those travelling
from Wellington City, Lower Hutt City, Upper Hutt City or Porirua City on the day of
surveying) and ‘other’ (including travellers from any other region on New Zealand on the
day of surveying). The group sizes yielded from this division are displayed in Table 19.
Table 19. Travel origin grouping frequencies.
Location Frequency
Otaki 205 (45.4%)
Other Kapiti 78 (17.3%)
North of KCDC 85 (18.8%)
South of KCDC 61 (13.5%)
Other 23 (5.1%)
Total 452 (100.0%)
14
Calculated by dividing the frequency of purchase type in the Expressway group by the overall frequency of
people that made that purchase type.
Otaki Customer Survey
21
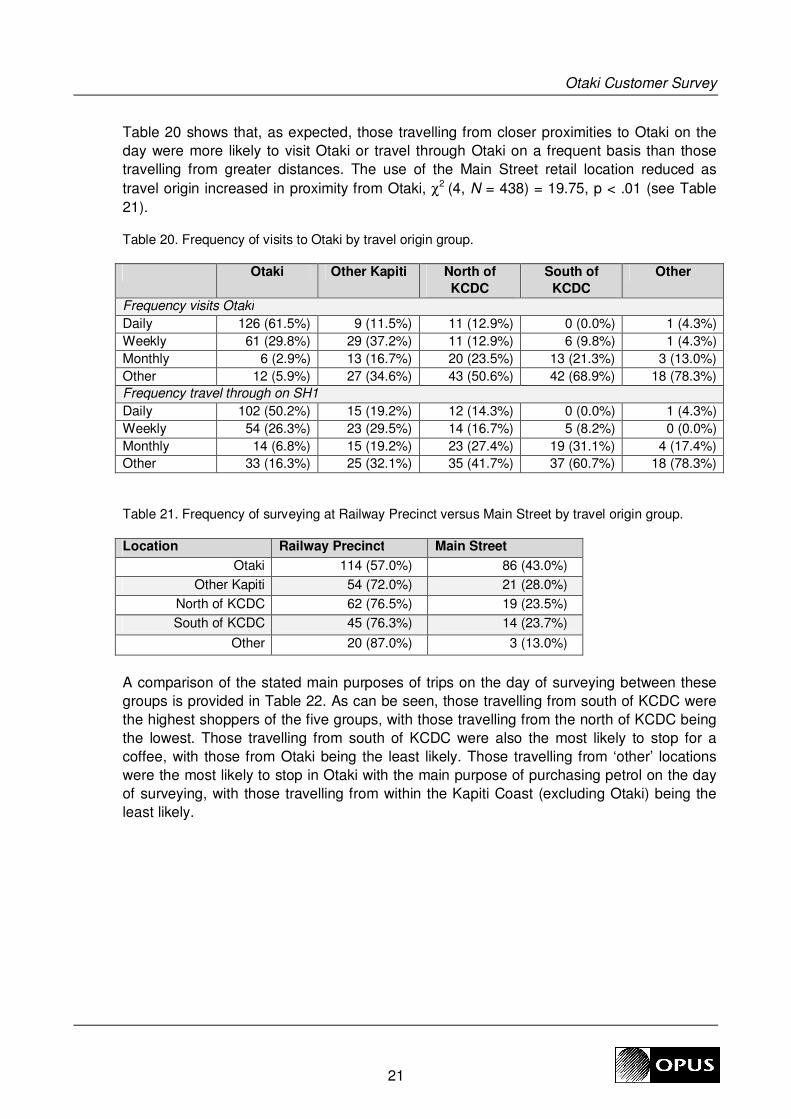
Table 20 shows that, as expected, those travelling from closer proximities to Otaki on the
day were more likely to visit Otaki or travel through Otaki on a frequent basis than those
travelling from greater distances. The use of the Main Street retail location reduced as
travel origin increased in proximity from Otaki, χ2 (4, N = 438) = 19.75, p < .01 (see Table
21).
Table 20. Frequency of visits to Otaki by travel origin group.
Otaki Other Kapiti North of
KCDC
South of
KCDC
Other
Frequency visits Otaki
Daily 126 (61.5%) 9 (11.5%) 11 (12.9%) 0 (0.0%) 1 (4.3%)
Weekly 61 (29.8%) 29 (37.2%) 11 (12.9%) 6 (9.8%) 1 (4.3%)
Monthly 6 (2.9%) 13 (16.7%) 20 (23.5%) 13 (21.3%) 3 (13.0%)
Other 12 (5.9%) 27 (34.6%) 43 (50.6%) 42 (68.9%) 18 (78.3%)
Frequency travel through on SH1
Daily 102 (50.2%) 15 (19.2%) 12 (14.3%) 0 (0.0%) 1 (4.3%)
Weekly 54 (26.3%) 23 (29.5%) 14 (16.7%) 5 (8.2%) 0 (0.0%)
Monthly 14 (6.8%) 15 (19.2%) 23 (27.4%) 19 (31.1%) 4 (17.4%)
Other 33 (16.3%) 25 (32.1%) 35 (41.7%) 37 (60.7%) 18 (78.3%)
Table 21. Frequency of surveying at Railway Precinct versus Main Street by travel origin group.
Location Railway Precinct Main Street
Otaki 114 (57.0%) 86 (43.0%)
Other Kapiti 54 (72.0%) 21 (28.0%)
North of KCDC 62 (76.5%) 19 (23.5%)
South of KCDC 45 (76.3%) 14 (23.7%)
Other 20 (87.0%) 3 (13.0%)
A comparison of the stated main purposes of trips on the day of surveying between these
groups is provided in Table 22. As can be seen, those travelling from south of KCDC were
the highest shoppers of the five groups, with those travelling from the north of KCDC being
the lowest. Those travelling from south of KCDC were also the most likely to stop for a
coffee, with those from Otaki being the least likely. Those travelling from ‘other’ locations
were the most likely to stop in Otaki with the main purpose of purchasing petrol on the day
of surveying, with those travelling from within the Kapiti Coast (excluding Otaki) being the
least likely.
Otaki Customer Survey
22
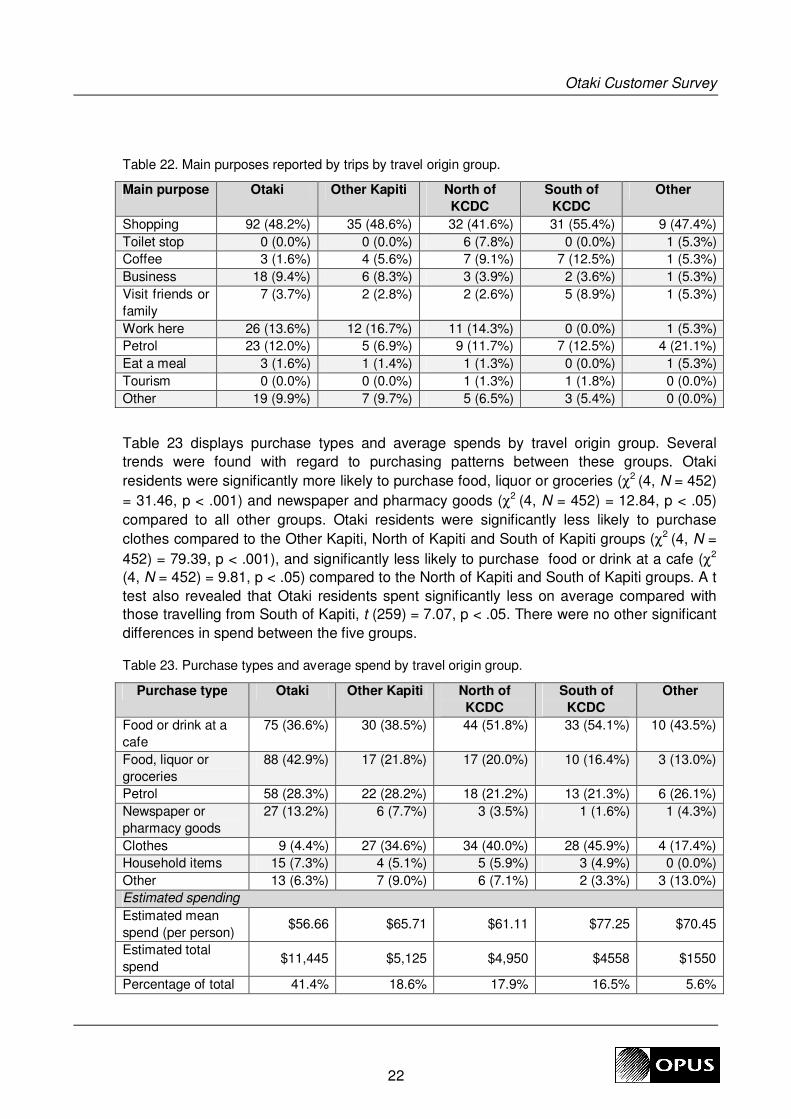
Table 22. Main purposes reported by trips by travel origin group.
Main purpose Otaki Other Kapiti North of
KCDC
South of
KCDC
Other
Shopping 92 (48.2%) 35 (48.6%) 32 (41.6%) 31 (55.4%) 9 (47.4%)
Toilet stop 0 (0.0%) 0 (0.0%) 6 (7.8%) 0 (0.0%) 1 (5.3%)
Coffee 3 (1.6%) 4 (5.6%) 7 (9.1%) 7 (12.5%) 1 (5.3%)
Business 18 (9.4%) 6 (8.3%) 3 (3.9%) 2 (3.6%) 1 (5.3%)
Visit friends or
family
7 (3.7%) 2 (2.8%) 2 (2.6%) 5 (8.9%) 1 (5.3%)
Work here 26 (13.6%) 12 (16.7%) 11 (14.3%) 0 (0.0%) 1 (5.3%)
Petrol 23 (12.0%) 5 (6.9%) 9 (11.7%) 7 (12.5%) 4 (21.1%)
Eat a meal 3 (1.6%) 1 (1.4%) 1 (1.3%) 0 (0.0%) 1 (5.3%)
Tourism 0 (0.0%) 0 (0.0%) 1 (1.3%) 1 (1.8%) 0 (0.0%)
Other 19 (9.9%) 7 (9.7%) 5 (6.5%) 3 (5.4%) 0 (0.0%)
Table 23 displays purchase types and average spends by travel origin group. Several
trends were found with regard to purchasing patterns between these groups. Otaki
residents were significantly more likely to purchase food, liquor or groceries (χ2 (4, N = 452)
= 31.46, p < .001) and newspaper and pharmacy goods (χ2 (4, N = 452) = 12.84, p < .05)
compared to all other groups. Otaki residents were significantly less likely to purchase
clothes compared to the Other Kapiti, North of Kapiti and South of Kapiti groups (χ2 (4, N =
452) = 79.39, p < .001), and significantly less likely to purchase food or drink at a cafe (χ2
(4, N = 452) = 9.81, p < .05) compared to the North of Kapiti and South of Kapiti groups. A t
test also revealed that Otaki residents spent significantly less on average compared with
those travelling from South of Kapiti, t (259) = 7.07, p < .05. There were no other significant
differences in spend between the five groups.
Table 23. Purchase types and average spend by travel origin group.
Purchase type Otaki Other Kapiti North of
KCDC
South of
KCDC
Other
Food or drink at a
cafe
75 (36.6%) 30 (38.5%) 44 (51.8%) 33 (54.1%) 10 (43.5%)
Food, liquor or
groceries
88 (42.9%) 17 (21.8%) 17 (20.0%) 10 (16.4%) 3 (13.0%)
Petrol 58 (28.3%) 22 (28.2%) 18 (21.2%) 13 (21.3%) 6 (26.1%)
Newspaper or
pharmacy goods
27 (13.2%) 6 (7.7%) 3 (3.5%) 1 (1.6%) 1 (4.3%)
Clothes 9 (4.4%) 27 (34.6%) 34 (40.0%) 28 (45.9%) 4 (17.4%)
Household items 15 (7.3%) 4 (5.1%) 5 (5.9%) 3 (4.9%) 0 (0.0%)
Other 13 (6.3%) 7 (9.0%) 6 (7.1%) 2 (3.3%) 3 (13.0%)
Estimated spending
Estimated mean
spend (per person) $56.66 $65.71 $61.11 $77.25 $70.45
Estimated total
spend $11,445 $5,125 $4,950 $4558 $1550
Percentage of total 41.4% 18.6% 17.9% 16.5% 5.6%
Otaki Customer Survey
23
spend by group
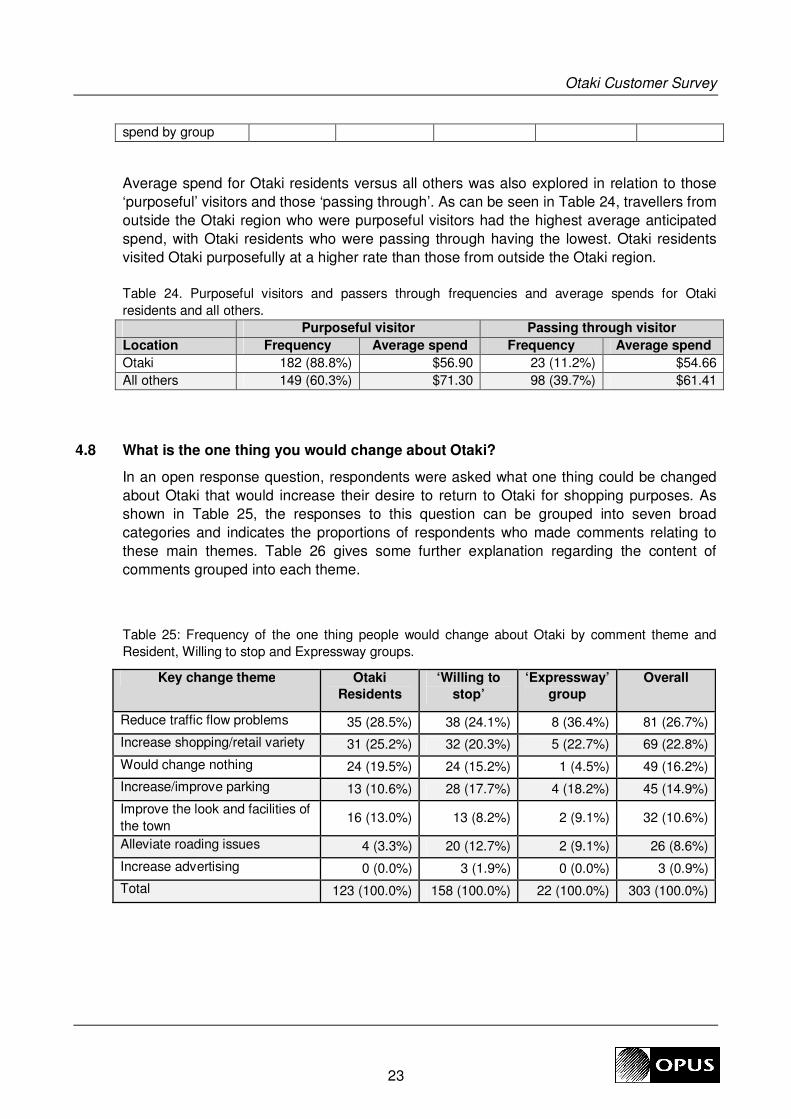
Average spend for Otaki residents versus all others was also explored in relation to those
‘purposeful’ visitors and those ‘passing through’. As can be seen in Table 24, travellers from
outside the Otaki region who were purposeful visitors had the highest average anticipated
spend, with Otaki residents who were passing through having the lowest. Otaki residents
visited Otaki purposefully at a higher rate than those from outside the Otaki region.
Table 24. Purposeful visitors and passers through frequencies and average spends for Otaki
residents and all others.
Purposeful visitor Passing through visitor
Location Frequency Average spend Frequency Average spend
Otaki 182 (88.8%) $56.90 23 (11.2%) $54.66
All others 149 (60.3%) $71.30 98 (39.7%) $61.41
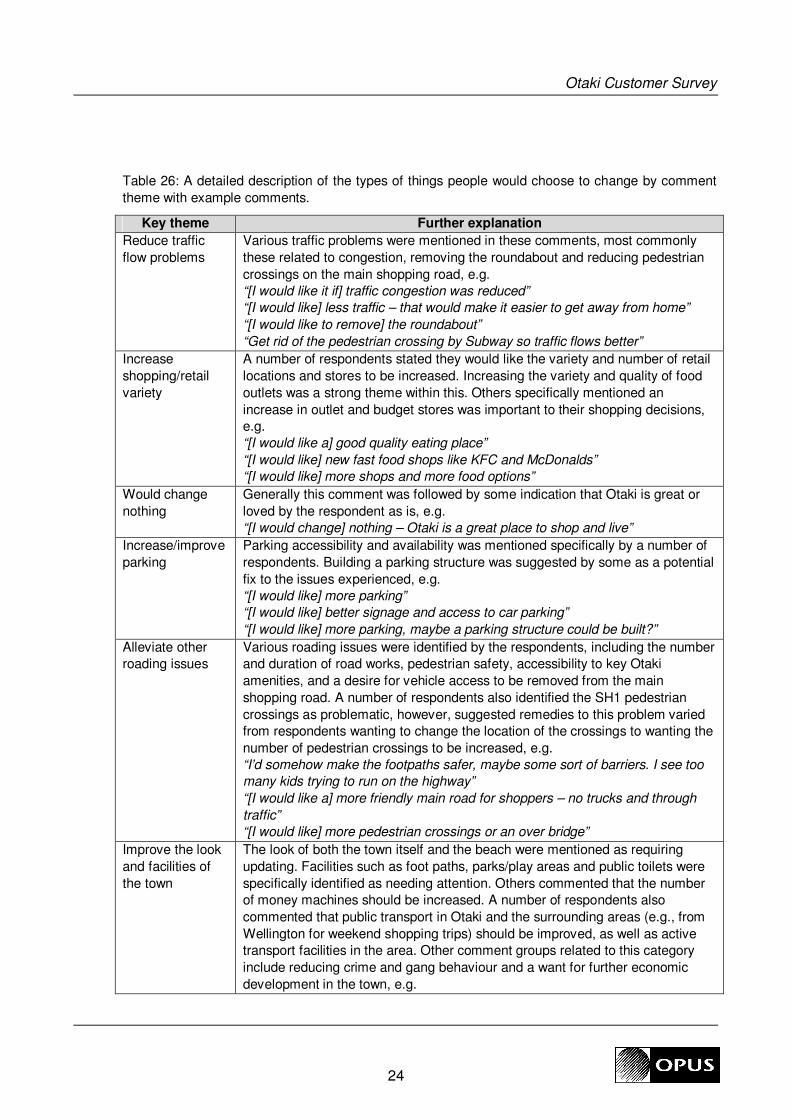
4.8 What is the one thing you would change about Otaki?
In an open response question, respondents were asked what one thing could be changed
about Otaki that would increase their desire to return to Otaki for shopping purposes. As
shown in Table 25, the responses to this question can be grouped into seven broad
categories and indicates the proportions of respondents who made comments relating to
these main themes. Table 26 gives some further explanation regarding the content of
comments grouped into each theme.
Table 25: Frequency of the one thing people would change about Otaki by comment theme and
Resident, Willing to stop and Expressway groups.
Key change theme Otaki
Residents
‘Willing to
stop’
‘Expressway’
group
Overall
Reduce traffic flow problems 35 (28.5%) 38 (24.1%) 8 (36.4%) 81 (26.7%)
Increase shopping/retail variety 31 (25.2%) 32 (20.3%) 5 (22.7%) 69 (22.8%)
Would change nothing 24 (19.5%) 24 (15.2%) 1 (4.5%) 49 (16.2%)
Increase/improve parking 13 (10.6%) 28 (17.7%) 4 (18.2%) 45 (14.9%)
Improve the look and facilities of
the town 16 (13.0%) 13 (8.2%) 2 (9.1%) 32 (10.6%)
Alleviate roading issues 4 (3.3%) 20 (12.7%) 2 (9.1%) 26 (8.6%)
Increase advertising 0 (0.0%) 3 (1.9%) 0 (0.0%) 3 (0.9%)
Total 123 (100.0%) 158 (100.0%) 22 (100.0%) 303 (100.0%)
Otaki Customer Survey
24
Table 26: A detailed description of the types of things people would choose to change by comment
theme with example comments.
Key theme Further explanation
Reduce traffic
flow problems
Various traffic problems were mentioned in these comments, most commonly
these related to congestion, removing the roundabout and reducing pedestrian
crossings on the main shopping road, e.g.
“[I would like it if] traffic congestion was reduced”
“[I would like] less traffic – that would make it easier to get away from home”
“[I would like to remove] the roundabout”
“Get rid of the pedestrian crossing by Subway so traffic flows better”
Increase
shopping/retail
variety
A number of respondents stated they would like the variety and number of retail
locations and stores to be increased. Increasing the variety and quality of food
outlets was a strong theme within this. Others specifically mentioned an
increase in outlet and budget stores was important to their shopping decisions,
e.g.
“[I would like a] good quality eating place”
“[I would like] new fast food shops like KFC and McDonalds”
“[I would like] more shops and more food options”
Would change
nothing
Generally this comment was followed by some indication that Otaki is great or
loved by the respondent as is, e.g.
“[I would change] nothing – Otaki is a great place to shop and live”
Increase/improve
parking
Parking accessibility and availability was mentioned specifically by a number of
respondents. Building a parking structure was suggested by some as a potential
fix to the issues experienced, e.g.
“[I would like] more parking”
“[I would like] better signage and access to car parking”
“[I would like] more parking, maybe a parking structure could be built?”
Alleviate other
roading issues
Various roading issues were identified by the respondents, including the number
and duration of road works, pedestrian safety, accessibility to key Otaki
amenities, and a desire for vehicle access to be removed from the main
shopping road. A number of respondents also identified the SH1 pedestrian
crossings as problematic, however, suggested remedies to this problem varied
from respondents wanting to change the location of the crossings to wanting the
number of pedestrian crossings to be increased, e.g.
“I’d somehow make the footpaths safer, maybe some sort of barriers. I see too
many kids trying to run on the highway”
“[I would like a] more friendly main road for shoppers – no trucks and through
traffic”
“[I would like] more pedestrian crossings or an over bridge”
Improve the look
and facilities of
the town
The look of both the town itself and the beach were mentioned as requiring
updating. Facilities such as foot paths, parks/play areas and public toilets were
specifically identified as needing attention. Others commented that the number
of money machines should be increased. A number of respondents also
commented that public transport in Otaki and the surrounding areas (e.g., from
Wellington for weekend shopping trips) should be improved, as well as active
transport facilities in the area. Other comment groups related to this category
include reducing crime and gang behaviour and a want for further economic
development in the town, e.g.
Otaki Customer Survey
25
Key theme Further explanation
“Do the beach front up and install a coffee shop”
“[I would like] better toilet facilities”
“[I would like an] Otaki to Paraparaumu bus service or train upgrade”
Increase
advertising
The respondents who made comments regarding advertising indicated that out-
of-towners generally lack knowledge of the variety of outlet and other stores
located in Otaki. Indicating that advertising will be of increased importance after
the Expressway has been built, e.g.
“[I would like] more advertising of the outlet stores, people from outside the
region don’t know what’s here”
4.8.1 General comments
In addition to comments regarding desired changes to the Otaki township, respondents
were also encouraged to make any other comments they felt relevant to the survey. Only
17.8% (N=88) of respondents choose to make such a comment. Of these, 52 respondents
made comments specifically related to the Expressway. The main themes of the
Expressway related comments were: pro Expressway (n=31, 59.7% of Expressway related
comments), against Expressway (n=14, 26.9%), more information needs to be provided
regarding the Expressway (n=2, 3.8%) and identifying detriments to the Otaki community
from the Expressway (n=5, 9.6%). Therefore, of those who specifically showed a
preference regarding the Expressway (N=50), 62% were in support and 38% were in
opposition.
Other comments made in this section tied in with the themes identified in the desired
changes to Otaki comments. For example, a number of participants noted they disliked the
traffic in Otaki (9.1% of those who made a final comment), others commented the public
transport in the Otaki region (6.8%) or the town (2.3%) were requiring improvements and
others suggested vehicles should be removed from the main shopping road (1.1%). On a
positive note, 12.5% of those who made a final comment made positive statements about
the Otaki community, mainly stating that it is a friendly place. The new car park at the
Railway (1.1%) and the absence of parking meters (2.3%) were also identified as positives
in the township.
4.9 Retail store survey
A second survey was conducted in March 2011 within the retail sectors of both the Otaki
and Te Horo townships to gain a deeper understanding of shopper’s behaviour and
therefore the potential economic impacts of the proposed Expressway. This survey had a
similar layout and question format to the pedestrian intercept survey (see Appendix A and B
for the final versions of both), however, there were several key differences between the two,
particularly in terms of methodology.
In the retail store survey, questionnaires were placed in key retail stores in both Otaki and
Te Horo. Retailers were asked to direct customers to fill these out. Completed surveys were
collected from retailers. In contrast, as discussed above, participants in the pedestrian
survey were intercepted while walking in the retail area of Otaki by trained interviewers.
Otaki Customer Survey
26
4.9.1 Limitations
There are three potential limitations to the validity of the retail store survey data when
compared with the pedestrian survey data. Therefore, the retail store survey results should
be treated with caution.
1) Sample selection bias: Owners may have influenced who completed the retail store
surveys, therefore causing a sample selection bias, where certain customers were
oversampled or under-sampled. The pedestrian survey utilised surveyors trained in
approach techniques and used a prize draw incentive to maximise the response rate
(and therefore the representative nature of the sample). Store owners were not trained,
and were not focused solely on the survey. Also, due to confidentiality issues
surrounding the collection of personal details, the prize draw incentive was not part of
the retail store survey. Perhaps the best evidence of a sample selection bias is the
apparent oversampling of females (see Table 27), and the lower response (indicating a
lower response rate).
2) Participant response bias: There is the possibility of ‘owner influence’ in the retail store
survey, where owners may have inadvertently caused a participant response bias
based on their expectations, how they explained the research, or merely being present.
Official trained surveyors were more objective, as they were not influenced by the
outcome of the research, and therefore less likely to influence participant responses in
this way.
3) Sample size: Third, the retail store survey method yielded a smaller number of
participants (N = 150, with only 5 of these from Te Horo), meaning it is more difficult to
detect differences or trends in the data (due to lower statistical power) and there are
greater limitations on the depth of analysis possible.
Because of these key differences between the two surveys these two samples were
deemed inappropriate for combining. A short analysis of the retail store survey was
undertaken, excluding the five surveys from Te Horo due to the extremely small sample
size and the increased complication in reporting the results. The findings of this analysis are
provided in the sections below, and due to the limitations outlined previously, should be
interpreted with caution.
Otaki Customer Survey
27
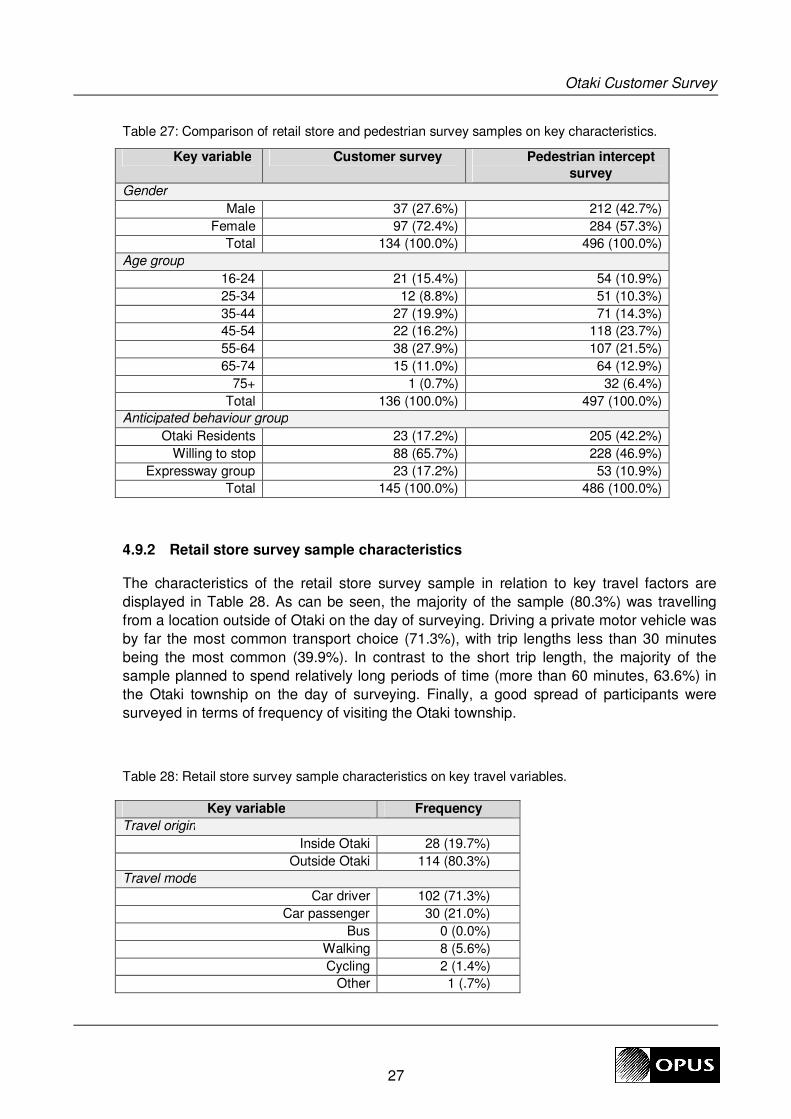
Table 27: Comparison of retail store and pedestrian survey samples on key characteristics.
Key variable Customer survey Pedestrian intercept
survey
Gender
Male 37 (27.6%) 212 (42.7%)
Female 97 (72.4%) 284 (57.3%)
Total 134 (100.0%) 496 (100.0%)
Age group
16-24 21 (15.4%) 54 (10.9%)
25-34 12 (8.8%) 51 (10.3%)
35-44 27 (19.9%) 71 (14.3%)
45-54 22 (16.2%) 118 (23.7%)
55-64 38 (27.9%) 107 (21.5%)
65-74 15 (11.0%) 64 (12.9%)
75+ 1 (0.7%) 32 (6.4%)
Total 136 (100.0%) 497 (100.0%)
Anticipated behaviour group
Otaki Residents 23 (17.2%) 205 (42.2%)
Willing to stop 88 (65.7%) 228 (46.9%)
Expressway group 23 (17.2%) 53 (10.9%)
Total 145 (100.0%) 486 (100.0%)
4.9.2 Retail store survey sample characteristics
The characteristics of the retail store survey sample in relation to key travel factors are
displayed in Table 28. As can be seen, the majority of the sample (80.3%) was travelling
from a location outside of Otaki on the day of surveying. Driving a private motor vehicle was
by far the most common transport choice (71.3%), with trip lengths less than 30 minutes
being the most common (39.9%). In contrast to the short trip length, the majority of the
sample planned to spend relatively long periods of time (more than 60 minutes, 63.6%) in
the Otaki township on the day of surveying. Finally, a good spread of participants were
surveyed in terms of frequency of visiting the Otaki township.
Table 28: Retail store survey sample characteristics on key travel variables.
Key variable Frequency
Travel origin
Inside Otaki 28 (19.7%)
Outside Otaki 114 (80.3%)
Travel mode
Car driver 102 (71.3%)
Car passenger 30 (21.0%)
Bus 0 (0.0%)
Walking 8 (5.6%)
Cycling 2 (1.4%)
Other 1 (.7%)
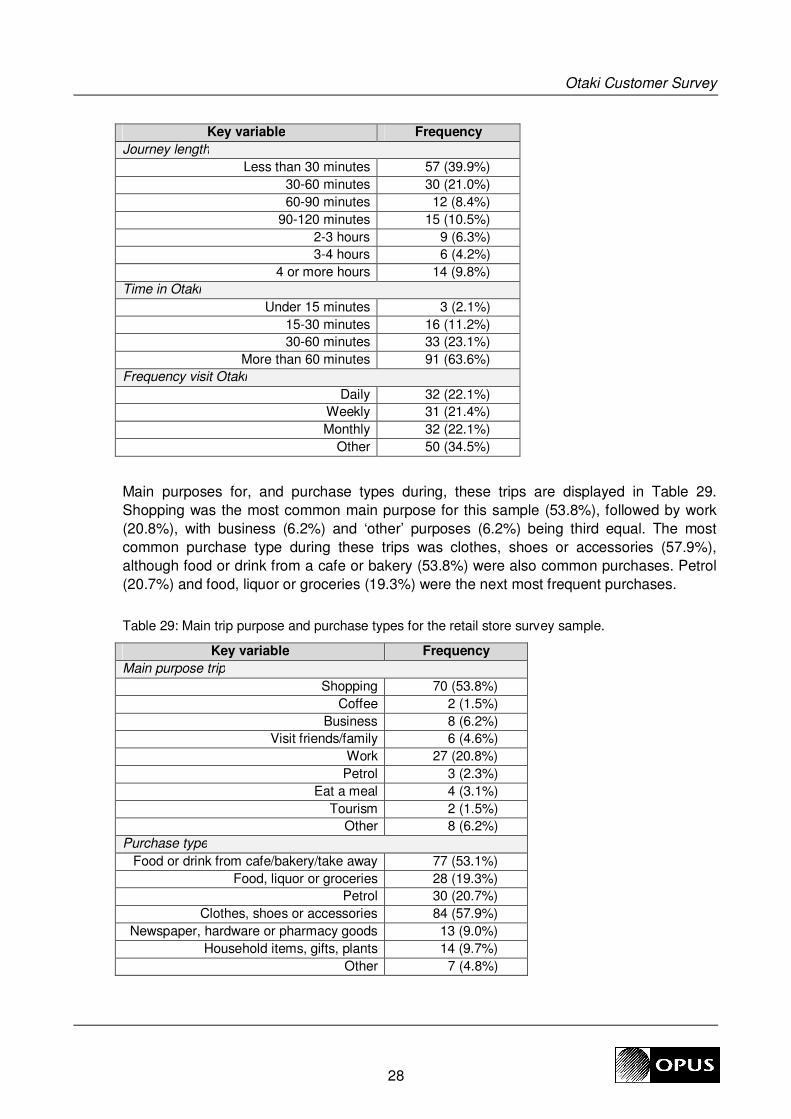
Otaki Customer Survey
28
Key variable Frequency
Journey length
Less than 30 minutes 57 (39.9%)
30-60 minutes 30 (21.0%)
60-90 minutes 12 (8.4%)
90-120 minutes 15 (10.5%)
2-3 hours 9 (6.3%)
3-4 hours 6 (4.2%)
4 or more hours 14 (9.8%)
Time in Otaki
Under 15 minutes 3 (2.1%)
15-30 minutes 16 (11.2%)
30-60 minutes 33 (23.1%)
More than 60 minutes 91 (63.6%)
Frequency visit Otaki
Daily 32 (22.1%)
Weekly 31 (21.4%)
Monthly 32 (22.1%)
Other 50 (34.5%)
Main purposes for, and purchase types during, these trips are displayed in Table 29.
Shopping was the most common main purpose for this sample (53.8%), followed by work
(20.8%), with business (6.2%) and ‘other’ purposes (6.2%) being third equal. The most
common purchase type during these trips was clothes, shoes or accessories (57.9%),
although food or drink from a cafe or bakery (53.8%) were also common purchases. Petrol
(20.7%) and food, liquor or groceries (19.3%) were the next most frequent purchases.
Table 29: Main trip purpose and purchase types for the retail store survey sample.
Key variable Frequency
Main purpose trip
Shopping 70 (53.8%)
Coffee 2 (1.5%)
Business 8 (6.2%)
Visit friends/family 6 (4.6%)
Work 27 (20.8%)
Petrol 3 (2.3%)
Eat a meal 4 (3.1%)
Tourism 2 (1.5%)
Other 8 (6.2%)
Purchase type
Food or drink from cafe/bakery/take away 77 (53.1%)
Food, liquor or groceries 28 (19.3%)
Petrol 30 (20.7%)
Clothes, shoes or accessories 84 (57.9%)
Newspaper, hardware or pharmacy goods 13 (9.0%)
Household items, gifts, plants 14 (9.7%)
Other 7 (4.8%)
Otaki Customer Survey
29
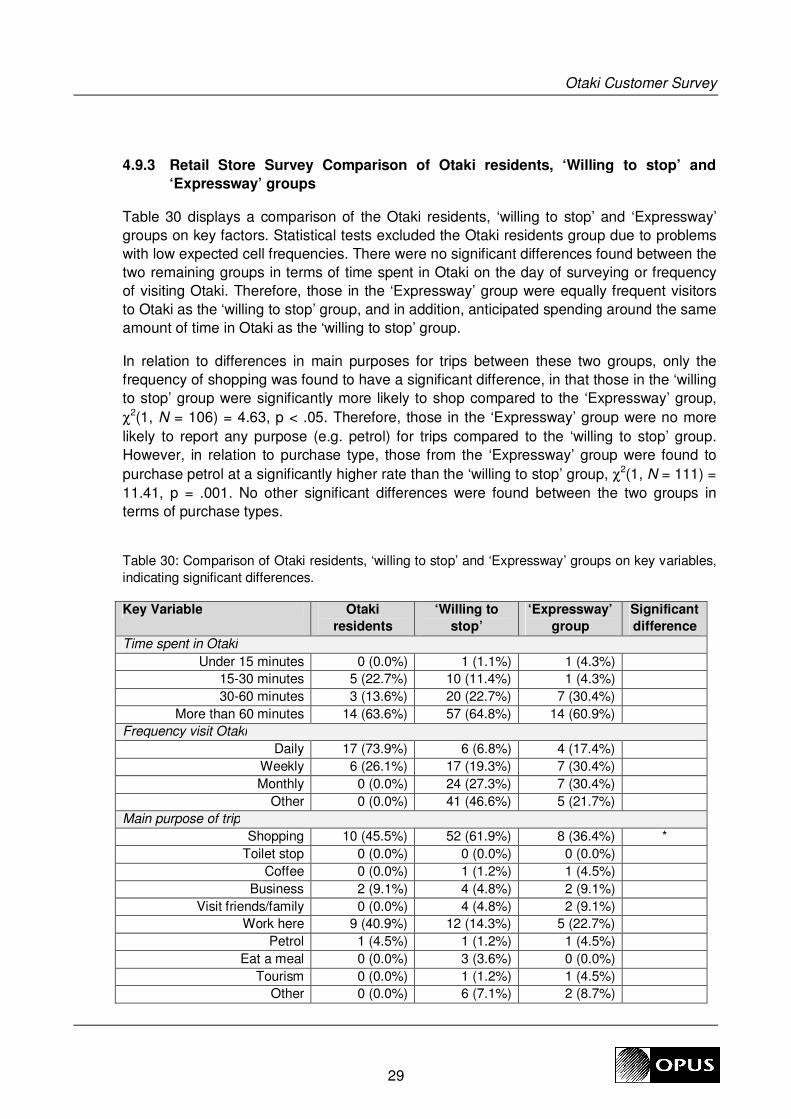
4.9.3 Retail Store Survey Comparison of Otaki residents, ‘Willing to stop’ and
‘Expressway’ groups
Table 30 displays a comparison of the Otaki residents, ‘willing to stop’ and ‘Expressway’
groups on key factors. Statistical tests excluded the Otaki residents group due to problems
with low expected cell frequencies. There were no significant differences found between the
two remaining groups in terms of time spent in Otaki on the day of surveying or frequency
of visiting Otaki. Therefore, those in the ‘Expressway’ group were equally frequent visitors
to Otaki as the ‘willing to stop’ group, and in addition, anticipated spending around the same
amount of time in Otaki as the ‘willing to stop’ group.
In relation to differences in main purposes for trips between these two groups, only the
frequency of shopping was found to have a significant difference, in that those in the ‘willing
to stop’ group were significantly more likely to shop compared to the ‘Expressway’ group,
χ2(1, N = 106) = 4.63, p < .05. Therefore, those in the ‘Expressway’ group were no more
likely to report any purpose (e.g. petrol) for trips compared to the ‘willing to stop’ group.
However, in relation to purchase type, those from the ‘Expressway’ group were found to
purchase petrol at a significantly higher rate than the ‘willing to stop’ group, χ2(1, N = 111) =
11.41, p = .001. No other significant differences were found between the two groups in
terms of purchase types.
Table 30: Comparison of Otaki residents, ‘willing to stop’ and ‘Expressway’ groups on key variables,
indicating significant differences.
Key Variable Otaki
residents
‘Willing to
stop’
‘Expressway’
group
Significant
difference
Time spent in Otaki
Under 15 minutes 0 (0.0%) 1 (1.1%) 1 (4.3%)
15-30 minutes 5 (22.7%) 10 (11.4%) 1 (4.3%)
30-60 minutes 3 (13.6%) 20 (22.7%) 7 (30.4%)
More than 60 minutes 14 (63.6%) 57 (64.8%) 14 (60.9%)
Frequency visit Otaki
Daily 17 (73.9%) 6 (6.8%) 4 (17.4%)
Weekly 6 (26.1%) 17 (19.3%) 7 (30.4%)
Monthly 0 (0.0%) 24 (27.3%) 7 (30.4%)
Other 0 (0.0%) 41 (46.6%) 5 (21.7%)
Main purpose of trip
Shopping 10 (45.5%) 52 (61.9%) 8 (36.4%) *
Toilet stop 0 (0.0%) 0 (0.0%) 0 (0.0%)
Coffee 0 (0.0%) 1 (1.2%) 1 (4.5%)
Business 2 (9.1%) 4 (4.8%) 2 (9.1%)
Visit friends/family 0 (0.0%) 4 (4.8%) 2 (9.1%)
Work here 9 (40.9%) 12 (14.3%) 5 (22.7%)
Petrol 1 (4.5%) 1 (1.2%) 1 (4.5%)
Eat a meal 0 (0.0%) 3 (3.6%) 0 (0.0%)
Tourism 0 (0.0%) 1 (1.2%) 1 (4.5%)
Other 0 (0.0%) 6 (7.1%) 2 (8.7%)
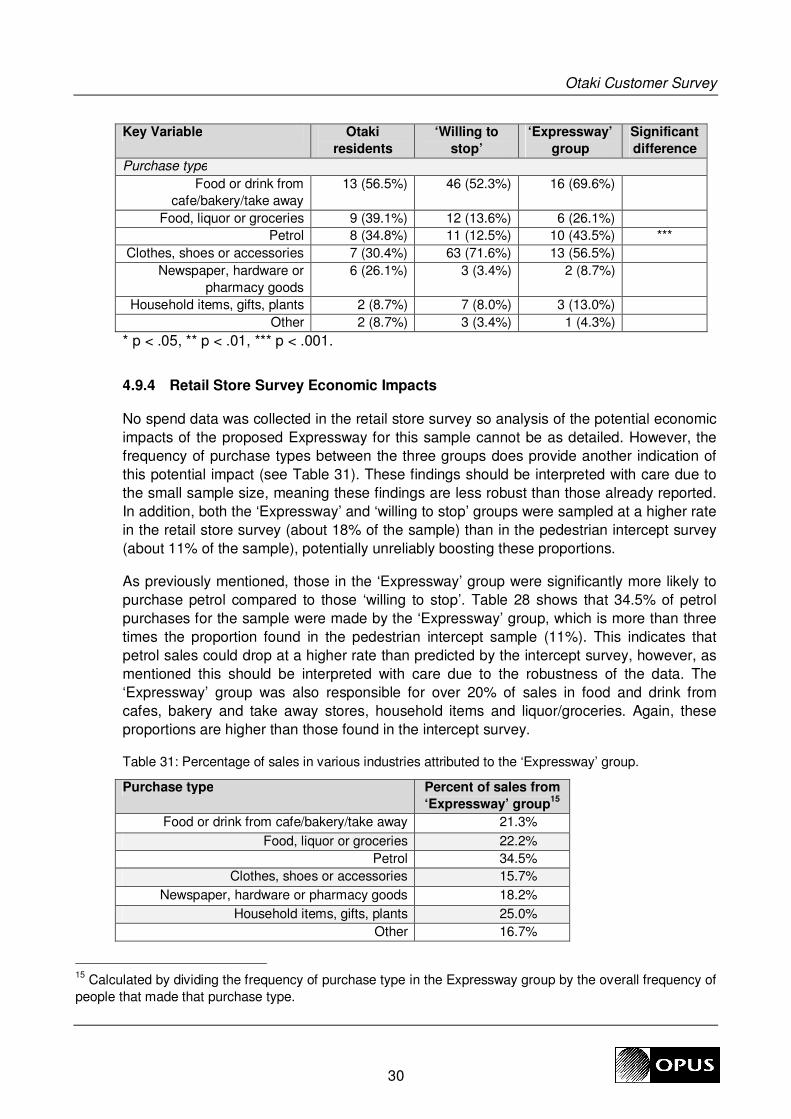
Otaki Customer Survey
30
Key Variable Otaki
residents
‘Willing to
stop’
‘Expressway’
group
Significant
difference
Purchase type
Food or drink from
cafe/bakery/take away
13 (56.5%) 46 (52.3%) 16 (69.6%)
Food, liquor or groceries 9 (39.1%) 12 (13.6%) 6 (26.1%)
Petrol 8 (34.8%) 11 (12.5%) 10 (43.5%) ***
Clothes, shoes or accessories 7 (30.4%) 63 (71.6%) 13 (56.5%)
Newspaper, hardware or
pharmacy goods
6 (26.1%) 3 (3.4%) 2 (8.7%)
Household items, gifts, plants 2 (8.7%) 7 (8.0%) 3 (13.0%)
Other 2 (8.7%) 3 (3.4%) 1 (4.3%)
* p < .05, ** p < .01, *** p < .001.
4.9.4 Retail Store Survey Economic Impacts
No spend data was collected in the retail store survey so analysis of the potential economic
impacts of the proposed Expressway for this sample cannot be as detailed. However, the
frequency of purchase types between the three groups does provide another indication of
this potential impact (see Table 31). These findings should be interpreted with care due to
the small sample size, meaning these findings are less robust than those already reported.
In addition, both the ‘Expressway’ and ‘willing to stop’ groups were sampled at a higher rate
in the retail store survey (about 18% of the sample) than in the pedestrian intercept survey
(about 11% of the sample), potentially unreliably boosting these proportions.
As previously mentioned, those in the ‘Expressway’ group were significantly more likely to
purchase petrol compared to those ‘willing to stop’. Table 28 shows that 34.5% of petrol
purchases for the sample were made by the ‘Expressway’ group, which is more than three
times the proportion found in the pedestrian intercept sample (11%). This indicates that
petrol sales could drop at a higher rate than predicted by the intercept survey, however, as
mentioned this should be interpreted with care due to the robustness of the data. The
‘Expressway’ group was also responsible for over 20% of sales in food and drink from
cafes, bakery and take away stores, household items and liquor/groceries. Again, these
proportions are higher than those found in the intercept survey.
Table 31: Percentage of sales in various industries attributed to the ‘Expressway’ group.
Purchase type Percent of sales from
‘Expressway’ group15
Food or drink from cafe/bakery/take away 21.3%
Food, liquor or groceries 22.2%
Petrol 34.5%
Clothes, shoes or accessories 15.7%
Newspaper, hardware or pharmacy goods 18.2%
Household items, gifts, plants 25.0%
Other 16.7%
15
Calculated by dividing the frequency of purchase type in the Expressway group by the overall frequency of
people that made that purchase type.
Otaki Customer Survey
31
5 Discussion
The introduction of an Expressway that bypasses Otaki is likely to reduce pedestrian foot
traffic in the retail areas by up to 11%, with 53 of the 500 pedestrians interviewed in Otaki
indicating that they would typically remain on the Expressway. Further examination of the
characteristics of these Expressway users indicates that they presently visit the Otaki shops
on an infrequent basis, and are more likely to spend short amounts of time (e.g., less than
15 minutes) in the Otaki retail area.
Future Expressway users spend about $18 less per person than those that would still
choose to stop in Otaki regardless of the time savings of the Expressway, and make up
about 9% of the value of current sales. The most common purchases for the Expressway
group are food or drink at a cafe, petrol and clothes.
5.1 Purchase types most affected
The Expressway users are no more likely to purchase petrol than any other group, but this still indicates about an 11% drop in sales transactions. Clothing sales for Expressway users are also similar to other groups, but this accounts for a 12% reduction in sales transactions. Food and drink sales in cafes, bakeries and take away outlets are significantly higher for the Expressway group, with about 15% of sales transactions coming from the Expressway users. These three industries account for about 45% of the businesses in Otaki (Clothing stores = 28%; Café, bakery and take-away = 14%; Petrol stations = 2%). The findings related to increased food, coffee or petrol purchases for likely ‘Expressway’
groups fits with previous findings (e.g., Srinivasan & Kockelman, 2002; Anderson, Harrison,
Euritt, Mahmassani, Walton & Helaakoski, 1992; Binney, 2010). Srinivasan and Kockelman
(2002) found petrol stations were most vulnerable to negative effects following the
completion of an Expressway. Anderson et al. (1992) found that both petrol station sales
and sales for eating and drinking establishments dropped at a higher rate than other
industries in small Texan towns following completion of an Expressway. Sales dropped for
both industries at a rate of between 10%-15% (Anderson et al., 1992).
5.2 Learning from international solutions
Parolin and Garner (1996) found that the greatest loss was experienced in service stations
and takeaway food outlets, with food stores such as supermarkets being less affected.
Opening ‘service centres’ outside of the town centre mitigated job loss in the town centre.
Binney (2010) emphasised incorporating strategies to mitigate these effects following the
introduction of an Expressway. For example, emphasising the improved safety and
attractiveness of the retail area, increasing signage and advertising of retail opportunities,
and applying business restructure or refocus.
Reviews of the overseas literature reveal these economic effects are generally short term,
with the long term benefits outweighing any detriments (Binney, 2010; Leong & Weisbrod,
2000). Economic impacts of an Expressway are typically higher in small communities (e.g.,
less than 2,500 people; Binney, 2010; Srinivasan & Kockelman, 2002). The Otaki
Otaki Customer Survey
32
community has a population of more than twice this at around 5,643 (Statistics New
Zealand, 2010), so this community is perhaps more robust than some small communities.
5.3 Key characteristics for improvement
When asked about the one thing that could be improved to make it more likely that
respondents would return to shop in Otaki, traffic congestion is the primary issue that
people commented on, followed by improving the number and variety of shopping facilities.
• Congestion: Easing traffic congestion (including around the roundabout) is a key issue
for 26% of respondents. The proposed Expressway is likely to alleviate this issue,
including easing congestion and removing trucks from the main shopping road. The
consequent reduction in traffic is likely to make it a safer, user friendly environment for
pedestrians in the CBD.
• Shopping variety: Increasing the variety and number of retail opportunities is suggested
as a key area of improvement. Currently shopping characteristics are not rated highly
as the primary reason for stopping in Otaki. There is a particular desire for an increase
in the variety and number of eating establishments and outlet stores.
• Parking accessibility: Is currently rated among the most important factors in people’s
current decisions to stop in Otaki, indicating that parking is already perceived to be
highly accessible in Otaki. The new car park at the railway and the lack of parking
meters are specifically mentioned as positive features. Even taking into account the
perceived ease of parking in Otaki, about 15% of respondents want further
improvement in parking accessibility.
Other issues identified by the respondents that are not directly addressed by the proposed
Expressway include improving key amenities (e.g., public toilets and play/park areas), the
look of the town and beach, public transport, and active transport facilities (e.g., walking
and cycling facilities)16. Strategies aimed at improving these factors could therefore
increase the attractiveness of the town to both locals and out-of-towners and consequently
provide a boost to the retail sector.
5.4 Location-based findings
The proposed Expressway has heavier impacts in the Railway Precinct (State Highway 1)
retail area, where there is an estimated 13.8% reduction in overall foot traffic and an
estimated 12.3% reduction in overall sales due to Expressway use. The impact on the Main
Street retail area is less, with an estimated 4.6% reduction in foot traffic and an estimated
2.9% reduction in overall sales due to Expressway use. The ‘Expressway’ group was also
responsible for a higher proportion of sales in each industry in the Railway Precinct
compared to the Main Street retail area, with the exception of household items and gifts
(where those sampled in Main Street were responsible for a higher proportion).
16
The proposed Peka Peka to Otaki Expressway does provide improved active transport amenity, with both
a walking and cycling track.
Otaki Customer Survey
33
5.5 Travel behaviour and travel origin
Over a third (37.4%) of those using the Otaki retail areas are from outside of the Kapiti
region, and these travellers accounted for an estimated 40.0% of the total spend on the
days surveyed. People who were purposefully travelling to Otaki as a destination shopping
location were spending higher on average than those passing through or locals to Otaki.
Those travelling from a more distant origin were less likely to use the Main Street retail
area, most likely indicating either the relative convenience of the Railway Precinct or a
lower level of knowledge regarding the Main Street retail area.
5.6 Acceptable time sacrifices and Willingness to Detour
This study is the first known to gather data related to acceptable time sacrifices in relation
to continued stopping at a town following the introduction of an Expressway in New
Zealand. While the figures are only indicative due to the small sample size, the findings do
provide insights into both intentions and behaviour post completion of Expressways and
can potentially assist in future planning.
Of the travellers that indicated that time savings are a critical factor in their decision to stop,
about 60% are still willing to sacrifice 3 minutes or more in time savings to stop in towns like
Otaki. If the overall time savings of the Expressway are only up to 1.5 minutes, the
proportion of people willing to stop increases to 88%. This provides indicative thresholds of
through traffic loss for similar towns in New Zealand.
Drivers should be educated to the likely time savings of any Expressway to ensure they are
well-informed when making their decision to detour. This finding also has implications for
other Expressway options, and further work into acceptable thresholds where people are
still willing to stop would be useful to inform Expressway locations.
5.7 Conclusion
There is likely to be some decline in retail sales following the completion of the proposed
Peka Peka to Otaki Expressway, particularly in the food, coffee, clothing and petrol sectors.
However, these findings suggest that several of the key changes required to make Otaki a
more vibrant retail destination, such as reduced traffic congestion, are likely to be provided
by the construction of the Expressway. Similarly, the characteristics that currently cause
people to choose Otaki are likely to be reinforced and enhanced by the Expressway, such
as its perception as a safe, attractive pedestrian environment.
Otaki Customer Survey
34
6 References
Agresti, A. (1996). An Introduction to Categorical Data Analysis. John Wiley & Sons, Inc: New
York.
Anderson, S.J., Harrison, R., Euritt, M.A., Mahmassani, H.S., Walton, M.C. & Helaakoski, R.
(1992). Economic impacts of highway bypasses, Report 1247-3F. Center for Transportation
Research, University of Texas, Austin, Texas.
Binney, J. (2010). Economic impact assessment for the Ingham to Cardwell Range Highway
Planning study. A report for the Queensland Department of Transport and Main Roads. Marsden
Jacob Associates: Melbourne.
Field, A. (2009). Discovering statistics using SPSS. (3rd ed.). Sage Publications Ltd: London.
Leong, D. & Weisbrod, G. (2000). Summary of highway bypass studies. Economic Development
Research Group – Reprint Series. Economic Development Research Group, Inc: Boston.
New Zealand Transport Agency. (2011). Roads of national significance: Wellington Northern
Corridor: Peka to Peka to Otaki Expressway. NZ Transport Agency: Wellington.
Srinivasan, S. & K. Kockelman. (2002). The impacts of bypasses on small- and medium-sized
communities: An econometric analysis. Journal of Transportation and Statistics, 5(2), pp. 57-69.
Statistics New Zealand. (2010). Otaki urban area community profile. Retrieved 28 March 2011 from
http://www2.stats.govt.nz/domino/external/web/CommProfiles.nsf/f5707c256626ece5cc256d12001
1b32b/1cc5b505d5cf5eb9cc256d310074cbf2?OpenDocument.

Otaki Customer Survey
35
7 Appendices
Appendix A: Otaki pedestrian questionnaire
Otaki Customer Survey
36
Otaki Customer Survey
37
Otaki Customer Survey
38
Appendix B: Otaki/Te Horo retail store questionnaire17
17
Note: in the Te Horo questionnaire the word ‘Otaki’ was replaced with ‘Te Horo’ and a few items not
relevant to the Te Horo township (e.g. relating to outlet stores and petrol stations) were removed.
Otaki Customer Survey
39