Embed Size (px)
Citation preview

ISSN 1936-5330
Stefan Jacewitz, Haluk Unal, and Chengjun Wu August 2021RWP 21-07http://doi.org/10.18651/RWP2021-07
Shadow Insurance? Money Market Fund Investors and Bank Sponsorship

1
Shadow Insurance? Money Market Fund Investors and Bank Sponsorship*
Stefan Jacewitz Haluk Unal Federal Reserve Bank R. H. Smith School of Business, University of Maryland of Kansas City Federal Deposit Insurance Corporation
Chengjun Wu
R. H. Smith School of Business, University of Maryland
August 2021
Abstract
We argue that bank holding companies (BHCs) extend shadow insurance to the prime institutional money market funds (PI-MMFs) they sponsor and that PI-MMFs price this shadow insurance by charging investors significantly higher expense ratios and paying lower net yields. We provide evidence that after September 2008, expense ratios at BHC-sponsored PI-MMFs increased more than at non-BHC-sponsored PI-MMFs. Despite higher expense ratios, BHC-sponsored PI-MMFs did not experience larger redemptions than non-BHC-sponsored PI-MMFs. In addition, we show that expense ratios increased with BHCs’ financial strength and the likelihood of their support; however, this expense ratio differential disappeared after the 2016 MMF reform.
JEL Classification: G2, G21, G23, G28, H12, H81.
Keywords: bank, bank holding company, bank run, financial crisis, liquidity risk, money market fund, systemic risk, too big to fail.
* The analysis, conclusions, and opinions set forth here are those of the authors alone and do not necessarily reflect the views of the Federal Deposit Insurance Corporation, the Federal Reserve Bank of Kansas City, the Federal Reserve System, or the United States. The bulk of the analysis was performed while Stefan Jacewitz was affiliated with the Federal Deposit Insurance Corporation. We thank Rosalind Bennett, Kathryn Fritzdixon, Jacob Goldston, Jonathan Pogach, N. Prabhala, Paul Soto, and the participants of the FDIC Brown Bag workshop and seminar and the IMAEF Corfu Meetings June 2016 for helpful comments and suggestions. We acknowledge the assistance of Philip Ostromogolsky in some of the data work contained in the paper. All errors and omissions are the authors’ responsibility. Authors can be contacted at [email protected], [email protected], and [email protected]

2
1. Introduction
Bank holding companies (BHCs) frequently own both insured bank subsidiaries and uninsured
nonbanks, such as insurance or brokerage subsidiaries, or hold non-operational subsidiaries, such as
special purpose vehicles (SPVs). The Gramm-Leach-Bliley Act of 1999 accelerated BHCs’ shift into
nonbank businesses by potentially giving them increased scope economies and by allowing them to
diversify into nonbank services. However, evidence has accumulated that nonbank activities lead to
regulatory arbitrage and have negative spillover effects on commercial banks and the economy in
general. Acharya, Schnabl, and Suarez (2013) show that BHCs extend implicit guarantees to the SPVs
they create. Chernenko and Sunderam (2014) demonstrate that the risk-taking by money market funds
can disrupt their short-term lending to creditworthy borrowers. Ferreira, Matos, and Pires (2018) argue
that equity fund managers support affiliated banks’ lending operations. Pogach and Unal (2018)
provide evidence that BHCs protect their nonbanks from the pressures of external dividends by using
the bank segment’s internal dividends.
We add to this growing literature by examining the BHC sponsorship of money market funds
(BHC-sponsored MMFs). This industry goes back to the early 1980s and is among the earliest nonbank
affiliations of BHCs. Other financial institutions that are not part of the usual financial safety-net can
also establish and sponsor MMFs (non-BHC-sponsored MMF). Sponsoring institutions extend an
implicit guarantee to MMF investors: that the sponsors will support the funds in times of crises. The
guarantee is implicit because the sponsors do not have a legal obligation to support an ailing MMF
under its sponsorship. However, as Kacperczyk and Schnabl (2013) point out, sponsors have the
incentive to support an ailing MMF to minimize the spillover risk of a failed MMF to other businesses
of the sponsor. Our objective is to understand how BHC-sponsored MMFs are different from non-

3
BHC-sponsored MMFs, and whether this affiliation creates regulatory arbitrage opportunities for the
sponsoring BHC.
Sponsorship by a BHC rather than a non-BHC can matter for investors because the fund
management can benefit from an affiliation with a BHC. The BHC has relatively quick access to cheap
and information-insensitive funding sources through its bank subsidiaries, such as insured, brokered
deposits or the discount window. Federal guidelines recognize the cross-subsidization within a BHC.
For example, in its Bank Holding Company Supervision Manual, the Board of Governors of the Federal
Reserve acknowledges that the failure of a nonbank subsidiary has financial ramifications for the BHC,
and thus the subsidiary can use the BHC’s resources to provide support to that subsidiary1:
… Failure of a nonbank subsidiary may lead to a lack of confidence in the affiliated
bank’s ability to continue in business, which might precipitate a run on the bank’s
deposits. … Because the bank is usually the largest subsidiary, the holding company may
attempt to draw upon the resources of the bank to aid the nonbank subsidiary.
Hence, investors could expect the BHC to provide support to its sponsored MMF when the fund’s
assets lose value, or the redemption activity is high. This expected support from a BHC can be more
credible, and therefore more valuable, than the expected support from an otherwise similar, non-BHC.
The non-BHC sponsor lacks access to relatively cheap funds, thereby giving the BHC sponsor “deeper
pockets.” Pogach and Unal (2020) report that the credit spreads of new bond issues at BHCs were on
average 20 basis points lower than other financial firms for the period from 1996 to 2002.
We test the implicit-guarantee hypothesis along four dimensions. In terms of pricing, BHC-
sponsored MMFs can charge their institutional investors more than the non-BHC-sponsored MMFs
1 Board of Governors of the Federal Reserve System, 2016, “Bank Holding Company Supervision Manual,” Division
of Banking Supervision and Regulation, Section 4030.0.

4
to compensate for the implicit guarantee from their sponsors. We measure this value by examining
the fund-level expense ratios and the net yields on assets in two contrasting market conditions. One
is the high-risk 2008 Lehman crisis that exposed MMFs to heightened redemption risk and increased
the need for, and thus the value of, sponsor support. In this environment and to the extent that the
value of the implicit insurance extended by the BHC sponsors is more valuable than other sponsors’
support, we expect BHC-sponsored MMFs to charge higher fees after September 2008 to account for
the higher value of the implicit insurance they provide. The other environment we examine is a 2016
regulatory change to the MMF industry that in practice, shifted risk away from MMFs (and sponsors)
to investors. In response to the 2008 crisis, the Securities and Exchange Commission (SEC) put in
place reforms to address the risk of investor runs on MMFs. One of the most important changes for
prime institutional money market funds (PI-MMFs) was the imposition of floating net asset values
(NAV) to reduce the risk of breaking the buck (NAV per share falling below $1). If the difference in
expense ratios between BHC-sponsored funds and non-BHC-sponsored funds were driven by the
differences in investor risk exposure, we would expect that the premium on expense ratios charged
by BHC-sponsored funds to disappear after these reforms.
The second dimension of our analysis focuses on the flow of funds into and out of MMFs. We
examine the redemption behavior of investors in BHC-sponsored funds versus the non-BHC-
sponsored funds during the Lehman crisis. This analysis elucidates the investors’ perceptions about
the safety of the fund. They may have perceived that the BHC that sponsored the fund was providing
a valuable form of implicit insurance. If that is the case, we should observe that notwithstanding the
higher expense ratio and lower yields, BHC-sponsored MMFs do not necessarily face more
redemptions than non-BHC-sponsored MMFs after controlling for asset characteristics.
The third dimension of our analysis examines the actual support from the sponsors during the
Lehman crisis. Despite the fact that only the Reserve Primary Fund broke the buck during the Lehman

5
crisis, many other MMFs kept their NAVs at $1 with sponsor support. Brady, Anadu, and Cooper,
2012) provide a thorough analysis of the instances of sponsor support during the crisis. We use this
dataset and investigate whether the BHC sponsors are more likely to support MMFs during the
Lehman crisis and that whether the expense ratios are sensitive to the likelihood of support. We predict
that BHC-sponsored MMFs are more likely to receive support from their sponsors.
Finally, we examine the sensitivity of the expense ratios to the financial strength of the sponsor.
In order for the sponsor to extend a credible guarantee to a fund, it should itself have a sound financial
standing. During the Lehman crisis, many BHCs themselves were experiencing liquidity issues,
suffering declines in asset values, and even facing default. Therefore, to the extent that the implicit-
guarantee hypothesis was valid, MMF investors should perceive sponsorship by financially strong
BHCs to be more valuable. We therefore predict that the PI-MMFs that are sponsored by more liquid
and lower default-risk BHCs charge higher expense ratios.
In our analysis, we focus primarily on PI-MMFs. There are two reasons for this emphasis. First,
PI-MMFs are more vulnerable to industry-wide runs (Schmidt, Timmerman, and Wermers, 2016).
Second, they are an important part of the shadow banking system and have a significant effect on the
systemic risk of the aggregate financial system — as seen during the 2008 MMF Crisis. The size of
BHC-sponsored PI-MMFs grew from a negligible percentage of the industry in 1986 to about 50%,
$227 billion, of total assets of the MMF industry by the turn of the century. These funds grew to $612
billion and as much as 52% of all institutional MMF assets by the end of 2007. Hence, sponsorship of
PI-MMFs created an enormous implicit liability for BHCs.
Our empirical results support the predictions. We use a difference-in-differences analysis and
show that BHC-sponsored PI-MMFs earned 6.77 basis points fewer gross returns but charged 6.55
basis points higher expense ratios compared to non-BHC-sponsored PI-MMFs during the period
6
from September 2008 to March 2009 (post-Lehman crisis) relative to the period from March to August
2008 (pre-Lehman crisis). Given that the average expense ratio of non-BHC-sponsored PI-MMFs
during the post-crisis period was 36 basis points, the 6.55 basis points difference is economically
significant. Furthermore, it is within 0.1 basis points of the average premiums on deposit insurance
that the Federal Deposit Insurance Corporation (FDIC) charged in 2008. Because of reduced gross
yields and increased expense ratios during the same post-crisis period, investors’ net yield was 13 basis
points or 8.5% lower at BHC-sponsored PI-MMFs.
These results contrast with a placebo test of alternative funds – government institutional funds
and prime retail funds. The identical institutions that sponsor PI-MMFs typically sponsor those funds.
To the extent that there is a different clientele for BHC-sponsored funds versus non-BHC-sponsored
funds, these clientele differences would carry over to other fund types under the same sponsor.
However, the most conspicuous difference between government institutional funds and PI-MMFs is
the risk of their underlying assets. While PI-MMF assets are exposed to risky assets such as asset-
backed commercial paper (ABCP), government institutional funds have assets mostly free of default
risk. In terms of prime retail funds, despite that these funds had similar risky assets as PI-MMFs,
investors were less risk sensitive and did not exhibit run behavior during the Lehman crisis (Schmidt,
Timmerman, and Wermers, 2016). Therefore, we predict that a sponsor’s implicit guarantee would be
relatively less valuable to investors in these funds and thus expense ratios would not significantly differ
between BHC- and non-BHC-sponsored funds. We examine difference-in-differences in expense
ratios between BHC-sponsored and non-BHC-sponsored funds and between the pre-Lehman and the
post-Lehman periods. Consistent with our expectations, in contrast to PI-MMFs, the falsification tests
find no relation between BHC sponsorship and expense ratios.
To assess the flow effect, we use a difference-in-differences to contrast the flows between pre-
and post-Lehman crisis periods and for BHC- and non-BHC-sponsored funds. Our findings show

7
that there was no material difference between the changes in expense ratios for these two fund groups.
In other words, no material withdrawal occurred at BHC-sponsored PI-MMFs despite the lower yields
of these funds. This finding is in sharp contrast to the literature that analyzes the flow-performance
relation during relatively calm periods. Kacperczyk and Schnabl (2013) and Cherenkov and Sunderam
(2014) show that institutional investors are very sensitive to yield differences and that they move large
sums of funds to gain additional returns of as little as 10 basis points. In addition, Christoffersen
(2001) and Christoffersen and Musto (2002) provide evidence that there is a strong performance-flow
relation, such that higher yielding funds attract more inflows. Given the findings of this literature, the
mere fact that investors at BHC-sponsored funds did not redeem their funds despite a 13 basis points
lower net return supports the argument that they see BHC sponsorships to be valuable.
The results of our analysis of sponsor support during the financial crisis show that BHC sponsors
with more ABCP exposure are indeed more likely to provide direct support to their affiliated PI-
MMFs. ABCP is the class of assets that suffered the most as a result of the failure of Lehman’s
commercial paper. Those funds that had high holdings of ABCP experienced the greatest decline in
asset values and therefore needed sponsor support. The results support this prediction. In addition,
we find a higher probability of getting support is associated with higher charged expense ratios by
BHC-sponsored PI-MMFs. We interpret these results as evidence that investors in PI-MMFs behave
as if they find the BHC’s implicit guarantee credible and treat their funds as being safer, and are
therefore less likely to redeem.
Our final analysis pertains to the variations in default risk within BHC sponsors. We use a BHC’s
level of liquidity, equity, and uninsured deposits (all as a percentage of the BHC’s assets) as proxies
for the BHC’s default risk. Higher liquidity and equity levels are signals of financial strength. We use
the uninsured deposits ratio as a signal of the confidence of depositors that can mimic the institutional
investors at MMFs. The higher levels of uninsured deposits can be construed as showing lower

8
expectations of default risk for the BHC. Our results support these conjectures. We find that PI-
MMFs sponsored by BHCs with higher liquidity and uninsured deposits tend to charge a higher
expense ratio in light of the more credible guarantee from their sponsors.
In sum, our findings show that BHC-sponsored PI-MMFs operated as if they were under a
government safety net during the sample period. They were not “shadow banks” in the sense that they
lacked access to the government safety net. Instead, BHCs were operating in the shadows and
extending shadow insurance to institutional investors through their affiliated MMFs. In return, the
affiliated MMFs charged higher expense ratios. However, the BHCs had no reserve or capital
requirements and paid no fees to the federal insurer against the risks they assumed because of their
sponsorship of the fund. Thus, the BHC sponsors benefited from potential government support
without bearing any additional costs that led to regulatory arbitrage.
These results add to the findings of Acharya, Schnabl, and Suarez (2013). They provide evidence
of regulatory arbitrage in which BHCs create SPV conduits and securitize loans. However, BHCs keep
their sponsorship (guarantee) behind these securitized loans while getting relief from capital
requirements. This sponsorship of SPVs and securitized loans is similar in spirit to the implicit
guarantee extended by the BHC-sponsors of PI-MMFs that contributed to the growth of PI-MMFs.
Hence, our findings nicely complement those in Acharya, Schnabl, and Suarez (2013). We also add to
the findings in Kacperczyk and Schnabl (2013). They show that participation in MMFs places
important financial obligations on the sponsoring firms. Our results support their insight and show
that BHCs face increased exposure to liquidity risk because of their affiliation with MMFs.
We organize the paper as follows: Section 2 provides the institutional background. In Section 3,
we discuss the conceptual framework and the empirical setting. Section 4 presents the data. Sections
5, 6, 7, and 8 provide the results of our empirical analyses. Section 9 concludes.

9
2. Institutional Background
MMFs, which were introduced in 1971, are structured as registered investment companies under
the Investment Company Act of 1940. A management company (fund sponsor) can establish a new
MMF as a separate legal entity. The management company can simultaneously operate many individual
funds, and it can advertise them under a single brand name, such as BlackRock or Fidelity. The group
of funds under a brand name are called a fund complex. A fund can issue share classes that can have
different expense ratios or minimum investment requirements. They also often categorize share classes
by investor type: institutional or retail. Institutional shares are for investors such as corporate treasuries,
bank trust departments, corporations, and pension funds. These shares have higher minimum
investment requirements and are associated with larger accounts. Retail shares are open to all investors
— organizations and individuals (Morley, 2014 and Baklanova and Tanega, 2014).
Each institutional or retail MMF can have categories, such as prime, government, and tax free. Prime
funds invest in short-term private debt instruments such as commercial paper, certificates of deposit,
other bank obligations, repurchase agreements (repos), and corporate floating-rate notes. Government
funds invest in US Treasury securities and in US government agency obligations such as government-
funded enterprises. Tax-free funds invest in municipal securities.
Rule 2a-7 of the Investment Company Act of 1940 places restrictions on the liquidity, maturity,
and credit risk of the assets held by an MMF, such that the fund assets have a relatively low risk
exposure. Specifically, each asset held by an MMF must have a maximum maturity of one year, and
the weighted average maturity of all assets held must be no longer than 60 days. A rating agency must
rate 97% of all securities held by an MMF as being in their top two categories. Funds cannot invest
more than 5% of their assets in the securities of one issuer. Ten percent of portfolio assets must be in
liquid instruments with daily availability, and 30% of portfolio assets must be in instruments having
10
weekly availability. Also, MMFs cannot invest more than 5% of their assets in illiquid securities. Lastly,
all MMF holdings must be denominated in US dollars.
Up until 2014, each share had a fixed price of $1 that was pegged to a fixed portfolio net asset
value (NAV) of $1 per share. This fixed pricing was a pivotal fixture of the MMF industry from its
start in 1971 through the crisis of 2008. Responding to the crisis of 2008, in 2014 the SEC abolished
the stable per share NAV for the share prices of prime institutional funds and required floating share
pricing to start in October 2016. (see Securities and Exchange Commission, 2014.a, 2014.b).
Under the fixed-share-price regime, healthy MMFs that met the requirements of Rule 2a-7
calculated the value of their assets by using the amortized cost accounting method. This method values
each asset at its historical cost. The rule justifies the use of this method because it requires that MMF
portfolio assets must be of high credit quality, high liquidity, and of short maturity. If an MMF’s assets
lose value so that the per-share market value (its shadow price) drops below its historical per-share
cost of $1 (below $0.995), the fund “breaks the buck” — it has become distressed. When a fund breaks
the buck, its board of directors can suspend redemptions to allow for an orderly liquidation.
The primary reasons for the deterioration of an MMF’s assets include asset devaluation, asset
default, an interest rate spike, or a liquidity event. Breaking the buck is a rare event. In the decades-
long history of MMFs, only two have broken the buck. These were the Community Bankers US
Government Fund in 1994 and the Reserve Primary Fund in 2008.
3. The Expense Ratio as a Fee for Implicit Insurance
The central argument of our paper is that institutional investors may price the value of a MMF
sponsorship. We hypothesize that BHC sponsorships can be more valuable because of their “deep-
pockets” relative to non-BHC sponsors (including other financial firms, such as insurance companies

11
and investment banks). This funding advantage provides a form of liquidity insurance for investors.
Consequently, we argue that investors will accept higher expense ratios (and lower net yields) from
BHC-sponsored MMFs when the environment gets riskier.
To investigate this hypothesis, we use the difference in expense ratios between BHC- and non-
BHC-sponsored MMFs as a proxy for the value of this guarantee, while acknowledging and controlling
for many other factors that can affect the expense ratio. This is a novel interpretation of the expense
ratio. Expense ratios are the fees that investors pay to the fund company to manage the fund, and the
fund expresses them as a percentage of its total assets. Fees for management and administrative
services constitute the largest expense of funds followed by marketing and distribution. In addition,
funds can charge investors for custodian and auditing fees as well as trustees’ fees and expenses. If a
BHC-sponsored MMF can provide a more credible liquidity backstop, then it could charge more for
any of these components relative to a non-BHC-sponsored MMF to account for the implicit guarantee
that it extends. Since from an investors’ perspective, fees are fungible, for example, a custodial fee and
an equal administrative fee are ultimately reflected identically in the investors’ realized returns; we
focus on the sum total of these fees.
Higher expense ratios can generate more profits for the MMF and its BHC sponsor. However,
an implicit guarantee transfers risk from the MMF to the BHC. Hence, understanding the risks posed
by the BHC-sponsored MMFs can help identify the channels through which these so-called “shadow
banks” can extend shadow insurance and thereby extract subsidies from the safety net and potentially
weaken financial stability.
However, other factors can influence the expense ratios. Of foremost importance is their use in
determining the net yield to MMF investors. Because market conditions and portfolio holdings
determine gross yield, fund managers can increase, lower, or waive expense ratios to give the investors

12
acceptable yields. When interest rates are high, fund gross returns are high; and MMFs can charge a
higher expense ratio. In contrast, when interest rates are low, to compensate investors with reasonable
net yields, MMFs can waive expense ratios. For example, there are MMFs that waived expense ratios
during the 2009-2015 period when interest rates were at their record low levels. Conversely, waivers
were at their lowest level during the period from 2006 to 2008 when rates were still relatively high (ICI
Research Perspective, 2018). However, Christoffersen (2001) provides evidence that there is a relatively
flat relation between MMF performance and waivers. In our empirical tests we use expense ratios net
of waivers and reductions.
Expense ratios also depend on the minimum size of investment. Increasing the minimum size is
associated with lower expense ratios. Schmidt, Timmerman, and Wermers (2016) argue that a fund
with higher minimum size is a proxy for investor sophistication. Because a larger investment means
more “skin in the game,” Schmidt, Timmerman, and Wermers (2016) claim that these investors will
analyze the health of the fund more carefully than others will and hence could be considered
sophisticated. They provide evidence that there is a strong relation between expense ratios and
minimum investments for prime share classes.
To minimize the confounding effects of differences in minimum sizes on expenses, we compare
the expense ratios of BHC- and non-BHC-sponsored funds at different minimum balance
requirements. We control for the effects of market interest rates and investor sophistication when we
compare the expense ratios of different sponsors. Our premise is that a fund that implicitly provides
a higher guarantee because of its BHC affiliation will charge a higher expense ratio, regardless of the
minimum investment size.

13
4. Data
4.1 Data Source
We use data from the iMoneyNet datasets that contain detailed historical information on individual
US MMFs. Schmidt, Timmermann, and Wermers (2016) compare iMoneyNet data to statistics from the
Investment Company Institute and find that iMoneyNet data cover about 93.5% of the total dollar value
of US PI-MMFs.
The iMoneyNet dataset is structured such that group of funds are collected under a brand name,
called the fund complex, for example, “Blackrock”. The iMoneyNet calls each fund that belongs to a fund
complex as the master class fund and identifies it with an indicator. All share classes under the same master
class fund name have identical portfolios and are managed by the same fund manager. Each share class
has an associated master class fund name and a fund code. In the remainder of the paper, we use the
terms fund and master class fund interchangeably.
We use three panel datasets: monthly, weekly, and daily observations. All three datasets record
the total amount in each share class (share class assets). In addition, the datasets contain the expense
ratio, gross yield, and net yield for each share class. The weekly dataset has the asset composition of
the funds’ portfolios that comprises the weighted average maturity and the fraction of a fund’s
portfolio that is held in commercial paper, floating-rate notes, repos, bank deposits, non-deposit bank
obligations, and US government securities.
To complement our study, we also obtain the relevant BHC’s financial data from the Federal
Reserve’s Y9-C report and its sponsoring between 2007 and 2011 from Brady, Anadu and Cooper
(2012).
4.2 BHC Sponsorship Identification

14
The critical aspect of our analysis is the identification of the fund sponsors in terms of BHC or
non-BHC affiliation. The iMoneyNet datasets contain a binary bank identifier. However, this variable
does not vary over time and is fixed at a value that corresponds to the last date in each iMoneyNet
dataset.
To identify the sponsorship status of each fund complex, we manually match the name of each
fund complex in our data to a BHC or non-BHC sponsor.2 Then, we search the SEC filings and the
business press to identify all ownership and sponsorship relations between the MMF and other
financial institutions over our sample period. We define a fund complex as being BHC-sponsored if it is
affiliated with a BHC that is a financial holding company (FHC) with a subsidiary commercial bank,
or a commercial bank that is not a member of the BHC.3 Thus, we correct the original identifier BHC
sponsorship from iMoneyNet by adjusting it to be historically accurate.
Appendix A shows the fund complexes and the number of funds and share classes that are in our
sample as of September 2008. The last two columns show that the iMoneyNet identifier and the
corrected identifier, respectively. As the appendix shows, in the case of 18 complexes, the iMoneyNet
identifier requires modification. These changes fall into three categories. The first pertains to instances
where the sponsoring firms changed their filing status to a BHC over the sample period. This change
accounts for differences in two fund complexes and the eight funds within those complexes. They are
Goldman Sachs and Morgan Stanley that were investment banks before the crisis and became BHCs
shortly after the Lehman collapse. The iMoneyNet files carry these two sponsors only as BHCs, whereas
2 Philip Ostromogolsky contributed significantly to the matching work that spans the period of 1986-2016.
3 The definition of commercial bank excludes the following types of institutions: industrial loan company, federal savings bank, savings and loan institution, savings and loan holding company, and credit union.

15
they should be non-BHCs up until their switch.4 The second type is not an error, but a difference in
usage. We consider a sponsor to have access to the domestic safety net if it has a domestic regulatory
holder. For six complexes and nine funds, sponsors were recorded correctly as “BHCs” by iMoneyNet,
but those BHCs lacked a domestic regulatory holder. We treat a fund complex of a foreign bank as a
non-BHC fund because the foreign banks do not have the same safety net advantages as US banks.
In one case, we correctly identified a parent to be a domestic institution and changed its identification
from a non-BHC to a BHC. The third and final type of difference is due to other data discrepancies.
These apply to nine fund complexes and 21 funds within these complexes. In some cases, iMoneyNet
codes private uninsured banks as a BHC, which does not match our usage.
5. Do Institutional Investors Value BHC Sponsorship of MMFs?
5.1 The Lehman Crisis and Expense Ratios
The $350 billion contraction in the ABCP market in late 2007 casts doubt on the credit quality of
many such short-term, AAA-rated asset categories (Covitz, Liang, and Suarez, 2009). PI-MMFs, which
held such assets, experienced a significant credit event that reduced the value of their assets and
brought them perilously close to breaking the buck. One of those funds, the Reserve Primary Money
Market Fund, was not able to weather the storm because of its exposure to Lehman’s commercial
paper. On September 15, 2008, Lehman declared bankruptcy that inflicted a severe credit event on
the Reserve Fund’s assets. A day after Lehman’s crisis, the Reserve Fund broke the buck on September
16, 2008, that then triggered the largest crisis in the history of the US MMF industry.5 The collapse of
4 In the case of Goldman Sachs, iMoneyNet shows some funds to be BHC-sponsored and some to be non-BHC-
sponsored within the same complex. We consider all funds under Goldman Sachs to be non-BHC-sponsored while Goldman Sachs was not officially a BHC.
5 See Strahan and Tanyeri (2013), McCabe (2010), Investment Company Institute (2009), Securities and Exchange Commission (2009).
16
the Reserve Fund sparked unprecedented mass withdrawals from PI-MMFs. From September 12 to
October 1, 2008, PI-MMFs lost a total of $460 billion, which was 29% of industry assets.6
The main hypothesis of this paper is that because BHC-sponsored funds provide a more credible
guarantee, institutional investors are willing to accept lower net yields from their PI-MMFs. To test
this hypothesis, we compare the gross yields, expense ratios, and net yields of funds with BHC and
non-BHC sponsors of the PI-MMFs before and after this shock to the industry. Ultimately, net yield
– the return after accounting for expenses, is what matters to investors. For instance, whether they
realize less net yield caused by higher expense ratios or lower gross yields will not affect investor
decision making. Empirically, we find that gross yields are not statistically different across sponsors..
Therefore, definitionally and empirically, an increase (decrease) in the expense ratio of one basis point
is equivalent to a decrease (increase) in the net yield received by investors of one basis point. Thus,
comparing differences in net yields is identical to comparing the negative differences in expense ratios.
Figure 1 displays the average gross yields for both types of funds from 2006 through 2009. The
vertical lines represent August 2007 and September 2008, respectively. August 2007 is when the
French bank BNP Paribas announced that they were freezing $2.2 billion of subprime funds and were
barring investors from redeeming cash from the funds. As we indicated earlier, Kacperczyk and
Schnabl (2013) argue that August 2007 marks the time when the underlying asset risk of the MMF
industry fundamentally changed.
We observe that the average gross yields for BHC-sponsored and non-BHC-sponsored funds
experienced a slight uptick immediately after August 2007, but the increase was not significant and
there was no statistical difference between their average yields. Figure 1 also shows that shortly after
6 We calculate this percentage from data provided by iMoneyNet. See Strahan and Tanyeri (2013) and McCabe (2010).

17
August 2007, the gross yield offered by both types of funds declined dramatically until August 2008.
This result is a direct consequence of the decline in short-term rates. The three-month yield on
Treasury bills was 4.55% on September 4, 2007 and declined to 1.72% on September 2, 2008.
However, shortly after September 2008, non-BHC-sponsored funds on average had gross yields
slightly higher than the average gross yield offered by BHC-sponsored funds. This observation means
that the non-BHC-sponsored funds further increased the asset risk and thus the corresponding gross
yield, possibly to prevent redemptions. The difference disappeared in 2009 and thereafter. This
convergence can be explained by the rapid decline in the interest rates of the economy.
Figure 2 displays the average expense ratios during the same period. We should note that the
expense ratios for the 2006-2008 period are not particularly confounded with fee waivers because, as
indicated above, fee waivers were at their lowest level during this period. We observe an interesting
pattern in Figure 2. The BHC-sponsored PI-MMFs increased their expense ratios relative to non-
BHC-sponsored PI-MMFs right around August 2007. However, the difference is not statistically
significant. As September 2008 approached, we observe that BHC-sponsored funds further increased
their expense ratios while non-BHC-sponsored PI-MMFs slightly decreased their expense ratios.
Following September 2008, the expense ratios diverged sharply; the difference between the two types
of funds reached its maximum as the BHC-sponsored funds charged higher rates on average by
roughly 8 basis points by January 2009.
Next, we examine the variation in expense ratios across different minimum required investments.
We segregate funds into three buckets: “small” for funds with minimum balances of less than $25,000;
“medium” for funds with between $25,000 and $1,000,000; and “large” for funds with minimum
balances of more than $1,000,000. Figure 3 displays the average expense ratios for each of these three
buckets of minimum balances. Expense ratios are inversely related to the size of the minimum
investment requirement for both types of funds. This observation is consistent with Schmidt,

18
Timmerman, and Wermers (2016) who argue that minimum investments capture investor
sophistication. Funds with higher minimum investments attract more sophisticated investors who pay
lower expense ratios. However, we observe that on average, BHC-sponsored PI-MMFs increased the
expense ratios at every minimum size bucket in the post-Lehman period. These observations cannot
be consistent with investors becoming less sophisticated (justifying charging a higher expense ratio)
in a falling interest rate environment. In contrast, the results give support to the argument that expense
ratios reflect risk, at least to some extent. We argue that BHC-sponsored funds charge higher expense
ratios in an environment where the implicit insurance the sponsoring BHC provides becomes more
valuable.
5.2. Portfolio Characteristics of PI-MMFs in 2008
In Table 1, we provide the average portfolio makeup of PI-MMFs overall and by sponsor type
(BHC or non-BHC) for the months of June 2008 and December 2008. We take June and December
as representative months for the pre- and post-crisis periods. There are 345 (317) distinct prime
institutional share classes with 230 (167) non-BHC-sponsored share classes and 115 (150) BHC-
sponsored share classes as of June 2008 (December 2008).
The first three columns of Table 1 pertain to June 2008. In terms of our focal variables, gross
yield, expense ratio, and net yield, there is no difference on average between the BHC-sponsored and
non-BHC-sponsored MMFs. In terms of measures of asset risk, including weighted asset maturity
(WAM), age, complex size, government debt (US Treasury and agency debt), repos, and bank
obligations, non-BHC- and BHC-sponsored funds are statistically indistinguishable. However, the
compositions do vary in a few categories. First, BHC-sponsored funds hold significantly more time
deposits, which stands to reason, although these holdings represent a relatively small component of
total assets. The BHC-sponsored funds also hold less in floating rate notes (FRNs) than non-BHC-

19
sponsored funds, although this difference is only marginally significant. The last difference is in the
composition of their commercial paper holdings and ABCP. iMoneyNet reports first-tier and second-
tier commercial paper categories, which include ABCP. 7 However, it reports the ABCP amount
separately. Hence, we create a commercial paper variable that is the sum of the first tier and the second
tier net of ABCP and enter the ABCP as a separate variable in our analysis. We observe in Table 1
that non-BHC-sponsored funds hold significantly more ABCP than BHC-sponsored funds, 20% to
10%, while BHC-sponsored funds hold more non-ABCP commercial paper than non-BHC-
sponsored funds, 29% to 22%. However, in aggregate, risky asset holdings do not statistically differ
between BHC- and non-BHC-sponsored MMFs.
The last three columns of Table 1 provide the same information about portfolio composition for
December 2008. The picture changed substantially after the fall of Lehman and the ensuing run on
PI-MMFs. Markedly, funds sponsored by BHCs charged a significantly higher expense ratio of 44
basis points versus the 36 basis points charged by funds with non-BHC sponsors as of December
2008. This change is reflected as well in the significant difference in the net yield. Investors in BHC-
sponsored funds received 136 basis points on average, while investors in funds that were not
sponsored by BHCs received 153 basis points on average. In other words, while non-BHC sponsors
kept their expense ratios unchanged relative to the pre-crisis level, BHC sponsors showed a significant
departure from the industry average and charged higher expense ratios and paid lower net yields to
their institutional customers after the Lehman crisis. This observation provides the initial support for
our hypothesis that these investors were willing to pay for BHC sponsorship when it was needed most
7 “First tier” securities, as defined by Rule 2a-7 of the Investment Company Act of 1940, are securities rated in the highest short-term rating category by two or more rating agencies. “Second tier” indicates that the securities have received the highest rating from one rating agency and the second highest rating from another or has received the second highest rating from two rating agencies.
20
immediately following the crisis. In terms of asset composition, both types of MMFs have similar
portfolios, and there is no statistical difference in the holdings of risky assets in aggregate.
5.3 Difference-in-Differences Analysis of BHC- and Non-BHC-Sponsored MMFs
To provide further support for these observations, we estimate a difference-in-differences
between BHC- and non-BHC-sponsored funds before and after the Lehman crisis for gross yield,
expense ratio, and net yields, while controlling for other fund characteristics. The specification is as
follows:
𝐹𝑜𝑐𝑎𝑙 𝑉𝑎𝑟𝑖𝑎𝑏𝑙𝑒𝑗,𝑡 = 𝛾0 + 𝛾1𝐵𝐻𝐶𝑗 + 𝛾2𝐴𝑓𝑡𝑒𝑟 𝐿𝑒ℎ𝑚𝑎𝑛𝑡 + 𝛾3𝐴𝑓𝑡𝑒𝑟 𝐿𝑒ℎ𝑚𝑎𝑛𝑡 ∗ 𝐵𝐻𝐶𝑗 +
𝜔𝐶𝑜𝑛𝑡𝑟𝑜𝑙𝑠𝑗𝑡 + 𝜀𝑗𝑡, (1)
where j and t denote the share class and the month, respectively. The focal variables are 30-day gross
and net compound yields, the expense ratio, and the outflow that are all calculated as the percentage
changes in total net assets. The variable BHC equals one for the BHC-sponsored funds and zero
otherwise. After Lehman is equal to one for September 2008–February 2009 and zero for February–
August 2008. The difference-in-differences estimator, 𝛾3, is the coefficient for the product of the BHC
and After Lehman variables. This is the main coefficient of interest and measures the difference between
the BHC-sponsored fund’s response and that of the non-BHC-sponsored fund to the Lehman
collapse.
The vector of controls contains other variables that are potentially correlated with the focal
variables. One important control is the riskiness of the asset holdings. For this, we use two measures.
The first is the WAM, since assets with shorter maturities are easier to liquidate (McCabe, 2010). The
second is the fund’s investment holdings that the investor perceives to have a lower liquidation value.
Kacperczyk and Schnabl (2013) argue that investors perceive bank obligations, FRNs, and commercial
paper to have lower liquidation values. They classify US Treasury securities, repos, and BHC-time

21
deposits as assets with high liquidation values. We also follow Kacperczyk and Schnabl (2013) and
create a risky holdings variable as another proxy for portfolio riskiness. Further, we use the log of
minimum investment as a proxy for investor sophistication (Schmidt, Timmerman, and Wermers,
2016). Additional variables control for the Treasury yield and the size of the fund complex. We should
note that complex size and fund size are correlated. For our BHC-sponsored sample, the correlation
between complex and fund sizes is 51% with significance at the 1% level.
In addition to our lead specification in equation (1), we also include a robust difference-in-
differences specification, following Bertrand, Duflo and Mullainathan (2004) who propose collapsing
the pre- and post-time series as a way to overcome the problem of serial correlation in difference-in-
differences that produces consistent standard errors. Unless otherwise stated, we estimate the
specifications at the share-class level and cluster all standard errors at the fund-sponsor level. We
cluster at this level because we expect that the error term across share classes under the same sponsor
to be correlated. Clustering at the sponsor level accounts for the arbitrary correlation within fund
complexes.
We report the results in Table 2. Column (1) shows that BHC-sponsored funds earned lower
gross yields, though not statistically significant, relative to non-BHC-sponsored funds post-Lehman.
However, the difference in yields is salient when we examine the net yields; as shown in Column (2),
investors in BHC-sponsored PI-MMFs received a net yield that was 13 basis points lower than that
of investors in non-BHC-sponsored funds after the Lehman failure. Given that the non-BHC-
sponsored PI-MMFs’ average net yield was 153 basis points in December 2008, the 13 basis points
difference means that investors accepted an 8.5% lower net yield from BHC-sponsored PI-MMFs
relative to non-BHC-sponsored funds. The major factor underlying this result was the higher expense
ratios charged by the BHC-sponsored funds. Column (3) shows that the expense ratios are 6.55 basis
22
points higher for BHC-sponsored PI-MMFs, or approximately 18% higher than the expense ratios
that non-BHC-sponsored funds charged post-Lehman.
The control variables have the expected signs. The gross and net yields have positive correlations
with Treasury yields. However, funds charge more on average when Treasury yields are low. This
seemingly counterintuitive result is plausible given that the BHC-sponsored funds charged higher
expense ratios in the declining interest rate environment. We also observe that funds with riskier
holdings realized higher gross yields and, consequently, net yields. The riskiness of a fund’s holdings,
measured by WAM, also affects the expense ratio, but none of the portfolio components, such as time
deposits, bank obligations, FRNs, commercial paper, and ABCP, are important predictors of the
expense ratio. Finally, the results show that higher minimum investment, a proxy for investor
sophistication, is associated with higher net yields and a lower expense ratio. We also use risky holdings
as a percentage of total assets as an alternative measure of the risk of portfolio holdings. We find that
our result does not change when we control for the aggregate risky holdings instead of separate
portfolio holdings, and a higher risky-holding percentage generates higher yields.
To further demonstrate the robustness of our findings, we report in Columns (4) – (6) of Table
2 the results from a robust difference-in-differences specification, which was proposed by Bertrand,
Duflo and Mullainathan (2004). Similar to the results in Columns (1) – (3), Columns (4) – (6) show
that investors in BHC-sponsored PI-MMFs received around 13 basis points lower net yields while
being charged 5 basis points higher expense ratios than the investors in non-BHC-sponsored PI-
MMFs.
iMoneyNet reports the simple and compound investor returns over multiple time intervals. In a
robustness check, we use alternative measures of investor returns including the 30-day net simple

23
yield, the 7-day net compound yield, the 1-month net simple return8, and the 1-month net simple yield.
We observe that in all cases, irrespective of the specific yield measure, the net return on investment is
11 to 17 basis points lower for the MMFs that were sponsored by BHCs after the collapse of Lehman.
In Table 2, we show that the expense ratios at BHC-sponsored funds were 6.55 basis points
higher than the expense ratios at non-BHC-sponsored funds (4.97 basis points with robust estimates).
Our argument is that this finding reflects a form of insurance against losses on funds placed by the
sponsoring BHCs in their sponsored MMFs. While the BHC sponsor’s guarantee is implicit, there are
analogous guarantees that are easily observed that provide protection to investors against loss; while
that protection, itself, is derived from the same ultimate source: the federal government. This relation
can provide an idea of the economic magnitude of the observed difference in charged expense ratios
and therefore a reasonable benchmark.
In the US, funds placed directly in a bank, for instance in a money market deposit account, are
explicitly insured by the FDIC (under the applicable statutory conditions). In 2008, matching the bulk
of our sample period, the FDIC guaranteed an average of $4.6 trillion in insured deposits. That same
year, it collected $3 billion in insurance assessments (i.e., insurance premiums) that equals 6.52 basis
points of insurance premium per insured dollar. Our point estimate of 6.55 basis points (or 4.97 with
robust estimates) for a qualitatively similar “insurance” guarantee aligns remarkably well with this point
of reference.
5.4 Difference-in-Differences Analysis of Government and Retail MMFs
We have thus far shown a significant difference in the response to the Lehman failure of PI-
MMFs that are sponsored by BHCs and those that are not. However, there conceivably are other,
8 We use iMoneyNet’s definitions that calculate the “yield” by using the dividend factor and the “return” by using the dividend factor plus capital gains and losses.
24
non-risk-based explanations for this observation. For instance, potentially, there could be a clientele
difference between BHC- and non-BHC-sponsored PI-MMFs. Perhaps investors in BHC-sponsored
PI-MMFs are less financially sophisticated, and therefore more willing to accept a larger expense ratio
and lower net yields. Along the same lines, differences in expense ratios might have nothing to do
with the underlying risk but instead with the unobserved differences between BHC- versus non-BHC-
sponsored PI-MMFs. Alternatively, perhaps due to the structure of the tests or because of coincidental
events surrounding the Lehman failure, the tests can be biased in favor of finding a result. If
unobserved characteristics of sponsors or of their clientele are driving our main results, we can predict
that those same results will carry over to other funds sponsored by the same BHCs and non-BHCs
that serve the same respective clientele. If the differences in expense ratios are unrelated to risk, then
the expense ratios should change across all funds they manage.
To mitigate these concerns, we construct two “placebo” tests. First, we examine the Government
Institutional MMFs (GI-MMFs) that were also exposed to the Lehman failure, but were less affected
by the changes in risk because the asset holdings of these funds were much more restricted than PI-
MMFs and predominantly contained bonds of government and government-sponsored entities. In
addition, we explore the family of Prime Retail MMFs (PR-MMFs), where a BHC sponsor’s guarantee
may be less attractive to their relatively less risk sensitive target clientele. Schmidt, Timmerman, and
Wermers (2015) argue that retail depositors are relatively unsophisticated and had a much more muted
response to the crisis. If our tests are biased towards finding a result, we are more likely to see a
significant change in expense ratios in government and prime-retail funds, as well as the changes we
have already observed in PI-MMFs.
To facilitate these falsification tests, we apply the identical analysis as in Columns (4) – (6) of
Table 2 to the GI-MMFs and PR-MMFs; the results are shown in Table 3. We observe that contrary
to the results for PI-MMFs, we find no significant difference in the charged expense ratios between
25
GI-MMFs sponsored by BHCs and those that are not. In addition, the BHC-sponsored PR-MMFs
have lower yields than non-BHC-sponsored PR-MMFs, but the BHC-sponsored PR-MMFs do not
charge a higher expense ratio. The fact that we do not see any significance adds confidence to the
interpretation that the observed significant differences in the charged expense ratios of PI-MMFs are
associated with BHC sponsor’s implicit guarantee against increased risk.
5.5 Difference-in-Differences Analysis of Redemptions
We next analyze the changes in the redemption decisions of investors during the post-Lehman
period. If BHC-sponsored funds charge significantly higher expense ratios and if BHC and non-BHC
sponsors provide equal guarantees, then we should see these return-seeking, prime institutional
investors move their funds away from the relatively expensive BHC-sponsored funds toward the
relatively inexpensive non-BHC-sponsored funds. This behavior would be consistent with the
predictions of Christoffersen (2001), Christoffersen and Musto (2002), Kacperczyk and Schnabl
(2013), and Cherenkov and Sunderam (2014).
To assess the difference in redemptions between BHC-sponsored and non-BHC-sponsored
funds before and after the Lehman crisis, we use the data on monthly assets under management from
iMoneyNet and compute the 1-month, 2-month, and 3-month redemptions in percentages for every
share class in our sample. To mitigate the effect of outliers and extreme values, we winsorize the
redemption data at the 1st and 99th percentiles of their empirical distributions. In Table 4, we present
the estimation results of equation (1) and the robust difference-in-differences model proposed by
Bertrand, Duflo and Mullainathan (2004). This analysis parallels that in Table 2 in which the
institutional investors earned less and were charged more during the post-Lehman period at BHC-
sponsored PI-MMFs. Table 4 shows that investors at BHC-sponsored funds behave differently than
what would be predicted by the research. After the Lehman collapse, even while the BHC-sponsored

26
funds charged significantly higher expense ratios and, therefore, paid significantly lower net yields,
these funds faced no greater associated net outflows of funds in the 1-month, 2-month, and 3-month
horizons.
In all, the evidence of the flow analysis shows that institutional investors in BHC-sponsored funds
behave differently. Despite being charged higher expense ratios and earning lower net yields than
investors in non-BHC-sponsored funds, they do not respond by redeeming more that indicates the
BHC sponsorship provides a safety net for institutional investors that they are willing to pay for.
6. Are BHC Sponsors More Likely to Provide Support?
MMF sponsors play a critical role in preventing a fund from breaking the buck. In times of
distress, these sponsors can and do provide liquidity support. Sponsors can purchase assets that have
declined in value at par so that the MMF can meet any mass redemption requests by its investors.
Other forms of sponsor support include capital contributions, capital support agreements, letters of
credit, and performance guarantees. This support is not merely theoretical. Moody’s (2010) provides
examples of major sponsorship interventions and demonstrates that sponsors extended extensive
instances of support in 1994 and 2008. Indeed, sponsor support played a pivotal role during the crisis
of September 2008. The SEC estimates that from August 2007 to December 2008 almost 20% of all
PI-MMFs received sponsor support (Securities and Exchange Commission (2009), p. 20). Brady,
Anadu and Cooper (2012) also conservatively estimate that at least 21 prime MMFs that received
sponsors’ support would have broken the buck in absence of the support during the financial crisis.
Our hypothesis is that BHC sponsorship matters for investors because the sponsoring BHC has
relatively quick and easy access to cheap and information-insensitive funding sources through its
insured subsidiaries, such as insured brokered deposits or the discount window. In addition,
27
regulations recognize the failure of a nonbank subsidiary, such as a sponsored MMF, can have serious
financial ramifications for the BHC, and thus the parent may use its resources to provide support to
that subsidiary. In this section, we examine whether BHCs provide support to their sponsored MMFs
when the fund’s assets lose value, or the redemption activity is high. Given that non-BHC sponsors
lack access to relatively cheap funds, thereby giving the BHC sponsor deeper pockets, we predict the
likelihood of BHC support will be high.
Brady, Anadu and Cooper (2012) list instances of non-contractual support in the form of cash
contributions or purchases of distressed securities at above-market price provided to MMFs by their
sponsors that are based on a review of the annual SEC financial statement filings of public MMF with
fiscal year-end dates falling between 2007 and 2011. They identify the fund name and the
corresponding SEC Series ID of the fund that receives support from the sponsor. Each fund name is
the master class fund name in iMoneyNet. We designate our analysis period from the fiscal year ending
February 2008 to January 2010 to capture support instances for a wider period around September
2008. We search the Series ID in iMoneyNet and extract the master class funds that received the
sponsors’ support.
To evaluate the likelihood of getting support, we collapse the time series in the sample and
conduct a cross-sectional analysis using a logit model at the master class fund-level. If a fund receives
support during the analysis period, we designate the variable Get Support as 1, otherwise zero. To
estimate the logit model, we keep only funds that experienced greater than 20% asset losses in at least
one month during the analysis period. We apply this filtering criteria because we want to restrict our
sample to only those funds that needed their sponsor’s support at some point.
The run on MMFs was triggered by the announcement by the Reserve Primary Fund that it had
suffered significant losses to its holding of Lehman Brothers’ commercial paper and had broken the

28
buck. This announcement had profoundly deleterious effect on the perception of commercial paper
as a safe asset, despite its short maturity and high credit rating (Kacperczyk and Schnabl, 2010).
Therefore, sponsor support because of redemptions would be more likely when the holding of
commercial paper is greater. To allow for this possibility, we create a variable BHC*ABCP and test
whether BHC-sponsored funds are more likely to receive a sponsor’s support if they have larger
holdings of ABCP. In addition, we use commercial paper (both including and excluding ABCP),
ABCP by itself, risky portfolio holdings, and maximum monthly loss as proxies for portfolio risk. We
define risky portfolio holdings as the sum of time deposits, bank obligations, Floating Rate Notes,
Commercial Paper, ABCP. We define the maximum monthly loss as the negative of the largest
monthly percentage change in net assets during the analysis period experienced by a fund. This
transformation makes the interpretation easier, such that a higher value implies higher loss.
We present the results in Table 5. We observe that the coefficient on BHC is positive but
insignificant when the specification does not allow for an interaction term with portfolio riskiness.
Only in Column (2), when we use the interaction with commercial paper (excluding ABCP), is BHC
significant and positive, indicating that the likelihood of bank support is higher relative to nonbanks.
However, in this specification, commercial paper becomes insignificant. We observe that ABCP is
marginally significant and positive for the greater than 20 percent asset loss case. No other risk variable
is significant, with the one exception for of the case when where Maximum Monthly Asset loss is used
as a risk proxy. In this case, the larger the maximum loss the more likely is the sponsor support
In unreported regressions, we analyzed the support instances reported in annual SEC filings with
fiscal year-end dates between February 2008 and February 2009. This narrower sample period mirrors
the ABCP crisis period documented in Acharya and Schnabl (2010). The major difference using this
sample is that the interaction term BHC*ABCP is highly significant, indicating that support varies with

29
the amount of ABCP in a fund. Additionally, while the commercial paper definition excluding ABCP
is insignificant, it becomes significant when the definition includes commercial paper and ABCP.
In all, we can conclude that the likelihood of a bank sponsor’s support was higher, and further
that we have some evidence that ABCP was a driver of the likelihood of sponsor support.
We also cross-sectionally examine the relation between the charged expense ratio and the
likelihood of sponsors’ support. A higher likelihood of sponsor support could sustain a higher expense
ratio. We obtain the estimated probability of getting support from the logit model described above
and present the results in Table 6. We observe that BHC-sponsored funds with a higher probability
of receiving support charge a significantly higher expense ratio. On average, 0.1 rise in the estimated
probability of getting support is associated with 2.1 to 3.9 bps higher expense ratio in the BHC-
sponsored funds.
7. BHC’s Financial Strength and Expense Ratios
In this section, we allow for variations in the liquidity holdings, capitalization levels, and the
default risks of BHC sponsors. We can view these variations as proxies for the ability of the BHC to
provide support and the strength of their guarantee. To the extent that BHC-sponsored MMFs enjoy
an implicit protection derived from their affiliation with their BHCs, MMFs sponsored by BHCs with
lower default risks and more liquidity can provide more valuable guarantees. Hence, the MMF can
charge higher expense ratios to exploit such an advantage.
We obtain BHC quarterly financial data from Y-9C reports and compute the liquidity holdings,
uninsured deposits, and equity ratios as a percentage of BHC total assets. As a measure of equity, we
use the ratio of the total equity capital, as reported on Schedule HC of the Y-9C forms, to the bank’s
reported total assets. This measure includes, perpetual preferred stock, common stock, non-preferred

30
stock surplus, retained earnings, other accumulated income, noncontrolling interests in consolidated
subsidiaries, and other equity capital components. We count federal funds sold, federal funds for
resale, noninterest bearing balances (currency), and interest-bearing balances (domestic and foreign)
as liquid assets.
To ensure that the BHCs’ financial data are known before the expense ratio is determined, we
link the expense ratio and other PI-MMF data to the lagged BHCs’ financial data. For example, we
match BHCs’ financial data in the first quarter of 2008 to PI-MMF data in the second quarter of 2008.
We use three specifications to test our hypothesis. First, we use the lagged BHCs’ financial data as
explanatory variables and test whether the sponsors with lower default risk charge higher expense
ratios. The second specification sorts the lagged BHCs’ financial data into four quartile groups and
tests whether sponsors in lower risk groups charge higher expense ratios. Finally, we collapse the
monthly PI-MMFs data into quarterly data and use lagged BHC financial data as regressors to show
robustness.
We present the results in Table 7. We observe a significantly positive relation between BHCs’
liquid assets ratio and PI-MMFs’ charged expense ratio in Columns (1) and (3) that is consistent with
our hypothesis that BHC sponsors with lower default risks can offer stronger guarantees and thus the
funds sponsored by these BHCs can charge a higher expense ratio. Given that the sample standard
deviation in the liquid assets ratio is 16%, a one standard deviation increase in the liquid assets ratio is
associated with a 5.8 to 6.9 basis points higher expense ratio. The positive relation between the liquid
assets ratio and the charged expense ratio is robust to the alternative specification in Column (2) in
which the explanatory variables are indicators of the BHCs financial variables quartile groups. We
observe that compared with the PI-MMFs sponsored by BHCs with liquid asset ratios in the lowest
quartile, the PI-MMFs sponsored by BHCs with liquid asset ratios in the highest quartile charge 13
basis points higher expense ratios on average. In all of these specifications, the equity ratio is

31
insignificant. This finding shows that MMF investors care about the liquidity strength of the sponsor,
rather than its capitalization.
The other variable we use is uninsured deposits. This variable can signal uninsured depositors’
perception of the strength of a BHC. The higher the level, the more confidence uninsured depositors
have about the financial strength of the BHC, ceteris paribus. Indeed, Jacewitz and Pogach (2018)
show that between 2007 and 2008, the risk premium paid by the largest BHCs was 35 basis points
lower than the risk premium at other BHCs. These uninsured depositors are closest to the MMF
institutional investors, whose funds are explicitly uninsured but can benefit from implicit insurance
provided by the BHC sponsor. Hence, we argue that the amount of uninsured deposits in a BHC can
be a proxy for the collective confidence in this BHC’s financial strength.
We augment our analysis with the uninsured deposit ratio and present the results in Columns (4)
– (6) of Table 7. We observe that the relation between the uninsured deposits ratio and the charged
expense ratio is significant in the quarterly data regression in Column (6), although this relation is less
significant in the monthly data regression and insignificant in the quartiles of the uninsured deposits
ratio. However, in all cases the sign is positive that indicates higher levels of uninsured deposits are
correlated with higher expense ratios. A one standard deviation increase (5%) in the uninsured
deposits ratio is correlated with a 2.35 basis points higher expense ratio in the subsequent quarter. In
addition, in Columns (4) – (6), we find that the significance and magnitude of the liquid asset ratio
remain unchanged when the uninsured deposits ratio is taken into account.
The positive and significant relation between uninsured deposits and expense ratios can have an
alternate explanation. It is possible that uninsured depositors of the sponsoring BHC can move their

32
funds into the MMFs to exploit the US Treasury’s guarantee on MMFs.9 Therefore, MMFs could have
raised expense ratios to meet the increased demand. On September 29, following the collapse of the
Reserve Fund and the unprecedented fund outflows that followed, the US Treasury announced the
Temporary Guarantee Program for Money Market Funds (commonly known as TGP). 10 This
program retroactively guaranteed money held by MMF investors as of the close of business on
September 19, 2008 – 10 days earlier. TGP was designed to address “temporary dislocations in the
credit market,” specifically to buttress the MMF industry by stabilizing fund values. Indeed, TGP likely
reduced the liquidity risk of the industry, overall, as existing funds no longer had a reason to flee.
Moreover, other government responses to the crisis created new risk-free money management options
for institutional investors. Starting on October 14, 2008, the FDIC implemented the Temporary
Liquidity Guarantee Program (TLGP). In part, the TLGP offered to guarantee without limit non-
interest-bearing transaction accounts. By the end of December 2008, the Program guaranteed nearly
$684 billion or 84% of deposits in eligible accounts (see Quarterly Banking Profile, FDIC; Fourth
Quarter 2008 and authors calculations). Moreover, there was a large and protracted increase in deposit
accounts that were protected by the TLGP. Funds covered by the TLGP increased by more than 13%
($112 billion), over the course of 2009. These accounts are typically deposits by businesses used to
make payroll and facilitate other business transactions. As a point of comparison, the cumulative
outflows from PI-MMFs in September and October 2008 was approximately $400 billion 11 The
guarantee of noninterest-bearing transaction accounts ultimately expired on December 31, 2010.12
9 See US Treasury Press Release, September 29, 2008 (https://www.treasury.gov/press-center/press-releases/Pages/hp1161.aspx)
10 Ibid.
11 See Schmidt, Timmermann, and Wermers (2016).
12 See Federal Deposit Insurance Corporation (2017).

33
However, the specifics of the program’s design were such that it had less of an impact on our
empirical results. Namely, its retroactive nature meant that it did not directly affect the marginal
investor. Unlike most insurance guarantees, the TGP was a “sunk guarantee,” in the sense that it
applied only to funds that existed at some time in the past. The US Treasury’s announcement noted
that the coverage applied “to shareholders for amounts that they held in participating money market
funds as of the close of business on September 19, 2008.” From the perspective of a marginal investor,
looking to invest a dollar or move a dollar in the present, that dollar would not be and could not be
guaranteed under the Treasury program. Thus, throughout the full post-Lehman period, the maximum
value of the guarantee for each individual fund and each individual investor was immutably based on
an ex ante unknowable date in the past.
To conclude, our analysis exploits the variations within BHC sponsors and indicates that PI-
MMFs that have BHC sponsors with lower default risks represented by a higher liquid assets ratio
charged a higher expense ratio. This result complements the main argument in this paper.
8. Changes in the Expense Ratios Around the 2016 MMF Reform
The analysis thus far has concentrated on the 2008 financial crisis that heightened risk for MMF
investors. Therefore, the sponsor guarantee became more important and valuable for MMF investors.
In this section, we identify an exogenous shock to MMFs. In 2016, the government put regulations in
place that potentially affected the value of a sponsor’s guarantee. Therefore, we look for changes in
the expense ratios around the time of these substantial regulatory developments.

34
On July 23, 2014, the SEC adopted a reform to address the risk of investor runs in MMFs.13 One
of the major changes that affected PI-MMFs was the imposition of floating net asset values (NAV) to
be fully in effect by October 14, 2016. This change required the PI-MMFs to value their portfolio
instruments by using present market value rather than the amortized cost. Funds were no longer
required to maintain a fixed share price of $1.00. In this way, “breaking the buck” is no longer possible.
Regulators explicitly intended to reduce the risk of breaking the buck by introducing the floating
NAV.14 In that case, the value of the implicit guarantee from the sponsors, or at least the perceived
value, would have been reduced after the 2016 Money Market Fund reform. Hence, if the difference
in expense ratios between BHC-sponsored funds and non-BHC-sponsored funds was driven by a
difference in risk exposure for investors and if the reforms reduced or eliminated the value of the
implicit guarantee, then the premium in expense ratios charged by BHC-sponsored funds would
shrink or disappear after the reform.
Figure 4 displays the difference in the average expense ratios for BHC-sponsored and non-BHC-
sponsored funds from 2014 through 2018. The vertical lines represent the month when the reform
went into effect. As a reference for the overarching interest rate environment, the figure also provides
the Federal Funds Rate. We observe that before the reform, BHC-sponsored PI-MMFs charged
higher expense ratio mostly. Shortly after the Reform, however, in response to the change in interest
rate environment, non-BHC-sponsored PI-MMFs rose their expense ratio more than the BHC-
sponsored PI-MMFs and as a consequence the relation flipped that non-BHC-sponsored funds
consistently charged higher expense ratio. We should also note that changes in the number of BHC-
13 See Securities and Exchange Commission press release, July 23, 2014. (https://www.sec.gov/news/press-release/2014-143)
14 See SEC Commissioner Aguilar’s public statement “Strengthening Money Market Funds to Reduce Systemic Risk”, July 23, 2014. (https://www.sec.gov/news/public-statement/2014-07-23-open-meeting-statment-laa)

35
sponsored funds in the market after the reform were larger. From January 2016 to August 2017, the
number of BHC-sponsored funds declined by 50%, whereas the number of non-BHC-sponsored
funds decreased by 23%.
To further examine this regulatory change, we conduct an analysis parallel to that in Table 2 with
a robust difference-in-differences method as proposed by Bertrand, Duflo and Mullainathan (2004).
The results are shown in Table 8. To better assess the change in expense ratios, we restrict our sample
to the same set of fund complexes as in our analysis of the Lehman collapse conditional on the fund
complexes still existing during our sample period of July 2014 to July 2018. We start in July 2014
because this is the date the new reform was first proposed.
Table 2 shows that the funds sponsored by BHCs had lower net yields while charging higher
expense ratios after Lehman failed compared to funds sponsored by non-BHCs. In contrast, as shown
in Columns (2) and (3) of Table 8, the analysis on the same sample of fund complexes indicates that
after the reform, BHC-sponsored PI-MMFs delivered higher net yields and charged lower expense
ratios than non-BHC-sponsored PI-MMFs. In a robustness check, we perform another analysis that
uses the full sample of all the available fund complexes in iMoneyNet during the sample period and
find that the results remain significant and have similar magnitude. Our findings are consistent with a
reduction in the value of an implicit subsidy following the 2016 reforms and thus provide ancillary
evidence that before the reform, the implicit guarantee from the BHC sponsors was valuable and
funds sponsored by BHCs were able to charge higher expense ratios.
9. Conclusion
PI-MMFs are an important part of the shadow banking system. In this paper, we show that an
important distinguishing feature of these funds is that PI-MMF investors perceive BHC-sponsored

36
funds to be less risky than non-BHC-sponsored PI-MMFs and price this BHC affiliation accordingly.
We provide evidence that they accept lower net yields and redeem less, in contrast to the explanations
in the literature. In other words, institutional investors behaved as if they were paying insurance
premiums to BHC-sponsored MMFs to protect their investment against losses during the 2008 MMF
crisis. In support of this shadow insurance hypothesis, we further show that the charged expense ratio
is associated with the sponsoring BHC’s financial strength and the likelihood of its support. Moreover,
consistent with our hypothesis, the premium charged in the expense ratio of BHC-sponsored MMFs
disappeared after the 2016 MMF reform that shifted the risk from MMFs to investors.
These observations are important in light of the definition of shadow banks first proposed by
McCulley (2009) and followed by many others (Acharya, Schnabl, and Suarez, 2013; Kane, 2014;
Financial Stability Board, 2015). These definitions highlight two quintessential characteristics of
shadow banks. One, they operate in the shadows without access to FDIC insurance. The other is that
because shadow banks do not have explicit access to the government safety net, they do not operate
under the same regulatory constraints.
However, our findings add a third characteristic. We show that shadow banks can extend shadow
insurance. We show that during the 2008 crisis BHC-sponsored MMFs extended shadow insurance
by charging “premiums” in the form of higher expense ratios. This guarantee was more pronounced
at BHC-sponsored MMFs because the sponsor had access to the government safety net. Therefore,
we argue that it is better to characterize some of these nontraditional intermediation activities as
“banks in the shadows extending shadow insurance” rather than “shadow banks.”

37
References
Acharya, Viral V., and Philipp Schnabl, 2010, "Do global banks spread global imbalances? Asset-backed commercial paper during the financial crisis of 2007–09." IMF Economic Review 58(1): 37-73.
Acharya, Viral V., Philipp Schnabl, and Gustavo Suarez, 2013, “Securitization Without Risk Transfer,” Journal of Financial Economics 107, 515–536.
Baklanova, Viktoria and Joseph Tanega, eds., 2014, Money Market Funds in the EU and the US: Regulation and Practice, Oxford University Press.
Bertrand, Marianne, Esther Duflo, and Sendhil Mullainathan, 2004, “How Much Should We Trust Differences-in-Differences Estimates?” The Quarterly Journal of Economics 119(1), 249-275.
Bertrand, Marianne, and Sendhil Mullainathan, 2003, “Enjoying the Quiet Life? Corporate Governance and Managerial Preferences.” Journal of Political Economy, vol. 111, no. 5, pp. 1043–1075.
Board of Governors of the Federal Reserve System, 2016, “Bank Holding Company Supervision Manual,” Division of Banking Supervision and Regulation.
Brady, Steffanie, Kenechukwu Anadu, and Nathaniel Cooper, 2012, “The Stability of Prime Money Market Mutual Funds: Sponsor Support from 2007 to 2011”, Available at SSRN 3015986
Burcu Duygan-Bump, Patrick Parkinson, Eric Rosengren, Gustavo A. Suarez, and Paul Willen, 2013, “How Effective Were the Federal Reserve Emergency Liquidity Facilities? Evidence from the Asset-Backed Commercial Paper Money Market Mutual Fund Liquidity Facility,” Journal of Finance 68(2), 715-737. (Also available at www.bos.frb.org/bankinfo/qau/index.htm.)
Buser, Stephen A., Andrew H. Chen, and Edward J. Kane, 1981, “Federal Deposit Insurance, Regulatory Policy, and Optimal Bank Capital,” Journal of Finance 36(1), 51-60.
Chernenko, Sergey and Adi Sunderam, Frictions in Shadow Banking: Evidence from the Lending Behavior of Money Market Mutual Funds, The Review of Financial Studies, Volume 27, Issue 6, June 2014, Pages 1717–1750.
Covitz, Daniel, Nellie Liang, and Gustavo A. Suarez, 2013, “The Evolution of a Financial Crisis: Collapse of the Asset-Backed Commercial Paper Market,” Journal of Finance 68(3), 815-848.
Christoffersen, Susan E. K., 2001, “Why do Money Fund Managers Voluntarily Waive Their Fees?” Journal of Finance, Vol 56 (3), 117-1140.
Christoffersen, Susan E. K and David Musto, 2002, Demand Curves and the Pricing of Money Management, The Review of Financial Studies, Volume 15, Issue 4
Ehrbar, Al, 1994, “The Great Bond Market Massacre,” Fortune Magazine, October 17.
Federal Deposit Insurance Corporation (FDIC). 2017. Crisis and Response: An FDIC History, 2008–2013. Washington, DC: FDIC.Financial Stability Board, 2015, “Global Shadow Banking Monitoring Report 2015,” November 12, www.fsb.org/wp-content/uploads/global-shadow-banking-monitoring-report-2015.pdf.
Ferreira, Miguel A., Pedro Matos, and Pedro Pires, 2018, "Asset Management Within Commercial Banking Groups: International Evidence," Journal of Finance 73(5), 2181-2227.

38
Financial Stability Board, 2015, “Global Shadow Banking Monitoring Report 2015,” https://www.fsb.org/2015/11/global-shadow-banking-monitoring-report-2015/
Investment Company Institute, 2009, “Report of the Money Market Working Group,” https://www.ici.org/pdf/ppr_09_mmwg.pdf.
Investment Company Institute Research Perspective, Trends in the Expenses and Fees of Funds, 2017, April 2018, Vol 24 No 3.
Jacewitz, Stefan and Jonathan Pogach, "Deposit Rate Advantages at the Largest Banks," Journal of Financial Services Research, 53(1), 1-35.
Kacperczyk, Marcin and Philipp Schnabl, 2013, “How Safe Are Money Market Funds?” The Quarterly Journal of Economics, 128(3), 1073-1122.
Kacperczyk, Marcin and Philipp Schnabl, 2010, When Safe Proved Risky: Commercial Paper during the Financial Crisis of 2007-2009,” Journal of Economic Perspectives, 24 (1), 29-50
Kane, Edward J., 1981, “Accelerating Inflation, Technological Innovation, and the Decreasing Effectiveness of Banking Regulation,” Journal of Finance 36(2), 355-67.
Kane, Edward J., 1983, “Policy Implications of Structural Changes in Financial Markets,” American Economic Review 73(2), 96-100.
Kane, Edward J., 2014, "Shadowy Banking: Theft by Safety Net." Yale Journal on Regulation, 31(3), 773-808.
Moody’s, 2010, “Fund Support Key to Money Market Funds,” Moody’s Investors Service, August 9.
McCabe Patrick E., 2010, “The Cross Section of Money Market Fund Risks and Financial Crises,” Finance and Economics Discussion Series 2010-51, Board of Governors of the Federal Reserve.
McCulley, Paul, 2009 "The Shadow Banking System and Hyman Minsky’s Economic Journey," Global Central Bank Focus 12
Morley, John, 2014, “The Separation of Funds and Managers: A Theory of Investment Fund Structure and Regulation,” The Yale Law Journal 123(5), 1228-1287.
Pogach, J. and Haluk Unal, 2020, “Banks’ Nonbank Business,” FDIC Working Paper
Schmidt, Lawrence, Allan Timmermann, and Russ Wermers, 2016, "Runs on Money Market Mutual Funds," American Economic Review 106(9), 2625-57.
Securities and Exchange Commission, 2009, “Money Market Fund Reform: Proposed Rule,” https://www.sec.gov/rules/proposed/2009/ic-28807.pdf.
Securities and Exchange Commission, 2014.a, “Money Market Fund Reform; Amendments to Form PF: Final Rule,” www.sec.gov/rules/final/2014/33-9616.pdf.
Securities and Exchange Commission, 2014.b, “SEC Adopts Money Market Fund Reform Rules,” Press Release, www.sec.gov/News/PressRelease/Detail/PressRelease/1370542347679.
Strahan, Philip E. and Başak Tanyeri, 2013, “Once Burned, Twice Shy: Money Market Fund Responses to a Systemic Liquidity Shock,” Journal of Financial and Quantitative Analysis 50(1-2), 119-144.
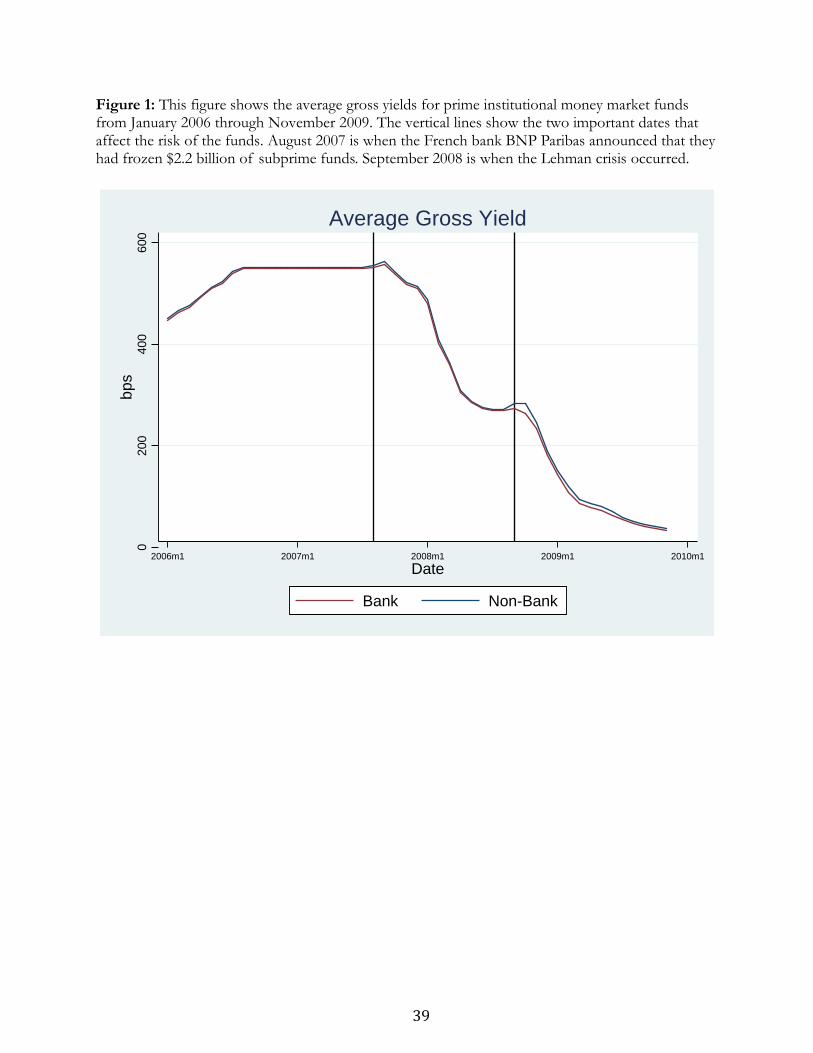
39
Figure 1: This figure shows the average gross yields for prime institutional money market funds from January 2006 through November 2009. The vertical lines show the two important dates that affect the risk of the funds. August 2007 is when the French bank BNP Paribas announced that they had frozen $2.2 billion of subprime funds. September 2008 is when the Lehman crisis occurred.
0200
400
600
bps
2006m1 2007m1 2008m1 2009m1 2010m1
Date
Bank Non-Bank
Average Gross Yield
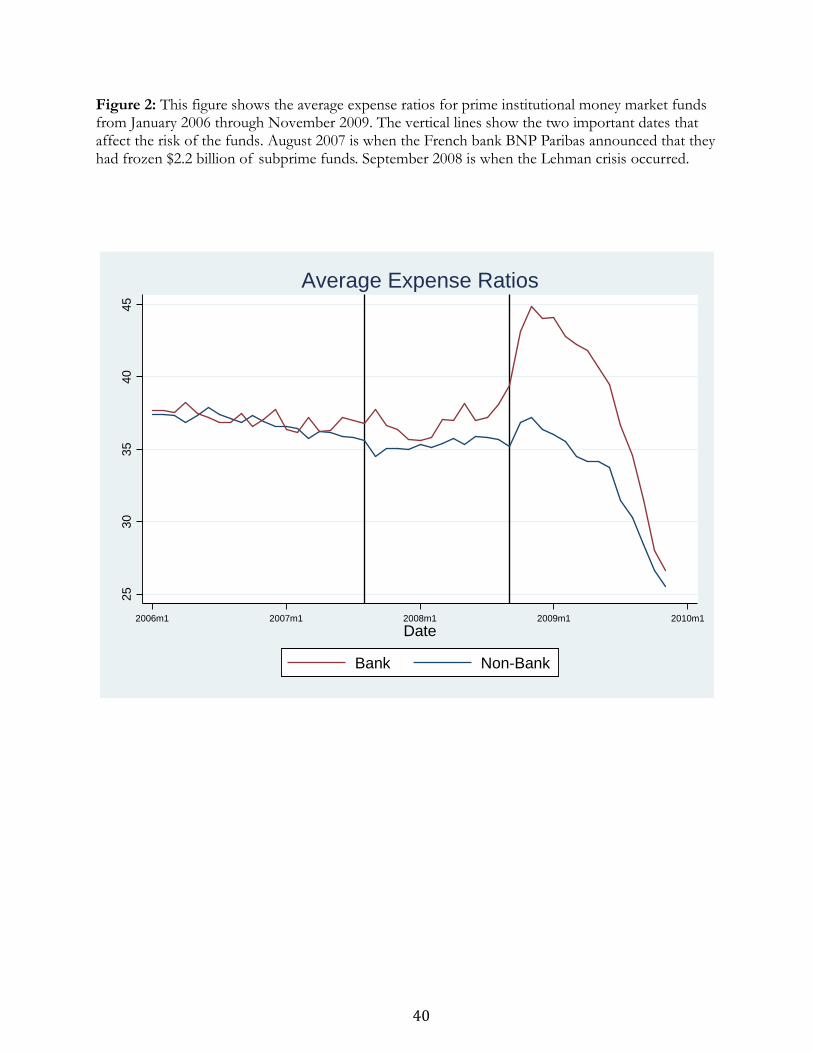
40
Figure 2: This figure shows the average expense ratios for prime institutional money market funds from January 2006 through November 2009. The vertical lines show the two important dates that affect the risk of the funds. August 2007 is when the French bank BNP Paribas announced that they had frozen $2.2 billion of subprime funds. September 2008 is when the Lehman crisis occurred.
25
30
35
40
45
2006m1 2007m1 2008m1 2009m1 2010m1
Date
Bank Non-Bank
Average Expense Ratios

41
Figure 3: This figure shows the average expense ratios by required minimum investment before and after the Lehman failure (September 2008). Funds are separated into three sizes: “small” for funds with minimum balances of less than $25,000, “medium” for funds with between $25,000 and $1,000,000, and “large” for funds with minimum balances of more than $1,000,000.
05
10
15
20
25
30
35
40
45
50
55
60
Ba
sis
Po
ints
Small Medium Large
by Minimum Investment (Pre-Lehman)
Mean Expense Ratio
Bank Non-Bank
05
10
15
20
25
30
35
40
45
50
55
60
Ba
sis
Po
ints
Small Medium Large
by Minimum Investment (Post-Lehman)
Mean Expense Ratio
Bank Non-Bank

42
Figure 4: This figure shows the difference in the average expense ratios for prime institutional
money market funds for bank and non-bank sponsors (left axis, positive indicates bank sponsored
funds are higher) and the Federal Funds Rate (right axis), from July 2014 to June. The vertical line
shows the month when the Money Market Fund Reform went into effect.

43
Table 1: This table presents the portfolio characteristics of prime institutional money market funds
(PI-MMFs) as of June and December 2008. The means for each variable are given for the universe of
PI-MMFs as well as for each group of sponsors – non-BHCs and BHCs. The standard deviations are
in the parentheses below the mean. Holdings are as a fraction of total net assets. Stars on the mean
represent the significance of the difference between non-BHC and BHC-sponsors, with *** for 1%,
** for 5%, and * for 10%.
June 2008 December 2008
All Non-BHC
BHC All Non-BHC
BHC
30-Day Gross Yield (bps) 274.3 275.1 272.9 185.2 189.6 180.3* (17.14) (16.89) (17.61) (50.68) (59.45) (38.27) Expense Ratio (bps) 36.3 36.04 36.83 39.83 36.16 43.92*** (23.98) (25.45) (20.83) (24.22) (23.39) (24.54) 30-Day Net Yield (bps) 238 239 236 145.3 153.4 136.4*** (28.55) (30.03) (25.34) (52.51) (58.88) (42.80) Share Class Assets ($B) 3.5 3.3 3.9 3.2 3.0 3.4 (7.6) (7.6) (7.8) (7.1) (6.4) (7.8) WAM (days) 42.24 42.31 42.1 37.85 39.14 36.42* (11.82) (12.34) (10.73) (13.54) (16.28) (9.467) Age (years) 9.948 9.942 9.959 10.87 11.17 10.55 (6.999) (7.142) (6.734) (7.147) (7.638) (6.568) Complex Assets ($B) 103.6 108.4 94.0 137.5 131.7 143.8 Low-Risk Holdings
(108.9)
(119.8) (82.4) (138.9) (160.6) (109.9)
U.S. Govt. 0.0489 0.048 0.0507 0.0861 0.0859 0.0863 (0.0951) (0.0891) (0.107) (0.129) (0.121) (0.137)
Repos 0.135 0.136 0.133 0.148 0.147 0.150 Risky Holdings
(0.118) (0.125) (0.104) (0.165) (0.203) (0.109)
All Risky Holdings 0.816 0.816 0.816 0.766 0.767 0.764 (0.159) (0.158) (0.161) (0.201) (0.218) (0.181) Time Deposits 0.0297 0.0208 0.0473*** 0.0357 0.0231 0.0499*** (0.0412) (0.032) (0.0508) (0.0613) (0.0405) (0.0759) Bank Obligations 0.189 0.18 0.207 0.176 0.208 0.140*** (0.15) (0.143) (0.162) (0.151) (0.167) (0.122) Floating Rate Notes 0.185 0.194 0.168* 0.149 0.149 0.148 (0.137) (0.144) (0.12) (0.138) (0.157) (0.113) Commercial Paper 0.242 0.218 0.290*** 0.222 0.226 0.218 (0.189) (0.196) (0.163) (0.159) (0.181) (0.129) ABCP 0.17 0.203 0.103*** 0.184 0.162 0.208** (0.164) (0.173) (0.118) (0.183) (0.176) (0.188)
Observations 345 230 115 317 167 150

44
Table 2: This table shows the relation between the yield and expense ratios with fund sponsorship. Columns (1) – (3) present results from equation (1). Columns (4) – (6) present results from regressions on the months before and after Lehman bankruptcy. Bertrand, Duflo and Mullainathan (2004) propose this technique as a robust difference-in-differences regression that produces consistent standard errors. BHC is a dummy variable that equals one for BHC-sponsored funds and zero otherwise. After Lehman equals one for observations in September 2008 – February 2009 and zero for observations in February 2008 – August 2008. The sample period is from February 2008 to February 2009. Standard errors are clustered at the sponsor level. Robust t-statistics are in parentheses. The *, **, and *** denotes significance at the 10%, 5%, and 1% level, respectively.
Difference-in-Differences Robust Difference-in-Differences
(1) (2) (3) (4) (5) (6) VARIABLES 30-Day
Gross Yield (bps)
30-Day Net Yield (bps)
Charged Expense
Ratio (bps)
30-Day Gross Yield
(bps)
30-Day Net Yield (bps)
Charged Expense
Ratio (bps)
BHC -7.15** -10.78** 3.62 -3.06 -6.63 3.19 (-2.13) (-2.49) (1.10) (-1.08) (-1.50) (0.99) After Lehman -23.00*** -20.32*** -2.63 118.43*** 137.92*** -6.85 (-4.82) (-4.21) (-1.47) (3.76) (4.34) (-0.54) BHC * After Lehman -6.77 -13.24** 6.55** -8.99* -12.83** 4.97** (-1.16) (-2.10) (2.59) (-1.70) (-2.26) (2.08) log(Complex Assets) -0.54 -1.48 0.93 -1.52 -2.65** 0.96 (-0.53) (-1.45) (0.99) (-1.46) (-2.34) (1.00) Treasury Yield (bps) 0.51*** 0.52*** -0.01** 1.55*** 1.70*** -0.05 (18.54) (19.33) (-2.07) (6.76) (7.29) (-0.55) log(WAM) 16.58*** 11.87* 4.81** 23.37*** 17.85*** 6.16** (2.83) (1.91) (2.47) (4.91) (3.66) (2.44) Time Deposits (%) 1.15*** 1.07*** 0.08 0.39 0.30 0.10 (3.50) (2.72) (0.35) (0.89) (0.56) (0.30) Bank Obligations (%) 1.01*** 1.07*** -0.06 1.04*** 1.16*** -0.10 (7.74) (6.03) (-0.44) (8.71) (6.79) (-0.70) Floating Rate Notes (%) 1.38*** 1.50*** -0.12 1.17*** 1.37*** -0.17* (5.85) (6.89) (-1.33) (7.35) (9.55) (-1.80) Commercial Paper (%) 0.72*** 0.79*** -0.07 0.54*** 0.65*** -0.10 (4.21) (4.32) (-0.97) (4.57) (4.38) (-1.12) ABCP (%) 0.55*** 0.56*** -0.01 0.69*** 0.73*** -0.03 (3.19) (2.74) (-0.09) (3.61) (3.68) (-0.34) log(Minimum Investment) 0.01 1.47*** -1.46*** 0.08 1.38*** -1.31*** (0.02) (4.36) (-5.39) (0.31) (3.86) (-4.51) Constant 101.23*** 68.29*** 32.51*** -75.26 127.31*** 34.51* (5.38) (3.35) (3.63) (-1.62) (-2.71) (1.95)
Observations 4,355 4,354 4,359 708 707 709 R-squared 0.513 0.503 0.121 0.875 0.804 0.115

45
Table 3: This table shows the results from a robust difference-in-differences method as proposed by Bertrand, Duflo and Mullainathan (2004) for yields and expense ratios of Government Institutional MMFs and Prime Retail MMFs. The sample MMFs here are chosen such that these MMFs have the same sponsors as the PI-MMFs in Table 2. BHC is a dummy variable that equals one for BHC-sponsored funds and zero otherwise. After Lehman equals one for observations in September 2008 – February 2009 and zero for observations in February 2008 – August 2008. The sample period is from February 2008 to February 2009. Standard errors are clustered at the sponsor level. Robust t-statistics are in parentheses. The *, **, and *** denotes significance at the 10%, 5%, and 1% level, respectively.
Government Institutional MMFs Prime Retail MMFs
(1) (2) (3) (4) (5) (6)
VARIABLES 30-Day Gross
Yield (bps)
30-Day Net Yield
(bps)
Charged Expense
Ratio (bps)
30-Day Gross
Yield (bps)
30-Day Net Yield
(bps)
Charged Expense
Ratio (bps)
BHC -5.60 -8.96 3.32 -3.55 -10.73 7.18
(-0.98) (-1.19) (0.89) (-0.75) (-1.64) (1.03)
After Lehman -14.72 -35.06 22.25 161.19*** 33.32 127.86
(-0.50) (-1.09) (1.36) (2.96) (0.48) (1.20)
BHC * After Lehman 1.05 0.09 1.20 -13.05** -11.82** -1.22
(0.15) (0.01) (0.37) (-2.15) (-2.00) (-0.41)
log(Complex Assets) -3.02** -4.17** 1.13 -0.32 2.61 -2.92
(-2.36) (-2.55) (1.46) (-0.28) (1.45) (-1.38)
Treasury Yield (bps) 0.87*** 0.69*** 0.20 2.15*** 1.05 1.10
(3.65) (2.76) (1.60) (4.47) (1.65) (1.14)
log(WAM) 7.94*** 4.88* 3.23** 30.63*** 27.90*** 2.72
(3.66) (1.97) (2.19) (4.39) (2.82) (0.37)
Time Deposits (%) 0.84** 0.55 0.30
(2.20) (0.63) (0.37)
Bank Obligations (%) 1.02*** 0.74*** 0.27
(5.81) (4.10) (1.08)
Floating Rate Notes (%) 1.53*** 1.60*** -0.07* 1.32*** 0.71*** 0.62***
(7.98) (8.62) (-1.80) (7.43) (2.94) (2.98)
Commercial Paper (%) -5.62 -2.52 -3.07*** 0.53*** 0.08 0.45**
(-1.11) (-0.48) (-4.35) (4.00) (0.54) (2.59)
ABCP (%) 0.71*** 0.41 0.29
(4.71) (1.57) (1.11)
log(Minimum Investment) -0.19 1.34*** -1.51*** 0.26 1.75*** -1.49***
(-0.53) (3.05) (-3.92) (1.24) (3.19) (-2.91)
Constant 94.47** 87.80* 3.36 -204.75** -101.58 -103.17
(2.25) (1.89) (0.15) (-2.65) (-1.02) (-0.68)
Observations 748 748 750 527 527 527
R-squared 0.865 0.824 0.154 0.875 0.688 0.118
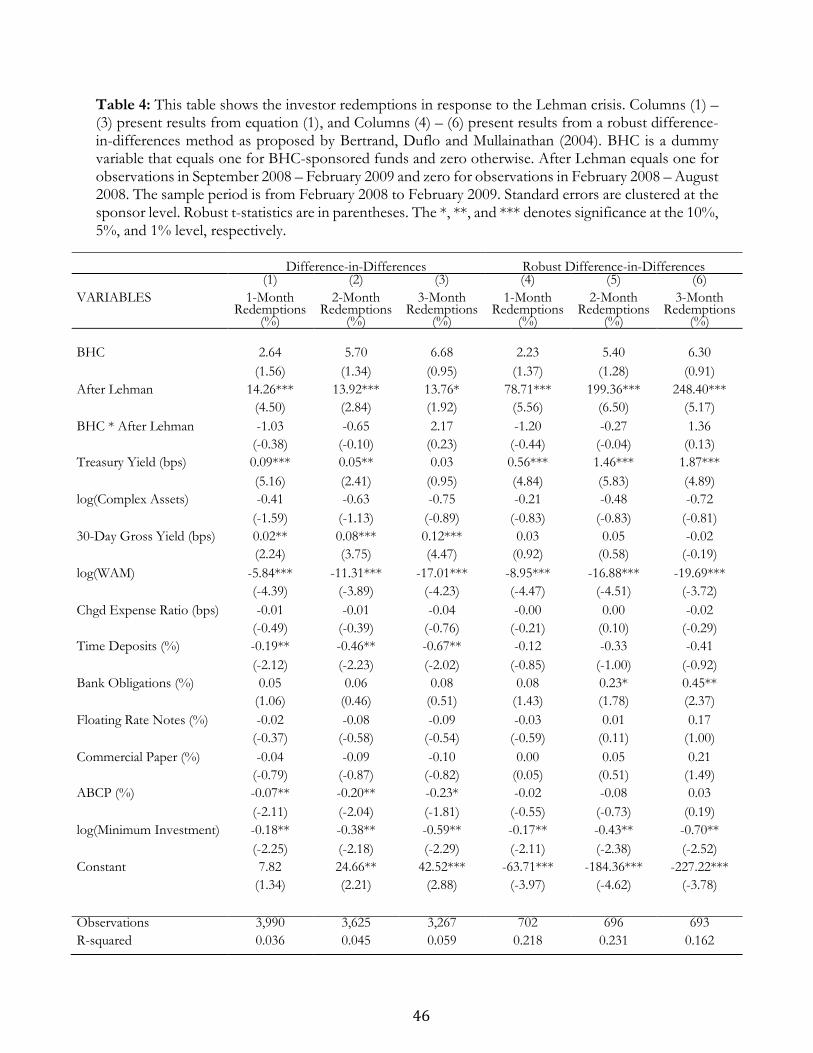
46
Table 4: This table shows the investor redemptions in response to the Lehman crisis. Columns (1) – (3) present results from equation (1), and Columns (4) – (6) present results from a robust difference-in-differences method as proposed by Bertrand, Duflo and Mullainathan (2004). BHC is a dummy variable that equals one for BHC-sponsored funds and zero otherwise. After Lehman equals one for observations in September 2008 – February 2009 and zero for observations in February 2008 – August 2008. The sample period is from February 2008 to February 2009. Standard errors are clustered at the sponsor level. Robust t-statistics are in parentheses. The *, **, and *** denotes significance at the 10%, 5%, and 1% level, respectively.
Difference-in-Differences Robust Difference-in-Differences
(1) (2) (3) (4) (5) (6)
VARIABLES 1-Month Redemptions
(%)
2-Month Redemptions
(%)
3-Month Redemptions
(%)
1-Month Redemptions
(%)
2-Month Redemptions
(%)
3-Month Redemptions
(%)
BHC 2.64 5.70 6.68 2.23 5.40 6.30
(1.56) (1.34) (0.95) (1.37) (1.28) (0.91)
After Lehman 14.26*** 13.92*** 13.76* 78.71*** 199.36*** 248.40***
(4.50) (2.84) (1.92) (5.56) (6.50) (5.17)
BHC * After Lehman -1.03 -0.65 2.17 -1.20 -0.27 1.36
(-0.38) (-0.10) (0.23) (-0.44) (-0.04) (0.13)
Treasury Yield (bps) 0.09*** 0.05** 0.03 0.56*** 1.46*** 1.87***
(5.16) (2.41) (0.95) (4.84) (5.83) (4.89)
log(Complex Assets) -0.41 -0.63 -0.75 -0.21 -0.48 -0.72
(-1.59) (-1.13) (-0.89) (-0.83) (-0.83) (-0.81)
30-Day Gross Yield (bps) 0.02** 0.08*** 0.12*** 0.03 0.05 -0.02
(2.24) (3.75) (4.47) (0.92) (0.58) (-0.19)
log(WAM) -5.84*** -11.31*** -17.01*** -8.95*** -16.88*** -19.69***
(-4.39) (-3.89) (-4.23) (-4.47) (-4.51) (-3.72)
Chgd Expense Ratio (bps) -0.01 -0.01 -0.04 -0.00 0.00 -0.02
(-0.49) (-0.39) (-0.76) (-0.21) (0.10) (-0.29)
Time Deposits (%) -0.19** -0.46** -0.67** -0.12 -0.33 -0.41
(-2.12) (-2.23) (-2.02) (-0.85) (-1.00) (-0.92)
Bank Obligations (%) 0.05 0.06 0.08 0.08 0.23* 0.45**
(1.06) (0.46) (0.51) (1.43) (1.78) (2.37)
Floating Rate Notes (%) -0.02 -0.08 -0.09 -0.03 0.01 0.17
(-0.37) (-0.58) (-0.54) (-0.59) (0.11) (1.00)
Commercial Paper (%) -0.04 -0.09 -0.10 0.00 0.05 0.21
(-0.79) (-0.87) (-0.82) (0.05) (0.51) (1.49)
ABCP (%) -0.07** -0.20** -0.23* -0.02 -0.08 0.03
(-2.11) (-2.04) (-1.81) (-0.55) (-0.73) (0.19)
log(Minimum Investment) -0.18** -0.38** -0.59** -0.17** -0.43** -0.70**
(-2.25) (-2.18) (-2.29) (-2.11) (-2.38) (-2.52)
Constant 7.82 24.66** 42.52*** -63.71*** -184.36*** -227.22***
(1.34) (2.21) (2.88) (-3.97) (-4.62) (-3.78)
Observations 3,990 3,625 3,267 702 696 693
R-squared 0.036 0.045 0.059 0.218 0.231 0.162

47
Table 5: This table presents the results of a Logit model for the analysis on the likelihood of receiving support from sponsors. Get Support is a binary variable that equals one if the fund gets support from its sponsor and zero otherwise. BHC is a dummy variable that equals one for BHC-sponsored funds and zero otherwise. Business Spillover is defined as the sponsor’s assets under management excluding its PI-MMF divided by the sponsor’s total assets under management (Kacperczyk and Schnabl, 2013). Maximum Monthly Asset Loss is the negative of the largest monthly percentage change in net assets during the analysis period experienced by a fund. We use instances of sponsor support instances reported in annual SEC financial statement filings with fiscal year-end dates falling between February 2008 and January 2010 to conservatively capture all the support instances occurred during February 2008 to February 2009. The sample period for MMF data is from February 2008 to February 2009. Standard errors are clustered at sponsor level. Robust z-statistics are in parentheses. The *, **, and *** denotes significance at the 10%, 5%, and 1% level, respectively.
(1) (2) (3) (4) (5) (6)
VARIABLES Get Support (1/0)
Get Support (1/0)
Get Support (1/0)
Get Support (1/0)
Get Support (1/0)
Get Support (1/0)
BHC 1.087 2.225* -0.528 -2.043 4.021 -2.044
(1.13) (1.69) (-0.41) (-1.08) (0.96) (-1.16)
BHC * CP (Excluding ABCP) -0.044
(-0.92)
BHC * ABCP 0.103*
(1.95)
BHC * Commercial Paper 0.073
(1.62)
BHC * Risky Holdings -0.038
(-0.65)
BHC * Max Monthly Loss 0.067**
(1.96)
CP (Excluding ABCP) (%) 0.043 0.058 0.035 0.040
(1.01) (1.24) (0.82) (0.96)
ABCP (%) 0.016 0.021 -0.012 0.022
(0.50) (0.62) (-0.30) (0.67)
Commercial Paper (%) 0.002
(0.06)
Risky Holdings 0.022
(0.63)
Maximum Monthly Asset Loss 0.039** 0.042** 0.041* 0.031* 0.021 0.017
(2.19) (2.33) (1.92) (1.72) (1.30) (1.08)
Business Spillover -0.016 -0.017 -0.020 -0.014 -0.021 -0.017
(-0.93) (-1.01) (-1.20) (-0.73) (-0.95) (-1.08)
log(Complex Assets) 0.336 0.268 0.136 0.226 0.141 0.327
(1.43) (1.02) (0.55) (1.14) (0.82) (1.52)
log(WAM) 1.673 1.693 2.146 1.999 1.107 1.684
(1.42) (1.38) (1.50) (1.54) (0.96) (1.56)
Time Deposits (%) 0.150 0.150 0.183 0.183 0.194
(1.26) (1.24) (1.43) (1.61) (1.64)

48
Bank Obligations (%) -0.051 -0.041 -0.034 -0.044 -0.056
(-1.23) (-0.88) (-0.67) (-1.08) (-1.23)
Floating Rate Notes (%) 0.043 0.050 0.042 0.031 0.044
(0.95) (1.09) (0.84) (0.68) (0.99)
log(Minimum Investment) -0.039 -0.032 -0.015 -0.033 -0.029 -0.015
(-0.50) (-0.38) (-0.15) (-0.43) (-0.46) (-0.20)
Constant -13.594** -13.989*** -13.237** -12.149** -8.595* -12.782***
(-2.52) (-2.58) (-2.25) (-2.33) (-1.83) (-2.62)
Observations 80 80 80 80 80 80
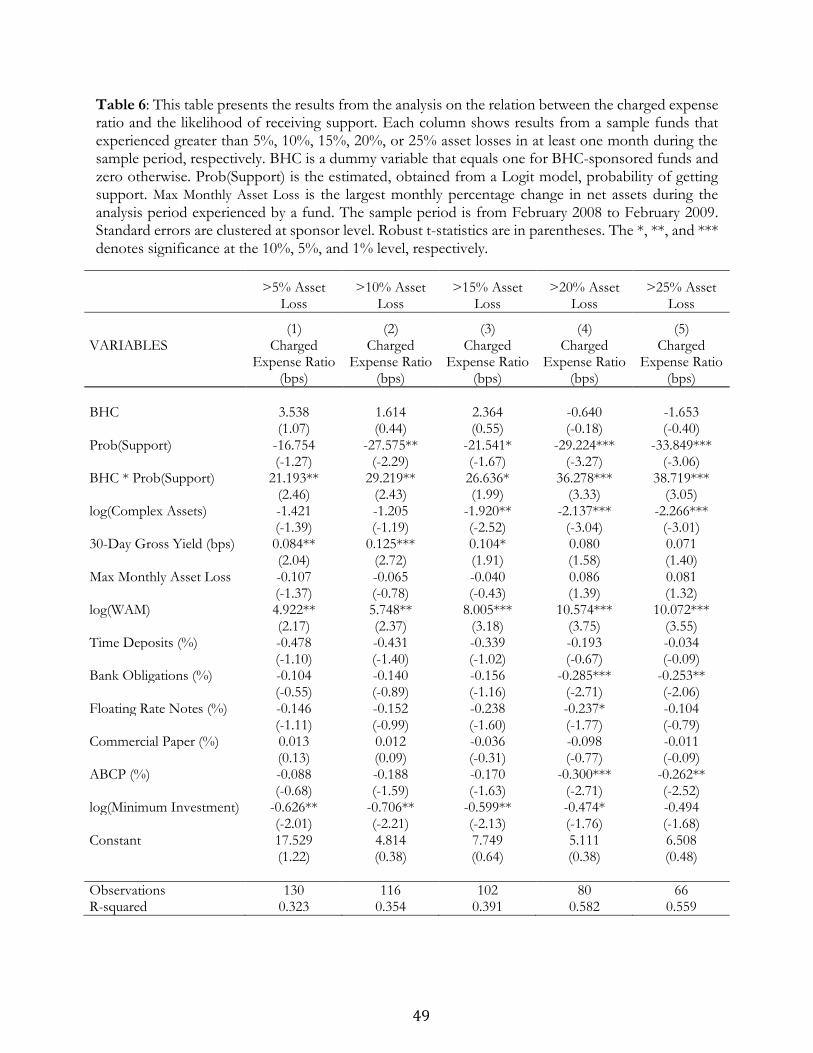
49
Table 6: This table presents the results from the analysis on the relation between the charged expense ratio and the likelihood of receiving support. Each column shows results from a sample funds that experienced greater than 5%, 10%, 15%, 20%, or 25% asset losses in at least one month during the sample period, respectively. BHC is a dummy variable that equals one for BHC-sponsored funds and zero otherwise. Prob(Support) is the estimated, obtained from a Logit model, probability of getting support. Max Monthly Asset Loss is the largest monthly percentage change in net assets during the analysis period experienced by a fund. The sample period is from February 2008 to February 2009. Standard errors are clustered at sponsor level. Robust t-statistics are in parentheses. The *, **, and *** denotes significance at the 10%, 5%, and 1% level, respectively.
>5% Asset
Loss >10% Asset
Loss >15% Asset
Loss >20% Asset
Loss >25% Asset
Loss
(1) (2) (3) (4) (5)
VARIABLES Charged Expense Ratio
(bps)
Charged Expense Ratio
(bps)
Charged Expense Ratio
(bps)
Charged Expense Ratio
(bps)
Charged Expense Ratio
(bps)
BHC 3.538 1.614 2.364 -0.640 -1.653 (1.07) (0.44) (0.55) (-0.18) (-0.40) Prob(Support) -16.754 -27.575** -21.541* -29.224*** -33.849*** (-1.27) (-2.29) (-1.67) (-3.27) (-3.06) BHC * Prob(Support) 21.193** 29.219** 26.636* 36.278*** 38.719*** (2.46) (2.43) (1.99) (3.33) (3.05) log(Complex Assets) -1.421 -1.205 -1.920** -2.137*** -2.266*** (-1.39) (-1.19) (-2.52) (-3.04) (-3.01) 30-Day Gross Yield (bps) 0.084** 0.125*** 0.104* 0.080 0.071 (2.04) (2.72) (1.91) (1.58) (1.40) Max Monthly Asset Loss -0.107 -0.065 -0.040 0.086 0.081 (-1.37) (-0.78) (-0.43) (1.39) (1.32) log(WAM) 4.922** 5.748** 8.005*** 10.574*** 10.072*** (2.17) (2.37) (3.18) (3.75) (3.55) Time Deposits (%) -0.478 -0.431 -0.339 -0.193 -0.034 (-1.10) (-1.40) (-1.02) (-0.67) (-0.09) Bank Obligations (%) -0.104 -0.140 -0.156 -0.285*** -0.253** (-0.55) (-0.89) (-1.16) (-2.71) (-2.06) Floating Rate Notes (%) -0.146 -0.152 -0.238 -0.237* -0.104 (-1.11) (-0.99) (-1.60) (-1.77) (-0.79) Commercial Paper (%) 0.013 0.012 -0.036 -0.098 -0.011 (0.13) (0.09) (-0.31) (-0.77) (-0.09) ABCP (%) -0.088 -0.188 -0.170 -0.300*** -0.262** (-0.68) (-1.59) (-1.63) (-2.71) (-2.52) log(Minimum Investment) -0.626** -0.706** -0.599** -0.474* -0.494 (-2.01) (-2.21) (-2.13) (-1.76) (-1.68) Constant 17.529 4.814 7.749 5.111 6.508 (1.22) (0.38) (0.64) (0.38) (0.48)
Observations 130 116 102 80 66 R-squared 0.323 0.354 0.391 0.582 0.559
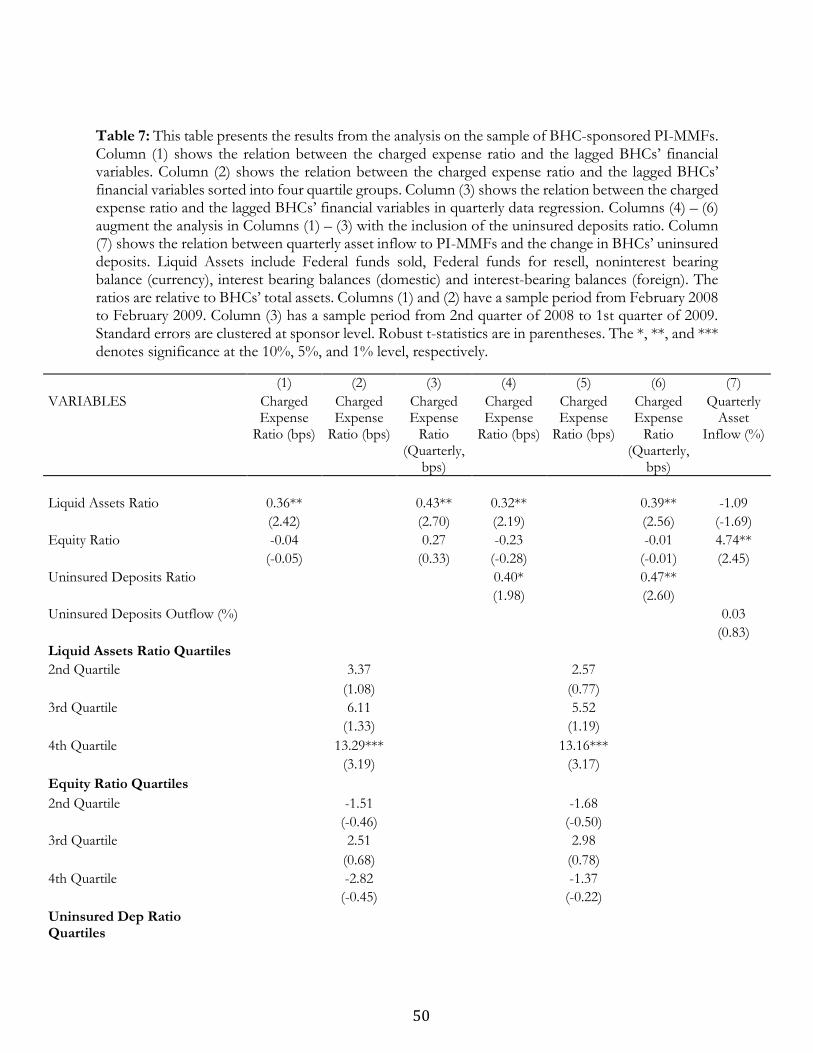
50
Table 7: This table presents the results from the analysis on the sample of BHC-sponsored PI-MMFs. Column (1) shows the relation between the charged expense ratio and the lagged BHCs’ financial variables. Column (2) shows the relation between the charged expense ratio and the lagged BHCs’ financial variables sorted into four quartile groups. Column (3) shows the relation between the charged expense ratio and the lagged BHCs’ financial variables in quarterly data regression. Columns (4) – (6) augment the analysis in Columns (1) – (3) with the inclusion of the uninsured deposits ratio. Column (7) shows the relation between quarterly asset inflow to PI-MMFs and the change in BHCs’ uninsured deposits. Liquid Assets include Federal funds sold, Federal funds for resell, noninterest bearing balance (currency), interest bearing balances (domestic) and interest-bearing balances (foreign). The ratios are relative to BHCs’ total assets. Columns (1) and (2) have a sample period from February 2008 to February 2009. Column (3) has a sample period from 2nd quarter of 2008 to 1st quarter of 2009. Standard errors are clustered at sponsor level. Robust t-statistics are in parentheses. The *, **, and *** denotes significance at the 10%, 5%, and 1% level, respectively.
(1) (2) (3) (4) (5) (6) (7)
VARIABLES Charged Expense
Ratio (bps)
Charged Expense
Ratio (bps)
Charged Expense
Ratio (Quarterly,
bps)
Charged Expense
Ratio (bps)
Charged Expense
Ratio (bps)
Charged Expense
Ratio (Quarterly,
bps)
Quarterly Asset
Inflow (%)
Liquid Assets Ratio 0.36** 0.43** 0.32** 0.39** -1.09
(2.42) (2.70) (2.19) (2.56) (-1.69)
Equity Ratio -0.04 0.27 -0.23 -0.01 4.74**
(-0.05) (0.33) (-0.28) (-0.01) (2.45)
Uninsured Deposits Ratio 0.40* 0.47**
(1.98) (2.60)
Uninsured Deposits Outflow (%) 0.03
(0.83)
Liquid Assets Ratio Quartiles
2nd Quartile 3.37 2.57
(1.08) (0.77)
3rd Quartile 6.11 5.52
(1.33) (1.19)
4th Quartile 13.29*** 13.16***
(3.19) (3.17)
Equity Ratio Quartiles
2nd Quartile -1.51 -1.68
(-0.46) (-0.50)
3rd Quartile 2.51 2.98
(0.68) (0.78)
4th Quartile -2.82 -1.37
(-0.45) (-0.22)
Uninsured Dep Ratio Quartiles

51
2nd Quartile -0.37
(-0.17)
3rd Quartile -0.79
(-0.31)
4th Quartile 6.62
(1.40)
After Lehman 2.79 2.79 0.78 3.15 2.78 3.17 205.38
(1.36) (1.30) (0.06) (1.55) (1.34) (0.21) (1.68)
log(Complex Assets) -1.59 -1.00 -2.34 -0.92 -0.44 -1.51 2.50
(-1.22) (-0.67) (-1.71) (-0.72) (-0.29) (-1.08) (0.80)
Treasury Yield (bps) -0.02 -0.02 -0.04 -0.01 -0.02 -0.02 1.42
(-1.20) (-1.29) (-0.42) (-0.87) (-1.19) (-0.20) (1.53)
log(WAM) 16.47*** 16.85*** 17.35*** 16.56*** 17.20*** 17.47*** 20.34
(4.43) (4.61) (4.54) (4.36) (4.87) (4.51) (1.71)
Time Deposits (%) 0.26 0.24 0.52 0.25 0.21 0.46 1.18
(1.25) (1.24) (1.48) (1.21) (0.99) (1.32) (1.43)
Bank Obligations (%) 0.04 -0.01 0.07 -0.02 -0.02 -0.01 0.18
(0.31) (-0.04) (0.50) (-0.17) (-0.15) (-0.06) (0.67)
Floating Rate Notes (%) -0.05 -0.09 -0.01 -0.07 -0.09 -0.04 -0.51
(-0.40) (-0.86) (-0.08) (-0.60) (-0.85) (-0.32) (-1.20)
Commercial Paper (%) -0.09 -0.15 -0.02 -0.10 -0.15 -0.05 -0.26
(-0.78) (-1.40) (-0.18) (-0.91) (-1.36) (-0.39) (-0.75)
ABCP (%) -0.06 -0.15 0.17 -0.10 -0.18 0.12 -0.52
(-0.43) (-1.17) (0.96) (-0.75) (-1.40) (0.67) (-1.20)
log(Minimum Investment) -2.13*** -2.14*** -1.86*** -2.08*** -2.10*** -1.81*** 0.69
(-2.91) (-2.89) (-3.27) (-2.82) (-2.84) (-3.17) (0.97)
Constant 21.28 18.92 15.86 13.77 11.97 5.32 -338.12*
(0.95) (0.84) (0.72) (0.60) (0.53) (0.25) (-1.99)
Observations 1,072 1,072 421 1,072 1,072 421 421
R-squared 0.234 0.241 0.195 0.240 0.246 0.203 0.031

52
Table 8: This table presents the results from a robust difference-in-differences method as proposed by Bertrand, Duflo and Mullainathan (2004) for the yields and expense ratios of PI-MMFs before and after the Money Market Fund Reform in 2016. The analysis uses the same sample of fund complexes as the analysis in Table 2. BHC is a dummy variable that equals one for BHC-sponsored funds and zero otherwise. After Reform equals one for observations in November 2016 – July 2018 and zero for observations in July 2014 – October 2016. The sample period is from July 2014 to July 2018. Standard errors are clustered at sponsor level. Robust t-statistics are in parentheses. The *, **, and *** denotes significance at the 10%, 5%, and 1% level, respectively.
(1) (2) (3)
VARIABLES 30-Day Gross Yield (bps)
30-Day Net Yield (bps) Charged Expense Ratio (bps)
BHC -0.89 -7.77*** 6.88***
(-0.67) (-4.93) (3.61)
After Reform 1.69 -10.02 11.71**
(0.38) (-1.38) (2.23)
BHC * After Reform 1.35 8.22** -6.87**
(0.72) (2.51) (-2.29)
log(Complex Assets) 1.60*** -1.48* 3.08***
(3.08) (-1.91) (5.63)
Treasury Yield (bps) 1.08*** 1.08*** -0.00
(28.43) (13.94) (-0.00)
log(WAM) 5.08*** 2.76 2.33
(3.02) (1.43) (1.69)
Time Deposits (%) 0.09 0.04 0.05
(0.82) (0.33) (0.48)
Bank Obligations (%) 0.04 -0.00 0.05
(1.15) (-0.02) (0.91)
Floating Rate Notes (%) 0.03 -0.22** 0.25**
(0.56) (-2.05) (2.73)
Commercial Paper (%) 0.02 -0.13 0.15*
(0.31) (-1.45) (2.00)
ABCP (%) -0.03 -0.05 0.02
(-0.38) (-0.46) (0.22)
log(Minimum Investment) 0.05 1.11*** -1.06***
(0.59) (7.37) (-5.53)
Constant -14.85** 3.28 -18.12**
(-2.08) (0.42) (-2.23)
Observations 338 338 338
R-squared 0.991 0.932 0.307

53
Appendix A: Sample prime institutional funds as of September 2008 and corrections to fund sponsors reported by iMoneyNet.
Complex Number of Funds
Number of Share
Classes
iMoneyNet Sponsor Indicator
Corrected Sponsor
BHC status change within sample period (2 complexes / 8 funds / 32 share classes)
Goldman Sachs 5 21 BHC/Non-BHC Non-BHC then -BHC
Morgan Stanley 3 11 BHC Non-BHC then BHC
No domestically domiciled regulatory high-holder (7 complexes / 10 funds / 20 share classes)
Barclays 2 8 BHC/Non-BHC Non-BHC
BMO (BHC of Montreal) 1 1 BHC Non-BHC
Credit Suisse 1 3 BHC Non-BHC
HSBC 1 2 BHC Non-BHC
ING 3 3 BHC Non-BHC
RBC 1 1 Non-BHC BHC
UBS 1 2 BHC Non-BHC
Data error (9 complexes / 21 funds / 41 share classes)
American Century 2 2 Non-BHC BHC
BlackRock 8 16 BHC/Non-BHC Non-BHC
CitizensSelect 1 4 BHC Non-BHC
Legg Mason 4 9 BHC/Non-BHC Non-BHC
Monarch 1 4 Non-BHC BHC
Munder 2 3 BHC/Non-BHC Non-BHC
RidgeWorth 1 1 BHC Non-BHC
Virtus 1 1 BHC Non-BHC
BBH (Brown Brothers Harriman)
1 1 BHC Non-BHC
No change from iMoneyNet data (55 complexes / 97 funds / 236 share classes)
Advisors Inner Circle 1 1 Non-BHC Non-BHC
Allegiant 2 3 BHC BHC
Ambassador 1 1 Non-BHC Non-BHC
American Beacon 1 4 Non-BHC Non-BHC
AMF 1 1 Non-BHC Non-BHC
Bishop St 1 1 BHC BHC
BNY Mellon 1 1 BHC BHC
BofA Global Capital 2 10 BHC BHC
Cadre 1 2 Non-BHC Non-BHC
Calvert 1 1 Non-BHC Non-BHC
Cavanal Hill 1 2 BHC BHC
Deutsche 3 7 BHC BHC
Dreyfus 7 24 BHC BHC
Evergreen 2 9 BHC BHC

54
Federated 6 15 Non-BHC Non-BHC
Fidelity 5 18 Non-BHC Non-BHC
Fifth Third 1 4 BHC BHC
First American 1 4 BHC BHC
Fortis 2 3 Non-BHC Non-BHC
Franklin 1 2 Non-BHC Non-BHC
GE 2 2 Non-BHC Non-BHC
Hancock Horizon 1 1 BHC BHC
Invesco 3 16 Non-BHC Non-BHC
Janus 2 3 Non-BHC Non-BHC
JPMorgan 2 11 BHC BHC
Lehman Brothers 4 11 Non-BHC Non-BHC
Meeder 1 1 Non-BHC Non-BHC
Nationwide 1 1 Non-BHC Non-BHC
North Track 1 1 Non-BHC Non-BHC
Northern 2 6 BHC BHC
OppenheimerFunds 1 3 Non-BHC Non-BHC
Pax World 1 1 Non-BHC Non-BHC
Performance 1 1 BHC BHC
PFM 1 1 Non-BHC Non-BHC
Pioneer 2 4 Non-BHC Non-BHC
PNC 1 1 BHC BHC
Principal 1 1 Non-BHC Non-BHC
Prudential 2 3 Non-BHC Non-BHC
Reich & Tang 1 2 Non-BHC Non-BHC
Reserve 2 10 Non-BHC Non-BHC
RMK 1 1 BHC BHC
Schwab 2 4 Non-BHC Non-BHC
SEI 2 9 Non-BHC Non-BHC
SSgA (State Street) 2 3 BHC BHC
Sterling Capital 1 1 BHC BHC
TD Asset Mgmt USA 1 2 BHC BHC
Thrivent 1 1 Non-BHC Non-BHC
TIAA-CREF 2 3 Non-BHC Non-BHC
Touchstone 2 3 Non-BHC Non-BHC
Utendahl 1 1 Non-BHC Non-BHC
Vanguard 1 1 Non-BHC Non-BHC
Victory 1 2 BHC BHC
Wells Fargo 4 7 BHC BHC
Wilmington 2 4 BHC BHC
Wilmington Trust 1 1 BHC BHC
Total 136 329