Embed Size (px)
Citation preview

ShadyStats
Project UpdateMike Cora
November 16, 2005
533C: Information Visualization

Background and Motivation
Spent the last year developing the high-level AI for Super Mario Strikers (decisions and positioning)
Coding, tuning and testing a video game’s AI involved gathering a lot of multidimensional statistics
An interactive visualization can: Show trends, and correlations, compare teams and difficulty levels Help with finding bugs during development Help with tuning a well balanced game Aid communication with the publisher (across potential language
barriers for example)
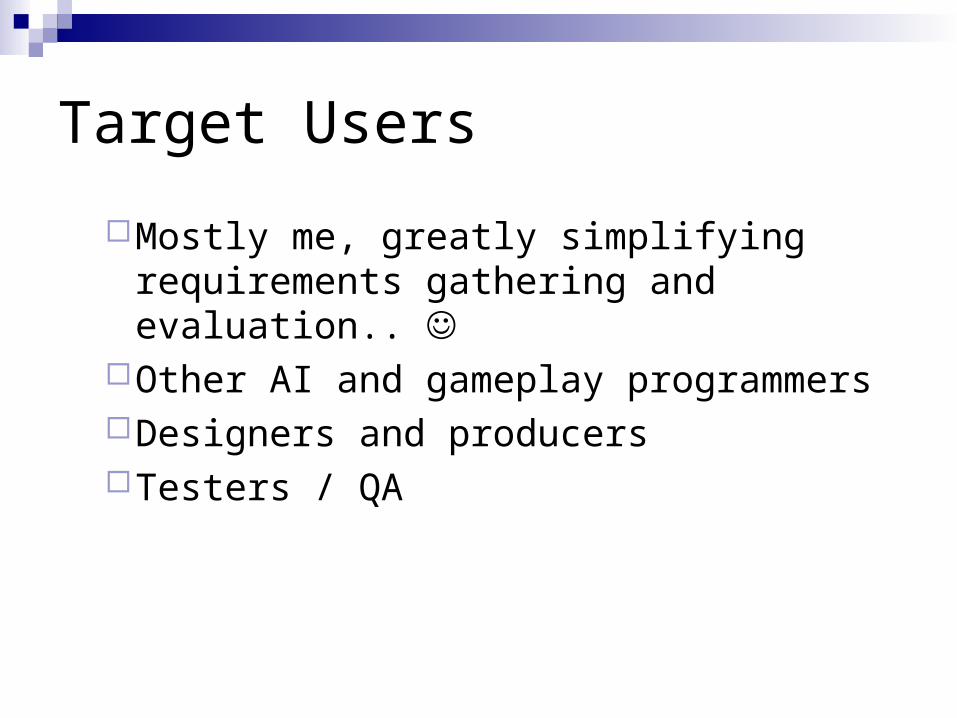
Target Users
Mostly me, greatly simplifying requirements gathering and evaluation..
Other AI and gameplay programmersDesigners and producersTesters / QA
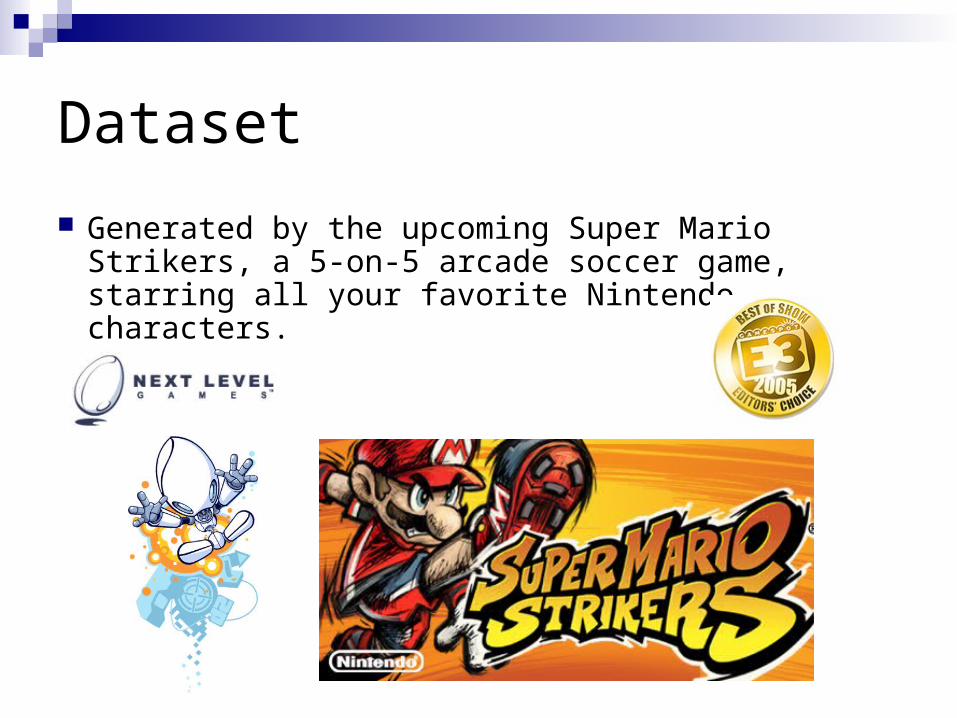
Dataset
Generated by the upcoming Super Mario Strikers, a 5-on-5 arcade soccer game, starring all your favorite Nintendo characters.

Dataset Details 2400 games played by the AI, at 4 difficulty levels per
side (home / away) Recorded at 6 different dates over the last 2 months
of development 14 dimensions (ie. passes, shots, hits, steals) ~ 2400 games * 14 dim * 2 sides = 67,200 numbers

Proposal: ShadyStats
4 – Dynamic filtering 3 – Zoomable, detailed graphs
1) Dataset history
2) Hierarchical parallel coordinates

Feature Goals
1) Maintain history of datasets for easy comparison during development lifecycle
2) Use XmdvTool1 for parallel coordinates: Hierarchical aggregation, with fancy shading Extend with interactive drag reordering of
dimensions
3) Generate detailed graphs on demand, using Zedgraph2, by interacting with the parallel coordinates component
Feature Goals 2
4) In depth, dynamic filtering and highlighting options
5) Various statistical measures (mean, variance)
6) Highly interactive, tooltip information everywhere (data values, dimension names, etc).
7) Contextual zooming of individual graphs
Enviornment
Platform is Windows Language changed from Java to C# & C++. Why?
XmdvTool1 is written in C++ Zedgraph2 is a C# control with full source, excellent
customization, tutorials and documentation C# and C++ are buddies, and play nice C# is very UI friendly, fast develpment time I have less (and outdated) experience with Java

Progress Compiled and poked through XmdvTool1:
Minor compilation issues with non-standard iostream.h Uses OpenGL for rendering Uses Tcl/Tk6 for its UI, meaning the code is nicely setup for
external interface, so isolating the parallel coordinate canvas and creating a C# interface around it should be doable
Very little implementation documentation
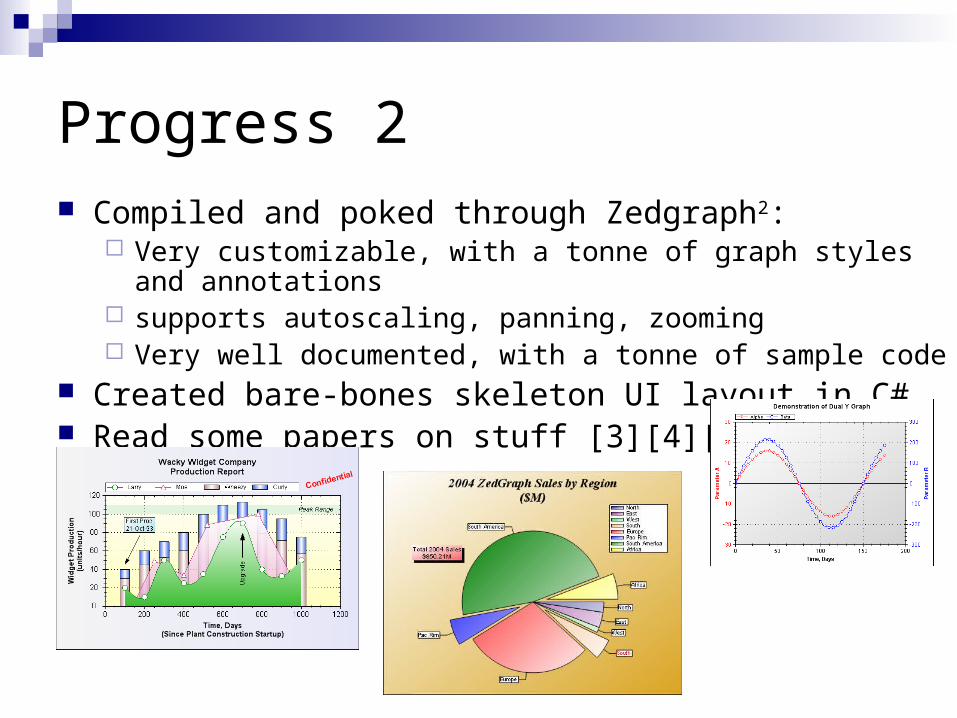
Progress 2 Compiled and poked through Zedgraph2:
Very customizable, with a tonne of graph styles and annotations supports autoscaling, panning, zooming Very well documented, with a tonne of sample code
Created bare-bones skeleton UI layout in C# Read some papers on stuff [3][4][5]
Challenges
Have never actually created a C# friendly control from C++ before, nor played with Managed C++.
Isolating the parallel coordinate canvas from XmdvTool1 may pose some challenges.
Several areas will be ongoing challenges, and will be heavily iterated on, to maximize usage of the tool: Good set of dynamic and interactive filters High interactivity and linking between all components Variety of visualizations and graphs for different dimensions

Bibliography
1) XmdvTool: http://davis.wpi.edu/~xmdv/
2) Zedgraph: http://zedgraph.sourceforge.net/
3) Edward J. Wegman. Hyperdimensional Data Analysis Using Parallel Coordinates, Journal of the American Statistical Association, Vol. 85, No. 411. (Sep., 1990), pp. 664-675.
4) Ying-Huey Fua, Matthew O. Ward, and Elke A. Rundensteiner, Hierarchical Parallel Coordinates for Visualizing Large Multivariate Data Sets, IEEE Visualization '99.
5) Jing Yang, Wei Peng, Matthew O. Ward and Elke A. Rundensteiner, Interactive Hierarchical Dimension Ordering, Spacing and Exploration of High Dimensional Datasets, Proc. InfoVis 2003.
6) John K. Ousterhout, Tcl and the Tk Toolkit, Addison Wesley,1994.