Embed Size (px)
Citation preview
Copyright 2012 MuleShoe Engineering 1
Shale GasBy David Simpson, PE
www muleshoe eng com
1
www.muleshoe-eng.com
Copyright 2012 MuleShoe Engineering 2
What is Unconventional Gas?
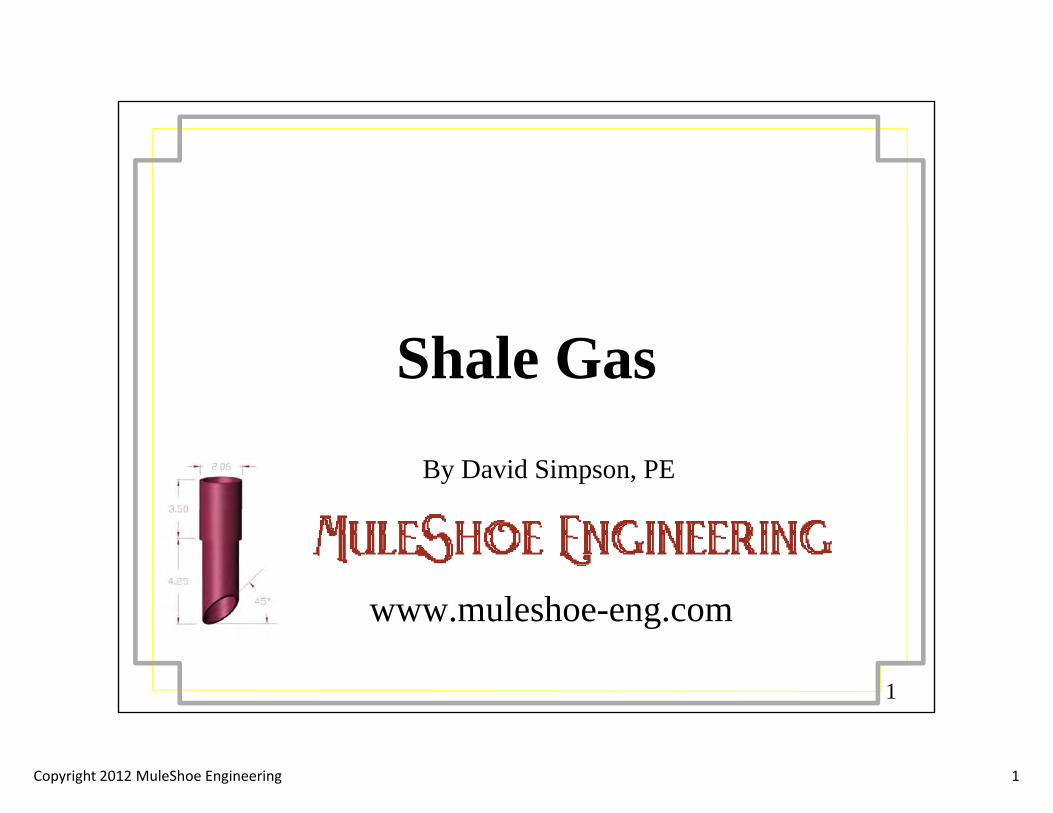
• Unconventional gas is the stuff that the industry tended to skip over when there was anything else to recoverover when there was anything else to recover
• It requires non-oilfield techniques to exploit• It is often very expensive to develop and produce
S f i i i il• So far it is primarily:– Tight gas– CBM
Sh l G– Shale Gas
• But hydrate mining, and land fill gas
ill t ll fitCourtesy of CSM: Ocean hydrates at the Barkley Canyon off the coast
2
will eventually fit into this category
at the Barkley Canyon off the coast from Vancouver, CANADA.
Copyright 2012 MuleShoe Engineering 3
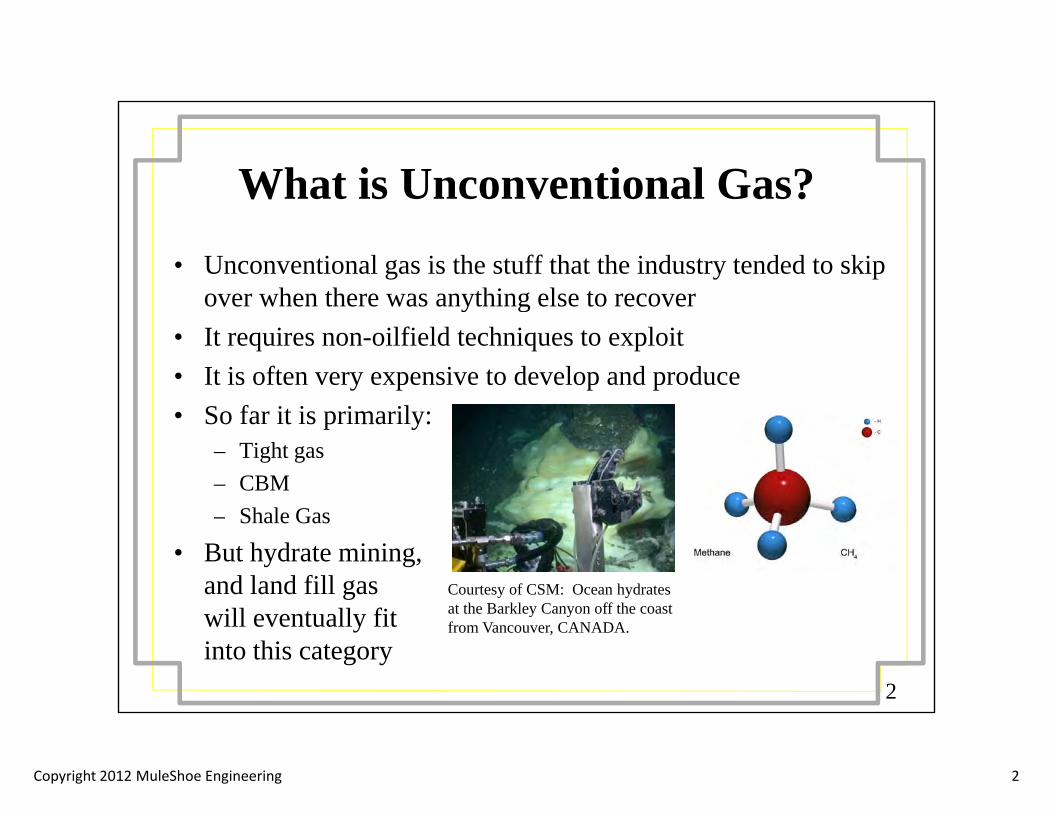
Gas Reservoir ContinuumGas Reservoir Continuum• The lines are not very clear between the
various kinds of gas production• Halliburton breaks the continuum down
into five types of gas by adding a “Complex Gas” between “Conventional Gas” and “Tight Gas”g
• This extra category helps to differentiate where Conventional Gas ends and Unconventional Begins
• Complex gas is reasonably rare and• Complex gas is reasonably rare and quite difficult to produce
• Complex gas performance is predictable with the application of extraordinary techniques
3Courtesy of Halliburton Inc.
techniques
Copyright 2012 MuleShoe Engineering 4
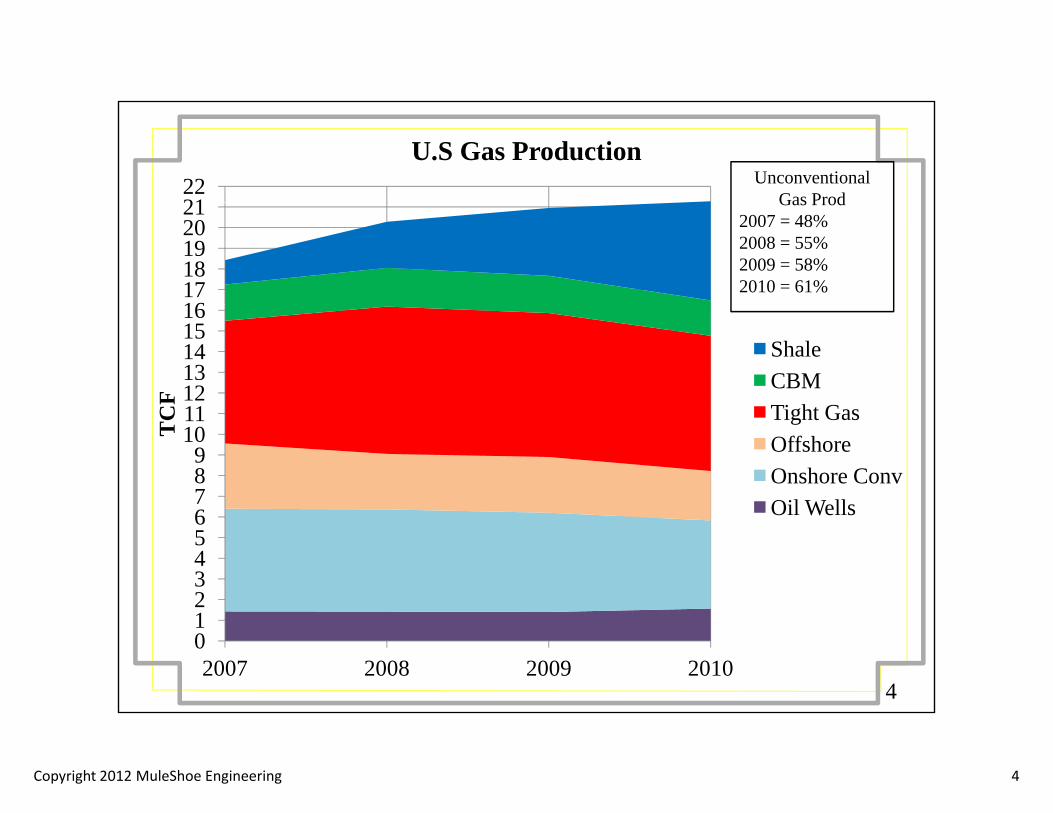
2122
U.S Gas ProductionUnconventional
Gas Prod
161718192021 Gas Prod
2007 = 48%2008 = 55%2009 = 58%2010 = 61%
111213141516
CF
ShaleCBMTi ht G
789
1011
TC Tight Gas
OffshoreOnshore ConvOil Wells
23456 Oil Wells
4
01
2007 2008 2009 2010
Copyright 2012 MuleShoe Engineering 5
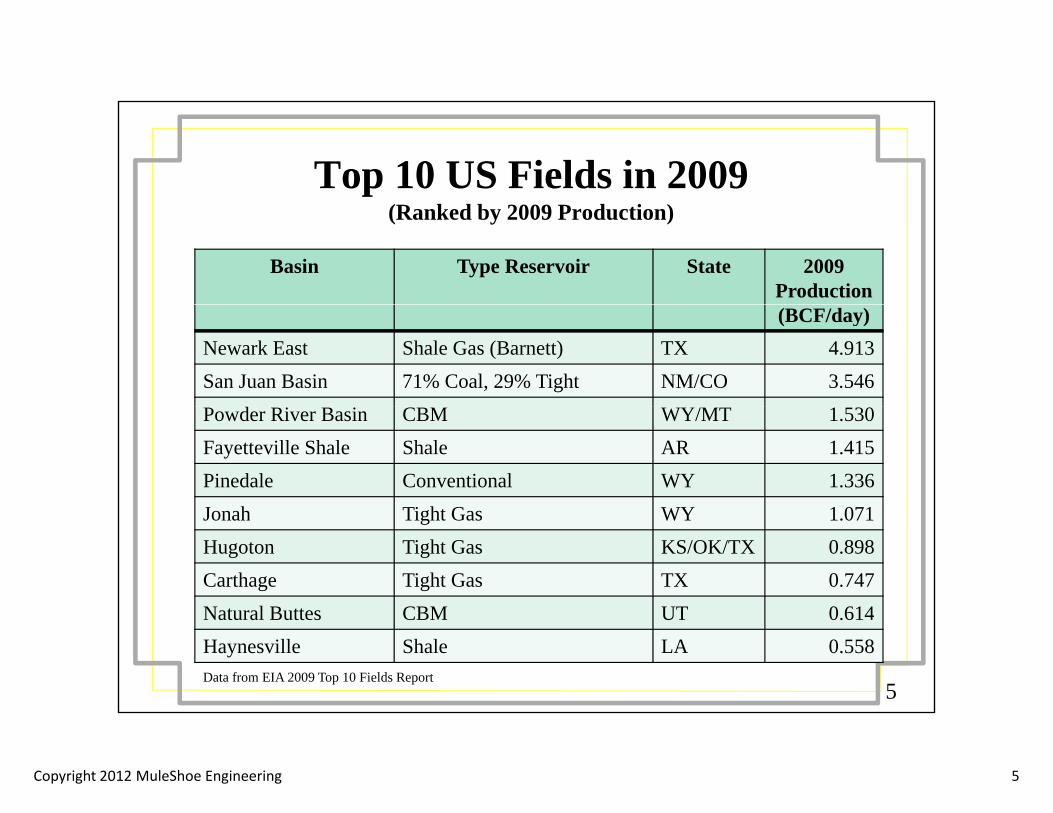
Top 10 US Fields in 2009(Ranked by 2009 Production)
Basin Type Reservoir State 2009 Production (BCF/day)
Newark East Shale Gas (Barnett) TX 4.913San Juan Basin 71% Coal, 29% Tight NM/CO 3.546
d i i /Powder River Basin CBM WY/MT 1.530Fayetteville Shale Shale AR 1.415Pinedale Conventional WY 1.336J h Ti ht G WY 1 071Jonah Tight Gas WY 1.071Hugoton Tight Gas KS/OK/TX 0.898Carthage Tight Gas TX 0.747Natural Buttes CBM UT 0 614
5
Natural Buttes CBM UT 0.614Haynesville Shale LA 0.558Data from EIA 2009 Top 10 Fields Report
Copyright 2012 MuleShoe Engineering 6
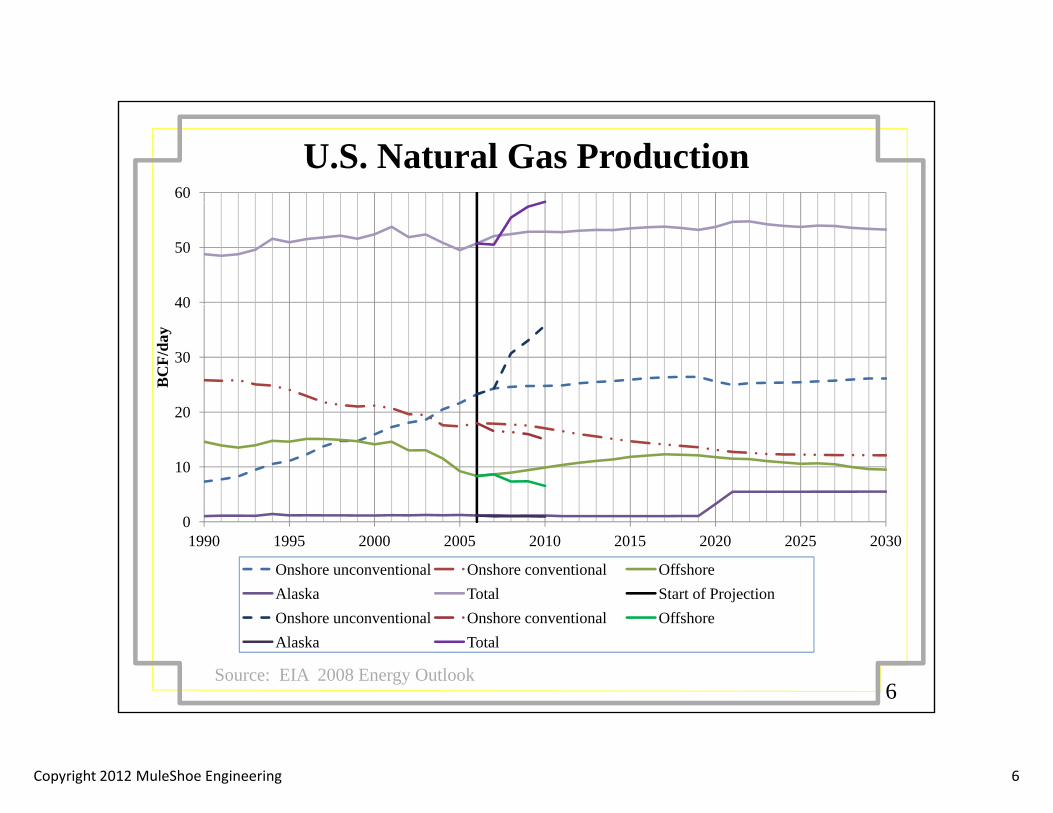
60
U.S. Natural Gas Production
40
50
20
30
40
BC
F/da
y
10
20
01990 1995 2000 2005 2010 2015 2020 2025 2030
Onshore unconventional Onshore conventional OffshoreAlaska Total Start of Projection
6Source: EIA 2008 Energy Outlook
Onshore unconventional Onshore conventional OffshoreAlaska Total
Copyright 2012 MuleShoe Engineering 7
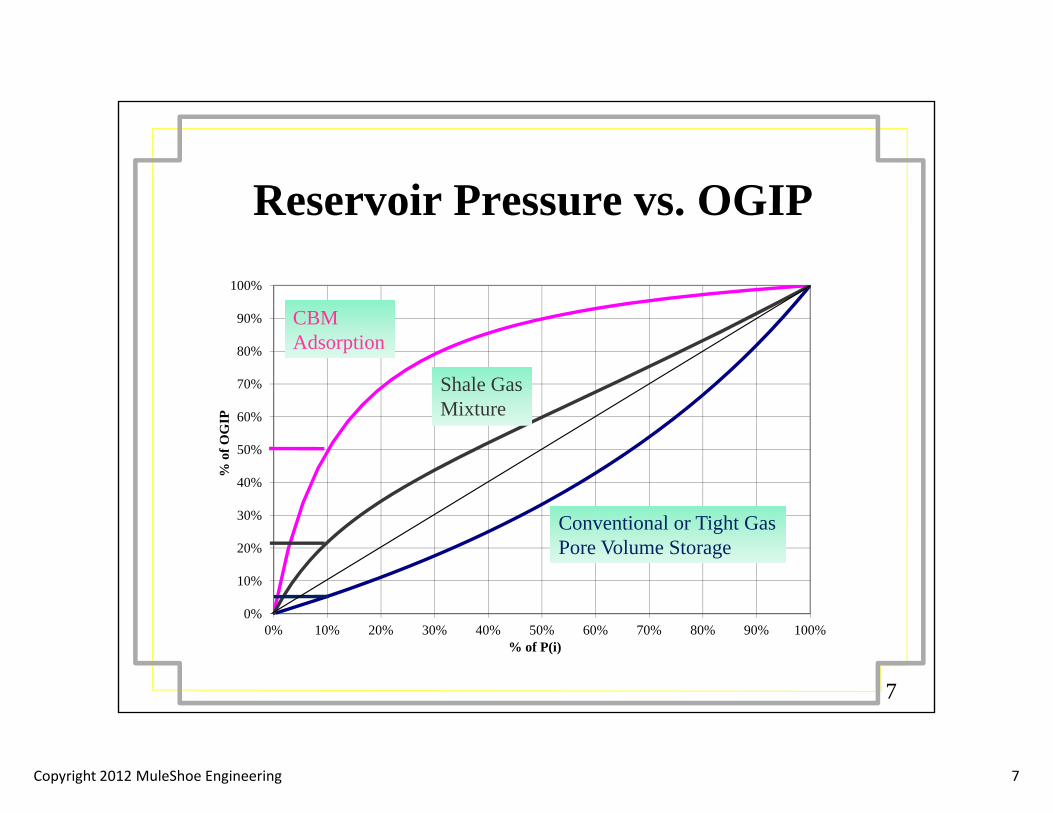
Reservoir Pressure vs OGIPReservoir Pressure vs. OGIP
100%
70%
80%
90%
Shale GasMixture
CBMAdsorption
40%
50%
60%
% o
f OG
IP Mixture
0%
10%
20%
30% Conventional or Tight GasPore Volume Storage
7
0%0% 10% 20% 30% 40% 50% 60% 70% 80% 90% 100%
% of P(i)
Copyright 2012 MuleShoe Engineering 8
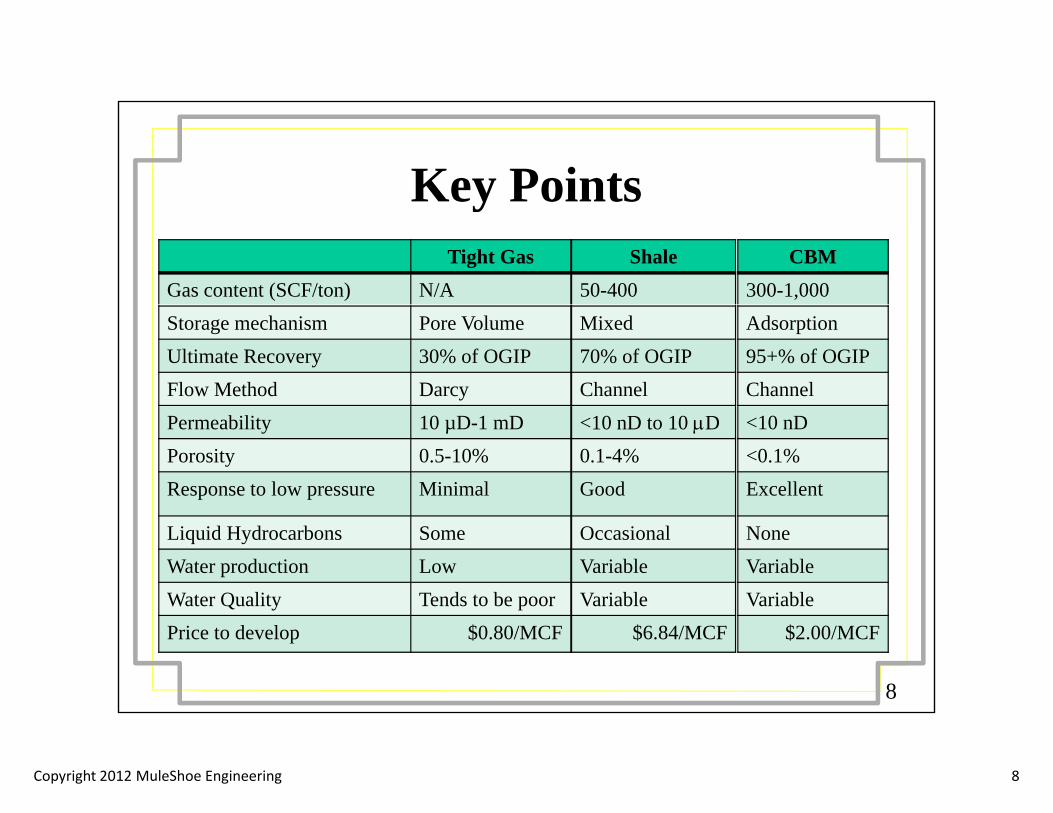
Key PointsyTight Gas
Gas content (SCF/ton) N/AShale
50-400CBM
300-1,000Storage mechanism Pore VolumeUltimate Recovery 30% of OGIPFlow Method Darcy
Mixed70% of OGIPChannel
Adsorption95+% of OGIPChannel
Permeability 10 µD-1 mDPorosity 0.5-10%Response to low pressure Minimal
<10 nD to 10 D0.1-4%Good
<10 nD<0.1%Excellent
Liquid Hydrocarbons SomeWater production LowWater Quality Tends to be poor
OccasionalVariableVariable
NoneVariableVariable
8
Price to develop $0.80/MCF $6.84/MCF $2.00/MCF
Copyright 2012 MuleShoe Engineering 9
9
Copyright 2012 MuleShoe Engineering 10
Shale Gas Introduction
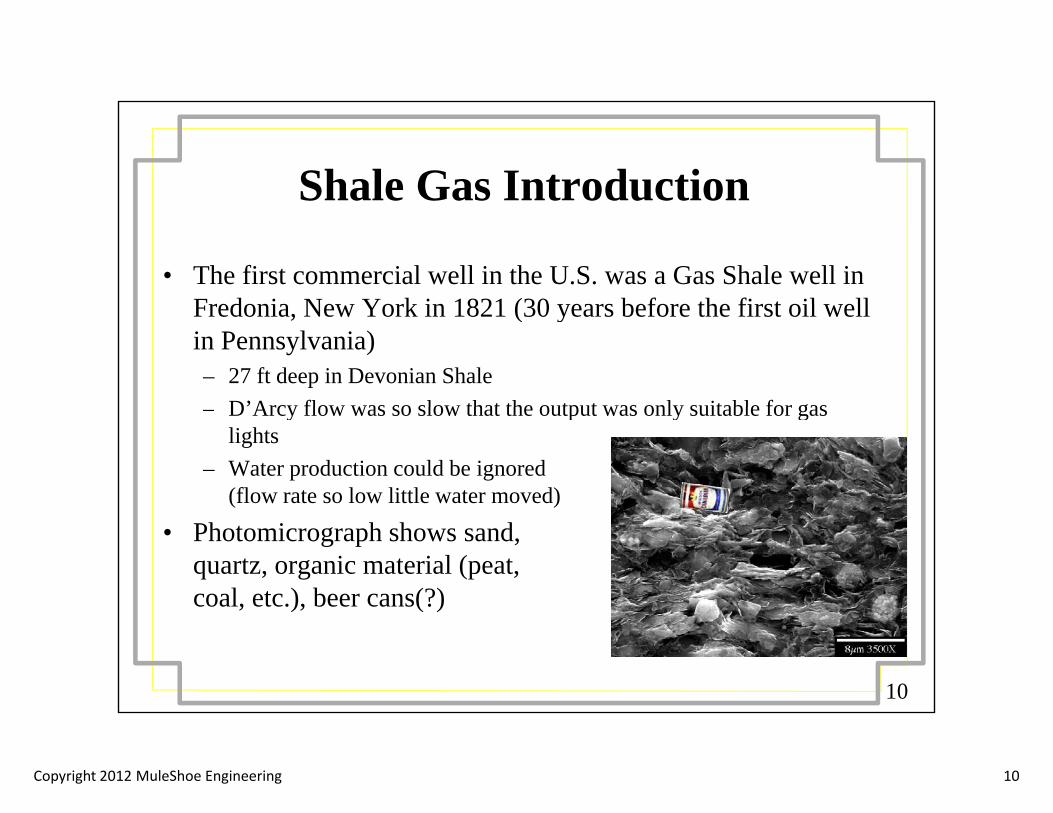
• The first commercial well in the U.S. was a Gas Shale well in Fredonia New York in 1821 (30 years before the first oil wellFredonia, New York in 1821 (30 years before the first oil well in Pennsylvania)– 27 ft deep in Devonian Shale
D’Arcy flow was so slow that the output was only suitable for gas– D Arcy flow was so slow that the output was only suitable for gas lights
– Water production could be ignored (flow rate so low little water moved)
• Photomicrograph shows sand, quartz, organic material (peat, coal, etc.), beer cans(?)
10
) ( )
Copyright 2012 MuleShoe Engineering 11
Shale Gas Introduction• Gas from Shale is a mixture
– Thermogenic gas (gas from breaking down organic material under high temperature and high pressure) which can start as oil and heavy gases and ends up as methaneas methane
– Biogenic gas (gas from biological processes that has not been modified by heat and pressure) tends to be primarily methane
• The more mature the reservoir, the larger percentage of methane• Important Producing Areas
− Antrim Shale in Michigan (first prod 1965) produces nearly 400 MMCF/d− Barnett Shale in Texas (1981) produces 3 BCF/d − Fayetteville Shale in Arkansas (2004) produces 250 MMCF/d− Marcellus Shale covers 95,000 square miles and has an OGIP around 550 TCF.
No significant production as of 2008
11
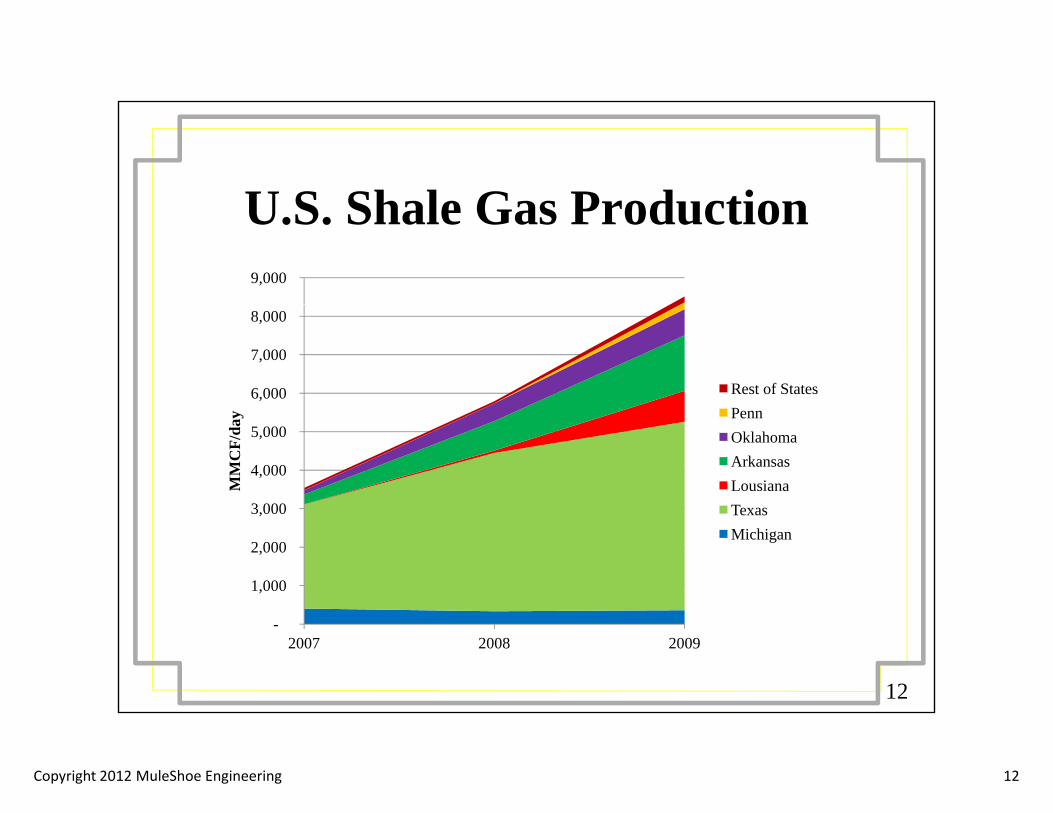
Copyright 2012 MuleShoe Engineering 12
U S Shale Gas ProductionU.S. Shale Gas Production9,000
6,000
7,000
8,000
Rest of States
3 000
4,000
5,000
MM
CF/
day Penn
OklahomaArkansasLousianaTexas
1,000
2,000
3,000 TexasMichigan
12
-2007 2008 2009
Copyright 2012 MuleShoe Engineering 13
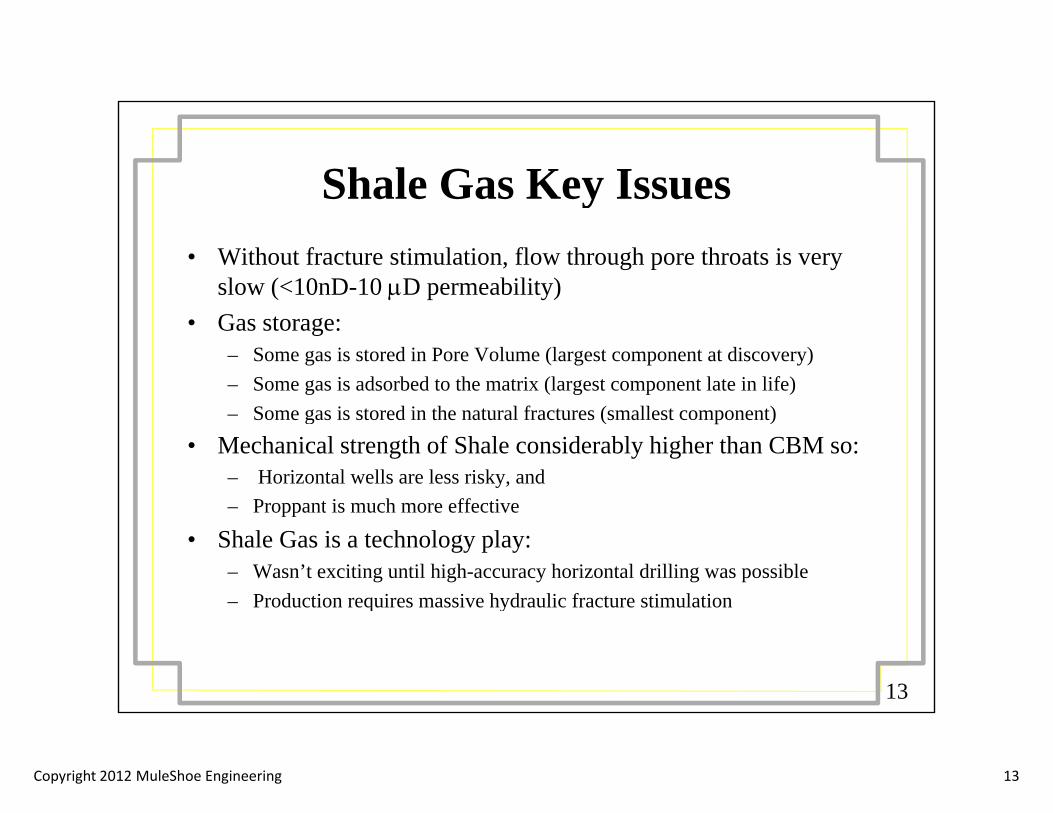
Shale Gas Key Issuesy• Without fracture stimulation, flow through pore throats is very
slow (<10nD-10 D permeability)• Gas storage:
– Some gas is stored in Pore Volume (largest component at discovery)– Some gas is adsorbed to the matrix (largest component late in life)
S i d i h l f ( ll )– Some gas is stored in the natural fractures (smallest component)• Mechanical strength of Shale considerably higher than CBM so:
– Horizontal wells are less risky, and – Proppant is much more effectiveProppant is much more effective
• Shale Gas is a technology play:– Wasn’t exciting until high-accuracy horizontal drilling was possible– Production requires massive hydraulic fracture stimulation
13
q y
Copyright 2012 MuleShoe Engineering 14
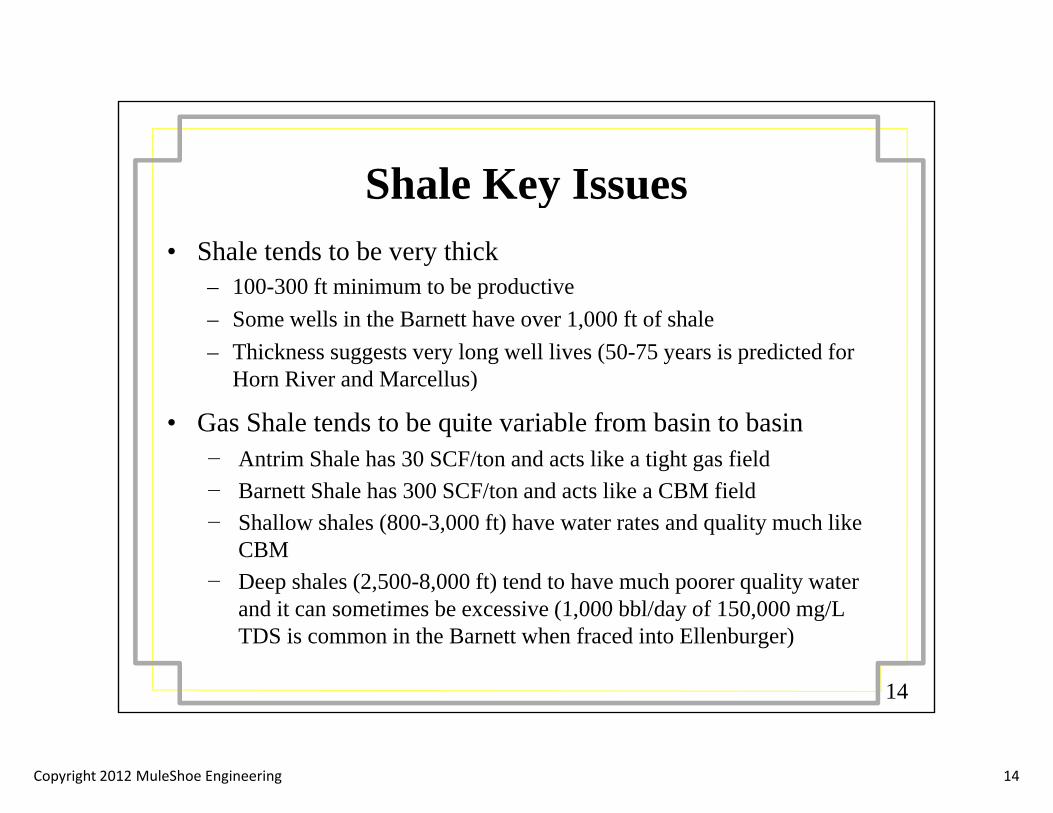
Shale Key Issuesy• Shale tends to be very thick
– 100-300 ft minimum to be productive– Some wells in the Barnett have over 1,000 ft of shale– Thickness suggests very long well lives (50-75 years is predicted for
Horn River and Marcellus)
• Gas Shale tends to be quite variable from basin to basin− Antrim Shale has 30 SCF/ton and acts like a tight gas field− Barnett Shale has 300 SCF/ton and acts like a CBM field− Shallow shales (800-3,000 ft) have water rates and quality much like
CBM− Deep shales (2,500-8,000 ft) tend to have much poorer quality water
and it can sometimes be excessive (1 000 bbl/day of 150 000 mg/L
14
and it can sometimes be excessive (1,000 bbl/day of 150,000 mg/L TDS is common in the Barnett when fraced into Ellenburger)
Copyright 2012 MuleShoe Engineering 15
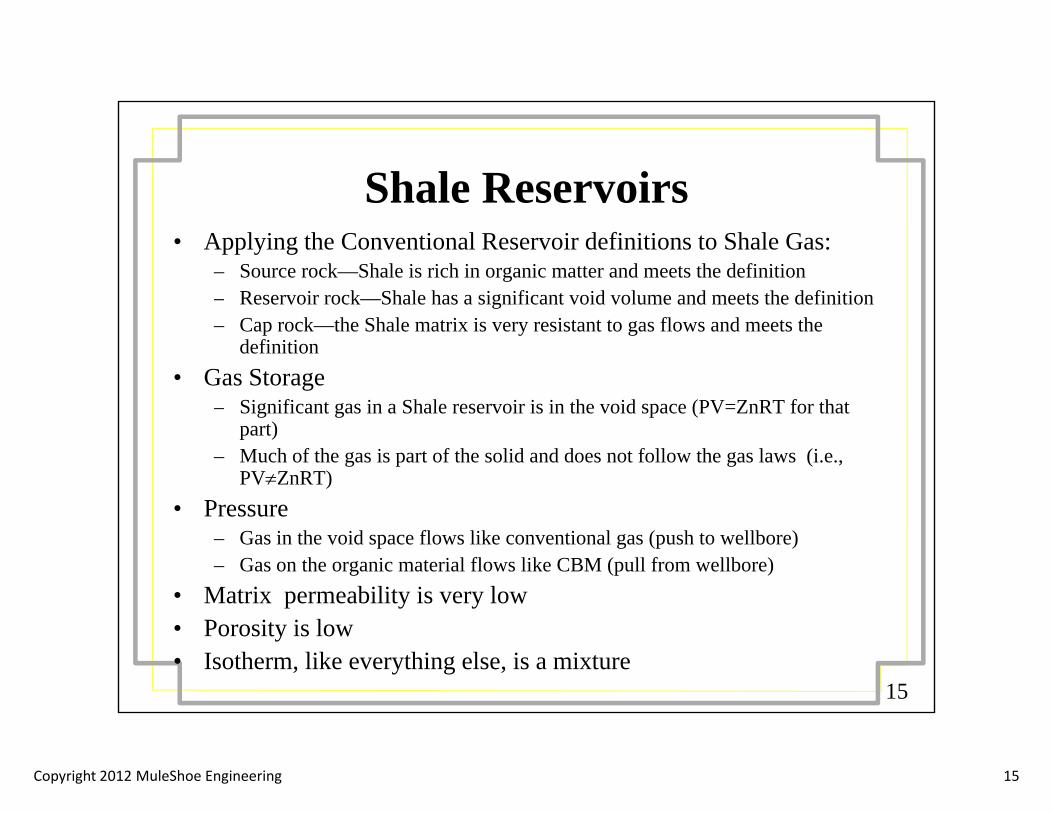
Shale ReservoirsShale Reservoirs• Applying the Conventional Reservoir definitions to Shale Gas:
– Source rock—Shale is rich in organic matter and meets the definition– Reservoir rock—Shale has a significant void volume and meets the definitionese vo oc S e s s g c vo d vo u e d ee s e de o– Cap rock—the Shale matrix is very resistant to gas flows and meets the
definition• Gas Storage
Significant gas in a Shale reservoir is in the void space (PV=ZnRT for that– Significant gas in a Shale reservoir is in the void space (PV=ZnRT for that part)
– Much of the gas is part of the solid and does not follow the gas laws (i.e., PVZnRT)
• Pressure• Pressure– Gas in the void space flows like conventional gas (push to wellbore)– Gas on the organic material flows like CBM (pull from wellbore)
• Matrix permeability is very low
15
• Porosity is low• Isotherm, like everything else, is a mixture
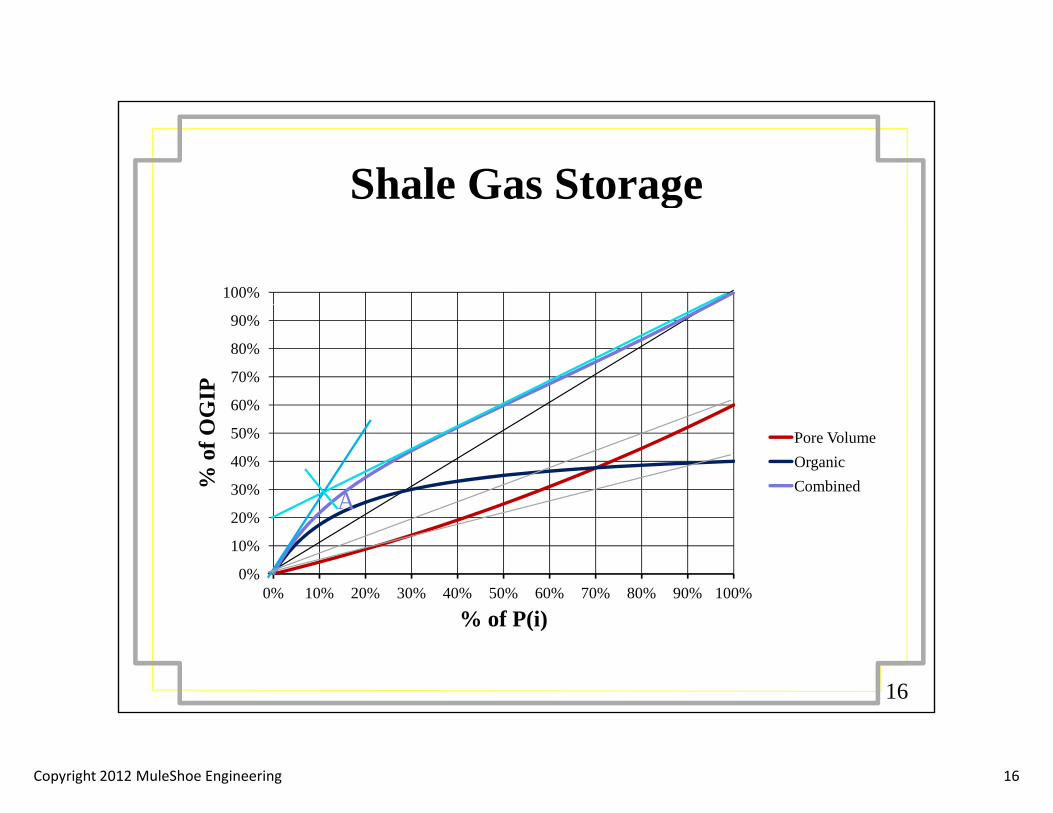
Copyright 2012 MuleShoe Engineering 16
Shale Gas Storageg
100%
60%
70%
80%
90%
GIP
30%
40%
50%
60%
% o
f OG
Pore VolumeOrganicCombined
A
0%
10%
20%
0% 10% 20% 30% 40% 50% 60% 70% 80% 90% 100%
% f (i)
A
16
% of P(i)
Copyright 2012 MuleShoe Engineering 17
Shale Ultimate Recoveryy
• EIA estimates less than 20% of OGIP is recoverableThis is the same value they assigned to CBM in 1991– This is the same value they assigned to CBM in 1991
– It will certainly be revised upwards over time
• It is difficult to predict well-response to deliquification and pressure reduction but:pressure reduction, but:– Wells with high organic content should act like CBM wells earlier in
their life, and low pressures should recover a very large percentage of OGIP
– Wells with lower organic content should act like tight gas wells until much later in their life—they respond to a steady pressure, and if you can minimize variability you should be able to get above 60% of OGIP
17
Copyright 2012 MuleShoe Engineering 18
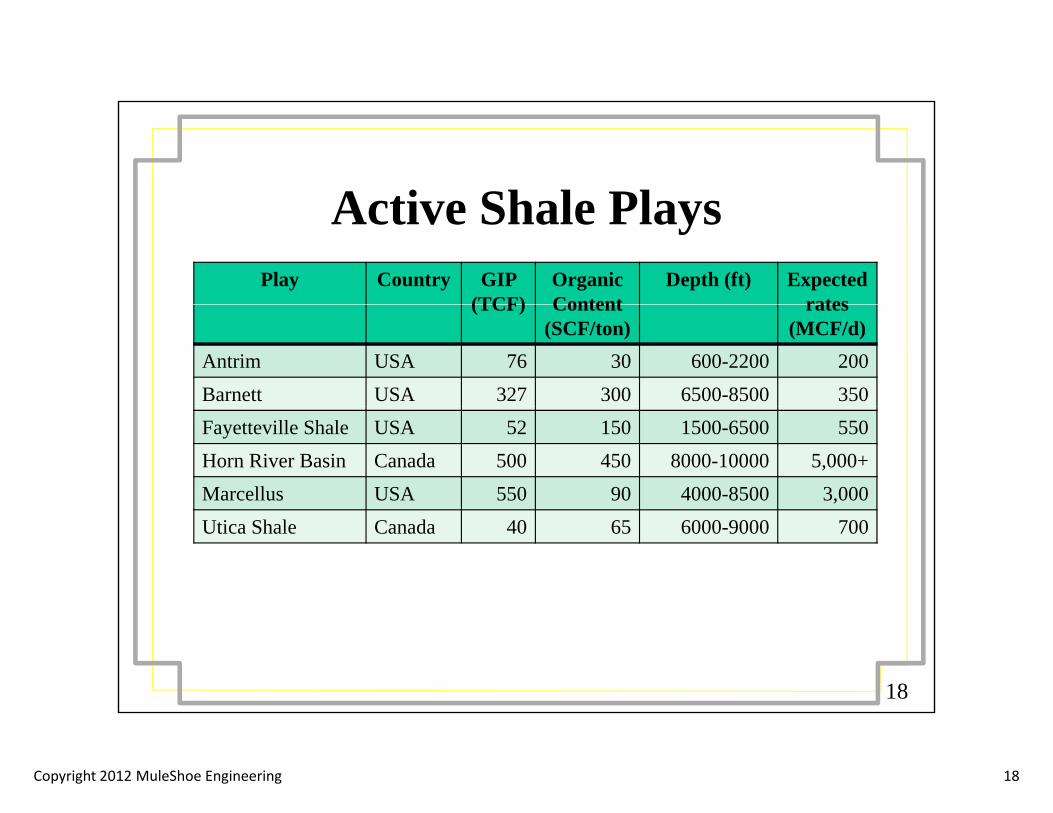
Active Shale PlaysActive Shale PlaysPlay Country GIP
(TCF)Organic Content
Depth (ft) Expected rates(TCF) Content
(SCF/ton)rates
(MCF/d)Antrim USA 76 30 600-2200 200Barnett USA 327 300 6500-8500 350Fayetteville Shale USA 52 150 1500-6500 550Horn River Basin Canada 500 450 8000-10000 5,000+Marcellus USA 550 90 4000-8500 3,000Utica Shale Canada 40 65 6000-9000 700
18
Copyright 2012 MuleShoe Engineering 19
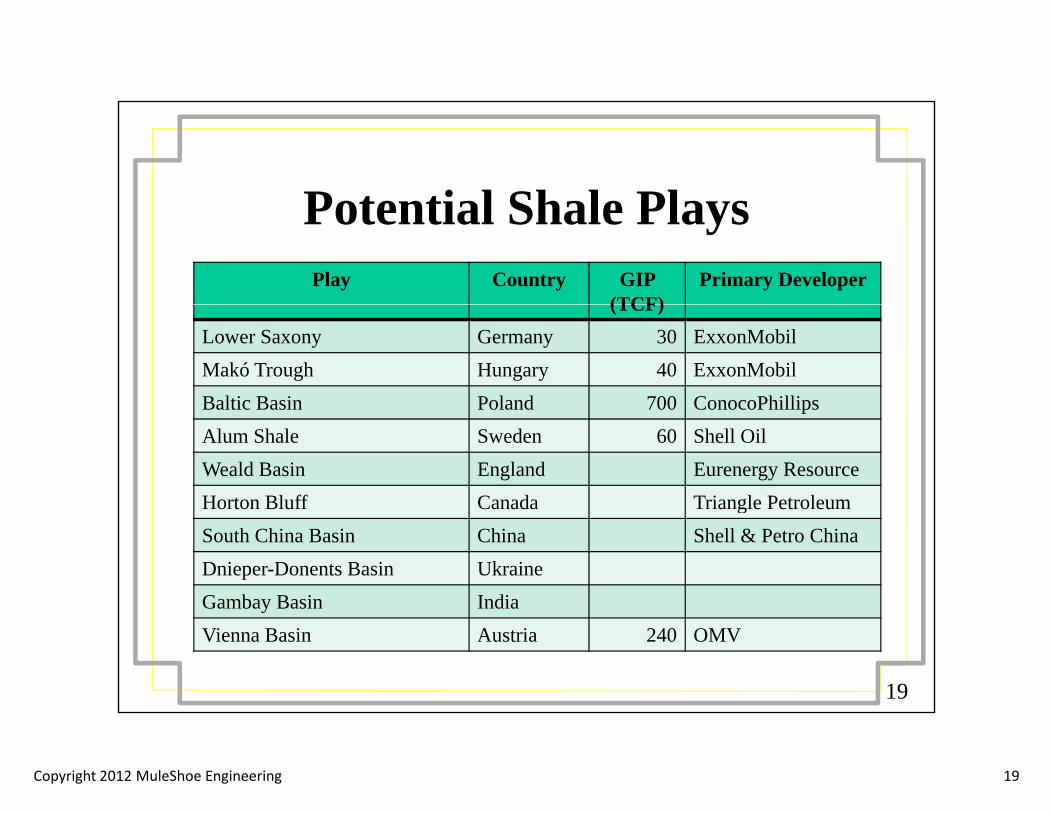
Potential Shale PlaysPotential Shale PlaysPlay Country GIP
(TCF)Primary Developer
(TCF)Lower Saxony Germany 30 ExxonMobilMakó Trough Hungary 40 ExxonMobilBaltic Basin Poland 700 ConocoPhillipsBaltic Basin Poland 700 ConocoPhillipsAlum Shale Sweden 60 Shell OilWeald Basin England Eurenergy ResourceHorton Bluff Canada Triangle PetroleumHorton Bluff Canada Triangle PetroleumSouth China Basin China Shell & Petro ChinaDnieper-Donents Basin UkraineGambay Basin India
19
yVienna Basin Austria 240 OMV
Copyright 2012 MuleShoe Engineering 20
Shale Specific Challengesp g
• Abrasive solids• Water Acquisition• Water Acquisition• Infrastructure
20
Copyright 2012 MuleShoe Engineering 21
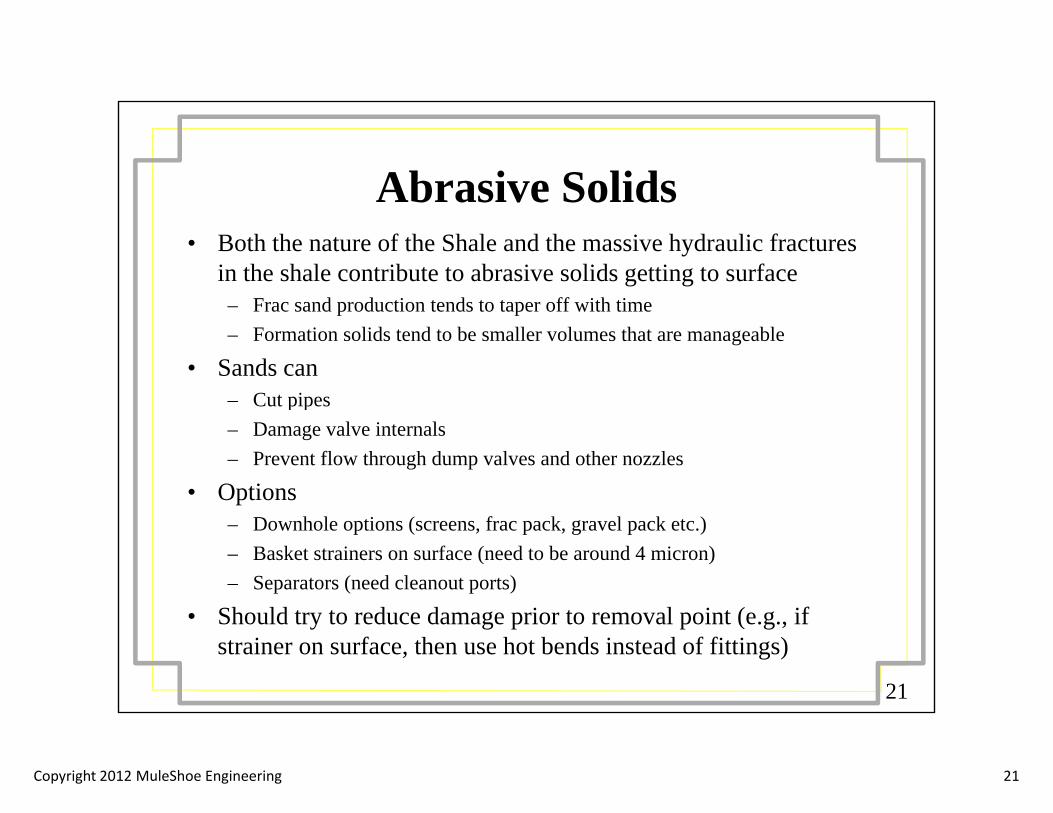
Abrasive Solidsb s ve So ds• Both the nature of the Shale and the massive hydraulic fractures
in the shale contribute to abrasive solids getting to surfaceFrac sand production tends to taper off with time– Frac sand production tends to taper off with time
– Formation solids tend to be smaller volumes that are manageable
• Sands can – Cut pipesp p– Damage valve internals– Prevent flow through dump valves and other nozzles
• Options– Downhole options (screens, frac pack, gravel pack etc.)– Basket strainers on surface (need to be around 4 micron)– Separators (need cleanout ports)
Sh ld t t d d i t l i t ( if
21
• Should try to reduce damage prior to removal point (e.g., if strainer on surface, then use hot bends instead of fittings)
Copyright 2012 MuleShoe Engineering 22
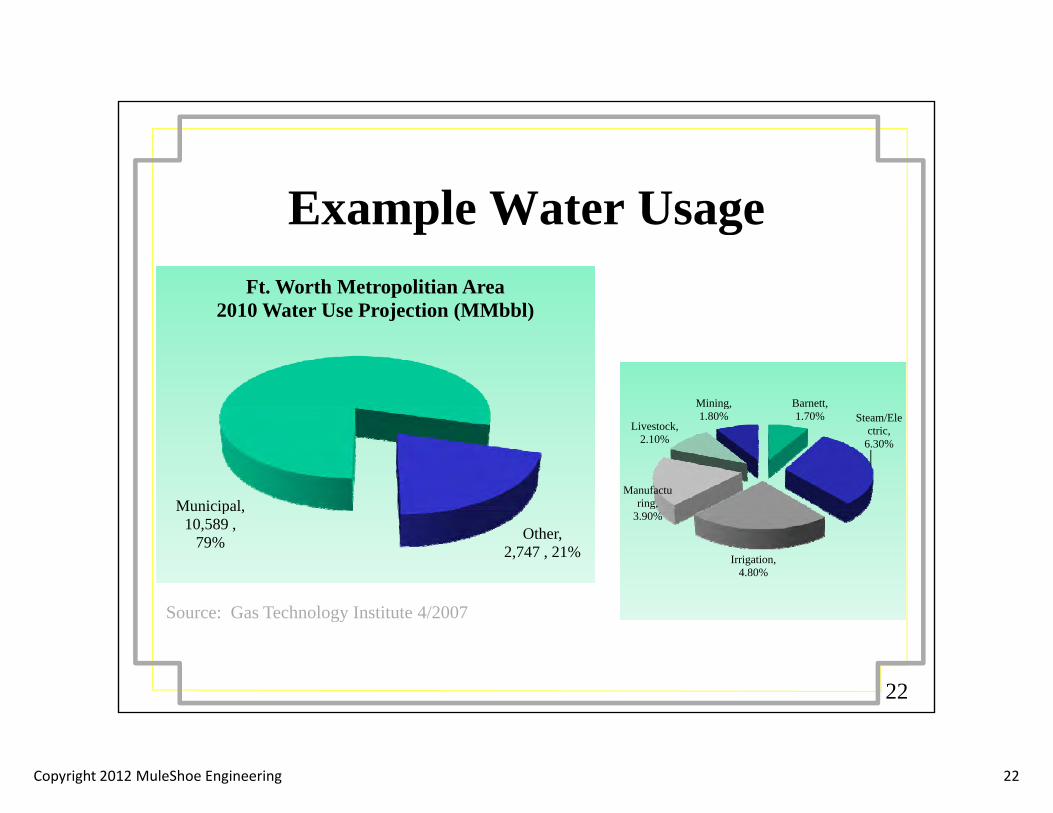
Example Water UsageExample Water UsageFt. Worth Metropolitian Area
2010 W t U P j ti (MMbbl)2010 Water Use Projection (MMbbl)
Barnett, Mining,
Municipal
a ett,1.70% Steam/Ele
ctric, 6.30%
Manufacturing,
Livestock, 2.10%
g,1.80%
Municipal, 10,589 ,
79% Other, 2,747 , 21% Irrigation,
4.80%
g3.90%
Source: Gas Technology Institute 4/2007
22
Source: Gas Technology Institute 4/2007
Copyright 2012 MuleShoe Engineering 23
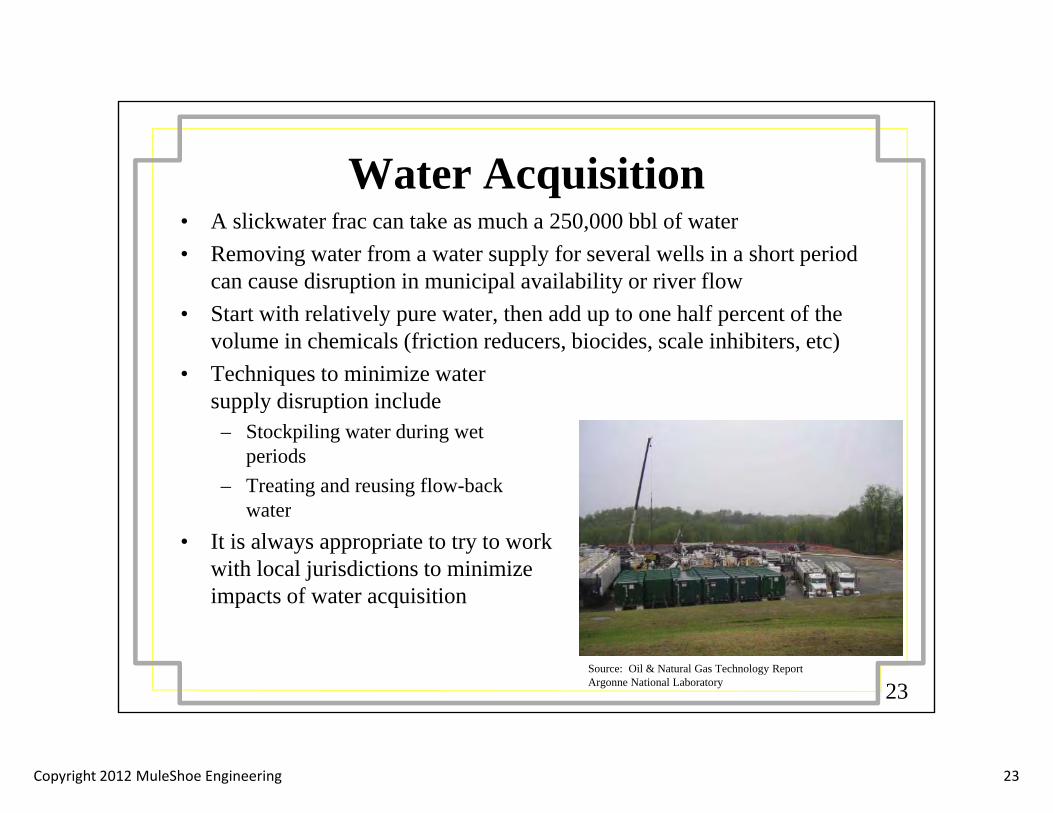
Water Acquisition• A slickwater frac can take as much a 250,000 bbl of water• Removing water from a water supply for several wells in a short period
can cause disruption in municipal availability or river flow• Start with relatively pure water, then add up to one half percent of the
volume in chemicals (friction reducers, biocides, scale inhibiters, etc)• Techniques to minimize water
supply disruption includesupply disruption include– Stockpiling water during wet
periods– Treating and reusing flow-back
waterwater• It is always appropriate to try to work
with local jurisdictions to minimize impacts of water acquisition
23Source: Oil & Natural Gas Technology ReportArgonne National Laboratory
Copyright 2012 MuleShoe Engineering 24
Infrastructures uc u e• Shale Gas development is happening in places that have not
historically had natural gas production• This creates barriers to development
– Pipelines can take years to permit and build– Plants and compressor stations can be very
difficult to permit in places where Oil & Gasdifficult to permit in places where Oil & Gas operations are new
– States without a tradition of Oil & Gas will often try to apply regulations from other industries that can be unreasonably restrictiveindustries that can be unreasonably restrictive
– Water management infrastructure causes regulators considerable difficulty
• All of the barriers can be overcome, but
24
it often requires significant time, money, and public-relations effort
Copyright 2012 MuleShoe Engineering 25
Shale Gas Conclusion
• Shale Gas development is in its early stagesW d ’t k h th ll ill d ti– We don’t know how the wells will respond over time
– We don’t know how the water rates will change with time– We don’t have a clear strategy for what pressures will be required over
timetime– We don’t know how we are going to do mid-life and late-life
deliquification
• Some of this information may require 30-50 years to developy q y p• Beware of the idea that you can design your Shale Gas field
once and facilities will last forever—we will make about the same number of mistakes in Shale as we made in CBM, but
25
same number of mistakes in Shale as we made in CBM, but hopefully they will be different mistakes

Copyright 2012 MuleShoe Engineering 26
Thank you for your attention.Additional information can be found at
www.muleshoe-eng.comg
David Simpsonzdas04@muleshoe eng [email protected]
505-326-2115
26