Embed Size (px)
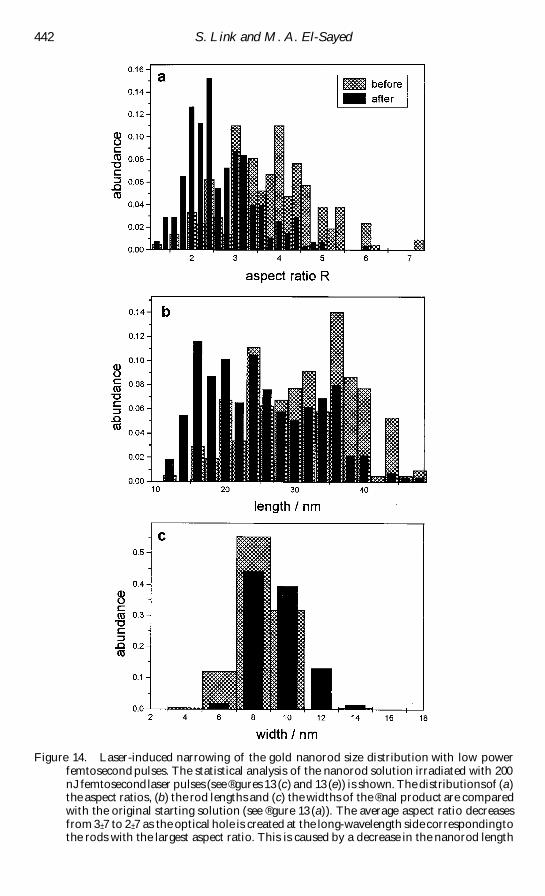
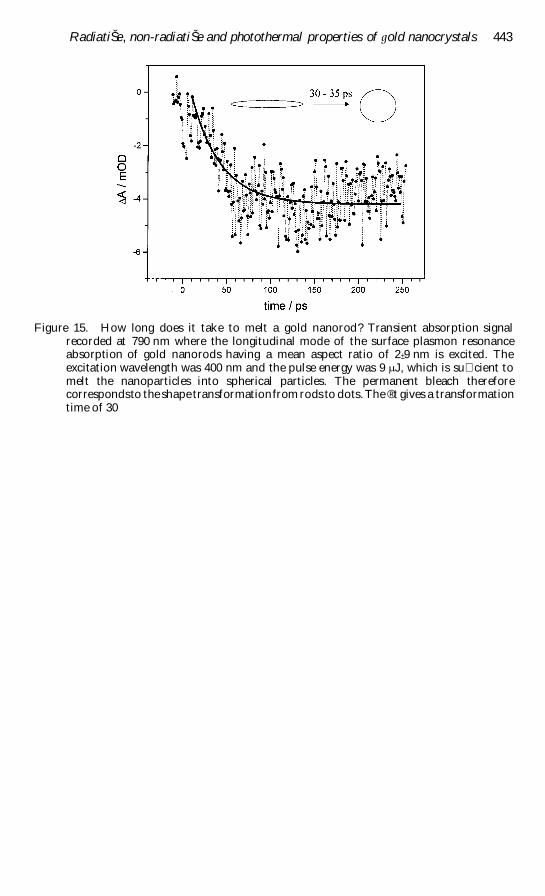
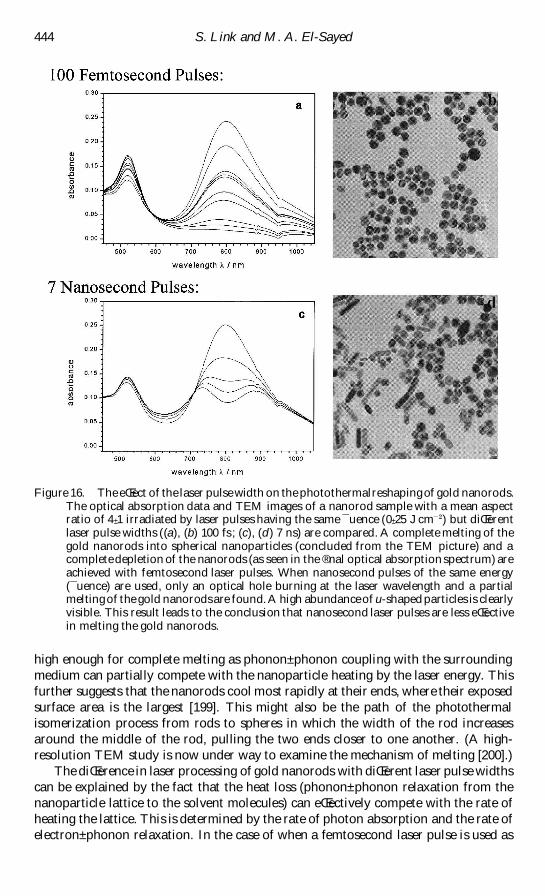
Citation preview
I n t R e v i e w s i n P h y s i c a l C h e m i s t r y 2000 V o l 19 N o 3 409plusmn 453
Shape and size dependence of radiative non-radiative and photothermalproperties of gold nanocrystals
STEPHAN LINK and MOSTAFA A EL-SAYEDlsaquo
Laser Dynamics Laboratory School of Chemistry and Biochemistry
Georgia Institute of Technology Atlanta GA 30332-0400 USA
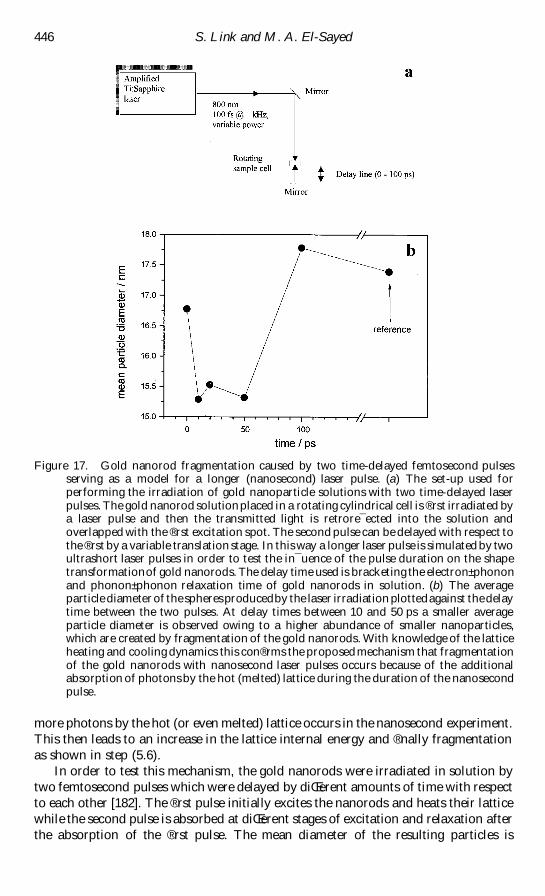
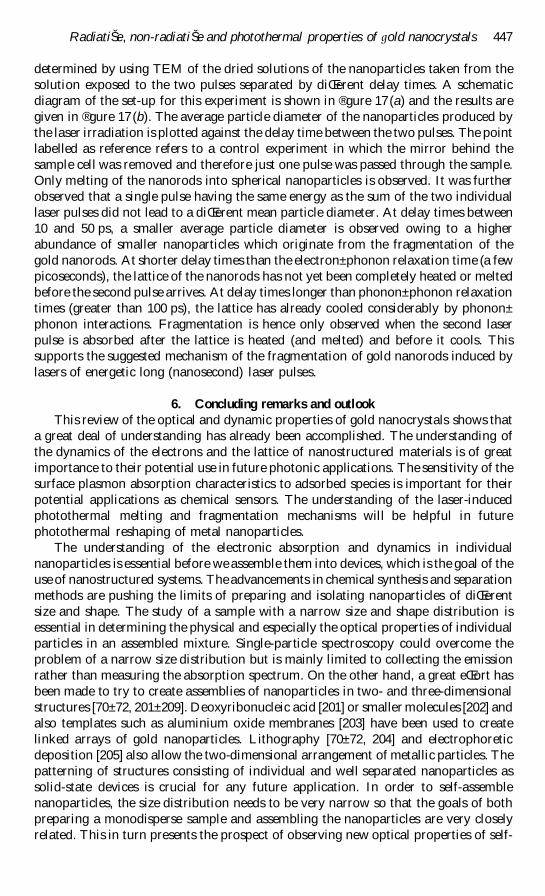
Driven by the search for new materials with interesting and unique propertiesand also by the fundamental question of how atomic and molecular physicalbehaviour develops with increasing size the reg eld of nanoparticle research hasgrown immensely in the last two decades Partially for these reasons colloidalsolutions of metallic (especially silver and gold) nanoparticles have long fascinatedscientists because of their very intense colours The intense red colour of colloidalgold nanoparticles is due to their surfaceplasmon absorptionThis article describesthe physical origin of the surface plasmon absorption in gold nanoparticles withemphasis on the Mie and also the Maxwell-Garnett theory and reviews the eŒectsof particle size and shape on the resonance conditionA better understandingof therelationship between the optical absorption spectrum (in particular the plasmonresonance) and such particle properties as its dimensions or surroundingenvironment can prove fruitful for the use of the plasmon absorption as ananalytical tool The plasmon resonance has also had a great impact on the Ramanspectrum of surface-adsorbed molecules and a large enhancement of the macr uores-cence quantum yield of gold nanorods is observed Furthermore following thechanges in the plasmon absorption induced by excitation (heating) with ultrashortlaser pulses allows one to monitor the electron dynamics (electronplusmn electron andelectronplusmn phonon interactions) in real time which is important in understandingsuch fundamental questions regarding the thermal and electrical conductivity ofthese nanoparticles Very intense heating with laser pulses leads to structuralchanges of the nanoparticles (nuclear rearrangements in the form of melting andfragmentation)
Contents
1 Introduction 410
2 Optical absorption properties of metal nanoparticles the surface plasmon
resonance 413
21 The Mie theory 413
22 Shape-dependent radiative properties the Gans theory 419
23 EŒective dielectric function of a metalplusmn host composite material
the Maxwell-Garnett theory 421
3 Luminescence properties of metal nanoparticles 422
4 Electron dynamics in gold nanoparticles probed by femtosecond transient
absorption spectroscopy 426
41 Introduction 426
42 Theoretical modelling of the transient optical response 429
43 Electronplusmn electron thermalization in gold nanoparticles 430
lsaquo Author for correspondenceE-mail mostafael-sayedchemistrygatechedu
International Re Š iews in Physical Chemistry ISSN 0144-235X printISSN 1366-591X online 2000 Taylor amp Francis Ltdhttpwwwtandcoukjournals
410 S Link and M A El-Sayed
44 Electronplusmn phonon relaxation in gold nanoparticles 431
45 Pump power dependence of the electronplusmn phonon relaxation rate 434
46 Shape and size dependences of the electronplusmn phonon relaxation
rate 435
5 Photothermal laser-induced shape transformation of gold nanoparticles 438
6 Concluding remarks and outlook 447
Acknowledgements 448
References 448
1 Introduction
Over the last two decades the interest in colloidal and cluster chemistry has grown
signireg cantly [1plusmn 14] The more general term nanoparticle includes small clusters or
giant molecules (fewer than 100 atoms in the size range around 1 nm) and larger
particles consisting of tens to hundreds of thousands of atoms (or even greater) and
having a diameter in the range of tens to hundreds of nanometres The latter kind of
material has long been known to scientists as colloids [1 2 4 12 15plusmn 17] most often
referring to suspensions of metal particles in an aqueous medium In fact colloidal
gold has been used as a colouring pigment dating back to the middle ages [15] In the
nineteenth century Faraday [18] already recognized that the ruby red colour of
colloidal gold stems from the presence of aggregates of gold atoms although he had no
means of analysing the size of these gold nanoparticles by modern analytical
techniques such as transmission electron microscopy (TEM)
Around the turn of the twentieth century the reg eld of colloidal chemistry was
undergoing tremendous growth due to the pioneering contributions from Ostwald and
Mie and the Nobel Prize winners Svedberg and Zsigmondy The work by Mie [19]
who reg rst explained the origin of the red colour of gold nanoparticles will be discussed
in greater detail in this review article The one thing that all these pioneers had in
common was the fact that they realized how dramatically the ratio of surface atoms to
interior atoms changes if one successively divides a macroscopic object (eg a cube)
into smaller parts The study of the accompanying changes in the physical chemistry
of nanoscale material compared with the bulk or to individual atoms was their goal
then as it still is today
As an example of how drastically the number of surface atoms increases with
decreasing particle size consider a cube of iron 1 cm on an edge The percentage of
surface atoms would be only 10shy amp Dividing the same cube into smaller cubes with
an edge of just 10 nm results in a percentage of surface atoms of 10 and in a cube
with an edge of 1 nm every atom would be a surface atom This might illustrate why
changes in the size range of a few nanometres are expected to lead to great changes in
the physical and chemical properties of the nanoparticle The investigation of new
material properties is interesting from a technological standpoint [12plusmn 14 20] the
transition from individual atoms to the bulk state of matter is however also of very
great fundamental importance in science [21plusmn 26]
The reason for the resurrection of colloid and cluster science in recent years is that
the gap between the organometallic clusters and small colloidal particles has been
closed by synthesis of larger clusters stabilized by organic ligands [12] At the same
Radiati Š e non-radiati Š e and photothermal properties of gold nanocrystals 411
time size selective separation methods of colloidal particles have allowed the isolation
of smaller clusters from the large distribution of sizes [27plusmn 29] In fact the
monodispersity of the particle size is a key factor in enabling the study of size-
dependent physical properties of the nanoparticles In this way particles can be
isolated in a quantity which easily allows one to use less sensitive analytic techniques
than usually employed in a cluster beam experiment Not only have the chemical
preparation methods improved signireg cantly but also the progress in computing
capabilities [12 23] makes it now possible to calculate cluster properties of fairly large
particles from reg rst principles similar to calculations of molecular properties On the
other hand band structure calculations in solid-state physics do not have to involve
inreg nite boundary conditions any more as the signireg cance of a reg nite size can be taken
into account Therefore the fact that the areas of cluster and colloid science are
merging together with the advancement in the chemical synthesis techniques explains
and justireg es the use of the word nanoparticle for all particles falling in the size regime
of 10shy m
The reason for studying nanostructured materials from a technological standpoint
is mainly the anticipated applications in optical systems and catalysis [12plusmn 14 20] In
particular in the reg elds of optical data communication and optical data storage the
need for new materials with high nonlinearities is driving nanoparticle research The
ease of tuning the optical properties gradually with particle size and shape have made
nanoparticles very interesting compared with organic dye molecules [3] Semi-
conductor nanoparticles have already been successfully used in solar cells converting
sunlight into electricity [20] On the other hand because of their high surface-to-
volume ratios metal nanoparticles (especially platinum and palladium) are important
as catalysts [12] Shape control over platinum nanoparticles [30] might allow the
exposure of diŒerent crystal surfaces for catalysis showing diŒerences in catalytic
e ciency
In general nanoparticles can be composed of metals in their neutral valence state
or as their oxides sulphides selenides etc Nanoparticles composed of a semi-
conducting material are of great interest since their bandgap transition has moved to
the visible compared with the infrared for the bulk [3 9 10] Even though this article
will focus on metallic nanoparticles all the particles have in common that they must
be stabilized by molecules attached at their surface (to control their size and to prevent
them from agglomeration and precipitation) or must be embedded in a solid matrix in
order to avoid aggregation and the formation of the thermodynamically favoured
bulk material In the absence of any counteractive repulsive forces the van der Waals
forces between two metal nanoparticles would lead towards coagulation This can be
avoided by either electrostatic or steric stabilization [12] Electrostatic stabilization is
realized by an electrical double layer arising from the attraction of negatively charged
ions to the (mainly) metal nanoparticles The positive counterions then form a second
layer (hence the electrical double layer) Steric stabilization in solution is achieved by
binding of polymers or surfactant molecules with long alkyl chains to the particle
surface The long chains of the organic molecules prevent the particles from coming
close to each other The surface organic molecules further prevent the oxidation of the
neutral metal in solution and small nanoparticles of gold can be isolated as a powder
and are completely stable against air oxidation [31] In the case of gold organic thiols
have been employed very successfully in the synthesis of small gold clusters [28 31 32]
The goldEthiolate bond is known to be particularly strong and allows the isolation of
these compounds as molecular substances
412 S Link and M A El-Sayed
Preparation methods of metallic nanoparticles range from chemical methods to
metal vapour synthesis [12] The most widely used and oldest method is reduction of
the metal salt in solution by reducing agents such as sodium citrate phosphor sodium
borhydride or hydrogen [33] While sodium citrate used in an excess can also serve as
a protective capping agent in the case of the other mentioned substances polymers or
surfactants have to be added before the salt reduction in order to stabilize the
nanoparticles The reduction with sodium citrate has been worked out in detail by
Turkevich and co-workers [34plusmn 37] and produces gold nanoparticles with an average
diameter of about 20 nm with a very narrow size distribution and good reproducibility
It is therefore often used to prepare gold nanoparticles in solution which have been
widely used as labelling agents in biological samples using TEM [5]
Another reducing agent of a diŒerent kind employed very successfully is the use of
free electrons or radicals generated in solution by radiolytic techniques [1 2] Henglein
[1 2] and Mulvaney [4] have used a c -ray source to produce a wide variety of diŒerent
metal nanoparticles from cadmium thallium and lead to silver and gold Thermolysis
[38plusmn 41] and photolysis [42] of unstable organometallic precursors is another
preparation method which has been used for the synthesis of palladium and platinum
nanoparticles Electrolysis [43 44] can also be used to prepare metal nanoparticles In
metal vapour synthesis [45] atomic metal vapour is simply condensed in a dispersing
medium at low temperatures (because of the reactivity towards water this is exclusively
done in organic solvents) Furthermore nanoparticles can be grown in optically
transparent glasses at high temperatures [46] which is often the procedure most widely
used in solid-state physics In order also to synthesize nanoparticles of a certain shape
the reduction of the metal precursors can be carried out in a constraint environment
such as the inside of zeolites [12] porous alumina [47plusmn 52] and micelles [44 53plusmn 55]
The feature that distinguishes the preparation methods listed above from each
other in obtaining a homogeneous size distribution is the rate of nuclei formation
where the nuclei are homogeneously distributed over the reaction volume This allows
all clusters to grow with the same rate and one obtains a kinetically favoured product
rather than reaching the thermodynamically most favourable state (which would of
course be the bulk metal itself if given enough time)
While it would be worth reviewing the wide reg eld of preparation methods more
thoroughly the above discussion is used here only to serve as a general introduction
Instead this article focuses on the optical properties of the noble metal nanoparticles
which show a pronounced surface plasmon absorption The exact preparation
methods are of less importance for the main optical absorption feature It should
however be mentioned that the results presented here are all obtained on gold
nanoparticles produced either by the citrate method [34 35 56] or by an elec-
trochemical method with the use of organic surfactant molecules producing gold
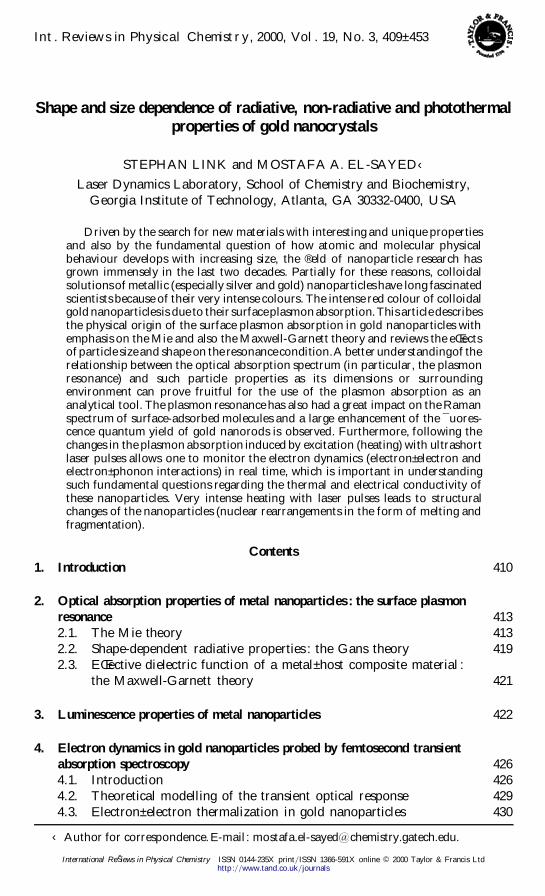
nanorods [44 53] TEM pictures of 48 nm nanodots and gold nanorods with a mean
aspect ratio of 3 plusmn 3 are shown in reg gures 1(a) and (b) respectively The eŒect of the
surrounding medium will be discussed at appropriate times throughout the text The
reg rst part of this review discusses the physical origin of the surface plasmon absorption
and the eŒects of size and shape on the resonance condition The theories developed
by Mie [19] and Maxwell-Garnett [57] early in the twentieth century will be outlined
in more detail The second part deals with the optical response of the surface plasmon
band after excitation with a femtosecond laser pulse Time-resolved transient
absorption spectroscopy allows direct observation of the electron dynamics as the
electrons couple to the lattice Very intense laser heating on the other hand leads to
Radiati Š e non-radiati Š e and photothermal properties of gold nanocrystals 413
Figure 1 TEM images of (a) spherical gold nanoparticles with an average diameter of 48 nmand (b) gold nanorods with a mean aspect ratio of 3 plusmn 3
nuclear rearrangements and permanent shape transformation of the nanoparticles
This transformation can also be followed directly by monitoring the surface plasmon
absorption We shall see that TEM analysis is of crucial importance in order to
correlate the structural changes with the optical absorption data
2 Optical absorption properties of metal nanoparticles the surface plasmon
resonance
21 The Mie theory
It was mentioned in the introduction that a reduction in particle size leads to
diŒerent physical and especially optical properties [1plusmn 3 8plusmn 11 23 58plusmn 60] Reducing the
size of the nanoparticle has a pronounced eŒect on the energy level spacing as the
system becomes more conreg ned Similar to a particle in a box the energy separation
between adjacent levels increases with decreasing dimensions This is most pronounced
for semiconductor nanoparticles where the bandgap energy increases with decreasing
size and the onset of the bandgap transition is shifted to higher frequencies [3 8plusmn 10
24plusmn 26 61] Since the exciton radius is typically 2plusmn 8 nm for IIplusmn VI semiconductors
particles of several nanometres in diameter are expected to undergo the transition
from the bulk to the quantum-conreg ned state Quantum size eŒects are also known for
metal nanoparticles [21 22] In order to observe the localization of the energy levels the
size must be well below 2 nm as the level spacing has to exceed the thermal energy
(about 26 meV) There is a simple explanation for this fundamental diŒerence In a
414 S Link and M A El-Sayed
semiconductor the interesting level spacing is the energy diŒerence between the
completely reg lled valence band and the empty conduction band which corresponds to
the interband transition This energy separation is of the order of a few electronvolts
and increases rapidly with decreasing size [61] In a metal the conduction band is half-
reg lled and the density of energy levels is so high that a noticeable separation in energy
levels within the conduction band (intraband transition) is only observed when the
nanoparticle is made up of just a few atoms (N macr 100) In fact the level spacing of the
one electron states can be roughly approximated by EFN [21plusmn 23] where the Fermi
energy EF
is typically of the order of 5 eV in most metals A 10 nm gold nanoparticle
consisting of roughly 30000 atoms would therefore have an energy level spacing of
only 0 plusmn 167 meV On the other hand this simple approximation translates into a
transition energy of 167 meV for a 30-atom cluster which exceeds the thermal energy
Experimentally an increased bandgap between the lowest unoccupied (molecular)
orbital (LUMO) and the highest occupied (molecular) orbital has been found to be
around 1 plusmn 7 eV or 730 nm for a 28-atom gold cluster [62]
The surface plasmon resonance is the coherent excitation of all the `free rsquo electrons
within the conduction band leading to an in-phase oscillation [1 4 58plusmn 60] The
surface plasmon resonance does not give rise to the most intense absorption for very
small clusters but is rather strongly damped [23 63plusmn 65] For the larger particles of
several tens of nanometres in which their size is still small compared with the
wavelength of light excitation of the surface resonance can take place with visible
light For the same particles the volume plasmon is located at very high energies (6plusmn 9
eV) [23] The surface obviously plays a very important role for the observation of the
surface plasmon resonance as it alters the boundary conditions for the polarizibility of
the metal and therefore shifts the resonance to optical frequencies In this sense the
surface plasmon absorption is a small particle (or thin layer) eŒect but dereg nitely is not
a quantum size eŒect
Figure 2(a) shows how one can picture the creation of a surface plasmon
oscillation in a simple manner The electric reg eld of an incoming light wave induces a
polarization of the (free) conduction electrons with respect to the much heavier ionic
core of a spherical nanoparticle The net charge diŒerence occurs at the nanoparticle
boundaries (the surface) which in turn acts as a restoring force In this manner a
dipolar oscillation of the electrons is created with period T Figure 2(b) shows the
surface plasmon absorption of 22 48 and 99 nm gold nanoparticles [56] prepared in
aqueous solution by the reduction of gold ions with sodium citrate [34 35] The
absorption spectra of the diŒerent particles are normalized at their surface plasmon
absorption maximum for comparison The molar extinction coe cient is of the order
of 1 not 10 Mshy cmshy for 20 nm nanoparticles and increases linearly with increasing
volume of the particles [11] Note that these extinction coe cients are three to four
orders of magnitude higher than those for the very strong absorbing organic dye
molecules From reg gure 2(b) it can be seen that the surface plasmon absorption red
shifts with increasing size while the bandwidth increases in the size region above 20 nm
[56] These trends for particles of diŒerent sizes will be discussed theoretically in the
following paragraphs
Dating back to 1908 Mie [19] was the reg rst to explain the red colour of gold
nanoparticle solutions He solved Maxwellrsquo s equation for an electromagnetic light
wave interacting with small spheres having the same macroscopic frequency-
dependent material dielectric constant as the bulk metal The solution of this
electrodynamic calculation with appropriate boundary conditions for a spherical
Radiati Š e non-radiati Š e and photothermal properties of gold nanocrystals 415
Figure 2 Surface plasmon absorption of spherical nanoparticles and its size dependence (a)A scheme illustrating the excitation of the dipole surface plasmon oscillation The electricreg eld of an incoming light wave induces a polarization of the (free) conduction electronswith respect to the much heavier ionic core of a spherical gold nanoparticleA net chargediŒerence is only felt at the nanoparticle boundaries (surface) which in turn acts as arestoring force In this way a dipolar oscillation of the electrons is created with period TThis is known as the surface plasmon absorption (b) Optical absorptionspectra of 22 48and 99 nm spherical gold nanoparticles The broad absorption band corresponds to thesurface plasmon resonance
object leads to a series of multipole oscillations for the extinction cross-section of the
nanoparticles [23 58plusmn 60] By series expansion of the involved reg elds into partial waves
one obtains the following expressions for the extinction cross-section rext
and
scattering cross-section rsca
[23]
rext
macr2 p
rkr
cent
L=
(2Lshy 1) Re (aLshy b
L) (21)
rsca
macr2 p
rkr
cent
L=
(2Lshy 1) (raLrshy rb
Lr) (22)
with rabs
macr rextreg r
scaand
aL
macrmw
L(mx) w
L(x) reg w
L(mx) w
L(x)
mwL(mx) g
L(x) reg w
L(mx) g
L(x)
bL
macrw
L(mx) w
L(x) reg mw
L(mx) w
L(x)
wL(mx) g
L(x) reg mw
L(mx) g
L(x)
m macr nnm
where n is the complex refractive index of the particle and nm
the real
refraction index of the surrounding medium k is the wave-vector and x macr rkrr with r
416 S Link and M A El-Sayed
being the radius of a nanoparticle wL
and gL
are the Ricattiplusmn Bessel cylindrical
functions The prime indicates diŒerentiation with respect to the argument in
parentheses L is the summation index of the partial waves L macr 1 corresponds to the
dipole oscillation as illustrated in the reg gure 2 (a) while L macr 2 is associated with the
quadrupole oscillation and so on
For nanoparticles much smaller than the wavelength of light (2r rsquo k or roughly
2r kmax
10) only the dipole oscillation contributes signireg cantly to the extinction
cross-section [1 4 23 58plusmn 60] The Mie theory then reduces to the following
relationship (dipole approximation)
rext
(x) macr 9x
ce$m
Ve(x)
[e(x) shy 2e
m]shy e
(x)
(23)
where V is the particle volume x is the angular frequency of the exciting light c is the
speed of light and em
and e(x) macr e(x) shy ie
(x) are the dielectric functions of the
surrounding medium and the material itself respectively While the reg rst is assumed to
be frequency independent the latter is complex and is a function of energy The
resonance condition is fulreg lled when e(x) macr reg 2e
mif e
is small or weakly dependent
on x [23]
The above equation has been used extensively to explain the absorption spectra of
small metallic nanoparticles in a qualitative as well as quantitative manner [23 63]
However for larger nanoparticles (greater than about 20 nm in the case of gold) where
the dipole approximation is no longer valid the plasmon resonance depends explicitly
on the particle size as x is a function of the particle radius r The larger the particles
become the more important are the higher-order modes as the light can no longer
polarize the nanoparticles homogeneously These higher-order modes peak at lower
energies and therefore the plasmon band red shifts with increasing particle size [23
58plusmn 60] At the same time the plasmon bandwidth increases with increasing particle
size This is illustrated experimentally from the spectra shown in reg gure 2(b) It also
follows from the Mie theory As the optical absorption spectra depend directly on the
size of the nanoparticles this is regarded as an extrinsic size eŒects [23]
The plasmon bandwidth can be associated with the dephasing of the coherent
electron oscillation [56 66plusmn 73] Large bandwidth corresponds to rapid loss of the
coherent electron motion Electron dephasing times of a few femtoseconds are
computed from the surface plasmon bandwidth which strongly suggests that the main
relaxation process involves electronplusmn electron collisions [56] If one assumes a simple
two-level model for the plasmon absorption the width C is then given by [66]
1
T
macr p c C macr1
2T
shy1
T $
(24)
T
describes the population relaxation time (involving both radiative and non-
radiative processes) T
is the total dephasing time and T $
is the pure dephasing time
The latter results from collisions that change the plasmon wave-vector but not its
energy Often T $
is much shorter than the energy relaxation Tand thus determines the
value of T
Assuming a homogeneous size distribution and therefore homogeneous line
broadening the total dephasing time can be computed from the measured width of the
plasmon absorption band Using equation (24) with the spectra shown in reg gure 2(b)
Radiati Š e non-radiati Š e and photothermal properties of gold nanocrystals 417
dephasing times of 4 plusmn 1 3 plusmn 9 and 2 plusmn 6 fs are calculated for the 22 44 and 99 nm gold
particles respectively [56] Kreibig et al [67] determined dephasing times of 2 fs for 2
nm silver clusters embedded in a matrix and 7 fs for the same clusters in vacuum
(naked clusters) These extremely fast dephasing times are in agreement with nonlinear
frequency mixing studies on gold nanoparticles by Heilweil and Hochstrasser [66]
They found that both T
and T
are shorter than 48 fs More recent nonlinear studies
came to the conclusion that the dephasing time of the coherent plasmon oscillation is
shorter than 20 fs [68] These results also agree with studies on lithographically
produced gold and silver nanoparticles (about 200 nm in size) [70plusmn 72] for which
dephasing times of 6 and 10 fs were measured by second-order nonlinear auto-
correlation femtosecond spectroscopy [72] Furthermore recent single nanoparticle
investigations with a scanning near-reg eld optical microscope found a homogeneous
linewidth of only 160 meV for some individual particles corresponding to a dephasing
time of 8 fs for 40 nm gold nanoparticles in a solplusmn gel TiO
matrix [73]
The situation concerning the size dependence of the optical absorption spectrum is
more complicated for smaller nanoparticles for which only the dipole term is
important As can easily be seen from equation (23) the extinction coe cient does not
depend on the particle dimensions which would imply that the surface plasmon
absorption becomes size independent for particles smaller than about 20 nm A size
dependence is observed experimentally [4 11 23 63] For 5 nm particles the plasmon
oscillation is strongly damped and its absorption becomes weak and broad and it
completely disappears for nanoparticles less than about 2 nm in diameter [32 64 65]
This is because the electron density in the `conduction rsquo band becomes very small
Obviously the assumption of bulk-like electronic bands and bulk electronic and
optical properties associated with the electronic structure of the nanoparticles is rather
questionable In particular the use of the bulk dielectric constant which enters the Mie
equation as the only material-related physical quantity is not justireg ed any longer [4
23 63] However as the Mie theory has been very successful in describing the optical
absorption spectra of metal nanoparticles [4 23 58plusmn 60] the theory was modireg ed in a
way to account for the size eŒects rather than abandon it altogether
In almost all the many theoretical models published it is assumed that the dielectric
constant of the material is size dependent (e(x r)) below an average particle diameter
of about 20 nm [23 63] In one of the early approaches Kreibig and von Fragstein [74]
and Kreibig [75] proposed that electronplusmn surface scattering must be enhanced in those
small particles since the mean free path of the conduction electrons is limited by the
physical dimension of the nanoparticle The mean free path of the electrons in silver
and gold is of the order of 40plusmn 50 nm [76] If the electrons scatter with the surface in an
elastic but totally random way the coherence of the overall plasmon oscillation is lost
Inelastic electronplusmn surface collisions would also change the phase The smaller the
particles the faster the electrons reach the surface of the particles The electrons can
then scatter at the surface and lose the coherence more quickly than in a larger
nanoparticle As a consequence the plasmon band width increases with decreasing
nanoparticle radius Indeed it was shown theoretically [63 74 75] and experimentally
[46 74 75 77 78] that the plasmon band width is inversely proportional to the particle
radius
Following the model of the reduction of the eŒective electron mean free path and
enhanced electronplusmn surface scattering [74 75] the mathematical formulation of this
problem explaining the correct size dependence of the surface plasmon absorption
starts with writing the dielectric function as a combination of an interband term eIB
(x)
418 S Link and M A El-Sayed
and a Drude term eD(x) considering only the free conduction electrons (e(x) macr
eIB
(x) shy eD(x)) The latter is given within the free-electron model by the following
expression [76]
eD(x) macr 1 reg
xp
x shy ic x (25)
where xpmacr nee
m
effis the bulk plasmon frequency expressed in terms of the free
electron density n and the electron charge e e
is the vacuum permittivity and meff
the
electron eŒective mass c is introduced as a phenomenological damping constant It is
equal to the plasmon absorption bandwidth C for the case of a perfectly free-electron
gas in the limit c rsquo x [23] The damping constant c is related to the lifetimes of all
electron scattering processes which are mainly electronplusmn electron electronplusmn phonon
and electronplusmn defect scattering in the bulk material [23]
cmacr
i
sshy i
macr sshy eplusmn e
shy sshy e plusmn ph
shy sshy e plusmn d
(26)
where c
is the bulk damping constant As already mentioned above for nanoparticles
smaller than the mean free path of the conduction electrons electronplusmn surface
scattering is believed to be important as well An additional term accounting for
electronplusmn surface scattering is added to equation (26) and c then becomes a function
of the particle radius r as follows [74 75]
c(r) macr cshy
A ŠF
r (27)
where A is a theory-dependent parameter which is dependent on the details of the
scattering process (eg isotropic or diŒuse scattering) [23 63] and ŠF
is the velocity of
the electrons at the Fermi energy This size eŒect is considered an intrinsic size eŒect
[23] since the material dielectric function itself is size dependent in contrast with the
extrinsic size eŒect in large particles (ie r 20 nm)
This model gives the correct 1r dependence [46 74 75 77 78] of the plasmon
bandwidth as a function of size for nanoparticles described by the dipole ap-
proximation in the intrinsic size region (r 20 nm) The parameter A is mostly used
as a reg t parameter of the experimental results However the best advantage of this
theory is probably the fact that it provides a very good description for the dependence
of the particle dielectric constant on size The modireg cation of the dielectric constant
is done in a straightforward manner However there exist many more theories [79plusmn 89]
discussing how diŒerent factors such as the changes in the band structure
environmental changes or the `spill-out rsquo of the conduction electrons can be
incorporated into a size-dependent dielectric function and thus into the main
framework of the Mie theory Other theories calculate the optical response from reg rst
principles by quantum-mechanical methods [87] or by the use of the jellium model for
small clusters [88] This is rather di cult to use by most synthetic or physical chemists
trying to explain trends in the optical absorption spectra as a function of particle size
A compilation and comprehensive overview of these theories with references to the
original work can be found in [23] While all of them predict a 1r dependence of the
plasmon bandwidth the calculated slope of this relationship covers a wide range of
Radiati Š e non-radiati Š e and photothermal properties of gold nanocrystals 419
values More complicated is the prediction of the resonance absorption maximum as
a function of particle size as many theories predict both a red shift and a blue shift with
decreasing particle size [23 63] The fact that both trends are also observed
experimentally makes it di cult to assign the origin of the band maximum shift with
size
A good comparison between diŒerent sizes can also be di cult since most
preparation methods are only able to synthesize nanoparticles in a limited size range
The chemical reduction with sodium citrate for example is limited to sizes above 5 nm
[33plusmn 35] while the thiolate-stabilized gold clusters produced by reduction with sodium
borhydride are only stable for diameters below 5 nm [28 32 64 65] The
monodispersity of each sample in comparison with the others is also important as
inhomogeneous broadening can complicate size dependence studies While one might
think that a comparison between particles prepared by diŒerent methods should be
possible as the same gold core is present in all the nanoparticles (the fcc crystal
structure does not change with decreasing particle size) the capping ligands (matrix)
around the particle surface can have a very important inmacr uence on the plasmon
bandwidth and position [1 4 63 67 89 90] Henglein and co-workers [90] have shown
that molecules adsorbed on silver nanoparticles will cause a pronounced broadening
and damping of the surface plasmon resonance One of the most recent theories that
attempts to explain the size dependence of small nanoparticles in the intrinsic size
range takes explicitly into account the chemical nature of the molecules capping the
particles Persson [89] developed a model known as the chemical interface damping
(CID) model In this model the empty LUMOs of the acceptor molecules on the
particle surface are coupled to the free electrons in the conduction band of the metal
The smaller the energy diŒerence between the donor and acceptor levels the stronger
is the coupling Electron transfer between the levels becomes possible after excitation
of a plasmon resonance Excited electrons transfer into the empty acceptor levels and
then back This causes their loss of coherence with the rest of the electrons excited
during the plasmon excitation This then corresponds to a broader bandwidth of the
plasmon absorption As the electronic structure (and therefore the energy position of
the LUMO) varies for diŒerent adsorbate molecules it is expected that the plasmon
resonance of the same metal cluster will experience diŒerent degrees of damping
depending on the specireg c adsorbed molecules Kreibig and co-workers [67 91] have
shown experimentally how the plasmon band broadens when the same silver clusters
produced in the gas phase are reg rst deposited on a SiO
substrate and then later
embedded in SiO
by co-deposition of SiO In this unique experiment they were able
to measure the surface plasmon absorption of 2 nm silver nanoparticles in the gas
phase deposited on a substrate and embedded in a matrix The plasmon bandwidth
increases as the clusters are surrounded by more SiO
molecules as expected from the
model proposed by Persson [89] They furthermore found very good quantitative
agreement with the CID of the surface plasmon resonance Therefore it was proposed
that the surface plasmon absorption could serve as a sensitive chemical sensor of the
particle environment [92]
22 Shape-dependent radiati Š e properties the Gans theory
While size and environment (matrix) eŒects are very important shape eŒects seem
to be even more pronounced in the optical absorption spectrum of gold nanoparticles
[44 47 53] The plasmon resonance absorption band splits into two bands as the
420 S Link and M A El-Sayed
Figure 3 Size-dependent surface plasmon absorption of gold nanorods Optical absorptionspectra of gold nanorods with mean aspect ratios of 2 plusmn 7 ([[[[[) and 3 plusmn 3 (plusmn plusmn plusmn ) are shownThe short-wavelength absorption band is due to the oscillation of the electronsperpendicular to the major axis of the nanorod while the long-wavelength band is causedby the oscillation along the major axis The absorption bands are referred to as thetransverseand longitudinal surface plasmon resonancesrespectivelyThe former is ratherinsensitive towards the nanorod aspect ratio in contrast with the longitudinal surfaceplasmon band which red shifts with increasing aspect ratio This is illustrated in the insetwhere the two band maxima (() transverse mode (D) longitudinal mode) are plottedagainst the nanorod aspect ratio R
particles become more elongated along one axis [58plusmn 60] The aspect ratio is the value
of the long axis (length) divided by the short axis (width) of a cylindrical or rod-shaped
particle As the aspect ratio increases the energy separation between the resonance
frequencies of the two plasmon bands increases [58plusmn 60] The high-energy band
absorbing at around 520 nm corresponds to the oscillation of the electrons
perpendicular to the major (long) rod axis and is referred to as the transverse plasmon
absorption This absorption band is relatively insensitive to the nanorod aspect ratio
[44 47 53] and coincides spectrally with the surface plasmon oscillation of the
nanodots The other absorption band at lower energies is caused by the oscillation of
the free electrons along the major (long) rod axis and is known as the longitudinal
surface plasmon absorption Figure 3 shows the absorption spectra of two nanorod
samples having aspect ratios of 2 plusmn 7 and 3 plusmn 3 The samples were prepared electro-
chemically using micelles as the rod-shaping and stabilizing agents [44 53] Figure 3
shows that the longitudinal plasmon band maximum (open circles) red shifts with
increasing aspect ratio while the transverse absorption band maximum (open squares)
does not change [44 47 53 93]
The optical absorption spectrum of a collection of randomly oriented gold
nanorods with aspect ratio R can be modelled using an extension of the Mie theory
Within the dipole approximation according to the Gans [94] treatment the extinction
cross-section rext
for elongated ellipsoids is given by the following equation [58]
rext
macrx
3ce$m
Vj
(1Pj) e
sup2 e
shy [(1 reg P
j)P
j] e
macute shy e
(28)
Radiati Š e non-radiati Š e and photothermal properties of gold nanocrystals 421
where Pjare the depolarization factors along the three axes A B and C of the nanorod
with A B macr C dereg ned as
PA
macr1reg e
e 9 1
2eln 0 1 shy e
1 reg e 1 reg 1 (29)
PB
macr PC
macr1 reg P
A
2 (210)
and the aspect ratio R is included in e as follows
e macr 9 1 reg 0 BA 1
macr 0 1reg1
R 1 (211)
23 EŒecti Š e dielectric function of a metalplusmn host composite material the Maxwell-
Garnett theory
In general the Mie theory is only valid for very low concentrations of the
nanoparticles in a solvent or solid matrix [23 58] It is assumed that the individual
particles are non-interacting and separated from one another Therefore the electric
reg eld created around one particle by the excitation of a surface plasmon resonance is
not felt by the other surrounding particles If the interparticle distances become
smaller than the particle dimension or if aggregation occurs the plasmon resonance
red shifts and often a second absorption peak at a longer wavelength is observed [23
63 95plusmn 97] This band could be regarded as a longitudinal resonance absorption similar
to the nanorods in the case of chain-like aggregation of the individual nanodots In the
case of particle aggregation and for composite materials such as densely packed
nanoparticles in a transparent host medium the eŒective-medium theories are better
suited to explain their optical absorption spectra [23 58 63]
The Maxwell-Garnett [57] theory is an eŒective-medium theory It treats the
metalplusmn dielectric composite material in which the particles are embedded and isolated
from each other The particle dimension and interparticle distances are considered to
be inreg nitely small compared with the wavelength of the interacting light [58] The
Maxwell-Garnett theory is based on the Clausiusplusmn Masotti equation and it assumes
that it is justireg ed to describe the composite material containing metal nanoparticles
embedded in an inert host medium by an eŒective complex dielectric constant ec
such
that [23 48plusmn 51 58 98 99]
ec reg e
m
ecshy j e
m
macr fm
e reg em
e shy j em
(212)
where e and em
are the dielectric constants of the metal nanoparticles and the host
medium respectively In contrast with the Mie theory em
is also a complex function
depending on the frequency of light fm
is the volume fraction of the metal
nanoparticles in the composite material and j is a screening parameter The latter is
related to the shape of the nanoparticles [98 99] It has a value of two for spherical
particles and equals one for long nanorods oriented with their axes of revolution
parallel to the direction of the incident light Its value approaches inreg nity for macr at discs
oriented with their axes of revolution perpendicular to the incident light [48plusmn 51] With
knowledge of e and em
from the literature and an estimation of fm
from the sample
preparation procedure the dielectric constant ec
of the composite material can be
422 S Link and M A El-Sayed
computed with equation (212) The absorption spectrum of the metal nanoparticles in
a transparent non-interacting host medium can then easily be calculated as the
dielectric constant is related to the optical refractive index nc
and the absorption
coe cient kc
in the following way [58]
ecmacr n
cmacr e
cshy ie
c (213a)
e cmacr n
c reg kc (213b)
e cmacr 2 n
ck
c (213 c)
Martin and co-workers [48plusmn 52] have used an extended Maxwell-Garnett theory in
order to explain the optical absorption spectra of needle-like and pancake-like gold
nanoparticles in a porous alumina membrane The particles are prepared by
electrochemical deposition of the gold into the nanopores of the aluminium oxide
template The particles are all well aligned in one direction parallel to each other and
the aspect ratio was controlled by the deposition time
Palpant et al [100] synthesized gold clusters in an alumina matrix in the size range
2plusmn 4 nm by laser vaporization of the metal and co-deposition with a dielectric vapour
as a thin reg lm on a substrate The surface plasmon absorption of these small gold
nanoparticles is strongly damped and blue shifts with decreasing particle size They
explained their experimental results by use of the Maxwell-Garnett theory and in
combination with calculations based on the time-dependent local-density approxi-
mation [100]
3 Luminescence properties of metal nanoparticles
Photoluminescence from bulk copper and gold was reg rst observed by Mooradian
[101] and has been used extensively in characterizing the carrier relaxation and the
band structure of metals [102plusmn 107] It was found that the emission peak was centred
near the interband absorption edge of the metal and therefore was attributed to direct
radiative recombination of the excited electrons in the sp band with the holes in the d
band [107] However the quantum e ciency of the photoluminescence from bulk
noble metals is very low typically of the order of 10shy [101] A theoretical model
explaining the radiative recombination in noble metals was developed by Apell and
Monreal [106] Because of the slight overlap between the sp conduction band and the
d band the luminescence band shows a Stokes shift [107] A more extensive
experimental study on the photoluminescence of copper silver and gold was carried
out by Boyd et al [103] They were able to model their experimental results and
determined the relation between the spectral peaks and the interband recombination
transitions at selected symmetry points in the Brillouin zone
Furthermore Boyd et al [103] studied the eŒect of the surface roughness on the
photoluminescence properties of noble metals The luminescence was found to be
enhanced by several orders of magnitude on rough metal surfaces which is known as
the lightning rod eŒect [103 108 109] The rough metal surface can be regarded as a
collection of randomly oriented hemispheroids of nanometre size dimension on a
smooth surface These hemispheroids show a surface plasmon resonance and therefore
the incoming and outgoing electric reg elds are amplireg ed by the local reg eld induced
around the hemispheroids by the plasmon resonances [103 108 109]
The same local reg eld eŒect is also observed in the Raman scattering from molecules
absorbed on rough surfaces of noble metals nanoparticle aggregates or single
nanoparticles [15 16 110plusmn 118] The surface-enhanced Raman scattering (SERS)
Radiati Š e non-radiati Š e and photothermal properties of gold nanocrystals 423
Figure 4 Size dependence of the luminescence properties of gold nanorods The main plotshows macr uorescencespectra of nanorodshaving mean aspect ratios of 2 plusmn 6 3 plusmn 3 and 5 plusmn 4 Themacr uorescence spectra are normalized at their respective maxima and the excitationwavelength was 480 nm The macr uorescence maximum red shifts with increasing aspectratio R This dependence is found to be linear as illustrated in the inset
signal is enhanced by several orders of magnitude While the chemical nature of the
absorbed molecule and the bonding to the metal surface plays a role in SERS [110 111]
it is also recognized that an important component of the enhanced Raman scattering
is due to the enhancement of the electromagnetic reg elds close to the nanoparticle
surface [15 16 112 113] The nanoparticles can therefore be regarded as nano-
amplireg ers and since the discovery of this eŒect SERS spectroscopy has been studied
intensively [15 16 110plusmn 118] It is a convenient tool of increasing the sensitivity of an
otherwise weak Raman signal
A similar enhancement has recently been found by our group for the luminescence
of gold nanorods [119] The luminescence e ciency is increased by six orders of
magnitude because of the lightning rod eŒect Figure 4 shows the steady-state
macr uorescence spectra of three gold nanorod samples having average aspect ratios of 2 plusmn 6
3 plusmn 3 and 5 plusmn 4 after excitation at 480 nm The spectra reveal the presence of an emission
band between 550 and 600 nm The macr uorescence maximum red shifts with increasing
nanorod aspect ratio This is illustrated in the inset of reg gure 4 where the band
maximum of the macr uorescence emission is plotted against the nanorod aspect ratio A
linear dependence was found experimentally [119] However the luminescence
quantum e ciency increases linearly with increasing square of the aspect ratio [119]
On the other hand gold nanodots with diameters of between 10 and 30 nm prepared
by the same electrochemical method do not show a comparable emission This leads
to the conclusion that the longitudinal plasmon resonance absorbing at a longer
wavelength is more eŒective in amplifying the macr uorescence intensity in gold
nanoparticles than the surface plasmon resonance of spheres This could be because
the longitudinal plasmon resonance is less damped and has a much larger oscillator
strength
Wilcoxon et al [120] reported that very small spherical gold clusters (less than 5
nm) show an emission at 440 nm when excited at 230 nm The quantum yield is
increased to 10shy plusmn 10shy amp which is comparable with the enhancement of the photo-
424 S Link and M A El-Sayed
Figure 5 Theoretical modelling of the luminescence enhancement for gold nanorods withvarious aspect ratios (a) The calculated single-photon luminescence power P
lrE
rb
lemitted from gold nanorods as a function of the emission wavelength and the nanorodaspect ratio The excitation wavelength was chosen to be 500 nm (b) The calculatedsingle-photonluminescencepower P
lrE
rb
lemitted from gold nanorods as a function of
the excitation wavelength and the nanorod aspect ratio The emission wavelength waschosen to be 650 nm
Radiati Š e non-radiati Š e and photothermal properties of gold nanocrystals 425
luminescence of gold nanorods These workers [120] showed that the luminescence is
absent in larger nanodots of 15 nm diameter and concluded that the photoluminescent
signal is aŒected by the capping ligands such as thiols or amines
In the above studies [119 120] the origin of the photoluminescence was attributed
to the radiative recombination of an electronplusmn hole pair The incident photons are
initially absorbed by the d-band electrons leading to interband transitions The
photon energy promotes these electrons from the reg lled d band to electronic states
above the Fermi level in the sp conduction band Even if the excitation is carried out
in the plasmon band rapid relaxation to the interband transition must take place
Electrons and holes relax by phonon scattering processes and some recombine
radiatively to give rise to the observed luminescence Such an intrinsic emission proreg le
is however modireg ed by the local reg eld induced around the nanoparticles owing to
excitation of the plasmon resonance The theory of the local reg eld eŒect has been
successfully applied in various cases to explain results on second-harmonic generation
[108] SERS [109] and luminescence [103] observed from rough noble metal surfaces
In order to test this mechanism for the photoluminescence enhancement in gold
nanorods we calculated the photoluminescence power of gold nanorods as a function
of the emission wavelength and the nanorod aspect ratio [119] According to the
theoretical studies of the photoinduced luminescence [103] from rough surfaces of
noble metals the incoming and outgoing reg elds are proposed to be enhanced via
coupling to the local plasmon resonances The rough surface is assumed to be a
random collection of non-interacting hemispheroids of height a and radius b The
volume is V macr $p ab The local reg eld correction factor L(x) within the spheroid is then
given by [103 109]
L(x) macrL
LR
e(x) shy i e
(x) reg 1 shy L
LRsup2 (1 shy i 4 p V ) [1 reg e
(x) reg i e
(x)]3k$ acute
(31)
where LLR
called the lightning-rod factor is dereg ned as LLR
macr 1A where
A macr1
1 reg n Q (n)Q
(n)
n macr1
[1 reg (ba)]
Q(n) macr
n
2ln 0 n shy 1
n reg 1 1 reg 1 Q (n) macr
dQ(n)
dn
From equation (31) the single-photon luminescence power Plcan be calculated [103]
for excitation and emission energies hxexc
and hxem
Plmacr b
l2 rE
r V rL(x
exc) L(x
em)r (32)
where blis a constant that includes the intrinsic luminescence spectrum of the gold and
E
is the incident electric reg eld
Assuming that the luminescence enhancement of the gold nanorods is due to the
local reg eld factor PlrE
rb
lwas calculated as a function of the gold nanorod aspect
ratio and emission wavelength The excitation wavelength was 500 nm The results of
these calculations [119] are shown in reg gure 5 (a) The resonant luminescence power
increases with increasing nanorod aspect ratio (lightning-rod eŒect) and shifts to
longer emission wavelength Furthermore note that PlrE
rb
lis of the order of 10(
426 S Link and M A El-Sayed
Both the red shift of the photoluminescence of the gold nanorods and the magnitude
of the luminescence power due to the local reg eld correction factor are in good
agreement with the experimental results [119]
PlrE
rb
lwas also calculated as a function of the excitation wavelength and the
gold nanorod aspect ratio for a reg xed volume The emission wavelength was set at 650
nm The results of this calculation are shown in reg gure 5(b) for the 200plusmn 650 nm
excitation wavelength range PlrE
rb
lis resonantly enhanced for an aspect ratio of
about 4 plusmn 5 This value of the aspect ratio depends critically on the chosen emission
wavelength Furthermore the luminescence power greatly increases with increasing
excitation wavelength
From the calculation in reg gure 5 it follows that the luminescence power increases
linearly with increasing square of the nanorod aspect ratio (or increasing square of the
length for a reg xed nanorod width) while a linear dependence on the aspect ratio is found
for the wavelength of the emission maximum These results are in good agreement with
the experimental observations This fact therefore strongly supports the assignment
of the origin of the macr uorescence from gold nanorods This also suggests that the
mechanism of the large enhancement in the luminescence e ciency is a result of the
great enhancement of the reg eld of the incoming exciting light and the outgoing emitted
light via the coupling to the surface plasmon resonance
4 Electron dynamics in gold nanoparticles probed by femtosecond transient
absorption spectroscopy
41 Introduction
In order to study the interaction between the electrons and the lattice vibrations
(phonons) in bulk materials time-resolved transmission and remacr ectivity [121plusmn 132] as
well as two-photon photoemission spectroscopies [133plusmn 138] have been used on thin
reg lms of metals and semiconductors A better understanding of the thermal and
electrical conductivity and also superconductivity was one of the goals of this research
With the advancement of ultrashort laser pulses one can selectively excite the
electrons of the metal and then follow the electronplusmn phonon coupling in real time It
was suggested [121 122] that this should in principle be possible with laser pulses
shorter than the electronplusmn phonon energy relaxation time Because of the high electron
density in metals electronplusmn electron interactions were expected to be strong enough to
thermalize the electron gas within the duration of the exciting laser pulse According
to the two-temperature model (TTM) [139] the electrons and the lattice can be treated
as two coupled subsystems The separation of the electron gas and the lattice is
justireg ed because of the large diŒerence in their heat capacities The electrons absorb
the photon energy leading to a non-equilibrium temperature diŒerence between the
electron gas and the lattice directly after the laser pulse Electronplusmn phonon collisions
then give rise to the excitation energy exchange between the electron subsystem and
the lattice (energy relaxation T) In this manner a thermal equilibrium is reached The
time evolution of the electron and the lattice temperatures are expressed math-
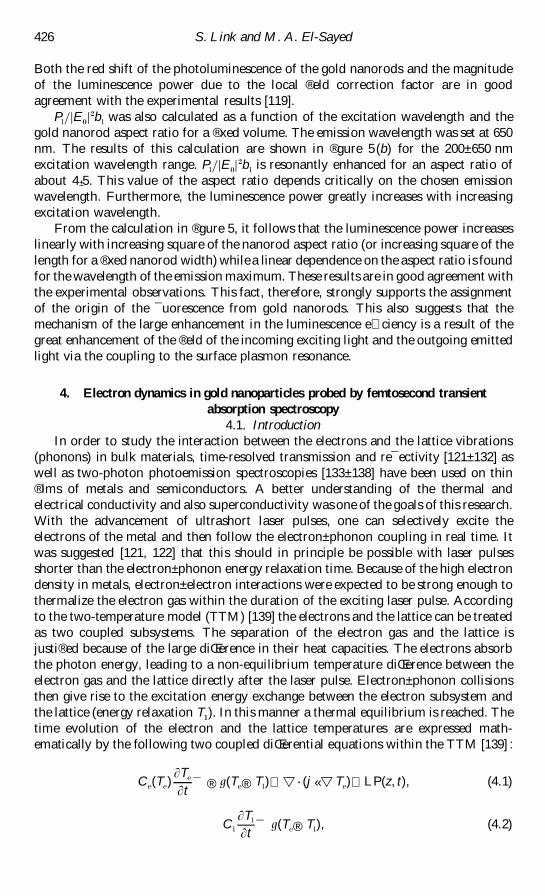
ematically by the following two coupled diŒerential equations within the TTM [139]
Ce(T
e)brvbarT
e
brvbartmacr reg g(T
ereg Tl) shy x[(j laquo x T
e) shy LP(z t) (41)
Cl
brvbarTl
brvbartmacr g(T
ereg Tl) (42)
Radiati Š e non-radiati Š e and photothermal properties of gold nanocrystals 427
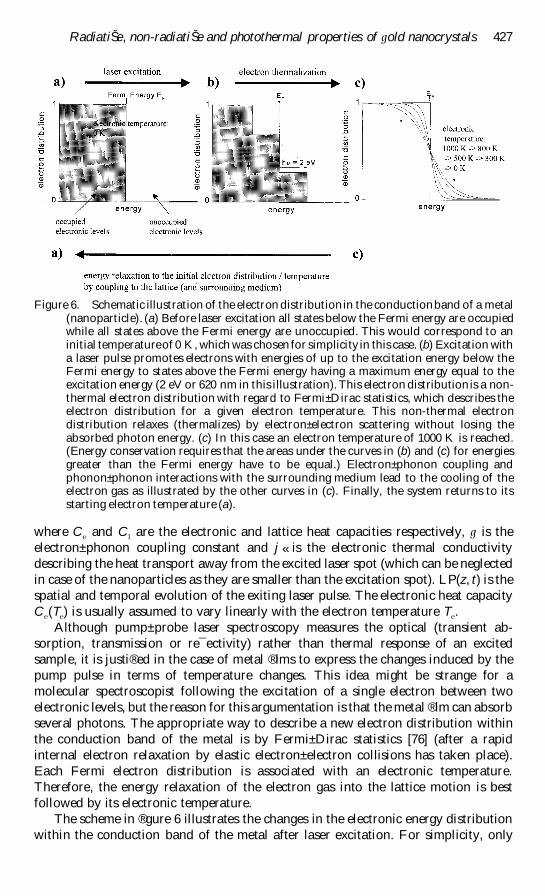
Figure 6 Schematic illustration of the electron distributionin the conductionband of a metal(nanoparticle) (a) Before laser excitation all states below the Fermi energy are occupiedwhile all states above the Fermi energy are unoccupied This would correspond to aninitial temperatureof 0 K which was chosen for simplicity in this case (b) Excitation witha laser pulse promotes electrons with energies of up to the excitation energy below theFermi energy to states above the Fermi energy having a maximum energy equal to theexcitation energy (2 eV or 620 nm in this illustration) This electron distribution is a non-thermal electron distribution with regard to Fermiplusmn Dirac statistics which describes theelectron distribution for a given electron temperature This non-thermal electrondistribution relaxes (thermalizes) by electronplusmn electron scattering without losing theabsorbed photon energy (c) In this case an electron temperature of 1000 K is reached(Energy conservation requires that the areas under the curves in (b) and (c) for energiesgreater than the Fermi energy have to be equal) Electronplusmn phonon coupling andphononplusmn phonon interactions with the surrounding medium lead to the cooling of theelectron gas as illustrated by the other curves in (c) Finally the system returns to itsstarting electron temperature (a)
where Ce
and Cl
are the electronic and lattice heat capacities respectively g is the
electronplusmn phonon coupling constant and j laquo is the electronic thermal conductivity
describing the heat transport away from the excited laser spot (which can be neglected
in case of the nanoparticles as they are smaller than the excitation spot) LP(z t) is the
spatial and temporal evolution of the exiting laser pulse The electronic heat capacity
Ce(T
e) is usually assumed to vary linearly with the electron temperature T
e
Although pumpplusmn probe laser spectroscopy measures the optical (transient ab-
sorption transmission or remacr ectivity) rather than thermal response of an excited
sample it is justireg ed in the case of metal reg lms to express the changes induced by the
pump pulse in terms of temperature changes This idea might be strange for a
molecular spectroscopist following the excitation of a single electron between two
electronic levels but the reason for this argumentation is that the metal reg lm can absorb
several photons The appropriate way to describe a new electron distribution within
the conduction band of the metal is by Fermiplusmn Dirac statistics [76] (after a rapid
internal electron relaxation by elastic electronplusmn electron collisions has taken place)
Each Fermi electron distribution is associated with an electronic temperature
Therefore the energy relaxation of the electron gas into the lattice motion is best
followed by its electronic temperature
The scheme in reg gure 6 illustrates the changes in the electronic energy distribution
within the conduction band of the metal after laser excitation For simplicity only
428 S Link and M A El-Sayed
intraband excitations are considered in this picture Furthermore it is assumed that
the experiment is carried out at an initial temperature of 0 K The electron distribution
f shown in reg gure 6(a) is calculated according to the Fermiplusmn Dirac statistics and has the
mathematical form [76]
f macr1
1 shy exp (E reg EFk T )
(43)
where k T EF
and E are the Boltzmann constant the temperature the Fermi energy
and the energy of the electronic energy levels respectively
Excitation with a wavelength of 620 nm corresponds to a photon energy of 2 plusmn 0 eV
This excites electrons having an energy of less than or equal to 2 plusmn 0 eV below the Fermi
level to electronic levels up to 2 eV above the Fermi level The corresponding electron
distribution is plotted in reg gure 6(b) This electron distribution is not the equilibrium
distribution according to the occupation dictated by the Fermiplusmn Dirac statistics for
fermions Electronplusmn electron scattering within the electron gas occurs until a new
Fermi electron distribution with a higher electron temperature is reached as illustrated
in reg gure 6(c) This leads to an internal electron thermalization [127 128] Electronplusmn
electron interactions are elastic and the overall energy is conserved during this reg rst
relaxation process External thermalization [127 128] with the phonon bath will then
initially lead to a temperature equilibration between the electron and the lattice
subsystems As the excited electrons above the Fermi level now lose their energy to the
phonons the Fermi distribution narrows until a situation shown in reg gure 6(a) is
reached assuming that there is also heat release to the surrounding system During the
external thermalization the temperature of the electron gas (and the lattice) decreases
steadily and the whole system returns to its original (ground) state prior to laser
excitation
Interband transitions lead to a very similar picture especially if one remembers that
recombination of the holes in the low-lying d band with any of the excited electrons
above the Fermi level or the unexcited electrons below the Fermi level occurs on the
tens of femtoseconds time scale [140plusmn 142] that is faster than or comparable with the
duration of the exciting laser pulse It is the high density of the charge carriers in the
conduction band that leads to fast interband relaxation If one assumes for the
interband relaxation that an Auger-type recombination mechanism process takes
place then highly excited electrons are present within the conduction shortly after the
excitation pulse These electrons have an average excess energy above the Fermi level
equal to the exciting photon energy as the holes in the d band have already been reg lled
by the initial electronplusmn electron scattering Although interband transitions might
therefore complicate the initial relaxation dynamics they should not change the
overall picture
Typical electronplusmn phonon relaxation times of the order of a few picoseconds were
measured for thin gold reg lms by time-resolved transmissivity and remacr ectivity [121plusmn 132]
as well as two-photon photoemission spectroscopy [133plusmn 138] using femtosecond laser
pulses By measuring the transient optical response of metal nanoparticles the eŒect of
size on the electronplusmn phonon coupling can directly be analysed The reduction in the
size and dimensionality of the material introduces new boundaries as in the
nanoparticle surfaces Enhanced electronplusmn surface scattering [74 75] was already
discussed as a mechanism for the dephasing of the coherent plasmon oscillation and
could also be important for the energy relaxation of hot electrons The reduction in the
density of electron and phonon states could further alter the relaxation dynamics in
Radiati Š e non-radiati Š e and photothermal properties of gold nanocrystals 429
these zero-dimensional dots However in the size range of gold nanoparticles
discussed so far (10plusmn 100 nm) the bulk gold band structure of the nanoparticles is
expected to be well developed The average energy spacing between adjacent energy
levels within the conduction band is small compared with the thermal energy
Quantum size eŒects in the relaxation dynamics are therefore expected to occur only
in very small gold clusters which lack an intense plasmon absorption The presence of
a well developed plasmon band can however be very advantageous in following the
optical response of excited metal nanoparticles as has been shown in many studies
[143plusmn 167] Furthermore for about 200 000 atoms in a 20 nm gold nanoparticle and
hence with many conduction electrons the same general theory (many-electron
excitation described by an eŒective electron temperature) as applied for metal reg lms
[121plusmn 138] can be used This especially holds because of the large extinction coe cients
of the gold nanoparticles Experimentally a transient broadening of the surface
plasmon absorption is observed which results in a bleach at the plasmon absorption
band maximum with two positive absorption features at higher and lower energies
The rate of the bleach recovery directly monitors the rate of the electronplusmn electron
electronplusmn phonon and phononplusmn phonon dynamics which will be illustrated in more
detail below
42 Theoretical modelling of the transient optical response
Theoretically the broadening of the plasmon band can be related to the changes
in the real and imaginary parts of the complex dielectric function [124 127 128 147
165 166] Changes in e
and ewill aŒect the plasmon absorption as can be shown from
equation (23) The changes in the real and imaginary parts of the dielectric function
can be related to the changes in the electron distribution function as suggested in a
model developed by Rosei et al [168 169] for continuous-wave thermomodulation
experiments Using the constant-matrix approximation the change in the imaginary
part of the dielectric function is given by [128]
D epound
1
(hm) amp D(E hm) D q dE (44)
where D(E hm) is the joint density of states with respect to the energy E of the reg nal state
and D q denotes the change in the electron distribution f as given by equation (43)
D(E hm) is calculated assuming parabolic band structures for the d band and
conduction band in the vicinity of the L point of the Brillouin zone [168] This
determines D efor a given change D q in the electron distribution The change D q in the
electron distribution for a thermalized electron gas is calculated from the diŒerence
between the two Fermi electron distributions at room temperature and at a higher
temperature corresponding to a certain laser excitation The change D ein the real part
of the dielectric constant is then computed from D e
using the Kramersplusmn Kronig
relationship [76]
D e(hm) macr
2
pP 0 amp hm laquo D e
(hm laquo )
(hm laquo )reg (hm)d(hm laquo ) 1 (45)
where P denotes a Cauchy principal value integral which extends over the whole
frequency range
The diŒerential transmission D TT of the gold nanoparticles at low excitation
levels is approximately equal to the change in absorption and can be expressed as
430 S Link and M A El-Sayed
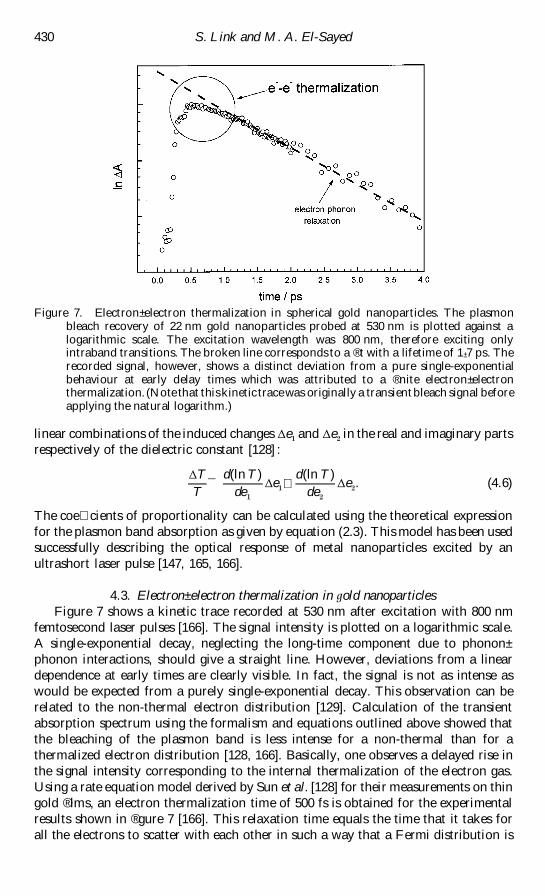
Figure 7 Electronplusmn electron thermalization in spherical gold nanoparticles The plasmonbleach recovery of 22 nm gold nanoparticles probed at 530 nm is plotted against alogarithmic scale The excitation wavelength was 800 nm therefore exciting onlyintraband transitions The broken line corresponds to a reg t with a lifetime of 1 plusmn 7 ps Therecorded signal however shows a distinct deviation from a pure single-exponentialbehaviour at early delay times which was attributed to a reg nite electronplusmn electronthermalization (Note that this kinetic trace was originally a transientbleach signal beforeapplying the natural logarithm)
linear combinations of the induced changes D eand D e
in the real and imaginary parts
respectively of the dielectric constant [128]
D T
Tmacr
d(ln T )
de
D eshy
d(ln T )
de
D e (46)
The coe cients of proportionality can be calculated using the theoretical expression
for the plasmon band absorption as given by equation (23) This model has been used
successfully describing the optical response of metal nanoparticles excited by an
ultrashort laser pulse [147 165 166]
43 Electronplusmn electron thermalization in gold nanoparticles
Figure 7 shows a kinetic trace recorded at 530 nm after excitation with 800 nm
femtosecond laser pulses [166] The signal intensity is plotted on a logarithmic scale
A single-exponential decay neglecting the long-time component due to phononplusmn
phonon interactions should give a straight line However deviations from a linear
dependence at early times are clearly visible In fact the signal is not as intense as
would be expected from a purely single-exponential decay This observation can be
related to the non-thermal electron distribution [129] Calculation of the transient
absorption spectrum using the formalism and equations outlined above showed that
the bleaching of the plasmon band is less intense for a non-thermal than for a
thermalized electron distribution [128 166] Basically one observes a delayed rise in
the signal intensity corresponding to the internal thermalization of the electron gas
Using a rate equation model derived by Sun et al [128] for their measurements on thin
gold reg lms an electron thermalization time of 500 fs is obtained for the experimental
results shown in reg gure 7 [166] This relaxation time equals the time that it takes for
all the electrons to scatter with each other in such a way that a Fermi distribution is
Radiati Š e non-radiati Š e and photothermal properties of gold nanocrystals 431
reached This is of course longer than a scattering event involving only two electrons
which is of the order of 10 fs according to the Fermi-liquid theory [170] The reason
why the eŒect of these processes on the transient absorption is rather small (compared
with theoretical results) and why it is only detectable at low pump powers [166] is the
fact that processes outlined in reg gure 6 (electronplusmn electron electronplusmn phonon and
phononplusmn phonon scattering) are not really sequential processes Electronplusmn phonon
coupling will relax the hot initial electron distribution before an equilibrium Fermi
electron distribution can be fully established This is however taken into account in
the rate equation with which a thermalization time of 500 fs was calculated [128 166]
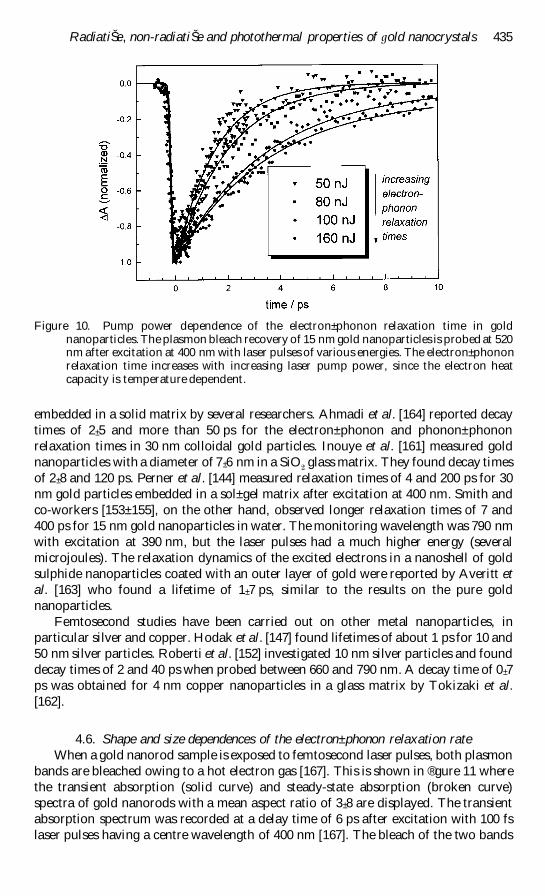
44 Electronplusmn phonon relaxation in gold nanoparticles
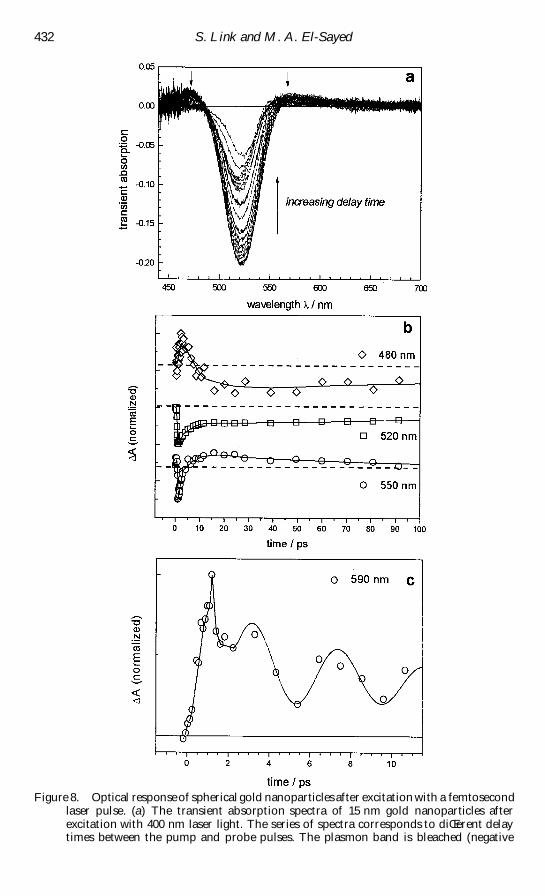
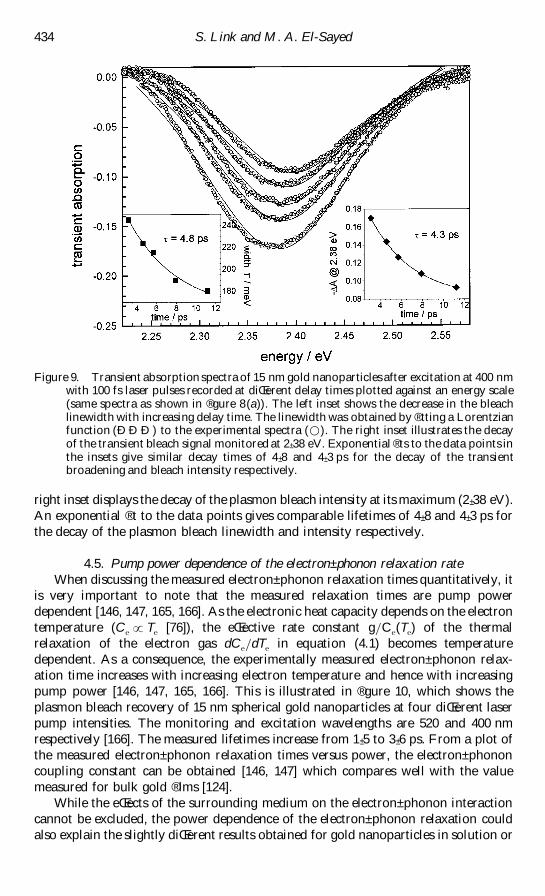
Figure 8(a) shows the transient absorption spectra of 15 nm gold particles at
diŒerent delay times after the excitation pulse [166] The excitation wavelength used
for these studies was 400 nm and was produced by second-harmonic generation using
the fundamental of an amplireg ed titanium sapphire laser system [166] The transient
absorption spectra are obtained by using a white-light continuum laser pulse with and
without pulsed excitation at diŒerent delay times The diŒerence spectrum between the
absorption of the gold nanoparticles after excitation and their `ground-state rsquo
(unexcited) absorption is then calculated as a function of time The plasmon band
bleaches at its maximum corresponding to a higher transmission of light of the excited
solution Two weaker absorption bands are also visible at lower and higher energies
than the plasmon band maximum [143plusmn 145 164plusmn 166] These spectral features are due
to a broadening of the surface plasmon resonance at higher electronic temperatures
Compared with the ground-state absorption a broader but less intense plasmon
absorption at a higher electronic temperature after laser excitation results in a bleach
and two positive absorptions in the transient spectrum (diŒerence spectrum) The fact
that the important parameter is the electronic temperature explains the observation
that the optical response is independent of the excitation wavelength [166] At 400 nm
or shorter wavelengths than the plasmon absorption interband transitions from the d
band to above the Fermi level are excited Excitation at the plasmon resonance will
cause the oscillation of the conduction electrons and basically results in the collective
excitation of all the conduction electrons This could be regarded as intraband
transitions which are also excited to the red of the plasmon band (In gold
nanoparticles of the size under study the onset for intraband transition coincides with
the plasmon maximum at about 2 plusmn 4 eV [171]) All these excitation processes result in
heating of the electron gas [166]
The laser-induced optical changes decay as the electronic temperature decreases
and thermal equilibration between the electrons and the lattice is established [144 147
164] The absorbed laser energy is then released to the surrounding medium by
phononplusmn phonon interactions [144 147 164] Measuring the bleach recovery as a
function of time gives the electronplusmn phonon and phononplusmn phonon relaxation times
Figure 8(b) shows such a kinetic trace The observation wavelength is 520 nm
coinciding with the plasmon band bleach maximum where the transient signal is most
sensitive The data in reg gure 8(b) [166] were obtained from the transient absorption
spectra recorded with a charge-coupled device camera by extracting the time
dependence at a certain wavelength from the measured spectra The plasmon bleach
recovery can be reg tted to a biexponential decay function giving relaxation times of 3 plusmn 4
and about 100 ps The reg rst component corresponds to the electronplusmn phonon
interactions [164] while the long-time component is the energy relaxation (phononplusmn
432 S Link and M A El-Sayed
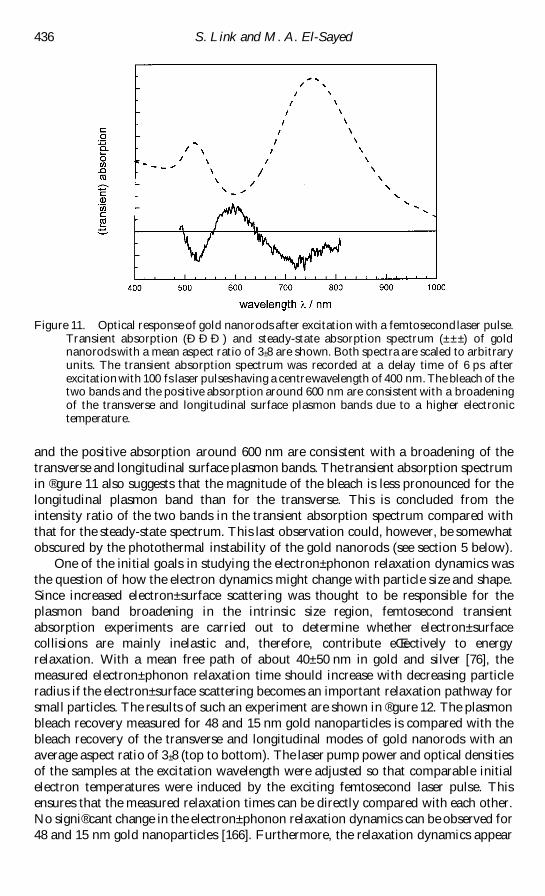
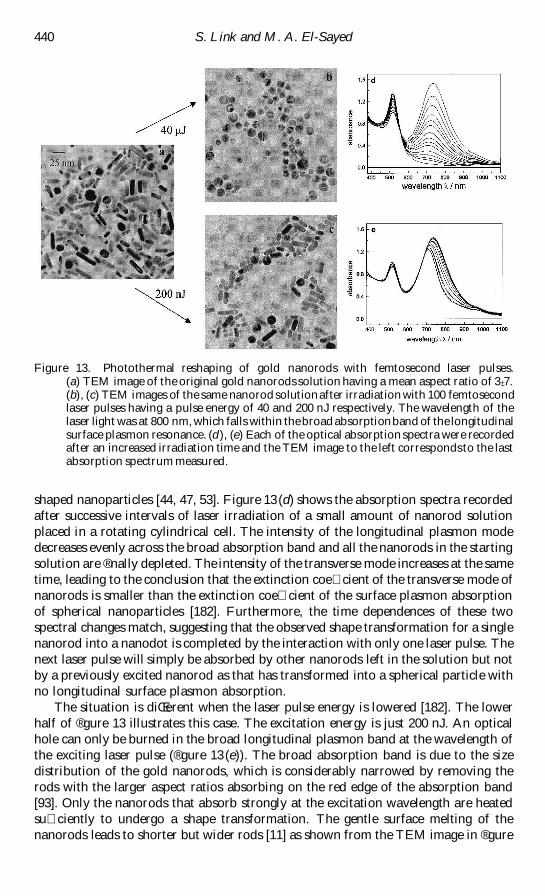
Figure 8 Optical response of spherical gold nanoparticles after excitation with a femtosecondlaser pulse (a) The transient absorption spectra of 15 nm gold nanoparticles afterexcitation with 400 nm laser light The series of spectra corresponds to diŒerent delaytimes between the pump and probe pulses The plasmon band is bleached (negative
Radiati Š e non-radiati Š e and photothermal properties of gold nanocrystals 433
phonon interactions [164]) of the hot lattice to the surrounding medium The latter
reg nally leads to complete cooling of the whole nanoparticle Kinetic traces for other
wavelengths are also shown in reg gure 8(b) At 480 nm the signal reg rst shows absorption
and then bleaches at later times This can be explained by a red shift of the plasmon
resonance [147] due to a volume expansion of the hot particles and hence a lower
electron density and lower plasmon frequency (see section 2) Correspondingly the
transient absorption signal at 550 nm changes from a bleach into an absorption at a
comparable time delay of about 10 ps However the change in the absorption signal
at 550 nm not only could result from a red shift but also could be due to the narrowing
of the plasmon bleach as the Fermi electron distribution cools
A closer look at the kinetic traces at a longer wavelength than the plasmon band
maximum reveals that the transient absorption signal oscillates with a period of about
5 ps (reg gure 8(c)) Del Fatti et al [157 158] and also Hartland and co-workers [148
149] have shown that these quantum beats are indeed real and result from the low-
frequency acoustic breathing modes of the hot nanoparticles The acoustic breathing
modes are impulsively excited by the rapid heating of the particle lattice after laser
excitation [148 149 157 158] The volume of the nanoparticles increases and
decreases periodically owing to the excitation of these modes This in turn leads to a
shift in the plasmon band maximum as the free-electron density changes with the
volume A volume expansion causes a drop in the free-electron density and a red shift
of the plasmon which is associated with an increase in the plasmon bleach intensity at
low energies At high energies the acoustic breathing causes an oscillation of the
transient absorption which is 180 deg out of phase with respect to the signal observed at
low energies [158] It was further found that the frequencies of the acoustic modes are
inversely proportional to the nanoparticle radius [148 149 157 158]
Physically this transient behaviour of the plasmon band broadening is also
associated with a faster dephasing time T
of the coherent plasmon oscillation
[143plusmn 145] At higher temperatures the occupation of higher electronic states leads to
an increased electron scattering rate as known from the Fermi-liquid theory [170] and
thus to an increased damping of the plasmon oscillation Perner et al [144] found an
increase in the plasmon bandwidth of gold nanoparticles embedded in a solplusmn gel matrix
by 120 meV and calculated an average electronplusmn electron scattering rate of (10 fs)shy for
a hot electron distribution at 4000 K The decay of the transient plasmon band
broadening follows the same kinetics as the decay of the bleach intensity This is
illustrated in reg gure 9 for 15 nm gold nanoparticles The spectra are reg tted to a
Lorentzian line shape The left inset in reg gure 8 shows the linewidth decay while the
absorption)and two positive absorption bands are visible at higher and lower energies asindicated by the arrows The transient signal is due to a broadening of the plasmonresonance at higher electronic temperatures (b) The temporal evolution of the recordedspectra at certain wavelengths ((V) 480 nm () 520 nm (D) 550 nm) The signalrecovers by electronplusmn phonon coupling and phononplusmn phonon relaxation with molecules inthe surrounding medium These two processes are of the order of 1plusmn 4 and 100 psrespectively (c) The temporal evolution of the transient absorption signal at 590 nm isshown on a shorter time scale The oscillation is due to the low-frequency acousticbreathing modes of the host nanoparticles These modes are impulsively excited by therapid heating of the particle lattice and correspondto an oscillatory change in the volumeof the hot nanoparticles The line in (c) is not a reg t to the data points but serves as a visualaid showing the beat signal All kinetic traces in this reg gure were obtaineddirectly from themeasured transient absorption spectra in (a)
434 S Link and M A El-Sayed
Figure 9 Transient absorption spectra of 15 nm gold nanoparticles after excitation at 400 nmwith 100 fs laser pulses recorded at diŒerent delay times plotted against an energy scale(same spectra as shown in reg gure 8(a)) The left inset shows the decrease in the bleachlinewidth with increasing delay time The linewidth was obtained by reg tting a Lorentzianfunction (ETH ETH ETH ) to the experimental spectra (D) The right inset illustrates the decayof the transient bleach signal monitored at 2 plusmn 38 eV Exponential reg ts to the data points inthe insets give similar decay times of 4 plusmn 8 and 4 plusmn 3 ps for the decay of the transientbroadening and bleach intensity respectively
right inset displays the decay of the plasmon bleach intensity at its maximum (2 plusmn 38 eV)
An exponential reg t to the data points gives comparable lifetimes of 4 plusmn 8 and 4 plusmn 3 ps for
the decay of the plasmon bleach linewidth and intensity respectively
45 Pump power dependence of the electronplusmn phonon relaxation rate
When discussing the measured electronplusmn phonon relaxation times quantitatively it
is very important to note that the measured relaxation times are pump power
dependent [146 147 165 166] As the electronic heat capacity depends on the electron
temperature (Cepound T
e[76]) the eŒective rate constant gC
e(T
e) of the thermal
relaxation of the electron gas dCedT
ein equation (41) becomes temperature
dependent As a consequence the experimentally measured electronplusmn phonon relax-
ation time increases with increasing electron temperature and hence with increasing
pump power [146 147 165 166] This is illustrated in reg gure 10 which shows the
plasmon bleach recovery of 15 nm spherical gold nanoparticles at four diŒerent laser
pump intensities The monitoring and excitation wavelengths are 520 and 400 nm
respectively [166] The measured lifetimes increase from 1 plusmn 5 to 3 plusmn 6 ps From a plot of
the measured electronplusmn phonon relaxation times versus power the electronplusmn phonon
coupling constant can be obtained [146 147] which compares well with the value
measured for bulk gold reg lms [124]
While the eŒects of the surrounding medium on the electronplusmn phonon interaction
cannot be excluded the power dependence of the electronplusmn phonon relaxation could
also explain the slightly diŒerent results obtained for gold nanoparticles in solution or
Radiati Š e non-radiati Š e and photothermal properties of gold nanocrystals 435
Figure 10 Pump power dependence of the electronplusmn phonon relaxation time in goldnanoparticlesThe plasmon bleach recovery of 15 nm gold nanoparticles is probed at 520nm after excitation at 400 nm with laser pulses of various energies The electronplusmn phononrelaxation time increases with increasing laser pump power since the electron heatcapacity is temperature dependent
embedded in a solid matrix by several researchers Ahmadi et al [164] reported decay
times of 2 plusmn 5 and more than 50 ps for the electronplusmn phonon and phononplusmn phonon
relaxation times in 30 nm colloidal gold particles Inouye et al [161] measured gold
nanoparticles with a diameter of 7 plusmn 6 nm in a SiOglass matrix They found decay times
of 2 plusmn 8 and 120 ps Perner et al [144] measured relaxation times of 4 and 200 ps for 30
nm gold particles embedded in a solplusmn gel matrix after excitation at 400 nm Smith and
co-workers [153plusmn 155] on the other hand observed longer relaxation times of 7 and
400 ps for 15 nm gold nanoparticles in water The monitoring wavelength was 790 nm
with excitation at 390 nm but the laser pulses had a much higher energy (several
microjoules) The relaxation dynamics of the excited electrons in a nanoshell of gold
sulphide nanoparticles coated with an outer layer of gold were reported by Averitt et
al [163] who found a lifetime of 1 plusmn 7 ps similar to the results on the pure gold
nanoparticles
Femtosecond studies have been carried out on other metal nanoparticles in
particular silver and copper Hodak et al [147] found lifetimes of about 1 ps for 10 and
50 nm silver particles Roberti et al [152] investigated 10 nm silver particles and found
decay times of 2 and 40 ps when probed between 660 and 790 nm A decay time of 0 plusmn 7
ps was obtained for 4 nm copper nanoparticles in a glass matrix by Tokizaki et al
[162]
46 Shape and size dependences of the electronplusmn phonon relaxation rate
When a gold nanorod sample is exposed to femtosecond laser pulses both plasmon
bands are bleached owing to a hot electron gas [167] This is shown in reg gure 11 where
the transient absorption (solid curve) and steady-state absorption (broken curve)
spectra of gold nanorods with a mean aspect ratio of 3 plusmn 8 are displayed The transient
absorption spectrum was recorded at a delay time of 6 ps after excitation with 100 fs
laser pulses having a centre wavelength of 400 nm [167] The bleach of the two bands
436 S Link and M A El-Sayed
Figure 11 Optical response of gold nanorods after excitation with a femtosecondlaser pulseTransient absorption (ETH ETH ETH ) and steady-state absorption spectrum (plusmn plusmn plusmn ) of goldnanorods with a mean aspect ratio of 3 plusmn 8 are shown Both spectra are scaled to arbitraryunits The transient absorption spectrum was recorded at a delay time of 6 ps afterexcitation with 100 fs laser pulses having a centrewavelength of 400 nm The bleach of thetwo bands and the positive absorption around 600 nm are consistent with a broadeningof the transverse and longitudinal surface plasmon bands due to a higher electronictemperature
and the positive absorption around 600 nm are consistent with a broadening of the
transverse and longitudinal surface plasmon bands The transient absorption spectrum
in reg gure 11 also suggests that the magnitude of the bleach is less pronounced for the
longitudinal plasmon band than for the transverse This is concluded from the
intensity ratio of the two bands in the transient absorption spectrum compared with
that for the steady-state spectrum This last observation could however be somewhat
obscured by the photothermal instability of the gold nanorods (see section 5 below)
One of the initial goals in studying the electronplusmn phonon relaxation dynamics was
the question of how the electron dynamics might change with particle size and shape
Since increased electronplusmn surface scattering was thought to be responsible for the
plasmon band broadening in the intrinsic size region femtosecond transient
absorption experiments are carried out to determine whether electronplusmn surface
collisions are mainly inelastic and therefore contribute eŒectively to energy
relaxation With a mean free path of about 40plusmn 50 nm in gold and silver [76] the
measured electronplusmn phonon relaxation time should increase with decreasing particle
radius if the electronplusmn surface scattering becomes an important relaxation pathway for
small particles The results of such an experiment are shown in reg gure 12 The plasmon
bleach recovery measured for 48 and 15 nm gold nanoparticles is compared with the
bleach recovery of the transverse and longitudinal modes of gold nanorods with an
average aspect ratio of 3 plusmn 8 (top to bottom) The laser pump power and optical densities
of the samples at the excitation wavelength were adjusted so that comparable initial
electron temperatures were induced by the exciting femtosecond laser pulse This
ensures that the measured relaxation times can be directly compared with each other
No signireg cant change in the electronplusmn phonon relaxation dynamics can be observed for
48 and 15 nm gold nanoparticles [166] Furthermore the relaxation dynamics appear
Radiati Š e non-radiati Š e and photothermal properties of gold nanocrystals 437
Figure 12 Size and shape dependences of the electronplusmn phonon relaxation time Plasmonbleach recovery measured for 48 and 15 nm gold nanoparticles and for the transverse andlongitudinal modes of gold nanorods with an average aspect ratio of 3 plusmn 8 (from top tobottom) The laser pump power and optical densities of the samples at the excitationwavelength were adjusted so that comparable initial electron temperatures were inducedby the exciting femtosecond laser pulse The results show that the measured electronplusmnphonon relaxation times are independent of particle size and shape eliminating theinmacr uence of electronplusmn surface scattering as a dominant energy relaxation pathway
to be independent of the particle shape and the specireg c plasmon band mode
(transverse or longitudinal) as also shown in reg gure 12 [167] In summary these
experimental results show that the measured electronplusmn phonon relaxation times are
independent of particle size and shape for gold in the investigated size range
eliminating the inmacr uence of electronplusmn surface scattering as a dominant energy
relaxation pathway
Ahmadi et al [165] also observed no size dependence of the electronplusmn phonon
relaxation for 1 plusmn 9 2 plusmn 6 and 3 plusmn 2 nm thiol-passivated gold nanocrystals which were
compared with the measured relaxation dynamics of 30 nm colloidal gold nano-
particles prepared by the citrate method The spectral changes in the transient
absorption signal were attributed to a lower density of electronic states in the very
small molecular-like nanoparticles In agreement with these results Hodak et al [149]
reported that the electronplusmn phonon coupling constant (and hence the electronplusmn phonon
relaxation time) is independent of particle size for gold nanoparticles in the size range
between 4 and 120 nm They also found no change in the electron dynamics measured
in 10 and 50 nm silver particles [147] Hamanaka et al [156] reported that the
electronplusmn phonon coupling constant and the electronic and lattice specireg c heats are size
independent for silver nanocrystals with a diameter of more than 6 nm They observed
a decay of the plasmon band broadening with relaxation times of 2plusmn 3 and 200 ps On
the other hand Stella et al [172 173] reported a size-dependent electronplusmn surface
interaction for 2 4 and 6 nm tin particles embedded in an AlO
$matrix by femtosecond
transient remacr ectivity measurements They measured decreasing lifetimes with
438 S Link and M A El-Sayed
decreasing size corresponding to an increase in electronplusmn surface scattering in the tin
nanoparticles where the mean free path is 4 plusmn 4 nm The same workers also obtained a
size dependence of the hot electron relaxation time for solid and liquid gallium
nanoparticles which had mean diameters of 5 7 and 9 nm [174] Del Fatti et al [159]
reported a decrease in the electronplusmn phonon relaxation times from 800 to 500 fs for
silver nanoparticles in a glass matrix as the size is reduced from 30 nm to below 8 nm
This size dependence of the electronplusmn phonon relaxation was also attributed to an
enhanced inelastic electronplusmn surface scattering Smith et al [155] compared 15 nm gold
nanoparticles with Au$
and Auampamp
clusters They also found a size dependence and
proposed a model in which the relaxation dynamics of the photoexcited electron gas
are described by two competing processes Electronplusmn phonon coupling decreases and
electronplusmn surface scattering increases with decreasing particle size As the two processes
compete with each other they determine the measured lifetime
In recent work Hodak et al [175] were able to explain the diŒerence in the size
dependence of the electronplusmn phonon relaxation in diŒerent metallic nanoparticles
Based on a quantum kinetic treatment of the electronplusmn surface coupling developed by
Belotskii et al [176 177] they calculated the contribution of the electronplusmn surface
coupling constant to the total (bulk) coupling constant They found that the excitation
of capillary and acoustic surface modes by the scattering of the electrons with the
particle surface accounts for less than 10 of the electron energy loss in gold
nanoparticles as small as 2 plusmn 6 nm However the relative magnitude of the electronplusmn
surface coupling constant compared with the total electronplusmn phonon coupling constant
depends on the ratio of the electron density to the metal density and therefore on the
specireg c metal The excitation of surface vibrations is suppressed in nanoparticles
consisting of heavy atoms such as gold as the electrons scatter rather elastically In
nanoparticles made of lighter atoms with more valence electrons contributing to the
conduction band a size-dependent energy relaxation becomes possible via electronplusmn
surface interactions [175] Using the same model Nisoli et al [174] were able to
account completely for the size dependence of the electronplusmn phonon relaxation in
gallium nanoparticles which consist of lighter atoms and a higher electron density
5 Photothermal laser-induced shape transformation of gold nanoparticles
Electronplusmn phonon coupling leads to thermal equilibration between the electrons
and the lattice after selective excitation of the electron gas with a laser pulse as already
discussed in detail in section 4 It was also mentioned that electron temperatures of
several thousand kelvins are easily reached even with excitation powers as low as 100
nJ or typical macr uences on the order of 1 mJ cmshy corresponding to a tightly focused
beam with a spot size of about 100plusmn 200 l m [144 166] Because of the diŒerence in heat
capacities [76] the change in the lattice temperature is only on the order of a few tens
of degrees This is no longer the case when the energy of the excitation pulse is
increased to several microjoules (with no change in the spot size) The temperature of
the nanoparticle lattice can then reach the melting temperature of the respective
material In several cases size [178plusmn 181] and shape [182plusmn 185] changes have been
observed for nanoparticles heated by laser exposure in colloidal solutions as well as in
a solid glass matrix Usually TEM is used to analyse the reg nal shape of the irradiation
product which is then compared with the starting material The optical absorption
spectrum of the studied nanoparticles in colloidal or micellar solution can also be a
very good indication of laser-induced structural changes as the plasmon resonance
Radiati Š e non-radiati Š e and photothermal properties of gold nanocrystals 439
depends on particle size and shape (see section 2) While lasers have been used in
the production of nanoparticles [100 185plusmn 190] the detailed study of the laser-induced
nuclear changes of nanoparticles might allow one to shape the particles after
production in a controlled manner independent of the synthetic method In this way
the discussion below might reg nd many parallels in the broad reg eld of laser ablation and
processing of bulk materials or thin reg lms [191plusmn 197]
In the case of spherical nanoparticles Koda and co-workers [178 179] reported
that irradiation of gold particles in aqueous solution with 532 nm nanosecond laser
pulses leads to fragmentation of the nanodots This was explained in terms of the slow
heat release of the deposited laser energy into the surrounding solvent which leads to
melting and even vaporization of the nanoparticles as estimated from the deposited
laser energy and the absorption cross-section Since the nanoparticles cannot cool as
fast as they are heated they fragment into smaller nanodots The size reduction of
silver nanoparticles in a glass matrix induced by excimer laser irradiation at 248 nm
was also explained by a thermal model [180] On the other hand in a study of colloidal
silver nanoparticles which were irradiated with 355 nm picosecond laser pulses
Kamat et al [181] proposed that a transient aggregate is formed via photoejection of
electrons after laser excitation which is considered to be a precursor for complete
fragmentation of the nanoparticles Hence the initial ejection of photoelectrons
causes the particles to become positively charged and the repulsion between the
charges then leads to fragmentation
While high-energy laser pulses can induce a size reduction of nanodots a more
gentle melting of the spherical nanoparticles with lower pulse energies might remain
unnoticed as the most thermodynamically favourable shape is the sphere itself Even
if the melting temperature of the material is reached and the nanoparticle becomes a
liquid droplet no shape transformation will occur in an isotropic medium However
irradiation of gold nanorods with femtosecond laser pulses has given some interesting
results [178] It was found that the nanorods melt into nanodots in solution after
excitation with femtosecond laser pulses having pulse energies in the microjoule range
(less than 10 mJ cmshy ) This process is independent of the excitation wavelength
similar to the bleaching of the surface plasmon resonance as the absorbed photon
energy is transferred into lattice vibrations on the picosecond time scale by
electronplusmn phonon relaxation processes independent of the electronic transitions
involved initially (see discussion in section 4) Figures 13 (a) and (b) show the TEM
images of a gold nanorod sample with a mean aspect ratio of 37 before and after
irradiation respectively with 800 nm femtosecond laser pulses having a pulse energy of
40 microJ While some nanodots are already present in the starting solution as impurities
[44 53] the reg nal irradiation product consists of only spherical nanoparticles The
statistical size and shape analysis of the particles in these two solutions further reveals
that the average volume of the nanodots in reg gure 13 (b) is comparable with the average
volume of the nanorods in the original starting solution in reg gure 13(a) [182] This
conreg rms that it is possible to melt the metal nanoparticles in aqueous solution by
selectively exciting the electron gas of the metal nanoparticles with an intense
femtosecond laser pulse and without fragmenting them by controlling the laser pulse
energy
The nanorodplusmn nanodot shape transformation in solution is also remacr ected in the
optical absorption data While the transverse mode of the surface plasmon oscillation
of gold nanorods coincides spectrally with the surface plasmon absorption of
nanodots the longitudinal mode is red-shifted and therefore characteristic for rod-
440 S Link and M A El-Sayed
Figure 13 Photothermal reshaping of gold nanorods with femtosecond laser pulses(a) TEM image of the original gold nanorods solution having a mean aspect ratio of 3 plusmn 7(b) (c) TEM images of the same nanorod solutionafter irradiation with 100 femtosecondlaser pulses having a pulse energy of 40 and 200 nJ respectively The wavelength of thelaser light was at 800 nm which falls within the broad absorptionband of the longitudinalsurface plasmon resonance (d ) (e) Each of the optical absorption spectra were recordedafter an increased irradiation time and the TEM image to the left correspondsto the lastabsorption spectrum measured
shaped nanoparticles [44 47 53] Figure 13(d) shows the absorption spectra recorded
after successive intervals of laser irradiation of a small amount of nanorod solution
placed in a rotating cylindrical cell The intensity of the longitudinal plasmon mode
decreases evenly across the broad absorption band and all the nanorods in the starting
solution are reg nally depleted The intensity of the transverse mode increases at the same
time leading to the conclusion that the extinction coe cient of the transverse mode of
nanorods is smaller than the extinction coe cient of the surface plasmon absorption
of spherical nanoparticles [182] Furthermore the time dependences of these two
spectral changes match suggesting that the observed shape transformation for a single
nanorod into a nanodot is completed by the interaction with only one laser pulse The
next laser pulse will simply be absorbed by other nanorods left in the solution but not
by a previously excited nanorod as that has transformed into a spherical particle with
no longitudinal surface plasmon absorption
The situation is diŒerent when the laser pulse energy is lowered [182] The lower
half of reg gure 13 illustrates this case The excitation energy is just 200 nJ An optical
hole can only be burned in the broad longitudinal plasmon band at the wavelength of
the exciting laser pulse (reg gure 13(e)) The broad absorption band is due to the size
distribution of the gold nanorods which is considerably narrowed by removing the
rods with the larger aspect ratios absorbing on the red edge of the absorption band
[93] Only the nanorods that absorb strongly at the excitation wavelength are heated
su ciently to undergo a shape transformation The gentle surface melting of the
nanorods leads to shorter but wider rods [11] as shown from the TEM image in reg gure
Radiati Š e non-radiati Š e and photothermal properties of gold nanocrystals 441
13(c) as well as the change in the mean nanorod aspect ratio length and width upon
laser irradiation as shown in reg gures 14 (a) (b) and (c) respectively The average aspect
ratio of 3 plusmn 7 has decreased to 2 plusmn 7 after laser irradiation which is due to a decrease in the
average rod length from 31 to 25 nm and an increase in the average width from 8 plusmn 4 to
9 plusmn 4 nm As the shorter nanorods are not intrinsically wider in the starting solution (as
checked independently) these results are consistent with surface melting and
inconsistent with depletion of the long nanorods due to complete melting into
nanodots The increase in the intensity at 520 nm suggests that spherical nanoparticles
are also formed at the same time In conclusion this experiment narrows the initial size
distribution of the starting gold nanorod sample considerably [182]
While the nanorodplusmn nanodot shape transformation was followed by two steady-
state techniques namely TEM and ultravioletplusmn visible absorption spectroscopy an
interesting question arises as to how much time the actual shape transformation takes
[198] In order to answer this question we used time-resolved pumpplusmn probe
spectroscopy to monitor the rate of the disappearance of the longitudinal surface
plasmon absorption after femtosecond pulsed photothermal heating of the nanorod
solution [198] The red wavelength absorption edge of the longitudinal plasmon
absorption was chosen to monitor this process in order to avoid interference from the
transient reversible bleach of this band upon excitation At longer wavelengths the
bleach crosses over into an absorption in the transient spectrum and the bleach signal
becomes very small [167] thus not interfering with a signal caused by the permanent
bleaching of the longitudinal plasmon band due to the nanorod melting The
experiment was further carried out in a macr ow cell with a large sample volume in order
to ensure that the overall percentage of nanorods destroyed remains small and that a
new probe volume of a fresh (mainly unexposed) nanorod solution is sampled every
laser pulse [198] The result obtained from a gold nanorod sample with an average
aspect ratio of 2 plusmn 9 is shown in reg gure 15 The photothermal excitation wavelength was
400 nm with an energy of 9 l J and the monitoring wavelength was 790 nm [198] That
nanodots are indeed produced was checked independently by TEM for a small
amount of the nanorod solution which was placed in a rotating cylindrical cell and
irradiated until the complete destruction of the longitudinal surface plasmon band was
observed [198] Figure 15 shows the rise in the permanent bleach signal which is
attributed to the disappearance of the plasmon band at this wavelength and hence
marks the beginning of the shape transformation from a rod to a sphere A reg t of the
data points gives a time of 30 sup3 5 ps This time gives the lower limit of the
nanorodplusmn nanodot transformation time since the monitoring wavelength was set to the
red edge of the plasmon band The measured transformation time is independent of
the laser pump power in the investigated power range 5plusmn 20 l J [198] Only melting with
no fragmentation occurs with the femtosecond laser pulses of these energies and a
focus spot of about 100plusmn 200 l m Furthermore no signireg cant dependence of the
photoinduced isomerization dynamics on the gold nanorod aspect ratio could be
detected for four samples with aspect ratios ranging from 1 plusmn 9 to 3 plusmn 7 [198]
It is worth noting that this transformation time is faster than the cooling of the gold
lattice (greater than 100 ps [143plusmn 148 164plusmn 167]) but slower than the electronplusmn phonon
relaxation time (less than 10 ps [143plusmn 148 164plusmn 167]) This is expected from the
discussion in section 4 about the energy relaxation in metal nanoparticles In the case
of laser irradiation with femtosecond laser pulses the separation into sequential
processes of excitation of the electron gas lattice heating by electronplusmn phonon
coupling and melting of the nanorods is justireg ed However this is not valid any longer
442 S Link and M A El-Sayed
Figure 14 Laser-induced narrowing of the gold nanorod size distribution with low powerfemtosecond pulses The statistical analysis of the nanorod solution irradiated with 200nJ femtosecondlaser pulses (see reg gures 13 (c) and 13 (e)) is shown The distributionsof (a)the aspect ratios (b) the rod lengths and (c) the widths of the reg nal product are comparedwith the original starting solution (see reg gure 13 (a)) The average aspect ratio decreasesfrom 3 plusmn 7 to 2 plusmn 7 as the optical hole is created at the long-wavelength side correspondingtothe rods with the largest aspect ratio This is caused by a decrease in the nanorod length
Radiati Š e non-radiati Š e and photothermal properties of gold nanocrystals 443
Figure 15 How long does it take to melt a gold nanorod Transient absorption signalrecorded at 790 nm where the longitudinal mode of the surface plasmon resonanceabsorption of gold nanorods having a mean aspect ratio of 2 plusmn 9 nm is excited Theexcitation wavelength was 400 nm and the pulse energy was 9 l J which is su cient tomelt the nanoparticles into spherical particles The permanent bleach thereforecorrespondsto the shape transformationfrom rods to dotsThe reg t gives a transformationtime of 30 sup3 5 ps
when a laser with a picosecond or nanosecond pulse duration is used In fact it is
found that the reg nal irradiation product can be quite diŒerent when a nanosecond laser
is used as the irradiation source [182] Comparing the inmacr uence of nanosecond with
that of femtosecond laser pulses it is found that the energy threshold for the complete
melting of gold nanorods is lower with femtosecond laser pulses [199] In reg gure 16 the
optical absorption data and TEM images of a sample with a mean aspect ratio of 4 plusmn 1
irradiated with laser pulses having the same laser pulse energy of 20 l J (and macr uence of
0 plusmn 25 J cmshy ) but diŒerent laser pulse widths are shown (reg gures 16 (a) and (b) show
irradiation with femtosecond pulses and reg gures 16 (c) and (d ) irradiation with
nanosecond pulses) In the case of irradiation with nanosecond pulses only an optical
hole burning is observed similar to that observed when femtosecond pulses with much
lower pulse energies (see reg gure 13(e)) are used The dominant particle shape in the
TEM image (reg gure 16 (d )) is a u-shaped nanoparticle (particle of mainly cylindrical
shape with a spherical middle part) indicating that only partial melting occurs
compared with the nanodots seen in reg gure 16(b) produced by irradiation with
femtosecond laser pulses Bent and twisted nanorods and especially u-shaped particles
are mainly found after irradiation with nanosecond pulses as independently reported
by Chang et al [183] The same type of particles can also be observed with
femtosecond irradiation but only at much lower pulse energies and with a lower
abundance [199] The u-shaped particles seem to be an early stage of the shape
transformation into spheres (ie melting) [183 199] in which the pulse energy is not
from 31 to 25 nm while the width increases from 8 plusmn 4 to 9 plusmn 4 nm As the shortest nanorodsare not the widest rods in the starting solution this result suggests that the nanorodsundergo a surface melting in which the nanorods become wider at a cost to their length
444 S Link and M A El-Sayed
Figure 16 The eŒect of the laser pulse width on the photothermalreshapingof gold nanorodsThe optical absorption data and TEM images of a nanorod sample with a mean aspectratio of 4 plusmn 1 irradiated by laser pulses having the same macr uence (0plusmn 25 J cmshy ) but diŒerentlaser pulse widths ((a) (b) 100 fs (c) (d ) 7 ns) are compared A complete melting of thegold nanorods into spherical nanoparticles (concluded from the TEM picture) and acomplete depletion of the nanorods (as seen in the reg nal optical absorption spectrum) areachieved with femtosecond laser pulses When nanosecond pulses of the same energy(macr uence) are used only an optical hole burning at the laser wavelength and a partialmelting of the gold nanorodsare found A high abundance of u-shaped particles is clearlyvisible This result leads to the conclusion that nanosecond laser pulses are less eŒectivein melting the gold nanorods
high enough for complete melting as phononplusmn phonon coupling with the surrounding
medium can partially compete with the nanoparticle heating by the laser energy This
further suggests that the nanorods cool most rapidly at their ends where their exposed
surface area is the largest [199] This might also be the path of the photothermal
isomerization process from rods to spheres in which the width of the rod increases
around the middle of the rod pulling the two ends closer to one another (A high-
resolution TEM study is now under way to examine the mechanism of melting [200])
The diŒerence in laser processing of gold nanorods with diŒerent laser pulse widths
can be explained by the fact that the heat loss (phononplusmn phonon relaxation from the
nanoparticle lattice to the solvent molecules) can eŒectively compete with the rate of
heating the lattice This is determined by the rate of photon absorption and the rate of
electronplusmn phonon relaxation In the case of when a femtosecond laser pulse is used as
Radiati Š e non-radiati Š e and photothermal properties of gold nanocrystals 445
the excitation source the photophysical events (absorption by the electrons coupling
to the lattice melting and heat release to the solvent) are basically separated in time
and could be thought of as sequential processes to a reg rst approximation This is
certainly not justireg ed for the nanosecond case This is especially true in cases when the
absorption coe cient of the gold nanorods at the excitation wavelength changes
owing to shape changes The longitudinal surface plasmon band bleaches because of
the hot electron gas absorption leading to a decrease in absorption and therefore to
a less eŒective heating of the nanorods [167] The diŒerence in the energy threshold for
observing a complete melting of the nanorods when the two lasers are used can now
be understood [199] Melting occurs if the rate of heating the lattice is faster than the
rate of cooling the lattice With femtosecond lasers the laser intensity is so high that the
rate of absorption (and thus heating) is very rapid Therefore the same number of
photons squeezed in 100 fs can heat the lattice much more eŒectively and more rapidly
than if they are stretched to a nanosecond pulse width
When nanosecond laser pulses of higher energies (millijoule range) are used
fragmentation of the gold nanorods into smaller nearly spherical nanoparticles is
observed [182] similar to those observed for the gold [178 179] and silver [180 181]
nanodots described above While this observation was explained for the nanodots in
terms of the slow heat loss to the solvent or the ejection of photoelectrons for a gold
nanorod solution another mechanism was shown to contribute as well [182] As the
nanorodsrsquo lattice heats up and melts during the long nanosecond laser pulse the gold
nanoparticle continues to absorb photons The additional photons absorbed by the
hot particles was proposed to lead to fragmentation of the gold nanorods [182] This
model can be described as follows
(Au)NR
MMMMNnhm
[(Au)NR
]g (51)
[(Au)NR
]g MMMMNfs
[(Au)NR
]v (52)
[(Au)NR
]v MMMMNps
[(Au)NR
]vib (53)
[(Au)NR
]vib MMMMNmelting
[(Au)NS
] (54)
[(Au)NP
]vib MMMMNmhm (ns)
[(Au)NP
]vib (55)
[(Au)NP
]vibMMMMNfragmentation
(Au)SNS
(56)
Processes (51) (52) and (53) represent laser excitation of the electrons thermal
heating of the electrons (less than 1 ps [166]) and lattice heating resulting from
electronplusmn phonon relaxation processes (less than 10 ps [143plusmn 149 164plusmn 167]) respect-
ively NR NS NP and SNS refer to nanorods nanospheres nanoparticles (when
there is no dereg nite information about the particle shape) and small nanospheres
respectively It is important to note that heating the lattice via electronplusmn phonon
relaxation in the femtosecond experiment occurs in the dark as it takes place on a time
scale longer than the pulse width Process (54) is the melting of the nanorods which
completes the photophysical events in the femtosecond experiment if heat loss to the
surrounding medium is neglected However this is not the case for the nanosecond
experiments Process (55) represents further laser excitation of the hot lattice in the
experiments with nanosecond laser pulses Therefore it is expected that absorption of
446 S Link and M A El-Sayed
Figure 17 Gold nanorod fragmentation caused by two time-delayed femtosecond pulsesserving as a model for a longer (nanosecond) laser pulse (a) The set-up used forperforming the irradiation of gold nanoparticle solutions with two time-delayed laserpulses The gold nanorod solutionplaced in a rotating cylindrical cell is reg rst irradiated bya laser pulse and then the transmitted light is retroremacr ected into the solution andoverlapped with the reg rst excitation spot The second pulse can be delayed with respect tothe reg rst by a variable translation stage In this way a longer laser pulse is simulated by twoultrashort laser pulses in order to test the inmacr uence of the pulse duration on the shapetransformationof gold nanorods The delay time used is bracketing the electronplusmn phononand phononplusmn phonon relaxation time of gold nanorods in solution (b) The averageparticle diameterof the spheres producedby the laser irradiation plottedagainst the delaytime between the two pulses At delay times between 10 and 50 ps a smaller averageparticle diameter is observed owing to a higher abundance of smaller nanoparticleswhich are created by fragmentation of the gold nanorods With knowledge of the latticeheating and cooling dynamics this conreg rms the proposedmechanism that fragmentationof the gold nanorods with nanosecond laser pulses occurs because of the additionalabsorption of photons by the hot (melted) lattice during the duration of the nanosecondpulse
more photons by the hot (or even melted) lattice occurs in the nanosecond experiment
This then leads to an increase in the lattice internal energy and reg nally fragmentation
as shown in step (56)
In order to test this mechanism the gold nanorods were irradiated in solution by
two femtosecond pulses which were delayed by diŒerent amounts of time with respect
to each other [182] The reg rst pulse initially excites the nanorods and heats their lattice
while the second pulse is absorbed at diŒerent stages of excitation and relaxation after
the absorption of the reg rst pulse The mean diameter of the resulting particles is
Radiati Š e non-radiati Š e and photothermal properties of gold nanocrystals 447
determined by using TEM of the dried solutions of the nanoparticles taken from the
solution exposed to the two pulses separated by diŒerent delay times A schematic
diagram of the set-up for this experiment is shown in reg gure 17(a) and the results are
given in reg gure 17(b) The average particle diameter of the nanoparticles produced by
the laser irradiation is plotted against the delay time between the two pulses The point
labelled as reference refers to a control experiment in which the mirror behind the
sample cell was removed and therefore just one pulse was passed through the sample
Only melting of the nanorods into spherical nanoparticles is observed It was further
observed that a single pulse having the same energy as the sum of the two individual
laser pulses did not lead to a diŒerent mean particle diameter At delay times between
10 and 50 ps a smaller average particle diameter is observed owing to a higher
abundance of smaller nanoparticles which originate from the fragmentation of the
gold nanorods At shorter delay times than the electronplusmn phonon relaxation time (a few
picoseconds) the lattice of the nanorods has not yet been completely heated or melted
before the second pulse arrives At delay times longer than phononplusmn phonon relaxation
times (greater than 100 ps) the lattice has already cooled considerably by phononplusmn
phonon interactions Fragmentation is hence only observed when the second laser
pulse is absorbed after the lattice is heated (and melted) and before it cools This
supports the suggested mechanism of the fragmentation of gold nanorods induced by
lasers of energetic long (nanosecond) laser pulses
6 Concluding remarks and outlook
This review of the optical and dynamic properties of gold nanocrystals shows that
a great deal of understanding has already been accomplished The understanding of
the dynamics of the electrons and the lattice of nanostructured materials is of great
importance to their potential use in future photonic applications The sensitivity of the
surface plasmon absorption characteristics to adsorbed species is important for their
potential applications as chemical sensors The understanding of the laser-induced
photothermal melting and fragmentation mechanisms will be helpful in future
photothermal reshaping of metal nanoparticles
The understanding of the electronic absorption and dynamics in individual
nanoparticles is essential before we assemble them into devices which is the goal of the
use of nanostructured systems The advancements in chemical synthesis and separation
methods are pushing the limits of preparing and isolating nanoparticles of diŒerent
size and shape The study of a sample with a narrow size and shape distribution is
essential in determining the physical and especially the optical properties of individual
particles in an assembled mixture Single-particle spectroscopy could overcome the
problem of a narrow size distribution but is mainly limited to collecting the emission
rather than measuring the absorption spectrum On the other hand a great eŒort has
been made to try to create assemblies of nanoparticles in two- and three-dimensional
structures [70plusmn 72 201plusmn 209] Deoxyribonucleic acid [201] or smaller molecules [202] and
also templates such as aluminium oxide membranes [203] have been used to create
linked arrays of gold nanoparticles Lithography [70plusmn 72 204] and electrophoretic
deposition [205] also allow the two-dimensional arrangement of metallic particles The
patterning of structures consisting of individual and well separated nanoparticles as
solid-state devices is crucial for any future application In order to self-assemble
nanoparticles the size distribution needs to be very narrow so that the goals of both
preparing a monodisperse sample and assembling the nanoparticles are very closely
related This in turn presents the prospect of observing new optical properties of self-
448 S Link and M A El-Sayed
assembled monolayers of metallic nanoparticles as now the electric reg elds connected to
the plasmon resonance (enhancement of the incoming and outgoing electric reg elds
when interacting with light) will inmacr uence the eŒective reg elds around the neighbouring
nanoparticles Although aggregates of metallic nanoparticles [94plusmn 96] and their optical
absorption have been studied experimentally and theoretically an ordered array of
nanoparticles instead of an agglomerate might present new properties diŒerent from
the individual particles
Acknowledgements
We wish to acknowledge our collaborators Professor Zhong L Wang Dr Clemens
Burda Mona M Mohamed Babak Nikoobakht and Victor Volkov We would like to
thank Janet Petroski for carefully reading the manuscript This work was supported by
the National Science Foundation (grant CHE 9705164)
References
[1] H e n g l e i n A 1993 J phys Chem 97 8457[2] H e n g l e i n A 1989 Chem Re Š 89 1861[3] A l i v i s a t o s A P 1996 J phys Chem 100 13226[4] M u l v a n e y P 1996 Langmuir 12 788[5] S t o r h o f f J J and M i r k i n C A 1999 Chem Re Š 99 1849[6] S c h m i d G and C h i L F 1998 AdŠ Mater 10 515[7] A l i v i s a t o s A P B a r b a r a P F C a s t l e m a n A W Ch a n g J D i x o n D A K l e i n
M L M c L e n d o n G L M i l l e r J S R a t n e r M A R o s s k y P J St u p p S I andT h o m p s o n M E 1998 Ad Š Mater 10 1297
[8] W a n g Y and H e r r o n N 1991 J phys Chem 95 525[9] H e a t h J R and Sh i a n g J J 1998 Chem Soc Re Š 27 65
[10] W e l l e r H 1993 Angew Chem Int Edn Engl 32 41[11] L i n k S and E l -S a y e d M A 1999 J phys Chem B 103 8410[12] S c h m i d G 1994 Clusters and Colloids From Theory to Application (Weinheim VCH)[13] K a m a t P V and M e i s e l D 1997 Studies in Surface Science and Catalysis Vol 103
Semiconductor NanoclustersETH Physical Chemical and Catalytic Aspects (AmsterdamElsevier)
[14] E d e l s t e i n A S and Ca m m a r a t a R C 1996 Nanoparticles Synthesis Properties andApplications (Bristol Institute of Physics)
[15] K e r k e r M 1985 J Colloid Interface Sci 105 297[16] C r e i g h t o n J A and E a d o n D G 1991 J chem Soc Faraday Trans 87 3881[17] H u g h e s A E and Ja i n S C 1979 Ad Š Phys 28 717[18] F a r a d a y M 1857 Phil Trans R Soc 147 145[19] M i e G 1908 Ann Phys 25 329[20] G r a e t z e l M 1992 Electrochemistry in Colloids and Dispersions edited by R A Mackay
and J Texter (Weinheim VCH)[21] P e r e n b o o m J A A J W y d e r P and M e i e r P 1981 Phys Rep 78 173[22] H a l p e r i n W P 1986 Re Š mod Phys 58 533[23] K r e i b i g U and V o l l m e r M 1995 Optical Properties of Metal Clusters (Berlin
Springer)[24] B r u s L E 1983 J chem Phys 79 5566[25] B r u s L E 1984 J chem Phys 80 4403[26] B r u s L E 1991 Appl Phys A 53 465[27] M u r r a y C B N o r r i s D J and B a w e n d i M G 1993 J Am chem Soc 11 8706[28] W h e t t e n R L K h o u r y J T A l v a r e z A M M u r t h y S V e z m a r I W a n g Z L
S t e p h e n s P W C l e v e l a n d C L L u e d t k e W D and L a n d m a n U 1996 AdŠ Mater 8 428
[29] C h e m s e d d i n e A and W e l l e r H 1993 Ber Bunsenges phys Chem 97 636[30] A h m a d i T S W a n g Z L Gr e e n T C and E l -Sa y e d M A 1996 Science 272 1924[31] B r u s t M W a l k e r M B e t h e l l D S c h i f f r i n D J and W y h n m a n R 1994 J chem
Soc chem Commun 801
Radiati Š e non-radiati Š e and photothermal properties of gold nanocrystals 449
[32] H o s t e t l e r M J W i n g a t e J E Z h o n g C-J Ha r r i s J E V a c h e t R W C l a r k M R L o n d o n o J D G r e e n S J S t o k e s J J W i g n a l l G D G l i s h G L P o r t e r M D E v a n s N D and M u r r a y R W 1998 Langmuir 14 17
[33] H a n d l e y D A 1989 Colloidal Gold Principles Methods and Applications Vol 1 (NewYork Academic Press)
[34] T u r k e v i c h J St e v e n s o n P C 19 Hillier J 1951 Discuss Faraday Soc 11 55[35] T u r k e v i c h J G a r t o n G and S t e v e n s o n P C 1954 J Colloid Sci Suppl 1 26[36] T u r k e v i c h J 1985 Gold Bull 18 86[37] T u r k e v i c h J 1985 Gold Bull 18 125[38] T a n o T E s u m i K and M e g u r o K 1989 J Colloid Interface Sci 133 530[39] E s u m i K S u z u k i M T a n o T T o r i g o e K and M e g u r o K 1991 Colloids Surf
55 9[40] E s u m i K S a d a k a n e O T o r i g o e K and M e g u r o K 1992 Colloids Surf 62 255[41] E s u m i K T a n o T and M e g u r o K 1989 Langmuir 5 268[42] T o s h i m a N T a k a h a s h i T and H i r a i H 1985 Chem Lett 1245[43] R e e t z M T and He l b i g W 1994 J Am chem Soc 116 7401[44] Y u Y C h a n g S L e e C and W a n g C R C 1997 J phys Chem B 101 34 6661[45] B l a c k b o r o w J R and Y o u n d D 1979 Metal Vapor Synthesis (New York Springer)[46] D o r e m u s R H 1964 J chem Phys 40 2389[47] v a n d e r Z a n d e B M I B o h m e r M R F o k k i n k L G J and Sc h o n e n b e r g e r C
1997 J phys Chem B 101 852[48] F o s s C A H o r n y a k G L T i e r n e y M J and M a r t i n C R 1992 J phys Chem 96
9001[49] H o r n y a k G L Pa t r i s s i C J and M a r t i n C R 1997 J phys Chem B 101 1548[50] F o s s C A Ho r n y a k G L St o c k e r t J A and M a r t i n C R 1992 J phys Chem
96 7497[51] F o s s C A Ho r n y a k G L St o c k e r t J A and M a r t i n C R 1994 J phys Chem
98 2963[52] H o r n y a k G L and M a r t i n C R 1997 Thin Solid Films 303 84[53] M o h a m e d M B I s m a e l K Z L i n k S and E l -S a y e d M A 1998 J phys Chem B
102 9370[54] L i s i e c k i I B i l l o u d e t F and Pi l e n i M P 1996 J phys Chem 100 4160[55] L i s i e c k i I and P i l e n i M P 1993 J am Chem Soc 115 3887[56] L i n k S and E l -S a y e d M A 1999 J phys Chem B 103 4212[57] M a x w e l l -G a r n e t t J C 1904 Phil Trans R Soc 203 385[58] P a p a v a s s i l i o u G C 1980 Prog solid st Chem 12 185[59] K e r k e r M 1969 The Scattering of Light and Other Electromagnetic Radiation (New
York Academic Press)[60] B o h r e n C F and H u f f m a n D R 1983 Absorption and Scattering of Light by Small
Particles (New York Wiley)[61] N o z i k A J and M e m m i n g R 1996 J phys Chem 100 13061[62] S c h a a f f T G K n i g h t G S h a f i g u l l i n M B o r k m a n R F and W h e t t e n R L
1998 J phys Chem B 102 10643[63] K r e i b i g U and Ge n z e l U 1985 Surf Sci 156 678[64] A l v a r e z M M K h o u r y J T S c h a a f f T G Sh a f i g u l l i n M N Ve z m e r I and
W h e t t e n R L 1997 J phys Chem B 101 3706[65] S c h a a f f T G S h a f i g u l l i n M N K h o u r y J T Ve z m e r I W h e t t e n R L
C u l l e n W G F i r s t P N G u t i e r r e z -Wi n g C A s c e n s i o J and J o s e -Ya c a m a n M J 1997 J phys Chem B 101 7885
[66] H e i l w e i l E J and H o c h s t r a s s e r R M 1985 J chem Phys 82 4762[67] K r e i b i g U G a r t z M and H i l g e r A 1997 Ber Bunsenges phys Chem 101 1593[68] P u e c h K H e n a r i F Z B l a u W J D u f f D and S c h m i d G 1995 Chem Phys
Lett 247 13[69] P u e c h K H e n a r i F Z B l a u W J D u f f D and Sc h m i d G 1995 Europhys Lett
32 119[70] L a m p r e c h t B L e i t n e r A and A u s s e n e g g F R 1997 Appl Phys B 64 269[71] L a m p r e c h t B K r e n n J R L e i t n e r A and A u s s e n e g g F R 1999 Appl Phys B 69
223
450 S Link and M A El-Sayed
[72] L a m p r e c h t B L e i t n e r A and A u s s e n e g g F R 1999 Appl Phys B 68 419[73] K l a r T P e r n e r M G r o s s e S v o n P l e s s e n G S p i r k l W and F e l d m a n n J 1998
Phys Re Š Lett 80 4249[74] K r e i b i g U and v o n F r a g s t e i n C 1969 Z Phys 224 307[75] K r e i b i g U 1970 Z Phys 234 307[76] A s h c r o f t N W and M e r m i n N D 1976 Solid State Physics (Philadelphia
Pennsylvania Saunders College)[77] D o r e m u s R H 1965 J chem Phys 42 414[78] S m i t h a r d M A 1974 Solid St Commun 14 407[79] R u p p i n R and Y a t o m H 1976 Phys Stat sol (b) 74 647[80] K a w a b a t a A and K u b o R 1966 J phys Soc Japan 21 1765[81] H a c h e F R i c a r d D and F l y t z a n i s C 1986 J opt Am Soc B 3 1647[82] C i n i M 1987 J opt Soc Am 71 386[83] G e n z e l L M a r t i n T P and K r e i b i g U 1975 Z Phys B 21 339[84] W o o d D M and A s h c r o f t N W 1982 Phys Re Š B 25 6255[85] K r a u s W A and S c h a t z G C 1983 J chem Phys 79 6130[86] Y a n n o u l e a s C and B r o g l i a R A 1992 Ann Phys 217 105[87] B r a c k M 1993 Re Š mod Phys 65 677[88] B o n a c i c -K o u t e c k y V F a n t u c c i P and K o u t e c k y J 1991 Chem Re Š 91 1035[89] P e r s s o n N J 1993 Surf Sci 281 153[90] L i n n e r t T M u l v a n e y P and H e n g l e i n A 1993 J phys Chem 97 679[91] H o e v e l H F r i t z S H i l g e r A K r e i b i g U and V o l l m e r M 1993 Phys Re Š B 48
18178[92] L y o n L A M u s i c k M D S m i t h P C R e i s s B D P e n a D J and Na t a n M J
1999 Sensors Actuators B 54 118[93] L i n k S M o h a m e d M B and E l -S a y e d M A 1999 J phys Chem B 103 3073[94] G a n s R 1915 Annln Phys 47 270[95] K r e i b i g U A l t h o f f A and P r e s s m a n n H 1981 Surf Sci 106 308[96] Q u i n t e n M and K r e i b i g U 1986 Surf Sci 172 557[97] Q u i n t e n M Sc h o e n a u e r D Kr e i b i g U 1989 Z Phys D 26 239[98] A s p n e s D E H e l l e r A and Po r t e r J D 1986 J appl Phys 60 3028[99] A s p n e s D E 1982 Thin Solid Films 89 249
[100] P a l p a n t B P r e v e l B L e r m e J C o t t a n c i n E P e l l a r i n M T r e i l l e u x M P e r e z A V i a l l e J L and B r o y e r M 1998 Phys Re Š B 57 1963
[101] M o o r a d i a n A 1969 Phys Re Š Lett 22 185[102] W h i t t l e D G and B u r s t e i n E 1981 Bull Am phys Soc 26 777[103] B o y d G T Y u Z H and Sh e n Y R 1986 Phys Re Š B 33 7923[104] M o s h o v i s t s M 1985 Re Š mod Phys 57 783[105] H e r i t a g e J P B e r g m a n J G P i n c z u k A and W o r l o c k J M 1979 Chem Phys
Lett 67 229[106] A p e l l P and M o n r e a l R 1988 Physica Scripta 38 174[107] P l e k h a n o v V G and Si l i u k o v a T V 1990 SoŠ iet Phys Solid St 32 1268[108] C h e n C K H e i n z T F R i c a r d D and S h e n Y R 1983 Phys Re Š B 27 1965[109] B o y d G T R a s i n g T L e i t e J R R and S h e n Y R 1984 Phys Re Š B 30 519[110] O t t o A 1991 J Raman Spectrosc 22 743[111] O t t o A M r o z e k I G r a b h o r n H and A k e m a n W 1992 J Phys condens Matter
4 1143[112] Z e m a n E J and S c h a t z G C 1987 J phys Chem 91 634[113] C l i n e M P B a r b e r P W and C h a n g R K 1986 J opt Soc Am B 3 15[114] C r e i g h t o n J A B l a t c h f o r d C G and A l b r e c h t M G 1979 J chem Soc
Faraday Trans II 75 790[115] K e r k e r M S i i m a n O B u m m L A and W a n g W-S 1980 Appl Optics 19 3253[116] K e r k e r M W a n g D and C h e w H 1980 Appl Optics 19 4159[117] F r e e m a n R G Ho m m e r M B G r a b a r K C Ja c k s o n M A and N a t a n M J
1996 J phys Chem 100 718[118] E m o r y S R H a s k i n s W E N i e S 1998 J Am chem Soc 120 8009[119] M o h a m e d M B V o l k o v V V L i n k s S and E l -Sa y e d M A 2000 Chem Phys
Lett 317 517
Radiati Š e non-radiati Š e and photothermal properties of gold nanocrystals 451
[120] W i l c o x o n J P M a r t i n J E P a r s a p o u r F W i e d e n m a n B and K e l l e y D F1998 J chem Phys 108 9137
[121] E s l e y G L 1983 Phys Re Š Lett 51 2140[122] E s l e y G L 1986 Phys Re Š B 33 2144[123] G r o e n e v e l d R H M Sp r i k R and L a g e n d i j k A 1992 Phys Re Š B 45 5079[124] G r o e n e v e l d R H M Sp r i k R and L a g e n d i j k A 1995 Phys Re Š B 51 11 433[125] S c h o e n l e i n R W L i n W Z F u j i m o t o J G and E s l e y G L 1987 Phys Re Š Lett
58 1680[126] B r o r s o n S D F u j i m o t o J G and Ip p e n E P 1987 Phys Re Š Lett 59 1962[127] S u n C-K V a l l e e F A c i o l i L H I p p e n E P and F u j i m o t o J G 1993 Phys Re Š
B 48 12365[128] S u n C-K V a l l e e F A c i o l i L H I p p e n E P and F u j i m o t o J G 1994 Phys Re Š
B 50 15337[129] d e l F a t t i N B o u f f a n a i s R V a l l e e F and F l y t z a n i s C 1998 Phys Re Š Lett 81
922[130] E l s a y e d -A l i H E J u h a s z T Sm i t h G O and B r o n W E 1991 Phys Re Š B 43
4488[131] Ju h a s z T E l s a y e d -A l i H E Hu H and B r o n W E 1992 Phys Re Š B 45 13819[132] Ju h a s z T E l s a y e d -Al i H E S m i t h G O S u a r e z C and B r o n W E 1993 Phys
Re Š B 48 15488[133] F a n n W S St o r z R T o m H W K and B o k e r J 1992 Phys Re Š B 46 13592[134] F a n n W S St o r z R T o m H W K and B o k e r J 1992 Phys Re Š Lett 68 2834[135] S c h m u t t e n m a e r C A A e s c h l i m a n n M E l s a y e d -A l i H E M i l l e r R J D
M a n t e l l D A C a o J and G a o Y 1994 Phys Re Š B 50 8957[136] A e s c h l i m a n n M S c h m u t t e n m a e r C A E l s a y e d -Al i H E M i l l e r R J D Ca o
J G a o Y and M a n t e l l D A 1995 J chem Phys 102 8606[137] G a o Y C a o J M i l l e r R J D E l s a y e d -A l i H E and M a n t e l l D A 1997
Phys Re Š B 56 1099[138] C a o J G a o Y E l s a y e d -Al i H E M i l l e r R J D and M a n t e l l D A 1998
Phys Re Š B 58 10948[139] A n i s i m o v L K a p e l i o v i c h B L and P e r e l rsquo m a n T L 1975 So Š iet Phys JETP
39 375[140] P a w l i k S B a u e r M and A e s c h l i m a n n M 1997 Surf Sci 377plusmn 379 206[141] A e s c h l i m a n n M P a w l i k S and B a u e r M 1995 Ber Bunsenges phys Chem 99
1504[142] O g a w a S and P e t e k H 1996 Surf Sci 357plusmn 358 585[143] P e r n e r M B o s t P P a u c k T v o n Pl e s s e n G F e l d m a n n J B e c k e r U M e n n i g
M P o r s t e n d o r f e r J S c h m i t t M and S c h m i d t H 1996 Ultrafast Phenomena Xedited by P F Babara J G Fujimoto W H Knox and W Zinth (Berlin Springer)
[144] P e r n e r M B o s t P v o n Pl e s s e n G F e l d m a n n J B e c k e r U M e n n i g M andS c h m i d t H 1997 Phys Re Š Lett 78 2192
[145] P e r n e r M K l a r T G r o s s e S L e m m e r U v o n P l e s s e n G S p i r k l W andF e l d m a n n J 1998 J Lumin 76plusmn 77 181
[146] H o d a k J K M a r t i n i I and H a r t l a n d G V 1998 Chem Phys Lett 284 135[147] H o d a k J K M a r t i n i I and H a r t l a n d G V 1998 J phys Chem B 102 6958[148] H o d a k J K M a r t i n i I and H a r t l a n d G V 1998 J chem Phys 108 9210[149] H o d a k J K H e n g l e i n A and H a r t l a n d G V 1999 J chem Phys 111 8613[150] B i g o t J-Y M e r l e J-C C r e g u t O and Da u n o i s A 1995 Phys Re Š Lett 75
4702[151] S h a h b a z y a n T V P e r a k i s I E and B i g o t J-Y 1998 Phys Re Š Lett 81 3120[152] R o b e r t i T W S m i t h B A and Z h a n g J Z 1995 J chem Phys 102 3860[153] S m i t h B A W a t e r s D M F a u l h a b e r A E K r e g e r M A R o b e r t i T W and
Z h a n g J Z 1997 J Solplusmn Gel Sci Technol 9 125[154] F a u l h a b e r A E Sm i t h B A A n d e r s e n J K and Z h a n g J Z 1996 Molec
Crystals liq Crystals 283 25[155] S m i t h B A Z h a n g J Z Gi e b e l U and S c h m i d G 1997 Chem Phys Lett 270
139[156] H a m a n a k a Y H a y a s h i N N a k a m u r a A and O m i S 1998 J Lumin 76plusmn 77 221
452 S Link and M A El-Sayed
[157] D e l F a t t i N T z o r t z a k i s S V o i s i n C F l y t z a n i s C and V a l l e e F 1999 PhysicaB 263plusmn 264 54
[158] D e l F a t t i N V o i s i n C C h e v y F V a l l e e F and F l y t z a n i s C 1999 J chemPhys 110 484
[159] d e l F a t t i N F l y t z a n i s C and Va l l e e F 1999 Appl Phys B 68 433[160] F e l d s t e i n M J Ke a t i n g C D L i a u Y-H N a t a n M J and Sc h e r e r N F 1997
J Am chem Soc 119 6638[161] In o u y e H T a n a k a K T a n a h a s h i I and H i r a o K 1998 Phys Re Š B 57 11334[162] T o k i z a k i T N a k a m u r a A Ka n e k o S U c h i d a K O m i S T a n j i H and A s a h a r a
Y 1994 Appl Phys Lett 65 941[163] A v e r i t t R D W e s t c o t t S L and H a l a s N J 1998 Phys Re Š B 58 10 203[164] A h m a d i T S L o g u n o v S L and E l -S a y e d M A 1996 J phys Chem 100 8053[165] A h m a d i T S L o g u n o v S L E l -Sa y e d M A K h o u r y J T and W h e t t e n R L
1997 J phys Chem B 101 3713[166] L i n k S B u r d a C W a n g Z L and E l -Sa y e d M A 1999 J chem Phys 111 1255[167] L i n k S B u r d a C M o h a m e d M B N i k o o b a k h t B and E l -Sa y e d M A 2000
Phys Re Š B 61 6086[168] R o s e i R A n t o n g e l i F and G r a s s a n o U M 1973 Surf Sci 37 689[169] C a r d o n a M 1969 Modulation Spectroscopy Solid State Physics SupplementII edited
by F Seitz D Turnball and H Ehrenreich (New York Academic Press)[170] P i n e s D and N o z i e rsquo r e s P 1966 The Theory of Quantum Liquids (New York
Benjamine)[171] C h r i s t e n s e n N E and S e r a p h i n B O 1971 Phys Re Š B 4 3321[172] S t e l l a A N i s o l i M d e S i l v e s t r i S S v e l t o O L a n z a n i G C h e y s s a c P and
K o f m a n R 1996 Phys Re Š B 53 15497[173] S t e l l a A N i s o l i M d e S i l v e s t r i S S v e l t o O L a n z a n i G C h e y s s a c P and
K o f m a n R 1996 Ultrafast Phenomena X edited by P F Babara J G FujimotoW H Knox and W Zinth (Berlin Springer)
[174] N i s o l i M S t a g i r a S d e S i l v e s t r i S S t e l l a A T o g i n i P Ch e y s s a c P andK o f m a n R 1997 Phys Re Š Lett 53 3575
[175] H o d a k J K M a r t i n i I and H a r t l a n d G V 2000 J chem Phys 112 5942[176] B e l o t s k i i E D and T o m c h u k P M 1990 Surf Sci 239 143[177] B e l o t s k i i E D and T o m c h u k P M 1992 Int J Electron 73 955[178] K u r i t a H T a k a m i A and K o d a S 1998 Appl Phys Lett 72 789[179] T a k a m i A Ku r i t a H and K o d a S 1999 J phys Chem B 103 1226[180] S t e p a n o v A L H o l e D E B u k h a r a e v A A T o w n s e n d P D and Nu r g a z i z o v
N I 1998 Appl Surf Sci 136 298[181] K a m a t P V F l u m i a n i M and H a r t l a n d G V 1998 J phys Chem B 102 3123[182] L i n k S B u r d a C M o h a m e d M B N i k o o b a k h t B and E l -S a y e d M A 1999 J
phys Chem A 103 1165[183] C h a n g S S h i h C Ch e n C L a i W and W a n g C R C 1999 Langmuir 15 701[184] K a e m p f e M R a i n e r T B e r g K-J Se i f e r t G and G r a e n e r H 1999 Appl Phys
Lett 74 1200[185] G e o h e g a n D B P u r e t z k y A A D u s c h e r G and Pe n n y c o o k S J 1998 Appl
Phys Lett 72 2987[186] L o w n d e s D H R o u l e a u C M T h u n d a t T D u s c h e r G Ke n i k E A and
P e n n y c o o k S J 1998 Appl Surf Sci 129 355[187] S a s a k i T T e r a u c h i S K o s h i z a k i N and U m e h a r a H 1998 Appl Surf Sci 129
398[188] P a s z t i Z H o r v a t h Z E P e t o G Ka r a c s A and G u c z i L 1997 Appl Surf Sci
110 67[189] L i l l i c h H W o l f r u m J Z u m b a c h V Al e a n d r i L E Jo n e s D J R o z i e r e J
A l b e r s P S e i b o l d K and F r e u n d A 1995 J phys Chem 99 12 413[190] W e r w a E S e r a p h i n A A C h i u L A Z h o u C X and Ko l e n b r a n d e r K D
1994 Appl Phys Lett 64 1821[191] L e n z n e r M K r u e g e r J K a u t e k W and K r a u s z E 1999 Appl Phys A 68 369[192] S i e g e l J E t t r i c h K W e l s c h E and M a t t h i a s E 1997 Appl Phys A 64 213[193] N o l t e S M o m m a C Ja c o b s H T u e n n e r m a n n A C h i c h k o v B N
W e l l e g e h a u s e n B and W e l l i n g H 1997 J opt Soc Am B 14 2716
Radiati Š e non-radiati Š e and photothermal properties of gold nanocrystals 453
[194] S t u a r t B C F e i t M D He r m a n S R u b e n c h i k A M S h o r e B W and P e r r y M D 1996 Phys Re Š B 53 1749
[195] S t u a r t B C F e i t M D He r m a n S R u b e n c h i k A M S h o r e B W and P e r r y M D 1996 J opt Soc Am B 13 459
[196] K o n o n e n k o T V G a r n o v S V K l i m e n t o v S M K o n o v V I L o u b n i n E ND a u s i n g e r F R a i b e r A and T a u t C 1997 Appl Surf Sci 109plusmn 110 48
[197] S o k o l o w s k i -Ti n t e n K B i a l k o w s k i J Ca v a l l e r i A v o n d e r L i n d e D O p a r i n A M e y e r -t e r -V e h n J and A n i s i m o v S I 1998 Phys Re Š Lett 81 224
[198] L i n k S B u r d a C N i k o o b a k h t B and E l -S a y e d M A 1999 Chem Phys Lett315 12
[199] L i n k S B u r d a C N i k o o b a k h t B and E l -Sa y e d M A 2000 J phys Chem (to bepublished)
[200] L i n k S W a n g Z L and E l -S a y e d M A 2000 (to be published)[201] M i r k i n C A L e t s i n g e r R L M u c i c R C and St o r h o f f J J 1996 Nature 382
607[202] A n d r e s R P B i e l e f e l d J D H e n d e r s o n J I Ja n e s D B K o l a g u n t a V R
K u b i a k C P M a h o n e y W J and O s i f c h i n R G 1996 Science 273 1690[203] M a r i n a k o s S M B r o u s s e a u L C Jo n e s A and F e l d h e i m D L 1998 Chem
Mater 10 1214[204] Je n s e n T R Sc h a t z G C and v a n D u y n e R P 1999 J phys Chem B 103 2394[205] G i e r s i g M and M u l v a n e y P 1993 J phys Chem 97 6334[206] W a n g Z L 1998 Ad Š Mater 10 13[207] M o t t e L B i l l o u d e t F L a c a z e E D o u i n J and Pi l e n i M P 1997 J phys Chem
B 101 138[208] K o r g e l B A F u l l a m S C o n n o l l y S and F i t z m a u r i c e D 1998 J phys Chem B
102 8379[209] H a r f e n i s t S A W a n g Z L Al v a r e z M M V e z m a r I and W h e t t e n R L 1996
J phys Chem 100 13904
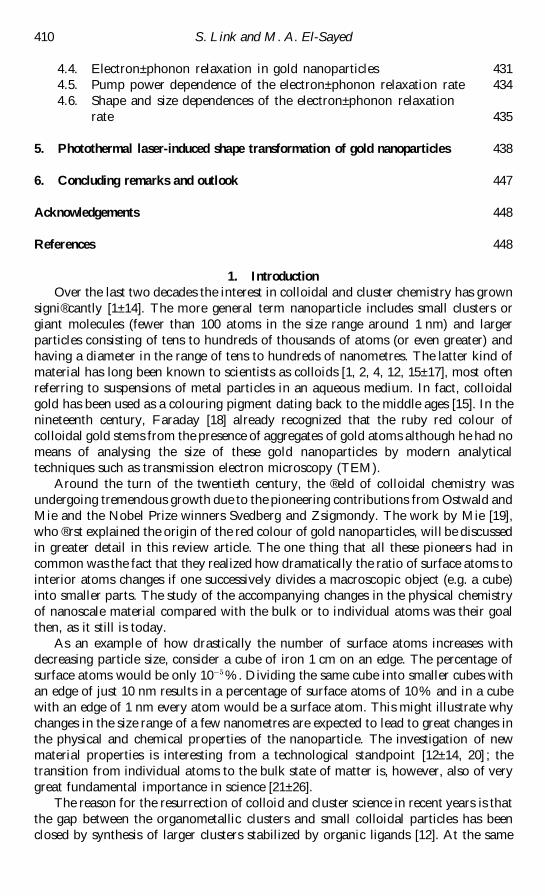
410 S Link and M A El-Sayed
44 Electronplusmn phonon relaxation in gold nanoparticles 431
45 Pump power dependence of the electronplusmn phonon relaxation rate 434
46 Shape and size dependences of the electronplusmn phonon relaxation
rate 435
5 Photothermal laser-induced shape transformation of gold nanoparticles 438
6 Concluding remarks and outlook 447
Acknowledgements 448
References 448
1 Introduction
Over the last two decades the interest in colloidal and cluster chemistry has grown
signireg cantly [1plusmn 14] The more general term nanoparticle includes small clusters or
giant molecules (fewer than 100 atoms in the size range around 1 nm) and larger
particles consisting of tens to hundreds of thousands of atoms (or even greater) and
having a diameter in the range of tens to hundreds of nanometres The latter kind of
material has long been known to scientists as colloids [1 2 4 12 15plusmn 17] most often
referring to suspensions of metal particles in an aqueous medium In fact colloidal
gold has been used as a colouring pigment dating back to the middle ages [15] In the
nineteenth century Faraday [18] already recognized that the ruby red colour of
colloidal gold stems from the presence of aggregates of gold atoms although he had no
means of analysing the size of these gold nanoparticles by modern analytical
techniques such as transmission electron microscopy (TEM)
Around the turn of the twentieth century the reg eld of colloidal chemistry was
undergoing tremendous growth due to the pioneering contributions from Ostwald and
Mie and the Nobel Prize winners Svedberg and Zsigmondy The work by Mie [19]
who reg rst explained the origin of the red colour of gold nanoparticles will be discussed
in greater detail in this review article The one thing that all these pioneers had in
common was the fact that they realized how dramatically the ratio of surface atoms to
interior atoms changes if one successively divides a macroscopic object (eg a cube)
into smaller parts The study of the accompanying changes in the physical chemistry
of nanoscale material compared with the bulk or to individual atoms was their goal
then as it still is today
As an example of how drastically the number of surface atoms increases with
decreasing particle size consider a cube of iron 1 cm on an edge The percentage of
surface atoms would be only 10shy amp Dividing the same cube into smaller cubes with
an edge of just 10 nm results in a percentage of surface atoms of 10 and in a cube
with an edge of 1 nm every atom would be a surface atom This might illustrate why
changes in the size range of a few nanometres are expected to lead to great changes in
the physical and chemical properties of the nanoparticle The investigation of new
material properties is interesting from a technological standpoint [12plusmn 14 20] the
transition from individual atoms to the bulk state of matter is however also of very
great fundamental importance in science [21plusmn 26]
The reason for the resurrection of colloid and cluster science in recent years is that
the gap between the organometallic clusters and small colloidal particles has been
closed by synthesis of larger clusters stabilized by organic ligands [12] At the same
Radiati Š e non-radiati Š e and photothermal properties of gold nanocrystals 411
time size selective separation methods of colloidal particles have allowed the isolation
of smaller clusters from the large distribution of sizes [27plusmn 29] In fact the
monodispersity of the particle size is a key factor in enabling the study of size-
dependent physical properties of the nanoparticles In this way particles can be
isolated in a quantity which easily allows one to use less sensitive analytic techniques
than usually employed in a cluster beam experiment Not only have the chemical
preparation methods improved signireg cantly but also the progress in computing
capabilities [12 23] makes it now possible to calculate cluster properties of fairly large
particles from reg rst principles similar to calculations of molecular properties On the
other hand band structure calculations in solid-state physics do not have to involve
inreg nite boundary conditions any more as the signireg cance of a reg nite size can be taken
into account Therefore the fact that the areas of cluster and colloid science are
merging together with the advancement in the chemical synthesis techniques explains
and justireg es the use of the word nanoparticle for all particles falling in the size regime
of 10shy m
The reason for studying nanostructured materials from a technological standpoint
is mainly the anticipated applications in optical systems and catalysis [12plusmn 14 20] In
particular in the reg elds of optical data communication and optical data storage the
need for new materials with high nonlinearities is driving nanoparticle research The
ease of tuning the optical properties gradually with particle size and shape have made
nanoparticles very interesting compared with organic dye molecules [3] Semi-
conductor nanoparticles have already been successfully used in solar cells converting
sunlight into electricity [20] On the other hand because of their high surface-to-
volume ratios metal nanoparticles (especially platinum and palladium) are important
as catalysts [12] Shape control over platinum nanoparticles [30] might allow the
exposure of diŒerent crystal surfaces for catalysis showing diŒerences in catalytic
e ciency
In general nanoparticles can be composed of metals in their neutral valence state
or as their oxides sulphides selenides etc Nanoparticles composed of a semi-
conducting material are of great interest since their bandgap transition has moved to
the visible compared with the infrared for the bulk [3 9 10] Even though this article
will focus on metallic nanoparticles all the particles have in common that they must
be stabilized by molecules attached at their surface (to control their size and to prevent
them from agglomeration and precipitation) or must be embedded in a solid matrix in
order to avoid aggregation and the formation of the thermodynamically favoured
bulk material In the absence of any counteractive repulsive forces the van der Waals
forces between two metal nanoparticles would lead towards coagulation This can be
avoided by either electrostatic or steric stabilization [12] Electrostatic stabilization is
realized by an electrical double layer arising from the attraction of negatively charged
ions to the (mainly) metal nanoparticles The positive counterions then form a second
layer (hence the electrical double layer) Steric stabilization in solution is achieved by
binding of polymers or surfactant molecules with long alkyl chains to the particle
surface The long chains of the organic molecules prevent the particles from coming
close to each other The surface organic molecules further prevent the oxidation of the
neutral metal in solution and small nanoparticles of gold can be isolated as a powder
and are completely stable against air oxidation [31] In the case of gold organic thiols
have been employed very successfully in the synthesis of small gold clusters [28 31 32]
The goldEthiolate bond is known to be particularly strong and allows the isolation of
these compounds as molecular substances
412 S Link and M A El-Sayed
Preparation methods of metallic nanoparticles range from chemical methods to
metal vapour synthesis [12] The most widely used and oldest method is reduction of
the metal salt in solution by reducing agents such as sodium citrate phosphor sodium
borhydride or hydrogen [33] While sodium citrate used in an excess can also serve as
a protective capping agent in the case of the other mentioned substances polymers or
surfactants have to be added before the salt reduction in order to stabilize the
nanoparticles The reduction with sodium citrate has been worked out in detail by
Turkevich and co-workers [34plusmn 37] and produces gold nanoparticles with an average
diameter of about 20 nm with a very narrow size distribution and good reproducibility
It is therefore often used to prepare gold nanoparticles in solution which have been
widely used as labelling agents in biological samples using TEM [5]
Another reducing agent of a diŒerent kind employed very successfully is the use of
free electrons or radicals generated in solution by radiolytic techniques [1 2] Henglein
[1 2] and Mulvaney [4] have used a c -ray source to produce a wide variety of diŒerent
metal nanoparticles from cadmium thallium and lead to silver and gold Thermolysis
[38plusmn 41] and photolysis [42] of unstable organometallic precursors is another
preparation method which has been used for the synthesis of palladium and platinum
nanoparticles Electrolysis [43 44] can also be used to prepare metal nanoparticles In
metal vapour synthesis [45] atomic metal vapour is simply condensed in a dispersing
medium at low temperatures (because of the reactivity towards water this is exclusively
done in organic solvents) Furthermore nanoparticles can be grown in optically
transparent glasses at high temperatures [46] which is often the procedure most widely
used in solid-state physics In order also to synthesize nanoparticles of a certain shape
the reduction of the metal precursors can be carried out in a constraint environment
such as the inside of zeolites [12] porous alumina [47plusmn 52] and micelles [44 53plusmn 55]
The feature that distinguishes the preparation methods listed above from each
other in obtaining a homogeneous size distribution is the rate of nuclei formation
where the nuclei are homogeneously distributed over the reaction volume This allows
all clusters to grow with the same rate and one obtains a kinetically favoured product
rather than reaching the thermodynamically most favourable state (which would of
course be the bulk metal itself if given enough time)
While it would be worth reviewing the wide reg eld of preparation methods more
thoroughly the above discussion is used here only to serve as a general introduction
Instead this article focuses on the optical properties of the noble metal nanoparticles
which show a pronounced surface plasmon absorption The exact preparation
methods are of less importance for the main optical absorption feature It should
however be mentioned that the results presented here are all obtained on gold
nanoparticles produced either by the citrate method [34 35 56] or by an elec-
trochemical method with the use of organic surfactant molecules producing gold
nanorods [44 53] TEM pictures of 48 nm nanodots and gold nanorods with a mean
aspect ratio of 3 plusmn 3 are shown in reg gures 1(a) and (b) respectively The eŒect of the
surrounding medium will be discussed at appropriate times throughout the text The
reg rst part of this review discusses the physical origin of the surface plasmon absorption
and the eŒects of size and shape on the resonance condition The theories developed
by Mie [19] and Maxwell-Garnett [57] early in the twentieth century will be outlined
in more detail The second part deals with the optical response of the surface plasmon
band after excitation with a femtosecond laser pulse Time-resolved transient
absorption spectroscopy allows direct observation of the electron dynamics as the
electrons couple to the lattice Very intense laser heating on the other hand leads to
Radiati Š e non-radiati Š e and photothermal properties of gold nanocrystals 413
Figure 1 TEM images of (a) spherical gold nanoparticles with an average diameter of 48 nmand (b) gold nanorods with a mean aspect ratio of 3 plusmn 3
nuclear rearrangements and permanent shape transformation of the nanoparticles
This transformation can also be followed directly by monitoring the surface plasmon
absorption We shall see that TEM analysis is of crucial importance in order to
correlate the structural changes with the optical absorption data
2 Optical absorption properties of metal nanoparticles the surface plasmon
resonance
21 The Mie theory
It was mentioned in the introduction that a reduction in particle size leads to
diŒerent physical and especially optical properties [1plusmn 3 8plusmn 11 23 58plusmn 60] Reducing the
size of the nanoparticle has a pronounced eŒect on the energy level spacing as the
system becomes more conreg ned Similar to a particle in a box the energy separation
between adjacent levels increases with decreasing dimensions This is most pronounced
for semiconductor nanoparticles where the bandgap energy increases with decreasing
size and the onset of the bandgap transition is shifted to higher frequencies [3 8plusmn 10
24plusmn 26 61] Since the exciton radius is typically 2plusmn 8 nm for IIplusmn VI semiconductors
particles of several nanometres in diameter are expected to undergo the transition
from the bulk to the quantum-conreg ned state Quantum size eŒects are also known for
metal nanoparticles [21 22] In order to observe the localization of the energy levels the
size must be well below 2 nm as the level spacing has to exceed the thermal energy
(about 26 meV) There is a simple explanation for this fundamental diŒerence In a
414 S Link and M A El-Sayed
semiconductor the interesting level spacing is the energy diŒerence between the
completely reg lled valence band and the empty conduction band which corresponds to
the interband transition This energy separation is of the order of a few electronvolts
and increases rapidly with decreasing size [61] In a metal the conduction band is half-
reg lled and the density of energy levels is so high that a noticeable separation in energy
levels within the conduction band (intraband transition) is only observed when the
nanoparticle is made up of just a few atoms (N macr 100) In fact the level spacing of the
one electron states can be roughly approximated by EFN [21plusmn 23] where the Fermi
energy EF
is typically of the order of 5 eV in most metals A 10 nm gold nanoparticle
consisting of roughly 30000 atoms would therefore have an energy level spacing of
only 0 plusmn 167 meV On the other hand this simple approximation translates into a
transition energy of 167 meV for a 30-atom cluster which exceeds the thermal energy
Experimentally an increased bandgap between the lowest unoccupied (molecular)
orbital (LUMO) and the highest occupied (molecular) orbital has been found to be
around 1 plusmn 7 eV or 730 nm for a 28-atom gold cluster [62]
The surface plasmon resonance is the coherent excitation of all the `free rsquo electrons
within the conduction band leading to an in-phase oscillation [1 4 58plusmn 60] The
surface plasmon resonance does not give rise to the most intense absorption for very
small clusters but is rather strongly damped [23 63plusmn 65] For the larger particles of
several tens of nanometres in which their size is still small compared with the
wavelength of light excitation of the surface resonance can take place with visible
light For the same particles the volume plasmon is located at very high energies (6plusmn 9
eV) [23] The surface obviously plays a very important role for the observation of the
surface plasmon resonance as it alters the boundary conditions for the polarizibility of
the metal and therefore shifts the resonance to optical frequencies In this sense the
surface plasmon absorption is a small particle (or thin layer) eŒect but dereg nitely is not
a quantum size eŒect
Figure 2(a) shows how one can picture the creation of a surface plasmon
oscillation in a simple manner The electric reg eld of an incoming light wave induces a
polarization of the (free) conduction electrons with respect to the much heavier ionic
core of a spherical nanoparticle The net charge diŒerence occurs at the nanoparticle
boundaries (the surface) which in turn acts as a restoring force In this manner a
dipolar oscillation of the electrons is created with period T Figure 2(b) shows the
surface plasmon absorption of 22 48 and 99 nm gold nanoparticles [56] prepared in
aqueous solution by the reduction of gold ions with sodium citrate [34 35] The
absorption spectra of the diŒerent particles are normalized at their surface plasmon
absorption maximum for comparison The molar extinction coe cient is of the order
of 1 not 10 Mshy cmshy for 20 nm nanoparticles and increases linearly with increasing
volume of the particles [11] Note that these extinction coe cients are three to four
orders of magnitude higher than those for the very strong absorbing organic dye
molecules From reg gure 2(b) it can be seen that the surface plasmon absorption red
shifts with increasing size while the bandwidth increases in the size region above 20 nm
[56] These trends for particles of diŒerent sizes will be discussed theoretically in the
following paragraphs
Dating back to 1908 Mie [19] was the reg rst to explain the red colour of gold
nanoparticle solutions He solved Maxwellrsquo s equation for an electromagnetic light
wave interacting with small spheres having the same macroscopic frequency-
dependent material dielectric constant as the bulk metal The solution of this
electrodynamic calculation with appropriate boundary conditions for a spherical
Radiati Š e non-radiati Š e and photothermal properties of gold nanocrystals 415
Figure 2 Surface plasmon absorption of spherical nanoparticles and its size dependence (a)A scheme illustrating the excitation of the dipole surface plasmon oscillation The electricreg eld of an incoming light wave induces a polarization of the (free) conduction electronswith respect to the much heavier ionic core of a spherical gold nanoparticleA net chargediŒerence is only felt at the nanoparticle boundaries (surface) which in turn acts as arestoring force In this way a dipolar oscillation of the electrons is created with period TThis is known as the surface plasmon absorption (b) Optical absorptionspectra of 22 48and 99 nm spherical gold nanoparticles The broad absorption band corresponds to thesurface plasmon resonance
object leads to a series of multipole oscillations for the extinction cross-section of the
nanoparticles [23 58plusmn 60] By series expansion of the involved reg elds into partial waves
one obtains the following expressions for the extinction cross-section rext
and
scattering cross-section rsca
[23]
rext
macr2 p
rkr
cent
L=
(2Lshy 1) Re (aLshy b
L) (21)
rsca
macr2 p
rkr
cent
L=
(2Lshy 1) (raLrshy rb
Lr) (22)
with rabs
macr rextreg r
scaand
aL
macrmw
L(mx) w
L(x) reg w
L(mx) w
L(x)
mwL(mx) g
L(x) reg w
L(mx) g
L(x)
bL
macrw
L(mx) w
L(x) reg mw
L(mx) w
L(x)
wL(mx) g
L(x) reg mw
L(mx) g
L(x)
m macr nnm
where n is the complex refractive index of the particle and nm
the real
refraction index of the surrounding medium k is the wave-vector and x macr rkrr with r
416 S Link and M A El-Sayed
being the radius of a nanoparticle wL
and gL
are the Ricattiplusmn Bessel cylindrical
functions The prime indicates diŒerentiation with respect to the argument in
parentheses L is the summation index of the partial waves L macr 1 corresponds to the
dipole oscillation as illustrated in the reg gure 2 (a) while L macr 2 is associated with the
quadrupole oscillation and so on
For nanoparticles much smaller than the wavelength of light (2r rsquo k or roughly
2r kmax
10) only the dipole oscillation contributes signireg cantly to the extinction
cross-section [1 4 23 58plusmn 60] The Mie theory then reduces to the following
relationship (dipole approximation)
rext
(x) macr 9x
ce$m
Ve(x)
[e(x) shy 2e
m]shy e
(x)
(23)
where V is the particle volume x is the angular frequency of the exciting light c is the
speed of light and em
and e(x) macr e(x) shy ie
(x) are the dielectric functions of the
surrounding medium and the material itself respectively While the reg rst is assumed to
be frequency independent the latter is complex and is a function of energy The
resonance condition is fulreg lled when e(x) macr reg 2e
mif e
is small or weakly dependent
on x [23]
The above equation has been used extensively to explain the absorption spectra of
small metallic nanoparticles in a qualitative as well as quantitative manner [23 63]
However for larger nanoparticles (greater than about 20 nm in the case of gold) where
the dipole approximation is no longer valid the plasmon resonance depends explicitly
on the particle size as x is a function of the particle radius r The larger the particles
become the more important are the higher-order modes as the light can no longer
polarize the nanoparticles homogeneously These higher-order modes peak at lower
energies and therefore the plasmon band red shifts with increasing particle size [23
58plusmn 60] At the same time the plasmon bandwidth increases with increasing particle
size This is illustrated experimentally from the spectra shown in reg gure 2(b) It also
follows from the Mie theory As the optical absorption spectra depend directly on the
size of the nanoparticles this is regarded as an extrinsic size eŒects [23]
The plasmon bandwidth can be associated with the dephasing of the coherent
electron oscillation [56 66plusmn 73] Large bandwidth corresponds to rapid loss of the
coherent electron motion Electron dephasing times of a few femtoseconds are
computed from the surface plasmon bandwidth which strongly suggests that the main
relaxation process involves electronplusmn electron collisions [56] If one assumes a simple
two-level model for the plasmon absorption the width C is then given by [66]
1
T
macr p c C macr1
2T
shy1
T $
(24)
T
describes the population relaxation time (involving both radiative and non-
radiative processes) T
is the total dephasing time and T $
is the pure dephasing time
The latter results from collisions that change the plasmon wave-vector but not its
energy Often T $
is much shorter than the energy relaxation Tand thus determines the
value of T
Assuming a homogeneous size distribution and therefore homogeneous line
broadening the total dephasing time can be computed from the measured width of the
plasmon absorption band Using equation (24) with the spectra shown in reg gure 2(b)
Radiati Š e non-radiati Š e and photothermal properties of gold nanocrystals 417
dephasing times of 4 plusmn 1 3 plusmn 9 and 2 plusmn 6 fs are calculated for the 22 44 and 99 nm gold
particles respectively [56] Kreibig et al [67] determined dephasing times of 2 fs for 2
nm silver clusters embedded in a matrix and 7 fs for the same clusters in vacuum
(naked clusters) These extremely fast dephasing times are in agreement with nonlinear
frequency mixing studies on gold nanoparticles by Heilweil and Hochstrasser [66]
They found that both T
and T
are shorter than 48 fs More recent nonlinear studies
came to the conclusion that the dephasing time of the coherent plasmon oscillation is
shorter than 20 fs [68] These results also agree with studies on lithographically
produced gold and silver nanoparticles (about 200 nm in size) [70plusmn 72] for which
dephasing times of 6 and 10 fs were measured by second-order nonlinear auto-
correlation femtosecond spectroscopy [72] Furthermore recent single nanoparticle
investigations with a scanning near-reg eld optical microscope found a homogeneous
linewidth of only 160 meV for some individual particles corresponding to a dephasing
time of 8 fs for 40 nm gold nanoparticles in a solplusmn gel TiO
matrix [73]
The situation concerning the size dependence of the optical absorption spectrum is
more complicated for smaller nanoparticles for which only the dipole term is
important As can easily be seen from equation (23) the extinction coe cient does not
depend on the particle dimensions which would imply that the surface plasmon
absorption becomes size independent for particles smaller than about 20 nm A size
dependence is observed experimentally [4 11 23 63] For 5 nm particles the plasmon
oscillation is strongly damped and its absorption becomes weak and broad and it
completely disappears for nanoparticles less than about 2 nm in diameter [32 64 65]
This is because the electron density in the `conduction rsquo band becomes very small
Obviously the assumption of bulk-like electronic bands and bulk electronic and
optical properties associated with the electronic structure of the nanoparticles is rather
questionable In particular the use of the bulk dielectric constant which enters the Mie
equation as the only material-related physical quantity is not justireg ed any longer [4
23 63] However as the Mie theory has been very successful in describing the optical
absorption spectra of metal nanoparticles [4 23 58plusmn 60] the theory was modireg ed in a
way to account for the size eŒects rather than abandon it altogether
In almost all the many theoretical models published it is assumed that the dielectric
constant of the material is size dependent (e(x r)) below an average particle diameter
of about 20 nm [23 63] In one of the early approaches Kreibig and von Fragstein [74]
and Kreibig [75] proposed that electronplusmn surface scattering must be enhanced in those
small particles since the mean free path of the conduction electrons is limited by the
physical dimension of the nanoparticle The mean free path of the electrons in silver
and gold is of the order of 40plusmn 50 nm [76] If the electrons scatter with the surface in an
elastic but totally random way the coherence of the overall plasmon oscillation is lost
Inelastic electronplusmn surface collisions would also change the phase The smaller the
particles the faster the electrons reach the surface of the particles The electrons can
then scatter at the surface and lose the coherence more quickly than in a larger
nanoparticle As a consequence the plasmon band width increases with decreasing
nanoparticle radius Indeed it was shown theoretically [63 74 75] and experimentally
[46 74 75 77 78] that the plasmon band width is inversely proportional to the particle
radius
Following the model of the reduction of the eŒective electron mean free path and
enhanced electronplusmn surface scattering [74 75] the mathematical formulation of this
problem explaining the correct size dependence of the surface plasmon absorption
starts with writing the dielectric function as a combination of an interband term eIB
(x)
418 S Link and M A El-Sayed
and a Drude term eD(x) considering only the free conduction electrons (e(x) macr
eIB
(x) shy eD(x)) The latter is given within the free-electron model by the following
expression [76]
eD(x) macr 1 reg
xp
x shy ic x (25)
where xpmacr nee
m
effis the bulk plasmon frequency expressed in terms of the free
electron density n and the electron charge e e
is the vacuum permittivity and meff
the
electron eŒective mass c is introduced as a phenomenological damping constant It is
equal to the plasmon absorption bandwidth C for the case of a perfectly free-electron
gas in the limit c rsquo x [23] The damping constant c is related to the lifetimes of all
electron scattering processes which are mainly electronplusmn electron electronplusmn phonon
and electronplusmn defect scattering in the bulk material [23]
cmacr
i
sshy i
macr sshy eplusmn e
shy sshy e plusmn ph
shy sshy e plusmn d
(26)
where c
is the bulk damping constant As already mentioned above for nanoparticles
smaller than the mean free path of the conduction electrons electronplusmn surface
scattering is believed to be important as well An additional term accounting for
electronplusmn surface scattering is added to equation (26) and c then becomes a function
of the particle radius r as follows [74 75]
c(r) macr cshy
A ŠF
r (27)
where A is a theory-dependent parameter which is dependent on the details of the
scattering process (eg isotropic or diŒuse scattering) [23 63] and ŠF
is the velocity of
the electrons at the Fermi energy This size eŒect is considered an intrinsic size eŒect
[23] since the material dielectric function itself is size dependent in contrast with the
extrinsic size eŒect in large particles (ie r 20 nm)
This model gives the correct 1r dependence [46 74 75 77 78] of the plasmon
bandwidth as a function of size for nanoparticles described by the dipole ap-
proximation in the intrinsic size region (r 20 nm) The parameter A is mostly used
as a reg t parameter of the experimental results However the best advantage of this
theory is probably the fact that it provides a very good description for the dependence
of the particle dielectric constant on size The modireg cation of the dielectric constant
is done in a straightforward manner However there exist many more theories [79plusmn 89]
discussing how diŒerent factors such as the changes in the band structure
environmental changes or the `spill-out rsquo of the conduction electrons can be
incorporated into a size-dependent dielectric function and thus into the main
framework of the Mie theory Other theories calculate the optical response from reg rst
principles by quantum-mechanical methods [87] or by the use of the jellium model for
small clusters [88] This is rather di cult to use by most synthetic or physical chemists
trying to explain trends in the optical absorption spectra as a function of particle size
A compilation and comprehensive overview of these theories with references to the
original work can be found in [23] While all of them predict a 1r dependence of the
plasmon bandwidth the calculated slope of this relationship covers a wide range of
Radiati Š e non-radiati Š e and photothermal properties of gold nanocrystals 419
values More complicated is the prediction of the resonance absorption maximum as
a function of particle size as many theories predict both a red shift and a blue shift with
decreasing particle size [23 63] The fact that both trends are also observed
experimentally makes it di cult to assign the origin of the band maximum shift with
size
A good comparison between diŒerent sizes can also be di cult since most
preparation methods are only able to synthesize nanoparticles in a limited size range
The chemical reduction with sodium citrate for example is limited to sizes above 5 nm
[33plusmn 35] while the thiolate-stabilized gold clusters produced by reduction with sodium
borhydride are only stable for diameters below 5 nm [28 32 64 65] The
monodispersity of each sample in comparison with the others is also important as
inhomogeneous broadening can complicate size dependence studies While one might
think that a comparison between particles prepared by diŒerent methods should be
possible as the same gold core is present in all the nanoparticles (the fcc crystal
structure does not change with decreasing particle size) the capping ligands (matrix)
around the particle surface can have a very important inmacr uence on the plasmon
bandwidth and position [1 4 63 67 89 90] Henglein and co-workers [90] have shown
that molecules adsorbed on silver nanoparticles will cause a pronounced broadening
and damping of the surface plasmon resonance One of the most recent theories that
attempts to explain the size dependence of small nanoparticles in the intrinsic size
range takes explicitly into account the chemical nature of the molecules capping the
particles Persson [89] developed a model known as the chemical interface damping
(CID) model In this model the empty LUMOs of the acceptor molecules on the
particle surface are coupled to the free electrons in the conduction band of the metal
The smaller the energy diŒerence between the donor and acceptor levels the stronger
is the coupling Electron transfer between the levels becomes possible after excitation
of a plasmon resonance Excited electrons transfer into the empty acceptor levels and
then back This causes their loss of coherence with the rest of the electrons excited
during the plasmon excitation This then corresponds to a broader bandwidth of the
plasmon absorption As the electronic structure (and therefore the energy position of
the LUMO) varies for diŒerent adsorbate molecules it is expected that the plasmon
resonance of the same metal cluster will experience diŒerent degrees of damping
depending on the specireg c adsorbed molecules Kreibig and co-workers [67 91] have
shown experimentally how the plasmon band broadens when the same silver clusters
produced in the gas phase are reg rst deposited on a SiO
substrate and then later
embedded in SiO
by co-deposition of SiO In this unique experiment they were able
to measure the surface plasmon absorption of 2 nm silver nanoparticles in the gas
phase deposited on a substrate and embedded in a matrix The plasmon bandwidth
increases as the clusters are surrounded by more SiO
molecules as expected from the
model proposed by Persson [89] They furthermore found very good quantitative
agreement with the CID of the surface plasmon resonance Therefore it was proposed
that the surface plasmon absorption could serve as a sensitive chemical sensor of the
particle environment [92]
22 Shape-dependent radiati Š e properties the Gans theory
While size and environment (matrix) eŒects are very important shape eŒects seem
to be even more pronounced in the optical absorption spectrum of gold nanoparticles
[44 47 53] The plasmon resonance absorption band splits into two bands as the
420 S Link and M A El-Sayed
Figure 3 Size-dependent surface plasmon absorption of gold nanorods Optical absorptionspectra of gold nanorods with mean aspect ratios of 2 plusmn 7 ([[[[[) and 3 plusmn 3 (plusmn plusmn plusmn ) are shownThe short-wavelength absorption band is due to the oscillation of the electronsperpendicular to the major axis of the nanorod while the long-wavelength band is causedby the oscillation along the major axis The absorption bands are referred to as thetransverseand longitudinal surface plasmon resonancesrespectivelyThe former is ratherinsensitive towards the nanorod aspect ratio in contrast with the longitudinal surfaceplasmon band which red shifts with increasing aspect ratio This is illustrated in the insetwhere the two band maxima (() transverse mode (D) longitudinal mode) are plottedagainst the nanorod aspect ratio R
particles become more elongated along one axis [58plusmn 60] The aspect ratio is the value
of the long axis (length) divided by the short axis (width) of a cylindrical or rod-shaped
particle As the aspect ratio increases the energy separation between the resonance
frequencies of the two plasmon bands increases [58plusmn 60] The high-energy band
absorbing at around 520 nm corresponds to the oscillation of the electrons
perpendicular to the major (long) rod axis and is referred to as the transverse plasmon
absorption This absorption band is relatively insensitive to the nanorod aspect ratio
[44 47 53] and coincides spectrally with the surface plasmon oscillation of the
nanodots The other absorption band at lower energies is caused by the oscillation of
the free electrons along the major (long) rod axis and is known as the longitudinal
surface plasmon absorption Figure 3 shows the absorption spectra of two nanorod
samples having aspect ratios of 2 plusmn 7 and 3 plusmn 3 The samples were prepared electro-
chemically using micelles as the rod-shaping and stabilizing agents [44 53] Figure 3
shows that the longitudinal plasmon band maximum (open circles) red shifts with
increasing aspect ratio while the transverse absorption band maximum (open squares)
does not change [44 47 53 93]
The optical absorption spectrum of a collection of randomly oriented gold
nanorods with aspect ratio R can be modelled using an extension of the Mie theory
Within the dipole approximation according to the Gans [94] treatment the extinction
cross-section rext
for elongated ellipsoids is given by the following equation [58]
rext
macrx
3ce$m
Vj
(1Pj) e
sup2 e
shy [(1 reg P
j)P
j] e
macute shy e
(28)
Radiati Š e non-radiati Š e and photothermal properties of gold nanocrystals 421
where Pjare the depolarization factors along the three axes A B and C of the nanorod
with A B macr C dereg ned as
PA
macr1reg e
e 9 1
2eln 0 1 shy e
1 reg e 1 reg 1 (29)
PB
macr PC
macr1 reg P
A
2 (210)
and the aspect ratio R is included in e as follows
e macr 9 1 reg 0 BA 1
macr 0 1reg1
R 1 (211)
23 EŒecti Š e dielectric function of a metalplusmn host composite material the Maxwell-
Garnett theory
In general the Mie theory is only valid for very low concentrations of the
nanoparticles in a solvent or solid matrix [23 58] It is assumed that the individual
particles are non-interacting and separated from one another Therefore the electric
reg eld created around one particle by the excitation of a surface plasmon resonance is
not felt by the other surrounding particles If the interparticle distances become
smaller than the particle dimension or if aggregation occurs the plasmon resonance
red shifts and often a second absorption peak at a longer wavelength is observed [23
63 95plusmn 97] This band could be regarded as a longitudinal resonance absorption similar
to the nanorods in the case of chain-like aggregation of the individual nanodots In the
case of particle aggregation and for composite materials such as densely packed
nanoparticles in a transparent host medium the eŒective-medium theories are better
suited to explain their optical absorption spectra [23 58 63]
The Maxwell-Garnett [57] theory is an eŒective-medium theory It treats the
metalplusmn dielectric composite material in which the particles are embedded and isolated
from each other The particle dimension and interparticle distances are considered to
be inreg nitely small compared with the wavelength of the interacting light [58] The
Maxwell-Garnett theory is based on the Clausiusplusmn Masotti equation and it assumes
that it is justireg ed to describe the composite material containing metal nanoparticles
embedded in an inert host medium by an eŒective complex dielectric constant ec
such
that [23 48plusmn 51 58 98 99]
ec reg e
m
ecshy j e
m
macr fm
e reg em
e shy j em
(212)
where e and em
are the dielectric constants of the metal nanoparticles and the host
medium respectively In contrast with the Mie theory em
is also a complex function
depending on the frequency of light fm
is the volume fraction of the metal
nanoparticles in the composite material and j is a screening parameter The latter is
related to the shape of the nanoparticles [98 99] It has a value of two for spherical
particles and equals one for long nanorods oriented with their axes of revolution
parallel to the direction of the incident light Its value approaches inreg nity for macr at discs
oriented with their axes of revolution perpendicular to the incident light [48plusmn 51] With
knowledge of e and em
from the literature and an estimation of fm
from the sample
preparation procedure the dielectric constant ec
of the composite material can be
422 S Link and M A El-Sayed
computed with equation (212) The absorption spectrum of the metal nanoparticles in
a transparent non-interacting host medium can then easily be calculated as the
dielectric constant is related to the optical refractive index nc
and the absorption
coe cient kc
in the following way [58]
ecmacr n
cmacr e
cshy ie
c (213a)
e cmacr n
c reg kc (213b)
e cmacr 2 n
ck
c (213 c)
Martin and co-workers [48plusmn 52] have used an extended Maxwell-Garnett theory in
order to explain the optical absorption spectra of needle-like and pancake-like gold
nanoparticles in a porous alumina membrane The particles are prepared by
electrochemical deposition of the gold into the nanopores of the aluminium oxide
template The particles are all well aligned in one direction parallel to each other and
the aspect ratio was controlled by the deposition time
Palpant et al [100] synthesized gold clusters in an alumina matrix in the size range
2plusmn 4 nm by laser vaporization of the metal and co-deposition with a dielectric vapour
as a thin reg lm on a substrate The surface plasmon absorption of these small gold
nanoparticles is strongly damped and blue shifts with decreasing particle size They
explained their experimental results by use of the Maxwell-Garnett theory and in
combination with calculations based on the time-dependent local-density approxi-
mation [100]
3 Luminescence properties of metal nanoparticles
Photoluminescence from bulk copper and gold was reg rst observed by Mooradian
[101] and has been used extensively in characterizing the carrier relaxation and the
band structure of metals [102plusmn 107] It was found that the emission peak was centred
near the interband absorption edge of the metal and therefore was attributed to direct
radiative recombination of the excited electrons in the sp band with the holes in the d
band [107] However the quantum e ciency of the photoluminescence from bulk
noble metals is very low typically of the order of 10shy [101] A theoretical model
explaining the radiative recombination in noble metals was developed by Apell and
Monreal [106] Because of the slight overlap between the sp conduction band and the
d band the luminescence band shows a Stokes shift [107] A more extensive
experimental study on the photoluminescence of copper silver and gold was carried
out by Boyd et al [103] They were able to model their experimental results and
determined the relation between the spectral peaks and the interband recombination
transitions at selected symmetry points in the Brillouin zone
Furthermore Boyd et al [103] studied the eŒect of the surface roughness on the
photoluminescence properties of noble metals The luminescence was found to be
enhanced by several orders of magnitude on rough metal surfaces which is known as
the lightning rod eŒect [103 108 109] The rough metal surface can be regarded as a
collection of randomly oriented hemispheroids of nanometre size dimension on a
smooth surface These hemispheroids show a surface plasmon resonance and therefore
the incoming and outgoing electric reg elds are amplireg ed by the local reg eld induced
around the hemispheroids by the plasmon resonances [103 108 109]
The same local reg eld eŒect is also observed in the Raman scattering from molecules
absorbed on rough surfaces of noble metals nanoparticle aggregates or single
nanoparticles [15 16 110plusmn 118] The surface-enhanced Raman scattering (SERS)
Radiati Š e non-radiati Š e and photothermal properties of gold nanocrystals 423
Figure 4 Size dependence of the luminescence properties of gold nanorods The main plotshows macr uorescencespectra of nanorodshaving mean aspect ratios of 2 plusmn 6 3 plusmn 3 and 5 plusmn 4 Themacr uorescence spectra are normalized at their respective maxima and the excitationwavelength was 480 nm The macr uorescence maximum red shifts with increasing aspectratio R This dependence is found to be linear as illustrated in the inset
signal is enhanced by several orders of magnitude While the chemical nature of the
absorbed molecule and the bonding to the metal surface plays a role in SERS [110 111]
it is also recognized that an important component of the enhanced Raman scattering
is due to the enhancement of the electromagnetic reg elds close to the nanoparticle
surface [15 16 112 113] The nanoparticles can therefore be regarded as nano-
amplireg ers and since the discovery of this eŒect SERS spectroscopy has been studied
intensively [15 16 110plusmn 118] It is a convenient tool of increasing the sensitivity of an
otherwise weak Raman signal
A similar enhancement has recently been found by our group for the luminescence
of gold nanorods [119] The luminescence e ciency is increased by six orders of
magnitude because of the lightning rod eŒect Figure 4 shows the steady-state
macr uorescence spectra of three gold nanorod samples having average aspect ratios of 2 plusmn 6
3 plusmn 3 and 5 plusmn 4 after excitation at 480 nm The spectra reveal the presence of an emission
band between 550 and 600 nm The macr uorescence maximum red shifts with increasing
nanorod aspect ratio This is illustrated in the inset of reg gure 4 where the band
maximum of the macr uorescence emission is plotted against the nanorod aspect ratio A
linear dependence was found experimentally [119] However the luminescence
quantum e ciency increases linearly with increasing square of the aspect ratio [119]
On the other hand gold nanodots with diameters of between 10 and 30 nm prepared
by the same electrochemical method do not show a comparable emission This leads
to the conclusion that the longitudinal plasmon resonance absorbing at a longer
wavelength is more eŒective in amplifying the macr uorescence intensity in gold
nanoparticles than the surface plasmon resonance of spheres This could be because
the longitudinal plasmon resonance is less damped and has a much larger oscillator
strength
Wilcoxon et al [120] reported that very small spherical gold clusters (less than 5
nm) show an emission at 440 nm when excited at 230 nm The quantum yield is
increased to 10shy plusmn 10shy amp which is comparable with the enhancement of the photo-
424 S Link and M A El-Sayed
Figure 5 Theoretical modelling of the luminescence enhancement for gold nanorods withvarious aspect ratios (a) The calculated single-photon luminescence power P
lrE
rb
lemitted from gold nanorods as a function of the emission wavelength and the nanorodaspect ratio The excitation wavelength was chosen to be 500 nm (b) The calculatedsingle-photonluminescencepower P
lrE
rb
lemitted from gold nanorods as a function of
the excitation wavelength and the nanorod aspect ratio The emission wavelength waschosen to be 650 nm
Radiati Š e non-radiati Š e and photothermal properties of gold nanocrystals 425
luminescence of gold nanorods These workers [120] showed that the luminescence is
absent in larger nanodots of 15 nm diameter and concluded that the photoluminescent
signal is aŒected by the capping ligands such as thiols or amines
In the above studies [119 120] the origin of the photoluminescence was attributed
to the radiative recombination of an electronplusmn hole pair The incident photons are
initially absorbed by the d-band electrons leading to interband transitions The
photon energy promotes these electrons from the reg lled d band to electronic states
above the Fermi level in the sp conduction band Even if the excitation is carried out
in the plasmon band rapid relaxation to the interband transition must take place
Electrons and holes relax by phonon scattering processes and some recombine
radiatively to give rise to the observed luminescence Such an intrinsic emission proreg le
is however modireg ed by the local reg eld induced around the nanoparticles owing to
excitation of the plasmon resonance The theory of the local reg eld eŒect has been
successfully applied in various cases to explain results on second-harmonic generation
[108] SERS [109] and luminescence [103] observed from rough noble metal surfaces
In order to test this mechanism for the photoluminescence enhancement in gold
nanorods we calculated the photoluminescence power of gold nanorods as a function
of the emission wavelength and the nanorod aspect ratio [119] According to the
theoretical studies of the photoinduced luminescence [103] from rough surfaces of
noble metals the incoming and outgoing reg elds are proposed to be enhanced via
coupling to the local plasmon resonances The rough surface is assumed to be a
random collection of non-interacting hemispheroids of height a and radius b The
volume is V macr $p ab The local reg eld correction factor L(x) within the spheroid is then
given by [103 109]
L(x) macrL
LR
e(x) shy i e
(x) reg 1 shy L
LRsup2 (1 shy i 4 p V ) [1 reg e
(x) reg i e
(x)]3k$ acute
(31)
where LLR
called the lightning-rod factor is dereg ned as LLR
macr 1A where
A macr1
1 reg n Q (n)Q
(n)
n macr1
[1 reg (ba)]
Q(n) macr
n
2ln 0 n shy 1
n reg 1 1 reg 1 Q (n) macr
dQ(n)
dn
From equation (31) the single-photon luminescence power Plcan be calculated [103]
for excitation and emission energies hxexc
and hxem
Plmacr b
l2 rE
r V rL(x
exc) L(x
em)r (32)
where blis a constant that includes the intrinsic luminescence spectrum of the gold and
E
is the incident electric reg eld
Assuming that the luminescence enhancement of the gold nanorods is due to the
local reg eld factor PlrE
rb
lwas calculated as a function of the gold nanorod aspect
ratio and emission wavelength The excitation wavelength was 500 nm The results of
these calculations [119] are shown in reg gure 5 (a) The resonant luminescence power
increases with increasing nanorod aspect ratio (lightning-rod eŒect) and shifts to
longer emission wavelength Furthermore note that PlrE
rb
lis of the order of 10(
426 S Link and M A El-Sayed
Both the red shift of the photoluminescence of the gold nanorods and the magnitude
of the luminescence power due to the local reg eld correction factor are in good
agreement with the experimental results [119]
PlrE
rb
lwas also calculated as a function of the excitation wavelength and the
gold nanorod aspect ratio for a reg xed volume The emission wavelength was set at 650
nm The results of this calculation are shown in reg gure 5(b) for the 200plusmn 650 nm
excitation wavelength range PlrE
rb
lis resonantly enhanced for an aspect ratio of
about 4 plusmn 5 This value of the aspect ratio depends critically on the chosen emission
wavelength Furthermore the luminescence power greatly increases with increasing
excitation wavelength
From the calculation in reg gure 5 it follows that the luminescence power increases
linearly with increasing square of the nanorod aspect ratio (or increasing square of the
length for a reg xed nanorod width) while a linear dependence on the aspect ratio is found
for the wavelength of the emission maximum These results are in good agreement with
the experimental observations This fact therefore strongly supports the assignment
of the origin of the macr uorescence from gold nanorods This also suggests that the
mechanism of the large enhancement in the luminescence e ciency is a result of the
great enhancement of the reg eld of the incoming exciting light and the outgoing emitted
light via the coupling to the surface plasmon resonance
4 Electron dynamics in gold nanoparticles probed by femtosecond transient
absorption spectroscopy
41 Introduction
In order to study the interaction between the electrons and the lattice vibrations
(phonons) in bulk materials time-resolved transmission and remacr ectivity [121plusmn 132] as
well as two-photon photoemission spectroscopies [133plusmn 138] have been used on thin
reg lms of metals and semiconductors A better understanding of the thermal and
electrical conductivity and also superconductivity was one of the goals of this research
With the advancement of ultrashort laser pulses one can selectively excite the
electrons of the metal and then follow the electronplusmn phonon coupling in real time It
was suggested [121 122] that this should in principle be possible with laser pulses
shorter than the electronplusmn phonon energy relaxation time Because of the high electron
density in metals electronplusmn electron interactions were expected to be strong enough to
thermalize the electron gas within the duration of the exciting laser pulse According
to the two-temperature model (TTM) [139] the electrons and the lattice can be treated
as two coupled subsystems The separation of the electron gas and the lattice is
justireg ed because of the large diŒerence in their heat capacities The electrons absorb
the photon energy leading to a non-equilibrium temperature diŒerence between the
electron gas and the lattice directly after the laser pulse Electronplusmn phonon collisions
then give rise to the excitation energy exchange between the electron subsystem and
the lattice (energy relaxation T) In this manner a thermal equilibrium is reached The
time evolution of the electron and the lattice temperatures are expressed math-
ematically by the following two coupled diŒerential equations within the TTM [139]
Ce(T
e)brvbarT
e
brvbartmacr reg g(T
ereg Tl) shy x[(j laquo x T
e) shy LP(z t) (41)
Cl
brvbarTl
brvbartmacr g(T
ereg Tl) (42)
Radiati Š e non-radiati Š e and photothermal properties of gold nanocrystals 427
Figure 6 Schematic illustration of the electron distributionin the conductionband of a metal(nanoparticle) (a) Before laser excitation all states below the Fermi energy are occupiedwhile all states above the Fermi energy are unoccupied This would correspond to aninitial temperatureof 0 K which was chosen for simplicity in this case (b) Excitation witha laser pulse promotes electrons with energies of up to the excitation energy below theFermi energy to states above the Fermi energy having a maximum energy equal to theexcitation energy (2 eV or 620 nm in this illustration) This electron distribution is a non-thermal electron distribution with regard to Fermiplusmn Dirac statistics which describes theelectron distribution for a given electron temperature This non-thermal electrondistribution relaxes (thermalizes) by electronplusmn electron scattering without losing theabsorbed photon energy (c) In this case an electron temperature of 1000 K is reached(Energy conservation requires that the areas under the curves in (b) and (c) for energiesgreater than the Fermi energy have to be equal) Electronplusmn phonon coupling andphononplusmn phonon interactions with the surrounding medium lead to the cooling of theelectron gas as illustrated by the other curves in (c) Finally the system returns to itsstarting electron temperature (a)
where Ce
and Cl
are the electronic and lattice heat capacities respectively g is the
electronplusmn phonon coupling constant and j laquo is the electronic thermal conductivity
describing the heat transport away from the excited laser spot (which can be neglected
in case of the nanoparticles as they are smaller than the excitation spot) LP(z t) is the
spatial and temporal evolution of the exiting laser pulse The electronic heat capacity
Ce(T
e) is usually assumed to vary linearly with the electron temperature T
e
Although pumpplusmn probe laser spectroscopy measures the optical (transient ab-
sorption transmission or remacr ectivity) rather than thermal response of an excited
sample it is justireg ed in the case of metal reg lms to express the changes induced by the
pump pulse in terms of temperature changes This idea might be strange for a
molecular spectroscopist following the excitation of a single electron between two
electronic levels but the reason for this argumentation is that the metal reg lm can absorb
several photons The appropriate way to describe a new electron distribution within
the conduction band of the metal is by Fermiplusmn Dirac statistics [76] (after a rapid
internal electron relaxation by elastic electronplusmn electron collisions has taken place)
Each Fermi electron distribution is associated with an electronic temperature
Therefore the energy relaxation of the electron gas into the lattice motion is best
followed by its electronic temperature
The scheme in reg gure 6 illustrates the changes in the electronic energy distribution
within the conduction band of the metal after laser excitation For simplicity only
428 S Link and M A El-Sayed
intraband excitations are considered in this picture Furthermore it is assumed that
the experiment is carried out at an initial temperature of 0 K The electron distribution
f shown in reg gure 6(a) is calculated according to the Fermiplusmn Dirac statistics and has the
mathematical form [76]
f macr1
1 shy exp (E reg EFk T )
(43)
where k T EF
and E are the Boltzmann constant the temperature the Fermi energy
and the energy of the electronic energy levels respectively
Excitation with a wavelength of 620 nm corresponds to a photon energy of 2 plusmn 0 eV
This excites electrons having an energy of less than or equal to 2 plusmn 0 eV below the Fermi
level to electronic levels up to 2 eV above the Fermi level The corresponding electron
distribution is plotted in reg gure 6(b) This electron distribution is not the equilibrium
distribution according to the occupation dictated by the Fermiplusmn Dirac statistics for
fermions Electronplusmn electron scattering within the electron gas occurs until a new
Fermi electron distribution with a higher electron temperature is reached as illustrated
in reg gure 6(c) This leads to an internal electron thermalization [127 128] Electronplusmn
electron interactions are elastic and the overall energy is conserved during this reg rst
relaxation process External thermalization [127 128] with the phonon bath will then
initially lead to a temperature equilibration between the electron and the lattice
subsystems As the excited electrons above the Fermi level now lose their energy to the
phonons the Fermi distribution narrows until a situation shown in reg gure 6(a) is
reached assuming that there is also heat release to the surrounding system During the
external thermalization the temperature of the electron gas (and the lattice) decreases
steadily and the whole system returns to its original (ground) state prior to laser
excitation
Interband transitions lead to a very similar picture especially if one remembers that
recombination of the holes in the low-lying d band with any of the excited electrons
above the Fermi level or the unexcited electrons below the Fermi level occurs on the
tens of femtoseconds time scale [140plusmn 142] that is faster than or comparable with the
duration of the exciting laser pulse It is the high density of the charge carriers in the
conduction band that leads to fast interband relaxation If one assumes for the
interband relaxation that an Auger-type recombination mechanism process takes
place then highly excited electrons are present within the conduction shortly after the
excitation pulse These electrons have an average excess energy above the Fermi level
equal to the exciting photon energy as the holes in the d band have already been reg lled
by the initial electronplusmn electron scattering Although interband transitions might
therefore complicate the initial relaxation dynamics they should not change the
overall picture
Typical electronplusmn phonon relaxation times of the order of a few picoseconds were
measured for thin gold reg lms by time-resolved transmissivity and remacr ectivity [121plusmn 132]
as well as two-photon photoemission spectroscopy [133plusmn 138] using femtosecond laser
pulses By measuring the transient optical response of metal nanoparticles the eŒect of
size on the electronplusmn phonon coupling can directly be analysed The reduction in the
size and dimensionality of the material introduces new boundaries as in the
nanoparticle surfaces Enhanced electronplusmn surface scattering [74 75] was already
discussed as a mechanism for the dephasing of the coherent plasmon oscillation and
could also be important for the energy relaxation of hot electrons The reduction in the
density of electron and phonon states could further alter the relaxation dynamics in
Radiati Š e non-radiati Š e and photothermal properties of gold nanocrystals 429
these zero-dimensional dots However in the size range of gold nanoparticles
discussed so far (10plusmn 100 nm) the bulk gold band structure of the nanoparticles is
expected to be well developed The average energy spacing between adjacent energy
levels within the conduction band is small compared with the thermal energy
Quantum size eŒects in the relaxation dynamics are therefore expected to occur only
in very small gold clusters which lack an intense plasmon absorption The presence of
a well developed plasmon band can however be very advantageous in following the
optical response of excited metal nanoparticles as has been shown in many studies
[143plusmn 167] Furthermore for about 200 000 atoms in a 20 nm gold nanoparticle and
hence with many conduction electrons the same general theory (many-electron
excitation described by an eŒective electron temperature) as applied for metal reg lms
[121plusmn 138] can be used This especially holds because of the large extinction coe cients
of the gold nanoparticles Experimentally a transient broadening of the surface
plasmon absorption is observed which results in a bleach at the plasmon absorption
band maximum with two positive absorption features at higher and lower energies
The rate of the bleach recovery directly monitors the rate of the electronplusmn electron
electronplusmn phonon and phononplusmn phonon dynamics which will be illustrated in more
detail below
42 Theoretical modelling of the transient optical response
Theoretically the broadening of the plasmon band can be related to the changes
in the real and imaginary parts of the complex dielectric function [124 127 128 147
165 166] Changes in e
and ewill aŒect the plasmon absorption as can be shown from
equation (23) The changes in the real and imaginary parts of the dielectric function
can be related to the changes in the electron distribution function as suggested in a
model developed by Rosei et al [168 169] for continuous-wave thermomodulation
experiments Using the constant-matrix approximation the change in the imaginary
part of the dielectric function is given by [128]
D epound
1
(hm) amp D(E hm) D q dE (44)
where D(E hm) is the joint density of states with respect to the energy E of the reg nal state
and D q denotes the change in the electron distribution f as given by equation (43)
D(E hm) is calculated assuming parabolic band structures for the d band and
conduction band in the vicinity of the L point of the Brillouin zone [168] This
determines D efor a given change D q in the electron distribution The change D q in the
electron distribution for a thermalized electron gas is calculated from the diŒerence
between the two Fermi electron distributions at room temperature and at a higher
temperature corresponding to a certain laser excitation The change D ein the real part
of the dielectric constant is then computed from D e
using the Kramersplusmn Kronig
relationship [76]
D e(hm) macr
2
pP 0 amp hm laquo D e
(hm laquo )
(hm laquo )reg (hm)d(hm laquo ) 1 (45)
where P denotes a Cauchy principal value integral which extends over the whole
frequency range
The diŒerential transmission D TT of the gold nanoparticles at low excitation
levels is approximately equal to the change in absorption and can be expressed as
430 S Link and M A El-Sayed
Figure 7 Electronplusmn electron thermalization in spherical gold nanoparticles The plasmonbleach recovery of 22 nm gold nanoparticles probed at 530 nm is plotted against alogarithmic scale The excitation wavelength was 800 nm therefore exciting onlyintraband transitions The broken line corresponds to a reg t with a lifetime of 1 plusmn 7 ps Therecorded signal however shows a distinct deviation from a pure single-exponentialbehaviour at early delay times which was attributed to a reg nite electronplusmn electronthermalization (Note that this kinetic trace was originally a transientbleach signal beforeapplying the natural logarithm)
linear combinations of the induced changes D eand D e
in the real and imaginary parts
respectively of the dielectric constant [128]
D T
Tmacr
d(ln T )
de
D eshy
d(ln T )
de
D e (46)
The coe cients of proportionality can be calculated using the theoretical expression
for the plasmon band absorption as given by equation (23) This model has been used
successfully describing the optical response of metal nanoparticles excited by an
ultrashort laser pulse [147 165 166]
43 Electronplusmn electron thermalization in gold nanoparticles
Figure 7 shows a kinetic trace recorded at 530 nm after excitation with 800 nm
femtosecond laser pulses [166] The signal intensity is plotted on a logarithmic scale
A single-exponential decay neglecting the long-time component due to phononplusmn
phonon interactions should give a straight line However deviations from a linear
dependence at early times are clearly visible In fact the signal is not as intense as
would be expected from a purely single-exponential decay This observation can be
related to the non-thermal electron distribution [129] Calculation of the transient
absorption spectrum using the formalism and equations outlined above showed that
the bleaching of the plasmon band is less intense for a non-thermal than for a
thermalized electron distribution [128 166] Basically one observes a delayed rise in
the signal intensity corresponding to the internal thermalization of the electron gas
Using a rate equation model derived by Sun et al [128] for their measurements on thin
gold reg lms an electron thermalization time of 500 fs is obtained for the experimental
results shown in reg gure 7 [166] This relaxation time equals the time that it takes for
all the electrons to scatter with each other in such a way that a Fermi distribution is
Radiati Š e non-radiati Š e and photothermal properties of gold nanocrystals 431
reached This is of course longer than a scattering event involving only two electrons
which is of the order of 10 fs according to the Fermi-liquid theory [170] The reason
why the eŒect of these processes on the transient absorption is rather small (compared
with theoretical results) and why it is only detectable at low pump powers [166] is the
fact that processes outlined in reg gure 6 (electronplusmn electron electronplusmn phonon and
phononplusmn phonon scattering) are not really sequential processes Electronplusmn phonon
coupling will relax the hot initial electron distribution before an equilibrium Fermi
electron distribution can be fully established This is however taken into account in
the rate equation with which a thermalization time of 500 fs was calculated [128 166]
44 Electronplusmn phonon relaxation in gold nanoparticles
Figure 8(a) shows the transient absorption spectra of 15 nm gold particles at
diŒerent delay times after the excitation pulse [166] The excitation wavelength used
for these studies was 400 nm and was produced by second-harmonic generation using
the fundamental of an amplireg ed titanium sapphire laser system [166] The transient
absorption spectra are obtained by using a white-light continuum laser pulse with and
without pulsed excitation at diŒerent delay times The diŒerence spectrum between the
absorption of the gold nanoparticles after excitation and their `ground-state rsquo
(unexcited) absorption is then calculated as a function of time The plasmon band
bleaches at its maximum corresponding to a higher transmission of light of the excited
solution Two weaker absorption bands are also visible at lower and higher energies
than the plasmon band maximum [143plusmn 145 164plusmn 166] These spectral features are due
to a broadening of the surface plasmon resonance at higher electronic temperatures
Compared with the ground-state absorption a broader but less intense plasmon
absorption at a higher electronic temperature after laser excitation results in a bleach
and two positive absorptions in the transient spectrum (diŒerence spectrum) The fact
that the important parameter is the electronic temperature explains the observation
that the optical response is independent of the excitation wavelength [166] At 400 nm
or shorter wavelengths than the plasmon absorption interband transitions from the d
band to above the Fermi level are excited Excitation at the plasmon resonance will
cause the oscillation of the conduction electrons and basically results in the collective
excitation of all the conduction electrons This could be regarded as intraband
transitions which are also excited to the red of the plasmon band (In gold
nanoparticles of the size under study the onset for intraband transition coincides with
the plasmon maximum at about 2 plusmn 4 eV [171]) All these excitation processes result in
heating of the electron gas [166]
The laser-induced optical changes decay as the electronic temperature decreases
and thermal equilibration between the electrons and the lattice is established [144 147
164] The absorbed laser energy is then released to the surrounding medium by
phononplusmn phonon interactions [144 147 164] Measuring the bleach recovery as a
function of time gives the electronplusmn phonon and phononplusmn phonon relaxation times
Figure 8(b) shows such a kinetic trace The observation wavelength is 520 nm
coinciding with the plasmon band bleach maximum where the transient signal is most
sensitive The data in reg gure 8(b) [166] were obtained from the transient absorption
spectra recorded with a charge-coupled device camera by extracting the time
dependence at a certain wavelength from the measured spectra The plasmon bleach
recovery can be reg tted to a biexponential decay function giving relaxation times of 3 plusmn 4
and about 100 ps The reg rst component corresponds to the electronplusmn phonon
interactions [164] while the long-time component is the energy relaxation (phononplusmn
432 S Link and M A El-Sayed
Figure 8 Optical response of spherical gold nanoparticles after excitation with a femtosecondlaser pulse (a) The transient absorption spectra of 15 nm gold nanoparticles afterexcitation with 400 nm laser light The series of spectra corresponds to diŒerent delaytimes between the pump and probe pulses The plasmon band is bleached (negative
Radiati Š e non-radiati Š e and photothermal properties of gold nanocrystals 433
phonon interactions [164]) of the hot lattice to the surrounding medium The latter
reg nally leads to complete cooling of the whole nanoparticle Kinetic traces for other
wavelengths are also shown in reg gure 8(b) At 480 nm the signal reg rst shows absorption
and then bleaches at later times This can be explained by a red shift of the plasmon
resonance [147] due to a volume expansion of the hot particles and hence a lower
electron density and lower plasmon frequency (see section 2) Correspondingly the
transient absorption signal at 550 nm changes from a bleach into an absorption at a
comparable time delay of about 10 ps However the change in the absorption signal
at 550 nm not only could result from a red shift but also could be due to the narrowing
of the plasmon bleach as the Fermi electron distribution cools
A closer look at the kinetic traces at a longer wavelength than the plasmon band
maximum reveals that the transient absorption signal oscillates with a period of about
5 ps (reg gure 8(c)) Del Fatti et al [157 158] and also Hartland and co-workers [148
149] have shown that these quantum beats are indeed real and result from the low-
frequency acoustic breathing modes of the hot nanoparticles The acoustic breathing
modes are impulsively excited by the rapid heating of the particle lattice after laser
excitation [148 149 157 158] The volume of the nanoparticles increases and
decreases periodically owing to the excitation of these modes This in turn leads to a
shift in the plasmon band maximum as the free-electron density changes with the
volume A volume expansion causes a drop in the free-electron density and a red shift
of the plasmon which is associated with an increase in the plasmon bleach intensity at
low energies At high energies the acoustic breathing causes an oscillation of the
transient absorption which is 180 deg out of phase with respect to the signal observed at
low energies [158] It was further found that the frequencies of the acoustic modes are
inversely proportional to the nanoparticle radius [148 149 157 158]
Physically this transient behaviour of the plasmon band broadening is also
associated with a faster dephasing time T
of the coherent plasmon oscillation
[143plusmn 145] At higher temperatures the occupation of higher electronic states leads to
an increased electron scattering rate as known from the Fermi-liquid theory [170] and
thus to an increased damping of the plasmon oscillation Perner et al [144] found an
increase in the plasmon bandwidth of gold nanoparticles embedded in a solplusmn gel matrix
by 120 meV and calculated an average electronplusmn electron scattering rate of (10 fs)shy for
a hot electron distribution at 4000 K The decay of the transient plasmon band
broadening follows the same kinetics as the decay of the bleach intensity This is
illustrated in reg gure 9 for 15 nm gold nanoparticles The spectra are reg tted to a
Lorentzian line shape The left inset in reg gure 8 shows the linewidth decay while the
absorption)and two positive absorption bands are visible at higher and lower energies asindicated by the arrows The transient signal is due to a broadening of the plasmonresonance at higher electronic temperatures (b) The temporal evolution of the recordedspectra at certain wavelengths ((V) 480 nm () 520 nm (D) 550 nm) The signalrecovers by electronplusmn phonon coupling and phononplusmn phonon relaxation with molecules inthe surrounding medium These two processes are of the order of 1plusmn 4 and 100 psrespectively (c) The temporal evolution of the transient absorption signal at 590 nm isshown on a shorter time scale The oscillation is due to the low-frequency acousticbreathing modes of the host nanoparticles These modes are impulsively excited by therapid heating of the particle lattice and correspondto an oscillatory change in the volumeof the hot nanoparticles The line in (c) is not a reg t to the data points but serves as a visualaid showing the beat signal All kinetic traces in this reg gure were obtaineddirectly from themeasured transient absorption spectra in (a)
434 S Link and M A El-Sayed
Figure 9 Transient absorption spectra of 15 nm gold nanoparticles after excitation at 400 nmwith 100 fs laser pulses recorded at diŒerent delay times plotted against an energy scale(same spectra as shown in reg gure 8(a)) The left inset shows the decrease in the bleachlinewidth with increasing delay time The linewidth was obtained by reg tting a Lorentzianfunction (ETH ETH ETH ) to the experimental spectra (D) The right inset illustrates the decayof the transient bleach signal monitored at 2 plusmn 38 eV Exponential reg ts to the data points inthe insets give similar decay times of 4 plusmn 8 and 4 plusmn 3 ps for the decay of the transientbroadening and bleach intensity respectively
right inset displays the decay of the plasmon bleach intensity at its maximum (2 plusmn 38 eV)
An exponential reg t to the data points gives comparable lifetimes of 4 plusmn 8 and 4 plusmn 3 ps for
the decay of the plasmon bleach linewidth and intensity respectively
45 Pump power dependence of the electronplusmn phonon relaxation rate
When discussing the measured electronplusmn phonon relaxation times quantitatively it
is very important to note that the measured relaxation times are pump power
dependent [146 147 165 166] As the electronic heat capacity depends on the electron
temperature (Cepound T
e[76]) the eŒective rate constant gC
e(T
e) of the thermal
relaxation of the electron gas dCedT
ein equation (41) becomes temperature
dependent As a consequence the experimentally measured electronplusmn phonon relax-
ation time increases with increasing electron temperature and hence with increasing
pump power [146 147 165 166] This is illustrated in reg gure 10 which shows the
plasmon bleach recovery of 15 nm spherical gold nanoparticles at four diŒerent laser
pump intensities The monitoring and excitation wavelengths are 520 and 400 nm
respectively [166] The measured lifetimes increase from 1 plusmn 5 to 3 plusmn 6 ps From a plot of
the measured electronplusmn phonon relaxation times versus power the electronplusmn phonon
coupling constant can be obtained [146 147] which compares well with the value
measured for bulk gold reg lms [124]
While the eŒects of the surrounding medium on the electronplusmn phonon interaction
cannot be excluded the power dependence of the electronplusmn phonon relaxation could
also explain the slightly diŒerent results obtained for gold nanoparticles in solution or
Radiati Š e non-radiati Š e and photothermal properties of gold nanocrystals 435
Figure 10 Pump power dependence of the electronplusmn phonon relaxation time in goldnanoparticlesThe plasmon bleach recovery of 15 nm gold nanoparticles is probed at 520nm after excitation at 400 nm with laser pulses of various energies The electronplusmn phononrelaxation time increases with increasing laser pump power since the electron heatcapacity is temperature dependent
embedded in a solid matrix by several researchers Ahmadi et al [164] reported decay
times of 2 plusmn 5 and more than 50 ps for the electronplusmn phonon and phononplusmn phonon
relaxation times in 30 nm colloidal gold particles Inouye et al [161] measured gold
nanoparticles with a diameter of 7 plusmn 6 nm in a SiOglass matrix They found decay times
of 2 plusmn 8 and 120 ps Perner et al [144] measured relaxation times of 4 and 200 ps for 30
nm gold particles embedded in a solplusmn gel matrix after excitation at 400 nm Smith and
co-workers [153plusmn 155] on the other hand observed longer relaxation times of 7 and
400 ps for 15 nm gold nanoparticles in water The monitoring wavelength was 790 nm
with excitation at 390 nm but the laser pulses had a much higher energy (several
microjoules) The relaxation dynamics of the excited electrons in a nanoshell of gold
sulphide nanoparticles coated with an outer layer of gold were reported by Averitt et
al [163] who found a lifetime of 1 plusmn 7 ps similar to the results on the pure gold
nanoparticles
Femtosecond studies have been carried out on other metal nanoparticles in
particular silver and copper Hodak et al [147] found lifetimes of about 1 ps for 10 and
50 nm silver particles Roberti et al [152] investigated 10 nm silver particles and found
decay times of 2 and 40 ps when probed between 660 and 790 nm A decay time of 0 plusmn 7
ps was obtained for 4 nm copper nanoparticles in a glass matrix by Tokizaki et al
[162]
46 Shape and size dependences of the electronplusmn phonon relaxation rate
When a gold nanorod sample is exposed to femtosecond laser pulses both plasmon
bands are bleached owing to a hot electron gas [167] This is shown in reg gure 11 where
the transient absorption (solid curve) and steady-state absorption (broken curve)
spectra of gold nanorods with a mean aspect ratio of 3 plusmn 8 are displayed The transient
absorption spectrum was recorded at a delay time of 6 ps after excitation with 100 fs
laser pulses having a centre wavelength of 400 nm [167] The bleach of the two bands
436 S Link and M A El-Sayed
Figure 11 Optical response of gold nanorods after excitation with a femtosecondlaser pulseTransient absorption (ETH ETH ETH ) and steady-state absorption spectrum (plusmn plusmn plusmn ) of goldnanorods with a mean aspect ratio of 3 plusmn 8 are shown Both spectra are scaled to arbitraryunits The transient absorption spectrum was recorded at a delay time of 6 ps afterexcitation with 100 fs laser pulses having a centrewavelength of 400 nm The bleach of thetwo bands and the positive absorption around 600 nm are consistent with a broadeningof the transverse and longitudinal surface plasmon bands due to a higher electronictemperature
and the positive absorption around 600 nm are consistent with a broadening of the
transverse and longitudinal surface plasmon bands The transient absorption spectrum
in reg gure 11 also suggests that the magnitude of the bleach is less pronounced for the
longitudinal plasmon band than for the transverse This is concluded from the
intensity ratio of the two bands in the transient absorption spectrum compared with
that for the steady-state spectrum This last observation could however be somewhat
obscured by the photothermal instability of the gold nanorods (see section 5 below)
One of the initial goals in studying the electronplusmn phonon relaxation dynamics was
the question of how the electron dynamics might change with particle size and shape
Since increased electronplusmn surface scattering was thought to be responsible for the
plasmon band broadening in the intrinsic size region femtosecond transient
absorption experiments are carried out to determine whether electronplusmn surface
collisions are mainly inelastic and therefore contribute eŒectively to energy
relaxation With a mean free path of about 40plusmn 50 nm in gold and silver [76] the
measured electronplusmn phonon relaxation time should increase with decreasing particle
radius if the electronplusmn surface scattering becomes an important relaxation pathway for
small particles The results of such an experiment are shown in reg gure 12 The plasmon
bleach recovery measured for 48 and 15 nm gold nanoparticles is compared with the
bleach recovery of the transverse and longitudinal modes of gold nanorods with an
average aspect ratio of 3 plusmn 8 (top to bottom) The laser pump power and optical densities
of the samples at the excitation wavelength were adjusted so that comparable initial
electron temperatures were induced by the exciting femtosecond laser pulse This
ensures that the measured relaxation times can be directly compared with each other
No signireg cant change in the electronplusmn phonon relaxation dynamics can be observed for
48 and 15 nm gold nanoparticles [166] Furthermore the relaxation dynamics appear
Radiati Š e non-radiati Š e and photothermal properties of gold nanocrystals 437
Figure 12 Size and shape dependences of the electronplusmn phonon relaxation time Plasmonbleach recovery measured for 48 and 15 nm gold nanoparticles and for the transverse andlongitudinal modes of gold nanorods with an average aspect ratio of 3 plusmn 8 (from top tobottom) The laser pump power and optical densities of the samples at the excitationwavelength were adjusted so that comparable initial electron temperatures were inducedby the exciting femtosecond laser pulse The results show that the measured electronplusmnphonon relaxation times are independent of particle size and shape eliminating theinmacr uence of electronplusmn surface scattering as a dominant energy relaxation pathway
to be independent of the particle shape and the specireg c plasmon band mode
(transverse or longitudinal) as also shown in reg gure 12 [167] In summary these
experimental results show that the measured electronplusmn phonon relaxation times are
independent of particle size and shape for gold in the investigated size range
eliminating the inmacr uence of electronplusmn surface scattering as a dominant energy
relaxation pathway
Ahmadi et al [165] also observed no size dependence of the electronplusmn phonon
relaxation for 1 plusmn 9 2 plusmn 6 and 3 plusmn 2 nm thiol-passivated gold nanocrystals which were
compared with the measured relaxation dynamics of 30 nm colloidal gold nano-
particles prepared by the citrate method The spectral changes in the transient
absorption signal were attributed to a lower density of electronic states in the very
small molecular-like nanoparticles In agreement with these results Hodak et al [149]
reported that the electronplusmn phonon coupling constant (and hence the electronplusmn phonon
relaxation time) is independent of particle size for gold nanoparticles in the size range
between 4 and 120 nm They also found no change in the electron dynamics measured
in 10 and 50 nm silver particles [147] Hamanaka et al [156] reported that the
electronplusmn phonon coupling constant and the electronic and lattice specireg c heats are size
independent for silver nanocrystals with a diameter of more than 6 nm They observed
a decay of the plasmon band broadening with relaxation times of 2plusmn 3 and 200 ps On
the other hand Stella et al [172 173] reported a size-dependent electronplusmn surface
interaction for 2 4 and 6 nm tin particles embedded in an AlO
$matrix by femtosecond
transient remacr ectivity measurements They measured decreasing lifetimes with
438 S Link and M A El-Sayed
decreasing size corresponding to an increase in electronplusmn surface scattering in the tin
nanoparticles where the mean free path is 4 plusmn 4 nm The same workers also obtained a
size dependence of the hot electron relaxation time for solid and liquid gallium
nanoparticles which had mean diameters of 5 7 and 9 nm [174] Del Fatti et al [159]
reported a decrease in the electronplusmn phonon relaxation times from 800 to 500 fs for
silver nanoparticles in a glass matrix as the size is reduced from 30 nm to below 8 nm
This size dependence of the electronplusmn phonon relaxation was also attributed to an
enhanced inelastic electronplusmn surface scattering Smith et al [155] compared 15 nm gold
nanoparticles with Au$
and Auampamp
clusters They also found a size dependence and
proposed a model in which the relaxation dynamics of the photoexcited electron gas
are described by two competing processes Electronplusmn phonon coupling decreases and
electronplusmn surface scattering increases with decreasing particle size As the two processes
compete with each other they determine the measured lifetime
In recent work Hodak et al [175] were able to explain the diŒerence in the size
dependence of the electronplusmn phonon relaxation in diŒerent metallic nanoparticles
Based on a quantum kinetic treatment of the electronplusmn surface coupling developed by
Belotskii et al [176 177] they calculated the contribution of the electronplusmn surface
coupling constant to the total (bulk) coupling constant They found that the excitation
of capillary and acoustic surface modes by the scattering of the electrons with the
particle surface accounts for less than 10 of the electron energy loss in gold
nanoparticles as small as 2 plusmn 6 nm However the relative magnitude of the electronplusmn
surface coupling constant compared with the total electronplusmn phonon coupling constant
depends on the ratio of the electron density to the metal density and therefore on the
specireg c metal The excitation of surface vibrations is suppressed in nanoparticles
consisting of heavy atoms such as gold as the electrons scatter rather elastically In
nanoparticles made of lighter atoms with more valence electrons contributing to the
conduction band a size-dependent energy relaxation becomes possible via electronplusmn
surface interactions [175] Using the same model Nisoli et al [174] were able to
account completely for the size dependence of the electronplusmn phonon relaxation in
gallium nanoparticles which consist of lighter atoms and a higher electron density
5 Photothermal laser-induced shape transformation of gold nanoparticles
Electronplusmn phonon coupling leads to thermal equilibration between the electrons
and the lattice after selective excitation of the electron gas with a laser pulse as already
discussed in detail in section 4 It was also mentioned that electron temperatures of
several thousand kelvins are easily reached even with excitation powers as low as 100
nJ or typical macr uences on the order of 1 mJ cmshy corresponding to a tightly focused
beam with a spot size of about 100plusmn 200 l m [144 166] Because of the diŒerence in heat
capacities [76] the change in the lattice temperature is only on the order of a few tens
of degrees This is no longer the case when the energy of the excitation pulse is
increased to several microjoules (with no change in the spot size) The temperature of
the nanoparticle lattice can then reach the melting temperature of the respective
material In several cases size [178plusmn 181] and shape [182plusmn 185] changes have been
observed for nanoparticles heated by laser exposure in colloidal solutions as well as in
a solid glass matrix Usually TEM is used to analyse the reg nal shape of the irradiation
product which is then compared with the starting material The optical absorption
spectrum of the studied nanoparticles in colloidal or micellar solution can also be a
very good indication of laser-induced structural changes as the plasmon resonance
Radiati Š e non-radiati Š e and photothermal properties of gold nanocrystals 439
depends on particle size and shape (see section 2) While lasers have been used in
the production of nanoparticles [100 185plusmn 190] the detailed study of the laser-induced
nuclear changes of nanoparticles might allow one to shape the particles after
production in a controlled manner independent of the synthetic method In this way
the discussion below might reg nd many parallels in the broad reg eld of laser ablation and
processing of bulk materials or thin reg lms [191plusmn 197]
In the case of spherical nanoparticles Koda and co-workers [178 179] reported
that irradiation of gold particles in aqueous solution with 532 nm nanosecond laser
pulses leads to fragmentation of the nanodots This was explained in terms of the slow
heat release of the deposited laser energy into the surrounding solvent which leads to
melting and even vaporization of the nanoparticles as estimated from the deposited
laser energy and the absorption cross-section Since the nanoparticles cannot cool as
fast as they are heated they fragment into smaller nanodots The size reduction of
silver nanoparticles in a glass matrix induced by excimer laser irradiation at 248 nm
was also explained by a thermal model [180] On the other hand in a study of colloidal
silver nanoparticles which were irradiated with 355 nm picosecond laser pulses
Kamat et al [181] proposed that a transient aggregate is formed via photoejection of
electrons after laser excitation which is considered to be a precursor for complete
fragmentation of the nanoparticles Hence the initial ejection of photoelectrons
causes the particles to become positively charged and the repulsion between the
charges then leads to fragmentation
While high-energy laser pulses can induce a size reduction of nanodots a more
gentle melting of the spherical nanoparticles with lower pulse energies might remain
unnoticed as the most thermodynamically favourable shape is the sphere itself Even
if the melting temperature of the material is reached and the nanoparticle becomes a
liquid droplet no shape transformation will occur in an isotropic medium However
irradiation of gold nanorods with femtosecond laser pulses has given some interesting
results [178] It was found that the nanorods melt into nanodots in solution after
excitation with femtosecond laser pulses having pulse energies in the microjoule range
(less than 10 mJ cmshy ) This process is independent of the excitation wavelength
similar to the bleaching of the surface plasmon resonance as the absorbed photon
energy is transferred into lattice vibrations on the picosecond time scale by
electronplusmn phonon relaxation processes independent of the electronic transitions
involved initially (see discussion in section 4) Figures 13 (a) and (b) show the TEM
images of a gold nanorod sample with a mean aspect ratio of 37 before and after
irradiation respectively with 800 nm femtosecond laser pulses having a pulse energy of
40 microJ While some nanodots are already present in the starting solution as impurities
[44 53] the reg nal irradiation product consists of only spherical nanoparticles The
statistical size and shape analysis of the particles in these two solutions further reveals
that the average volume of the nanodots in reg gure 13 (b) is comparable with the average
volume of the nanorods in the original starting solution in reg gure 13(a) [182] This
conreg rms that it is possible to melt the metal nanoparticles in aqueous solution by
selectively exciting the electron gas of the metal nanoparticles with an intense
femtosecond laser pulse and without fragmenting them by controlling the laser pulse
energy
The nanorodplusmn nanodot shape transformation in solution is also remacr ected in the
optical absorption data While the transverse mode of the surface plasmon oscillation
of gold nanorods coincides spectrally with the surface plasmon absorption of
nanodots the longitudinal mode is red-shifted and therefore characteristic for rod-
440 S Link and M A El-Sayed
Figure 13 Photothermal reshaping of gold nanorods with femtosecond laser pulses(a) TEM image of the original gold nanorods solution having a mean aspect ratio of 3 plusmn 7(b) (c) TEM images of the same nanorod solutionafter irradiation with 100 femtosecondlaser pulses having a pulse energy of 40 and 200 nJ respectively The wavelength of thelaser light was at 800 nm which falls within the broad absorptionband of the longitudinalsurface plasmon resonance (d ) (e) Each of the optical absorption spectra were recordedafter an increased irradiation time and the TEM image to the left correspondsto the lastabsorption spectrum measured
shaped nanoparticles [44 47 53] Figure 13(d) shows the absorption spectra recorded
after successive intervals of laser irradiation of a small amount of nanorod solution
placed in a rotating cylindrical cell The intensity of the longitudinal plasmon mode
decreases evenly across the broad absorption band and all the nanorods in the starting
solution are reg nally depleted The intensity of the transverse mode increases at the same
time leading to the conclusion that the extinction coe cient of the transverse mode of
nanorods is smaller than the extinction coe cient of the surface plasmon absorption
of spherical nanoparticles [182] Furthermore the time dependences of these two
spectral changes match suggesting that the observed shape transformation for a single
nanorod into a nanodot is completed by the interaction with only one laser pulse The
next laser pulse will simply be absorbed by other nanorods left in the solution but not
by a previously excited nanorod as that has transformed into a spherical particle with
no longitudinal surface plasmon absorption
The situation is diŒerent when the laser pulse energy is lowered [182] The lower
half of reg gure 13 illustrates this case The excitation energy is just 200 nJ An optical
hole can only be burned in the broad longitudinal plasmon band at the wavelength of
the exciting laser pulse (reg gure 13(e)) The broad absorption band is due to the size
distribution of the gold nanorods which is considerably narrowed by removing the
rods with the larger aspect ratios absorbing on the red edge of the absorption band
[93] Only the nanorods that absorb strongly at the excitation wavelength are heated
su ciently to undergo a shape transformation The gentle surface melting of the
nanorods leads to shorter but wider rods [11] as shown from the TEM image in reg gure
Radiati Š e non-radiati Š e and photothermal properties of gold nanocrystals 441
13(c) as well as the change in the mean nanorod aspect ratio length and width upon
laser irradiation as shown in reg gures 14 (a) (b) and (c) respectively The average aspect
ratio of 3 plusmn 7 has decreased to 2 plusmn 7 after laser irradiation which is due to a decrease in the
average rod length from 31 to 25 nm and an increase in the average width from 8 plusmn 4 to
9 plusmn 4 nm As the shorter nanorods are not intrinsically wider in the starting solution (as
checked independently) these results are consistent with surface melting and
inconsistent with depletion of the long nanorods due to complete melting into
nanodots The increase in the intensity at 520 nm suggests that spherical nanoparticles
are also formed at the same time In conclusion this experiment narrows the initial size
distribution of the starting gold nanorod sample considerably [182]
While the nanorodplusmn nanodot shape transformation was followed by two steady-
state techniques namely TEM and ultravioletplusmn visible absorption spectroscopy an
interesting question arises as to how much time the actual shape transformation takes
[198] In order to answer this question we used time-resolved pumpplusmn probe
spectroscopy to monitor the rate of the disappearance of the longitudinal surface
plasmon absorption after femtosecond pulsed photothermal heating of the nanorod
solution [198] The red wavelength absorption edge of the longitudinal plasmon
absorption was chosen to monitor this process in order to avoid interference from the
transient reversible bleach of this band upon excitation At longer wavelengths the
bleach crosses over into an absorption in the transient spectrum and the bleach signal
becomes very small [167] thus not interfering with a signal caused by the permanent
bleaching of the longitudinal plasmon band due to the nanorod melting The
experiment was further carried out in a macr ow cell with a large sample volume in order
to ensure that the overall percentage of nanorods destroyed remains small and that a
new probe volume of a fresh (mainly unexposed) nanorod solution is sampled every
laser pulse [198] The result obtained from a gold nanorod sample with an average
aspect ratio of 2 plusmn 9 is shown in reg gure 15 The photothermal excitation wavelength was
400 nm with an energy of 9 l J and the monitoring wavelength was 790 nm [198] That
nanodots are indeed produced was checked independently by TEM for a small
amount of the nanorod solution which was placed in a rotating cylindrical cell and
irradiated until the complete destruction of the longitudinal surface plasmon band was
observed [198] Figure 15 shows the rise in the permanent bleach signal which is
attributed to the disappearance of the plasmon band at this wavelength and hence
marks the beginning of the shape transformation from a rod to a sphere A reg t of the
data points gives a time of 30 sup3 5 ps This time gives the lower limit of the
nanorodplusmn nanodot transformation time since the monitoring wavelength was set to the
red edge of the plasmon band The measured transformation time is independent of
the laser pump power in the investigated power range 5plusmn 20 l J [198] Only melting with
no fragmentation occurs with the femtosecond laser pulses of these energies and a
focus spot of about 100plusmn 200 l m Furthermore no signireg cant dependence of the
photoinduced isomerization dynamics on the gold nanorod aspect ratio could be
detected for four samples with aspect ratios ranging from 1 plusmn 9 to 3 plusmn 7 [198]
It is worth noting that this transformation time is faster than the cooling of the gold
lattice (greater than 100 ps [143plusmn 148 164plusmn 167]) but slower than the electronplusmn phonon
relaxation time (less than 10 ps [143plusmn 148 164plusmn 167]) This is expected from the
discussion in section 4 about the energy relaxation in metal nanoparticles In the case
of laser irradiation with femtosecond laser pulses the separation into sequential
processes of excitation of the electron gas lattice heating by electronplusmn phonon
coupling and melting of the nanorods is justireg ed However this is not valid any longer
442 S Link and M A El-Sayed
Figure 14 Laser-induced narrowing of the gold nanorod size distribution with low powerfemtosecond pulses The statistical analysis of the nanorod solution irradiated with 200nJ femtosecondlaser pulses (see reg gures 13 (c) and 13 (e)) is shown The distributionsof (a)the aspect ratios (b) the rod lengths and (c) the widths of the reg nal product are comparedwith the original starting solution (see reg gure 13 (a)) The average aspect ratio decreasesfrom 3 plusmn 7 to 2 plusmn 7 as the optical hole is created at the long-wavelength side correspondingtothe rods with the largest aspect ratio This is caused by a decrease in the nanorod length
Radiati Š e non-radiati Š e and photothermal properties of gold nanocrystals 443
Figure 15 How long does it take to melt a gold nanorod Transient absorption signalrecorded at 790 nm where the longitudinal mode of the surface plasmon resonanceabsorption of gold nanorods having a mean aspect ratio of 2 plusmn 9 nm is excited Theexcitation wavelength was 400 nm and the pulse energy was 9 l J which is su cient tomelt the nanoparticles into spherical particles The permanent bleach thereforecorrespondsto the shape transformationfrom rods to dotsThe reg t gives a transformationtime of 30 sup3 5 ps
when a laser with a picosecond or nanosecond pulse duration is used In fact it is
found that the reg nal irradiation product can be quite diŒerent when a nanosecond laser
is used as the irradiation source [182] Comparing the inmacr uence of nanosecond with
that of femtosecond laser pulses it is found that the energy threshold for the complete
melting of gold nanorods is lower with femtosecond laser pulses [199] In reg gure 16 the
optical absorption data and TEM images of a sample with a mean aspect ratio of 4 plusmn 1
irradiated with laser pulses having the same laser pulse energy of 20 l J (and macr uence of
0 plusmn 25 J cmshy ) but diŒerent laser pulse widths are shown (reg gures 16 (a) and (b) show
irradiation with femtosecond pulses and reg gures 16 (c) and (d ) irradiation with
nanosecond pulses) In the case of irradiation with nanosecond pulses only an optical
hole burning is observed similar to that observed when femtosecond pulses with much
lower pulse energies (see reg gure 13(e)) are used The dominant particle shape in the
TEM image (reg gure 16 (d )) is a u-shaped nanoparticle (particle of mainly cylindrical
shape with a spherical middle part) indicating that only partial melting occurs
compared with the nanodots seen in reg gure 16(b) produced by irradiation with
femtosecond laser pulses Bent and twisted nanorods and especially u-shaped particles
are mainly found after irradiation with nanosecond pulses as independently reported
by Chang et al [183] The same type of particles can also be observed with
femtosecond irradiation but only at much lower pulse energies and with a lower
abundance [199] The u-shaped particles seem to be an early stage of the shape
transformation into spheres (ie melting) [183 199] in which the pulse energy is not
from 31 to 25 nm while the width increases from 8 plusmn 4 to 9 plusmn 4 nm As the shortest nanorodsare not the widest rods in the starting solution this result suggests that the nanorodsundergo a surface melting in which the nanorods become wider at a cost to their length
444 S Link and M A El-Sayed
Figure 16 The eŒect of the laser pulse width on the photothermalreshapingof gold nanorodsThe optical absorption data and TEM images of a nanorod sample with a mean aspectratio of 4 plusmn 1 irradiated by laser pulses having the same macr uence (0plusmn 25 J cmshy ) but diŒerentlaser pulse widths ((a) (b) 100 fs (c) (d ) 7 ns) are compared A complete melting of thegold nanorods into spherical nanoparticles (concluded from the TEM picture) and acomplete depletion of the nanorods (as seen in the reg nal optical absorption spectrum) areachieved with femtosecond laser pulses When nanosecond pulses of the same energy(macr uence) are used only an optical hole burning at the laser wavelength and a partialmelting of the gold nanorodsare found A high abundance of u-shaped particles is clearlyvisible This result leads to the conclusion that nanosecond laser pulses are less eŒectivein melting the gold nanorods
high enough for complete melting as phononplusmn phonon coupling with the surrounding
medium can partially compete with the nanoparticle heating by the laser energy This
further suggests that the nanorods cool most rapidly at their ends where their exposed
surface area is the largest [199] This might also be the path of the photothermal
isomerization process from rods to spheres in which the width of the rod increases
around the middle of the rod pulling the two ends closer to one another (A high-
resolution TEM study is now under way to examine the mechanism of melting [200])
The diŒerence in laser processing of gold nanorods with diŒerent laser pulse widths
can be explained by the fact that the heat loss (phononplusmn phonon relaxation from the
nanoparticle lattice to the solvent molecules) can eŒectively compete with the rate of
heating the lattice This is determined by the rate of photon absorption and the rate of
electronplusmn phonon relaxation In the case of when a femtosecond laser pulse is used as
Radiati Š e non-radiati Š e and photothermal properties of gold nanocrystals 445
the excitation source the photophysical events (absorption by the electrons coupling
to the lattice melting and heat release to the solvent) are basically separated in time
and could be thought of as sequential processes to a reg rst approximation This is
certainly not justireg ed for the nanosecond case This is especially true in cases when the
absorption coe cient of the gold nanorods at the excitation wavelength changes
owing to shape changes The longitudinal surface plasmon band bleaches because of
the hot electron gas absorption leading to a decrease in absorption and therefore to
a less eŒective heating of the nanorods [167] The diŒerence in the energy threshold for
observing a complete melting of the nanorods when the two lasers are used can now
be understood [199] Melting occurs if the rate of heating the lattice is faster than the
rate of cooling the lattice With femtosecond lasers the laser intensity is so high that the
rate of absorption (and thus heating) is very rapid Therefore the same number of
photons squeezed in 100 fs can heat the lattice much more eŒectively and more rapidly
than if they are stretched to a nanosecond pulse width
When nanosecond laser pulses of higher energies (millijoule range) are used
fragmentation of the gold nanorods into smaller nearly spherical nanoparticles is
observed [182] similar to those observed for the gold [178 179] and silver [180 181]
nanodots described above While this observation was explained for the nanodots in
terms of the slow heat loss to the solvent or the ejection of photoelectrons for a gold
nanorod solution another mechanism was shown to contribute as well [182] As the
nanorodsrsquo lattice heats up and melts during the long nanosecond laser pulse the gold
nanoparticle continues to absorb photons The additional photons absorbed by the
hot particles was proposed to lead to fragmentation of the gold nanorods [182] This
model can be described as follows
(Au)NR
MMMMNnhm
[(Au)NR
]g (51)
[(Au)NR
]g MMMMNfs
[(Au)NR
]v (52)
[(Au)NR
]v MMMMNps
[(Au)NR
]vib (53)
[(Au)NR
]vib MMMMNmelting
[(Au)NS
] (54)
[(Au)NP
]vib MMMMNmhm (ns)
[(Au)NP
]vib (55)
[(Au)NP
]vibMMMMNfragmentation
(Au)SNS
(56)
Processes (51) (52) and (53) represent laser excitation of the electrons thermal
heating of the electrons (less than 1 ps [166]) and lattice heating resulting from
electronplusmn phonon relaxation processes (less than 10 ps [143plusmn 149 164plusmn 167]) respect-
ively NR NS NP and SNS refer to nanorods nanospheres nanoparticles (when
there is no dereg nite information about the particle shape) and small nanospheres
respectively It is important to note that heating the lattice via electronplusmn phonon
relaxation in the femtosecond experiment occurs in the dark as it takes place on a time
scale longer than the pulse width Process (54) is the melting of the nanorods which
completes the photophysical events in the femtosecond experiment if heat loss to the
surrounding medium is neglected However this is not the case for the nanosecond
experiments Process (55) represents further laser excitation of the hot lattice in the
experiments with nanosecond laser pulses Therefore it is expected that absorption of
446 S Link and M A El-Sayed
Figure 17 Gold nanorod fragmentation caused by two time-delayed femtosecond pulsesserving as a model for a longer (nanosecond) laser pulse (a) The set-up used forperforming the irradiation of gold nanoparticle solutions with two time-delayed laserpulses The gold nanorod solutionplaced in a rotating cylindrical cell is reg rst irradiated bya laser pulse and then the transmitted light is retroremacr ected into the solution andoverlapped with the reg rst excitation spot The second pulse can be delayed with respect tothe reg rst by a variable translation stage In this way a longer laser pulse is simulated by twoultrashort laser pulses in order to test the inmacr uence of the pulse duration on the shapetransformationof gold nanorods The delay time used is bracketing the electronplusmn phononand phononplusmn phonon relaxation time of gold nanorods in solution (b) The averageparticle diameterof the spheres producedby the laser irradiation plottedagainst the delaytime between the two pulses At delay times between 10 and 50 ps a smaller averageparticle diameter is observed owing to a higher abundance of smaller nanoparticleswhich are created by fragmentation of the gold nanorods With knowledge of the latticeheating and cooling dynamics this conreg rms the proposedmechanism that fragmentationof the gold nanorods with nanosecond laser pulses occurs because of the additionalabsorption of photons by the hot (melted) lattice during the duration of the nanosecondpulse
more photons by the hot (or even melted) lattice occurs in the nanosecond experiment
This then leads to an increase in the lattice internal energy and reg nally fragmentation
as shown in step (56)
In order to test this mechanism the gold nanorods were irradiated in solution by
two femtosecond pulses which were delayed by diŒerent amounts of time with respect
to each other [182] The reg rst pulse initially excites the nanorods and heats their lattice
while the second pulse is absorbed at diŒerent stages of excitation and relaxation after
the absorption of the reg rst pulse The mean diameter of the resulting particles is
Radiati Š e non-radiati Š e and photothermal properties of gold nanocrystals 447
determined by using TEM of the dried solutions of the nanoparticles taken from the
solution exposed to the two pulses separated by diŒerent delay times A schematic
diagram of the set-up for this experiment is shown in reg gure 17(a) and the results are
given in reg gure 17(b) The average particle diameter of the nanoparticles produced by
the laser irradiation is plotted against the delay time between the two pulses The point
labelled as reference refers to a control experiment in which the mirror behind the
sample cell was removed and therefore just one pulse was passed through the sample
Only melting of the nanorods into spherical nanoparticles is observed It was further
observed that a single pulse having the same energy as the sum of the two individual
laser pulses did not lead to a diŒerent mean particle diameter At delay times between
10 and 50 ps a smaller average particle diameter is observed owing to a higher
abundance of smaller nanoparticles which originate from the fragmentation of the
gold nanorods At shorter delay times than the electronplusmn phonon relaxation time (a few
picoseconds) the lattice of the nanorods has not yet been completely heated or melted
before the second pulse arrives At delay times longer than phononplusmn phonon relaxation
times (greater than 100 ps) the lattice has already cooled considerably by phononplusmn
phonon interactions Fragmentation is hence only observed when the second laser
pulse is absorbed after the lattice is heated (and melted) and before it cools This
supports the suggested mechanism of the fragmentation of gold nanorods induced by
lasers of energetic long (nanosecond) laser pulses
6 Concluding remarks and outlook
This review of the optical and dynamic properties of gold nanocrystals shows that
a great deal of understanding has already been accomplished The understanding of
the dynamics of the electrons and the lattice of nanostructured materials is of great
importance to their potential use in future photonic applications The sensitivity of the
surface plasmon absorption characteristics to adsorbed species is important for their
potential applications as chemical sensors The understanding of the laser-induced
photothermal melting and fragmentation mechanisms will be helpful in future
photothermal reshaping of metal nanoparticles
The understanding of the electronic absorption and dynamics in individual
nanoparticles is essential before we assemble them into devices which is the goal of the
use of nanostructured systems The advancements in chemical synthesis and separation
methods are pushing the limits of preparing and isolating nanoparticles of diŒerent
size and shape The study of a sample with a narrow size and shape distribution is
essential in determining the physical and especially the optical properties of individual
particles in an assembled mixture Single-particle spectroscopy could overcome the
problem of a narrow size distribution but is mainly limited to collecting the emission
rather than measuring the absorption spectrum On the other hand a great eŒort has
been made to try to create assemblies of nanoparticles in two- and three-dimensional
structures [70plusmn 72 201plusmn 209] Deoxyribonucleic acid [201] or smaller molecules [202] and
also templates such as aluminium oxide membranes [203] have been used to create
linked arrays of gold nanoparticles Lithography [70plusmn 72 204] and electrophoretic
deposition [205] also allow the two-dimensional arrangement of metallic particles The
patterning of structures consisting of individual and well separated nanoparticles as
solid-state devices is crucial for any future application In order to self-assemble
nanoparticles the size distribution needs to be very narrow so that the goals of both
preparing a monodisperse sample and assembling the nanoparticles are very closely
related This in turn presents the prospect of observing new optical properties of self-
448 S Link and M A El-Sayed
assembled monolayers of metallic nanoparticles as now the electric reg elds connected to
the plasmon resonance (enhancement of the incoming and outgoing electric reg elds
when interacting with light) will inmacr uence the eŒective reg elds around the neighbouring
nanoparticles Although aggregates of metallic nanoparticles [94plusmn 96] and their optical
absorption have been studied experimentally and theoretically an ordered array of
nanoparticles instead of an agglomerate might present new properties diŒerent from
the individual particles
Acknowledgements
We wish to acknowledge our collaborators Professor Zhong L Wang Dr Clemens
Burda Mona M Mohamed Babak Nikoobakht and Victor Volkov We would like to
thank Janet Petroski for carefully reading the manuscript This work was supported by
the National Science Foundation (grant CHE 9705164)
References
[1] H e n g l e i n A 1993 J phys Chem 97 8457[2] H e n g l e i n A 1989 Chem Re Š 89 1861[3] A l i v i s a t o s A P 1996 J phys Chem 100 13226[4] M u l v a n e y P 1996 Langmuir 12 788[5] S t o r h o f f J J and M i r k i n C A 1999 Chem Re Š 99 1849[6] S c h m i d G and C h i L F 1998 AdŠ Mater 10 515[7] A l i v i s a t o s A P B a r b a r a P F C a s t l e m a n A W Ch a n g J D i x o n D A K l e i n
M L M c L e n d o n G L M i l l e r J S R a t n e r M A R o s s k y P J St u p p S I andT h o m p s o n M E 1998 Ad Š Mater 10 1297
[8] W a n g Y and H e r r o n N 1991 J phys Chem 95 525[9] H e a t h J R and Sh i a n g J J 1998 Chem Soc Re Š 27 65
[10] W e l l e r H 1993 Angew Chem Int Edn Engl 32 41[11] L i n k S and E l -S a y e d M A 1999 J phys Chem B 103 8410[12] S c h m i d G 1994 Clusters and Colloids From Theory to Application (Weinheim VCH)[13] K a m a t P V and M e i s e l D 1997 Studies in Surface Science and Catalysis Vol 103
Semiconductor NanoclustersETH Physical Chemical and Catalytic Aspects (AmsterdamElsevier)
[14] E d e l s t e i n A S and Ca m m a r a t a R C 1996 Nanoparticles Synthesis Properties andApplications (Bristol Institute of Physics)
[15] K e r k e r M 1985 J Colloid Interface Sci 105 297[16] C r e i g h t o n J A and E a d o n D G 1991 J chem Soc Faraday Trans 87 3881[17] H u g h e s A E and Ja i n S C 1979 Ad Š Phys 28 717[18] F a r a d a y M 1857 Phil Trans R Soc 147 145[19] M i e G 1908 Ann Phys 25 329[20] G r a e t z e l M 1992 Electrochemistry in Colloids and Dispersions edited by R A Mackay
and J Texter (Weinheim VCH)[21] P e r e n b o o m J A A J W y d e r P and M e i e r P 1981 Phys Rep 78 173[22] H a l p e r i n W P 1986 Re Š mod Phys 58 533[23] K r e i b i g U and V o l l m e r M 1995 Optical Properties of Metal Clusters (Berlin
Springer)[24] B r u s L E 1983 J chem Phys 79 5566[25] B r u s L E 1984 J chem Phys 80 4403[26] B r u s L E 1991 Appl Phys A 53 465[27] M u r r a y C B N o r r i s D J and B a w e n d i M G 1993 J Am chem Soc 11 8706[28] W h e t t e n R L K h o u r y J T A l v a r e z A M M u r t h y S V e z m a r I W a n g Z L
S t e p h e n s P W C l e v e l a n d C L L u e d t k e W D and L a n d m a n U 1996 AdŠ Mater 8 428
[29] C h e m s e d d i n e A and W e l l e r H 1993 Ber Bunsenges phys Chem 97 636[30] A h m a d i T S W a n g Z L Gr e e n T C and E l -Sa y e d M A 1996 Science 272 1924[31] B r u s t M W a l k e r M B e t h e l l D S c h i f f r i n D J and W y h n m a n R 1994 J chem
Soc chem Commun 801
Radiati Š e non-radiati Š e and photothermal properties of gold nanocrystals 449
[32] H o s t e t l e r M J W i n g a t e J E Z h o n g C-J Ha r r i s J E V a c h e t R W C l a r k M R L o n d o n o J D G r e e n S J S t o k e s J J W i g n a l l G D G l i s h G L P o r t e r M D E v a n s N D and M u r r a y R W 1998 Langmuir 14 17
[33] H a n d l e y D A 1989 Colloidal Gold Principles Methods and Applications Vol 1 (NewYork Academic Press)
[34] T u r k e v i c h J St e v e n s o n P C 19 Hillier J 1951 Discuss Faraday Soc 11 55[35] T u r k e v i c h J G a r t o n G and S t e v e n s o n P C 1954 J Colloid Sci Suppl 1 26[36] T u r k e v i c h J 1985 Gold Bull 18 86[37] T u r k e v i c h J 1985 Gold Bull 18 125[38] T a n o T E s u m i K and M e g u r o K 1989 J Colloid Interface Sci 133 530[39] E s u m i K S u z u k i M T a n o T T o r i g o e K and M e g u r o K 1991 Colloids Surf
55 9[40] E s u m i K S a d a k a n e O T o r i g o e K and M e g u r o K 1992 Colloids Surf 62 255[41] E s u m i K T a n o T and M e g u r o K 1989 Langmuir 5 268[42] T o s h i m a N T a k a h a s h i T and H i r a i H 1985 Chem Lett 1245[43] R e e t z M T and He l b i g W 1994 J Am chem Soc 116 7401[44] Y u Y C h a n g S L e e C and W a n g C R C 1997 J phys Chem B 101 34 6661[45] B l a c k b o r o w J R and Y o u n d D 1979 Metal Vapor Synthesis (New York Springer)[46] D o r e m u s R H 1964 J chem Phys 40 2389[47] v a n d e r Z a n d e B M I B o h m e r M R F o k k i n k L G J and Sc h o n e n b e r g e r C
1997 J phys Chem B 101 852[48] F o s s C A H o r n y a k G L T i e r n e y M J and M a r t i n C R 1992 J phys Chem 96
9001[49] H o r n y a k G L Pa t r i s s i C J and M a r t i n C R 1997 J phys Chem B 101 1548[50] F o s s C A Ho r n y a k G L St o c k e r t J A and M a r t i n C R 1992 J phys Chem
96 7497[51] F o s s C A Ho r n y a k G L St o c k e r t J A and M a r t i n C R 1994 J phys Chem
98 2963[52] H o r n y a k G L and M a r t i n C R 1997 Thin Solid Films 303 84[53] M o h a m e d M B I s m a e l K Z L i n k S and E l -S a y e d M A 1998 J phys Chem B
102 9370[54] L i s i e c k i I B i l l o u d e t F and Pi l e n i M P 1996 J phys Chem 100 4160[55] L i s i e c k i I and P i l e n i M P 1993 J am Chem Soc 115 3887[56] L i n k S and E l -S a y e d M A 1999 J phys Chem B 103 4212[57] M a x w e l l -G a r n e t t J C 1904 Phil Trans R Soc 203 385[58] P a p a v a s s i l i o u G C 1980 Prog solid st Chem 12 185[59] K e r k e r M 1969 The Scattering of Light and Other Electromagnetic Radiation (New
York Academic Press)[60] B o h r e n C F and H u f f m a n D R 1983 Absorption and Scattering of Light by Small
Particles (New York Wiley)[61] N o z i k A J and M e m m i n g R 1996 J phys Chem 100 13061[62] S c h a a f f T G K n i g h t G S h a f i g u l l i n M B o r k m a n R F and W h e t t e n R L
1998 J phys Chem B 102 10643[63] K r e i b i g U and Ge n z e l U 1985 Surf Sci 156 678[64] A l v a r e z M M K h o u r y J T S c h a a f f T G Sh a f i g u l l i n M N Ve z m e r I and
W h e t t e n R L 1997 J phys Chem B 101 3706[65] S c h a a f f T G S h a f i g u l l i n M N K h o u r y J T Ve z m e r I W h e t t e n R L
C u l l e n W G F i r s t P N G u t i e r r e z -Wi n g C A s c e n s i o J and J o s e -Ya c a m a n M J 1997 J phys Chem B 101 7885
[66] H e i l w e i l E J and H o c h s t r a s s e r R M 1985 J chem Phys 82 4762[67] K r e i b i g U G a r t z M and H i l g e r A 1997 Ber Bunsenges phys Chem 101 1593[68] P u e c h K H e n a r i F Z B l a u W J D u f f D and S c h m i d G 1995 Chem Phys
Lett 247 13[69] P u e c h K H e n a r i F Z B l a u W J D u f f D and Sc h m i d G 1995 Europhys Lett
32 119[70] L a m p r e c h t B L e i t n e r A and A u s s e n e g g F R 1997 Appl Phys B 64 269[71] L a m p r e c h t B K r e n n J R L e i t n e r A and A u s s e n e g g F R 1999 Appl Phys B 69
223
450 S Link and M A El-Sayed
[72] L a m p r e c h t B L e i t n e r A and A u s s e n e g g F R 1999 Appl Phys B 68 419[73] K l a r T P e r n e r M G r o s s e S v o n P l e s s e n G S p i r k l W and F e l d m a n n J 1998
Phys Re Š Lett 80 4249[74] K r e i b i g U and v o n F r a g s t e i n C 1969 Z Phys 224 307[75] K r e i b i g U 1970 Z Phys 234 307[76] A s h c r o f t N W and M e r m i n N D 1976 Solid State Physics (Philadelphia
Pennsylvania Saunders College)[77] D o r e m u s R H 1965 J chem Phys 42 414[78] S m i t h a r d M A 1974 Solid St Commun 14 407[79] R u p p i n R and Y a t o m H 1976 Phys Stat sol (b) 74 647[80] K a w a b a t a A and K u b o R 1966 J phys Soc Japan 21 1765[81] H a c h e F R i c a r d D and F l y t z a n i s C 1986 J opt Am Soc B 3 1647[82] C i n i M 1987 J opt Soc Am 71 386[83] G e n z e l L M a r t i n T P and K r e i b i g U 1975 Z Phys B 21 339[84] W o o d D M and A s h c r o f t N W 1982 Phys Re Š B 25 6255[85] K r a u s W A and S c h a t z G C 1983 J chem Phys 79 6130[86] Y a n n o u l e a s C and B r o g l i a R A 1992 Ann Phys 217 105[87] B r a c k M 1993 Re Š mod Phys 65 677[88] B o n a c i c -K o u t e c k y V F a n t u c c i P and K o u t e c k y J 1991 Chem Re Š 91 1035[89] P e r s s o n N J 1993 Surf Sci 281 153[90] L i n n e r t T M u l v a n e y P and H e n g l e i n A 1993 J phys Chem 97 679[91] H o e v e l H F r i t z S H i l g e r A K r e i b i g U and V o l l m e r M 1993 Phys Re Š B 48
18178[92] L y o n L A M u s i c k M D S m i t h P C R e i s s B D P e n a D J and Na t a n M J
1999 Sensors Actuators B 54 118[93] L i n k S M o h a m e d M B and E l -S a y e d M A 1999 J phys Chem B 103 3073[94] G a n s R 1915 Annln Phys 47 270[95] K r e i b i g U A l t h o f f A and P r e s s m a n n H 1981 Surf Sci 106 308[96] Q u i n t e n M and K r e i b i g U 1986 Surf Sci 172 557[97] Q u i n t e n M Sc h o e n a u e r D Kr e i b i g U 1989 Z Phys D 26 239[98] A s p n e s D E H e l l e r A and Po r t e r J D 1986 J appl Phys 60 3028[99] A s p n e s D E 1982 Thin Solid Films 89 249
[100] P a l p a n t B P r e v e l B L e r m e J C o t t a n c i n E P e l l a r i n M T r e i l l e u x M P e r e z A V i a l l e J L and B r o y e r M 1998 Phys Re Š B 57 1963
[101] M o o r a d i a n A 1969 Phys Re Š Lett 22 185[102] W h i t t l e D G and B u r s t e i n E 1981 Bull Am phys Soc 26 777[103] B o y d G T Y u Z H and Sh e n Y R 1986 Phys Re Š B 33 7923[104] M o s h o v i s t s M 1985 Re Š mod Phys 57 783[105] H e r i t a g e J P B e r g m a n J G P i n c z u k A and W o r l o c k J M 1979 Chem Phys
Lett 67 229[106] A p e l l P and M o n r e a l R 1988 Physica Scripta 38 174[107] P l e k h a n o v V G and Si l i u k o v a T V 1990 SoŠ iet Phys Solid St 32 1268[108] C h e n C K H e i n z T F R i c a r d D and S h e n Y R 1983 Phys Re Š B 27 1965[109] B o y d G T R a s i n g T L e i t e J R R and S h e n Y R 1984 Phys Re Š B 30 519[110] O t t o A 1991 J Raman Spectrosc 22 743[111] O t t o A M r o z e k I G r a b h o r n H and A k e m a n W 1992 J Phys condens Matter
4 1143[112] Z e m a n E J and S c h a t z G C 1987 J phys Chem 91 634[113] C l i n e M P B a r b e r P W and C h a n g R K 1986 J opt Soc Am B 3 15[114] C r e i g h t o n J A B l a t c h f o r d C G and A l b r e c h t M G 1979 J chem Soc
Faraday Trans II 75 790[115] K e r k e r M S i i m a n O B u m m L A and W a n g W-S 1980 Appl Optics 19 3253[116] K e r k e r M W a n g D and C h e w H 1980 Appl Optics 19 4159[117] F r e e m a n R G Ho m m e r M B G r a b a r K C Ja c k s o n M A and N a t a n M J
1996 J phys Chem 100 718[118] E m o r y S R H a s k i n s W E N i e S 1998 J Am chem Soc 120 8009[119] M o h a m e d M B V o l k o v V V L i n k s S and E l -Sa y e d M A 2000 Chem Phys
Lett 317 517
Radiati Š e non-radiati Š e and photothermal properties of gold nanocrystals 451
[120] W i l c o x o n J P M a r t i n J E P a r s a p o u r F W i e d e n m a n B and K e l l e y D F1998 J chem Phys 108 9137
[121] E s l e y G L 1983 Phys Re Š Lett 51 2140[122] E s l e y G L 1986 Phys Re Š B 33 2144[123] G r o e n e v e l d R H M Sp r i k R and L a g e n d i j k A 1992 Phys Re Š B 45 5079[124] G r o e n e v e l d R H M Sp r i k R and L a g e n d i j k A 1995 Phys Re Š B 51 11 433[125] S c h o e n l e i n R W L i n W Z F u j i m o t o J G and E s l e y G L 1987 Phys Re Š Lett
58 1680[126] B r o r s o n S D F u j i m o t o J G and Ip p e n E P 1987 Phys Re Š Lett 59 1962[127] S u n C-K V a l l e e F A c i o l i L H I p p e n E P and F u j i m o t o J G 1993 Phys Re Š
B 48 12365[128] S u n C-K V a l l e e F A c i o l i L H I p p e n E P and F u j i m o t o J G 1994 Phys Re Š
B 50 15337[129] d e l F a t t i N B o u f f a n a i s R V a l l e e F and F l y t z a n i s C 1998 Phys Re Š Lett 81
922[130] E l s a y e d -A l i H E J u h a s z T Sm i t h G O and B r o n W E 1991 Phys Re Š B 43
4488[131] Ju h a s z T E l s a y e d -A l i H E Hu H and B r o n W E 1992 Phys Re Š B 45 13819[132] Ju h a s z T E l s a y e d -Al i H E S m i t h G O S u a r e z C and B r o n W E 1993 Phys
Re Š B 48 15488[133] F a n n W S St o r z R T o m H W K and B o k e r J 1992 Phys Re Š B 46 13592[134] F a n n W S St o r z R T o m H W K and B o k e r J 1992 Phys Re Š Lett 68 2834[135] S c h m u t t e n m a e r C A A e s c h l i m a n n M E l s a y e d -A l i H E M i l l e r R J D
M a n t e l l D A C a o J and G a o Y 1994 Phys Re Š B 50 8957[136] A e s c h l i m a n n M S c h m u t t e n m a e r C A E l s a y e d -Al i H E M i l l e r R J D Ca o
J G a o Y and M a n t e l l D A 1995 J chem Phys 102 8606[137] G a o Y C a o J M i l l e r R J D E l s a y e d -A l i H E and M a n t e l l D A 1997
Phys Re Š B 56 1099[138] C a o J G a o Y E l s a y e d -Al i H E M i l l e r R J D and M a n t e l l D A 1998
Phys Re Š B 58 10948[139] A n i s i m o v L K a p e l i o v i c h B L and P e r e l rsquo m a n T L 1975 So Š iet Phys JETP
39 375[140] P a w l i k S B a u e r M and A e s c h l i m a n n M 1997 Surf Sci 377plusmn 379 206[141] A e s c h l i m a n n M P a w l i k S and B a u e r M 1995 Ber Bunsenges phys Chem 99
1504[142] O g a w a S and P e t e k H 1996 Surf Sci 357plusmn 358 585[143] P e r n e r M B o s t P P a u c k T v o n Pl e s s e n G F e l d m a n n J B e c k e r U M e n n i g
M P o r s t e n d o r f e r J S c h m i t t M and S c h m i d t H 1996 Ultrafast Phenomena Xedited by P F Babara J G Fujimoto W H Knox and W Zinth (Berlin Springer)
[144] P e r n e r M B o s t P v o n Pl e s s e n G F e l d m a n n J B e c k e r U M e n n i g M andS c h m i d t H 1997 Phys Re Š Lett 78 2192
[145] P e r n e r M K l a r T G r o s s e S L e m m e r U v o n P l e s s e n G S p i r k l W andF e l d m a n n J 1998 J Lumin 76plusmn 77 181
[146] H o d a k J K M a r t i n i I and H a r t l a n d G V 1998 Chem Phys Lett 284 135[147] H o d a k J K M a r t i n i I and H a r t l a n d G V 1998 J phys Chem B 102 6958[148] H o d a k J K M a r t i n i I and H a r t l a n d G V 1998 J chem Phys 108 9210[149] H o d a k J K H e n g l e i n A and H a r t l a n d G V 1999 J chem Phys 111 8613[150] B i g o t J-Y M e r l e J-C C r e g u t O and Da u n o i s A 1995 Phys Re Š Lett 75
4702[151] S h a h b a z y a n T V P e r a k i s I E and B i g o t J-Y 1998 Phys Re Š Lett 81 3120[152] R o b e r t i T W S m i t h B A and Z h a n g J Z 1995 J chem Phys 102 3860[153] S m i t h B A W a t e r s D M F a u l h a b e r A E K r e g e r M A R o b e r t i T W and
Z h a n g J Z 1997 J Solplusmn Gel Sci Technol 9 125[154] F a u l h a b e r A E Sm i t h B A A n d e r s e n J K and Z h a n g J Z 1996 Molec
Crystals liq Crystals 283 25[155] S m i t h B A Z h a n g J Z Gi e b e l U and S c h m i d G 1997 Chem Phys Lett 270
139[156] H a m a n a k a Y H a y a s h i N N a k a m u r a A and O m i S 1998 J Lumin 76plusmn 77 221
452 S Link and M A El-Sayed
[157] D e l F a t t i N T z o r t z a k i s S V o i s i n C F l y t z a n i s C and V a l l e e F 1999 PhysicaB 263plusmn 264 54
[158] D e l F a t t i N V o i s i n C C h e v y F V a l l e e F and F l y t z a n i s C 1999 J chemPhys 110 484
[159] d e l F a t t i N F l y t z a n i s C and Va l l e e F 1999 Appl Phys B 68 433[160] F e l d s t e i n M J Ke a t i n g C D L i a u Y-H N a t a n M J and Sc h e r e r N F 1997
J Am chem Soc 119 6638[161] In o u y e H T a n a k a K T a n a h a s h i I and H i r a o K 1998 Phys Re Š B 57 11334[162] T o k i z a k i T N a k a m u r a A Ka n e k o S U c h i d a K O m i S T a n j i H and A s a h a r a
Y 1994 Appl Phys Lett 65 941[163] A v e r i t t R D W e s t c o t t S L and H a l a s N J 1998 Phys Re Š B 58 10 203[164] A h m a d i T S L o g u n o v S L and E l -S a y e d M A 1996 J phys Chem 100 8053[165] A h m a d i T S L o g u n o v S L E l -Sa y e d M A K h o u r y J T and W h e t t e n R L
1997 J phys Chem B 101 3713[166] L i n k S B u r d a C W a n g Z L and E l -Sa y e d M A 1999 J chem Phys 111 1255[167] L i n k S B u r d a C M o h a m e d M B N i k o o b a k h t B and E l -Sa y e d M A 2000
Phys Re Š B 61 6086[168] R o s e i R A n t o n g e l i F and G r a s s a n o U M 1973 Surf Sci 37 689[169] C a r d o n a M 1969 Modulation Spectroscopy Solid State Physics SupplementII edited
by F Seitz D Turnball and H Ehrenreich (New York Academic Press)[170] P i n e s D and N o z i e rsquo r e s P 1966 The Theory of Quantum Liquids (New York
Benjamine)[171] C h r i s t e n s e n N E and S e r a p h i n B O 1971 Phys Re Š B 4 3321[172] S t e l l a A N i s o l i M d e S i l v e s t r i S S v e l t o O L a n z a n i G C h e y s s a c P and
K o f m a n R 1996 Phys Re Š B 53 15497[173] S t e l l a A N i s o l i M d e S i l v e s t r i S S v e l t o O L a n z a n i G C h e y s s a c P and
K o f m a n R 1996 Ultrafast Phenomena X edited by P F Babara J G FujimotoW H Knox and W Zinth (Berlin Springer)
[174] N i s o l i M S t a g i r a S d e S i l v e s t r i S S t e l l a A T o g i n i P Ch e y s s a c P andK o f m a n R 1997 Phys Re Š Lett 53 3575
[175] H o d a k J K M a r t i n i I and H a r t l a n d G V 2000 J chem Phys 112 5942[176] B e l o t s k i i E D and T o m c h u k P M 1990 Surf Sci 239 143[177] B e l o t s k i i E D and T o m c h u k P M 1992 Int J Electron 73 955[178] K u r i t a H T a k a m i A and K o d a S 1998 Appl Phys Lett 72 789[179] T a k a m i A Ku r i t a H and K o d a S 1999 J phys Chem B 103 1226[180] S t e p a n o v A L H o l e D E B u k h a r a e v A A T o w n s e n d P D and Nu r g a z i z o v
N I 1998 Appl Surf Sci 136 298[181] K a m a t P V F l u m i a n i M and H a r t l a n d G V 1998 J phys Chem B 102 3123[182] L i n k S B u r d a C M o h a m e d M B N i k o o b a k h t B and E l -S a y e d M A 1999 J
phys Chem A 103 1165[183] C h a n g S S h i h C Ch e n C L a i W and W a n g C R C 1999 Langmuir 15 701[184] K a e m p f e M R a i n e r T B e r g K-J Se i f e r t G and G r a e n e r H 1999 Appl Phys
Lett 74 1200[185] G e o h e g a n D B P u r e t z k y A A D u s c h e r G and Pe n n y c o o k S J 1998 Appl
Phys Lett 72 2987[186] L o w n d e s D H R o u l e a u C M T h u n d a t T D u s c h e r G Ke n i k E A and
P e n n y c o o k S J 1998 Appl Surf Sci 129 355[187] S a s a k i T T e r a u c h i S K o s h i z a k i N and U m e h a r a H 1998 Appl Surf Sci 129
398[188] P a s z t i Z H o r v a t h Z E P e t o G Ka r a c s A and G u c z i L 1997 Appl Surf Sci
110 67[189] L i l l i c h H W o l f r u m J Z u m b a c h V Al e a n d r i L E Jo n e s D J R o z i e r e J
A l b e r s P S e i b o l d K and F r e u n d A 1995 J phys Chem 99 12 413[190] W e r w a E S e r a p h i n A A C h i u L A Z h o u C X and Ko l e n b r a n d e r K D
1994 Appl Phys Lett 64 1821[191] L e n z n e r M K r u e g e r J K a u t e k W and K r a u s z E 1999 Appl Phys A 68 369[192] S i e g e l J E t t r i c h K W e l s c h E and M a t t h i a s E 1997 Appl Phys A 64 213[193] N o l t e S M o m m a C Ja c o b s H T u e n n e r m a n n A C h i c h k o v B N
W e l l e g e h a u s e n B and W e l l i n g H 1997 J opt Soc Am B 14 2716
Radiati Š e non-radiati Š e and photothermal properties of gold nanocrystals 453
[194] S t u a r t B C F e i t M D He r m a n S R u b e n c h i k A M S h o r e B W and P e r r y M D 1996 Phys Re Š B 53 1749
[195] S t u a r t B C F e i t M D He r m a n S R u b e n c h i k A M S h o r e B W and P e r r y M D 1996 J opt Soc Am B 13 459
[196] K o n o n e n k o T V G a r n o v S V K l i m e n t o v S M K o n o v V I L o u b n i n E ND a u s i n g e r F R a i b e r A and T a u t C 1997 Appl Surf Sci 109plusmn 110 48
[197] S o k o l o w s k i -Ti n t e n K B i a l k o w s k i J Ca v a l l e r i A v o n d e r L i n d e D O p a r i n A M e y e r -t e r -V e h n J and A n i s i m o v S I 1998 Phys Re Š Lett 81 224
[198] L i n k S B u r d a C N i k o o b a k h t B and E l -S a y e d M A 1999 Chem Phys Lett315 12
[199] L i n k S B u r d a C N i k o o b a k h t B and E l -Sa y e d M A 2000 J phys Chem (to bepublished)
[200] L i n k S W a n g Z L and E l -S a y e d M A 2000 (to be published)[201] M i r k i n C A L e t s i n g e r R L M u c i c R C and St o r h o f f J J 1996 Nature 382
607[202] A n d r e s R P B i e l e f e l d J D H e n d e r s o n J I Ja n e s D B K o l a g u n t a V R
K u b i a k C P M a h o n e y W J and O s i f c h i n R G 1996 Science 273 1690[203] M a r i n a k o s S M B r o u s s e a u L C Jo n e s A and F e l d h e i m D L 1998 Chem
Mater 10 1214[204] Je n s e n T R Sc h a t z G C and v a n D u y n e R P 1999 J phys Chem B 103 2394[205] G i e r s i g M and M u l v a n e y P 1993 J phys Chem 97 6334[206] W a n g Z L 1998 Ad Š Mater 10 13[207] M o t t e L B i l l o u d e t F L a c a z e E D o u i n J and Pi l e n i M P 1997 J phys Chem
B 101 138[208] K o r g e l B A F u l l a m S C o n n o l l y S and F i t z m a u r i c e D 1998 J phys Chem B
102 8379[209] H a r f e n i s t S A W a n g Z L Al v a r e z M M V e z m a r I and W h e t t e n R L 1996
J phys Chem 100 13904
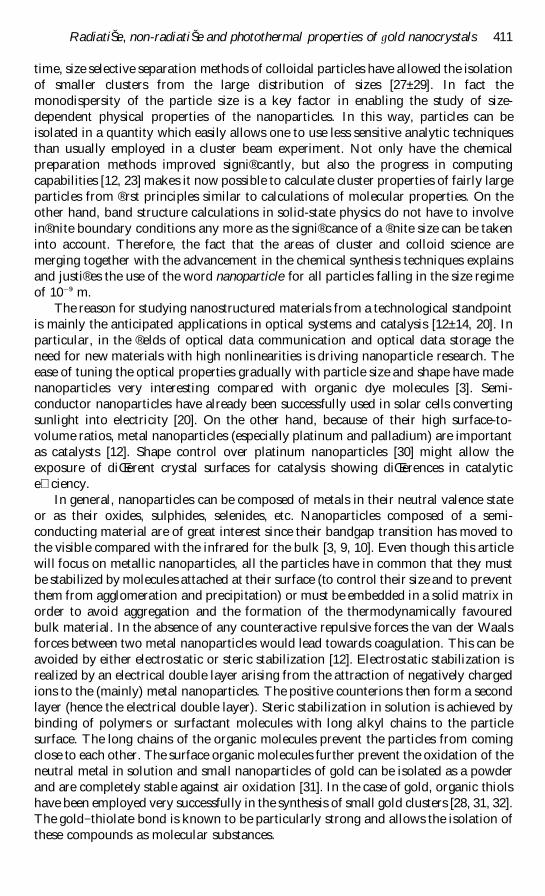
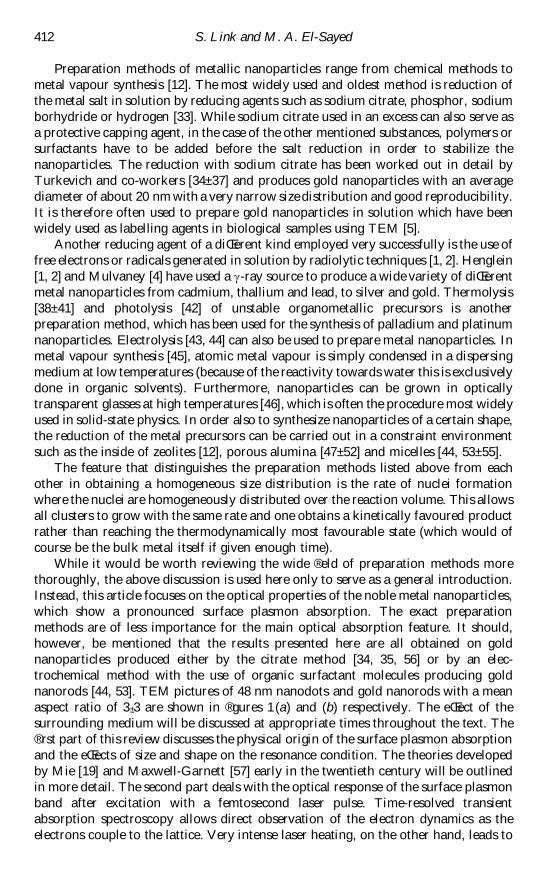
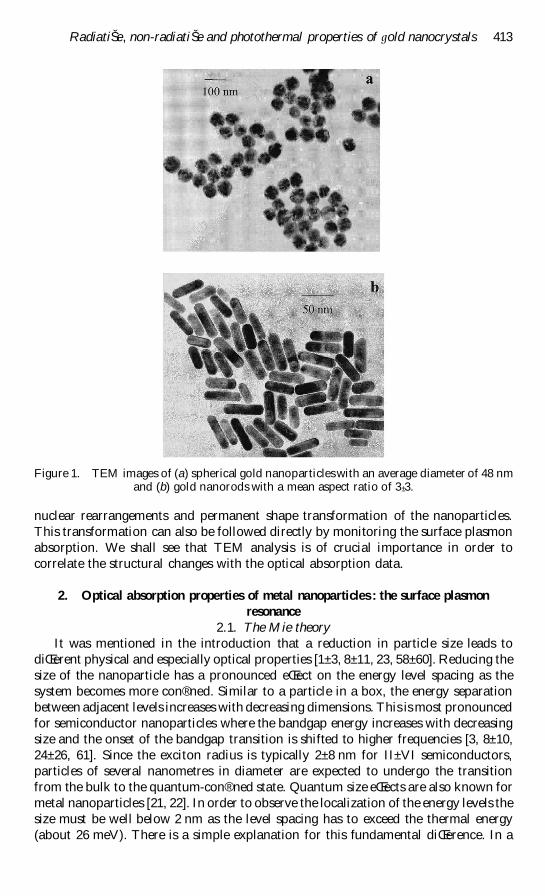
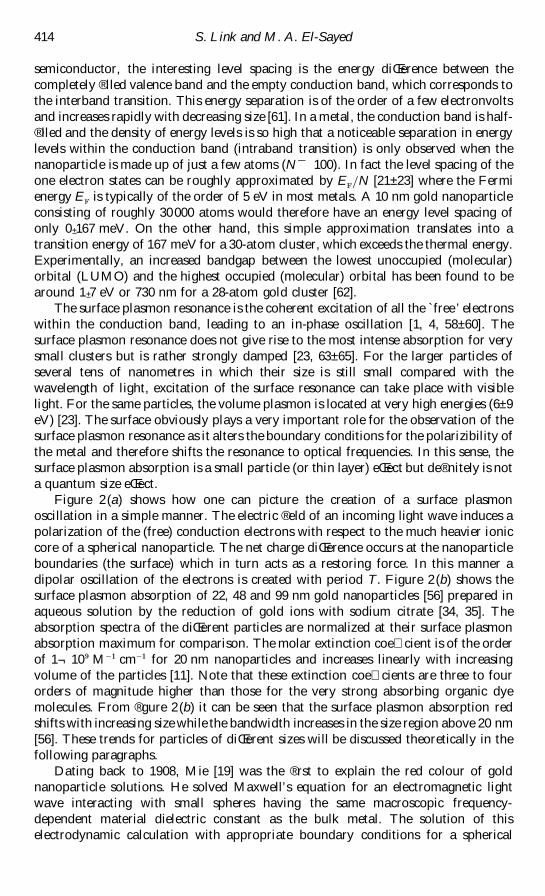
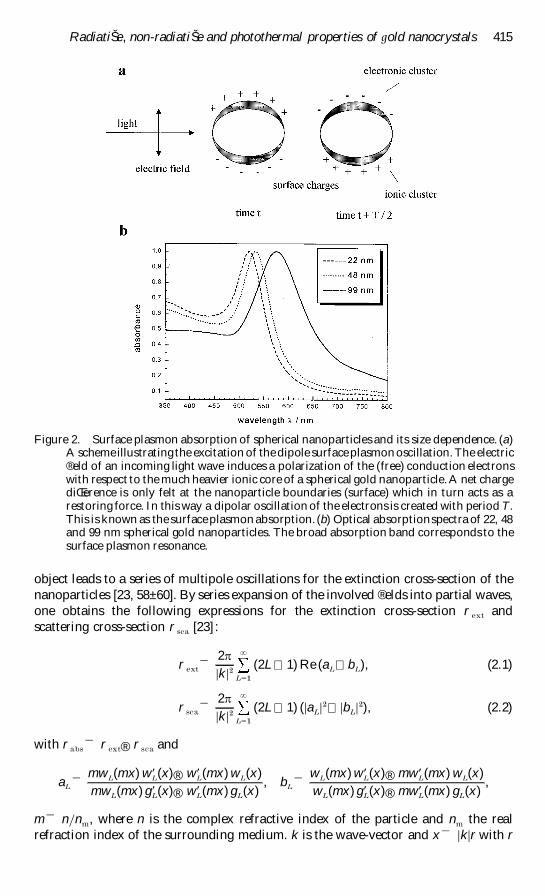
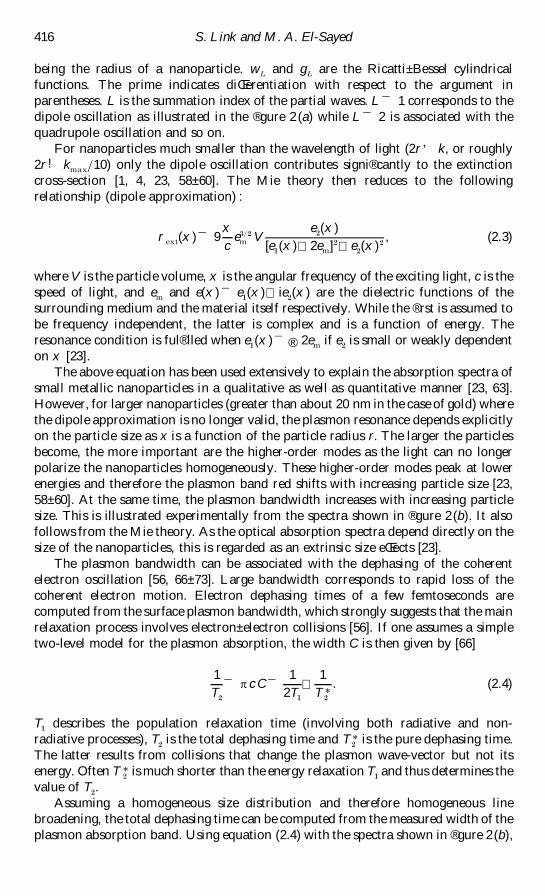
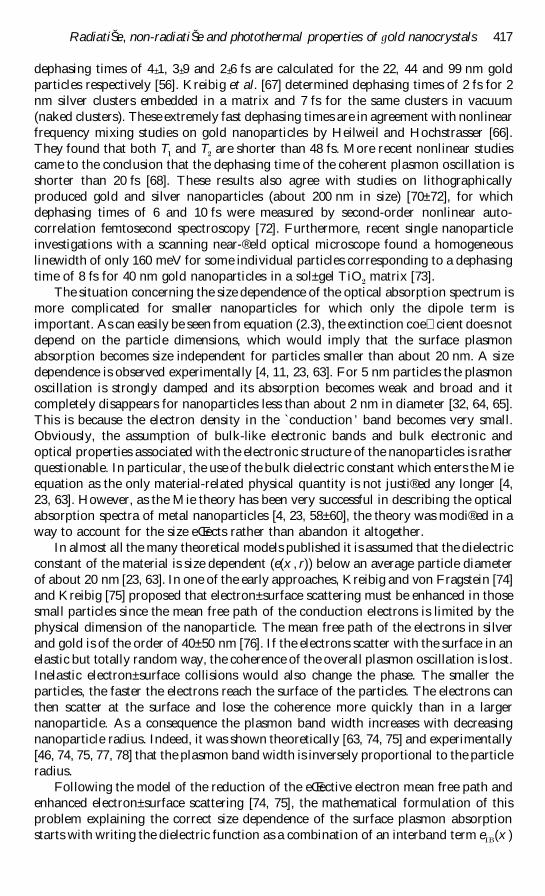
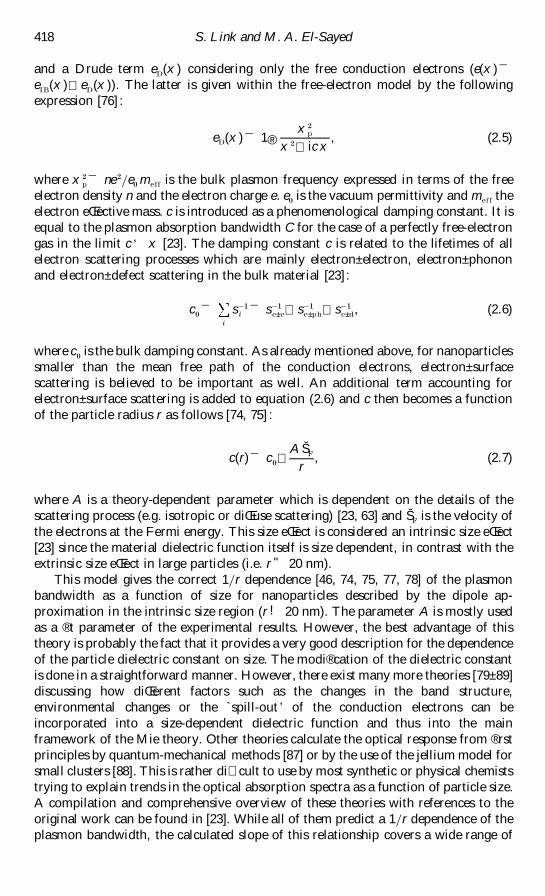
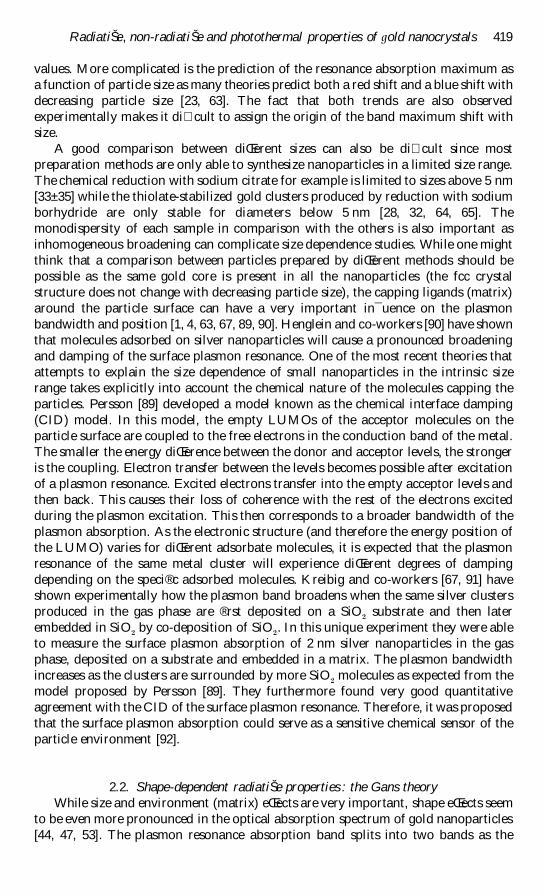
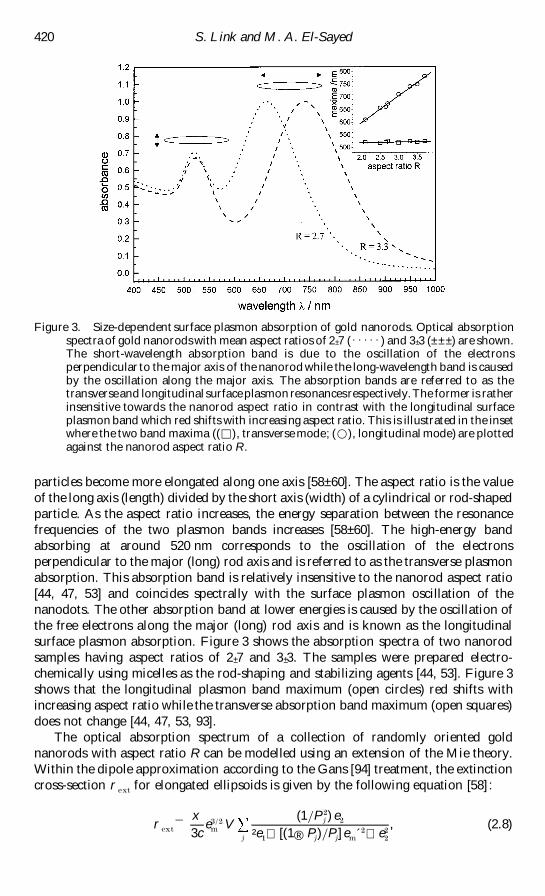
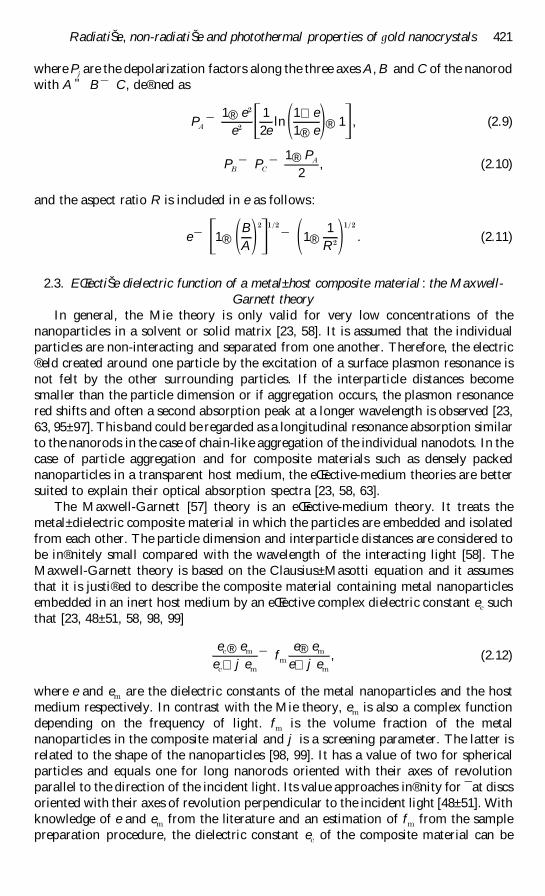
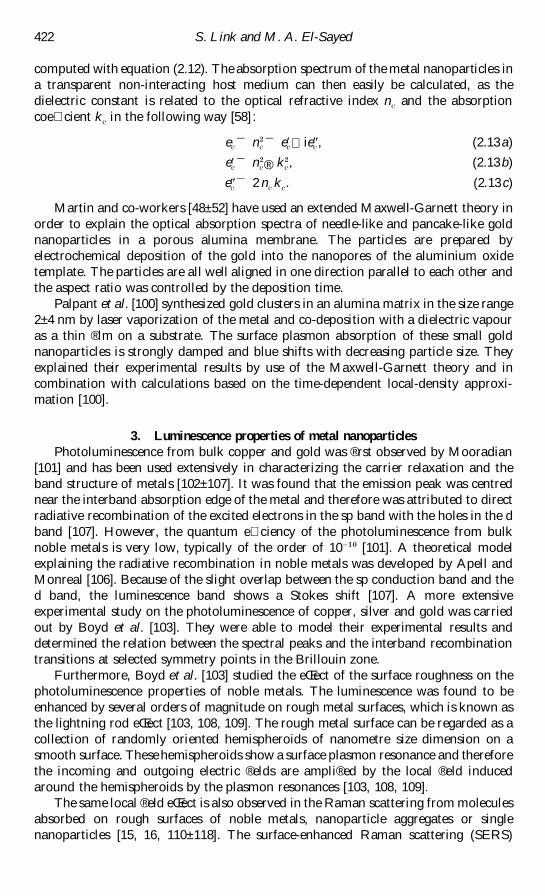
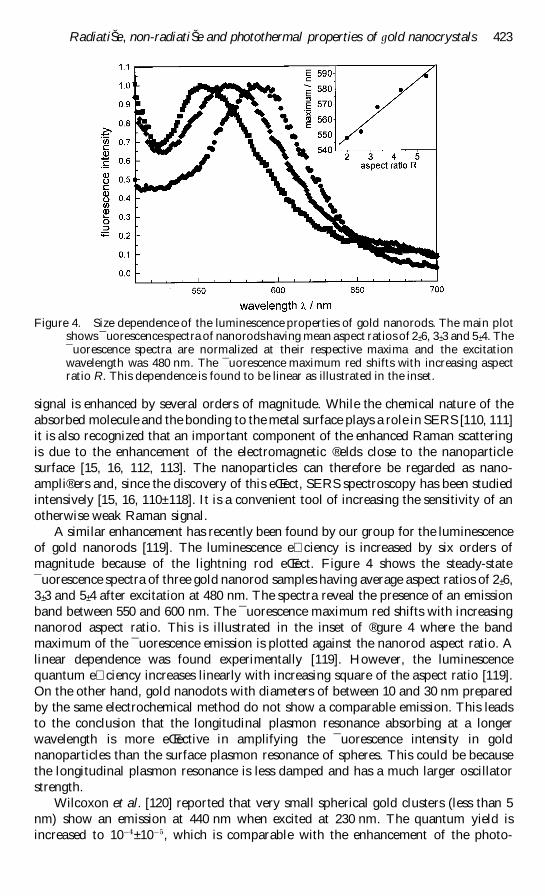
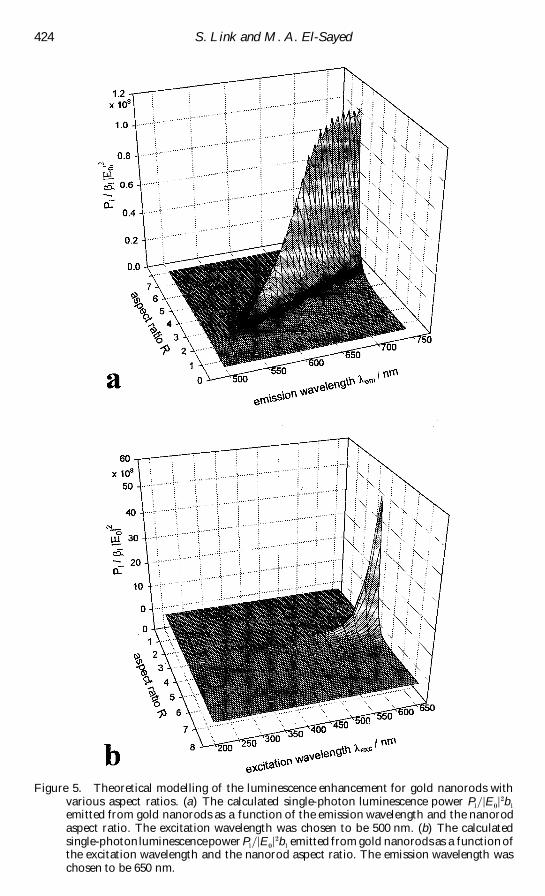
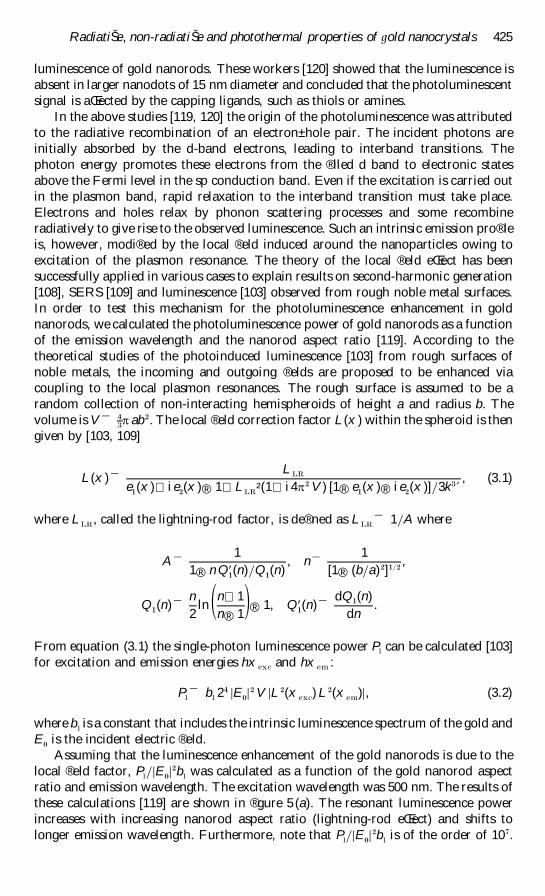