Embed Size (px)
Citation preview
ARTICLE IN PRESS
0022-0248/$ - se
doi:10.1016/j.jcr
�Correspondi+16103305714
E-mail addre
URL: http:/
Journal of Crystal Growth 274 (2005) 233–240
www.elsevier.com/locate/jcrysgro
Shape of ammonium chloride dendrite tips at smallsupersaturation
Andrew Dougherty�, Mayank Lahiri
Department of Physics, Lafayette College, Easton, PA 18042, USA
Received 17 May 2004; accepted 15 September 2004
Communicated by M.E. Glicksman
Available online 5 November 2004
Abstract
We report detailed shape measurements of the tips of three-dimensional NH4Cl dendrites grown from supersaturated
aqueous solution. For growth at small supersaturation, we compare two models for the tip shape: parabolic with a
fourth-order correction and a power law. Neither is ideal, but the fourth-order fit appears to provide the most robust
description of both the tip shape and position for this material. For that fit, the magnitude of the fourth-order
coefficient is about half of the theoretically expected value.
r 2004 Elsevier B.V. All rights reserved.
PACS: 68.70.+w; 81.10.Dn; 64.70.Dv
Keywords: A1. Crystal morphology; A1. Dendrites; A2. Growth from solution
1. Introduction
Dendrites are a commonly observed microstruc-tural form resulting from the diffusion-limitedsolidification of non-faceting materials, and theycontinue to be interesting for both practical andfundamental reasons. Practically, an improvedunderstanding of dendritic microstructures may
e front matter r 2004 Elsevier B.V. All rights reserve
ysgro.2004.09.065
ng author. Tel.: +16103305212; fax:
.
ss: [email protected] (A. Dougherty).
/www.lafayette.edu/%7Edoughera/.
enhance the ability to predict and control materialproperties. Fundamentally, they are an intriguingexample of pattern formation under non-linearand non-equilibrium conditions [1–4].Two of the most basic experimental character-
izations of a growing dendrite are the tip size andgrowth speed. Although there is already consider-able data available, recent advances in both theoryand experimental technique have made moreprecise comparisons between them possible. Somecomparisons have already been made for somepure materials [5,6], but it is important that theyalso be made for as broad a range of systems as is
d.
ARTICLE IN PRESS
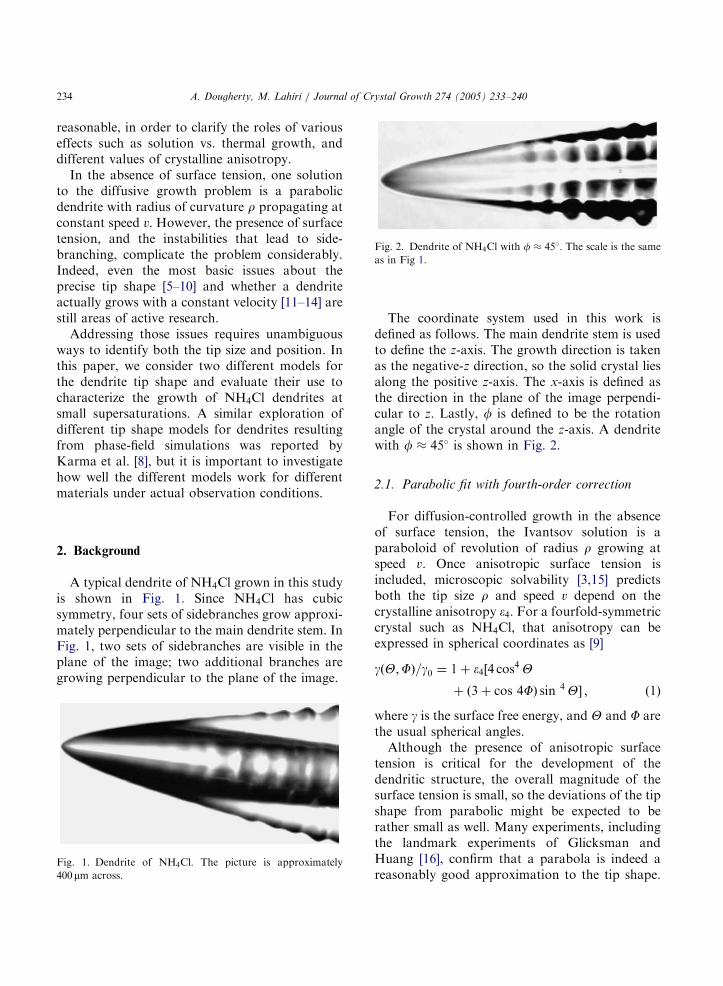
Fig. 2. Dendrite of NH4Cl with f � 45�: The scale is the sameas in Fig 1.
A. Dougherty, M. Lahiri / Journal of Crystal Growth 274 (2005) 233–240234
reasonable, in order to clarify the roles of variouseffects such as solution vs. thermal growth, anddifferent values of crystalline anisotropy.In the absence of surface tension, one solution
to the diffusive growth problem is a parabolicdendrite with radius of curvature r propagating atconstant speed v: However, the presence of surfacetension, and the instabilities that lead to side-branching, complicate the problem considerably.Indeed, even the most basic issues about theprecise tip shape [5–10] and whether a dendriteactually grows with a constant velocity [11–14] arestill areas of active research.Addressing those issues requires unambiguous
ways to identify both the tip size and position. Inthis paper, we consider two different models forthe dendrite tip shape and evaluate their use tocharacterize the growth of NH4Cl dendrites atsmall supersaturations. A similar exploration ofdifferent tip shape models for dendrites resultingfrom phase-field simulations was reported byKarma et al. [8], but it is important to investigatehow well the different models work for differentmaterials under actual observation conditions.
2. Background
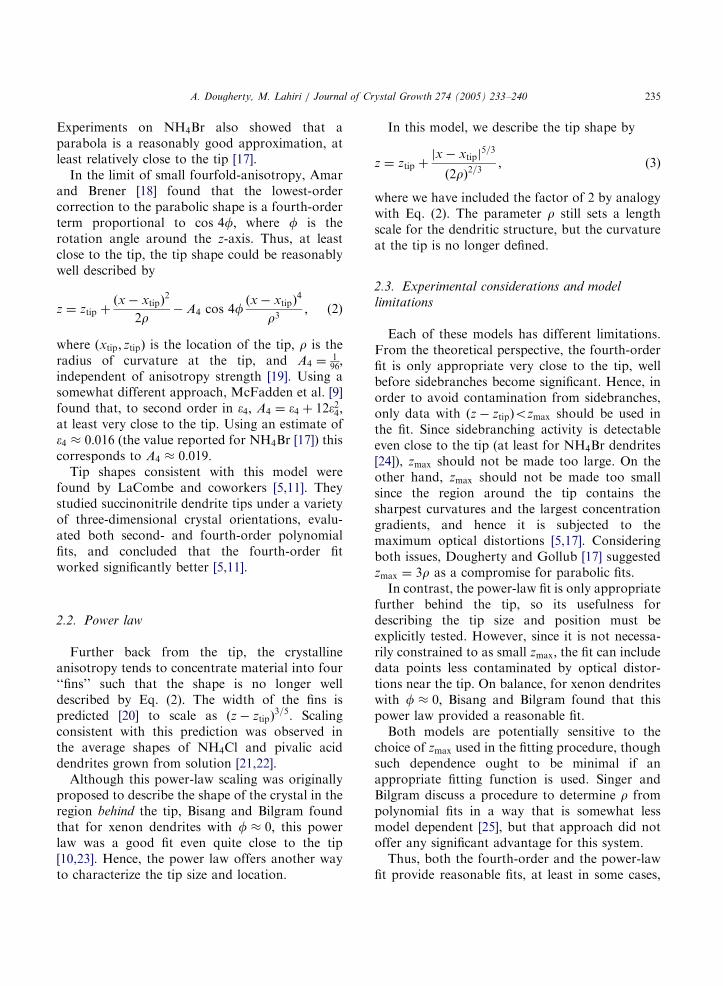
A typical dendrite of NH4Cl grown in this studyis shown in Fig. 1. Since NH4Cl has cubicsymmetry, four sets of sidebranches grow approxi-mately perpendicular to the main dendrite stem. InFig. 1, two sets of sidebranches are visible in theplane of the image; two additional branches aregrowing perpendicular to the plane of the image.
Fig. 1. Dendrite of NH4Cl: The picture is approximately400mm across.
The coordinate system used in this work isdefined as follows. The main dendrite stem is usedto define the z-axis. The growth direction is takenas the negative-z direction, so the solid crystal liesalong the positive z-axis. The x-axis is defined asthe direction in the plane of the image perpendi-cular to z. Lastly, f is defined to be the rotationangle of the crystal around the z-axis. A dendritewith f � 45� is shown in Fig. 2.
2.1. Parabolic fit with fourth-order correction
For diffusion-controlled growth in the absenceof surface tension, the Ivantsov solution is aparaboloid of revolution of radius r growing atspeed v. Once anisotropic surface tension isincluded, microscopic solvability [3,15] predictsboth the tip size r and speed v depend on thecrystalline anisotropy �4: For a fourfold-symmetriccrystal such as NH4Cl; that anisotropy can beexpressed in spherical coordinates as [9]
gðY;FÞ=g0 ¼ 1þ �4½4 cos4Y
þ ð3þ cos 4FÞ sin 4Y� ; ð1Þ
where g is the surface free energy, and Y and F arethe usual spherical angles.Although the presence of anisotropic surface
tension is critical for the development of thedendritic structure, the overall magnitude of thesurface tension is small, so the deviations of the tipshape from parabolic might be expected to berather small as well. Many experiments, includingthe landmark experiments of Glicksman andHuang [16], confirm that a parabola is indeed areasonably good approximation to the tip shape.
ARTICLE IN PRESS
A. Dougherty, M. Lahiri / Journal of Crystal Growth 274 (2005) 233–240 235
Experiments on NH4Br also showed that aparabola is a reasonably good approximation, atleast relatively close to the tip [17].In the limit of small fourfold-anisotropy, Amar
and Brener [18] found that the lowest-ordercorrection to the parabolic shape is a fourth-orderterm proportional to cos 4f; where f is therotation angle around the z-axis. Thus, at leastclose to the tip, the tip shape could be reasonablywell described by
z ¼ ztip þðx xtipÞ
2
2r A4 cos 4f
ðx xtipÞ4
r3; (2)
where ðxtip; ztipÞ is the location of the tip, r is theradius of curvature at the tip, and A4 ¼
196;
independent of anisotropy strength [19]. Using asomewhat different approach, McFadden et al. [9]found that, to second order in �4; A4 ¼ �4 þ 12�24;at least very close to the tip. Using an estimate of�4 � 0:016 (the value reported for NH4Br [17]) thiscorresponds to A4 � 0:019:Tip shapes consistent with this model were
found by LaCombe and coworkers [5,11]. Theystudied succinonitrile dendrite tips under a varietyof three-dimensional crystal orientations, evalu-ated both second- and fourth-order polynomialfits, and concluded that the fourth-order fitworked significantly better [5,11].
2.2. Power law
Further back from the tip, the crystallineanisotropy tends to concentrate material into four‘‘fins’’ such that the shape is no longer welldescribed by Eq. (2). The width of the fins ispredicted [20] to scale as ðz ztipÞ
3=5: Scalingconsistent with this prediction was observed inthe average shapes of NH4Cl and pivalic aciddendrites grown from solution [21,22].Although this power-law scaling was originally
proposed to describe the shape of the crystal in theregion behind the tip, Bisang and Bilgram foundthat for xenon dendrites with f � 0; this powerlaw was a good fit even quite close to the tip[10,23]. Hence, the power law offers another wayto characterize the tip size and location.
In this model, we describe the tip shape by
z ¼ ztip þjx xtipj
5=3
ð2rÞ2=3; (3)
where we have included the factor of 2 by analogywith Eq. (2). The parameter r still sets a lengthscale for the dendritic structure, but the curvatureat the tip is no longer defined.
2.3. Experimental considerations and model
limitations
Each of these models has different limitations.From the theoretical perspective, the fourth-orderfit is only appropriate very close to the tip, wellbefore sidebranches become significant. Hence, inorder to avoid contamination from sidebranches,only data with ðz ztipÞozmax should be used inthe fit. Since sidebranching activity is detectableeven close to the tip (at least for NH4Br dendrites[24]), zmax should not be made too large. On theother hand, zmax should not be made too smallsince the region around the tip contains thesharpest curvatures and the largest concentrationgradients, and hence it is subjected to themaximum optical distortions [5,17]. Consideringboth issues, Dougherty and Gollub [17] suggestedzmax ¼ 3r as a compromise for parabolic fits.In contrast, the power-law fit is only appropriate
further behind the tip, so its usefulness fordescribing the tip size and position must beexplicitly tested. However, since it is not necessa-rily constrained to as small zmax; the fit can includedata points less contaminated by optical distor-tions near the tip. On balance, for xenon dendriteswith f � 0; Bisang and Bilgram found that thispower law provided a reasonable fit.Both models are potentially sensitive to the
choice of zmax used in the fitting procedure, thoughsuch dependence ought to be minimal if anappropriate fitting function is used. Singer andBilgram discuss a procedure to determine r frompolynomial fits in a way that is somewhat lessmodel dependent [25], but that approach did notoffer any significant advantage for this system.Thus, both the fourth-order and the power-law
fit provide reasonable fits, at least in some cases,
ARTICLE IN PRESS
A. Dougherty, M. Lahiri / Journal of Crystal Growth 274 (2005) 233–240236
but a direct comparison of the two models for thesame material is required for an accurate assess-ment.
3. Experiments
The experiments were performed with aqueoussolutions of ammonium chloride with approxi-mately 36% NH4Cl by weight. The saturationtemperature was approximately 65 �C: The solu-tion was placed in a 45� 12:5� 2mm3 glass celland sealed with a teflon stopper. The cell wasmounted in a massive temperature-controlledcopper block surrounded by an insulated tempera-ture-controlled aluminum block, and placed on thestage of an Olympus BH-2 microscope. The entiremicroscope was enclosed in an insulating box.The temperature of the outer aluminum block
was controlled by an Omega CN-9000 controllerto approximately �1 �C: The temperature of theinner copper block was controlled directly bycomputer. A thermistor in the block was con-nected via a Kiethley 2000 digital multi-meter tothe computer, where the resistance was convertedto temperature. The computer then controlled theheater power supply using a software version of aproportional-integral controller. This allowed veryflexible control over not just the temperature, butalso over any changes in the temperature, such asthose used to initiate growth. The temperature ofthe sample was stable to within approximately�5� 104 �C:A charged-coupled device (CCD) camera was
attached to the microscope and images wereacquired directly into the computer with a DataTranslation DT3155 frame grabber with a resolu-tion of 640� 480 pixels. The ultimate resolution ofthe images was 0:63� 0:01mm=pixel: As a backup,images were also recorded onto video tape for lateruse.To obtain crystals, the solution was heated to
dissolve all the NH4Cl; stirred to eliminateconcentration gradients, and then cooled toinitiate growth. Typically, many crystals wouldnucleate. An automated process was set up toacquire images and then slowly adjust the tem-
perature until all but the largest crystal haddissolved.This isolated crystal was allowed to stabilize for
several days. The temperature was then reduced by0:77 �C and the crystal was allowed to grow. Thecrystal was initially approximately spherical, butdue to the cubic symmetry of NH4Cl; six dendritetips would begin to grow. The tip with the mostfavorable orientation was followed, and imageswere recorded at regular intervals.The interface position was determined in the
same manner as in Ref. [17]. The intensity in theimage was measured on a line perpendicular tothe interface. Over the range of a few pixels, theintensity changes rapidly from bright to dark.Deeper inside the crystal, the intensity begins torise again. (This corresponds to the brighter areasinside the crystal in Fig. 1.) In the bright-to-darktransition region, we fit a straight line to theintensity profile. We define the interface as thelocation where the fitted intensity is the average ofthe high value outside the crystal and the low valuejust inside the crystal.This fitting procedure interpolates intensity
values and allows a reproducible measure of theinterface to better than one pixel resolution. It isalso insensitive to absolute light intensity levels, tovariations in intensity across a single image, and tovariations in intensity inside the crystal well awayfrom the interface. For the simple shapes con-sidered here, this method is more robust andrequires less manual intervention than a moregeneral contour-extraction method, such as theone described by Singer and Bilgram for morecomplex crystal shapes [26].This method works best if the image is scanned
along a line perpendicular to the interface. Sincethe position and orientation of the interface areoriginally unknown, an iterative procedure is useduntil subsequent iterations make no significantchange to the fit. Specifically, we start with aninitial estimate of the size, location, and orienta-tion of the tip, and use that to scan the image toobtain a list of interface positions up to a distancezmax back from the tip (where zmax is some multipleof r). We next rotate the data by an angle y in thex–z plane and perform a non-linear regression onEqs. (2) or (3) to determine the best fit values for
ARTICLE IN PRESS
4
5
6
7
8
9
10
11
0 5 10 15 20 25
ρ (µ
m)
zmax/ρ
parabolicfourth order
power law
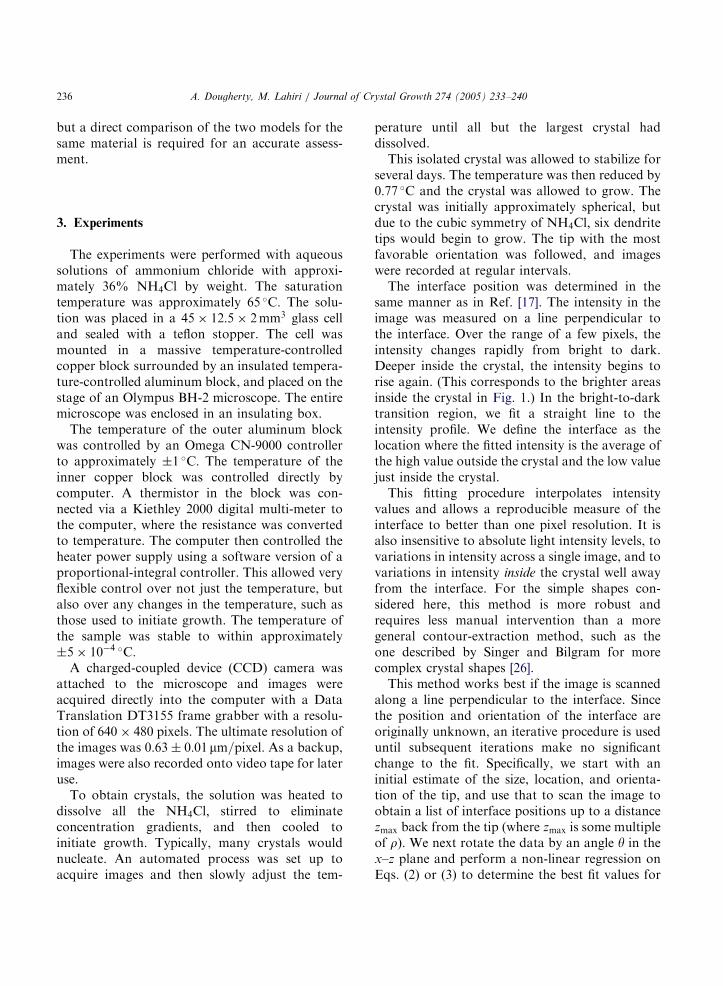
Fig. 3. Best fit value of r as a function of zmax=r for the crystalshown in Fig. 1. The curves are for a parabolic fit (þ), a fourth-
order fit (�), and a power-law fit ( ).
0.4
0.6
0.8
1
1.2
1.4
χ2
parabolicfourth order
power law
A. Dougherty, M. Lahiri / Journal of Crystal Growth 274 (2005) 233–240 237
xtip; ztip; r; and A4 (if applicable), and thecorresponding w2 value. We then repeat withdifferent y values and minimize w2 using Brent’salgorithm [27]. This completes one iteration of thefitting procedure. We use this result to rescan theimage along lines perpendicular to the interface toobtain a better estimate of the interface locationand begin the next iteration. The procedureusually converges fairly rapidly. Even for arelatively poor initial estimate, it typically takesfewer than 20 iterations.There are some subtleties to the procedure
worth noting. First, for a typical crystal in thiswork such as in Fig. 1, only about 120 data pointsare involved in the fit for zmax ¼ 6r: For thefourth-order fit with five free parameters, there areoften a number of closely spaced local minima inthe w2 surface, with tip positions and radii varyingby a few hundredths of a micrometer. If theiterative procedure enters a limit cycle instead ofsettling down to a single final value, we select theelement from that limit cycle with the minimum w2:Second, we have no way to control or preciselymeasure the orientation angle f of the crystals inour system. In Ref. [5], the authors were able todetermine f by viewing the crystal along twoperpendicular directions, but the thin horizontalcell used in this work only offers one optical axis.
0
0.2
0 5 10 15 20 25
zmax/ρ
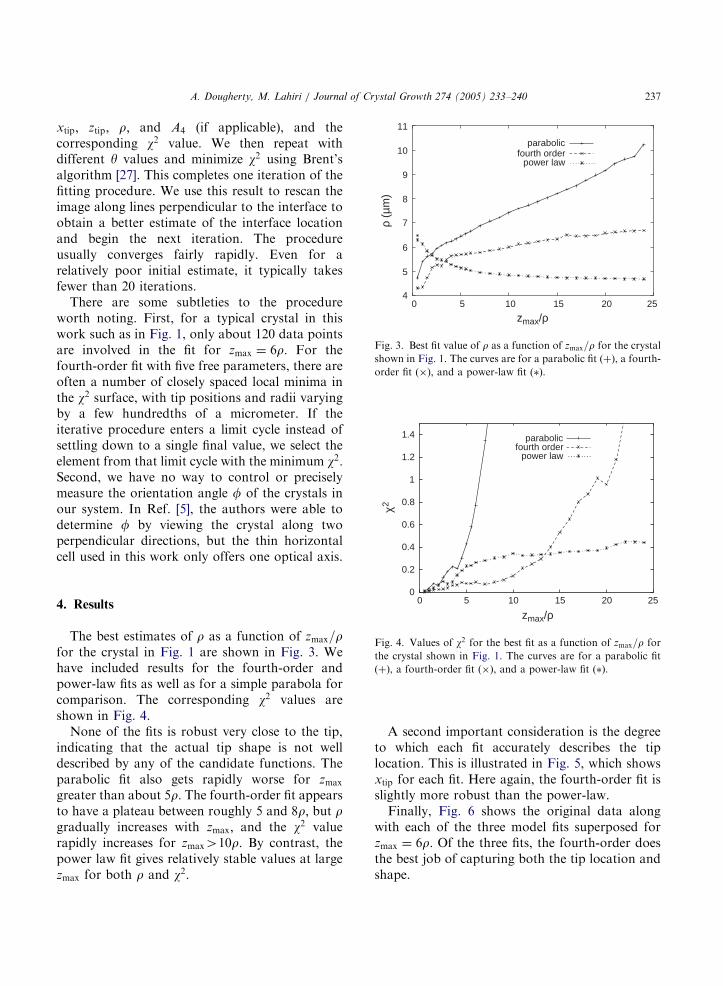
Fig. 4. Values of w2 for the best fit as a function of zmax=r forthe crystal shown in Fig. 1. The curves are for a parabolic fit
(þ), a fourth-order fit (�), and a power-law fit ( ).
4. Results
The best estimates of r as a function of zmax=rfor the crystal in Fig. 1 are shown in Fig. 3. Wehave included results for the fourth-order andpower-law fits as well as for a simple parabola forcomparison. The corresponding w2 values areshown in Fig. 4.None of the fits is robust very close to the tip,
indicating that the actual tip shape is not welldescribed by any of the candidate functions. Theparabolic fit also gets rapidly worse for zmaxgreater than about 5r: The fourth-order fit appearsto have a plateau between roughly 5 and 8r; but rgradually increases with zmax; and the w2 valuerapidly increases for zmax410r: By contrast, thepower law fit gives relatively stable values at largezmax for both r and w2:
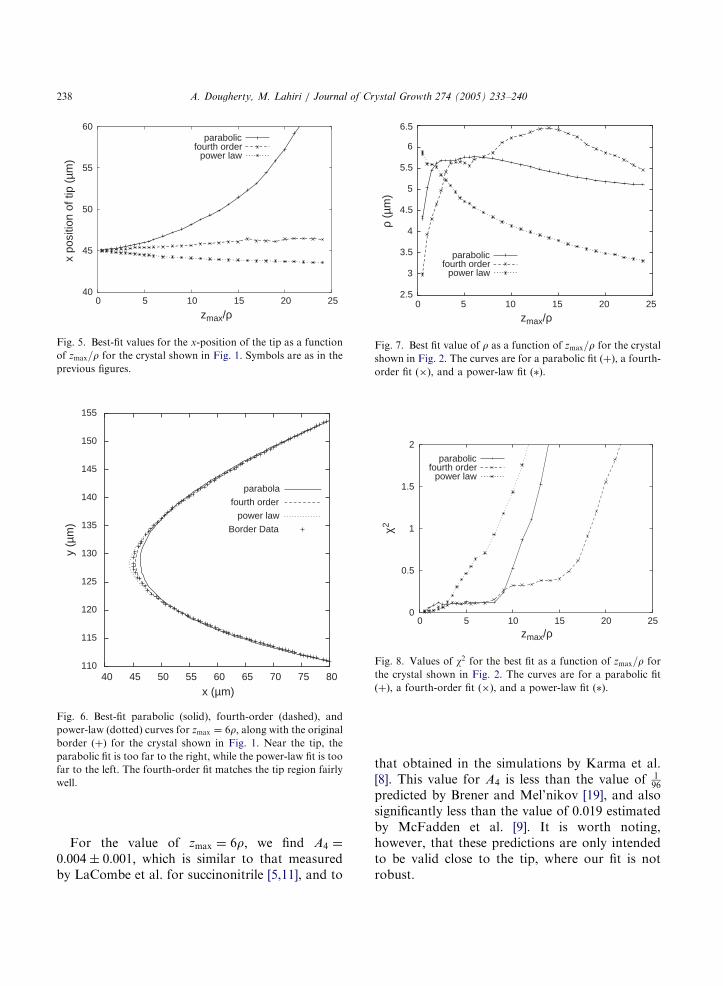
A second important consideration is the degreeto which each fit accurately describes the tiplocation. This is illustrated in Fig. 5, which showsxtip for each fit. Here again, the fourth-order fit isslightly more robust than the power-law.Finally, Fig. 6 shows the original data along
with each of the three model fits superposed forzmax ¼ 6r: Of the three fits, the fourth-order doesthe best job of capturing both the tip location andshape.
ARTICLE IN PRESS
parabolicfourth order
power law
zmax/ρ
40
45
50
55
60
0 5 10 15 20 25
x po
sitio
n of
tip
(µm
)
Fig. 5. Best-fit values for the x-position of the tip as a function
of zmax=r for the crystal shown in Fig. 1. Symbols are as in theprevious figures.
110
115
120
125
130
135
140
145
150
155
40 45 50 55 60 65 70 75 80
y (µ
m)
x (µm)
parabola
fourth order
power law
Border Data
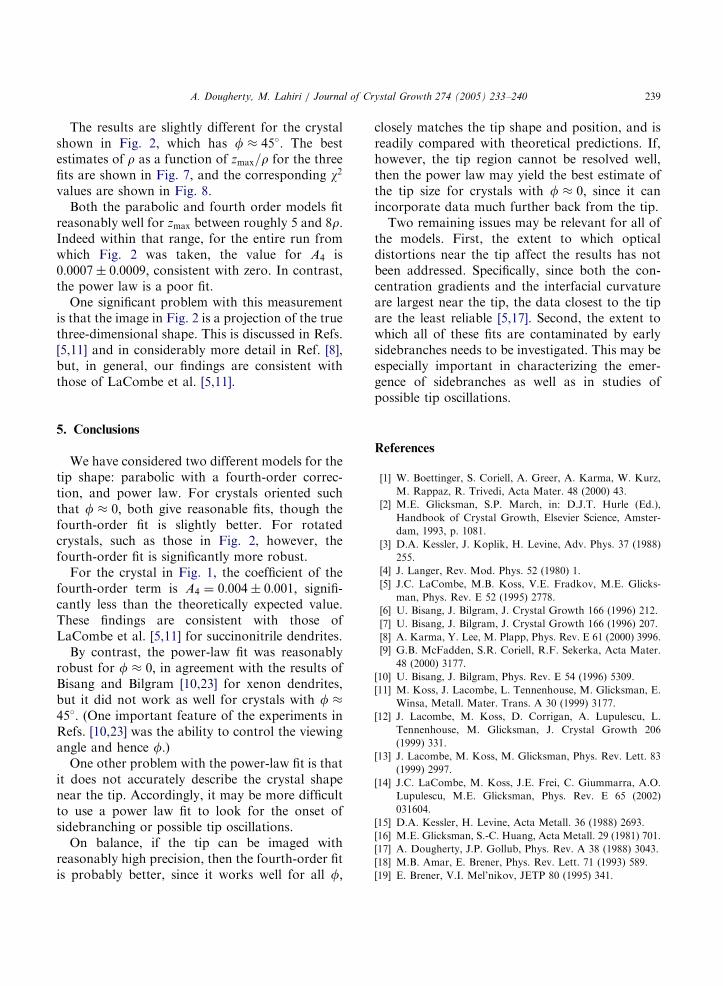
Fig. 6. Best-fit parabolic (solid), fourth-order (dashed), and
power-law (dotted) curves for zmax ¼ 6r; along with the originalborder (þ) for the crystal shown in Fig. 1. Near the tip, the
parabolic fit is too far to the right, while the power-law fit is too
far to the left. The fourth-order fit matches the tip region fairly
well.
parabolicfourth order
power law
zmax/ρ
2.5
3
3.5
4
4.5
5
5.5
6
6.5
0 5 10 15 20 25
ρ (µ
m)
Fig. 7. Best fit value of r as a function of zmax=r for the crystalshown in Fig. 2. The curves are for a parabolic fit (þ), a fourth-
order fit (�), and a power-law fit ( ).
χ2
parabolicfourth order
power law
zmax/ρ
0
0.5
1
1.5
2
0 5 10 15 20 25
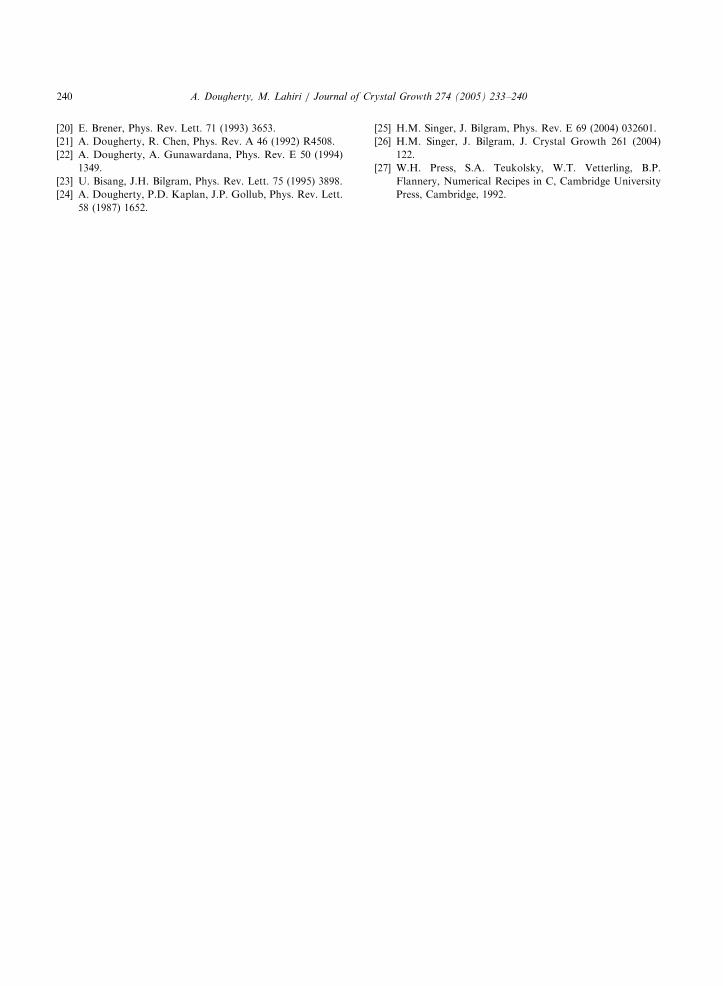
Fig. 8. Values of w2 for the best fit as a function of zmax=r forthe crystal shown in Fig. 2. The curves are for a parabolic fit
(þ), a fourth-order fit (�), and a power-law fit ( ).
A. Dougherty, M. Lahiri / Journal of Crystal Growth 274 (2005) 233–240238
For the value of zmax ¼ 6r; we find A4 ¼
0:004� 0:001; which is similar to that measuredby LaCombe et al. for succinonitrile [5,11], and to
that obtained in the simulations by Karma et al.[8]. This value for A4 is less than the value of
196
predicted by Brener and Mel’nikov [19], and alsosignificantly less than the value of 0.019 estimatedby McFadden et al. [9]. It is worth noting,however, that these predictions are only intendedto be valid close to the tip, where our fit is notrobust.
ARTICLE IN PRESS
A. Dougherty, M. Lahiri / Journal of Crystal Growth 274 (2005) 233–240 239
The results are slightly different for the crystalshown in Fig. 2, which has f � 45�: The bestestimates of r as a function of zmax=r for the threefits are shown in Fig. 7, and the corresponding w2
values are shown in Fig. 8.Both the parabolic and fourth order models fit
reasonably well for zmax between roughly 5 and 8r:Indeed within that range, for the entire run fromwhich Fig. 2 was taken, the value for A4 is0:0007� 0:0009; consistent with zero. In contrast,the power law is a poor fit.One significant problem with this measurement
is that the image in Fig. 2 is a projection of the truethree-dimensional shape. This is discussed in Refs.[5,11] and in considerably more detail in Ref. [8],but, in general, our findings are consistent withthose of LaCombe et al. [5,11].
5. Conclusions
We have considered two different models for thetip shape: parabolic with a fourth-order correc-tion, and power law. For crystals oriented suchthat f � 0; both give reasonable fits, though thefourth-order fit is slightly better. For rotatedcrystals, such as those in Fig. 2, however, thefourth-order fit is significantly more robust.For the crystal in Fig. 1, the coefficient of the
fourth-order term is A4 ¼ 0:004� 0:001; signifi-cantly less than the theoretically expected value.These findings are consistent with those ofLaCombe et al. [5,11] for succinonitrile dendrites.By contrast, the power-law fit was reasonably
robust for f � 0; in agreement with the results ofBisang and Bilgram [10,23] for xenon dendrites,but it did not work as well for crystals with f �
45�: (One important feature of the experiments inRefs. [10,23] was the ability to control the viewingangle and hence f:)One other problem with the power-law fit is that
it does not accurately describe the crystal shapenear the tip. Accordingly, it may be more difficultto use a power law fit to look for the onset ofsidebranching or possible tip oscillations.On balance, if the tip can be imaged with
reasonably high precision, then the fourth-order fitis probably better, since it works well for all f;
closely matches the tip shape and position, and isreadily compared with theoretical predictions. If,however, the tip region cannot be resolved well,then the power law may yield the best estimate ofthe tip size for crystals with f � 0; since it canincorporate data much further back from the tip.Two remaining issues may be relevant for all of
the models. First, the extent to which opticaldistortions near the tip affect the results has notbeen addressed. Specifically, since both the con-centration gradients and the interfacial curvatureare largest near the tip, the data closest to the tipare the least reliable [5,17]. Second, the extent towhich all of these fits are contaminated by earlysidebranches needs to be investigated. This may beespecially important in characterizing the emer-gence of sidebranches as well as in studies ofpossible tip oscillations.
References
[1] W. Boettinger, S. Coriell, A. Greer, A. Karma, W. Kurz,
M. Rappaz, R. Trivedi, Acta Mater. 48 (2000) 43.
[2] M.E. Glicksman, S.P. March, in: D.J.T. Hurle (Ed.),
Handbook of Crystal Growth, Elsevier Science, Amster-
dam, 1993, p. 1081.
[3] D.A. Kessler, J. Koplik, H. Levine, Adv. Phys. 37 (1988)
255.
[4] J. Langer, Rev. Mod. Phys. 52 (1980) 1.
[5] J.C. LaCombe, M.B. Koss, V.E. Fradkov, M.E. Glicks-
man, Phys. Rev. E 52 (1995) 2778.
[6] U. Bisang, J. Bilgram, J. Crystal Growth 166 (1996) 212.
[7] U. Bisang, J. Bilgram, J. Crystal Growth 166 (1996) 207.
[8] A. Karma, Y. Lee, M. Plapp, Phys. Rev. E 61 (2000) 3996.
[9] G.B. McFadden, S.R. Coriell, R.F. Sekerka, Acta Mater.
48 (2000) 3177.
[10] U. Bisang, J. Bilgram, Phys. Rev. E 54 (1996) 5309.
[11] M. Koss, J. Lacombe, L. Tennenhouse, M. Glicksman, E.
Winsa, Metall. Mater. Trans. A 30 (1999) 3177.
[12] J. Lacombe, M. Koss, D. Corrigan, A. Lupulescu, L.
Tennenhouse, M. Glicksman, J. Crystal Growth 206
(1999) 331.
[13] J. Lacombe, M. Koss, M. Glicksman, Phys. Rev. Lett. 83
(1999) 2997.
[14] J.C. LaCombe, M. Koss, J.E. Frei, C. Giummarra, A.O.
Lupulescu, M.E. Glicksman, Phys. Rev. E 65 (2002)
031604.
[15] D.A. Kessler, H. Levine, Acta Metall. 36 (1988) 2693.
[16] M.E. Glicksman, S.-C. Huang, Acta Metall. 29 (1981) 701.
[17] A. Dougherty, J.P. Gollub, Phys. Rev. A 38 (1988) 3043.
[18] M.B. Amar, E. Brener, Phys. Rev. Lett. 71 (1993) 589.
[19] E. Brener, V.I. Mel’nikov, JETP 80 (1995) 341.
ARTICLE IN PRESS
A. Dougherty, M. Lahiri / Journal of Crystal Growth 274 (2005) 233–240240
[20] E. Brener, Phys. Rev. Lett. 71 (1993) 3653.
[21] A. Dougherty, R. Chen, Phys. Rev. A 46 (1992) R4508.
[22] A. Dougherty, A. Gunawardana, Phys. Rev. E 50 (1994)
1349.
[23] U. Bisang, J.H. Bilgram, Phys. Rev. Lett. 75 (1995) 3898.
[24] A. Dougherty, P.D. Kaplan, J.P. Gollub, Phys. Rev. Lett.
58 (1987) 1652.
[25] H.M. Singer, J. Bilgram, Phys. Rev. E 69 (2004) 032601.
[26] H.M. Singer, J. Bilgram, J. Crystal Growth 261 (2004)
122.
[27] W.H. Press, S.A. Teukolsky, W.T. Vetterling, B.P.
Flannery, Numerical Recipes in C, Cambridge University
Press, Cambridge, 1992.