Embed Size (px)
Citation preview

ORIGINAL ARTICLE
Shape optimization of square weld nut in projection welding
Giyeol Han1& Sangun Ha1 & Karuppasamy Pandian Marimuthu1
& Siva Prasad Murugan2& Yeongdo Park2 &
Hyungyil Lee1
Received: 19 July 2020 /Accepted: 3 February 2021# The Author(s), under exclusive licence to Springer-Verlag London Ltd. part of Springer Nature 2021
AbstractThis study provides an optimal shape of square nut for better projection welding performance. Both experimental design methodand electrical-thermal-mechanical finite element analysis (FEA) are used to investigate the effects of nut shape parameters on theheight decrease of nut leg, called setdown. The relationship between the setdown and weld strength is then analyzed. Also,welding time to reach 50% of setdown tset is introduced as another objective function for better welding performance. The optimalnut shape parameters are determined to maximize the setdown, and minimize the tset at the same time via Taguchi method. Thedifference of setdown values between experiments and FEA is within 12%, which verify the reliability of the FE model. The gapbetween DIN928 standard for nut leg geometry and the optimized nut leg shape is less than 0.2 mm. The differences of setdownand tset values for two nut shapes are 6% and 9%, respectively.
Keywords Nut projection welding . Taguchi method . Coupled electrical-thermal-mechanical analysis . Finite element method .
Setdown . Optimal nut geometry
1 Introduction
In a vehicle body, most of the joints are mainly connected byusing nuts and bolts. Nuts are generally attached on a metalbody (or sheet) by nut projection welding (NPW). A stud boltis then screwed into the nut to fasten spare parts with thevehicle body. In NPW process, a square nut with small pro-jections at the bottom is pressed onto a metal sheet by flatelectrodes. This builds a closed electric circuit to facilitatethe current flow through the nut and sheet between electrodes.Due to the high concentration of current density around thesmall projections (= nut projection), the nut is welded on themetal sheet by developing a nugget at the joints between nut-sheet.
In the vehicle body assemblies, manufacturing defects canresult in product liability claims under the product liability act.Therefore, problems related to the welding qualities are
critically addressed to reduce weld defects such as low weldstrength and interfacial fracture in the welded joints. For ex-ample, a nugget with insufficient weld strength can cause thenut to detach from the sheet. Such weld defects are related tovehicle occupant safety as they significantly affect the perfor-mance, and crashworthiness of vehicles. Therefore, it is cru-cial to ensure the quality of the welded nuts, particularly onimportant vehicle parts such as front and rear axles andsteering columns [1]. This necessitates better understandingson the NPW process for ensuring reliable and quality welds inautomated manufacturing processes. A suitable selection ofnut shapes and corresponding materials may improve thewelding performances and thus the vehicle safety.
Several experimental and numerical studies were conduct-ed on nut projection welding. Adams et al. [2] analyzed theeffects of the projection shape on the weld quality.Cunningham and Begeman [3] reported a change in weldstrength with projection height. Sun [4] performed finite ele-ment analysis (FEA) to simulate the projection collapse andnugget formation processes for various projection heights.They concluded that nugget size is proportional to the projec-tion height. Despite several research works on projectionwelding of inter-sheets [5, 6], NPW has rarely been studieddue to the difficulties in experimental preparation of complexnut shapes. Convergence problems associated with the large
* Hyungyil [email protected]
1 Department of Mechanical Engineering, Sogang University,Seoul 04107, Republic of Korea
2 Department of Advanced Materials Engineering, Dong-EuiUniversity, Busan 47340, Republic of Korea
The International Journal of Advanced Manufacturing Technologyhttps://doi.org/10.1007/s00170-021-06771-7

deformations of nut projection and contact between nut andsheet also produce difficulties in the numerical simulations.Tolf and Hedegård [7] attached the nuts on high-strength steelsheets by NPW using both alternating and direct current. Byanalyzing the efficiency of welded nuts, they reported thatalternating current (AC) is advantageous over medium-frequency direct current (MFDC) for achieving optimal weldtensile strength. Ringsberg et al. [8] examined the fatigue lifeof a welded component with welding variables such as nutshape and sheet thickness. It was then concluded that M8 nutshave a greater fatigue resistance than M10 nuts. M8 and M10are square nuts with four projections. However, these experi-mental studies are limited in providing comprehensive data-bases for understanding the welding behavior with various nutshapes and other welding variables.
Linden [9] constructed FE model using a commercial FEprogram so-called SORPAS to identify optimal nut shapes forM6 and M8 square nuts for welding with various sheets in-cluding DP600, DP800, and AISI301. However, weld qualityassessments were limited to simple comparisons of nuggetshapes, and no systematic quantitative analysis of weldingbehavior with different nut shape was performed.Constructing three-dimensional (3D) FE model of squarenuts, Nielsen et al. [10] analyzed the effect of coefficient offriction on the projection collapse patterns and nugget shapesunder different welding conditions. These studies were per-formed by simply comparing the experimental observationswith the numerical results.
Here, we aim at investigating the mechanism and weldingprocess of NPWusing both Taguchi method and fully coupledelectrical-thermal-mechanical FEA. Since, high-strengthsteels (HSSs) are largely used as lightweight materials in theautomotive industries, we construct 3D FE model of squarenut and HSS sheet in Abaqus [11]. The criteria specified inDIN 928 (2013) are fully followed while creating the FEmodel. The reliability of FE model is confirmed by comparingthe experimental observation of projection collapse and fusionpatterns with numerical results. Finally, an optimal nut shapeis proposed based on two welding performance assessmentcriteria such as (i) setdown and (ii) time taken to reach 50%of setdown.
2 Optimization of nut projection shape
2.1 Experimental design
The experimental design, also known as Taguchi method [12],is a multivariate approach that reduces the number of experi-ments by analyzing the impact of each design variable on theobjective functions. To optimize the nut leg shape, we adopttwo variables (i) setdown S and (ii) time tset for 50% ofsetdown after current as assessment criteria of weld perfor-mance. As the smaller tset accelerates the process speed andimproves energy efficiency, we adopt tset as one of the objec-tive functions. The setdown S is the relative decrease of legheight of nut. For higher setdown, a stable nugget formationoccurs at the nut-sheet joints. The setdown S (%) can be cal-culated as [13]
S ¼ a−ba
≅a− h−c−dð Þ
a%½ � ð1Þ
where the variables a, b, h, c, and d are the dimensions of thenut as illustrated in Fig. 1. It is assumed that the nut bodyheight c and the sheet thickness d do not change during thewelding process.
The main design variables that influence the shape of nutare illustrated in Fig. 2, where A is the length of nut-sheetcontact area, B is the length of nut projection contact area, Cis the projection height, and D is the hole diameter. In thisstudy, welding performance is analyzed with three levels foreach design variable as listed in Table 1. In each experimentalcondition, the value of A is considered to be lower than that ofB. In addition, variables such as ambient air temperature E,coolant temperature F, and wind intensity G are assigned asnoise factors to consider the external environmental condi-tions. The wind intensity is adjusted by changing the convec-tion heat transfer coefficient. The higher convection heattransfer coefficient means high wind intensity. To obtain theoptimum nut leg shape from minimum number of analyses,the degrees of freedom are calculated for both inner and outerarrays by using L9 (3
4) and L8 (23) orthogonal array for inner
and outer array designs, respectively. In Taguchi method,larger setdown and smaller tset are preferred. The signal/noise
hc
da b
(a) (b)
Fig. 1 Dimensions of square nut-sheet system. (a) Before and (b)after projection collapse
Int J Adv Manuf Technol

ratio (S/N ratio) can be used to determine the optimal level ofeach design factors for acquiring the target values in variableanalysis. Experiments can be carried out under the conditionsthat minimize the influence of external conditions, which can-not be controlled during experiments. The S/N ratios relativeto the objective functions are calculated as
S=N ¼ −10logMSD
MSD ¼
∑n
i¼1xi2
n; for tset
∑n
i¼11=yi
2
n; for setdown S
8>>>>><>>>>>:
ð2Þ
where xi and yi are the mean value of tset and setdown S foreach condition, respectively. S/N ratios from Eq. (2) are usedfor analyzing the average impact of each variable via levelaverage analysis. Delta, which means the degree of effect on
the objective function of each design variable, is calculated asfollows.
Delta ¼ S=N½ �max− S=N½ �min ð3Þ
In this study, (i) a single variable that has greatest impact onoutcome and (ii) combinations of variables that provide idealoutcome are derived.
2.2 Finite element modeling
A nut projection welding (NPW) process consists two flat elec-trodes (upper and lower), a square nut, and metal sheet as illus-trated in Fig. 3a. By considering symmetry nature of the con-sidered NPW system, quarter FE model is constructed inAbaqus/Standard by using 10,150 coupled electrical-thermal-structural elements with reduced integration (Q3D8R) [11]. Thenut projections are refined with finer elements to accommodatelarge deformations due to melting (Fig. 3b). For nut and sheet,the considered number of elements is similar to the FEmodel ofNielsen et al. [10] for M10 square nut system. The nut dimen-sions are changed based on the levels of design variables aslisted in Table 1. The thickness of metal sheet is consideredas 1 mm. Pressing force of electrode f and welding current Iare applied to upper electrode, giving uniform distributed loadand current on the nut, while the displacement (ux, uy, uz) at thebottom of the lower electrode is fixed in all directions.Additionally, the electric potential φ at the bottom surface oflower electrode is assumed to be zero. The contact between nutprojection and steel sheets is modeled by using resistance equa-tion [14] with coefficient of friction μ of 0.46 [10]. Although,
Table 1 Levels of design variables and noise factors
Parameters Unit Levels 1, 2, 3
Design factors A mm 1 1.5 2
B mm 2 2.5 3
C mm 1 1.5 2
D mm 6 8 10
Noise factor E °C 0 15
F °C 0 30
G [W/(mm2 °C)] 15 × 10−6 60 × 10−6
C
D
nut body
projection (= leg)
Fig. 2 Representation of designvariables for square weld nut
Int J Adv Manuf Technol
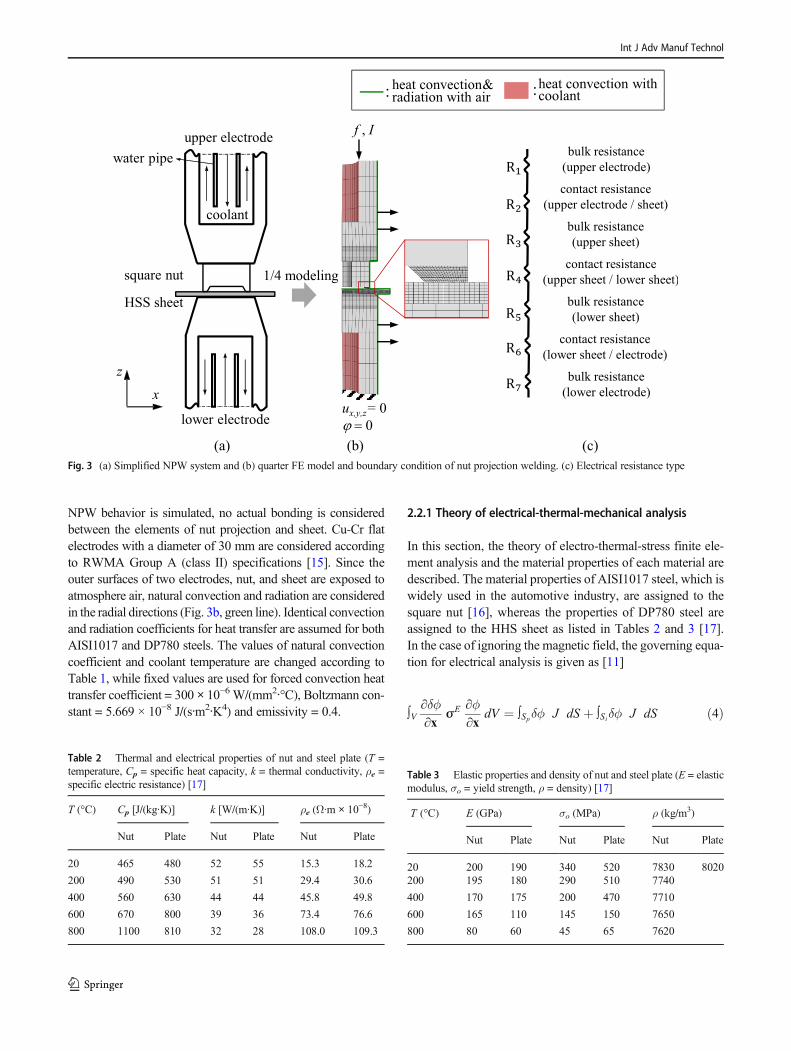
NPW behavior is simulated, no actual bonding is consideredbetween the elements of nut projection and sheet. Cu-Cr flatelectrodes with a diameter of 30 mm are considered accordingto RWMA Group A (class II) specifications [15]. Since theouter surfaces of two electrodes, nut, and sheet are exposed toatmosphere air, natural convection and radiation are consideredin the radial directions (Fig. 3b, green line). Identical convectionand radiation coefficients for heat transfer are assumed for bothAISI1017 and DP780 steels. The values of natural convectioncoefficient and coolant temperature are changed according toTable 1, while fixed values are used for forced convection heattransfer coefficient = 300 × 10−6 W/(mm2∙°C), Boltzmann con-stant = 5.669 × 10⁻⁸ J/(s∙m2∙K4) and emissivity = 0.4.
2.2.1 Theory of electrical-thermal-mechanical analysis
In this section, the theory of electro-thermal-stress finite ele-ment analysis and the material properties of each material aredescribed. The material properties of AISI1017 steel, which iswidely used in the automotive industry, are assigned to thesquare nut [16], whereas the properties of DP780 steel areassigned to the HHS sheet as listed in Tables 2 and 3 [17].In the case of ignoring the magnetic field, the governing equa-tion for electrical analysis is given as [11]
∫V∂δϕ∂x
σE ∂ϕ∂x
dV ¼ ∫Spδϕ J dS þ ∫Siδϕ J dS ð4Þ
Table 2 Thermal and electrical properties of nut and steel plate (T =temperature, Cp = specific heat capacity, k = thermal conductivity, ρe =specific electric resistance) [17]
T (°C) Cp [J/(kg·K)] k [W/(m·K)] ρe (Ω·m × 10−8)
Nut Plate Nut Plate Nut Plate
20 465 480 52 55 15.3 18.2
200 490 530 51 51 29.4 30.6
400 560 630 44 44 45.8 49.8
600 670 800 39 36 73.4 76.6
800 1100 810 32 28 108.0 109.3
Table 3 Elastic properties and density of nut and steel plate (E = elasticmodulus, σo = yield strength, ρ = density) [17]
T (°C) E (GPa) σo (MPa) ρ (kg/m3)
Nut Plate Nut Plate Nut Plate
20 200 190 340 520 7830 8020200 195 180 290 510 7740
400 170 175 200 470 7710
600 165 110 145 150 7650
800 80 60 45 65 7620
Fig. 3 (a) Simplified NPW system and (b) quarter FE model and boundary condition of nut projection welding. (c) Electrical resistance type
Int J Adv Manuf Technol

where φ is a function of electrical potential of (x, y, z, t) and Jis current density, x is position vector, and Sp is the surfacewhere the boundary conditions are given and Si is the surfacewhich can interact with the other bodies and V is volume. σE
is an electrical conductivity matrix consisting of the inverse ofthe specific electrical resistance ρe in Table 2 for bulkresistance. For modeling the contact-specific electrical resis-tance ρc, the equation proposed by Tsai et al. [14] is used asfollows
ρc Tð Þ ¼ ρc 20°Cð Þffiffiffiffiffiffiffiffiffiffiffiffiffiffiffiffiffiffiffiσo Tð Þ
σo 20°Cð Þ
sð5Þ
σo and T are the yield strength and applied temperature, re-spectively. A governing equation for thermal analysis is givenas follows
∫Vρ U̇ δT dV þ ∫V∂δT∂x
k∂T∂x
dV
¼ ∫VδT rdV þ ∫SpδT q dS þ ∫SiδT qc þ qr þ qecð ÞdS ð6Þ
where ρ is the density, U is the internal energy, k refers tothe function of thermal conductivity for temperatureconsisting of the thermal conductivity k in Table 2. q isthe heat flux per unit area; the subscripts c, r, and ec rep-resent conduction, radiation, and heat energy convertedfrom electricity. r represents the heat generated within thevolume. In resistance welding, heat generation by electri-cal resistance accounts for most of r. The amount of energyreleased as internal heat from electrical energy Pec is de-scribed by Joule’s law
r ¼ ηv Pec; Pec ¼ ∂ϕ∂x
σE ∂ϕ∂x
ð7Þ
where ηv is a factor for energy conversion from electricityto heat. In this study, ηv is set to 1, as same as the resistanceprojection welding model in Ha et al. [17].
During the welding process, the effect of kinematic hard-ening is very small and can be ignored. For this reason, thetypical isotropic hardening model is used in the FE modelconsidering the Von-Mises yield criterion.
F sð Þ ¼ f sð Þ−σ f ;i εt� �
¼ 0; f sð Þ ¼ffiffiffiffiffiffiffiffiffiffiffiffiffiffi3
2s : s
rð8Þ
Here, s is the deviatoric stress and σf,i (εt ) is the flow stressthat depends on nodal temperature of each element. σf,i (εt )can be calculated from data obtained from the tensile tests atvarious temperatures represented in Fig. 4.
3 Experimental methods
In this study, square nuts are welded on the surface ofmetal sheets through NPW experiments and then thestrengths of welded nuts are assessed based on weldstrength tests. Experimental observations are further com-pared with the FEA results to confirm the reliability of theFE model.
M6, M8, and M10 square nuts were welded on the surfaceof DP780 steel sheet fabricated via cold rolling process. As wefocus mainly around the welded region, thickness of steelsheet is considered as 1.2 mm by assuming negligible effectof sheet thickness on welding performance. The welding con-ditions were taken arbitrarily for making various setdownvalues as follows: pressing force f = 3~5 kN, welding currentI = 7~15 kA, welding time tw = 5~10 cycles. Care was taken toensure full contact between the upper electrode and nut. Thesqueeze and holding time were set to ts = 30 and th =15 cycles,respectively. The overall experimental setup is presented inFig. 5. The setdown (i.e., projection collapse height) is calcu-lated according to the Eq. (1) at the end of each experiment.The measured setdown is then compared with FEA data.Three specimens having three different setdown values are
Fig. 4 Stress-stress relationship depend on various temperatures for (a) AISI1017 and (b) DP780 material
Int J Adv Manuf Technol

prepared by applying different welding conditions under aslisted in Table 4. The weld strength of the welded specimenswith M8 square nuts is further assessed based on the weldstrength test to analyze the relationship between setdown Sand weld strength.
A photograph of experimental setup for weld strength testfixed on the Instron universal testing machine (3367) is givenin Fig. 5. The weld strength test specimens were prepared byscrewing a stud bold into the welded nut. A compressive loadwas then applied on the bold head with a displacement rate of0.6mm/min. During the test, the joints between nut and sheetbear all the tensile load. The applied compressive P is mea-sured by using Instron static load cell (cataglog # 2530−444,capacity ± 30 kN), which has accuracy less than ± 0.25% ofindicated force even at lower loads (< 20 N). The displace-ment δ is extracted from the inbuilt displacement encodersetup; typical load-displacement (P − δ) curve from the weldstrength is shown in Fig. 6. As the load P increases, displace-ment non-linearly increases until a first detachment of nut (atleast at one corner out of four welded corners) from the sheetoccurs at maximum load. Since the square weld nut is attachedat four corners by nut projection collapse, the load was ob-served to increase even after the maximum load due to loadbearing by the remaining welded corners. However, we con-sidered the maximum load Pmax as a measure of weld strengthbecause the welded part could not achieve the normal perfor-mance after the maximum load was applied.
4 Results and discussion
4.1 NPW simulations and experiments
Typical NPW process includes three steps, namely (i) squeeze,in which f reaches its maximum within 40% of squeeze time tsand then fmax is held until the end of NPW process, (ii) welding,in which I reaches its maximumwithin 10% of welding time tw,and then Imax is held until the end of welding step, (iii) holding,in which fmax is held without current flow for a period of th. Thevariation of f and I with welding cycles during nut projectionwelding process is schematically illustrated as shown in Fig. 7a.Each step time is denoted as squeeze time ts = 1 cycle (1 cycle ≡1/60 s), welding time tw = 10 cycles, and holding time th = 15cycles for Taguchi analysis based on the work of Ha et al. [17].The values of fmax= 5 kN and welding current Imax = 10 kA areemployed for Taguchi analysis based on FE analysis as ex-plained in Appendix 1. The distributions of equivalent stressσeq and temperature T during squeeze and welding stages arenumerically simulated as shown in Fig. 7b; σmax is the maxi-mum stress and Tm is the melting temperature of typical steels
Fig. 5 Experimental setup for nut projection welding (a) before and (b) during welding and (c) nut projection–welded specimen and cross-sectioned view
Fig. 6 Experimental setup and typical P − δ curve of weld strength test
Table 4 Welding conditions for the weld strength test specimens
Case fmax (kN) Imax (kA) tw (cycles)
1 3.0 10 10
2 3.0 10 7
3 3.0 8 10
Int J Adv Manuf Technol

(= 1500 °C). During squeeze, nut projections are mechanicallycollapsed (steps 1 to 3 in Fig. 7b) due to the applied force evenwithout current flow. In welding process, current flow increasesthe temperature, which exceeds Tm especially around the con-tact between nut projections and sheet (steps 4 to 6 in Fig. 7b);as a result, projections bond with the sheet by producing addi-tional collapse due to melting. A heat-affected zone (HAZ) canbe observed around portions of weld by thermal deformationsunder excessive current intensity or welding time. Therefore,appropriate welding conditions should be established accordingto the nut size.
An accurate verification of FEA can bemade by comparingthe welding temperature between experiments and simula-tions. Since the temperature at the weld zone rises above themelting temperature (approximately 1500 °C) exceeding themeasurement range of the conventional thermal imaging cam-era (− 20~150 °C), in situ measurement of welding tempera-ture is difficult with the available instruments. Therefore, thewelding temperatures are not compared in this study; instead,the constructed FE model is validated by comparing the sizesand shapes of HAZ and setdown values between experimentsand simulations. Table 5 compares the experimentally
Fig. 7 (a) Variation of pressing force andwelding current in nut projection welding process. (b) Distributions of equivalent stress and temperature duringsqueeze and welding stages
Table 5 Comparison of setdownvalues from FE analyses andexperiments (exp)
Nut type fmax (kN) Imax (kA) tw (cycles) S|exp (%) S|FEA (%) Error (%)
M8 3.0 15 5 79 70 11
M8 3.5 7 10 58 53 8
M8 4.0 10 10 74 76 3
M8 3.0 10 10 72 78 8
M8 3.0 10 7 51 54 6
M8 3.0 8 10 29 29 0
Int J Adv Manuf Technol

observed setdown values forM8 nut with those of numericallyobtained for the same welding conditions. A maximum errorbetween the experimental and numerical setdown values wasobtained as 11%. Generally, the increase of pressing force,current, and cycle time leads to high setdown values.Despite the error of 11%, the setdown value from FEA showssimilar tendencies as described above, implying that the con-structed FE model is reliable. Moreover, the FEA for shapeoptimization is performed by changing only nut leg shapevariables under the same welding conditions. Therefore, theerrors in changing welding conditions are not included in theTaguchi analysis. For S = 58%, a comparison of longest fusionzone width, which represents the size of melded duringwelding, between experiments and FEA (Fig. 8) gives maxi-mum error of 7.7%. In numerical analyses, the region wheregenerated temperature due to current exceeds melting temper-ature Tm is defined as fusion zone. Figure 9 shows the crosssection of weld zone in the specimens showing a setdown
value of 72% and 51% in Table 5. As the lower copperelectrode is cooled with coolant during welding, the tem-perature of contact surface between sheet and electrodedoes not rise during welding process. This phenomenoncauses the asymmetrical shape of HAZ. By performingNPW FE analysis with the same welding conditions, theweld zone was simulated as shown in Fig. 10 (crosssection). Comparison of Fig. 9 (experiments) and Fig.10 (FEA) shows a similar asymmetrical HAZ with asym-metrical distribution of temperature at the bottom of thespecimens. The fusion zone length of square nut is great-er than the fusion zone of sheet in the experimental re-sult. The above comparisons confirm the reliability of theFE models used in this study. Accordingly, it can beconcluded that the FE model for Taguchi analysis hashigh reliability. Consequently, the optimal nut shape de-rived based on the developed FE model is expected toexhibit a superior weld performance.
Fig. 8 Comparison of fusionzones between experiment andFE analysis
Fig. 9 Comparison of crosssection of weld specimens withsetdown (a) 72% and (b) 51%
Int J Adv Manuf Technol

Although both FEA and experiments give similar values ofsetdown and fusion zone width, NPW experiment has somepractical differences from FE modeling. For example, fusionpartially occurs near the nut hole in experiments, whereas itcan be only simulated around the nut projection (Fig. 8) due tothe simplified shape of square nut in the FEmodel. In addition, aprotruded surface (Fig. 8) can be observed on the top of squarenut due to concentrated current density from the upper electrode;similar behaviors are usually absent in numerical simulations.
Further NPW experiments are performed to understand therelationship between setdown and weld strength. Welded spec-imens with different setdowns are prepared by adjusting thewelding conditions as listed in Table 6, in which sectionsmarked by × indicate welding failure due to the separation ofnut and sheet after welding process. This parametric study
reveals that welding current and pressing force should be adjust-ed according to nut shape to ensure suitable nugget formation.Higher welding current (I max ≈ 15 kA) results in excessiveheating and expulsion near the projection, whereas lower current(I max ≈ 5 kA) results in insufficient heat generation and non-formation of nuggets (≈ fusion zone). For example, an applica-tion of Imax = 15 kA to M6 nut produces a complete projectioncollapse and partial thermal deformation in the nut body.
Weld strength tests are then performed with the preparedspecimens with welded square nut. Increasing Pmax withsetdown indicates that weld strength increases with setdown(Fig. 11). Formation of wider contact area between the sheetand the molten nut projections with setdown reduces the stressconcentration by distributing the external applied load aroundfusion zone. This confirms that the setdown can be used as acharacterizing parameter for assessing the welding perfor-mances of optimized square weld nut.
4.2 Investigating NPW based on Taguchi approach
The effects of design variables on the setdown S and time toreach 50% of setdown tset are analyzed by performing a
Fig. 10 Comparison of crosssection of FE results with setdown(a) 78% and (b) 54%
Table 6 Experimental conditions for obtaining various setdown in nutprojection welding
Nut type fmax (kN) Imax (kA) tw (cycles) S (%)
M6 4.0 15 5 100.0
M6 3.0 10 10 92.3
M6 3.5 10 7 92.3
M6 3.0 7 10 69.2
M8 3.0 15 5 78.9
M8 4.0 10 10 73.7
M8 3.5 10 7 57.9
M8 3.0 10 10 71.5
M8 3.0 10 7 51.1
M8 3.0 8 10 29.2
M8 4.0 7 7 ×
M8 4.5 7 5 ×
M10 4.5 15 10 83.3
M10 4.5 15 7 70.8
M10 4.5 10 10 66.7
M10 4.5 10 7 62.5
M10 5.0 7 10 58.3
M10 3.0 7 5 ×Fig. 11 Variation of maximum load of weld failure with setdown
Int J Adv Manuf Technol

minimum number of FE analyses; corresponding levels ofdesign variables and noise factors are designed by usingTaguchi method. The noise factor analysis shows that theeffect of noise factors E, F, and G on S and tset is negligibleas explained in Appendix 2. Therefore, further studies arefocused on investigating the effect of each main design vari-able on S and tset in the following sections.
4.2.1 Effect of each design variable on setdown S
In welding stage, the temperature of nut projection is related toprojection shape and the contact area. As the temperature in-creases, the resistance against projection collapse decreasesand, hence, setdown increases. In addition, the projection tem-perature is proportional to the nugget size [18]. Therefore,Taguchi analysis is performed for quantitative analysis ofthe relationship between the projection shape and setdown.Since the weld strength and setdown are positively correlated,a parameter study on setdown variation is performed to derivean optimal nut shape through FE analyses. The impact of eachdesign variable (A, B, C, D) on setdown S is analyzed basedon the calculated S/N ratio using Eq. (2) for each analysiscondition. S/N ratio response for each level of design variablesis presented in Table 7. Since, Taguchi method suggests that asmaller absolute value of S/N ratio gives a greater amount ofcollapse [12], a larger amount of setdown can be obtained forlower level of A and B and higher level of C and D. This canbe explained that an increase in levels of A and B results largerprojection volume and thus the pressing force per unit area ofprojection reduces. This eventually affects the projection col-lapse and reduces the setdown even for the same weldingcondition. These phenomena are consistent with the experi-mental observations of Lee [19]. On the other hand, the impactof C on setdown becomes insignificant from level 2, whereas
D hardly influences the setdown. Therefore, we conclude thatthe projection volume greatly influences the speed of nut pro-jection collapse until complete collapse; afterwards, fusionzone size increases without further projection collapse duringthe welding step.
4.2.2 Effect of each design variable on tset
Similarly, time to reach 50% of setdown tset can be a mainparameter affect to the NPW performances. In this section,we analyze the effect of each design variable (A, B, C, D) ontset by comparing S/N ratio calculated using Eq. (2). Since tset iscalculated from the start of electric current flow, the conditionsrelated to tset in the squeeze step are not considered in theTaguchi analysis. For tset, the response of S/N ratio for eachlevel of design variables is presented in Table 8. The resultssuggest that all design variables have significant impact (B:delta = 7.6, A: delta = 7.5, C: delta = 6.0, D: delta = 5.4) oninitial projection collapse time, and thus on tset. Therefore, thelevels of all four-design variables should be carefully consid-ered while designing a square nut. A shorter tset can beachieved with smaller absolute S/N ratio values as listed inTable 8. Accordingly, lower levels of A and B and higher levelof D are obtained as optimized values. As explained, the speedof projection collapse decreases for higher levels of A and Bdue to increase in projection volume for the same weldingconditions. C shows a positive correlation with tset up to acertain projection height and then reversal occurs for heightof 1.25~1.50 mm; for the current FE model, best welding per-formance is achieved with level 2 of C. In contrast, D is in-versely proportional with the speed of projection collapse.
4.3 Optimal shape of nut projection
It is important to ensure a strong bonding between nut andsheet through well-formed nugget by melting. Hence, al-though the Taguchi method provides optimum levels for de-sign variables, further FE analysis are performed to verify theformation of nugget process depending on the contact areabetween nut projection and sheet. The effects of various levelsof A and C are simulated as shown in Figs. 12 and 13, respec-tively. Figure 12 shows that an insufficient contact area be-tween nut projection-sheet leads to an insufficient area toreach melting temperature due to smaller projection volume.As a result, projection collapse is accelerated by the appliedpressing force instead of melting. This increases the contactarea too early and decreases the heat generation. Therefore,based on the response of S/N ratio (Table 7) and nugget for-mation analyses (Fig. 12), an optimal value for design variableA is suggested as 1.5 mm. On the other hand, quasi-identicalratio of projection height to nugget height is obtained for var-ious level of C (Fig. 13); an optimal design variable C (pro-jection height) is determined based on the response S/N ratio
Table 7 S/N ratioresponse of designvariables for setdown S
Level A B C D
1 38.6 38.7 37.9 38.0
2 38.2 38.0 38.3 38.3
3 37.8 37.9 38.4 38.3
Delta 0.8 0.8 0.4 0.3
Optimized levels are highlighted in bold
Table 8 S/N ratio response of design variables for tset
Level A B C D
1 − 21.4 − 20.9 − 29.1 − 28.9
2 − 23.7 − 24.5 − 23.1 − 24.1
3 − 28.9 − 28.5 − 24.3 − 23.3
Delta 7.5 7.6 6.0 5.4
Optimized levels are highlighted in bold
Int J Adv Manuf Technol

itself as 1.5 mm. The design variable D (hole diameter) has theoptimal level of level 3 (M10) based on the results of Taguchianalysis in Section 4.2.
However, design variable D can be excluded in order tofind the optimal projection shape for each hole diameter as thenut diameter is determined by the shape of the fasteners andrequired specification. The optimal square nut design vari-ables derived using both Taguchi method and FEA are com-pared with that of standard M10 specifications of DIN 928 inTable 9; consequently, the proposed optimal values are
verified. The comparison reveals that the two nut shapes arequasi-identical, and the error can be reduced by narrowing theintervals between levels for each design variable in Taguchimethod. Even for nut complex shapes, we believe that theproposed approach can be used to obtain optimal design var-iables that maximize the weld performance of NPW.
The welding performance of two nut shapes (optimal shapedrives in this study and standard nut shape) was compared forthe welding conditions of f = 5 kN, I = 10 kA, and tcyl = 10cycles via FEA. Table 10 compares the setdown and tset values
Fig. 12 Nugget formation forvarious levels of design variableA. (a) 1.0, (b) 1.5, (c) 2.0, (d) 2.5mm
Fig. 13 Nugget formation for various levels of design variable C. (a) 1.00, (b) 1.25, (c) 1.50, (d) 1.75, (e) 2.00 mm
Int J Adv Manuf Technol

for the two nut shapes. The comparison shows that the differ-ences between the setdown and tset are 6% and 9%, respec-tively, indicating that the proposed optimization process isreliable.
5 Conclusion
Weprovided an optimized design process for obtaining designvariables of square nut to ensure better welding performancesin nut projection welding (NPW). Based on the investigationswith Taguchi method and finite element analysis (FEA), thefollowing results were derived:
1. Amaximum error of 12% in setdown values was obtainedbetween experimental and numerical simulations.Accordingly, the reliability of FE model for simulatingNPW was demonstrated.
2. Insufficient contact area between nut projection-sheetmakes it difficult to reach melting temperature due tosmaller projection volume. As a result, projection collapsewas accelerated by the applied pressing force instead ofmelting, and the nugget size was reduced.
3. The projection shape obtained using the Taguchi methodis almost identical to standard M10 square nut. In addi-tion, welding FE analysis was performed for the derivedoptimal shape to compare welding performance with theDIN 928 standard nut shape. As a result, the difference ofsetdown and tset value showed 6% and 9% errors, respec-tively, indicating that the proposed optimization process isreliable.
Appendix 1. Welding conditions for Taguchimethod
FE analyses are performed by modeling square nut in accor-dance with the DIN928 standard [20]. The pressing force f = 5kN is applied as per the standard. A robust weld strength canbe ensured only when the nugget is sufficiently formed onboth the nut and steel sheet. Each experiment requires cross-sectional cutting of the nut-steel contact area to explore thenugget formation. This process is constrained by time and costlimitations. To address this problem, we perform several FEanalyses to evaluate the depth of fusion into sheet under dif-ferent current intensity (Fig. 14). At low electrode currentdensities, i.e., I = 5 and 7 kA, the nugget was formed onlyon the surface of the sheet, failing to penetrate the sheet,reducing the weld strength. This analysis is consistent withthe results of most studies on nut projection welding with I= 10 kA or higher. Therefore, FE analyses are performed witha fixed current of I = 10 kA in this study.
Table 9 Comparison of optimal design variable of square weld nut withstandard M10 nut
Design parameters Geometry (mm) Gap (mm)
DIN928 (standard) Taguchi
A 1.3 1.5 0.2
B 2.2 (±0.1) 2.0 0.3
C 1.2 (±0.1) 1.5 0.3
Table 10 Comparison of objective function from FEA using optimalnut shape and DIN928 standard nut shape
Objective function Nut shapes Gap (%)
DIN928 (standard) Taguchi
Setdown (%) 84.3 79.2 6
tset (ms) 6.5 7.1 9 Fig. 14 Cross-sectioned nugget shape for current I = (a) 5 kA, (b) 7 kA,(c) 10 kA
Int J Adv Manuf Technol

Appendix 2. Effect of noise factor on S and tset
Tables 11 and 12 show FEA results of S and tset, respectively,for various conditions according to Table 1. Zero values of tsetfor run #1 in Table 11 indicate that the projection collapse bypressing force exceeds 50% without current flow. To analyzethe effect of noise factor, level average analyses are performedby following the equation as shown in Table 13. The levelaverage value ui is calculated as follows
ui ¼∑n
j z jn
ðA1Þ
where z j is the mean value of either tset or S for eachjth noise factor combination. i means the level of eachnoise factor and n is the total number of simulations foreach level. The zero value of delta for each noise factordemonstrates negligible effect of noise factors E, F, andG on S and tset. This is because heat losses due toconvection and conduction can be ignored since nutprojection welding is performed within few millisecondsof the welding process, which is identical to that ofresistance welding.
Table 11 Values of setdown S according to various levels of design variables (in %)
E 1 1 1 1 2 2 2 2F 1 1 2 2 1 1 2 2
Run A B C D G 1 2 1 2 1 2 1 2 Mean
1 1 1 1 1 86.0 86.0 86.0 86.0 86.0 86.0 86.0 86.0 86.0
2 1 2 2 2 86.7 86.7 86.7 86.7 86.7 86.7 86.7 86.7 86.7
3 1 3 3 3 84.1 84.1 84.1 84.1 84.1 84.1 84.1 84.1 84.1
4 2 1 2 3 87.5 87.5 87.5 87.5 87.5 87.5 87.5 87.5 87.5
5 2 2 3 1 79.5 79.5 79.5 79.5 79.5 79.5 79.5 79.5 79.5
6 2 3 1 2 76.1 76.1 76.1 76.1 76.1 76.1 76.1 76.1 76.1
7 3 1 3 2 85.2 85.2 85.2 85.2 85.2 85.2 85.2 85.2 85.2
8 3 2 1 3 74.9 74.9 74.9 74.9 74.9 74.9 74.9 74.9 74.9
9 3 3 2 1 74.3 74.3 74.3 74.3 74.3 74.3 74.3 74.3 74.3
Mean 81.6 81.6 81.6 81.6 81.6 81.6 81.6 81.6
Table 12 Values of tset according to various levels of design variables (in ms)
E 1 1 1 1 2 2 2 2F 1 1 2 2 1 1 2 2
Run A B C D G 1 2 1 2 1 2 1 2 Mean
1 1 1 1 1 0.0 0.0 0.0 0.0 0.0 0.0 0.0 0.0 0.0
2 1 2 2 2 9.0 9.0 9.0 9.0 9.0 9.0 9.0 9.0 9.0
3 1 3 3 3 15.2 15.2 15.2 15.2 15.2 15.2 15.2 15.2 15.2
4 2 1 2 3 7.4 7.4 7.4 7.4 7.4 7.4 7.4 7.4 7.4
5 2 2 3 1 17.5 17.5 17.5 17.5 17.5 17.5 17.5 17.5 17.5
6 2 3 1 2 27.4 27.4 27.4 27.4 27.4 27.4 27.4 27.4 27.4
7 3 1 3 2 16.6 16.6 16.6 16.6 16.6 16.6 16.6 16.6 16.6
8 3 2 1 3 29.7 29.7 29.7 29.7 29.7 29.7 29.7 29.7 29.4
9 3 3 2 1 44.4 44.4 44.4 44.4 44.4 44.4 44.4 44.4 44.4
Mean 18.6 18.6 18.6 18.6 18.6 18.6 18.6 18.6
Int J Adv Manuf Technol
Data and materials availability The authors confirm that the datasupporting the findings of this study are available within the article.
Code availability Not applicable
Author contributions Giyeol Han: conceptualization, methodology, fi-nite element analysis, writing—review and editing
Sangun Ha: experiments, data curationKaruppasamy Pandian Marimuthu: investigationSiva Prasad Murugan: experimentsYeongdo Park: project administrationHyungyil Lee: supervision
Funding This work was supported by the Sogang University researchfund (No. 201919049.01) and the Carbon Industrial ClusterDevelopment Program (No. 10083609) funded by the Ministry ofTrade, Industry, & Energy (MOTIE, Korea).
Declarations
Conflict of interest The authors declare no conflict of interest.
References
1. Lasson JK, Bengtsson L (2007) The overlooked joining technologyof fasteners for modern car body structure-latest experience fromnut and bolt attachment to advanced high strength steels, 11thEuropean Automotive Engineers’ Council (EAEC), Budapest,Hungary
2. Adams JV, Matthews GN, Begeman ML (1965) Effect of projec-tion geometry upon weld quality and strength. Welding Journal 44:466–470
3. Cunningham AJR, BegemanML (1996) Effect of projection heightupon weld quality and strength. Welding Journal 45:26–30
4. Sun X (2001) Effect of projection height on projection collapse andnugget formation − a finite element study. Welding Journal 80:211–216
5. Harris JF, Riley JJ (1961) Projectionwelding low carbon steel usingembossed projects. Welding Journal 40:363–376
6. Lee H, Kim N, Lee TS (2005) Overload failure curve and fatiguebehavior of spot-welded specimens. Engineering FractureMechanics 72:1203–1221
7. Tolf E, Hedegård J (2007) Resistance nut welding: improving theweldability and joint properties of ultra-high strength steels.Welding in the World 51:28–36
8. Ringsberg JW, Orvegren P, Henrysson HF, Åkerström G (2008)Sheet metal fatigue near nuts welded to thin sheet structures.International Journal of Fatigue 30:877–887
9. Linden MJ (2010) Optimization of weld nut geometry by simula-tion, Master Thesis, KTH Royal Institute of Technology,Stockholm, Sweden
10. Nielsen CV, ZhangW, Martins PAF, Bay N (2014) Numerical andexperimental analysis of resistance projection welding of squarenuts to sheets. Procedia Engineering 81:2141–2146
11. Abaqus Version 6.14 User’s manual, 2013, Dassault SystemsSimulia Corp., Providence, RI, USA
12. Peace GS (1992) Taguchi methods: a hands-on approach. Addison-Wesley, Reading, MA
13. Nielsen CV, Zhang W, Martins PAF, Bay N (2015) 3D numericalsimulation of projection welding of square nuts to sheets. Journal ofMaterials Processing Technology 215:171–180
14. Tsai CL, DaiWL, Dickinson DW, Papritan JC (1991) Analysis anddevelopment of real-time control methodology in resistance spotwelding. Welding Journal 70:339–351
15. Resistance Welder Manufacturers’ Association (2003) Resistancewelding manual. RWMA, Philadelphia
16. Park YW, Son CS (2013) Weldability evaluation and process opti-mization of nut projection welding, Conference Proceedings of TheKorean Society of Manufacturing Technology Engineers, p 262
17. Ha S, Murugan SP, Marimuthu KP, Park Y, Lee H (2019)Estimation of lobe curve with material strength in resistance pro-jection welding. Journal of Materials Processing Technology 263:101–111
18. Zhang H, Senkara J (2011) Resistance welding : fundamentals andapplications. CRC press
19. Lee SY (2016) A study on improvement of nut shape for qualityimprovement in ultra high strength steel nut projection welding,Master Thesis, Pukyong University
20. Anon, DIN928-square weld nuts, 2013, Deutsches Institut FurNormung (German National Standard)
Publisher’s note Springer Nature remains neutral with regard to jurisdic-tional claims in published maps and institutional affiliations.
Table 13 Level averageanalysis results for noisefactors
Level E F G
S (%) 1 81.6 81.6 81.6
2 81.6 81.6 81.6
tset (ms) 1 18.6 18.6 18.6
2 18.6 18.6 18.6
Delta 0.0 0.0 0.0
Int J Adv Manuf Technol