Embed Size (px)
Citation preview

STAKE-HOLDER ASSET-BASED PLANNING ENVIRONMENT
DOD/OSD 2007 STTR TOPIC 003 Final Technical Report
LOGOS TECHNOLOGIES, INC&
CORNELL UNIVERSITYDEPARTMENT OF NATURAL RESOURCES
INITIATIVE FOR CIVIC ECOLOGY&
INTERNATIONAL SUSTAINABLE SYSTEMS, INC.
MAY 2, 2008
PROPRIETARY INFORMATIONUse or disclosure of data on this page is subject to restrictions

The Office of the Secretary Of Defense (OSD)1 issued a Request for Proposals for development of a systems architecture for operational commanders that incorporates participatory and asset-based community development methodologies for urban areas in support of national/strategic objectives, nicknamed “SHAPE,” which stands for Stake-holder Asset Based Planning Environment. The summary of the RFP reads as follows:
The mission of DoD in the Global War on Terror has gone far beyond the traditional warfighting role. The DoD mission areas within Stability Security Transition and Reconstruction (SSTR)2 requires both strategic and operational understanding of all of the factors that influence the actions of friendly and neutral populations in the area of operations. The community development strategists and theorists have advanced methodologies incorporating the “principle that a community can be built only by focusing on the strengths and capacities of the citizens and associations that call the community home.” These methodologies could be applied to situations in partner nations of interest to the US government. The asset-based analysis identifies existing resources and assets, indigenous desires and perceptions, enablers – including individuals who can serve in a catalytic role, existing positive feedback loops and opportunities for future positive feedback loops, and measures of the intended target environment’s receptiveness to assistance. Assets are broadly defined and multidimensional, and include financial, human, physical (both man-made and natural), social and political assets. The methodology is inherently participatory and seeks to help communities identify and leverage local assets to create jobs, social capabilities and structures, and sustainable economic markets appropriate for the local environment. Rural areas are the focus of most of the development techniques; however, the move to urban areas in recent history is well documented. The responders will investigate the viability of asset-based development methodologies, translate the salient features to urban environments, design and develop a system architecture that embraces the principles by identifying interacting component software modules, investigate display attributes and data structures, and create a demonstration capability for local applications.
LOGOS Technologies located in the Washington, D.C. area was awarded a Phase 1 contract to develop these ideas, and contracted IS23 and Cornell University’s Civic Ecology Initiative to assist in this work. This report was generated under Logos Technologies Inc. prime contract # W9132T-07-C-0032.
Authors: Keith G. Tidball Cornell UniversityElon D. Weinstein International Sustainable Systems, Inc.Stephen Kaisler Logos Technologies
1 Office Of The Secretary Of Defense (OSD), Deputy Director Of Defense Research & Engineering, Deputy Under Secretary Of Defense (Science & Technology), Small Business Technology Transfer Research (STTR), FY 2007 Program Description. OSD07-T003: Development of Systems Architecture for Stake-Holder Asset-based Planning Environment2 http://www.dtic.mil/whs/directives/corres/html/300005.htm3 http://www.internationalsustainablesystems.com/
PROPRIETARY INFORMATIONUse or disclosure of data on this page is subject to restrictions

Robert Grossman-Vermaas Logos TechnologiesScott Tousley Logos Technologies
TABLE OF CONTENTS
1. Introduction............................................................................................................................42.1 Background....................................................................................................................112.2 Objectives......................................................................................................................132.3 Asset/Participatory Analysis..........................................................................................18
2.3.1 Asset-Based Participatory Assessment...................................................................182.3.2 Participatory Planning............................................................................................20
2.4 Classic Planning.............................................................................................................202.5 Dynamic Planning.........................................................................................................222.6 Planning Completion.....................................................................................................25
3. SHAPE Phase 1 Literature Review.....................................................................................273.1 Background....................................................................................................................27
3.1.1 Complexity and Wicked Problem...........................................................................283.1.2 Morphological Analysis of “Wicked Problems”....................................................313.1.2 Social Complexity in “Wicked Problems”.............................................................32
3.2 Participatory Planning and Assessment.........................................................................333.3 Dynamic Adaptive Systems and Resilience..................................................................35
3.3.1 The Adaptive Cycle................................................................................................393.3.2 Panarchies...............................................................................................................403.3.3 The Adaptive Cycle Metaphor................................................................................413.3.4 Feedback Loops......................................................................................................423.3.5 Measuring Resilience..............................................................................................43
3.4 Systems and Ecology- Why consider the biophysical domain?....................................453.4.1 Social-Ecological Systems......................................................................................453.4.2 Urban Ecology, Urban Conflict..............................................................................46
3.5 Conclusions....................................................................................................................504. SHAPE Software Architecture............................................................................................51
4.1 SHAPE System Architecture.........................................................................................514.2 Technical Challenges.....................................................................................................53
4.2.1 Asynchronous Collaboration Support.....................................................................534.2.2 Situation Assessment..............................................................................................554.2.3 Strategy and Objectives Generation.......................................................................554.2.4 Ontology Foundation..............................................................................................584.2.5 Planning..................................................................................................................594.2.6 Plan Assessment.....................................................................................................62
4.3 SHAPE Functional Tools..............................................................................................634.3.1 Workflow Manager.................................................................................................644.3.2 Collaboration Support Tools...................................................................................654.3.3 Situation Assessment Tool.....................................................................................674.3.4 Strategy and Objectives Analysis Tool...................................................................68
PROPRIETARY INFORMATIONUse or disclosure of data on this page is subject to restrictions

4.3.5 Asset Specification Tool(s).....................................................................................694.3.6 Plan Generation Tool..............................................................................................704.3.7 Plan Assessment Tool.............................................................................................80
4.4 SHAPE Software Architecture......................................................................................814.4.1 SCHOLAR Application Framework......................................................................824.4.2 Web-enabled User Interface...................................................................................834.4.3 Rule Based System.................................................................................................844.4.4 Java JDK/JRE.........................................................................................................864.4.5 MySQL Data Base Management System...............................................................874.4.6 Visualization Tools.................................................................................................874.4.7 Microsoft Windows XP..........................................................................................884.4.8 Software Development Environment.....................................................................884.4.9 Ontology Development...........................................................................................90
4.10 Next Steps....................................................................................................................935. Experiment Design For SHAPE..........................................................................................94
5.1 Summary........................................................................................................................945.2 Experimentation.............................................................................................................945.3 Aim................................................................................................................................965.4 Objectives......................................................................................................................965.5 CRITICAL OPERATING ISSUES (COIs) And ANALYSIS......................................975.6 Design & Hypothesis.....................................................................................................975.7 Experimental Environment And Procedure...................................................................985.8 Experiment Design Assessment..................................................................................100
6. Conclusion.........................................................................................................................101ANNEX 1: : SHAPE LOE Risk Evaluation Matrix................................................................103ANNEX 2: References.........................................................................................................105
PROPRIETARY INFORMATIONUse or disclosure of data on this page is subject to restrictions

1. IntroductionStability, Security, Transition, and Reconstruction (SSTR) operations present an almost unimaginable complexity to planners and implementers alike. The complexities are both intellectual and material. One of the challenges is that truly sustainable solutions must be derived locally (internally) and not by foreigners (externally). The basic planning principle that the Logos Team has developed is that planners must include locals in the planning and assessment process, and build their solutions based predominately on local assets. Therefore, within Phase 1 of this STTR, the Logos Team has developed an innovative, actionable ‘Stakeholder Asset Based Planning Environment’ (SHAPE) architecture that encapsulates ‘stakeholder, asset-based’ principles as identified in the literature within a dynamic, iterative planning process and software suite. This Final Report constitutes and details this architecture in three complimentary themes: 1) concept (process) and 2) implementation (software architecture); 3) experimentation.
A number of factors contribute to the complex challenges of SSTR theatres. First, SSTR theatres are not single systems, but are comprised of many multiple nested systems composed of both social and physical elements. These systems range from societal structures and hierarchies, to formal institutions, to the bio-ecological environment that all these things exist within, and they encompass all sectors.
One result of the ‘nesting’ of many systems within a SSTR theatre is that changes within one system produce consequences for another, and sometimes every other system. The SSTR planner thus encounters the first fundamental difficulty in his and her quest to indentify a solution set: the apparent interconnectedness of all parts in the SSTR theatre. The second fundamental difficulty is that there is no problem center. Because of the deep interconnectedness – a poor security situation affects food production, which in turn undermines the livelihood of traditional farmers, which results in the breakdown of traditional social structures which further endangers the security situation, and so on – planners do not have the liberty to focus on only one ‘sector,’ such as agriculture, or security institutions if they hope to have a meaningful impact. Furthermore, because of these complexities, only ‘locals’ can readily navigate the SSTR landscape. Planners are literally foreigners to the environment they are asked to understand.
The ‘foreignness’ of specific SSTR environments to Washington and others’ donors’ capitals would seem to dictate the necessity of participatory approaches with locals in-theatre. Unfortunately current planning approaches to SSTR theatres rarely fully account for in-theatre assets, the range of stakeholders and the various relationships between them. Direct engagement with locals is often after-the-fact, leaving implementers to hope they will be well received. As a result SSTR plans do not accurately reflect the real “whole system” so SSTR operations rarely result in self-sustaining end states. Furthermore, linear externally-focused planning often leaves tactical field level implementation disconnected from strategic aims,
PROPRIETARY INFORMATIONUse or disclosure of data on this page is subject to restrictions

despite the apparent natural flow from the strategic through the operational to the tactical. In real terms, this means that implementers will do things in ways that might, for example, appear to fulfill operational objectives, but make the local population so angry that strategic aims are actually set backwards.
Urbanism
Add to these problems the urbanization of the World, and particularly the “Developing World.” In 2000 the National Intelligence Council predicted that by 2015 urbanization issues will emerge out of the broader trends as a component of major drivers and trends that will shape the world. The rapidly accelerating demographic shift of populations to urban areas magnifies the SSTR planners’ challenges for a myriad of reasons. First, there is an unusual diversity of systems in dense urban environments. Many “systems” (such as bio-physical, social, governmental, economic, etc.) of different scales exist simultaneously in the same place, overlap and ‘feedback’ to each other such that changes in one system result in changes in another system. Scholars call this “Panarchy,” and “Panarchy” is at its most complex in areas of high density like cities. Secondly, events in dense urban areas happen fast because high population densities and close proximities speed the transmission of feedback, increasing dynamism and reducing the available time to respond to phenomenon like riots, market crashes, or natural disasters. In urban environments demands on local understanding and anticipation are at their highest. Thirdly, in cities societal and physical feedback mechanisms are at their most complex because the high density of socio-economic systems (“Panarchy”) result in the highly diverse flows of information, or feedback. Fourthly, urban environments produce a unique set of collisions between social and bio-physical systems that are forced to interact in ways that don’t happen anywhere else but in cities.
These complexities make the planning challenges difficult, but not impossible. In March 2007, faced with these challenges in their own work, former State Department Planner, Elon Weinstein and scholar and experienced development implementer Keith Tidball, both members of this STTR design team, published a notional planning methodology aimed at addressing these and other challenges inherent in planning for SSTR operations and the post-conflict development periods that follow. Two important basis of their methodology, termed “Environment Shaping,” emerged. First, that unless assistance and donor actions align with the receptiveness of a given SSTR or development environment, donors and interveners’ best intentions will be rejected by the SSTR ‘system,’ much as the human body rejects foreign bodies; and secondly, that nations cannot be built with what they do not have. “Environment Shaping” sought the alignment of security and development assistance and actions, and the receiving theatre by focusing on: the relationship between people and their surroundings (collectively termed the “landscape” by World Wildlife Federation program implementers); local ‘assets’ and opportunities rather than on just ‘gaps’ and ‘needs’; and reducing destructive frictions and facilitating key enablers to positive and sustainable growth and development.
PROPRIETARY INFORMATIONUse or disclosure of data on this page is subject to restrictions

Building on this important work, this STTR product extrapolates four “big ideas” inherent in “Environment Shaping,” and from those ideas takes the “Environment Shaping” methodology several steps farther by both describing in detail all of its important components and adding a few more, but also by describing the operational processes required to actually use the methodology when planning for a real deployment to an SSTR theatre. The four “big ideas” are:
· Wicked Problems· Resilience· Socio-Ecosystem Perspective· Asset-based Participatory Assessment and Planning
Though the literature review in section 3 describes each of these “big ideas” in detail, below is an introduction to the concept relevant to SSTR planning in each:
Wicked Problems
Scholars characterize “Wicked Problems” in greater and lesser detail, but four attributes stand out when planning for SSTR operations:
No Problem Center
Because SSTR environments are composed of many interrelated systems within systems, action against, or change within one system produces results – intended or unintended – in other systems. This phenomenon can result in a classic “Catch-22” in which attempts to solve a problem in one system generates more problems in others systems. For example a necessary crackdown on the security situation may create population flows, stifle economic activity, or have negative natural resource consequences.
Stake-Holders Have Different Views
One of the most important principles of developing sustainable solutions for SSTR is that those solutions must be based in the desires, proclivities and capacities of the stakeholder themselves. Unfortunately “stakeholders” are never a monolithic group, but are instead composed of many different groups, often with entirely contrary aims. Often, the very competition between local stakeholders over differing aims is what led to the SSTR to begin with. The problem worsens when “stakeholder” is expanded to include the broader donor community, international organization, or countries neighboring an SSTR theatre.
Resources and Constraints Change Over Time
SSTR theatres are not static places, nor are the institutions behind the operations themselves. Whether the physical, social, and political landscape within the theatre itself or in the capitals of contributors to an SSTR operation, the operating environment is constantly changing.
PROPRIETARY INFORMATIONUse or disclosure of data on this page is subject to restrictions

Planners must therefore plan for change, an important principle of the methodologies and processes presented here.
Resists Efforts to be Changed by Command
Due both to the complexity of the systems-within-systems “Panarchy” that characterizes SSTR theatres, and to the self-emergent nature of many of these systems, the entire theatre likely tends strongly towards a certain set of conditions. Because the factors that lead to those conditions are “systemic,” the SSTR theatre will be resistant to induced change towards another set of conditions.
Resilience
A commonplace objective of security and reconstruction operations (S&RO) is “stability,” by which is usually meant a lack of violence. The problem with using “stability” as an objective, is that while “stability” speaks to a condition, in this case the lack of tumult at a given time, it does not effectively describe the capacity of a given system to remain “stable” in the face of internal or external shocks and trauma such as catalyzing political events (e.g. an election or assassination), natural calamity (e.g. flood, famine, earthquake), shifts in demographics (e.g. mass return of refugees, or the loss of a significant percentage of men to conflict, or mass death due to disease) or other “destabilizing” events or pressures. We find that instead, because it describes the nature of a system itself rather than just its condition at a certain period of time, the concept of resilience is a more useful one for planners. Three of the primary characteristics of Resilience are:
A resilient system can change and adapt to shifting conditions, but still maintain control of functions and structure.
In other words a place’s organizations (social and governmental) remain identifiable and it continues to function effectively, or maybe even better than before, even though changing conditions or traumatizing events force adaptation.
A resilient system is capable of self-organization.
The seeming self-emergence of social, economic, and self-managing institutions is a characteristic of resilient communities. In resilient communities new businesses and markets grow, community groups like local boards and PTA’s meet often and engage themselves actively in local issues, and individuals emphasize education or urban greening, all without any or much government or others prompting or coercion.
A resilient system learns and adapts to changing conditions and pressures.
PROPRIETARY INFORMATIONUse or disclosure of data on this page is subject to restrictions

Rather than break under the strain of changing internal conditions or external demands, a resilient system “learns” and alters itself as conditions demand. The most resilient systems improve their ability to learn and adapt each time they must do so.
Socio-Ecosystem Perspective
The nature of the SSTR theatre is why the problems planners face for these theatres are so ‘wicked.’ Three simple characteristics of the Socio-Ecosystem Perspective are highlighted here.
Every ‘Node’ in the System Impacts Every Other One
As described above in the ‘Wicked Problems’ section, SSTR planners must realize that everything they plan to do will have some impact, however large or small, on everything else in the theatre. These impacts will not always be either predictable or desirable.
Information and Resources Flow Between All Parts
The explanation for why every node in a system impacts every other node is because information and resources flow freely within and from system to system. For example, foreign investors watch events closely in a given theatre and their decision to invest will be influenced by how successful the SSTR operation is. Successful military operations in one part of the theatre may make political success for a key local partner impossible in another part of the country or region. Or resources and political capital built in legitimate economic and political spheres may fuel less desirable activities – Hamas’ rise to power in the Middle East is a perfect example of how different domains ‘communicate.’
High Levels of Diversity in All Categories
Though outsiders have a tendency to oversimplify situations they don’t fully understand, and planners must simplify complexity in order to structure manageable plans of action, assuming that any part of an SSTR theatre is monolithic invites failed attempts to solve the myriad of difficult problems. In fact, one of the reasons that the problems SSTR planners face are so difficult and complex to begin with is precisely because the theatres and all the systems within it are so diverse internally.
Asset-Based Participatory Assessment and Planning
One of the principles derived naturally from the ‘big ideas’ listed above is that truly sustainable solutions must be derived locally (internally) and not by foreigners (externally). The basic planning principle that follows is that planners must include locals in the planning and assessment process, and build their solutions based predominately on local assets.
PROPRIETARY INFORMATIONUse or disclosure of data on this page is subject to restrictions

Traditionally development, security, and military professionals view SSTR theatres in terms that focus on ‘gaps’ and ‘needs’ rather than highlighting what is actually available within a theatre to work with. The consequence of the traditional perspective is that it tends to lead to the introduction of resources and other assistance that produce unsustainable and sometimes even destructive results. The mass introduction of used clothing from the West into the Southern African region in the 1980’s severely undermined the local textile industry there, for example. An asset-based participatory approach to both assessment and planning:
- Emphasizes the identification of assets- More completely identifies constraints- Enables identification of the solution set most likely to succeed with minimal
‘trial and error’- Seeks the ‘first-person’ perspective
The architecture that flows from these ideas, therefore, focuses on facilitating a process that reaches deeply into the communities and the places that assistance aims to transform. The
components of that multi-iterative process appear in the graphic below.
First, in the “Background” preparation for planning, existing and prior assessments are gathered and ‘tailored’ so as to describe the SSTR theatre in systems and ‘resilience’ terms for the following steps.
Secondly, objectives that are already given, such as strategic objectives found in published national security strategy documents or those issued by senior leadership in Principals’ or Deputies’ Committee (PC or DC) or Policy Coordinating Committee (PCC) meetings, are compiled and documented along with given operational-level objectives. Based on these existing objectives and the descriptors of the theatre in ‘resilience’ terms, a new set of objectives are established that relate directly to achieving a resilient SSTR theatre, while meeting the more static given objectives.
PROPRIETARY INFORMATIONUse or disclosure of data on this page is subject to restrictions

Thirdly, an asset-based participatory assessment process engages the local population to create asset- and opportunity-based item generation, identify possible lines of action, and key enablers, socio-eco feedback loops and “catalyzers.” In the fourth step, these inputs are brought to the “classic” planning methods that the interagency is expected to employ, with or without SHAPE, such as the sequencing and task mapping from the S/CRS Planning Framework. In the fifth step, “dynamic” planning components are brought to bear on the “classic” approaches, using critical path analysis to identify key dependencies and enablers, enhance existing desirable feedback loops and catalyze new ones where possible, and seek to introduce or enhance resilience characteristics, all yielding a number of potential plans of action for the second ‘participatory’ stage. Whereas before “participation” was used to gather information with which to plan, this second iteration of participation is designed to test the waters of a few potential plans of action before they are actually implemented. Charrettes are one proven method of engaging in such a “members’ check.” This iterative “members’ check” is critical to matching assistance and plans of action to the SSTR environment itself – that match is a fundamental precept upon which this proposal is based.
Finally, after numerous iterations of this process to adapt to what new is learned about the SSTR theater at each step, implementation plans can be allocated for and acted against, and outcome metrics tailored and collected against. Of course the basis of this process is that the SSTR theatre never stops changing, and so the plan must continuously adapt through continued iterations of these steps as implementation of the chosen plans of action unfold.
PROPRIETARY INFORMATIONUse or disclosure of data on this page is subject to restrictions
2. The Shape Architecture
2.1 Background
Gather what is already available: Prior/Existing Assessments
The Stake-Holder Asset Based Planning Environment process begins by consolidating as much information through existing assessments as possible. By the time planning for an SSTR begins many others have usually been long-engaged in collecting information and trying to understand the planners’ theatre. Some have been in theatre for many years and understand the place and the people well. In many cases elements of the interagency itself and international partners have had active programs in a theatre for some time, and will consequently have conducted assessments and analysis. In some cases tools have been applied to the assessment process, such as the “Interagency Conflict Assessment Framework” (ICAF), one of USAID’s several conflict “toolkits” (see http://www.usaid.gov/our_work/cross-cutting_programs/conflict/ ). The World Bank, IMF, the United Nations and the major donor nations’ respective development agencies such as GTZ (Germany) and DFID (U.K.) all have assessment processes of varying levels of sophistication. Similarly NGO’s such as the International Crisis Group (see ICG:
PROPRIETARY INFORMATIONUse or disclosure of data on this page is subject to restrictions

www.crisisgroup.org) regularly publish mildly predictive assessments that include general policy recommendations. Intelligence agencies such as the Central Intelligence Agency (CIA), Defense Intelligence Agency (DIA), and State Department Bureau of Intelligence and Research (INR) monitor and document situations in almost every corner of the world, particularly those areas where there is an expectation that significant national resources might be called upon for deployment or assistance. In many cases firms like Charney Inc. have conducted surveys and polls whose data may be public or available for purchase. The National Security Agency (NSA), National Oceanic and Atmospheric Administration (NOAA), U.S. Department of Agriculture Foreign Agriculture Service (FAS), and the Smithsonian, as well as a number of commercial services may have Geographic Information Services (GIS) data and satellite or aerial imagery. From the universe of existing information a fairly detailed picture of the theater can be painted, including history, demography and ethnography, key players and some element of their motivations and relationships, external players and their interests, and some sense of the layout and condition of the bio-physical place where all this happening.
Morphological Analysis: Simplifying the Overwhelming
The amount of information available on a given theatre may be overwhelming to the planner. Though consolidation and organization of this data may be tedious and time consuming, prioritizing the data may not be self-evident prior to the planning process that follows. The difficulty is that any human planning process, particularly one forced to work at reasonably fast pace in response to unfolding events, cannot process all the information at once, and nor should they – not every piece of information merits attention. Invented in the late sixties by Fritz Zwicky at the California Institute of Technology, General Morphological Analysis is designed to cull out the limited set of relationships between non-quantifiable parts of a system (like a SSTR theatre) from the seemingly infinite morass. Morphological Analysis could be particularly helpful to the SSTR planner because it narrows the field based on objectives (just as the Dynamic Planning stage of this SHAPE methodology does, without throwing away so much that an important element once thought trivial but later important is lost).
Preparing to Plan: Characterize the Theatre in System Terms
One of the fundamental underlying principles of this proposed SHAPE planning methodology is that an SSTR environment is a system: it is composed of many interacting elements each of which has an effect on the others, and the balance of which never stops changing. It is the constancy of change that SSTR planners must plan for to achieve this thing we generally call “stability.” In point of fact, as described earlier, a fixed state in a system such as an SSTR theatre is not only unattainable, it may in fact be undesirable. A strong, robust, self-sustaining system is one that can absorb and rebound from many varieties of internal and external shocks and trauma and not just survive, but adapt and emerge more resilient still. Unfortunately, a true systems approach to SSTR environments is rare. Most existing assessments and analysis are sector driven, meaning education experts will assess
PROPRIETARY INFORMATIONUse or disclosure of data on this page is subject to restrictions

the education sector, but beyond the obvious like the impact of war or refugee flight, they are not likely to discuss the broad implications that other sectors have on their business of education. While there are exceptions (see the International Union for Conservation of Nature at http://cms.iucn.org), the vast quantity of existing assessment information describes things, people, and places within the context of their own category or sector, but not the relationships between the many things, people, and places in particularly useful detail.
With this existing universe of information, planners must at this stage define the theatre in resilience terms through a process both of “tailoring” existing generic indicators of resilience to specifics, and identifying aspects of a theatre that might contribute to resilience. The characterization of a SSTR theatre in resilience terms answers the question of “what [aspects of the SSTR theatre] is (or isn’t) resilient to what [possible events, stresses, disasters, etc.]?” The field of measuring indicators of resilience is growing rapidly. Though the vast majority of current research describes the attributes of social and community, ecological, and economic resilience, specific fields, such as public health have also been detailed. SSTR planners can draw on “functional” sector experts for help in defining what makes for resilience within sectors, and with “area” experts to help define what resilience means for a specific theatre. The explicit characterization of an SSTR theatre in resilience terms at this stage creates the foundation for the steps that follow, as we shall see as the process architecture unfolds.
2.2 Objectives
PROPRIETARY INFORMATIONUse or disclosure of data on this page is subject to restrictions

For purposes of this architecture, there are two categories of objectives: Given and Developed. Given Objectives are those that are passed down to planners from higher authorities like the President or Cabinet-level executives, fixed pre-existing policy aims, or published strategies and speeches. Developed objectives are those objectives that planners must identify or discover on their own through the planning process itself.
Given Objectives
Given, or issued objectives are almost always at the strategic level, and function practically as both guidance and constraints on planners for SSTR efforts. Given objectives can be very clear and explicit, or may require digging more deeply to determine what they mean for a specific theatre. In all cases planners should explore as many sources as possible, and seek guidance from senior leadership when clarity is impossible. Common sources of strategic objectives are National Security Strategies (NSS) and presidential directives (PD, PDD, NSPD, etc. – every presidential administration has its own acronym), published geographic strategies such as Mission Performance Plans (MPP) and Bureau Performance Plans (BPP), Theatre Security Cooperation Plans (TSCP), Congressional Budget Justifications (CBJ), as well as speeches and publicly issued statements by the President or his Cabinet.
Operational and tactical or field-level objectives may also be given, though this happens much more rarely. When objectives are given at these levels it is usually due to prior budgetary or programming commitments, or legislative requirements such as earmarks or
PROPRIETARY INFORMATIONUse or disclosure of data on this page is subject to restrictions

rules attached to important funding mechanisms. Similarly, previous agreements with the local government may have resulted in stated objectives of key programming mechanisms such as training and institutional capacity-building projects at these levels. In some cases these existing objectives may coincide with planners’ developed objectives, but most of the time they will function as constraints.
In this stage of the planning process Issued Objectives must be carefully and explicitly stated. Importantly, special emphasis should be placed on strategic message – what it is hoped will be communicated by engaging in development efforts or a security-oriented intervention. These explicitly stated strategic objectives and their associated strategic messages are required for the steps that follow in the SHAPE architecture.
Operational and Tactical Objectives
Operational and Tactical Objectives are the foundation of the proposed SHAPE planning methodology. It is in the “flow” from the strategic (conceptual) to the operational to the tactical (ground or field level) that determinations are made about what actual actions will be taken in theatre and where resources will be expended. The planning “team” or interagency group is responsible for the identification and formulation of objectives at these levels, and this decision-making process is what this SHAPE planning methodology is therefore geared to facilitate.
Challenges
There are several inherent challenges in defining objectives at the operational and tactical or field levels. Three of the most important are described below.
Finding the ‘Problem Center’ – Outputs of One Sector-System are Inputs to Every Other
A systems approach to planning for conflict environments is complicated by natural divisions in the policy community (particularly within government) into functional domains or “sectors” such as “security,” “economics,” “rule of law,” and “democracy and governance” among others. Conventionally each of these functional areas is seen to have its own discreet problem set – there aren’t enough well-trained police, or fiscal policy institutions are inept, or the military isn’t professional or well-equipped enough, or neither a legislative body nor “civil society” understand the precepts of democratic governance well enough to have a meaningful “democratic” government responsive to its people. In reality, all of these things may be true, but they actually inhabit the same physical, temporal, social and political space. The conditions within each of the traditional sectors are at least partially caused by conditions within other sectors, just as the consequences of activity within each domain can have a dramatic impact on the others. There is in essence, a web or network of multi-directional causality from domain to domain.
PROPRIETARY INFORMATIONUse or disclosure of data on this page is subject to restrictions

In its increasingly sophisticated approach to planning for conflict environments, the planning and policy community has begun to recognize that this is so. “Cross-sector integration” and “multi-“ or “cross-sectoral” are current terms of art in the interagency that reflect an increasing awareness that sector domains are not as discreet as once thought. The challenge is that as we increase our problem space by enlarging what we believe to be the boundaries of the problem-environment, the complexity of the problem increases exponentially. As a result of a true systems approach to a conflict environment, the limited set of ‘solutions’ within a given domain now must expand to both include possible solutions in all other sectors, and account for possible consequences caused to other sectors. Worse, as conditions in one domain change, whether due to deliberate action or uncontrollable events, values planners have assigned to a given sector and to actions taken within that sector change in priority dynamically – police training programs committed to in prior budget years with inflexible funding mechanism may become less relevant as local communities discover self-policing and conflict resolution mechanism in response to an unanticipated natural disaster, or through discovery of a shared economic opportunity resulting directly from deliberate micro-business enterprise promotion programs, just as promoting a certain type of ‘micro-enterprise’ may uncover layers of simmering conflict issues each requiring unique solutions and capacities.
In this thicket of causally-related “network nodes” operational- and tactical-level objectives may appear to always be in motion as action in one domain produces a set of new problems and related objectives in another.4 Regardless, the requirement to define objectives at these two important levels remains, as it is at these levels that implementation plans are derived.
Reinforcing Strategic Objectives at the Tactical and Operational Levels
An extension of the “problem-center” challenge (above) is the challenge of effectively mapping the relationship between the levels of planning and operations. In conventional hierarchical planning enterprises operational objectives and actions flow from strategic ones, just as tactical objectives and operations flow from the operational level above it. An unexpected consequence of this hierarchical approach is that tactical operations can come to work against strategic aims, even if they were designed to perfectly achieve operational-level objectives. Unfortunately operations in Iraq and Afghanistan, as well as most U.S. operations in recent history are rich with examples. This is best illustrated by the consequences of how tactical-level operations, policy, or programs are implemented for strategic aims. The strategic objective of enhancing respect and understanding of Western-style democracy may be undermined by employing unnecessarily violent or disrespectful operations when other options were available. Though these operations might have perfectly achieved a given operational “security” objective, the end result may be to move farther away from a key strategic objective, and ultimately to create new and more taxing security dilemmas. The British newspaper the Guardian describes one such example:
4 Rittel and Weber, Dilemmas in a General Theory of Planning. 159.
PROPRIETARY INFORMATIONUse or disclosure of data on this page is subject to restrictions

“A helipad was constructed in the heart of ancient Babylon. For this, ground had to be bulldozed and thousands of Hesco sandbags (made by the US-owned Handling Equipment Speciality Company) filled with earth to provide fortifications. The soil in these bags, dug up from the site, contains archaeological material now ripped out of its context, deracinated for all time. Worse, when more Hesco containers had to be filled, soil was brought in from other sites. The Hesco containers are biodegradable and are already beginning to collapse, leaving a stew of archaeological material that will eventually have to be sifted at vast expense if it is to be of value. The military have now moved on, but while the helipad was in use the daily flights shook the foundations of Babylon's ancient walls so severely that the wall of the Temple of Nabu and the roof of the 6th-century-BC Temple of Ninmah collapsed. How important is this? For the Iraqis, the damage strikes at the heart of their culture and history. Although the Iraq National Museum was founded only in 1923, it was an institution around which all Iraqis, regardless of religion, could attempt to create some shared national identity. There is also considerable significance for the rest of the world: in these sites are buried the roots of western civilisation. A line of influence (philosophical, scientific, artistic, aesthetic) runs from Mesopotamia through Greece to Rome and on to us. This is the birthplace of historiography in that it was here, in Babylonia, in southern Iraq, that writing was invented 5,000 years ago, when cuneiform, etched on clay tablets, allowed the transmission of ideas, of achievements, of records.” (The Guardian, Thursday January 19, 2006)
Unfortunately there are many more such examples from Iraq, Somalia, South America, Asia, and elsewhere. Though the authors of this proposed SHAPE planning methodology and process recognize that undertaking actions that produce undesirable secondary consequences such as military operations may be unavoidable, the next stage of the planning architecture (Asset/Participatory Analysis) is designed to best ameliorate unintended consequences and maximize the effectiveness of desirable ones.
The inflexibility of traditional “state” objectives
Traditionally objectives describe interim or end states, with an expectation that if the right actions are taken that “state” will be reached by a certain point in time. The problem with these kinds of objectives is that though they might lead to making a place better at a given time by, say, being more stable while an intervention force is in place, they may not do much to make the SSTR theatre capable of coping on its own. Furthermore, objectives set on fixed states such as “stability” rely on actions, efforts and mechanism designed for a particular situation at a particular point in time, and we have already established that SSTR theatres are always changing, and sometimes changing very quickly, so overly time-specific objectives may rapidly become obsolete. Though the need to change objectives in response to shifting circumstances may not on its face seem like much of a task since objectives are merely words in a plan, objectives may have a political life if they have been publicly stated making alteration or reversal difficult. Most importantly, the programming, deployment, and budgetary decisions made based on the original objectives are difficult if not impossible to reverse, require a long time to do so when it is possible, and may have set in motion consequences that make the sustaining of time-sensitive objectives fragile.
PROPRIETARY INFORMATIONUse or disclosure of data on this page is subject to restrictions

A myriad of examples from Liberia to Haiti illustrate the consequence of defining objectives in terms of states like “stability.” In each of these two examples – Liberia and Haiti – “stability,” a stated objective, was achieved, respective intervention missions declared successful and redeployed only to require a return some years later for much the same reasons that originally provoked their deployment to begin with.
Developed Objectives
The gargantuan challenge of prioritizing the near infinite possible programming, policy, and project actions in a way that accounts for all the sectors of an SSTR theatre, ties operations and programming to strategic objectives, and maintains effectiveness in the face of change is daunting, but can be overcome. One solution is to alter the nature of the objectives themselves from narrowly defined sector-driven aims like more police, lower inflation, or greater voter turnout (though each of these may ultimately be relevant) that seek to achieve a particular state, to a set of objectives whose aim is to alter conditions to reinforce particular attributes of the system itself, like resilience.
Resilience as an Objective
The concept of resilience is described above. The implications of replacing objective states (e.g. “stability”) with conditions (e.g. resilience) are first felt in the formulation of operational and tactical objectives.
2.3 Asset/Participatory Analysis
PROPRIETARY INFORMATIONUse or disclosure of data on this page is subject to restrictions

This stage of the SHAPE planning process is primarily what differentiates this planning process from other more traditional approaches. The Participatory phase of the SHAPE planning process occurs twice per complete iteration: first in the conduct of an asset-based assessment, and then as a “members’ check” as part of the Dynamic Planning phase. Each of these participatory phases is very different in character since they are conducted for different reasons.
2.3.1 Asset-Based Participatory Assessment
A survey of the existing and prior assessments collected in the Background (Phase I) of the SHAPE planning process will describe a place, name the people and groups, might fill in some history, and will almost certainly identify what is missing in the form of ‘needs’ or ‘gaps.’ All of this is useful information, but what planners need in order to develop plans to help make a SSTR theatre grow and develop into something more resilient are an accounting of what is already naturally available in that theatre. In the enterprise of nation building, a nation cannot be built with what it does not have. This SHAPE planning methodology therefore focuses on identifying and working with the inherent assets of a given theatre. Assets in this case are not just physical and material things, like roads, industry, water or oil sources, forest and other natural resources – though it includes those types of things as well – but also less tangible things such as cultural resources, social mores and proclivities, or social
PROPRIETARY INFORMATIONUse or disclosure of data on this page is subject to restrictions

structures advantageous to economic development or managing a particular conflict. One particularly important type of intangible assets are feedback loops.
Feedback Loops
One of the three primary characteristics of resilience is self-emergence. What makes the products of self-emergence grow and propagate into institutions that are themselves resilient are feed-back loops. In scientific terms a “positive feedback loop” is a phenomenon in which information of the consequences of a behavior or event cause the behavior or event to repeat itself with even greater magnitude. This is how revolutions start, local movements become national, an entire society suddenly decides that recycling is a good idea, or how stock markets rapidly climb or crash. Feedback loops are particularly important to the planner because they are at the heart of what the development community means when it refers to “sustainability.” How? If a social, economic or ecological system is feeding back information about its progress to itself over time, than it will grow and advance with little help from outsiders – precisely the outcome that development professionals (and soldiers deployed to an S&RO) dream of. One of the most important aspects to planners of feedback loops within SSTR theatres is that social and economic feedback loops are primarily perception driven. It is for this reason, among others, that perceptions play such a role in the SHAPE planning methodology, as will be particularly seen in the second iteration of the participatory phase (the “members’ check”). Though feedback loops are everywhere, identifying them can be challenging. None-the-less, feedback loops form the backbone of sustainable solutions, since they represent the byproduct of reaction within a society to itself, rather than to outsiders.
Perceptions as a Policy Driver
As eluded to above, feedback loops primarily “feed” on perceptions. The stock market is one of the best examples of this. If something happens that makes people unsure about a stock, they will sell, and this signals to others holders of the same stock that the stock is losing value and that now would be a good time to sell, furthering the loss of the stock’s value as more and more people react to its increasingly falling value. Economic growth and development in an SSTR theatre may thrive or wither based on perceptions. Similarly the perceptions of locals within a SSTR theatre to interventions and donors’ efforts can, through the phenomenon of feedback loops rapidly impact the effectiveness of donors and interveners in sectors seemingly unrelated to where an original action was taken. For example military action in a neighborhood that results in civilian casualties or significant damage to peoples’ property can make diplomatic or economic development efforts difficult by undermining trust and making people angry. As a result, identifying feedback loops inherent in a society and reinforcing them, as well as identifying possible catalysts for new feedback loops is critical. To do so, however, requires special attention to perceptions. Perceptions must both be effectively and comprehensively gauged as well as acted upon. Because of the power of feedback loops, and the overwhelming role that perceptions play in feedback loops, perceptions must be elevated to the same level that budget and political factors play in
PROPRIETARY INFORMATIONUse or disclosure of data on this page is subject to restrictions

determining which actions are most appropriate to achieve a given aim. Recognizing the relevance of feedback loops, and thus perceptions in a SSTR theatre, in this SHAPE planning architecture perceptions are treated as equals or even greater to other factors in the identification of possible courses of action.
Asset Identification and Item Generation
While some assets in a given SSTR theater may be self evident, many are not. Ultimately, the only way that assets can be accurately and comprehensively identified is by asking the local population within the SSTR theatre what they believe their assets are. Methods for discovering assets vary widely, from polls and surveys to focus groups, interviews and media analysis, and engaging local experts. All these methods are legitimate, and in most cases all and more must be employed to ensure that the full scope of local assets are captured. In the context of planning, assets, even those immaterial assets described earlier can be listed and ranked based on the importance they play in peoples’ minds. The process of discovering and cataloging assets is called “item generation.”
2.3.2 Participatory Planning
The stage will be utilized once the Dynamic Planning stage (see below) is complete and a number of possible plans of action have been identified and articulated. Also known as a “Members’ Check,” the planning iteration of the participatory stage is the opportunity for planners to test how their ideas for implementation will be received before they are acted upon and the consequences of action are irreversible. The most common and effective method for conducting a Members’ Check is a forum known as a charrette. During a charrette several possible plans of action are presented to members of the local community where these actions might be taken, and reactions are gauged and comments recorded as input for modification to the plans. If reaction is overly severe and significant modification to plans are required the planning process to the assessment stage of Asset/Participatory Analysis. It is important during a charrette that potential plans of action be presented as notional and not as fait accompli, as the point of conducting the charrette is both to gather feedback, and inject a feeling of inclusion or “buy in” about potential planned actions.
2.4 Classic Planning
Classic methods of planning dominate the departments and agencies that engage in SSTR planning, and these same organizations are “stove-piped” into narrow functional and geographic arenas. Ultimately even the most “dynamic,” systems-based integrated planning efforts must be implemented by many specialists, so tasks in an implementation plan must be divided out according to who is responsible for what. A number of matrices exist that break out possible tasks according to sector. The basis for most of these matrices, such as the State Department’s “Essential Tasks Framework” are based on a project from the think tank Center
PROPRIETARY INFORMATIONUse or disclosure of data on this page is subject to restrictions

for Strategic and International Studies (CSIS) called “Winning the Peace.” Additional products, such as Measuring Progress in Conflict Environments (MPICE) are based indirectly on this framework, and are divided into five sectors: Security (military), Rule of Law (police, judicial and penal), Political, Economic, and the “catch all” Social Well Being, which includes things like health and education. The SHAPE planning process requires the addition of two more categories. The first category is captured best by combining the World Wildlife Federation (WWF) concept of “Landscape” which encompasses the traditional sense of the physical environment’ objects and characteristics, but also the people and social fabric within that environment.
Natural features consisting of physical and biological formations or groups of such formations, which are of outstanding value from the aesthetic or scientific point of view; Geological and physiographical formations and precisely delineated areas which continue the habitat of threatened species of animals and plants of outstanding universal value form the point of view of science or conservation (or the community); Natural sites or precisely delineated natural areas of outstanding value from the point of view of science, conservation or natural beauty. (The United Nations Education, Scientific and Cultural Organization (UNESCO))
The second category includes “cultural resources” including: Monuments: architectural works, works of monumental sculpture and painting, elements or structures of an archaeological nature, inscriptions, cave dwellings and combinations of feature, which are of outstanding universal value from the point of view of history, art or science; Groups of
PROPRIETARY INFORMATIONUse or disclosure of data on this page is subject to restrictions

buildings: groups of separate or connected buildings which, because of their architecture, their homogeneity or their place in the landscape, are of outstanding universal value from the point of view of history, art or science; Sites: works of man or the combined works of nature and man, and areas including archeological sites, which are of outstanding universal value from the historical, aesthetic, ethnological or anthropological point of view; Practices, representations, expressions, knowledge, skills —as well as the instruments, objects, artifacts and cultural spaces associated therewith— that communities, groups and, in some cases, individuals recognize as part of their cultural heritage.
Most existing products like those listed above are extremely useful in providing catalogs of possible tasks or actions organized by sector from which planners can select. Classic Planning can produce very detailed and useful products, and planners should draw heavily on the data they produce, such as information about how long certain types of tasks might take, and what the necessary inputs into those tasks might be required. For example, experts have likely already documented through traditional sector lenses what is required to engage in capacity building for a given ministry, to improve water supplies, or to enhance female education programs. These “classic” tools, however, because they are usually pre-divided by sector, do not, usually provide a logic or method with which to prioritize the lengthy sets of possibilities, nor to effectively map the relationships and consequences between sectors. This is where the Dynamic Planning stage proves its greatest utility.
2.5 Dynamic Planning
PROPRIETARY INFORMATIONUse or disclosure of data on this page is subject to restrictions

The aim of the Dynamic Planning stage is to sequence those actions or efforts against the objectives from Objectives stage that will most likely produce sustainable results, free of the constraints that pre-established sector divisions place on the creation of possible solution sets.
Critical Path mapping has proven the most effective means for accomplishing this so far. Critical Path mapping entails laying out the resilience-oriented objectives on the right, and tracing paths of dependencies and enablers backwards over a timeline to an established starting point. A critical path is not necessarily entirely linear, since iterative processes can be imbedded in the path. This enables incremental shifts in resources towards things that require more or less attention over time as feedback loops grow or shrink aspects of the SSTR theatre. To describe the use of Critical Path in the SHAPE planning process we will revisit the female education example presented previously in the introduction. In the example below the objective in resilience terms is for the community to be more adaptive to changing local economic conditions. In this hypothetical example (analagous to several real examples in East and West Africa) it is known from the Background stage that women make up 50% of the population of the local community, but that only 5% of them are educated. It is discovered in the Participatory Assessment stage that women:
· are not allowed to attend school for cultural reasons· are the community’s water bearers and spend eight hours per day bearing water
because the water sources is far away
PROPRIETARY INFORMATIONUse or disclosure of data on this page is subject to restrictions

· value the long walks to the distant water source because it gives them women-only social time to discuss female issues without interference
A simplified version of a critical path map that might flow accordingly appears below. Experts have identified that a more educated population makes a community more resilient to changing economic conditions, and economic conditions are changing in
our target community, so an examination of deomgraphic data reveals that a full 50% of the population (the women) are uneducated, with the result that the community is not very resilient. The female half of the population is therefore identified as key to increasing the resilience of the community, and female education, or “women are educated” is identified as the Developed Objective. From this objective flows a number of requirements, including that women must attend school in order for schooling to be effective. Given the information we have from our participatory assessment we know that there must be a local water source if women are to have the time to attend school. All of these are dependencies (the red lines in the Critical Path diagram above) in that they must happen in order for the step that follows to occur. Therefore anything that has a red line must be done or the objective at the end will not be accomplished. Other dependencies that appear in the diagram are school buildings, textbooks and supplies, teachers, and funds for all of these things. The women you interviewed during the participatory assessment indicated they want to attend school, but also value their social time together, and will have a hard time deciding which to choose on any given day. An alternative social forum for women in the community is therefore an enabler since it makes the decision to attend school more likely. One of the most important aspects to highlight about the critical path example given here is that elements that are required – dependencies – that are outside the apparent domain of education planners are discovered and their critical role identified and articulated. Classic sector-driven planning methods would certainly tell you that you need teacher, books, and schools, but it might not be able to identify that you need a well, and how to go about building one. An important bit of information that is missing from this illustrative diagram us sequencing. Mapped out in greater detail the critical path map will also tell you how long each task takes, so that building a school, training teachers, and building the well can all lead to completion dates
PROPRIETARY INFORMATIONUse or disclosure of data on this page is subject to restrictions

that are somewhere close to the same. It might, for example, take a year to train teachers, but only six months to build a school, and three months to build the well. In this case teacher training must happen as early as possible relative to other tasks.
Feedback loops can be built into the critical path map in two ways: by introducing iterations of increasing impact in the map itself, and by ensuring that key catalysts identified in the participatory asset-based assessment stage are included as enablers wherever possible. The “buy-in” of influential female elders (Community ‘Matriarchs’) is an example of catalyst in this diagram. The attendance at school of a matriarch’s daughter might spark a rush to the schools if were suddenly seen as prestigious for a woman to be educated.
PROPRIETARY INFORMATIONUse or disclosure of data on this page is subject to restrictions

2.6 Planning Completion
The Planning Completion stage is something of a misnomer because in an iterative planning process such as this SHAPE process, planning continues until resources and efforts are no longer expended. In the first iteration however, this stage indicates the rolling into implementation, and the necessary requirements that entails. The three most important aspects of the Planning Completion stage are plan revisions, tracking outcomes – measures and indicators of success, and a return to the Participatory Analysis stage for a “members’ check” (see Asset/Participatory Analysis above) of plans of action that the Dynamic Planning stage outlined.
Revised planning occurs either when conditions within the SSTR theatre change dramatically enough that plans no longer appear to reflect reality, or if inputs such as funds, manpower or donors’ political will change dramatically. Changes may occur for many reasons, including dramatic events like assassinations, the outbreak of violent conflict and natural disasters, but also because things are going better than expected and objectives must be reinforced in unanticipated ways such as a ceasefire being signed despite long political odds, or runaway economic growth.
PROPRIETARY INFORMATIONUse or disclosure of data on this page is subject to restrictions

Lastly, measures and indicators of outcomes enable the monitoring of success over time. These results can then drive future iterations of the planning process moving forward. Importantly, though measures and indicators cannot be effectively designed to match planning goals until the first planning iteration through the Dynamic Planning stage is complete, outcome measures should be collected against as early as possible, preferably prior to implementation so as to establish a meaningful baseline.
PROPRIETARY INFORMATIONUse or disclosure of data on this page is subject to restrictions

3. SHAPE Phase 1 Literature Review
3.1 Background
As was described in the Weinstein and Tidball (Weinstein and Tidball 2007) environment shaping paper, development assistance has a chequered past, in large part because planning for development assistance is historically such a fractured enterprise internally, and so disassociated from development assistance recipients’ assets and needs. The authors of “environment shaping” offered an alternative development program planning methodology that highlighted the important relationship between development assistance and the environment into which it is offered. The authors employed an asset-based, rather than a traditional deficit-based, approach to assess the environment for which development assistance will be formulated. The authors then highlighted the power of perceptions in the creation of policy programming and in identifying and reinforcing opportunities for positive feedback loops within the recipient environment as critical to truly ‘sustainable’ development. Finally, though not explicitly, the authors called for the application of a systems theory not wedded to rigid notions of stability, but rather a systems theory open to the possibilities represented by change and surprise within system dynamics.
Some time later, the Office of the Secretary Of Defense (OSD) 5 issued a Request for Proposals for development of a “systems architecture” for operational commanders that incorporates participatory and asset-based community development methodologies for urban areas in support of national/strategic objectives, nicknamed “SHAPE,” which stands for Stake-holder Asset Based Planning Environment. The summary of the RFP reads as follows:
The mission of DoD in the Global War on Terror has gone far beyond the traditional warfighting role. The DoD mission areas within Stability Security Transition and Reconstruction (SSTR)6 requires both strategic and operational understanding all of the factors that influence the actions of friendly and neutral populations in the area of operations. The community development strategists and theorists have advanced methodologies incorporating the “principle that a community can be built only by focusing on the strengths and capacities of the citizens and associations that call the community home.” These methodologies could be applied to situations in partner nations of interest to the US government. The asset-based analysis identifies existing resources and assets, indigenous desires and perceptions, enablers – including individuals who can serve in a catalytic role -, existing positive feedback
5 Office Of The Secretary Of Defense (OSD), Deputy Director Of Defense Research & Engineering, Deputy Under Secretary Of Defense (Science & Technology), Small Business Technology Transfer Research (STTR), FY 2007 Program Description. OSD07-T003: Development of Systems Architecture for Stake-Holder Asset-based Planning Environment6 http://www.dtic.mil/whs/directives/corres/html/300005.htm
PROPRIETARY INFORMATIONUse or disclosure of data on this page is subject to restrictions

loops and
opportunities for future positive feedback loops, and measures of the intended target environment’s receptiveness to assistance. Assets are broadly defined and multidimensional, and include financial, human, physical (both man-made and natural), social and political assets. The methodology is inherently participatory and seeks to help communities identify and leverage local assets to create jobs, social capabilities and structures, and sustainable economic markets appropriate for the local environment. Rural areas are the focus of most of the development techniques; however, the move to urban areas in recent history is well documented. The responders will investigate the viability of asset-based development methodologies, translate the salient features to urban environments, design and develop a system architecture that embraces the principles by identifying interacting component software modules, investigate display attributes and data structures, and create a demonstration capability for local applications.
LOGOS Technologies located in the Washington, D.C. area was awarded a Phase 1 contract to develop these ideas, and contracted IS27 and Cornell University’s Civic Ecology Initiative to assist in this work. The following literature review is in support of efforts by LOGOS Technologies8 to fully account for the literature supporting or critical of the SHAPE concept. This literature review attempts to juxtapose literatures around complex problems and problem solving, resilience theory, asset-based participatory development and evaluation, and urban ecology, and security in anticipation of attempting to apply theories and techniques emerging from these literatures in synthesized, comprehensive ways for complex SSTR environments.
3.1.1 Complexity and Wicked Problem
The Stability Security Transition and Reconstruction (SSTR) environments within which a tool or approach such as SHAPE is intended to be employed are highly complex. Complexity exists at multiple levels, from bio-physical, landscape, social, political and governmental, economic, regional, and within operational elements involved with SSTR. In addition, the complexity of STTR Ops increases by the involvement of a large number of US Government elements, International Organizations, Non Governmental Organizations, 7 http://www.internationalsustainablesystems.com/8 http://www.logos-technologies.com/
PROPRIETARY INFORMATIONUse or disclosure of data on this page is subject to restrictionsFIG 1. A “node garden” illustrating a complex environment
characterized by nodes and linkages. Image source: www.complexification.net
FIG 1. A “node garden” illustrating a complex environment characterized by nodes and linkages. Image source: www.complexification.net

and Private Voluntary Organizations. Douville ( 2007) argues that perhaps the most difficult challenge in conducting SSTRO is understanding interagency complexity and strengthening interagency capacity.
The combined affect of this level of complexity and resulting confusion about multiple potential course of action is referred to by some as a “wicked problem.” The concept or notion of "wicked problems" was originally proposed by Horst Rittel and M. Weber (1973). In the late 1970s, Rittel identified crucial features of intellectual work that are highly pertinent to current concerns. He characterized a class of problem he called 'wicked', as opposed to 'tame' problems. Tame problems are not trivial problems, but by virtue of the maturity of certain fields, can be approached with more confidence. Tame problems are understood sufficiently that they can be analyzed using established methods, and it is clear when a solution has been reached. Tame problems may even be amenable to automated analysis, such as computer configuration design or medical diagnosis by expert system (Shum, 1997).
Rittel expounded on the nature of ill-defined design and planning problems which he termed “wicked,” (that is, messy, circular, aggressive) to contrast against the relatively “tame” problems of mathematics, chess or puzzle solving.9 Modern discussions and applications of this concept also cite the constraining nature of wicked problems, where most attempts to progress away from the problem and towards a solution then face multiple pressures forcing us back towards the original “wicked” conditions. In other words, “wicked problems” represent stable conditions and are resilient (in the word’s more negative connotation),or perhaps resistant, to the positive changes we wish to make against them.
Rittel concluded that wicked problems can only be tackled through what he termed an argumentative method. Understanding how to frame a wicked problem is the first step to solving it. He asks, “What are the key questions? What are the key priorities?” (Shum, 1997).
There are a number of iterations of the characteristics of a wicked problem. Rittel and Weber's (1973) formulation of wicked problems specifies ten characteristics, perhaps best considered in the context of social policy planning. According to Ritchey (2007), the ten characteristics are:
• There is no definitive formulation of a wicked problem. • Wicked problems have no stopping rule. • Solutions to wicked problems are not true-or-false, but better or worse. • There is no immediate and no ultimate test of a solution to a wicked problem. • Every solution to a wicked problem is a "one-shot operation"; because there is no
opportunity to learn by trial-and-error, every attempt counts significantly.
9
PROPRIETARY INFORMATIONUse or disclosure of data on this page is subject to restrictions

• Wicked problems do not have an exhaustively describable set of potential solutions, nor is there a well-described set of permissible operations to be incorporated into the plan.
• Every wicked problem is essentially unique. • Every wicked problem can be considered to be a symptom of another problem. • The existence of a discrepancy in problem representation can be explained in
numerous ways. The choice of explanation determines the nature of the problem's resolution.
• The planner has no right to be wrong (planners are liable for the consequences of the actions they generate).
According to another scholar, Robert Horn, the defining characteristics of a social mess or “wicked problem” are:
• No unique “correct” view of the problem; • Different views of the problem and contradictory solutions; • Most problems are connected to other problems; • Data are often uncertain or missing; • Multiple value conflicts; • Ideological and cultural constraints; • Political constraints; • Economic constraints; • Often a-logical or illogical or multi-valued thinking; • Numerous possible intervention points; • Consequences difficult to imagine; • Considerable uncertainty, ambiguity; • Great resistance to change; and, • Problem solver(s) out of contact with the problem and solutions (Horn, 2001; Horn &
Weber, 2007)
Yet another scholar in this field echoes some of the above definitional characteristics, but adds additional and useful characteristics:
· cannot be easily defined so that all stakeholders agree on the problem to solve; · require complex judgments about the level of abstraction at which to define the
problem; · have no clear stopping rules; · have better or worse solutions, not right and wrong ones; · have no objective measure of success; · require iteration-every trial counts; · have no given alternative solutions-these must be discovered; · often have strong moral, political or professional dimensions (Shum 1997)
PROPRIETARY INFORMATIONUse or disclosure of data on this page is subject to restrictions

And finally, according to Conklin, the four defining characteristics of “wicked problems” are:
• The problem is not understood until after formulation of a solution. • Stakeholders have radically different world views and different frames for
understanding the problem. • Constraints and resources to solve the problem change over time. • The problem is never solved (Conklin 2003)
Despite nuances in defining specific characteristics of “wicked problems,” there appears to be consensus among scholars on the general nature of “wicked problems.” As project managers have begun to adopt the notion of “wicked problems,” they have begun to distill key points in addressing them. One such practitioner advocates the following four strategies for coping with wicked problems.
· Participation – involves obtaining knowledge and assumptions of all the stakeholders. It also involves restating the knowledge and assumptions in objective terms for comparison and acceptance by the same stakeholders.
· Adversity – this may seen odd, but the participants must understand and use doubt when dealing with the possible solutions. It also means that the participants must withhold judgment until the premises are tested.
· Integration – through both analysis and synthesis. Analysis subdivides the whole into parts. Synthesis assembles the parts into a whole. Both must be done concurrently.
· Support Of The Managerial Mind – since ongoing support is required to deliver any part of the solution (Alleman, 2006).
Critics of the “wicked problem” concept and its implication argue that searching for and defining a problem as “wicked” assumes that one can somehow a priori decide whether a specific problem is a wicked one requiring highly skilled problem definition or a linear one which is already well defined. These critics assert that the concept is flawed in that it misses the point that the problem that one is attempting to “understand” may already be the wrong problem (Conklin, Basadur et al. 2007).
3.1.2 Morphological Analysis of “Wicked Problems”
General Morphological Analysis (GMA) is a method for structuring and analyzing the total set of relationships contained in multi-dimensional, non-quantifiable, problem complexes (Ritchey 2007). Developed by the Swedish National Defense Research Agency in the middle of the 1990s, it can be used for structuring complex policy and planning issues, developing
PROPRIETARY INFORMATIONUse or disclosure of data on this page is subject to restrictions

scenario and strategy laboratories, and analyzing organizational and stakeholder structures. GMA is especially useful for working with so-called “wicked problems.”10
Morphological Analysis works through very simple processes, using two common principles of creativity: decomposition and forced association. The problem is broken down into component variables and possible values identified for each. The association principle is then brought into play by ‘banging together’ multiple combinations of these values.
Advanced Computer-Aided Morphological Analysis was developed in 1995-96 by Tom Ritchey, then at the Department of Technological Foresight and Assessment, at the Swedish National Defense Research Agency in Stockholm (Ritchey, 2002). MA/Casper is a dedicated software system which supports an extended form of Morphological Analysis. It serves as a development platform for creating scenario and strategy laboratories, and morphological inference models (Ritchey, 2003). It is presently in its 4th programming version.
With dedicated computer support, far more than 7 variables, and many millions of configurations, can be treated quite rigorously. When a solution space is synthesized, the resultant morphological field becomes an inference model, in which any parameter (or multiple parameters) can be selected as "input", and any others as "output". Thus, with computer support, the morphological field can be turned into a laboratory with which one can designate initial conditions and examine alternative solutions.
The Swedish National Defense Research Agency (FOI) has been using MA for more than fifteen years, and has worked with virtually every Swedish Government department, as well as the governments of South Africa, the Netherlands and the USA.
We do not know of any critical reviews or constructive critiques of Morphological Analysis.
3.1.2 Social Complexity in “Wicked Problems”
In addition to the complexity of the problem environment of “wicked problems,” scholars argue for the addition of the social complexity dimension (Conklin, Basadur et al. 2007). Social complexity goes beyond individual diversity and diversity among disciplines to include people who represent different institutions and organizations. Each organization or institution has its own function and charter, its own goals, and is managed by its own leader. These organizations often have divergent goals. If or when divergent members of a project team come together to collaborate, they represent not only themselves but also their respective institutional management chain and hierarchy. Ideally, everyone in the organization is committed to the same outcome but operationally goals and agendas can be quite fragmented. Thus, according to Jeff Conklin (Conklin 2006), social complexity makes wicked problems even more wicked, raising the bar of collaborative success higher than ever.
10 http://www.swemorph.com/
PROPRIETARY INFORMATIONUse or disclosure of data on this page is subject to restrictions
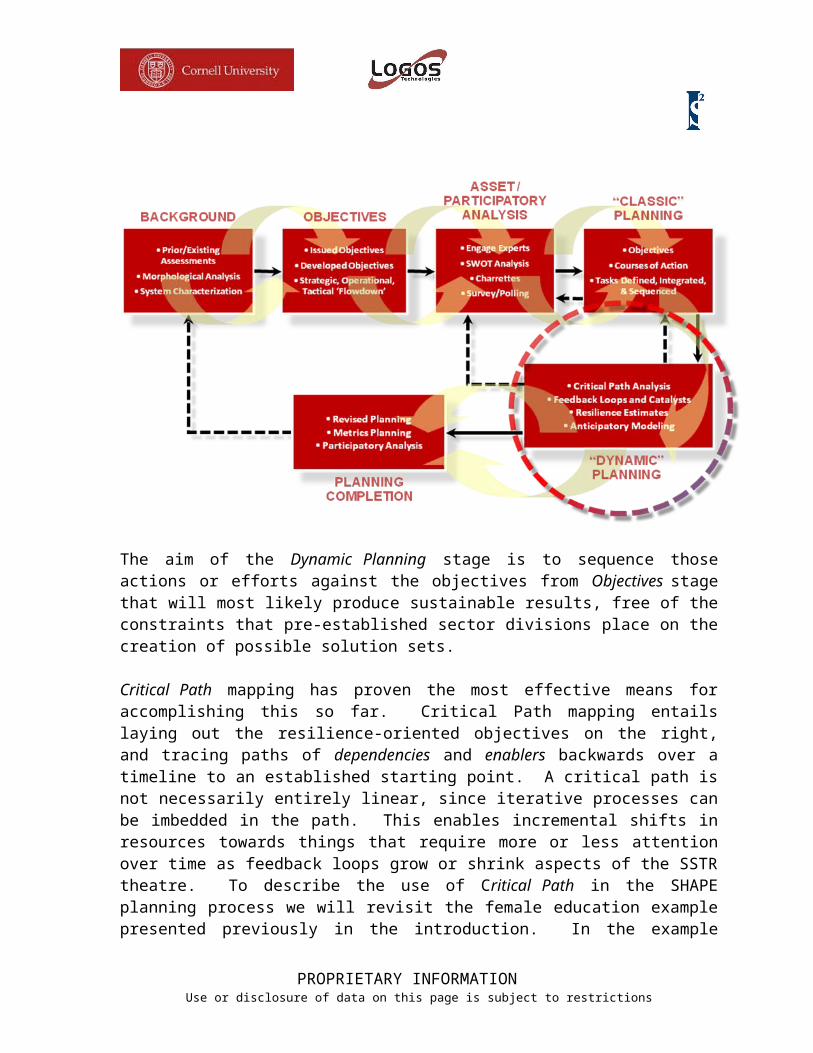
According to Conklin, the main feature of a wicked problem is that you don’t understand the problem until you already have a solution. Conklin states that in terms of social complexity:
“not understanding the problem does not show up as innocent wonder about the mystery of the problem, nor does it usually occur as a thoughtful collective inquiry into the deeper nature of the problem. Rather, not understanding the problem shows up as different stakeholders who are certain that their version of the problem is correct. In severe cases, such as many political situations, each stakeholder’s position about what the problem is reflects the mission and objectives of the organization (or region) they represent. In such cases there is a fine line between collaboration and colluding with the enemy. How can you make headway on a mutually acceptable solution if the stakeholders cannot agree on what the problem is?”
Conklin situates the answer to this question in “creating shared understanding about the problem, and shared commitment to the possible solutions.” He qualifies this elsewhere explaining that shared understanding does not imply that all parties necessarily agree on the problem, rather, explains Conklin, what is meant is that the stakeholders understand each other’s positions well enough to have intelligent dialogue about the different interpretations of the problem, and to exercise collective intelligence about how to solve it. Underscoring the importance of asset-based participatory planning, and providing a segue to the next section, Conklin argues that... “because of social complexity, solving a wicked problem is fundamentally a social process. Having a few brilliant people or the latest project management technology is no longer sufficient (Ibid).”
3.2 Participatory Planning and Assessment
Because the administration of humanitarian aid and reconstruction is rarely if ever a neutral process, the LOGOS team has considered that SRO undertakings generate resources, jobs, and training opportunities, create new hierarchies, and alter access to government, media and financial resources and that such opportunities and services empower those who are involved in SSTR operations. The project team has recognized, therefore, that who controls and participates in aid and reconstruction efforts has far-reaching implications for failed and fragile states (Crowley et al, 2006).
Participatory approaches to development, assessment of development programs, and then research, has many of its roots in social psychology. It builds on the Action research and Group Dynamics models developed by psychologist Kurt Lewin (Lewin 1946) in the early-to-mid 1900s. Fundamentally, participatory approaches revolve around three sets of relationships: relations between individuals within communities and groups, relations
PROPRIETARY INFORMATIONUse or disclosure of data on this page is subject to restrictions

between those groups and communities, and relations between people and their physical environment. Management of group dynamics in its many aspects thus plays a central role in participatory processes, and participatory practitioners/facilitators must have a strong foundation in this field11.
According to Mathie (Mathie 2002) these kinds of participatory modes of addressing development can be understood as an approach, as a set of methods for community mobilization, and as a strategy for community-based development. The following are distilled from the important paper “From Clients to Citizens: Asset-Based Community Development as a Strategy For Community-Driven Development” which reviews this literature:
• As an approach to community-based development, the salient principle is that the recognition of strengths, gifts, talents and assets of individuals and communities is more likely to inspire positive action for change than an exclusive focus on needs and problems.
• As a set of methods, the literature advocates participation as a means of inspiring a community to mobilize around a common vision or plan. This can occur through such techniques as collecting stories about community successes and identifying the capacities of communities that contributed to success. Outcomes of these techniques may include:
– Organizing a core group to carry the process forward – Mapping completely the capacities and assets of individuals,
associations, and local institutions – Building relationships among local assets for mutually beneficial
problem-solving within the community. – Mobilizing the community's assets fully for economic development
and information sharing purposes – Convening as broadly representative group as possible for the
purposes of building a community vision and plan – Leveraging activities, investments and resources from outside the
community to support asset-based, locally defined development
• As a strategy for sustainable community-driven development, the authors have in mind moving beyond the mobilization of a particular community, to sharing resources and concern regarding how to link micro-assets to the macro environment. Here, the literature argues for attention to be paid to the boundaries of community and how to position the community in relation to local institutions and the external environment on which its continued prosperity and security depends.
11 http://en.wikipedia.org/wiki/Participatory_action_research
PROPRIETARY INFORMATIONUse or disclosure of data on this page is subject to restrictions

More specific and intentional than participatory development, asset-based development analysis, based on an approach referred to as ‘Asset-Based Community Development’ or ‘ABCD’, focuses explicitly on what a community, town, city, nation, etcetera, actually possesses rather than what it is perceived to lack. A town, a region, or a nation, for example, cannot promote growth with what it does not have. ABCD seeks to identify the resources available to a community, in a process within which the community participates directly in the identification of assets, and then seeks to use those resources as the means to positive and productive ends (Dewar, Kretzmann et al. 1997). Some have argued that participatory approaches inherent to ABCD are simply a clever way of co-opting communities to perform the wishes of outside ‘developers’ (Cooke and Kothari 2001). Although there is merit in questioning the ascendency of the participation paradigm as “supreme”, combining the knowledge, experience and expectations of both internal and external actors would appear to be crucially important to achieving effective development solutions (Samuel and Giles 2004). Kretzmann and McKnight note in their ABCD guide that:
“Focusing on the assets of lower income communities does not imply that these communities do not need additional resources from the outside. Rather, this guide simply suggests that outside resources will be much more effectively used if the local community is itself fully mobilized and invested, and if it can define the agendas for which additional resources must be attained. The assets within lower income communities, in other words, are absolutely necessary but usually not sufficient to meet the huge development challenges ahead” (Kretzmann and McKnight 1993).
Where Asset Based Participatory Planning and the legacy of participatory development intersect is in helping to identify a legitimate role for external agencies in community development so that control over development stays within the communities themselves, but in a climate where inclusive participation is encouraged. Users of the approach are deliberate in their intentions to lead by stepping back. Existing associations and networks (whether formal or informal) are assumed to be the source of constructive energy in the community.
Some might argue, however, that capacity building in the participatory paradigm is more effective if people are not constrained by cultural norms and practices considered undemocratic or archaic. For this reason they might advocate that new community based organizations should be formed rather than building on existing associational forms that might prejudice the interests of less powerful members. The challenge of encouraging inclusive participation, which may at times be at odds with "leading by stepping back," is therefore one with which practitioners and planners will have to wrestle as community-driven development unfolds.
3.3 Dynamic Adaptive Systems and Resilience
PROPRIETARY INFORMATIONUse or disclosure of data on this page is subject to restrictions

According to the Resilience Alliance, a network of scholars investigating ecosystem resilience, “Ecosystem resilience is the capacity of an ecosystem to tolerate disturbance without collapsing into a qualitatively different state that is controlled by a different set of processes. A resilient ecosystem can withstand shocks and rebuild itself when necessary. Resilience in social systems has the added capacity of humans to anticipate and plan for the future.”12 Luminary ecologist “Buzz” Holling originated the technical term “resilience” from within the field of ecology (Holling 1973), and later clearly distinguished the term from resilience as it began to be used in engineering13 fields (Holling 1996). The concept of resilience is now deployed in a great variety of interdisciplinary work dealing with the interactions between people and nature (Gunderson, Holling et al. 1995; Hanna, Folke et al. 1996; Ludwig, Walker et al. 1997; Berkes and Folke 1998; Redman 1999; Klein and Nicholls 1999; Gunderson 2000; Kinzig A and others 2000; Gunderson and Holling 2001) and with individual and community health (Luthar, Cicchetti et al. 2000). The following section will review resilience theory and the adaptive cycle, borrowing heavily from the thorough literature review found in Carpenter and others’ important article “From Metaphor to Measurement: Resilience of What to What?” (Carpenter, Walker et al. 2001).
Resilience has multiple levels of meaning: as a metaphor related to, but not substituted for, sustainability, as a property of dynamic models, and as a measurable quantity that can be assessed in field studies of Social-Ecological Systems. The operational indicators of resilience have thus far received relatively little attention in the literature. However, Carpenter et al point out that to assess a system’s resilience, one must specify which system configuration and which disturbances are of interest, or “resilience of what to what” (Carpenter, Walker et al. 2001).
Other authors have emphasized the critical role of innovation and learning in the ability of socio-ecosystems to recover from catastrophic events, like disaster (Walker and Salt 2006; Tidball and Krasny 2007). Scholars of ecosystem resilience point out that unlike notions such as sustainability, resilience can be desirable or undesirable. For example, system states that decrease social welfare, such as polluted water supplies or dictatorships, can be highly resilient. In contrast, sustainability is an overarching goal that includes assumptions or preferences about which system states are desirable (Carpenter, Walker et al. 2001).
The resilience literature focuses largely on forest, aquatic, marine, agricultural, and other more rural socio-ecological systems (Baskerville 1995; Carpenter and Cottingham 1997; Anderies, Janssen et al. 2002). Recently, Alberti and Marzluff (Alberti and Marzluff 2004) applied resilience theory to resource management in an urban context, and Tidball and Krasny have applied resilience theory to urban systems focusing on community-designed green spaces (e.g., allotment gardens, urban community forests, etc.) (Tidball and Krasny 2007). 12 Resilience Alliance, www.resalliance.org 13 For more on engineering understandings of resilience, visit the Multidisciplinary Center for Earthquake Engineering Research website, or see: Bruneau M, Chang S, Eguchi RT, Lee GC, O.Rourke TD, Reinhorn AM, Shinozuka M, Tierney K, Wallace WA, von Winterfelt D (2002): A framework to quantitatively assess and enhance seismic resilience of communities. Multidisciplinary Center for Earthquake Engineering Research, Buffalo, NY.
PROPRIETARY INFORMATIONUse or disclosure of data on this page is subject to restrictions

Gunderson and Holling (2001) define “resilience” as the capacity of a system to undergo disturbance and maintain its functions and controls. In their view, resilience is quantified by the magnitude of disturbance the system can tolerate and still persist. They contrast this definition with that proposed by Pimm (1984), who argues that the appropriate measure is the ability of the system to resist disturbance and the rate at which it returns to equilibrium following disturbance (Pimm 1984; Tilman and Downing 1994).
Carpenter et al (2001) and other scholars report that the distinction or nuance between these two definitions of resilience has been useful in encouraging managers of naturally variable systems to consider the persistence of such systems and has helped them to escape “traditional preoccupation with management aimed at the unachievable goal of stability.” However, Carpenter et al (2001) maintain the need to simultaneously consider the other, complementary aspect of persistence— resistance, which they define as the “amount of external pressure needed to bring about a given amount of disturbance in the system.” In arguing for this dualistic perspective of resilience, they point to examples of systems they believe are particularly persistent because they are intrinsically resistant— that is they absorb high levels of external pressure and nevertheless persist. An example referenced included self-mulching clay soils and paddy rice production in Java (Geertz 1963). Concurring with Gunderson and Holling (2001), Carpenter et al point to the key criterion being persistence; therefore, to assess long-term persistence, resilience scholars believe they need to also consider resistance as the complementary attribute of resilience.
Carpenter et al. (2001) include both ecological and social indicators of resilience in their research. Similarly, international development professionals attempting to measure resilience in developing countries have integrated sustainable livelihood and environmental management factors that may foster resilience in the face of climate change (Elasha, Elhassan et al. 2005). However, most resilience measures used by government authorities and researchers in developed countries are limited to social indicators of resilience. For example, the Auckland Region Civil Defense Emergency Management Group in New Zealand has defined social resilience as the capacity of people, communities and organizations to adapt to, manage, and learn from the demands, challenges and changes encountered during emergencies, and has identified 11 social measures for their model of resilience (e.g., community participation, leadership, social support; see (Paton, Daly et al. 2006). Similarly, researchers at the Multidisciplinary Center for Earthquake Engineering Research define resilience as “the ability of social units (e.g., organizations, communities) to mitigate hazards, contain the effects of disasters when they occur, and carry out recovery activities in ways that minimize social disruption and mitigate the effects of future disasters,” and have identified four dimensions of resilience: the technical, organizational, social, and economic (Bruneau, S. E. Chang et al. 2003). Finally, measures used in the “Toolkit for Health and Resilience in Vulnerable Environments” are clustered into four categories: built environment, social capital, services and institutions, and structural
PROPRIETARY INFORMATIONUse or disclosure of data on this page is subject to restrictions

factors (Prevention Institute 2004). There is a need for measures of resilience that integrate these social indicators with ecological indicators.
Resilience researchers have cited three attributes as being fundamental to the ability of a society to respond to changes such as disaster and conflict, including: (1) the amount of change the system can undergo and still retain the same controls on function and structure (which depends heavily on the biological and socio-economic diversity present in the system), (2) the degree to which the system is capable of self-organization, and (3) the ability to build and increase the capacity for learning and adaptation (Folke, Carpenter et al. 2002). The resilience literature also relies heavily on the concept of the adaptive cycle (Holling 1973) and panarchies (Gunderson and Holling 2001) of these cycles. We discuss each of these briefly below.
Diversity is fundamental to retaining functional and structural controls in the face of disturbance and thus to buffering the impact of catastrophic and other changes (Folke, Carpenter et al. 2002; Perrings 2006; Walker and Salt 2006). Biological diversity provides functional redundancy, so that if one species declines (e.g., a nitrogen-fixing species), other species providing the same ecosystem services will continue to function (Levin 2005). Similarly, when diverse groups of stakeholders, including resource users from different socio-economic classes or ethnic groups, scientists, community members with local knowledge, non-profit organizations, and government officials, share the management of an urban forest or other natural resource, decision-making may be better informed, stakeholders may be more invested in and supportive of the decisions, and more options exist for testing and evaluating policies (Olsson, Folke et al. 2004).
Self-organization refers to the emergence of macro-scale patterns from smaller-scale rules, such as the emergence of ecosystem patterns related to nutrient cycling or plant size distributions as a result of evolution acting at the species level (Levin 2005), or the development of a market economy in laissez-faire political systems. Participation of local residents in managing their own resources also may be viewed as a form of self-organization and can lead to adaptive learning and eventually greater resilience (Olsson, Folke et al. 2004). For example, following a hurricane on the island of Montserrat, local people undertook development projects such as building a community center and implementing new farming practices (Vale and Campanella 2005), and refugees living in camps in Somalia and Kenya learned new methods of growing food which they took back to their communities following resettlement (Smit and Bailkey 2006). Community forestry post-Katrina also provides an example of local people reclaiming blighted areas in cities, and thus embodying a form of community-based self-organization that presents an alternative to dependence on formal institutions (Folke, Carpenter et al. 2002). Volunteer community foresters engaged in tree planting and similar activities also may create or join advocacy groups to conserve the trees and urban forests they have planted. Throughout this process, they may be learning adaptively from their forestry and advocacy activities (Gunderson, Carpenter et al. 2006).
PROPRIETARY INFORMATIONUse or disclosure of data on this page is subject to restrictions

Walker and Salt (2006) list nine rather than three attributes that we would expect to find in resilient socio-ecosystems, including diversity, ecological variability, modularity, tight feedbacks, social capital, innovation, overlap in governance, and ecosystem services. We can envision some of these additional attributes playing a role in community forestry in New Orleans. For example, the civic ecology practices that emerged to address how to care for damaged trees can be considered an “innovation,” and individuals who are engaged in tree planting and caring for trees may have built new social networks and become leaders in civic associations, both of which are aspects of social capital. Further, the involvement of both non-profit organizations and government agencies in tree planting and caring for trees represents overlap in governance, and the trees themselves enhance diversity and ecological variability, as well as provide ecosystem services.
Functionally, resilience can be visualized by understanding basins of attraction and the adaptive cycle. They are covered here in brief and in the order listed. Basins of attraction help to understand the state of a system as a marble rolling on a ridge between multiple bowls (or basins), or somewhere inside one bowl or another. The above graphic depicts four important characteristics of this understanding. The first is latitude, or the maximum amount the system can be changed before losing its ability to reorganize within the same state. In essence it is the width of the stability domain or the basin of attraction. Wide basins mean a greater number of system states can be experienced without crossing a threshold (L, Fig. 2). The second, resistance, is the ease or difficulty of changing the system; deep basins of attraction indicate that greater disturbances (forces or perturbations) are required to change the current state of the system away from the attractor (Fig. 2; R, or more accurately, higher ratios of R:L). The third, precariousness, is how close the current trajectory of the system is to a threshold that, if breached, makes reorganization difficult or impossible (Pr). And fourthly, cross-scale relations or panarchy is how the above three attributes are influenced by the states and dynamics of the (sub) systems at scales above and below the scale of interest. The resilience of a system at a particular focal scale will depend on the influences from states and dynamics at scales above and below.
3.3.1 The Adaptive Cycle
The notion of the adaptive cycle has played an important role in organizing and disseminating ideas about resilience (Gunderson and others 1995; Gunderson and Holling 2001). In the following I borrow heavily from Gunderson as well as Carpenter and his colleagues’ excellent summary of these concepts (Carpenter, Walker et al. 2001). According
PROPRIETARY INFORMATIONUse or disclosure of data on this page is subject to restrictions
http://www.ecologyandsociety.org/vol9/iss2/art5/

to the theory of the adaptive cycle, dynamical systems such as ecosystems, societies, corporations, economies, nations, and social-ecological systems do not tend toward some stable or equilibrium condition. Instead, they pass through the following four characteristic phases; rapid growth and exploitation (r), conservation (K), collapse or release (omega) “creative destruction”, and (alpha) renewal or reorganization.
A key feature of the adaptive cycle metaphor in the resilience literature is the existence of relatively brief periods during which major changes occur—the Omega and the Alpha phases. The former is a period of rapidly collapsing dynamics following a major perturbation during which some components and attributes of the system may be lost (species, memory). It is succeeded by a period of reorganization, the Alpha phase, during which novelty can arise (new species, new institutions, new ideas and policies, new industries). In the following r phase, the system settles into a new trajectory in a well-defined basin of attraction. During the long, slow progression from r to K, there is a diminishing likelihood that any further novelty will arise, although the system may become more complex as new connections are solidified. Resilience changes throughout the adaptive cycle, and different aspects of resilience assume prominence at particular phases of the cycle (Gunderson and Holling 2001). Most resilience scholars view the adaptive cycle as a useful metaphor and not as a testable hypothesis. The history of interactions between humans and nature includes many cyclic patterns (Gunderson, Holling et al. 1995; Redman 1999).
Definition of the r, K, Omega, and Alpha phases arose from the need to classify regimes that are commonly seen in resource management systems (Holling 1986; Gunderson, Holling et al. 1995). Resilience scholars have found it useful to classify these stages, just as biologists classify life-cycle stages that recur in species after species. These scholars believe that if the adaptive
PROPRIETARY INFORMATIONUse or disclosure of data on this page is subject to restrictions
FIG 3A. The adaptive cycle in its simplest form.http://www.resalliance.org/570.php
FIG 3B. The adaptive cycle, showing phases, “potential” and “connectedness” axis, and tipping points. http://rs.resalliance.org/wp-content/uploads/2007/02/4box-adaptive-cycle.gif
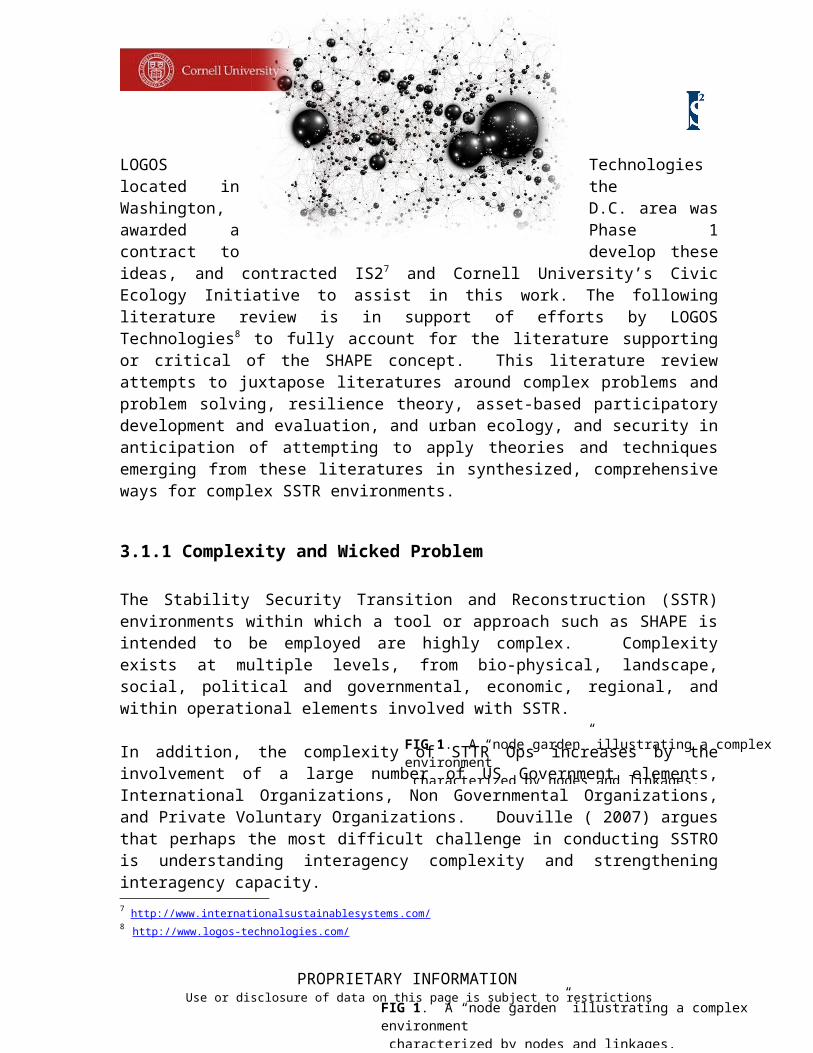
cycle is productive of ideas, it will generate testable explanations of SES dynamics that turn out to embrace a wide range of situations (Carpenter, Walker et al. 2001). Thus, resilience scholars have adopted a view of scientific progress similar to the one proposed by Hull (Hull 1988), in which theory itself is rarely tested directly, and in fact may not be testable in any definitive way. Instead, its success is measured by the utility of the concepts in terms of their ability to influence the research topics chosen by scientists and stimulate productive hypotheses. According to Hull (1988), progress in the definition of concepts is central to advancement of science. Given this view, we can expect resilience scholars to continue efforts to clarify the definition of resilience used in the adaptive cycle.
3.3.2 Panarchies
Lance Gunderson and C. S. Holling use the term “panarchy” in their 2001 book Panarchy: Understanding Transformations in Systems of Humans and Nature (Gunderson and Holling 2001). The publisher describes the book’s theory thusly:
“Panarchy, a term devised to describe evolving hierarchical systems with multiple interrelated elements, offers an important new framework for understanding and resolving this dilemma. Panarchy is the structure in which systems, including those of nature (e.g., forests) and of humans (e.g., capitalism), as well as combined human-natural systems (e.g., institutions that govern natural resource use such as the Forest Service), are interlinked in continual adaptive cycles of growth, accumulation, restructuring, and renewal.” 14
By way of review, characteristics of the resilience conceptual framework include:
1. multiple metastable regimes. Rather than a single equilibrium point, such systems generally have multiple metastable regimes. Within each regime, change may occur, but the set of dynamically important variables and interactions remains fixed.
2. the importance of episodic change. Systems with multiple metastable regimes may switch rapidly between them as critical thresholds are passed. Furthermore, hysteresis is common.
3. resilience. Holling and Gunderson define ecosystem resilience as “ ... the magnitude of disturbance that can be absorbed before the system changes its structure by changing the variables and processes that control behavior.” Resilience in this sense is central to the resilience conceptual framework.
4. multiple distinctive scales with cross-scale interactions. Holling et al. (2002c:72) argue that ecological and social-ecological systems form a
14 Island Press Bookstore description of Gunderson and Holling's Panarchy .
PROPRIETARY INFORMATIONUse or disclosure of data on this page is subject to restrictions

multilevel hierarchical structure, but that the different levels are of distinct kinds, i.e., the structure is not scale-free.
3.3.3 The Adaptive Cycle Metaphor
The characteristics of the adaptive cycle metaphor include: 1. a four-phase adaptive cycle. Holling and Gunderson (2002:32) suggest
that most, although not all, such systems follow a four-phase cycle of (1) “exploitation” (r); (2) “conservation” (K); (3) “release” (Ω) or “creative destruction,” a term derived from Schumpeter (1943); and (4) “reorganization” (α). The first two stem from standard ecological theory, in which an ecosystem’s r phase is dominated by colonizing species tolerant of environmental variation and the K phase, by species adapted to modulate such variation. However, Holling and Gunderson (2002) say that “ ...two additional functions are needed.” The corresponding phases, especially Ω, are typically much briefer: in a forest, Ω might be a fire or insect outbreak that frees nutrients from biomass, whereas the α phase involves soil processes limiting nutrient loss. The adaptive cycle involves changes in three main variables: resilience; potential in the form of accumulated resources in biomass or in physical, human, and social capital; and connectedness, meaning the tightness of coupling among the controlling variables that determine the system’s ability to modulate external variability. In the r phase, potential and connectedness are low but resilience is high; in K, resilience decreases while the other values increase. Eventually, some internal or external event triggers the Ω phase, in which potential crashes; finally, in α, resilience and potential grow, connectedness falls, unpredictability peaks, and new system entrants can establish themselves. Holling and Gunderson (2002) stress that the adaptive cycle is a metaphor that can be used to generate specific hypotheses; exact interpretations of resilience, potential, and connectedness are system dependent.
2. panarchy. Ecological and social-ecological systems form nested sets of adaptive cycles. The larger, slower cycles generally constrain the smaller, faster ones and maintain system integrity, but, during the Ω and α phases, critical cross-scale interactions can operate, particularly “Revolt” connections, in which an Ω phase collapse on one level triggers a crisis one level up, and “Remember” connections, in which the α phase of a cycle is organized by a higher-level K phase. The Revolt and Remember forms of cross-scale interaction, and panarchy itself as described in Holling et al. (2002c), assume that the hierarchically related systems are following adaptive cycles.
PROPRIETARY INFORMATIONUse or disclosure of data on this page is subject to restrictions

3. three distinct kinds of change. Holling et al. (2002a) identify three types of change within panarchies: incremental change in the r and K phases, which are smooth and fairly predictable; abrupt change in the transitions from K through Ω and α; and transformational learning, meaning change involving several panarchical levels, and interaction between different sets of labile variables.
3.3.4 Feedback Loops
The idea of feedback loops -most widely applied in control technology -is that the output of a system affects the next input and so on. This is how trends are created (Richardson 1986). In 1975 Levin, Roberts and Hirsch best captured the common definition of a positive feedback loop as one in which ‘an initial change in any factor eventually induces further self-change in the original direction (Levin, Roberts et al. 1975).
A few people wear a certain brand of clothing, and more people see the clothing and wear it themselves. Still more people see the brand, now that many more people are wearing it, and so on, until virtually everyone is wearing this one brand of clothing. This is a ‘positive’ (that is, self-amplifying, as opposed to a value judgment) feedback loop, because it is self-reinforcing. Tautologically, the more people buy the brand, the more people buy the brand. Positive feedback loops can also be highly destructive and, left unchecked in physical systems, can have catastrophically destabilizing effects. In the development context, a positive feedback loop can reinforce destructive behavior, such as deforestation, crime or violent conflict, just as it can reinforce constructive behavior, such as economic activity, environmental conservation and racial tolerance. Without positive feedback loops growth, be it economic, social or physical, may not take place.
Examples in Montserrat, Africa, and New Orleans provide useful case studies illustrating the power of positive feedback loops, which are also an important concept in resilience theory. In taking the initiative to manage local natural resources, people acquire skills and new knowledge, and apply them to enhancing community development, food security, and the local environment. This, in turn, should create a system that is more resilient in the face of a new disturbance or disaster (Tidball and Krasny 2008).
One challenge for planners is how to foster local leadership and action leading to positive feedback loops that enhance resilience. This is in contrast to some post-disaster or post-conflict interventions that result in destructive feedback loops, such as when lack of meaningful employment opportunities for men leads to violence, which in turn leads to destruction of infrastructure and even fewer employment opportunities (Tidball and Krasny 2007; Weinstein and Tidball 2007).
PROPRIETARY INFORMATIONUse or disclosure of data on this page is subject to restrictions

Building resilience through nurturing diversity, self-organization, adaptive learning, innovation, and constructive positive feedback loops is consistent with calls for a shift in disaster relief thinking from identifying what is missing in a crisis (needs, hazards, vulnerabilities) to identifying the strengths, skills, and resources that are already in place within communities (IFRC 2004). Applied to New Orleans, this would imply that policies should help foster the positive civic activity associated with tree planting. However, tools and policies that are consistent with asset-based approaches to building resilience in cities are often lacking.
3.3.5 Measuring Resilience
Carpenter et al (Carpenter, B. Walker et al. 2001) point out two issues that face researchers trying to develop measures of resilience. First, it is critical to define resilience of what, to what? Second, whereas several direct measures of socio-ecosystem resilience have been developed, they are difficult to implement (Carpenter et al 2001). Thus most studies focus on measuring indicators of resilience. For example, drawing from Walker and Salt (2006), one can assume that innovations are an indicator of social resilience, and biological and landscape diversity are indicators of ecosystem resilience. Thus, if one were to measure innovation and diversity, s/he would have at least a partial measure of resilience of the socio-ecological system.
Carpenter et al. (2001) include both ecological and social indicators of resilience in their research. Similarly, international development professionals attempting to measure resilience in developing countries have integrated sustainable livelihood and environmental management factors that may foster resilience in the face of climate change (Elasha, Elhassan et al. 2005). However, most resilience measures used by government authorities and researchers in developed countries are limited to social indicators of resilience. For example, the Auckland Region Civil Defense Emergency Management Group in New Zealand has defined social resilience as the capacity of people, communities and organizations to adapt to, manage, and learn from the demands, challenges and changes encountered during emergencies, and has identified 11 social measures for their model of resilience (e.g., community participation, leadership, social support; see (Paton, Daly et al. 2006). Similarly, researchers at the Multidisciplinary Center for Earthquake Engineering Research define resilience as “the ability of social units (e.g., organizations, communities) to mitigate hazards, contain the effects of disasters when they occur, and carry out recovery activities in ways that minimize social disruption and mitigate the effects of future disasters,” and have identified four dimensions of resilience: the technical, organizational, social, and economic (Bruneau, S. E. Chang et al. 2003). Finally, measures used in the “Toolkit for Health and Resilience in Vulnerable Environments” are clustered into four categories: built environment, social capital, services and institutions, and structural factors (Prevention Institute 2004). There is a need for measures of resilience that integrate these social indicators with ecological indicators.
PROPRIETARY INFORMATIONUse or disclosure of data on this page is subject to restrictions

In closing the section on resilience, we can think about what the case of New York City’s response to 9/11 can tell us about resilience or, stated more generally, about socially constituted adaptability to unpredictable ambient forces. Kendra and Wachtendorf, in their article “Elements of Community Resilience in the World Trade Center Attack” (Kendra and Wachtendorf 2001) describe it thusly:
Clearly, an organization involved in emergency response wants to maintain the established and known aspects of its operations, such as policies, procedures, practices, or tools. Yet, as illustrated by the World Trade Center attack, such organizational features can fail or prove inadequate to deal with the emerging disaster situation. It is at these times that resilience proves instrumental for bolstering effective response efforts. We see from New York that craftsmanship with respect to problem solving, almost an artisanal quality, allows people to deploy rapidly adaptive strategies. Like any craftsmanship, activities associated with emergency response derive from training, experience, and the ability to become inspired by features in the surrounding environment and to translate those inspirations into creative and innovative actions (emphasis added). Inspiration here is not meant in an ephemeral sense. Instead, it implies that the craftsman has taken note of a feature or features in the surrounding environment, engaged in a cognitive process of interpretation of that feature to produce a vision of a new goal or a previously unthought-of way to achieve an existing goal, and redirected his or her actions. Just as an artist may employ a new tool, new material, or new strategies, so too do decision makers in a resilient organization invoke new tools, materials, and strategies to rebound when established methods fail or when unanticipated circumstances arise. In both cases, training and preparation remain fundamental, but creative thinking, flexibility, and the ability to improvise in newly emergent situations are vital.
3.4 Systems and Ecology- Why consider the biophysical domain?
The Logos Team was intrigued with the ideas above regarding system dynamics, resilience theory, the usefulness of feedback loops and other system characteristics when attempting to solve “wicked problems,” but wanted to be sure there were truly cross-disciplinary applications by asking the question “Why should SSTR planners consider the biophysical domain?” The following is a review of the literature that makes the case for such consideration, but does not include a critical review of the literature that counters claims regarding the efficacy of notions such as “environmental security.”
PROPRIETARY INFORMATIONUse or disclosure of data on this page is subject to restrictions

3.4.1 Social-Ecological Systems
The figure above depicts systems originating in human culture and society, comprised of individuals, groups, networks, and institutions (rules, regulations, procedures) intervening to obtain goods and services from ecosystems. Actions and interventions include the removal or planting of vegetation, harvest of animals, irrigation of landscapes, and construction of systems to control floods, but may also include more beneficial interventions such as “civic ecology” practices (Tidball and Krasny 2007) such as biodiversity protection, conservation and restoration activities, including urban community forestry (Tidball 2008). These interventions directly and indirectly modify ecosystem structure and function.
3.4.2 Urban Ecology, Urban Conflict
“Ecology provides much of the base for urban conflict. It is the matter through which urban regimes reorganize themselves, with which elites embroider their projects of state and market control. Yet it is also the basis—forever rejuvenated in new waves of subversive urbanism—for a new urban political ecology strongly articulated with projects of emancipation, democracy, and justice”(Desfor and Keil 2004).
PROPRIETARY INFORMATIONUse or disclosure of data on this page is subject to restrictions
Fig. 4 Conceptual diagram of elements of a social-ecological system.

One way of looking at world history might be as a history of cities, if only because urbanization has been coexistent with that portion of human experience on earth that is commonly portrayed in world histories. It is relatively well understood that world urbanization is a key component of globalization. Therefore, a minimum of acquaintance with, if not the actual study of, urbanization and city interrelationships offers useful insights not just into the growth of a central form of human organization, but into world history itself (Modelski, G. 2005) And as we have been told, to know one’s past is to understand one’s future.15 Is the future an urban one?
The United Nations Report State of World Population 2004 offers this prediction about cities and urbanization:
... the ecological and sociological "footprint" of cities has spread over ever-wider areas, creating an urban-rural continuum of communities that share some aspects of each lifestyle. Fewer and fewer places on the planet are unaffected by the dynamics of cities.
To that end, United Nations Secretary-General Kofi Annan said at his inaugural address to Urban 21: Global Conference on the Urban Future: "We have entered the urban millennium. At their best, cities are engines of growth and incubators of civilization. They are crossroads of ideas, places of great intellectual ferment and innovation...cities can also be places of exploitation, disease, violent crime, unemployment, and extreme poverty...we must do more to make our cities safe and livable places for all." (Annan, K. 2000). At about the same time, the U.S. intelligence community convened a group of experts who predicted that by 2015, urbanization issues would emerge in the broader scheme of things as a component of major drivers and trends that will shape the world (National Intelligence Council, 2000).
Perhaps more disturbingly, in a World Policy Journal article published in 2004, the national security experts Peter Liotta and James Miskel argued that the ''failed state,'' which received so much attention in the 1990's, is being supplemented by the emergence of failed cities, where civil order succumbs to powerful criminal gangs (Stier 2004) (Liotta and Miskel 2004). With increasing urbanization the role of cities will be even more important to national and global security issues. Major incidents of social violence are mostly in cities and include civil war, urban terrorism, riots or street protests, and “external” warfare. The recent example of the destruction of Grozny, Chechnya is illustrative of the strategic value of cities and the consequent tragedy and reconstruction for the civilian population. Cities are focal points for terrorist activities. Within the U. S. during the last decade, tragedies in Oklahoma City and
15 David C. McCullough: History is a guide to navigation in perilous times. History is who we are and why we are the way we are. George Santayana: Those who cannot learn from history are doomed to repeat it.
PROPRIETARY INFORMATIONUse or disclosure of data on this page is subject to restrictions

New York emphasized the future problems of terrorism affecting the increasing numbers of our citizens living in cities.
According to these scholars, “there has been a significant lack of concern for the potential emergence of failed cities. This is somewhat surprising, as the feral city may prove as common a feature of the global landscape of the first decade of the twenty-first century as the faltering, failing, or failed state was in the last decade of the twentieth” (Norton 2003). Furthermore, urban conflict experts contend that “the city is and long has been, the ontological heart of conflict. City wars and wars among cities is a 5,000 year history, dwarfing the 300 years clocked up by the modern territorial state” (Stanley, B. 2003). Add to this recent events where we can observe first hand major incidents of social violence occurring largely in cities and including civil war, urban terrorism, riots or street protests, and “external” warfare. The recent example of the destruction of Grozny, Chechnya is illustrative of the strategic value of cities and the consequent tragedy and reconstruction for the civilian population. Finally, as we have experienced tragically experienced recently, cities are focal points for terrorist activities. Within the U. S. during the last decade, tragedies in Oklahoma City and New York emphasized the future problems of terrorism affecting the increasing numbers urban residents.
Armed conflicts and natural resources can be directly related in two main ways: armed conflicts motivated by the control of resources, and resources integrated into the financing of armed conflicts. Although few wars are initially motivated by conflict over the control of resources, many integrate resources into their political economy. While it would be an error to reduce armed conflicts to greed-driven resource wars, as political and identity factors remain key, the control of local resources influence the agendas and strategies of belligerents. However, if environmental degradation can trigger conflict, controversy, and violence, then environmental cooperation may have potential as a peacemaking tool. As Dabelko and Conca (Dabelko and Conca 2002) argue in their book Environmental Peacemaking, the environment offers some useful, perhaps even unique, qualities that lend themselves to building peace and transforming conflict. For example, they posit that though cross-border environmental cooperation is often difficult to achieve, where it does take root across such boundaries, it may help to enhance trust, establish cooperative habits, create shared regional identities around shared resources, and establish mutually recognized rights and expectations. They also describe “environmental peacemaking” in terms of use of cooperative efforts to manage environmental resources as a way to transform insecurities and create more peaceful relations between parties in dispute. In either case, it would appear that factoring in environmental attributes is of significant importance for any SSTR planning.
So, to the question should study and focus upon urban environments, the answer appears to be yes because “a holistic understanding of cities is important to national and global security” (Heiken and Valentine 2000), but what should the research agenda be? According to G. S. Cheema, of the United Nations Development Program, “The urban research agenda should focus on the identification of innovative approaches to deal with the complex issues in urban management and on strengthening national capacities to plan and implement urban
PROPRIETARY INFORMATIONUse or disclosure of data on this page is subject to restrictions

development programs” (Fuchs 1994). The implication is that the scientific community needs to further embrace urban systems as an important and credible field of research. Likewise, there is an increasing call for those involved in development and humanitarian assistance, as well as militaries and intelligence organizations, to better understand cities (Bartone 1994). According to members of the Urban Security Team at the Los Alamos National Laboratory:
“...the major research problems lie in understanding the interdependencies of the natural and human systems that comprise a city. Understanding an urban system requires an approach that integrates physical processes, economic and social factors, and nonlinear feedback across a broad range of scales and disparate process phenomena... we must continue interdisciplinary, inter-divisional research and add in more of the human dimension, with research that integrates the social, behavioral, and economic sciences into our projects” (see http://www.ees.lanl.gov/pdfs/urban_sec.pdf ).
How did cities become what they are today? We know that “the ancient city was primarily a fortress, a place of refuge in time of war. The modern city, on the contrary, is primarily a convenience of commerce, and owes its existence to the market place around which it sprang up. Industrial competition and the division of labor, which have probably done most to develop the latent powers of mankind, are possible only upon condition of the existence of markets, of money, and other devices for the facilitation of trade and commerce.” (Park, Robert E. 1925). In purely etymological terms, the word urban is an adjective used to describe that which is: (1) of, relating to, or located in a city or (2) characteristic of the city or city life.16 Urbanization, then, is the product of this culmination of city attributes.
The phenomena called “Urbanization” has increased steadily over the past forty thousand years of human settlement history and has dramatically risen in the past forty years (Small, C. 2001) (Desfor, G. and R. Keil, 2004.).These urban areas are blamed for a host of environmental ills, from global warming to the destruction of coral reefs (Buttenwieser, A.L. 1987) (Wille, L.W. 1991) (Vileisis, A. 1997) (Kennedy, L.W. 1992). Yet, while cities or urbanized areas are often thought of as “bad for the environment,” in many ways, concentrating large numbers of people is positive (Sherlock, H. 1991). Land use and energy consumption per person is often lower, while waste treatment systems benefit from economies of scale. Public transportation systems may reduce use of individual vehicles 17.
Cities are not, on the other hand, always a positive experience for those living in them – we often hear about how urban dwellers suffer from air and noise pollution as well as lack of access to open space and fresh food. And we are increasingly aware of the fact that urban dwellers often live in neighborhoods with high crime rates and poor schools.
16 The American Heritage Dictionary. The actual etymology of the word is: Latin urbanus, from urbs , urb-, city17 See proceedings for three consecutive International Conferences on Urban Regeneration and Sustainability for discussion on these themes. http://www.culturescope.ca/ev_en.php?ID=3902_201&ID2=DO_TOPIC
PROPRIETARY INFORMATIONUse or disclosure of data on this page is subject to restrictions

Regardless of their perceived benefits and problems, there is no way around the fact that cities are an increasingly important factor in the environment and in the world as a whole – almost 50 % of the world’s population lives in them. (Brunn, S., et al , 2003). In the US, nearly 80% of the population lives in cities. The percentage of urban dwellers is growing much faster than the population. (Parlange, M. 1998). Globally, the number of people living in mega-cities—those containing more than 10 million inhabitants—will double to more than 400 million. According to intelligence analysts, the implications of this growth are: (1)Urbanization will provide many countries the opportunity to tap the information revolution and other technological advances, and (2) the explosive growth of cities in developing countries will test the capacity of governments to stimulate the investment required to generate jobs and to provide the services, infrastructure, and social supports necessary to sustain livable and stable environments (National Intelligence Council, 2000).
Though the fields of urban history and of environmental history are both relatively new and apparently disparate subfields of American history (Tarr, J. 2005), there can be no doubt of their relatedness. Cities are founded in locations where nature offers various attractions, such as on coastlines where the land's contours created harbors, on lakes, rivers, and streams and springs that could be used for transportation, water supplies, and waste disposal, and in fertile watersheds with extensive food and animal resources.18 Cities have always placed demands on their sites and their hinterlands. The construction and inhabitation of these built environments tended to “loosen the bonds that connect its habitants with nature and to transform, eliminate, or replace its earth-bound aspects, covering the natural site with an artificial environment that enhances the dominance of man (sic) and encourages an illusion of complete independence from nature” (Lewis, M. 1956). Thus urbanization resulted in a built environment that both replaced the previously occurring natural environment and created new environments and local micro-climates, with different temperature gradients and rainfall and wind patterns than those of the surrounding countryside (W. B. Meyer 1991) (H. E. Landsberg 1981).
A review of the literature dealing with urban areas and the environment has identified five primary themes: (1) the study of the impact of the built environment and human activities in cities on the natural environment; (2) the study of societal responses to these impacts and efforts to alleviate environmental problems; (3) exploration of the effect of the natural environment on city life; (4) analysis of the relationship between cities and an ever widening hinterland; and (5) the investigation of gender, class, and race in regard to environmental 18 For further reading on urban origins, city site location selection, ancient cities, etc see the following: Liebeschuetz, J.H.W.G. 2001. “The Uses and Abuses of the Concept of ‘Decline’ in Later Roman History.” Journal of Roman Archaeology, Supplementary Series 42: Recent Research in Late-Antique Urbanism, ed. Luke Lavan, 233-245. Responses by Averil Cameron, Bryan Ward-Perkins, Mark Whittow, and Luke Lavan.McIntosh, Roderick J. 2000. “Clustered Cities of the Middle Niger: Alternative Routes to Authority in Pre-History.” In David M. Anderson and Richard Rathbone, eds., Africa’s Urban Past, 19-35. Portsmouth, NH: Heinemann.Schepens, Guido. 2001. “Ancient Greek City Histories: Self-Definition Through History Writing.” In Kristoffel Demoen, ed. The Greek City From Antiquity to the Present, 3-25. Louvain, Paris: Peeters Publishing.Stille, Alexander. 2002. The Future of the Past. Introduction (ix-xxi). New York: Farrar, Straus, and Giroux.Sumner, William M. 2003. Early Urban Life in the Land of Anshan: Excavations at Tal-E Malyan in the Highlands of Iran. Philadelphia: University of Pennsylvania Museum of Archaeology and Anthropology. Introduction, 1-4.
PROPRIETARY INFORMATIONUse or disclosure of data on this page is subject to restrictions

issues ( Bernhardt, C. forthcoming). Other portions of this report delve more deeply into focusing on urban landscapes using “ecosystem lenses” for the purposes of elucidating both ecological systems concepts potentially applicable to SSTR planning and to further review arguments about urban considerations more generally in SSTR contexts.
3.5 Conclusions
This literature review has attempted to thoroughly explore literatures around complex problems and problem solving, resilience theory, feedbacks and the adaptive cycle, asset-based participatory development and evaluation, and urban ecology, vulnerability and security. These diverse topics have been reviewed in such a way as to both summarize salient points for application to SSTR contexts, as well as synthesize points of theoretical and applied “linkage.” The challenge presented with a literature review such as this is to appropriately select seminal writings and scholarship that accurately capture transferable thinking and technique. We trust the reader of this review will see clearly the strand of “Stakeholder Asset-based Planning Environment” shaping in Security, Stability, Transition, and Recovery (SSTR).
The review has yielded a number of useful ideas and approaches in anticipation of attempting to apply theories and techniques emerging from these literatures in synthesized, comprehensive ways for complex SSTR environments.
PROPRIETARY INFORMATIONUse or disclosure of data on this page is subject to restrictions
4. SHAPE Software Architecture
The Logos Team has developed a software architecture that is the basis for implementing a software system to support the SHAPE asset-based planning process and methodology. This software architecture uses, in most cases, open source software applications to provide functionality to support the asset-based planning process. In a few cases, we suggest commercial off-the-shelf (COTS) software because it provides a more robust capability than we could identify in surveying the open source repositories.
Software to implement the functional capabilities to support the asset-based planning process and methodology will have to be developed anew. While some tools provide functional support, the unique nature of the process and methodology requires new software to be developed. Thus, we suggest two software development environments and recommend that software development be performed using the Java programming language as the most transportable language for developing software applications.
We have not addressed the design of the supporting SHAPE knowledge base nor specified a design for the user interface.
4.1 SHAPE System Architecture
Each element of the SHAPE Conceptual Architecture represents a stage in the end-to-end planning process. We have developed a SHAPE System Architecture, depicted in figure 4-1, that presents the coupling between each of these stages.
Each of the five rectangles represents a distinct subsystem that provides a capability for supporting the operations in that planning process stage. The subsystem maybe implemented by one or a small set of tools. The specific implementation of this capability will have to be determined by the SHAPE system development team.
The planning process begins in the upper left hand corner with Situation Awareness and proceeds to the lower left corner. Similar-colored rectangles represent coupled operations. The basic sequence is: Situation Awareness -> Objectives Specification -> Asset Specification -> Plan Generation -> Plan Assessment.
At two points, the planners will execute manual processes as they engage in participatory planning meetings with the indigenous leadership to seek local community input. Information gathered from these meetings and modifications to the evolving plan will be entered into the system. Design of the asset specification, plan generation, and plan assessment subsystems
PROPRIETARY INFORMATIONUse or disclosure of data on this page is subject to restrictions

should take account of this manual interaction and provide support for entering local population comments into the SHAPE knowledge base and the evolving plan.
Figure 4-1. SHAPE System Architecture
Table 4-1 represents the mapping from the SHAPE Conceptual Architecture, depicted in the conceptual planning process for the SHAPE System Architecture. The leftmost column represents the Conceptual Architecture stages while the 1st column from the left represents the System Architecture stages. In this system architecture, we have collapsed classic and dynamic planning into a single stage. We did so because automated tool support for individual stages would be duplicative and we believed that treating these activities as a single process makes more sense in a system implementation.
Table 4-1. Mapping from Conceptual Architecture to System Architecture
Conceptual System Conceptual System
PROPRIETARY INFORMATIONUse or disclosure of data on this page is subject to restrictions

ArchitectureStage
ArchitectureStage
ArchitectureActivities
ArchitectureTechnology
Background Situation Assessment Prior/ExistingAssessments;Morphological Analysis;SystemCharacterization
Foundation OntologyRule-Based SystemVisualization Tools
Objectives Strategy/ObjectivesGeneration
Issued Objectives;Developed Objectives;Strategic, Operational,Tactical Flow-down
Foundation Ontology;Adapted AutoMAP;Rule-Based SystemVisualization Tools
Asset/Participatory Analysis
Asset Specification Experts Engagement;SWOT Analysis;Charrette Activity;Survey/Polling Results
Foundation Ontology;Rule-Based SystemVisualization Tools
Classic PlanningDynamic Planning
Plan Generation Courses of Action;Tasks Defined, Negotiated, Sequenced;Critical Path Analysis;Feedback Loops & Catalysts;Resilience Estimates;Anticipatory Modeling
Foundation Ontology;Rule-Based SystemSystem DynamicsOther Models TBD
Plan Completion Plan Assessment Revised Planning;Assessment Planning;Participatory Analysis
Foundation Ontology;Rule-Based System; Adapted MPICEVisualization Tools
4.2 Technical Challenges
The complexity of the asset-based planning process and the resulting system architecture offer several technical challenges to the implementation of a semi-automated system. This section describes these issues and the technical approaches to be used to implement the automated system supporting SHAPE asset-based planning. The primary challenge is to develop a computer-based capability that allows the analyst to flow seamlessly through the stages of the asset-based planning process. The key to seamless planning is to develop an integrated, foundational knowledge structure that supports each of the SHAPE process stages, and provides a unifying representation and repository for information.
PROPRIETARY INFORMATIONUse or disclosure of data on this page is subject to restrictions

4.2.1 Asynchronous Collaboration Support
The Logos Team assumes that situations arise abruptly that need quick responses. The responding team will be assembled, perhaps hastily, from a set of personnel based on the initial perception of the precipitating event(s). Responses to such events demand the combined actions of people in a network of multiple organizations with no common authority, who must cooperate and collaborate. Such hastily formed networks (HFNs) generally have these characteristics (http://www.nps.edu/cebrowski/HFN.html):
· The precipitating event may not fit neatly into a known category. There may have been no advance planning, training, or positioning of equipment.
· Decision-makers and responders are overwhelmed. No one person understands the full situation or knows what to do.
· Available resources are likely to be insufficient and personnel are overwhelmed by the magnitude of the event. Personnel may not have adequate training in planning and decision-making.
· Multiple agencies will need to cooperate in the response, including military, civilian government, and private organizations. These groups may have had little or no prior reason to collaborate. The shock of moving from a state of "coexistence" to a state of "collaboration" can be overwhelming.
· The response will be distributed over a geographical area into many local jurisdictions. The authority to allocate resources and reach decisions is distributed among many organizations. Decisions by command-and-control do not work.
Thus, asset-based planning will occur through a collaborative process among a spatially and temporally distributed set of participants. We assume that each participant will have his own workstation or terminal connected to the SHAPE system. Connections may be through local LAN, across the Internet, or via some other government or civilian agency network. We make the following assumptions about user interaction with the system:
· Although some users may be physically collocated, each user may enter data and information into the system using the current stages tools at any time during the planning process.
· Each user should be able to work in any of the stages subject to the work flow restrictions.
· Each user should have his own repository of data and information for his work.· Each user may enter data into his repository or contribute to the group planning
repository.· When a user feels that a stage has reached a level of maturity, he can vote to move to
the next stage.
PROPRIETARY INFORMATIONUse or disclosure of data on this page is subject to restrictions

Managing concurrent user interactions and contributions to the knowledge base at each stage requires collaboration support tools to ensure that users do not “step on” each others contributions. Users must be able to manage their own private workspaces as well as access and contribute to the shared workspace.
Our assumption regarding workflow is that the set of participants will work on one stage at a time, beginning with stage 1. The team will transition to stage 2 only when a majority of the participants have voted a consensus view on the current stage’s activity. For example, this means that a simple majority must vote that the situation description to be created in stage 1 represents a true and fair assessment that the majority agrees to.
Additionally, the collaboration support tools must record the derivation of all knowledge entered by the users or created by the software subsystems.
4.2.2 Situation Assessment
Situation awareness involves perceiving critical and essential factors in the environment that affect or perturb the situation. If we understand those factors, their interrelationships, and their affect upon the situation we can understand how to ameliorate them to mitigate their effect. The user also needs to understand their relation to the operator's goals, and at the highest level, an understanding of what will happen with the system in the near future. (Endsley 2001) It consists of both an operational component and an environmental component. The environmental component includes regional and global elements such as cultural and political factors, potential flashpoints, and centers of gravity. To properly describe a situation, the following information is required:
· Domain knowledge about the region and its environment to include actors – people, groups, and organizations; their attributes; and their relationships.
· Events that have occurred or are likely to occur; their attributes, such as time, place, relevant actors, type, etc.; and their causal relationships and Historic context.
· Biophysical, landscape, and related resource implications, as well as linkages to above.
An assessment is a data-gathering exercise. It should provide as comprehensive a picture as possible within the time limitations of the unfolding and evolving situation. But, it produces a snapshot from which a response will be developed.
When time frames are short, a rapid assessment procedure should be used which is a subset of the typical situation assessment process. Rapid assessments are fluid and practical, with each round of findings shaping the next set of questions.
PROPRIETARY INFORMATIONUse or disclosure of data on this page is subject to restrictions

Awareness is a continuing process during an evolving situation. Data and information will be derived from a variety of sources – some electronic and some human. Both types must be incorporated into the SHAPE knowledge base.
4.2.3 Strategy and Objectives Generation
Strategic planning is the process of specifying an organization's vision, goals and objectives, developing policies and plans to achieve these objectives, and allocating resources to them. Performance management builds upon this foundation by collecting, assessing, communicating the progress achieved toward achieving the organization’s goals and objectives.
The US Government Accountability Office (GAO) noted that in order for strategic goals and objectives to be effectively communicated and pursued in a consistent, repeatable manner, a common language is required. The vernacular must span the entire strategic management portfolio, including defining cause-and-effect relationships among strategic themes. This understanding can lead to strategic accountability and governance that assists organizations in achieving, measuring, and reporting their results.
Accordingly, a Community of Practice of government and industry personnel convened a working group under the oversight of the Chief Information Officer’s Council (CIO-C) to define a standard for strategy representation based on XML, StratML – Strategy Markup Language. The CIO Council has developed a model, depicted in figure 4-2, that integrates the six building blocks of the Government Performance Review Act (GPRA) and Strategic Planning and Performance Model (SPPM) process. This model depicts the elements that comprise WHAT an organization wants to achieve (objectives>goals>vision), HOW it wants to do so (projects>programs>mission), and TO WHAT DEGREE it is accomplishing, or has succeeded in attaining its targets (output metrics>outcome metrics>trend indicators).
PROPRIETARY INFORMATIONUse or disclosure of data on this page is subject to restrictions

Figure 4-2. Strategic Planning and Performance Model(http://www.xml.gov/stratml/)
The StratML Core Framework, depicted in figure 4-3, represents an initial framework for representing a strategic plans, goals, objectives, resources, and outcomes. While this framework is a work in progress, we believe it to be a useful starting point for representing strategic plan elements in support of SHAPE.
PROPRIETARY INFORMATIONUse or disclosure of data on this page is subject to restrictions

Figure 4-3. StratML Core Framework http://www.xml.gov/stratml/)
An initial specification for the StratML Core Structure is described at https://collab.core.gov/CommunityBrowser.aspx.html.
Clearly, the StratML framework is not adequate for the detail required to represent the SHAPE strategy and objectives. Thus, it must be extended to include more detailed elements for actionable plans.
A model used by the COCOM Theater Security Cooperation (TSC) Working Groups, depicted in figure 4-4, provides a basis for extending the StratML framework. It emphasizes a logical progression for planning activities. We recommend this approach because it has been actively applied within different COCOMs for several years. It was largely developed under the auspices of the PACOM J5 in conjunction with EUCOM’s J5. It takes into account a diverse array of activities to support the requirements represent the tactical plan.
PROPRIETARY INFORMATIONUse or disclosure of data on this page is subject to restrictions

Figure 4-4. Endstates To Requirements Decomposition
4.2.4 Ontology Foundation
An ontology is a general body of knowledge about a particular domain. It consists of categories, their descriptive attributes, and a set of relationships between the categories. An ontology can support reasoning about the events that occur within a domain. (Chandresekaran, Stephenson, and Benjamins 1999) In its most general form, an ontology is a multidimensional mesh-like structure consisting of nodes and arcs. Each node represents an ontological concept. A node is a data structure consisting of attributes. Some attributes are descriptive, some are relational. Relational attributes link a node to other nodes in the mesh. A node may have 0:N descriptive attributes and 0:M relational attributes. Relational attributes link one concept to another.
There is no commonly accepted definition of what constitutes an ontology. The definitions are diverse and do not specify content concretely. Two definitions that are relevant to our work:
“In computer science, an ontology is the product of an attempt to formulate an exhaustive and rigorous conceptual schema about a domain. An ontology is typically a hierarchical data structure containing all the relevant entities and their relationships and rules within that domain (e.g., a domain ontology). The computer science usage of the term ontology is derived from the much older usage of the term ontology in philosophy. “en.wikipedia.org/wiki/Ontology_(computer_science
A specification of a conceptualization of a knowledge domain. An ontology is a controlled vocabulary that describes objects and the relations between them in a formal way, and has a grammar for using the vocabulary terms to express something meaningful within a specified domain of interest. The vocabulary is used to make queries and assertions. Ontological
PROPRIETARY INFORMATIONUse or disclosure of data on this page is subject to restrictions
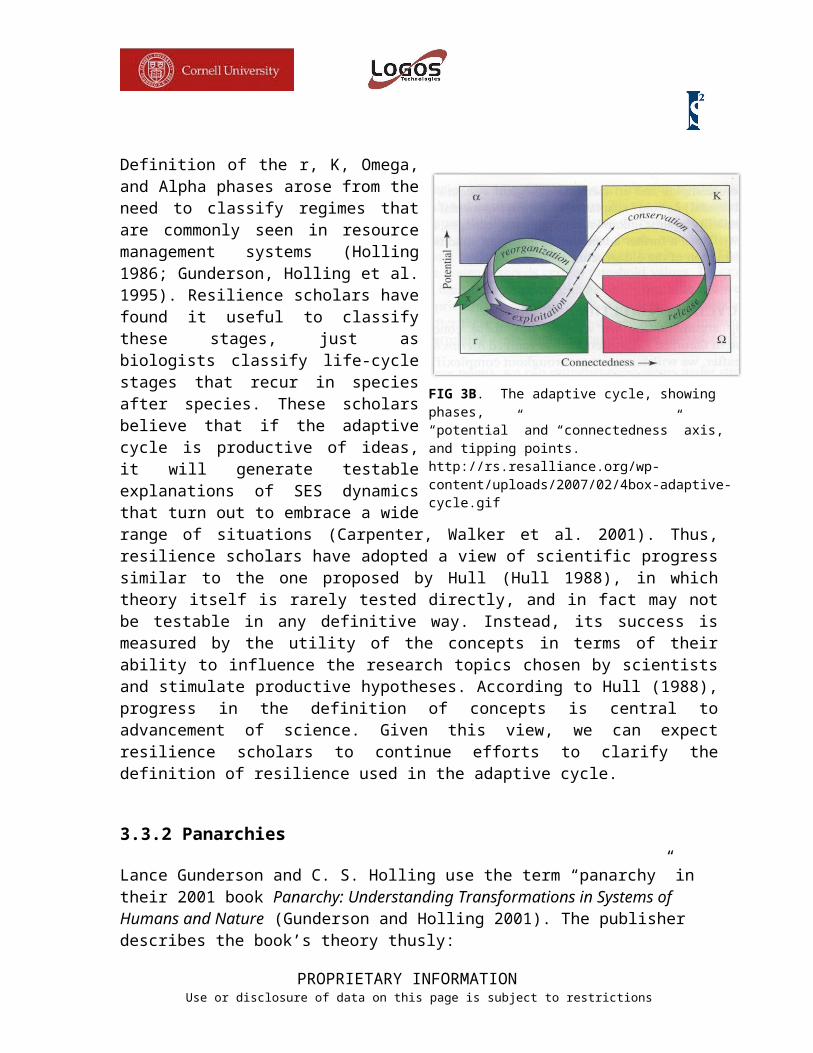
commitments are agreements to use the vocabulary in a consistent way for knowledge sharing. members.optusnet.com.au/~webindexing/Webbook2Ed/glossary.htm
The key to collaboration is a unified knowledge structure that provides a repository for information that can be used across the stages of the asset-based planning process. This knowledge can be represented in RDF/XML and stored in a relational database provided by the SCHOLAR application framework. The ontology represents shared knowledge and the relational database represents a common repository that would be accessible to all subsystems of the SHAPE system. It would act as a unifying medium of exchange of information between computers and users, between groups of users, and between two or more applications. That is, it would ensure that a common definition and description is used by all modules of the system.
Ontologies must evolve as the problem space and environment evolve. Static ontologies become less useful in domains where the problem space changes over time. Moreover, the way knowledge is represented in the ontology can pose a problem when trying to retrieve knowledge for use by an operational system. If a query is presented to the ontology knowledge base, it may be easy to answer if the knowledge sought matches the knowledge representation. On the other hand, a mismatch between query structure and knowledge representation may yield only partially useful knowledge. It can be uncertain what results a query might yield. This is the knowledge cliff problem: submitting a query is like stepping up to a cliff. You can either climb it (a useful result) or not. But, you don’t know what the result will be until you submit the query. Moreover, if a problem space changes over time and the ontology does not evolve, new queries based on the changing problem space may not yield useful results. Equally so, if an ontology changes in radical ways, but does not preserve previous structural information, a query may become unanswerable.
Thus, the SHAPE ontology will need to evolve to reflect the various situations, the emerging strategies, and the diverse set of resources and activities that will become part of the solutions. Continuing review of the ontology will need to be conducted throughout this project to ensure that it reflects the evolving process and methodology based on lessons learned through informal and formal demonstrations. Ontology review and improvement/enhancement must be embedded in the SHAPE process and methodology.
4.2.5 Planning
“You have a choice: you can either create your own future, or you can become the victim of a future that someone else creates for you. By seizing the transformation opportunities, you are seizing the opportunity to create your own future.” – VADM Arthur Cebrowski, NPGS
PROPRIETARY INFORMATIONUse or disclosure of data on this page is subject to restrictions

The asset-based planning process divides the actual planning or preparation process into a conceptual preparation stage and a dynamic analysis stage. In the conceptual preparation stage, a notional plan is created that consists of a structured set of tasks, actions, and decisions – possibly occurring concurrently – with types of assets and resources and constraints upon them assigned to specific elements of the plan.
Figure 4-5. Classic Planning Assumptions
Classical planning is the development of such a notional plan – a plan that has resource categories and sequences of actions. It is inherently descriptive rather than prescriptive and is often constrained by eight assumptions (Nau 2006). In reality, none of these assumptions ever holds, but they are useful assumptions for the initial plan development. As a result, once a notional plan is constructed, planning becomes a continuous exercise of asset and resource allocation, partial execution, and re-planning.
To create a plan that has relevance to the operational environment, realistic resources must be associated with notional resources. Time constraints and conflicts among the tasks must be resolved within an operational context. The planner’s cognizance of such a world is highly imperfect, much like, but less complex than, the game of Contract Bridge. In Contract Bridge, one does not know what cards the other players hold (except the dummy hand); there are many possible card distributions across the four hands. Thus, there are many possible ways for each game to be played because each of the three active players has many possible moves.
Nau (Nau 2000) has shown that encoding the possible distributions and moves in a game tree leads to an exponential explosion of possible outcomes. In the worst case, there are about 6 x
PROPRIETARY INFORMATIONUse or disclosure of data on this page is subject to restrictions

1044 leaf nodes, while the best case has about 1024 leaf nodes. Smith et al (1998) has applied Hierarchical Task Network (HTN) planning to the problem of playing Contract Bridge with considerable success. Bridge Baron 8, their Contract Bridge playing program, won the Baron Barclay World Bridge Computer Challenge, an international competition hosted in July 1997 by the American Contract Bridge League. Figure 4-6 depicts a partial plan for a finesse play (Nau 2006; Smith, S.S.J., D. Nau, and T. Throop 1998). This is meant to be illustrative of the number of alternatives and complexity that characterizes the kind of planning to be performed to support S&R operations.
Figure 4-6. Bridge Baron Finesse Play Example (Smith, Nau, and Throop 1998)
The entries in the blue and green leaf nodes represent explicit actions to be performed to accomplish the task. The topmost node represents the task to be accomplished and the light yellow nodes represent alternative ways to accomplish the task. These, of course, must be predefined as part of the domain knowledge. The planning objective is to seek the best solution, given the constraints, for accomplishing the task. In this case at this stage of play, West playing 2 leads to his partner East taking the trick with the Jack. This is apparently the best move for East at that point in the game. The key point here is that a properly constructed set of tasks and activities can be used to construct a suite of alternative plans which can be evaluated for the best results given the current situation and information.
The planning process seeks to decompose a set of tasks into solution graphs, as shown in the example above, and select the best or most satisfactory one. At each step of the solution
PROPRIETARY INFORMATIONUse or disclosure of data on this page is subject to restrictions

graph, there must be metric(s) that allow us to evaluate how well a particular action contributes to accomplishing the overall goal.
Planning for S&R operations is much more complex than the game of Contract Bridge. There is a greater diversity of objectives and goals varying constraints, a possibly larger number of participants, a greater diversity of assets and resources with variable ownership by the participants, varying constraints on resource and asset usage, and a much larger number of alternatives that need to be evaluated. Nevertheless, judicious choices can often reduce this problem to a manageable one. We know that it can be solved, albeit incompletely and with varying degrees of performance. However, through semi-automated AI planning systems, we can produce better plans that consider more factors and alternatives than humans alone can, because the system consider many more alternative constructs of the plan and, given specific measures to evaluate, assess and rank alternate paths.
Semi-automated planning tools can significantly enhance the actual planning process – both the notional planning and the dynamic planning. Planning tools can consider a broader array of alternative plans and develop ones based on participant-specified constraints. As participants assign specific resources and assets, time durations, and other parameter values, planning tools can quickly sift through the set of alternative plans to identify which are most viable under the given constraint set. The benefit of this approach is that participants can perform ‘what if’ analysis by varying the parameter’s value assignments to determine how different combinations affect a plan’s viability.
4.2.6 Plan Assessment
As a plan is developed, its course of action (COA) must yield positive outcomes that, at least, mitigate the situation, but, more importantly, improve the situation. When assessing the plan’s results, we must measure – either quantitatively or qualitatively – the outcomes and be able to determine how specific actions yielded those outcomes.
Our goal is to be able to determine the Return on Investment (ROI) due to incremental investments through resources and assets. Within the SHAPE process, the ROI is not about monetary profits, but is, for example, measured in terms of protecting human life, maintaining a nation’s stability, conserving a nation’s resources, or ensuring the security of a segment of the population.
Multiple metrics are useful, but often decision-makers require a single figure of merit for assessing a system. It is hard to assign specific, discrete values to many metrics. Exact values often contribute little to understanding how much a particular activity has contributed to improving the overall situation. Rather than precise quantitative equations yielding a numerical figure of merit, which can become the subject of intense debate, a more qualitative approach may be more useful. The Sustainability Institute has created a qualitative
PROPRIETARY INFORMATIONUse or disclosure of data on this page is subject to restrictions
representation based on consensus analysis for measuring the effect of foundation funding. Figure 4-7 depicts a graphical representation. (SI 2001).
Figure 4-7. Qualitative Indicator Presentation
Perhaps a better view would be a three-dimensional surface representation that presents to the participants the “bumpy” world that has multiple peaks and valleys. The system would be ‘located’ somewhere on the surface to indicate the current figure of merit.
4.3 SHAPE Functional Tools
Corresponding to the SHAPE System Architecture, we have developed a SHAPE Functional View that represents how the system would be integrated at the process level, which is depicted in figure 4-8.
The SHAPE knowledge base contains predefined data, the SHAPE ontology, and supporting data for the different functional subsystems. The ontology, represented in RDF/XML, will be translated into data structures in the rule-based system’s (RBS) working memory during initialization of the SHAPE system. The persistent storage for the SHAPE knowledge base will be stored in a MySQL database as that database management system is included as part of the SCHOLAR application framework.
PROPRIETARY INFORMATIONUse or disclosure of data on this page is subject to restrictions

As users enter data through the respective functional subsystems, where their interactions are mediated by the WorkFlow Manager and the Collaboration Support Tools, the data is stored in the SHAPE database. Selected data is translated into the RBS data structures and deposited into working memory.
Figure 4-8. SHAPE Functional View
The following sections describe semi-automated support for the SHAPE user interface and functional subsystems.
4.3.1 Workflow Manager
During SHAPE system operation, a Workflow Manager will control access to modules implementing the stages of the SHAPE process. Typically, the SHAPE system will begin operation in the Situation Assessment stage corresponding to stage 1. Systems users will be
PROPRIETARY INFORMATIONUse or disclosure of data on this page is subject to restrictions

restricted to operating within stage 1 until a majority of the users have voted to move on to stage 2. Voting will be managed by the Workflow Manager in that it will record each user’s notification that he has completed stage 1 interaction. When a majority of users have voted, indicating a consensus on the information entered into that stage, the Workflow Manager will enable access to the Strategy and Objectives Analysis tool corresponding to stage 2. A similar process will ensue until a majority of participants have voted to proceed to the next stage. This process continues until all stages have been exercised.
Table 4-2 presents a few of the Workflow Management tools that we have surveyed that are open-source, Java-based implementations.
Table 4-2. Workflow Management Tools
Tool Name/Website
Brief Description
Imixs Workflowhttp://sourceforge.net/projects/imixs-ix/
Imixs IX Workflow provides the platform for an open and standardized workflow technology. IX Workflow provides various components in a Java framework that allow to create, control and monitor process-oriented business tasks.
4.3.2 Collaboration Support Tools
Collaboration support involves helping people involved in a common task achieve their goals through a process known as computer-supported cooperative work (CSCW). Interaction occurs at many levels: conversational, transactional, and collaborative. In conversational interaction, two or more people freely exchange information through a variety of tools, such as email, chat, and instant messaging. In transactional interaction, a protocol often constrains the exchange of information and constrains the roles of the participants. In a collaborative interaction, the participants cooperate to create and/or alter some entity (a plan, a document, etc.) which emerges as a consensus product of the group.
Collaboration support tools allow multiple participants to asynchronously operate upon versions of an entity at once and to visualize both their own versions and the current consensus version. Depending on how the group is structured, a voting mechanism may be required to continually check and record consensus on components of as well as the whole entity.
PROPRIETARY INFORMATIONUse or disclosure of data on this page is subject to restrictions

A good example is Wikipedia (http://en.wikipedia.org/), a web-based, open content, freely accessible encyclopedia of knowledge. Wikis are organized so that legitimate users can make changes freely. However, to ensure that changes are relevant and germane, a board of editors reviews all changes before releasing them to the public domain. The goal of Wikipedia is to get many people with different perspectives to contribute on many different topics, and, thus, to achieve a consensus view of a particular topic. Because of their openness, wikis are often subject to vandalism and disruptive posts. Hence, the need for topic editors to ensure that malicious changes are not made or survive for long periods of time.
For SHAPE, the participants group is brought together to work a specific problem. Collaborative software that facilitates that process is essential to timely accomplish of their objective – an actionable plan to address the situation(s) at hand. Some support is already provided through the server platform (assumed to be Microsoft Windows XP), the Office suite (word processor, drawing editor, calendar), the email server, etc. To augment these tools to assist in managing knowledge and content, additional tools are required.
The Logos Team investigated a number of open-source, Java-based collaboration support tools for supporting the SHAPE system planning process. SCHOLAR provides a content management system (Drupal 4.7) as well as certain conversational services such as email and instant messaging. Table 4-x presents a few candidates to augment these services for further evaluation.
Table 4-3. Collaboration Support Tools
Tool Name/Website
Brief Description
AroundMe Collaboration Serverhttp://www.barnraiser.org
This server provides a social networking environment via a web server that allows sharing of information among a group of colleagues. Works with OpenID. Supports group blogs, forums, and wikis.
ICECore Integrated Collaboration Environmenthttp://sourceforge.net/projects/icecore/
ICECore integrates team workspaces and real-time conferencing in a single, integrated team collaboration environment. ICEcore provides all the tools knowledge workers demand most—blogs, wikis, file stores, discussion threads, content search, workflow, document management, RSS feeds and more. A “presence” feature lets team members check people’s on-line availability and then meet on the fly to discuss examine content, discuss issues, and reach consensus.
Centric Team Elements Team Elements is an Enterprise 2.0 team
PROPRIETARY INFORMATIONUse or disclosure of data on this page is subject to restrictions
http://sourceforge.net/projects/teamelements/
collaboration suite. It ties discussions, wikis, RSS, project and document management, and federated search into a unified application. It is database-driven with rigorous role-based access and permissions.
Caveat: Although these projects advertise that they are ready to use out of the box, it is our experience that all such projects require some customization and adaptation to the operational environment. Therefore, consideration must be given, when selecting one of these projects, to the effort required to integrate them into application frameworks. Such analysis was beyond the scope of this Phase I effort.
Additionally, USACE may want to consider using Microsoft’s Sharepoint Server to organize and maintain document and data repositories for the SHAPE system. However, Microsoft licenses Sharepoint on a per-seat basis which can significantly increase the cost of the system.
4.3.3 Situation Assessment Tool
A number of situation assessment frameworks have been developed to assess environmental conditions for S&RO, including MPICE (Logos 2008c), TCAF (USAID 2005), and the Resilience Alliance’s Workbook (Resilience 2007). Logos Team members have been deeply involved in the development of MPICE through several SBIRs.
PROPRIETARY INFORMATIONUse or disclosure of data on this page is subject to restrictions

Figure 4-9. Sample Situation Assessment Framework
The SCHOLAR application framework provides communications services that will enable the receipt and processing of electronic feeds from which data can be extracted to inform the assessment process.
4.3.4 Strategy and Objectives Analysis Tool
The Strategy and Objectives Analysis Tool (S&OAT) will facilitate the entry and analysis of strategy, objectives, goals and requirements.
4.3.4.1 AutoMAP
The Automated Mission & Action Planning Suite (AutoMAP Suite) Prototype (Logos 2008a), jointly being developed by Logos and George Mason University’s Peace Operations Policy Program, demonstrated how to augment the planning process described in (JFCOM 2005). AutoMAP will build a hierarchy of requirements using the Essential task Matrix (ETM) as the source. Strategy, objectives, goal, and requirements can be specified through data entry screens along with who will do the task and some sequencing information. Data
PROPRIETARY INFORMATIONUse or disclosure of data on this page is subject to restrictions

will be exportable from AutoMAP and can be transformed and deposited into the RBS working memory.
Figure 4–10 depicts the initial page presented to the user by the AutoMAP software. He purpose of AutoMAP is to guide the user through the process of policy specification, strategy development, and implementation. The user interface must be adapted to “walk” the user through the process of entering objectives, goals, and requirements.
Figure 4-10. AutoMAP Opening Page
The Logos Team believes that the AutoMAP concept can be adapted to the strategy, objectives, goals, and requirements approach for acquiring high-level planning information.
4.3.5 Asset Specification Tool(s)
Resources and assets are any entity in the problem environment that can perform an action. Resources and assets may be indigenous to the environment or provided by external sources. There are numerous categories of resources and assets that need to be considered as evidenced by the following tables.
Table 4-4. Potential Resources
Resource DescriptionConstruction Entities that can physically construct infrastructure
PROPRIETARY INFORMATIONUse or disclosure of data on this page is subject to restrictions

(electrical plants, water/sewage facilities, etc) and buildings (commercial, habitable, education, etc.)
Socio-economic Entities that provide services such as financial, housing, educational, job creation, children’s welfare, etc.
Biophysical Entities associated with the environment – trees, water resources, etc.
Public Sector Services Entities related to governance, law enforcement, etc.Energy Production and Delivery
Entities producing and delivering energy such as power plants, electricity transmission grids, etc.
Water/Sewage FacilitiesRe-use/Recycling of Materials
Examples: Water recycling and conservation; trash recycling and reprocessing
Food Production and Delivery
Entities such as farms, markets, and food distribution organizations for donated food
Commercial Entities producing and selling a variety of commodities and necessities, such as clothing, eating implements, books, etc.
This list is neither exhaustive nor comprehensive. It is meant to demonstrate the diversity of resources that must be considered in the detailed planning of an actionable plan. The detailed attributes required to describe these entities to support plan generation need to be defined.
Table 4-5. Potential Assets (Anecdotal)
Asset DescriptionWomen’s Social Time Village women often walked two hours to reach a potable water
well. It was suggested that building a well in the village would yield more time for these women to attend school to be educated. However, it was belatedly realized that walking to the well provided the women with two nontangible, but very critical benefits: (1) it gave them time to socialize and converse among themselves regarding women’s concerns, and (2) it gave them freedom from their husbands for several hours per day in a society where women were sequestered in the home doing chores.
Cultural Heritage Sites A helipad was constructed in the heart of ancient Babylon. The ground was bulldozed and sandbags were filled with dirt. The dirt dug up from the site, contained archaeological material now ripped out of its context, deracinated for all time. Soil was brought in from other sites thus contaminating the material. While the helipad was in use, the daily flights shook the foundations of Babylon’s ancient walls so severely that the wall of the Temple of Nabu and the roof of the 6 th-century-BC
PROPRIETARY INFORMATIONUse or disclosure of data on this page is subject to restrictions

Temple of Ninmah collapsed. This damage strikes at the heart of Iraqi culture and history, represents the loss of potentially significant historical material, and demonstrates the social and cultural ignorance and laissez-faire approach of Western personnel.
Transnational Wildlife Areas In Southern Africa, governments have made the preservation of ‘natural’ or ‘wilderness’ areas a national prerogative because of their value to the tourist industry. However, these same areas are also perfect for refugees and for conducting illicit activities such as smuggling drugs, arms and endangered species of plants and animals. Countries such as Mozambique and Zimbabwe have built fences to create national chokepoints that are easy to patrol. These fences partition the wilderness areas which stress the natural habitat by preventing natural animal migration. The result is lesser wildlife tourism leading to reduced tourism income for alienated indigenous groups who live there and thus turn to poaching and smuggling to make up for falling income, which leads to further ‘security’ measures. This destructive feedback loop is often seen where oppressive security measures are enacted.
From these anecdotes, it is apparent that nontangible assets result from behaviors and processes associated with tangible resources. The first anecdote shows the positive benefit from leaving a situation as it is. The second anecdote demonstrates that tangible entities may lead to negative and disruptive behaviors which can have significant repercussions both short- and long-term. Thus, understanding the social and cultural proclivities and mores that lead to negative assets can also be triggers for finding alternatives that yield positive assets.
Capturing asset information is likely to be a process of acquiring rules and constraints to be used during the plan generation process.
4.3.6 Plan Generation Tool
As noted in section 4.2.5, a semi-automated planning tool would facilitate the generation of actionable plans by the participants. The Logos Team believes that any planning tool should be open source and Java-based in order to allow enhancement and modification. We discuss two potential tools in the following sections.
4.3.6.1 Hierarchical Task Planner: JSHOP2
The JSHOP2 planning system was developed by Dana Nau at the University of Maryland College Park. JSHOP2 is a domain-independent planning system written in Java. It uses a process called ordered task decomposition, which is a type of Hierarchical Task Network
PROPRIETARY INFORMATIONUse or disclosure of data on this page is subject to restrictions

(HTN) planning (Nau, Smith, Erol 1998). JSHOP2 is an evolved version of the planning algorithm used in Bridge Baron 8 (Nau, Cao, Lotem, and Munoz-Avila 1999). It placed in the top four positions at the 2002 International Planning Competition, and has been successfully applied in several government applications. Source code for JSHOP2 has been downloaded from the University of Maryland website. This allows JSHOP2 to be extended with external Java functions to support specific domains such as the SHAPE domain.
In HTN planning, the planning system begins with an initial state-of-the-world and with the objective of creating a plan to perform a set of tasks (abstract representations of things that need to be done). HTN planning is done by problem reduction: the planner recursively decomposes tasks into subtasks, stopping when it reaches primitive tasks that can be performed directly by planning operators. In order to tell the planner how to decompose nonprimitive tasks into subtasks, it needs to have a set of methods, where each method is a schema for decomposing a particular kind of task into a set of subtasks (provided that some set of preconditions is satisfied). For each task, there may be more than one applicable method, and thus more than one way to decompose the task into subtasks. The HTN planner may have to try several of these alternative decompositions before finding one that is solvable at a lower level.
An ordered task decomposition planner is an HTN planner that plans for tasks in the same order that they will be executed. This reduces the complexity of reasoning by removing a great deal of uncertainty about the world, which makes it easy to incorporate substantial expressive power into the planning algorithm. In addition to the usual HTN methods and operators, our planners can make use of axioms, can do mixed symbolic/numeric conditions, and can do external function calls. (http://www.cs.umd.edu/projects/shop/description.html)
4.3.6.2 I-X Planning System
I-X is a robust systems integration architecture. It is an environment for helping people work together on processes that may be distributed over different geographical locations. I-X supports specification and implementation of best-practice procedures, process management, communication between collaborating agents, management of world state information, access to web services, planning, and option management. It includes:
· process panels – similar to to-do lists that people use to plan and monitor processes· a planning system – helps to explore different courses of action using what-if
scenarios· a domain modeling tool – to produce a library of best-practice or common ways of
doing things· a messaging system to help communication
PROPRIETARY INFORMATIONUse or disclosure of data on this page is subject to restrictions
I-X was developed by the University of Edinburgh and is distributed under the GNU Lesser General Public License, version 2.1. It was initially developed under DARPA’s Knowledge-Based Planning program conducted during the mid-to-late 90s. Since then, Edinburgh has continued developed through several sources of funding, including Esprit (European Union Research Programme), additional DARPA funding, and British research funding.
I-X supports application areas where different people and/or systems collaborate to solve a complex problem. It provides the following services:
· intelligent management of to-do lists· exploring alternative courses of action· maintaining world state information· monitoring task execution in real-time· monitoring conditions and effects of activities· communication between remote agents
Currently, inputs and outputs of activities can be represented in I-X. Simple object types and state information can be represented and managed in I-X world state descriptions, but to date there is no modeling support for these and it is the user’s task to maintain consistency. However, I-X is under continual development and support for these items is likely to be added in a future release.
The source code for I-X is available and down-loadable from the University of Edinburgh website, http://www.aiai.ed.ac.uk/project/ix/release/.
An example of an I-X Process Panel is depicted in figure 4-11.
PROPRIETARY INFORMATIONUse or disclosure of data on this page is subject to restrictions
Figure 4-11. I-X Process Panel Example
I-X provides a planner that supports plan generation, analysis, and checking. The planner can construct a plan from a library of detailed tasks given the notional plan and constraints on specific activities. The planner uses a hierarchical order-composition process similar to the HTN process used by JSHOP2.
PROPRIETARY INFORMATIONUse or disclosure of data on this page is subject to restrictions

Figure 4-12. I-X Planner Operator Panel
An example of plan checking output is depicted in figure 4-13.
Figure 4-x. Planner Checking Plan Example
PROPRIETARY INFORMATIONUse or disclosure of data on this page is subject to restrictions
4.3.6.3 Modeling to Support Planning
As von Clausewitz noted in On War, “real” war is a dynamic process. So, too, is the process of planning for the real world. As has been famously reported, no plan survives the first encounter with the enemy.
Typically, the asset-based planning process is decoupled from plan execution. Outcomes are often estimated or guessed using qualitative methods. With the degree of computer-based support envisioned in this report, it is possible to dynamically construct semi-automated models that can provide some quantitative analysis of a plan’s outcomes.
Additionally, plan analysis can be conducted concurrently with plan execution. Real-world data can be used to inform the modeling environment to assess alternative plans, to determine deviations from expected outcomes based on intermediate task and activity results, and to focus a dynamic re-planning effort to effect mid-course corrections or enhancements. As the DARPA Pre-Conflict Anticipation and Shaping (PCAS) Program demonstrated (Popp, Kaisler and Allen 2006), shaping actions could be specified to address specific issues and effect specific outcomes.
Assessing plan outcomes requires a set of metrics that can be tied to different plan tasks and activities. It also requires specification of relationships between tasks/activities at different time intervals within the plan. These relationships will allow simulation of plan outcomes and ROI calculations prior to plan execution and actual assessment during plan execution.
The Logos Team has investigated two tools for supporting modeling and analysis of alternative plans prior to execution: Evolving Logic’s Computer-Assisted Reasoning methodology and System Dynamics modeling.
Computer Assisted Reasoning (CARS)
Evolving Logic has developed CARS as a tool for examining alternative outcomes in plans based on manipulating critical variables. CARS explores the space defined by all the model variables and parameters (levers), testing different configurations for optimal results and determining the uncertainties that affect the sensitivity of the results. Levers are actions that we can control when running the model, e.g. decisions that we can make that affect the outcomes such as how much of a resource to allocate in a particular area. Uncertainties are things that we cannot control such as exogenous variables.
Consider this example from PCAS using nine levers based on PACOM’s Theatre Security Cooperation (TSC) activities, which are somewhat analogous to the tasks and activities that
PROPRIETARY INFORMATIONUse or disclosure of data on this page is subject to restrictions
can be used in asset-based planning – see figure 4-x. These were applied against the POFED model developed by Jacek Kugler of the Claremont Graduate School.
Figure 4-14. Possible TSC Levers
Associated with these levers are uncertainties as depicted in figure 4-14.
Figure 4-14. Parameters of Uncertainty
Using CARS to explore the space over all the values of the variables yielded the following matrix for applying humanitarian assistance. In this analysis, CARS generated over 4000 scenarios based on the values of nine variables in about an hour (circa 2005). After some winnowing using good effects as a criteria, they found 199 cases that had positive outcomes.
PROPRIETARY INFORMATIONUse or disclosure of data on this page is subject to restrictions

This brief example demonstrates a tool with significant utility to highlight for decision makers the outcomes of their actions. With a greater number of variables and parameters, the analysis is much more complex and requires longer time. It serves to give decision makers an early indication of where positive effects might result from judicious planning.
Figure 4-15. Evolving Logic’s CARS Output for Humanitarian Assistance
System Dynamics
System dynamics is a methodology for studying and managing complex feedback systems, such as one finds in business and other social systems. This field developed initially from the work of Jay Forrester through his seminal book Industrial Dynamics. Feedback refers to the situation of X affecting Y and Y in turn affecting X perhaps through a chain of causes and effects. One cannot study the link between X and Y and, independently, the link between Y and X and predict how the system will behave. Only the study of the whole system as a feedback system will lead to correct results.
The basis of system dynamics is the recognition that complex system’s components have circular, interlocking, time-delayed relationships. As a result, the properties of the whole cannot be found by just inspecting the properties of the elements not can the behavior of the whole be explained by an aggregation of the behavior of the parts. These are just some of the characteristics of complex, adaptive, emergent systems which are examples of wicked problems.
PROPRIETARY INFORMATIONUse or disclosure of data on this page is subject to restrictions

System dynamics problems can be expressed as a set of partial differential equations, but the real power arises from the ability to simulate system behavior to assess outcomes based on varying critical system parameters.
Figure 4-16 depicts a model developed by Nazli Choucri, Michael Siegel, and Stu Madnick of MIT and Brad Morrison of Brandeis University to assess influences on insurgent recruitment for the DARPA PCAS project. Note that resilience was an essential element of this model.
Figure 4-16. MIT System Dynamics Model of Insurgent Recruitment
In this analysis, the MIT group found that preventing recruitment had a greater effect on reducing the insurgent population than eliminating insurgents as depicted in figure 4-17.
PROPRIETARY INFORMATIONUse or disclosure of data on this page is subject to restrictions

Figure 4-17. Insurgent Reduction Due to Preventing Recruitment
However, an equally informative result was that loss of regime resilience created a significant tipping point where the insurgent population almost exponentially increased as depicted in figure 4-18. They included that regime resilience was a significant factor in the recruitment of new individuals.
PROPRIETARY INFORMATIONUse or disclosure of data on this page is subject to restrictions

Figure 4-18. Insurgent Population Increase Due to Loss of Regime Resilience
Table 4-6 presents two open source system dynamics tools, written in Java, that could be considered for the SHAPE JCTD. It also presents two commercial tools that could be investigated.
Table 4-6. Open Source and Commercial System Dynamics Tools
Tool/Website Brief DescriptionSphinx SD Toolshttp://sourceforge.net/projects/sphinxes/
This project is developing a system dynamics toolset in Java. It is licensed under the Apache License, Version 2.0. Source code is available.
System Dynamics 1.2http://sourceforge.net/projects/system-dynamics/
SystemDynamics is a graphical Java application for modeling, visualization and execution of System Dynamics models. It is licensed under the GNU General Public License (GPL) , version 2 or later. Source code is available.
Vensim 5.7http://www.vensim.com/
A commercial grade product. Used by MIT for the PCAS project. Supports scalable models to thousands of nodes. Vensim PLE (Personal Learning Edition) is download to familiarize oneself with system dynamics models.
Stellahttp://www.iseesystems.com/
A commercial product used at many universities, NASA, EPA, and the Sustainability Institute. Provides icon-based model building interface, good visualization tools, and technical support.
4.3.6.4 Planning Summary
The Logos Team has identified several open-source planning systems that are candidates for a semi-automated planning tool for the SHAPE system. We believe strongly that an AI-based semi-automated planning tool, properly configured for participants who are not computer scientists, can provide a significant advantage in generation of a detailed actionable plan.
4.3.7 Plan Assessment Tool
Plan assessment involves evaluating the results of executing all or a portion of the plan. Evaluation requires acquiring values of measurable variables associated with plan tasks that have been executed or their proxy variables.
PROPRIETARY INFORMATIONUse or disclosure of data on this page is subject to restrictions

In section 4.2.6, the Logos Team described the concept of resilience. Resilience is the ability of a system to resist change due to catastrophic shocks or disturbances. The structure of the system contributes to its resilience. Highly resilient systems have strong, even complex, networks of collaboration and interaction. A prime example is the open source software community, particularly the Linux community. Using social network theory, we can measure various static aspects of the collaboration network to assess its characteristics.
Resilience, however, is really a dynamic property of a system. As yet, we have no good theoretical or practical model for resilience; rather, we have sets of prescriptions that are useful in different domains.
In physics and engineering, resilience is defined as the capacity of a material to absorb energy when it is deformed elastically and then, upon unloading to have this energy recovered. In other words, it is the maximum energy per volume that can be elastically stored. In ecology, resilience has two competing definitions. First, it is the rate at which a system returns to a single steady or cyclic state following a perturbation. This definition of resilience assumes that behavior of a system remains within the stable domain that contains this steady state. Second, given conditions far from any steady-states, where instabilities can flip a system into another regime of behavior - i.e. to another stability domain, resilience is measured by the magnitude of disturbance that can be absorbed before the system changes its structure by changing the variables and processes that control behavior. All of these definitions involve nonlinear phenomena.
The Logos Team suggests that developing at least an initial theoretical and practical framework for computing resilience is critical to assessing plan results. Rather that developing an extensive formulaic theory, we suggest an empirically-driven modeling approach using system dynamics to capture measureable variables and parameters that allows a system dynamics model to continually compute resilience.
The Logos Team suggests that resilience is a dimensionless number, which we suggest be scaled to the interval [0, 99]. The higher the number, the more resilient a system is. There is no system that is perfectly resilient; hence, the value 100 cannot be practically obtained. That is, every system is susceptible to some catastrophic shock which will cause the system to fail.
A system dynamics model can be constructed, semi-automatically, as the situation assessment is developed and the strategic and tactical plan evolved (stages 1 – 4). The system dynamics model can then be run to predict outcomes during stage 4 and to assess plan outcomes and future impacts during stage 5.
4.4 SHAPE Software Architecture
PROPRIETARY INFORMATIONUse or disclosure of data on this page is subject to restrictions

The Logos Team has developed a conceptual SHAPE Software Architecture that depicts how the software components that might comprise the SHAPE system would be layered to form an integrated system. Given the SCHOLAR Application Framework, the Logos Team reviewed tools and subsystems that could be integrated with and utilize the services of SCHOLAR.
Figure 4-19 depicts the conceptual SHAPE Software Architecture. The tools and subsystems that support the asset-based planning process would be embedded in the architecture between a GUI-based front-end that provide users with a single portal to all tools and the infrastructure to support the tools.
Note that ontology is not depicted in this diagram explicitly because we that ontological information would be transformed into working memory structures for use by the DROOLS rule-based system.
Note also that visualization tools are not specifically depicted as we envision them being used to develop elements of each of the functional tools described in the previous section.
Figure 4-19. SHAPE Software Architecture
PROPRIETARY INFORMATIONUse or disclosure of data on this page is subject to restrictions

The following sections discus some subsystems and tools which provide additional capabilities necessary to support the SHAPE asset-based planning system. We do not describe Microsoft Office Suite as its components and capabilities are well known.
4.4.1 SCHOLAR Application Framework
A software framework is a suite of tools and subsystems that is designed to support software development. The idea is that all of the tedious, low-level details of creating an application, e.g., the infrastructure services, are already provided in a reusable package. Having a good framework in place allows the software developers to spend more time concentrating on the business-specific problem at hand rather than on the plumbing code behind it. However, a framework can limit the choices to be made during software development, so it can increase productivity in large, complex systems, but with the potential disadvantage of restricting some flexibility.
The Government will provide the SCHOLAR application Framework (Scholar Fact Sheet 2008) as the software application foundation for the JCTD. This framework, depicted in figure 4-20, provides a suite of services for communications, content management, database management, and data transformation.
PROPRIETARY INFORMATIONUse or disclosure of data on this page is subject to restrictions

Figure 4-20. SCHOLAR Application Framework
4.4.2 Web-enabled User Interface
We assumed that the participants in the SHAPE asset-based planning process are likely to be spatially and temporally distributed. As a result, the user interface to SHAPE should support access from a variety of different types of equipment – terminals, workstations, even iPhones and Blackberries. This would be accommodated through the communication tools and web services provided by the SCHOLAR application framework.
The user interface should support the major browsers – Microsoft Internet Explorer, Mozilla, Apple Safari – as it cannot be predicted how users will access the system’s capabilities. Each user should have a user profile that indicates how he will access the SHAPE system. This would allow the user interface to intelligently format and scope information for the device(s) the user is using to access the system.
PROPRIETARY INFORMATIONUse or disclosure of data on this page is subject to restrictions

4.4.3 Rule Based System
A rule based system (RBS) (also known as a production rule system) is a software application that represent knowledge in a declarative format as a set of ‘if … then …’ rules typically cast in a predicate logic structure. Data upon which the rules operate and reason with are stored in a working memory, which holds initial data, intermediate results and conclusions.
A rule interpreter generally executes a forward chaining algorithm for selecting productions to execute to meet current goals, which can include updating the system's data. The condition portion of each rule (left-hand side or LHS or the ‘if part’) is tested against the current state of the working memory. If the LHS is satisfied, the consequent actions (right-hand side or RHS or ‘then part’) will update the system’s knowledge, removing or adding data to the working memory. The system stops processing either when the user interrupts the forward chaining loop; when a given number of cycles has been performed; when a "halt" RHS is executed, or when no rules have true LHSs.
RBSs are data driven systems. As data is entered into the system, the data is matched against the relevant rules which are then executed. A key idea is that the order of data entry determines which rules are executed. Different orders of entry of data yield different rule execution sequences. The output of one rules’ execution may generate new data that causes one or more other rules to be executed, thus inducing a cascade effect of knowledge derivation in the working memory. It is this cascade effect which represents the true power of an RBS – the ability to generate new data and information through knowledge encoded in the rules. And, it is this capability which represents significant potential for the SHAPE system because subject matter expert (SME) knowledge about S&RO can be encoded in rules. When the rules are executed, the benefit of this knowledge can be realized even if the SMEs are not part of the planning team.
Rule-based systems are best used in applications where the business logic is too dynamic to be managed at the source code level -- that is, where a change in a business policy needs to be immediately reflected in the application. Applications in domains such as insurance (for example, insurance rating), financial services (loans, fraud detection, claims routing and management), government (application process and tax calculations), telecom customer care and billing (promotions for long distance calls that needs to be integrated into the billing system), ecommerce (personalizing the user's experience), and so on benefit greatly from using rule engines. S&RO analysis for situation awareness and analysis of strategy and objectives are also very good applications.
Adopting a rule-based approach for an application has the following advantages:
PROPRIETARY INFORMATIONUse or disclosure of data on this page is subject to restrictions

· Rules that represent policies are easily communicated and understood.· Rules retain a higher level of independence than conventional programming
languages.· Rules separate knowledge from its implementation logic.· Rules can be changed without changing source code; thus, there is no need to
recompile the application's code.
These benefits, however, are not without cost. As with any tool, the decision to integrate a rule engine into an application should be based on cost versus benefits. The cost includes the learning curve and the effort involved in building an interface between the application and the rule engine.
The Logos Team surveyed a number of open source rule-based systems written in Java for consideration for the SHAPE system. These are generally available through the SourceForge project (www.sourceforge.org). JESS is a commercially available system through Sandia Laboratories (http://www.jessrules.com/jess/index.shtml).
4.4.3.1 DROOLS
The Logos Team suggests that the SHAPE System use the DROOLS (Declarative Rule-base Object-Oriented Language System) as its rule-based system to support semi-automated reasoning about data and information during the asset-based planning process.
is being developed by the JBOSS organization which develops Java enterprise middleware through a community-driven process. (www.jboss.org) Software developed by JBOSS is available for use by anyone with no license fees.
DROOLS, provides for a declarative programming style in which the programmer specifies what is to be done, not how to do it. DROOLS uses a working memory to hold the data to be operated upon and a rule engine to execute the application rules. Data will be loaded into the working memory as received from the users where sets of rules associated with the stages of the SHAPE process will operate upon and reason about the data as it is entered. These rules will be used to check the data, derive new data and identify gaps or missing data that the SHAPE system can alert the user to enter.
DROOLS, a JSR-94 compliant system, uses the ReteOO rule engine, an enhanced version of Charles Forgy’s original Rete algorithm that was used in numerous systems, including OPS5. (http://en.wikipedia.org/wiki/Rete_algorithm) The Rete algorithm builds a tree from all the rules to form a state machine. It begins with facts entering the tree at the top-level nodes as parameters to the rules, and working their way down the tree--if they match the conditions--until they reach the leaf nodes (rule consequences). The ReteOO algorithm uses an object-oriented model for representing data in working memory.
PROPRIETARY INFORMATIONUse or disclosure of data on this page is subject to restrictions

Facts are inserted into working memory. There, they may be reasoned about, modified, or retracted. Modified facts may initiate an additional round of reasoning. New facts may be derived and inserted into memory as the result of rule execution. Eventually, data may be extracted from the working memory and provide to the user community.
New rules and data may be inserted into working memory dynamically. This allows evolution of the reasoning capability of the RBS as understanding of the situation evolves. Old data and rules may be withdrawn from the working memory at any time.
4.4.3.2 Java Expert Shell System (JESS)
JESS is a rule-based system engine written in Java developed by Sandia Laboratories of Livermore, CA. JESS also uses the RETE algorithm developed by Charles Forgy. JESS is largely based on the original CLIPS rule-based system developed by NASA in the late 1980s and 1990s. It is JSR94 compliant.
JESS is available to academic users at no cost. Commercial users can purchase a JESS license through Sandia Laboratories. It is not clear what rights the Government ahs to JESS since it was developed at a Government-owned, Contractor-operated laboratory belong to the Department of Energy.
Like DROOLS, JESS loads rules and data into a working memory where rules are executed until no further rule applies. New data can be inserted into working memory and data can be withdrawn through APIs. New rules can also be asserted dynamically or old rules withdrawn through the API. Thus, the reasoning capability is allowed to evolve during the system’s lifetime.
4.4.3.3 Use DROOLS
The Logos Team believes that an RBS will enhance the analysis of information provided by the participants during the asset-based planning process.
The Logos Team has suggested DROOLS because its efficiency is asymptotically independent of the number of rules being executed. Since the rule set is compiled into an internal tree, the rule set may contain hundreds or thousands of rules, but the performance only scales with the depth of the tree. And, because it is an open source software system.
We have had direct experience with DROOLS, but not with JESS. Therefore, we cannot comment on its efficiency.
PROPRIETARY INFORMATIONUse or disclosure of data on this page is subject to restrictions

Both are stable, well- supported products with continuing updates. Both have an active user community with wikis and blogs. Technical support is available for JESS through Sandia Laboratories or other commercial firms for a fee.
4.4.4 Java JDK/JRE
We recognize that there are many programming languages and environments that the government could choose from to develop the SHAPE system. Allowing multiple programming languages and software development environments increases integration and interoperability difficulties – even if software wrapper technology is used to mask the semantics of one or more subsystems. The Logos Team recommends the use of Java Programming environment for SHAPE system development.
Java is a programming language developed by Sun Microsystems in the early 1990s as the replacement for C++, a programming language of substantial complexity and numerous flaws which could compromise the security and integrity of software systems. While both C++ and Java are object-oriented programming languages, C++ was not strictly so and, absent adherence to certain conventions, violated the principles of strong encapsulation and information hiding critical to object-oriented programming.
The Java Development Kit (JDK) and Java Runtime Environment (JRE) are both available in binary and source form from Sun Microsystem’s JavaSoft website, http://java.sun.com/ for several platforms, including Windows XP.
4.4.5 MySQL Data Base Management System
The MySQL Data Base Management System (DBMS) is included within the SCHOLAR Application Framework. There are many other DBMS that could be used, but MySQL is an open source DBMS that is continually under development, is very robust, and has been widely used in many different systems.
4.4.6 Visualization Tools
The Logos Team reviewed a number of visualization tools to support display of information for the SHAPE participants. While some open source visualization tools exist, the Logos Team felt this was the one place where the government should not stint on tool quality. Thus, we believe that a COTS visualization tool can provide the best capability of the SHAPE system. However, we also suggest that a COTS tool be supplemented by several open-source, Java-based tools that are currently being used by the computational social science
PROPRIETARY INFORMATIONUse or disclosure of data on this page is subject to restrictions

community. Table 4-7 presents a few tools that should be investigated for inclusion in the SHAPE software architecture.
Table 4-7. Visualization Tools
Tool/Company/URL DescriptionOriginOriginLab Corporationhttp://www.originlab.com
Origin is an easy-to-use graphics and visualization software tool for analyzing and displaying data. Over 100,000 licenses have been distributed worldwide.
Surface3D/Volume4DScienceGL, Inc.http://www.sciencegl.com/
Advanced 3D/4D graphics and visualization tools used in science, medicine, business, and education. Handles massive multidimensional data sets.
jgraphhttp://www.jgraph.com/
Open source and commercial versions available. A
JUNGhttp://jung.sourceforge.net/index.html
The Java Universal Network Graph system is a powerful graph layout and visualization system. It is used for data mining and social network analysis.
4.4.7 Microsoft Windows XP
We have assumed that the hardware platform operating system will be Microsoft Windows XP because of its stability and familiarity to many users. Windows XP with Service Pack 2 provides a very stable foundation for software development and execution. Service Pack 3 is due within the next several months that should enhance this capability.
We do not, at this time, recommend Windows Vista because of the extreme number of functional changes to the operating system model. Vista’s stability and support is of significant concern as is some of Microsoft’s new policies regarding use of this software.
Before committing to Microsoft Vista, the Logos Team suggests a careful review and appraisal of its features, the support for other environments, and Microsoft’s policies regarding licensing, utilization, etc.
4.4.8 Software Development Environment
Given the recommendation for Java, several open source software development environments are available to support the development of complex, multisystem software applications. See this Wikipedia article (http://en.wikipedia.org/wiki/Comparison_of_integrated_development_environments#Java)
PROPRIETARY INFORMATIONUse or disclosure of data on this page is subject to restrictions

Two developments environments, NetBeans and Eclipse are widely used and readily available to the developer community. Both are licensed under open source licenses such as Sun Microsystems' Common Development and Distribution License (CDDL) (http://en.wikipedia.org/wiki/Common_Development_and_Distribution_License), the Mozilla Public License (MPL) (http://en.wikipedia.org/wiki/Mozilla_Public_License), and the GNU General Public License (GPL) (http://en.wikipedia.org/wiki/GPL). Either development environment would readily support the software development processes for the SHAPE system. Substantial documentation, examples, wikis, and user community blogs are available to assist software developers for both developments environments.
4.4.8.1 NetBeans
The NetBeans Integrated Development Environment (IDE) is a free, open-source software development environment developed by Sun Microsystems (http://www.netbeans.org/). NetBeans supports application development by integrating a set of modular software components called modules. A module is a Java archive file that contains Java classes written to interact with the NetBeans Open APIs and a manifest file that identifies it as a module. Applications built on modules can be extended by adding new modules. Since modules can be developed independently, applications based on the NetBeans platform can be easily and powerfully extended.
The current release, 6.0, features numerous tools for software development, including:
· An easy-to-use Java GUI Builder· Ruby and Rails Support· Visual UML Modeling· A language-aware editor that indents, matches brackets, and checks source code both
syntactically and semantically· Navigation tools for multiclass software applications with analysis of class
dependencies· Support for version control that allows roll-back from error-prone releases to stable
releases
Logos has used the NetBeans IDE for developing the MPICE framework.
4.4.8.2 Eclipse
Eclipse is an open-source development platform comprised of extensible frameworks, tools and runtime environments for building, deploying and managing software across the software development lifecycle. A large and vibrant ecosystem of major technology vendors,
PROPRIETARY INFORMATIONUse or disclosure of data on this page is subject to restrictions
innovative start-ups, universities, research institutions and individuals extend, complement and support the Eclipse platform. Eclipse arose out of internal IBM research and development. However, IBM, realizing the power of the open source development community, placed the Eclipse source code in the public domain and helped to establish eclipse.org to continue the development of Eclipse as a software development environment. (http://www.eclipse.org/)
Additionally, the Eclipse organization is supporting over 60 active projects focused on developing tools and capabilities to support software and applications development. We suggest reviewing some of these projects to determine if any of them can assist in facilitating the development of the SHAPE system.
Easy Eclipse (http://www.easyeclipse.org/site/home/) provides numerous open source plug ins to enhance the use of Eclipse in the software development process.
4.4.9 Ontology Development
As mentioned in section 4.x, an ontology is the foundational knowledge structure that both unifies the stages and provides a medium of information exchange among them. The ontology will be externally represented in Resource Description Framework (RDF)/ eXtensible Markup Language (XML) notation. Figure 4-x presents an example RDF class hierarchy. RDF was originally designed as a metadata data model, but has been adopted as the general representation scheme for ontological information in knowledge management systems. RDF describes information as a triple: subject-predicate-object. The subject denotes the resource, and the predicate denotes attributes or traits of the resource and expresses a relationship between the subject and the object. (http://www.w3.org/RDF/)
PROPRIETARY INFORMATIONUse or disclosure of data on this page is subject to restrictions

Figure 4-21. RDF Class Hierarchy Example (Mizoguchi 2000)
Figure 4-22 depicts a partial example of the RDF source statements corresponding to the diagram above.
PROPRIETARY INFORMATIONUse or disclosure of data on this page is subject to restrictions

Figure 4-22. RDF Source Statement Example (Mizoguchi 2000)
XML is a general purpose specification for creating customized markup languages. It is an extensible language in that it allows users to define their own elements. Its primary purpose is to facilitate the sharing of structured data across different information systems, particularly via the Internet and it is used both to encode documents and to serialize data. Numerous custom markup languages have been developed from the XML base. The disadvantage of using XML is that it is verbose: the tagging data often exceeds the actual information by a factor of three or more. However, since this tagging data facilitates information exchange and, thus, interoperability between diverse software tools, it is a burden the SHAPE system can accept. (http://www.w3.org/XML/)
StratML, which was discussed in section 4.2.3, is a government-sponsored XML-variant for describing strategy and objectives in strategic planning. As noted, StratML is in the initial stages of development. It is incomplete for the SHAPE’s representational needs, but provides a foundation from which a planning markup language can be developed through extension.
PROPRIETARY INFORMATIONUse or disclosure of data on this page is subject to restrictions

Numerous ontology development tools have been devised and implemented over the past decade as system designers and users have realized the expressive power and communicative utility of ontologies. The Logos Team reviewed documentation and reports on several open source ontology development tools (OntoWeb 2002). The OntoWeb survey was updated in 2004 to compare over 30 different tools. (http://www.xml.com/2004/07/14/examples/Ontology_Editor_Survey_2004_Table_-_Michael_Denny.pdf)
Two tools were of particular note: KAON and Protégé. KAON is an open-source ontology management infrastructure targeted for business applications. It includes a comprehensive tool suite allowing easy ontology creation and management and provides a framework for building ontology-based applications. (http://kaon.semanticweb.org/). However, a new release has not been delivered since 2005. A successor, KAON2, is being developed but there is not adequate documentation or source code available. However, one tool stood out for its widespread usage across the ontology community: Protégé. Thus, the Logos team suggests the use of Protégé for ontology development for the SHAPE planning system.
4.4.9.1 Protégé
Protégé is a free, open-source ontology editor and knowledge-base framework. Protégé ontologies can be exported into a variety of formats including RDF(S), OWL, and XML Schema. Protégé is based on Java, is extensible, and provides a plug-and-play environment that makes it a flexible base for rapid prototyping and application development. Protégé is supported by a strong community (over 91,000 registered users) of developers and academic, government and corporate users, who are using Protégé for knowledge solutions in areas as diverse as biomedicine, intelligence gathering, and corporate modeling. (http://protege.stanford.edu/)
The Protégé-OWL editor is an extension of Protégé that supports the Web Ontology Language (OWL). OWL is a standard ontology description language supported by the World Wide Web Consortium (W3C). Protégé-OWL is continuing to be developed by Stanford University. A version that runs under Windows XP is available for download. Figure 4-23 depicts a Protégé screenshot.
PROPRIETARY INFORMATIONUse or disclosure of data on this page is subject to restrictions

Figure 4-23. Protégé OWL Screenshot
4.10 Next Steps
The Logos Team has developed a high-level view of a software architecture to support SHAPE asset-based planning. We have identified several challenges to semi-automated support for the asset-based planning process and methodology. We have identified several types of tools and several alternatives in some of the tool categories that should be considered for adoption in support of the SHAPE program.
The next steps include the following:
· Develop a Functional Description/Concept of Operations for the SHAPE JCTD· Develop a ‘build-to’ System/Software Architecture· Perform a more detail analysis of tools leading to selection and/or acquisition· Construct prototypes of key stages to assess the SHAPE Process and Methodology in
an experimental environment.
PROPRIETARY INFORMATIONUse or disclosure of data on this page is subject to restrictions

5. Experiment Design for SHAPE
5.1 Summary
There is a large number of interagency S&RO planning, assessment and analysis experimentation campaigns in fiscal 2009, including the Coalition Warfare Interoperability Demonstration (CWID), several Joint Capability Technology Demonstrations (JCTDs); JFCOM campaigns such as MNE 5 and Unified Action, and smaller planning Limited Objective Experiments. JFCOM is also working with the Defense Advanced Research Projects Agency (DARPA) on a much more long-term planning effort, titled COMPOEX. COMPOEX is an attempt to develop detailed machine-driven integrated planning through extensive use of modeling, simulation and software-based planning tools. In order to further refine through spiral development, follow on phases of the SHAPE concept must involve a rigorous testing and evaluation process within one or more of the above campaigns.
A proposed DRAFT experiment approach is described in more detail below but in summary, the authors suggest designing a Limited Objective Experiment (LOE). The LOE will have specific objectives, and its findings can be used to inform larger experimental or operational endeavors. The LOE will have three distinct interagency planning groups each develop an SSTR asset-based plan, based on a realistic policy goal, and within a realistic, operational scenario. The process will include a walk-through of several of the SHAPE process steps and result in a plan.
To this end the three different planning groups will work in parallel, one using only SHAPE and existing S/CRS planning principles; one will be given only the existing S/CRS guidance for SSTR; and one will be given no specific tools and asked to use their best judgment in the formation of an SSTR plan. Each group will be given the same Policy Goal(s). The groups will also need to provide a synopsis of the key issues, the key outputs of each of the SHAPE steps, the Tasks that would be required to achieve the Goal(s), the organizations that should take the lead for delivery of different aspects of the plan, and, critically, the ‘dependencies’ and ‘best paths’ as outlined in the SHAPE architecture. .
Questionnaires, observations, presentations and interviews will lead to the key findings.
5.2 Experimentation
In follow on activities for SHAPE, the authors suggest the conduct at least one Limited Objective Experiment (LOE) that will test and evaluate the SHAPE process steps. Recall that unlike an exercise, an experiment tests the applicability and usefulness of a concept.
PROPRIETARY INFORMATIONUse or disclosure of data on this page is subject to restrictions

Many non-traditional experimentation partners have participated in military exercises; however, most are not familiar with what an experiment is, or its potential benefit to them.
An exercise is a simulated maneuver or operation, usually utilizing current doctrine and organization.19 Exercises are usually for the purpose of training personnel. The performance of the participants is usually graded. An experiment is a means of testing, in a controlled environment, the quality, value, or usefulness of a proposed solution to a real world problem to help support the practitioners in the field.20 The proposed solution is generally considered an innovated process, organization or technology/tool. Performance may be graded, but it is considered acceptable if the proposed solution is not completely successful or even ‘fails.’
In the case of SHAPE, the experimentation campaign will be a 12 month series of planning seminars, and spiral development activities leading to a Limited Objective Experiment LOE). There will be a discrete number of objectives that will be tested. The Phase 2 team will test and validate SHAPE within three exploration areas:
1. Process – What is the ideal way to use SHAPE processes to give us a ‘better’ plan?2. Organization – Who is best suited to work the process? 3. Technology – How can technology better enable the process and empower the user?
19 The Technical Cooperation Program (TTCP) Guide to Defense Experimentation (GUIDEx), Version 1.1, February 200620 Merriam-Webster Online Dictionary, http://www.m-w.com/dictionary/trial
PROPRIETARY INFORMATIONUse or disclosure of data on this page is subject to restrictions

Figure 1: Experiment Process
The LOE will consist of a number of levels: LOE Aim; Objectives; Critical Operational Issues (or the questions that the LOE seeks to answer though analysis); the Design (or treatment of the experiment, based on COIs); the Scenario that will be used to test SHAPE through injects and operational realism; and the Analysis and reporting of the findings.
The SHAPE software architecture will be tested in accordance with recognized experimentation requirements for technology demonstration/experimentation.
5.3 Aim
The experiment aim is to investigate, test, and validate the SHAPE process steps and concepts such as ‘best path and ‘dependency’, as well as the SHAPE software architecture and enabling tools as they contribute to an interagency SSTR plan. The intention of the experiment is to develop appropriate success factors with the plan, including linkages to Goals, Tasks, Resources and Assessment criteria.
5.4 Objectives
The objectives of the LOE will be developed and refined in the early stages of the experimentation campaign, but will be organized along the following themes:
Objective 1: To identify the insights associated with the application of the SHAPE architecture and tool suite to an interagency SSTR Planning Forum, and to codify findings in to a User’s Handbook.
Objective 2: To identify and codify skills, competencies and behaviors required of a) SHAPE Planning Forum ‘users’ (those who create the outputs), and b) SHAPE Planning Forum ‘consumers’ (those who will ultimately use the plan that is developed).
Objective 3: To determine if the provision of SHAPE assists in the planning of a joint performance planning, tasking, resourcing and monitoring effort in a mission-wide context, within an interagency forum.
Objective 4: To identify if the provision of an overarching framework such as the USG Draft Planning for Reconstruction, Stabilization and Conflict Transformation assists in the planning of a joint performance planning, tasking, resourcing and monitoring effort in a mission-wide context, within an interagency forum.
PROPRIETARY INFORMATIONUse or disclosure of data on this page is subject to restrictions

Objective 5: To identify if both an overarching framework such as the USG R/S and SHAPE assists in the planning of a joint performance planning, tasking, resourcing and monitoring effort in a mission-wide context, within an interagency forum.
5.5 CRITICAL OPERATING ISSUES (COIs) and ANALYSIS
There will be a number of COIs that can be addressed in the LOE, and include possible themes highlighted below. In order to address these COIs, specific study questions will be drafted and issued to the Analysis Team as they observe the 3 experiment groups.
COI1: Current USG planning processes are not sufficient to produce a shared, comprehensive, and dynamic plan that ensures asset-based, participatory planning for complex SSTR. This challenge addresses improving the capacity for and ability of the Interagency to conduct more effective planning. How can SHAPE increase planning effectiveness?
COI2: Current USG and ‘other’ tool capabilities for strategic and operational planning do not effectively allow for planners to create and visualize dynamic SSTR plans. How can SHAPE address this?
COI3: Current USG processes and tool for strategic and operational planning are not dynamic or responsive to fluctuations in the SSTR environment (analysis of threats, illicit power structures) that may affect plans over time. How can SHAPE, and its integration with existing capabilities, address this?
Lessons learned from part USG and multinational SSTR will be analyzed in the formation of the experiment plan. In addition, business planning models will be explored as part of the experiment design. Lessons learned are extracted with the hope that they will have direct relevance to the public sector and federal agencies, and some of these lessons will be rolled into experimentation guidelines for the Experiment Design Document that will be prepared for a follow-on phase. How can all of these lessons learned from prior research and practice inform us and help improve USG SSTR planning?
5.6 Design & Hypothesis
PROPRIETARY INFORMATIONUse or disclosure of data on this page is subject to restrictions

The SHAPE concept and tool will be investigated by experimental manipulation (independent variable) and therefore will have an experimental hypothesis. The hypothesis will be developed in Phase 2, but will follow the theme:
“Different processes and tools for the development of a comprehensive, asset-based, participatory, S&RO Plan will lead to a significantly different quality of planning output”.
The SHAPE LOE will be an empirical investigation using human participants. The ‘planning development’ aspect of the experiment will use a “between subjects” design with each group receiving a different treatment. To this end the three different planning groups will work in parallel, one using only SHAPE and existing S/CRS planning principles; one will be given only the existing S/CRS guidance for SSTR; and one will be given no specific tools and asked to use their best judgment in the formation of an SSTR plan. Each group will be given the same Policy Goal(s). The groups will also need to provide a synopsis of the key issues, the key outputs that their plan would need to achieve (expressed in terms of their outcomes), the Tasks that would be required to achieve the Goal(s), the organizations that should take the lead for delivery of different aspects of the Plan, and, critically, the ‘dependencies’ and ‘best paths’ between Goals and supporting activities and outputs at each step of the SHAPE process. The exact detail of the experimental treatments is illustrated below.
Figure 2: Experimental Design of AutoMAP LOE The SHAPE aspect of the investigation will be an in-depth comparative analysis of the planning processes and products between the three groups.
PROPRIETARY INFORMATIONUse or disclosure of data on this page is subject to restrictions
SHAPE LOE Design:
Between groups
SHAPE + S/CRS principles
CONTROL (No Guidance) S/CRS principles

5.7 Experimental Environment and Procedure
The SHAPE concept and tool suite can be used for theatre level USG or potentially coalition and interagency planning. To assess their utility, a suitable simulation of this level of planning will have to be undertaken. Participants will be grouped and assigned ‘roles’ based on relevant USG and international SSTR functional areas. There will also be a limited number Subject Matter Experts and control group participants to provide guidance and scenario-related ‘triggers.’ Experiment participants in the 3 groups will be given a simulated tasking from a controlled, simulated policy group. It is extremely important that the strategic guidance is of suitable detail that the 3 planning groups can conduct their planning without having to resort to undertaking substantial rewriting of the strategic guidance.
As noted above, the experimental design requires three different groups who plan in parallel from the same tasking but use different approaches to developing their Plans. To enable the participants to plan they require a fairly detailed scenario. To this end, an operationally-relevant scenario will be used to test the process. Suggestions have been made that the scenario either be a subset of the larger MNE 5 West African scenario focusing on the Mano River region, or a subset of the more contained Haiti Stabilization Initiative (HSI) plan to stabilize the volatile Cité Soleil area of Port-au-Prince. Each is a valid scenario option. The scenario should reflect realistic Strategic Guidance given and must include a clearly written Aim or Policy Goal, as well as list of Decisive Conditions. The scenario should also include those organizations that are currently or expected to be operating in the area which would influence subsequent planning for an intervention. Participants should be briefed to not ‘fight’ the scenario and ask for clarification if confusion arises. The scenario is just the vehicle to support the planning processes
Figure 3: Design of Trigger event
The LOE will use a common experimental method for control, mostly via an initial briefing to the participants and using some facilitation as ‘trusted agents.’ However, further control can, where necessary, be exerted via both High Control (HICON) and Low Control (LOCON). The use and requirement for this control should be in accordance with the final Experimental Design produced in Phase 2. The scenario, as well as role players representing
PROPRIETARY INFORMATIONUse or disclosure of data on this page is subject to restrictions
Trigger event
Participant Behavior,
Products and use of Tool
The SHAPE Plan

USG, UN and NGO actors will be used to produce ‘trigger events’ to stimulate the 3 groups into developing a realistic plans based on the SHAPE process steps.
The efficiency and effectiveness of the different approaches to developing their respective Plans will be evaluated by both process analysis, use of the SHAPE process and tool, and to a limited extent output quality analysis – how ‘good’ is the plan? A number of subjective measures and qualitative feedback will be collected during the event. These will be developed with the final Experiment Design. Role players and Subject Matter Experts are vitally important to the success of the experiment. It is important for the role players to play their part(s) as closely to the real world as possible. The experiment will take 2-5 days.
5.8 Experiment Design Assessment
The Experiment Design will be assessed using the criteria documented in the table in ANNEX 1. The table identifies 21 threats to valid experimentation. Each of these threats is rated for its importance to this experiment (rated as high, medium or low). The risk of each threat is then rated as red (significant problem or shortfall), yellow (area of concern or experiment limitation) or green (no known problems). The Experiment Design Document produced will highlight techniques for mitigating the risk of any threat evaluated as red or yellow.
PROPRIETARY INFORMATIONUse or disclosure of data on this page is subject to restrictions

6. ConclusionThis report constituted the Final Report for STTR 2007 Topic 3, calling for the development of a ‘Stakeholder Asset Based Planning Environment’ (SHAPE) architecture. The Logos Team has developed this architecture in three complimentary themes: 1) concept (process) and 2) implementation (software architecture); 3) experimentation.
The Report has five primary sections, and two Annexes. The first section introduces SHAPE and identifies the problem. The second section provides the conceptual history and context for SHAPE, and presents an innovative, asset-based, participatory planning process for Stability, Security, Transition, and Reconstruction operations (SSTR). The planning process is meant to be inclusive, that is interagency, NGO and local ‘stakeholder’ participation. It is a dynamic planning process, that integrates critical path methodologies and feedback loops for periodic assessment. The third section entails a comprehensive literature review. The SHAPE STTR product extrapolates four ‘big ideas’ inherent in ‘Environment Shaping,’ and from those ideas takes the ‘Environment Shaping’ methodology several steps further by both describing in detail all of its important components and adding a few more, but also by describing the operational processes required to actually use the methodology when planning for a real deployment to an SSTR theatre. The four ‘big ideas’ are: ‘Wicked Problems’; ‘Resilience’; the ‘Socio-Ecosystem Perspective;’ and. ‘Asset-based Participatory Assessment and Planning.’ The next section implements the conceptual planning architecture in within a practical and modular software architecture. This software architecture uses, in most cases, open source software applications to provide functionality to support the asset-based planning process. In a few cases, we suggest commercial off-the-shelf (COTS) software because it provides a more robust capability than we could identify in surveying the open source repositories. Software to implement the functional capabilities to support the asset-based planning process and methodology will have to be developed anew. While some tools provide functional support, the unique nature of the process and methodology requires new software to be developed. Thus, we suggest two software development environments and recommend that software development be performed using the Java programming language as the most transportable language for developing software applications. Finally, the STTR Final Report closes with an Experiment Design, meant to test and further develop the SHAPE process within a controlled Limited Objective Experiment (LOE). The LOE will be Objectives-led, with several Critical Operating Issues (COIs) analyzed through observation and interview of 3 controlled participant teams, each planning a SSTR based on a realistic scenario – one with the SHAPE process as a guiding framework, one with just S/CRS principles as guidance, and one with no guidance at all.
Stability, Security, Transition, and Reconstruction (SSTR) operations present an almost unimaginable complexity to planners and implementers alike. The complexities are both intellectual and material. One of the principles derived naturally from the ‘big ideas’ listed above is that truly sustainable solutions must be derived locally (internally) and not by
PROPRIETARY INFORMATIONUse or disclosure of data on this page is subject to restrictions

foreigners (externally). The basic planning principle that follows is that planners must include locals in the planning and assessment process, and build their solutions based predominately on local assets. The Logos Team has presented an actionable SHAPE architecture that encapsulates these principles with a dynamic, iterative planning process.
PROPRIETARY INFORMATIONUse or disclosure of data on this page is subject to restrictions

ANNEX 1: : SHAPE LOE Risk Evaluation Matrix
SHAPE LOE Risk Evaluation Matrix
Threat Importance to this
Event
Status Rating After Risk Mitigation
Ability to use capability1. Capability not workable: Does the hardware and software work?
Low Green
2. Player non-use: Do the players have the training and TTP to use the capability?
High Yellow
3. No potential effect in output:Is the output sensitive to capability use?
High Yellow
4. Capability not exercised: Does the scenario and Master Scenario Event List (MSEL) call for capability use?
High Green
Ability to Detect ResultsCorrectly detect a true effect
5. Capability variability: Is systems (hardware and software) and use in like trials the same?
Low Green
6. Player variability:Do individual operators/units in like trials have similar characteristics?
Medium Yellow
7. Data collection variability: Is there a large error variability in the data collection process?
Medium Green
8. Trial conditions variability: Are there uncontrolled or unmonitored changes in trial conditions for like trials? Look for intervening variables not recorded.
Medium Green
9. Low statistical power: Is the analysis sample sufficient?
Low Yellow
Incorrectly detect an artificial effect10. Violation of statistical assumptions: Are correct analysis techniques used and error rate avoided?
Low Green
Ability to Isolate Reason for ResultsSingle Group11. Capability changes over time: Are there system (hardware or software) or process changes during the test?
Low Green
12. Player changes over time: Will the player unit Low Green
PROPRIETARY INFORMATIONUse or disclosure of data on this page is subject to restrictions

change over time?13. Data collection changes over time: Are there changes in instrumentation or manual data collection during the experiment?
Low Green
14. Trial condition changes over time: Are there changes in trial conditions (such as weather, light, start conditions, and threat) during the experiment?
Low Green
Ability to Isolate Reason for ResultsMultiple Groups15. Player differences: Are there differences between groups unrelated to the treatment?
Medium Yellow
16. Data collection differences: Are there potential data collection differences between treatment groups?
High Green
17. Trial condition differences: Are the trial conditions similar for each treatment group?
High Green
Ability to Relate Results to Operations18. Nonrepresentative capability: Is the experimental surrogate functionally representative?
High Red
19. Nonrepresentative players: Is the player unit similar to the intended operational unit?
High Yellow
20. Nonrepresentative measures: Do the performance measures reflect the desired operational outcome?
Low Yellow
21. Nonrepresentative scenario: Are the Blue, Green, and Red conditions realistic?
Medium Yellow
PROPRIETARY INFORMATIONUse or disclosure of data on this page is subject to restrictions
ANNEX 2: ReferencesAlberti, M. and J. Marzluff (2004). "Resilience in urban ecosystems: Linking urban patterns to human and ecological functions." Urban Ecosystems: 241-265.
Anderies, J. M., M. A. Janssen, et al. (2002). "Grazing management, resilience and the dynamics of a fire driven rangeland system." Ecosystems 5: 23-44.
Ashford, G. and Patkar, S. (2001) "The appreciative inquiry approach" in Graham Ashford & and Saleela Parker (2001). Enhancing Ownership and Sustainability: A Resource Book on Participation (pp 86-93). International Fund for Agricultural Development (IFAD), Asian NGO Coalition for Agrarian Reform and Rural Development (ANGOC), and International Institute for Rural Construction (IIRR).
Barber, B. (1984). Strong Democracy: Participatory Politics for a New Age. Los Angeles, Ca.: University of California Press.
Bartone, C. (1994). Toward Environmental Strategies for Cities: Policy Considerations for Urban Environmental Management in Developing Countries, UNCHS, World Bank, & UNDP Urban Management Programme (UMP). Paper No. 18.
Baskerville, G. L. (1995). The forestry problem: Adaptive lurches of renewal. Barriers and Bridges to the Renewal of Ecosystems and Institutions. L. H. Gunderson, C. S. Holling and S. S. Light. New York City, Columbia University Press: 37-102.
Berkes, F. and C. Folke, Eds. (1998). Linking social and ecological systems. London, Cambridge University Press.
Bruneau, M., S. E. Chang, et al. (2003). "A framework to quantitatively assess and enhance the seismic resilience of communities." Earthquake Spectra 19(4): 733-752.
Carpenter, S., B. Walker, et al. (2001). "From metaphor to measurement: Resilience of what to what?" Ecosystems 4: 765-781.
Carpenter, S., B. Walker, et al. (2001). "From Metaphor to Measurement: Resilience of What to What?" Ecosystems 4: 765–781.
Carpenter, S. R. and K. L. Cottingham (1997). "Resilience and restoration of lakes." Conservation Ecology 1(1).
Chambers, R. (1997). Whose reality counts? Putting the first last. London: Intermediate Technology Publications.
PROPRIETARY INFORMATIONUse or disclosure of data on this page is subject to restrictions
Chandrasekaran, B., J. R. Stephenson and V. R. Benjamins. (1999). “What are Ontologies, and Why Do We Need Them?”, IEEE Intelligent Systems 01/02:20-26.
Conklin, J. (2003). Dialog Mapping: An Approach for Wicked Problems, CogNexus Institute.
Conklin, J. (2006). Dialogue Mapping: Building Shared Understanding of Wicked Problems, Wiley.
Conklin, J., M. Basadur, et al. (2007). "Rethinking Wicked Problems: Unpacking Paradigms, Bridging Universes." NextD Journal(10).
Cooke, B. and U. Kothari, Eds. (2001). Participation: The New Tyranny? New York, Zed Books.
Dabelko, G. and K. Conca (2002). Environmental Peacemaking. Baltimore, MD, JohnsHopkins University Press.
Denning, P. (2006). “Hastily Formed Networks”, Communications of the ACM, 49(4):15-20
Desfor, G. and R. Keil (2004). Nature and the City: Making Environmental Policy in Toronto and Los Angeles. Tucson AZ, The University of Arizona Press.
Dewar, T., J. P. Kretzmann, et al. (1997). Guide To Evaluating Asset-Based Community Development: Lessons, Challenges, and Opportunities. Chicago, IL, ACTA Publications.
Douville, J. M. (2007). Designing Excellence Into America's Stability, Security, Transistion and Reconstruction (SSTR) Efforts. USAWC Strategy Research Project. Washington, D.C., U.S. Army War College.
Edwards, M. (1999). Future positive: International co-operation in the 21st century. London, U.K.: Earthscan Publications.
Elasha, B. O., N. G. Elhassan, et al. (2005). Sustainable livelihood approach for assessing community resilience to climate change: Case studies from Sudan. AIACC Working Paper No.17, UNEP/WMO Intergovernmental Panel on Climate Change.
Endsley, M. R. (2001). “Designing for situation awareness in complex systems”, Proceedings of the Second intenational workshop on symbiosis of humans, artifacts and environment, Kyoto, Japan.
Folke, C., S. Carpenter, et al. (2002). "Resilience and sustainable development: Building adaptive capacity in a world of transformations." Ambio 31(5): 437-440.
PROPRIETARY INFORMATIONUse or disclosure of data on this page is subject to restrictions

Forgy, C. (1982). "Rete: A Fast Algorithm for the Many Pattern/Many Object Pattern Match Problem", Artificial Intelligence, 19, pp 17-37.
Foster, M. and Mathie, A. (2001). “Situating asset-based community development in the international development context.” Available from http://www.stfx.ca/institutes/coady/
Fuchs, R. F., Ellen Brennan, Joseph Chamie, Fu-chen Lo, and Juha I. Uitto, Ed. (1994). Mega-City Growth and the Future, United Nations University Press.
Geertz, C. (1963). Agricultural involution: the process of ecological change in Indonesia. Berkeley, CA, University of California Press.
Gittell, R. and Vidal, A. (1998). Community Organizing: Building Social Capital as a Development Strategy. Thousand Oaks, CA: Sage Publications.
Greene, M. (2000). The power of associations: Not mapping but organizing. Unpublished paper. Available from ABCD Neighborhood Circle Initiative, ABCD Institute, Evanston, IL.
Gunderson, L. (2000). "Ecological resilience—in theory and application." Annual Review of Ecological Systems 31: 425-39.
Gunderson, L., C. Holling, et al. (1995). Barriers and bridges to the renewal of ecosystems and institutions. New York, Columbia University Press.
Gunderson, L. and C. S. Holling, Eds. (2001). Panarchy: understanding transformations in human and natural systems. Washington, DC, Island Press.
Gunderson, L. H., S. R. Carpenter, et al. (2006). "Water RATs (resilience, adaptability, and transformability) in lake and wetland social-ecological systems." Ecology and Society 11(1:16).
Hanna, S., C. Folke, et al. (1996). Rights to Nature. Washington, D.C., Island Press.
Hawley, L. (2002). Generic POL-MIL Plan for a Multilateral Complex Contingency Operation, US Department of State.
Heiken, G. and G. Valentine (2000). Cities-National and Global Security Issues, Los Alamos National Laboratory.
Holling, C. S. (1973). "Resilience and stability of ecological systems." Annual Review of Ecological Systems 4: 1-23.
PROPRIETARY INFORMATIONUse or disclosure of data on this page is subject to restrictions

Holling, C. S. (1986). The resilience of terrestrial ecosystems; local surprise and global change. Sustainable development of the biosphere. W. C. Clark and R. E. Munn. Cambridge (England), Cambridge University Press: 292-317.
Holling, C. S. (1996). Engineering resilience versus ecological resilience. Engineering within ecological constraints. P. Schulze. Washington, D.C., National Academy Press: 31-44.
Hull, D. L. (1988). Science as a process. Chicago, University of Chicago Press.
IFRC (2004). Focus on Community Resilience. World Disasters Report. Geneva, Switzerland, International Federation of Red Cross and Red Crescent Societies: 231.
JFCOM, US Government Draft Planning Framework for Reconstruction, Stabilization, and Conflict Transformation, Joint Forces Command/Coordinator for Reconstruction and Stabilization, Version 1.0, 1 December 2005 (Pamphlet).
Kendra, J. and T. Wachtendorf (2001). Elements of Community Resilience in the World Trade Center Attack. 48th North American Meetings of the Regional Science Association International. Charleston, SC, USA.
Kinzig A and others. (2000, 4/15/2008). "Nature and society: an imperative for integrated environmental research." from http://lsweb.la.asu.edu/akinzig/report.htm.
Klein, R. and R. Nicholls (1999). "Assessment of coastal vulnerability to climate change." Ambio 28: 182–87.
Kretzmann, J. P. and J. A. McKnight (1993). Building Communities from the Inside Out: A Path Toward Finding and Mobilizing a Community’s Assets. Chicago, IL, ACTA Publications.
Lempert, R.J., S. W. Popper, S. C. Bankes. (2003). Shaping the Next One Hundred YearsNew Methods for Quantitative, Long-Term Policy Analysis, RAND Research Report MR 1626, http://rand.org/pubs/monograph_reports/MR1626/index.html
Logos Technologies. (2008a). Automation of Strategic Planning Frameworks with ‘AutoMAP’, DOD/OSD 2007 STTR Final technical Report, Arlington, VA.
Logos Technologies. (2008b). MPICE Handbook, Arlington, VA.
Levin, G., E. Roberts, et al. (1975). The Persistent Poppy: A Computer-aided Search for Heroin Police. Cambridge, MA, Ballinger Publishing Co.
Levin, S. (2005). "Self-organization and the emergence of complexity in ecological systems." BioScience 55(12): 1075-1079.
PROPRIETARY INFORMATIONUse or disclosure of data on this page is subject to restrictions

Liotta, P. and J. Miskel (2004). "Redrawing the Map of the Future." World Policy Journal (Spring).
Ludwig, D., B. Walker, et al. (1997). "Sustainability, stability and resilience." Conservation Ecology 1(1).
Luthar, S. S., D. Cicchetti, et al. (2000). "The Construct of Resilience: A Critical Evaluation and Guidelines for Future Work." Child Development 71(3): 543–562.
Mathiem, A. et al (2002). From Clients to Citizens: Asset-Based Community Development as a Strategy For Community-Driven Development.
Moser, C. (1998). The asset vulnerability framework: Reassessing urban poverty reduction strategies. World Development, 28, 1-49.
Mizoguchi, R. (2000). Ontology Development Tools and Languages, http://www.ei.sanken.osaka-u.ac.jp/pub/miz/Part2V3.pdf
Nau, D., S.J.J. Smith, and K. Erol. (1998). "Control Strategies in HTN Planning: Theory versus Practice." In AAAI-98/IAAI-98 Proceedings, pp. 1127-1133
Nau, D., Y. Cao, A. Lotem, and H. Muñoz-Avila. (1999). "SHOP: Simple Hierarchical Ordered Planner." In IJCAI-99, pp. 968-973
Nau. D. (2000). "Ordered Task Decomposition: Theory and Applications," Part 1 and Part 2. PLANET International Summer School on AI Planning, October 2000. Viewgraphs describing Ordered Task Decomposition.
Nau, D. (2005). May All Yours Plans Succeed!, AAAI-05, July 2005. An invited talk giving an overview of automated planning.
Norton, R. J. (2003). "Feral Cities: The New Strategic Environment." Naval War College Review(Autumn).
Olsson, P., C. Folke, et al. (2004). "Adaptive co-management for building resilience in social-ecological systems." Environmental Management 34: 75-90.
OntoWeb. (2002). A Survey of Ontology Tools, http://ontoweb.aifb.uni-karlsruhe.de/About/Deliverables/D13_v1-0.zip
Paton, D., M. Daly, et al. (2006). Measuring Community Resilience in Auckland, New Zealand. Cities on Volcanoes Conference 4. Quito, Ecuador.
PROPRIETARY INFORMATIONUse or disclosure of data on this page is subject to restrictions

Perrings, C. (2006). "Resilience and sustainable development." Environment and Development Economics 11: 417-427.
Pimm, S. (1984). "The complexity and stability of ecosystems." Nature 307: 321-326.
Popp, R., S. Kaisler, D. Allen et al. (2006). Assessing Nation-State Fragility, IEEE Aeroconference, March 6-11, 2006, Big Sky, MN
Prevention Institute (2004). Thrive: Toolkit for health and resilience in vulnerable environments. Oakland, CA, Prevention Institute.
Putnam, R. (1993). Making Democracy Work: Civic Traditions in Modern Italy. New Jersey: Princeton University Press.
Putnam, R. (2000). Bowling alone: The collapse and revival of American community. New York: Simon and Schuster.
Redman, C. (1999). Human impact on ancient environments. Tucson, AZ, University of Arizona Press.
Resilience Alliance. (2007). Assessing and managing resilience in social-ecological systems: A practitioners workbook. Volume 1, version 1.0. Available at http://www.resalliance.org/3871.php
Resilience Alliance. (2007). Assessing resilience in social-ecological systems: A scientists workbook. Available online http://www.resalliance.org/3871.php
Richardson, G. (1986). "Problems with Causal-Loop Diagrams." Systems Review 2(2): 158-170.
Ritchey, T. (2007). "Wicked Problems: Structuring Social Messes with Morphological Analysis." Swedish Morphological Society.
Rittel, H. and M. Weber (1973). "Dilemmas in a General Theory of Planning." Policy Sciences Vol. 4: 155-169.
Robinson, M. (1995). Towards a new paradigm of community development. Community Development Journal, 30(1), 21-30.
Rudolph, G. (2003). Some Guidelines For Deciding Whether To Use a Rules Engine, http://www.jessrules.com/jess/guidelines.shtml
Samuel, H. and M. Giles, Eds. (2004). Participation - From Tyranny to Transformation? Exploring New Approaches to Participation in Development. New York, Zed Books.
PROPRIETARY INFORMATIONUse or disclosure of data on this page is subject to restrictions

Serageldin, I. (1995). Nurturing development: Aid and cooperation in today's changing world. Washington, DC: The World Bank.
Shum, S. B. (1997). Representing Hard-to-Formalise, Contextualised, Multidisciplinary, Organisational Knowledge. AAAI Spring Symposium on Artificial Intelligence in Knowledge Management. Stanford University, Palo Alto, CA, AAAI Press.
Smith, S. J. J., D. S. Nau, and T. Throop. (1998). Computer Bridge: A Big Win for AI Planning, AI Magazine, 19(2):93–105.
Smit, J. and M. Bailkey (2006). Urban agriculture and the building of communities. Cities Farming for the Future - Urban Agriculture for Green and Productive Cities. R. van Veenhuizen. Phillipines, RUAF Foundation, IDRC, and IIRR: 458.
Stier, K. (2004). The 4th Annual: Year In Ideas; Feral Cities. New York Times. New York City.
Sustainability Institute (SI). (2001). Foundation Dynamics: Exploring the Leverage Points for Successfully Funding Sustainability, http://www.sustainer.org/pubs/FoundationDynamics.pdf
Tidball, K. G. (2008). "Raising" Resilience: Urban Community Forestry in Post-Conflict and Post-Disaster Contexts. Resilience 2008. Stockholm, Sweden.
Tidball, K. G. and M. E. Krasny (2007). From risk to resilience: What role for community greening and civic ecology in cities? Social Learning Towards a More Sustainable World. A. Wals. Wagengingen, Wagengingen Academic Press: 149-164.
Tidball, K. G. and M. E. Krasny (2008). Trees and Rebirth: Urban Community Forestry in Post-Katrina Resilience. CFERF Report. Berkeley CA, Community Forestry and Environmental Research Fellows Program. http://www.cnr.berkeley.edu/community_forestry/People/Final%20Reports/Tidball%20final%20report.pdf
Tilman, D. and J. Downing (1994). "Biodiversity and stability in grasslands." Nature 367: 363-365.
USAID. (2005). Conducting a Conflict Assessment: A Framework for Strategy and Program Development, US Agency for International Development, Washington, DC
Vale, L. J. and T. J. Campanella, Eds. (2005). The Resilient City: How Modern Cities Recover from Disaster. USA, Oxford University Press.
PROPRIETARY INFORMATIONUse or disclosure of data on this page is subject to restrictions

Walker, B. and D. Salt (2006). Resilience Thinking: Sustaining Ecosystems and People in a Changing World. Washington, DC, Island Press.
Weinstein, E. and K. G. Tidball (2007). "Environment shaping: An alternative approach to development and aid." Journal of Intervention and Statebuilding 1(Spring).
Woolcott, M., and Narayan, D. (2000). Social capital: Implications for development theory, research, and policy. The World Bank Research Observer, 15 (2), 225-249.
Woost, Michael D. (1997). "Alternative Vocabularies of Development? 'Community' and 'Participation' in Development Discourse in Sri Lanka." R.D. Grillo and R.L. Stirrat (Eds.), Discourses of development - anthropological perspectives. New York: Berg.
PROPRIETARY INFORMATIONUse or disclosure of data on this page is subject to restrictions