Embed Size (px)
Citation preview

Computers in Biology and Medicine 39 (2009) 231 -- 238
Contents lists available at ScienceDirect
Computers in Biology andMedicine
journal homepage: www.e lsev ier .com/ locate /cbm
Shape symmetry analysis of breast tumors on ultrasound images
Wei Yanga, Su Zhanga,∗, Yazhu Chena, Wenying Lib, Yaqing Chenb
aDepartment of Biomedical Engineering, Shanghai Jiao Tong University, Shanghai 200240, ChinabShanghai Sixth People's Hospital, Shanghai Jiao Tong University, Shanghai 200231, China
A R T I C L E I N F O A B S T R A C T
Article history:Received 23 February 2008Accepted 18 December 2008
Keywords:SymmetryBreast ultrasoundShape analysisMultiscale
Shape characteristics of malignant and benign breast tumors are significantly different. In this paper,the reflective symmetry of breast tumor shapes on ultrasound images was investigated. A new reflec-tive symmetry measure (RSML) derived from multiscale local area integral invariant was proposed toquantify the shape symmetry of breast tumor, which could be computed directly from the binary maskimage without the shape parameterization in terms of arc length. The performance of several symmetrymeasures for differentiating malignant and benign breast tumors at varying scales was evaluated andcompared by receiver operating characteristic (ROC) analysis. RSML with Gaussian kernel at scale 0.04(related to the maximal diameter) achieved the highest area under the ROC curve (0.85) on the imagedata of 168 tumors (104 benign and 64 malignant). The experimental results showed that the reflectivesymmetry of breast tumor shape was capable of providing potential diagnostic information, which couldbe characterized quantitatively by RSML with the appropriate scale parameter.
© 2009 Elsevier Ltd. All rights reserved.
1. Introduction
In the clinical evaluation of breast lesions on ultrasound, radiolo-gists consider various sonographical features, including lesion shape,margin definition, echogenic texture, posterior acoustic enhance-ment or shadowing [1]. Although the histological type of the breastlesion is rarely known at the time of ultrasound diagnosis, the dis-tinction between malignant and benign findings has to be made onthe basis of sonographic criteria [2]. Computerized schemes for eval-uating sonographic images have been proposed to reduce the oper-ator dependency and to provide a more objective interpretation ofultrasound findings and improve the diagnostic accuracy of radiol-ogists in the task of distinguishing between malignant and benignbreast lesions [3–9]. Especially, the researchers have also developedvariousmethods to quantify the shape feature of breast tumors, sincethe malignant and benign tumors have significantly different shapecharacteristics.
The shape characteristics of breast tumors on ultrasound relateto the pathology, and can reflect the growth pattern and the tu-mor's effects on its surrounding tissue. The malignant tumors withthe infiltrative growth pattern form their contours randomly. More-over, the tissue of malignant tumors with a high growth rate would
∗ Corresponding author. Tel.: +862134205825.E-mail addresses: [email protected] (W. Yang), [email protected]
(S. Zhang).
0010-4825/$ - see front matter © 2009 Elsevier Ltd. All rights reserved.doi:10.1016/j.compbiomed.2008.12.007
necrotize in some stages. Thus, the malignant breast tumors are usu-ally irregular, rough, spiculated, or microlobulated in shape. The be-nign tumor is usually associated with the expansive growth patternand its contour is usually smooth, round, oval, or macrolobulated[10]. Previous work on the shape analysis of breast tumor is focusedon measuring irregularity, roundness, spiculation, etc. We also ob-served that asymmetry was often a malignant sign and benign tu-mors were more symmetric than malignant ones on shape from theclinical observations, whichwas associatedwith the different growthpatterns. Actually, symmetry is an important criterion in medical di-agnosis. Especially, the shape symmetry of skin lesions have beeninvestigated and applied to computer-aided diagnosis [11].
In the mathematical definition of symmetry, an object never hasa certain degree of symmetry: either an object is symmetric or asym-metric. With that definition, natural things are rarely symmetric.Actually, symmetry is also a perceptive feature for humans, and canbe viewed as a continuous feature where intermediate values of sym-metry denote some intermediate amount of symmetry [12]. Varioussymmetry measures have been developed, such as symmetry trans-form distance [12], symmetry measure from turning function [13],symmetry measure from S-kernel [14], etc. However, these measuresare computed by analyzing the shapes at a single resolution scale.The scale is also a factor for the assessment of shape symmetry.At the different scales, the degree of symmetry should be different.A feasible way is to use scale space method to compute symmetryat different scales.
The purpose of this paper is to investigate the difference in shapesymmetry between the malignant and benign breast tumors, and
232 W. Yang et al. / Computers in Biology and Medicine 39 (2009) 231–238
analyze the effect of scale on the symmetry measures. The scaleshape representations and local area integral invariant signature[15,16] are employed to compute the scale symmetry measures.A new reflective symmetry measure (RSML) derived from local areaintegral invariant (LAII) is proposed to quantify symmetry of tumorshape. This work is limited to reflective (mirror) symmetry measures(RSM) on closed, non-self-intersecting planar curves, since the bi-nary segmentation of breast tumor from ultrasound images usuallyresults in closed, non-self-intersecting contours and the symmetryof breast tumor normally occurs as reflective symmetry.
2. Reflective symmetry measures for planar shape
2.1. Related works on symmetry measure
A 2D object is reflective-symmetric if it is invariant under a re-flection about a line (the reflective symmetry axis). Some symmetrymeasures, such as symmetry distance [12] and symmetry measuresfrom turning function [13] can be computed on the polygonal shape.
Let P be a polygonal shape which is presented by a sequence ofm points {pi = (xi, yi)}mi=1. Zabrodsky et al. [12] defined the symmetrydistance of P as the distance between P and its symmetry transformP′ = {p′
i}mi=1, and the symmetry transform of P was defined as thesymmetric shape P′, closest to P in terms of a metric. The distancebetween P and a polygonal shape Q with m points {qi}mi=1 is definedas
d(P,Q) =m∑i=1
‖pi − qi‖2/m.
The reflective symmetry transform can be found by the fold-ing/unfolding algorithm [12]. First, them=2k points of a given shapeP are divided to k pairs of points. There are k − 1 possible divisionsof points. Then, the orientation of the optimal reflective symmetryaxis through the centroid of P is determined by an analytic solu-tion for each division [12]. After that, a set of reflective-symmetricshapes {Qj}k−1
j=1 is obtained by the folding and unfolding opera-tions with respect to the optimal reflective symmetry axes. Thesymmetry transform P′ of P is the reflective-symmetric shape Qj∗among {Qj}k−1
j=1 , where j ∗ = arg minj∈{1,2,. . .,k−1} d(P,Qj). The reflective
symmetry distance of P is defined as
SD(P) =m∑i=1
‖pi − p′i‖2/m.
Symmetry distance can be transformed to a symmetry measure byexponential function (or the other functions), e.g.:
RSMD(P) = exp(−SD(P)). (1)
To compute RSMD, P is normalized by scaling the shape so thatthe maximum distance between the points on the contour and thecentroid is 10 pixels.
In fact, RSMD measures similarity between P and a certainreflective-symmetric shape. Another option of symmetry measureis to compare P with its reflection in the plane over a line, or theirshape signatures, which may be more appropriate to the perceptivecharacteristics of human, such as Sheynin's symmetry measuresfrom turning function [13] and classical symmetry measure fromregion area [17,18].
Denote by T(s) the angle between the x-axis and the normal tothe curve at the point p(s) along P, where s is the normalized curvelength of P and 0� s <1. The function T(s) is called a turning func-tion. The turning function of a polygon's reflection with respect toa line through the origin can be obtained conveniently. Denote byl�(P) the reflection of P with respect to a line l� through the origin
which makes an angle � (0�� <�) with the positive x-axis. Then,G(s)=−T(−s) is the turning function of the reflected shape l0(P). Theminimal dissimilarity metric for shapes P and l�(P) with varying �can be introduced as
�(P) = min�∈[0,�)
d(P, l�(P))
=(mint∈[0,1]
∫ 1
0(T(s + t) − G(s) + �)2 ds
)1/2
,
where �= ∫ 10 G(s) ds− ∫ 1
0 T(s) ds−2�t. An RSM from turning functionis defined as [13]:
RSMT(P) = exp(−�(P)). (2)
Let the binary mask B indicate the interior of the region boundedby a closed planar contour S and Bl be the reflection mask of Bwith respect to an axis l. The classical symmetry measure from thedifference between the regions of S and its reflection is defined as[11,17]:
RSMA(S) = maxl∈R2
Area(B ∩ Bl)/Area(B), (3)
where Area(B) is the area of the original mask B, and Area(B ∩ Bl) isthe overlapping area between B and the reflected mask Bl. For RSMA,the optimal symmetry axis is the line corresponding to its maximumvalue.
For all of these three RSM, the symmetry axes are implicit in thedefinitions. To compute RSMD and RSMT, the polygonal representa-tion is required, which can be obtained by the polygonal approxi-mation or sampling the points on the contour. However, RSMD andRSMT of a shape may depend on the polygonalisation algorithm orsampling. Furthermore, all of these RSM are defined on the originalshape and the effect of scale is not considered.
The scale space representation of a shape is created by progres-sively smoothing the shape by low-pass Gaussian filters of variablewidths � [18,19]. The details of the shape can be filtered out, andwhat remains is a coarser representation of the original shape, keep-ing its prominent features. Fig. 1 shows the scale space representa-tion of a breast tumor contour. As shown in Fig. 1, the contour S(s,�)would evolve to an ellipse with enough large scale � and the ap-pearance of S(s,�) is more symmetric as scale � increases. Using thesmoothed contour S(s,�) and its binary mask, we can also computethe symmetry measures associated with different scales. It is pre-dictable that symmetry of the contour smoothed by the larger scalefilter should become larger.
To obtain the scale space shape representation or signature, suchas curvature, the parameterization of a contour may be usually re-quired. However, the estimation of arc length of a digital contourfrom the binary mask is difficult. To avoid parameterization in termsof arc length, we introduce local area integral invariant signature[14] to define an RSM, which can be computed directly on the binarymask.
2.2. Integral invariant signature
A shape signature represents a shape by a one dimensional func-tion derived from the shape boundary points. Shape signatures areusually normalized into being translation and scale invariant suchas curvature and LAII [15]. An invariant signature is invariant withrespect to certain group transformations. Curvature is called differ-ential invariant since its calculation is based on differential opera-tions. Curvature is sensitive to noise because the calculation of thecurvature is dependent on second-order derivatives. In contrast tocurvature, integral invariants, such as distance integral invariant and

W. Yang et al. / Computers in Biology and Medicine 39 (2009) 231–238 233
Fig. 1. The evolution of tumor boundary as scale � increases.
Fig. 2. Illustration of local area integral invariant signature. (a) A tumor contour and a circle. The area of shadowing region is Ir of point p which is marked with a cross.(b) The corresponding Ir of all points on the contour.
area integral invariant [15], employ integral operations for their cal-culation and are robust to noise. Integral invariants are quite generaland contain regularized differential invariants as a subset. It is an ef-fective descriptor of shape and a local change of a shape affects thevalues of integral invariant for the entire shape, which have beenapplied to shape matching successfully [15]. Similar to RSMT derivedfrom turning function signature, we can also define the symmetrymeasure using integral invariant signature. LAII is introduced as fol-lows.
Area integral invariant [15]: define Kr:R2 × R2
�{0, 1}as an indi-cator kernel function on the interior of a circle with radius r centeredat point p:
Kr(p, x) ={1, |p − x|� r,0 otherwise.
For any given radius r, the corresponding integral invariant,
Ir(p).=∫BKr(p, x)dx,
can be thought of as a function from the interval [0 L] to R+ (sincearea is always nonnegative), bounded above by the area of B, whereL is the arc length of S and the binary mask B indicates the interiorof the region bounded by S. The area integral invariant can also benormalized by the area of Kr(p) for convenience
Ir(p).=∫BKr(p, x)dx/
∫R2
Kr(p, x)dx. (4)
The normalized integral invariant is then bounded between 0 and 1.This is illustrated in Fig. 2.
Furthermore, the kernel Kr(p, x) in (4) can be substituted by aGaussian kernel centered at p with width � = r:
G�(p, x) = exp(−|p − x|2)/(√2��).
Then, a `soft' version of area integral invariant is presented as
I�(p).=∫BG�(p, x)dx. (5)
Fig. 3. The multiscale LAII of a tumor contour.
Obviously, I�(p) is also bounded between 0 and 1. In [16], I�(p) isalso called as local shape feature.
LAII Ir and I� are relatively robust to noise. In fact, Ir entailsa regularized notion of curvature in a scale-space even where theboundary is not differentiable [15,16]. As defined in (4) and (5), ascale is associated with LAII. Varying r from zero to a maximumradius so that the local kernel Kr(p) encloses the entire curve, we cangenerate a multiscale integral invariant and various levels of featurescan be characterized in a shape feature scale-space. Fig. 3 shows themultiscale Ir of a tumor contour. As shown in Fig. 3, if the scale istoo small, the distinguishability of the signature degrades, and if thescale is too large, all parts of the signature tend to be identical. Thescale parameter is crucial to LAII.
The computation of Ir or I� need not parameterize the curve, sincethey can be yielded by convolving the binary mask B with the kernelKr or G�, not just the curve S [15]. Thus, we can index Ir or I� by thepixel length of point on boundary conveniently.
234 W. Yang et al. / Computers in Biology and Medicine 39 (2009) 231–238
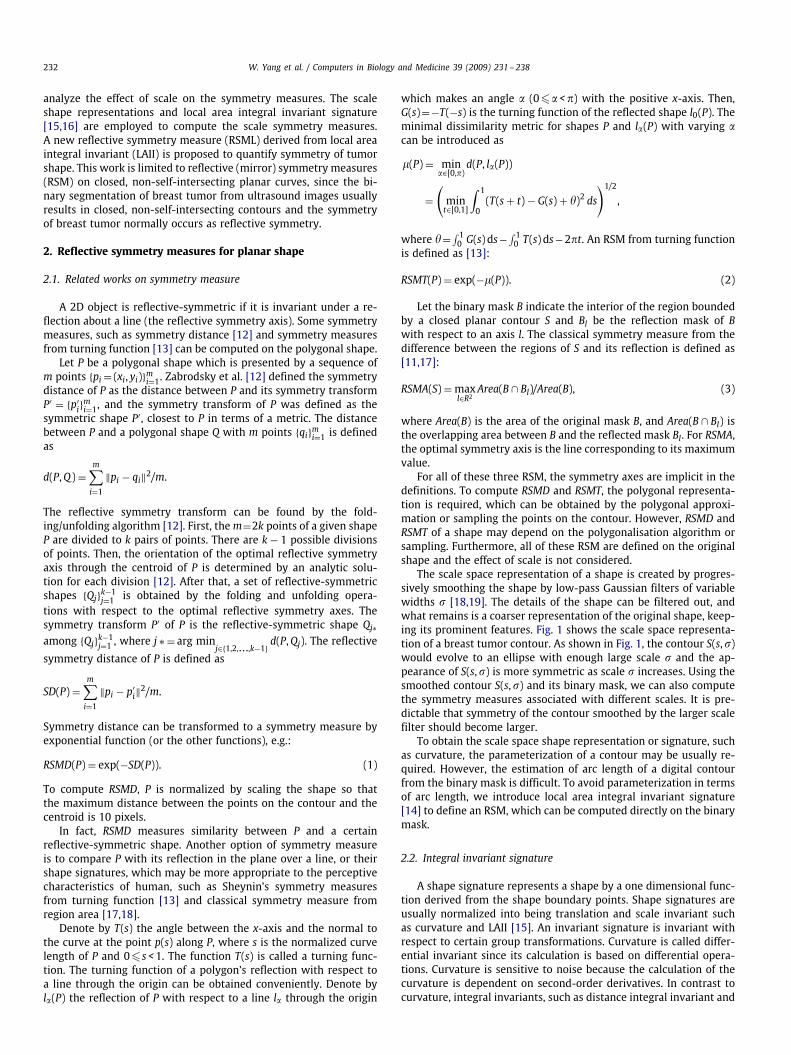
Fig. 4. A reflective-symmetric contour (a) and its LAII (b). The dash-dot lines are the optimal symmetry axes. The original and reflected LAII are completely overlapping on (b).
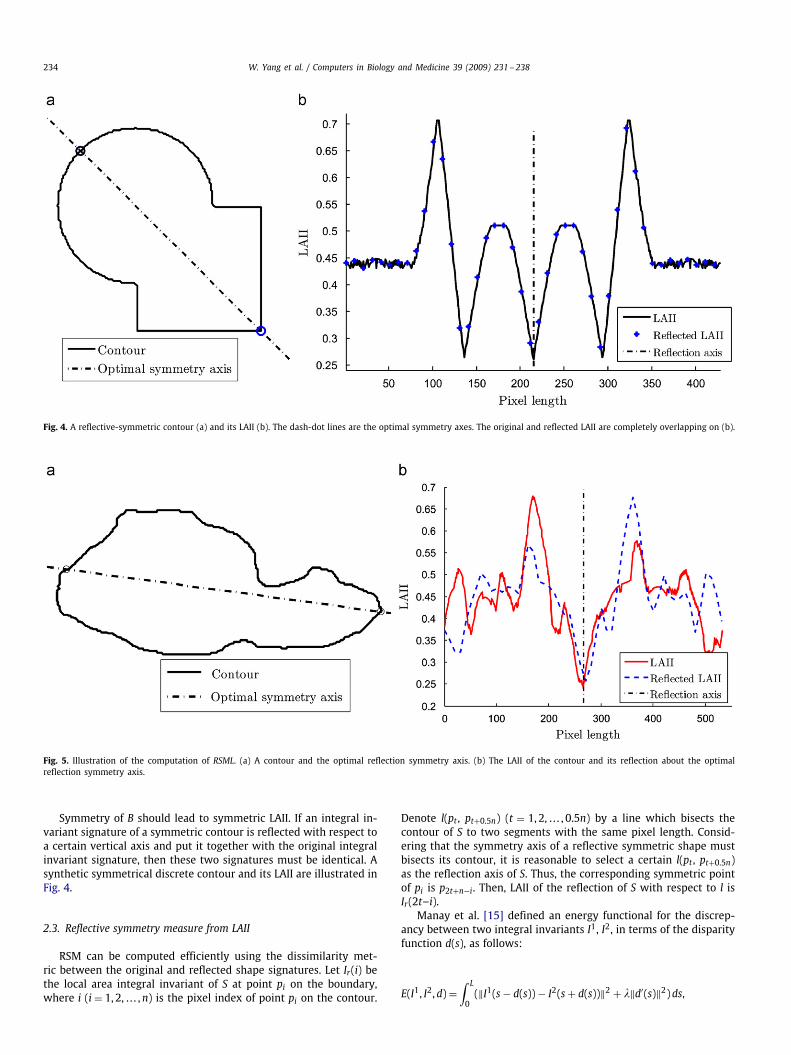
Fig. 5. Illustration of the computation of RSML. (a) A contour and the optimal reflection symmetry axis. (b) The LAII of the contour and its reflection about the optimalreflection symmetry axis.
Symmetry of B should lead to symmetric LAII. If an integral in-variant signature of a symmetric contour is reflected with respect toa certain vertical axis and put it together with the original integralinvariant signature, then these two signatures must be identical. Asynthetic symmetrical discrete contour and its LAII are illustrated inFig. 4.
2.3. Reflective symmetry measure from LAII
RSM can be computed efficiently using the dissimilarity met-ric between the original and reflected shape signatures. Let Ir(i) bethe local area integral invariant of S at point pi on the boundary,where i (i = 1, 2, . . . ,n) is the pixel index of point pi on the contour.
Denote l(pt , pt+0.5n) (t = 1, 2, . . . , 0.5n) by a line which bisects thecontour of S to two segments with the same pixel length. Consid-ering that the symmetry axis of a reflective symmetric shape mustbisects its contour, it is reasonable to select a certain l(pt , pt+0.5n)as the reflection axis of S. Thus, the corresponding symmetric pointof pi is p2t+n−i. Then, LAII of the reflection of S with respect to l isIr(2t–i).
Manay et al. [15] defined an energy functional for the discrep-ancy between two integral invariants I1, I2, in terms of the disparityfunction d(s), as follows:
E(I1, I2, d) =∫ L
0(‖I1(s − d(s)) − I2(s + d(s))‖2 + �‖d′(s)‖2)ds,
W. Yang et al. / Computers in Biology and Medicine 39 (2009) 231–238 235
where � is a constant. For S and its reflection with respect to l, thecorrespondence of their points is determined. Ignoring the disparityfunction d(s), we define the dissimilarity metric between Ir and itsreflection with respect to l in a discrete form as
Dr(t) =n∑
i=1
(Ir(i) − Ir(2t + n − i))2/n. (6)
Let t∗ minimize Dr(t):
t∗ = arg mint∈{1,. . .,0.5n}
Dr(t). (7)
Then, a new RSML based on LAII can be defined as
RSMLr(S) = 1 −√Dr(t∗). (8)
Line l(pt∗,pt∗+0.5n) is selected as the optimal reflection axis.In the optimization of (8), the optimal reflective axis is found
with the minimum dissimilarity between the original and reflectedLAII, which maximizes RSML, as shown in Fig. 5. The similar ideawas used to extract symmetry axes of curves through affine semi-local integral invariants in [20]. Since that LAII is associated with thescale parameter r and can characterize a shape with varying scales,RSMLr(S) is called as a scale symmetry measure. Substituting Ir by I�,we can defined the similar scale symmetry measure RSML�(S) withscale parameter �.
RSML satisfies some desired properties of measure with a moder-ate scale parameter: (1) 0�RSML(S)�1 for any shape S, because thenormalized LAII is bounded between 0 and 1. (2) If S is reflective-symmetric, RSML(S) = 1. (3) RSML(S) is a continuous real-valuedfunction. (4) RSML(S) is invariant under Euclidean and similaritytransform. S may not be reflective-symmetric if RSML(S) = 1, sinceLAII is identical with a large enough scale parameter. However, S isreflective-symmetric if RSML(S) = 1 at all scales.
3. Experimental results
3.1. Breast ultrasound image data and tumor segmentation
The breast ultrasound images of Chinese women were performedat the department of ultrasound in medicine, Shanghai Sixth Peo-ple's Hospital, Shanghai, China, and were collected from 2003 to2007. Only those images which did not contain overlaid cursors andin which pathology was clearly available were used for the study.
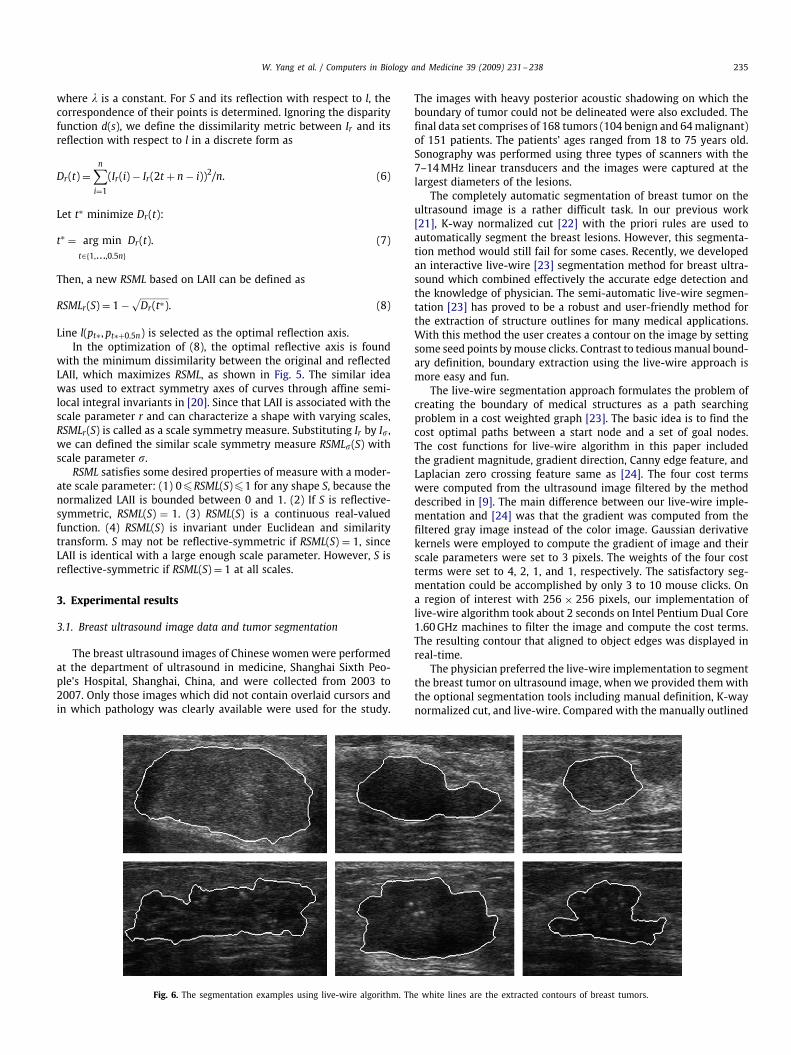
Fig. 6. The segmentation examples using live-wire algorithm. The white lines are the extracted contours of breast tumors.
The images with heavy posterior acoustic shadowing on which theboundary of tumor could not be delineated were also excluded. Thefinal data set comprises of 168 tumors (104 benign and 64malignant)of 151 patients. The patients' ages ranged from 18 to 75 years old.Sonography was performed using three types of scanners with the7–14MHz linear transducers and the images were captured at thelargest diameters of the lesions.
The completely automatic segmentation of breast tumor on theultrasound image is a rather difficult task. In our previous work[21], K-way normalized cut [22] with the priori rules are used toautomatically segment the breast lesions. However, this segmenta-tion method would still fail for some cases. Recently, we developedan interactive live-wire [23] segmentation method for breast ultra-sound which combined effectively the accurate edge detection andthe knowledge of physician. The semi-automatic live-wire segmen-tation [23] has proved to be a robust and user-friendly method forthe extraction of structure outlines for many medical applications.With this method the user creates a contour on the image by settingsome seed points bymouse clicks. Contrast to tediousmanual bound-ary definition, boundary extraction using the live-wire approach ismore easy and fun.
The live-wire segmentation approach formulates the problem ofcreating the boundary of medical structures as a path searchingproblem in a cost weighted graph [23]. The basic idea is to find thecost optimal paths between a start node and a set of goal nodes.The cost functions for live-wire algorithm in this paper includedthe gradient magnitude, gradient direction, Canny edge feature, andLaplacian zero crossing feature same as [24]. The four cost termswere computed from the ultrasound image filtered by the methoddescribed in [9]. The main difference between our live-wire imple-mentation and [24] was that the gradient was computed from thefiltered gray image instead of the color image. Gaussian derivativekernels were employed to compute the gradient of image and theirscale parameters were set to 3 pixels. The weights of the four costterms were set to 4, 2, 1, and 1, respectively. The satisfactory seg-mentation could be accomplished by only 3 to 10 mouse clicks. Ona region of interest with 256 × 256 pixels, our implementation oflive-wire algorithm took about 2 seconds on Intel Pentium Dual Core1.60GHz machines to filter the image and compute the cost terms.The resulting contour that aligned to object edges was displayed inreal-time.
The physician preferred the live-wire implementation to segmentthe breast tumor on ultrasound image, when we provided themwiththe optional segmentation tools including manual definition, K-waynormalized cut, and live-wire. Compared with the manually outlined

236 W. Yang et al. / Computers in Biology and Medicine 39 (2009) 231–238
Fig. 7. RSML with (a) indicator kernel and (b) Gaussian kernel as scale increases.
boundary, the boundary extracted using the live-wire approach wasmore accurate and could be reproducible. Moreover, the inter- andintra-observer variability of segmentation could be reduced by us-ing the live-wire approach. It was desirable that the shape featurescomputed from the semi-automatically segmented tumor contoursand their statistics were more stable and reliable. Some segmenta-tion results by one coauthor (W.Y. Li) are shown in Fig. 6. The shapesymmetry measures were computed from the semi-automaticallysegmented tumor contours and their polygonal approximation.
3.2. Effect of scale on RSML
To avoid the effect on symmetry measures of real tumor size,the scale parameters were set to the related values of the maximaldiameters of segmented tumor contours. The selected parameters rand � were set in range [0.01 0.75] for LAII and one-dimensionalsmoothing Gaussian filter scale parameter was set in range [0.010.35]. Fig. 7 shows RSML of 10 randomly selected tumor shapes atvarying scales with two different integral kernels. From Fig. 7, itcan be seen that the values of RSML with kernel Kr or G� tend toincrease as scale increases. However, the values of RSML also dependon the structures of tumor contour and the increasing speeds of RSMLrelated to the scales are different for the tumor contours. Thus, thedistinguishability of LAII is associated with the scale parameter. It isnecessary to select the appropriate scale parameter to quantify thesymmetry of tumor shapes using RSML.
3.3. Symmetry measures for distinguishing malignant from benigntumors
To evaluate the diagnostic performance of symmetry measures, areceiver operating characteristic (ROC) curve was generated by us-ing a sliding threshold on each measure and computing the sensitiv-ity and specificity for each threshold. The diagnostic performance issummarized by the area under the ROC curve (AUC) which is equal tothe probability that a classifier will rank a randomly chosen positiveinstance higher than a randomly chosen negative one [25]. Table 1lists AUC of RSML and RSMA for benign and malignant classifica-tion at varying scales. Obviously, AUC of RSML with moderate scaleparameters is higher than the too small or large scale parameters.Moreover, AUC of RSML with Gaussian kernel is slightly higher than
Table 1AUC of RSML and RSMA at different scales.
Scale 0.01 0.02 0.03 0.04 0.05 0.15 0.25 0.35 0.45 0.55 0.65 0.75
RSMLr 0.57 0.69 0.79 0.82 0.84 0.84 0.82 0.80 0.77 0.76 0.74 0.72RSML� 0.71 0.82 0.85 0.85 0.84 0.83 0.80 0.78 0.77 0.77 0.76 0.76RSMA 0.78 0.78 0.77 0.77 0.76 0.74 0.73 0.72 / / / /
Fig. 8. AUC of RSML and RSMA with varying scales.
indicator kernel. RSML with indicator and Gaussian kernels achievedthe highest AUC (0.84 and 0.85) at scale 0.05 and 0.04, respectively.
For computation of RSMA, the optimization algorithm, such asgenetic algorithm, can be used to search the optimal symmetry axis[19], but it is time-consuming. For the computation consideration,the major axis was used as the approximation of optimal axis. Thecontours smoothed by one-dimensional Gaussian kernels with dif-ferent scale parameters were used to compute RSMA. RSMA wererelatively stable to the scale varying. However, the highest AUC ofRSMA is less than RSML. Fig. 8 shows AUC of RSML and RSMA with
W. Yang et al. / Computers in Biology and Medicine 39 (2009) 231–238 237
the varying scale parameters. The appropriate scale parameter forRSML is about 0.04 to obtain the more strong distinguishability.
RSMT was calculated using the polygonal approximations of orig-inal tumor contours, and the polygonalisation algorithm described inour previous work [9] was employed. AUC of RSMTwas 0.79. To com-pute RSMD, both of the selected points by equal distance along thesmoothed contour with varying scale parameters and the polygonalrepresentation by the polygonalisation algorithm were used. AUC ofRSMD ranged only 0.5–0.6. RSMT and RSMD are not very suitable fordescribing the symmetry of tumor contours.
To assess the usefulness of symmetry measures associated withthe scale parameter, it is crucial to have a good estimate of their gen-eralization performance on future cases. Five-fold cross-validationwas used to minimize the impact of data dependency on the esti-mate of AUC. Each of the five random partitions of the cases servedas a test set for the symmetry measure with the scale parameter op-timized on the remaining four partitions. Five repetitions producedfive test ROC curves of the symmetry measure with the optimizedscale parameters. Then, we applied the vertical averaging algorithm[25] to obtain the average test ROC curve and to compute AUC, whichtook vertical samples of the five test ROC curves for fixed speci-ficity and averaged the corresponding sensitivity. The estimated AUCof RSML�, RSMLr , and RSMA were 0.84, 0.82, and 0.78, respectively.These AUC through five-fold cross-validation were very close to theAUC of symmetry measure with the optimal scale parameter overall of the cases. Actually, the classifier is very simple if we view
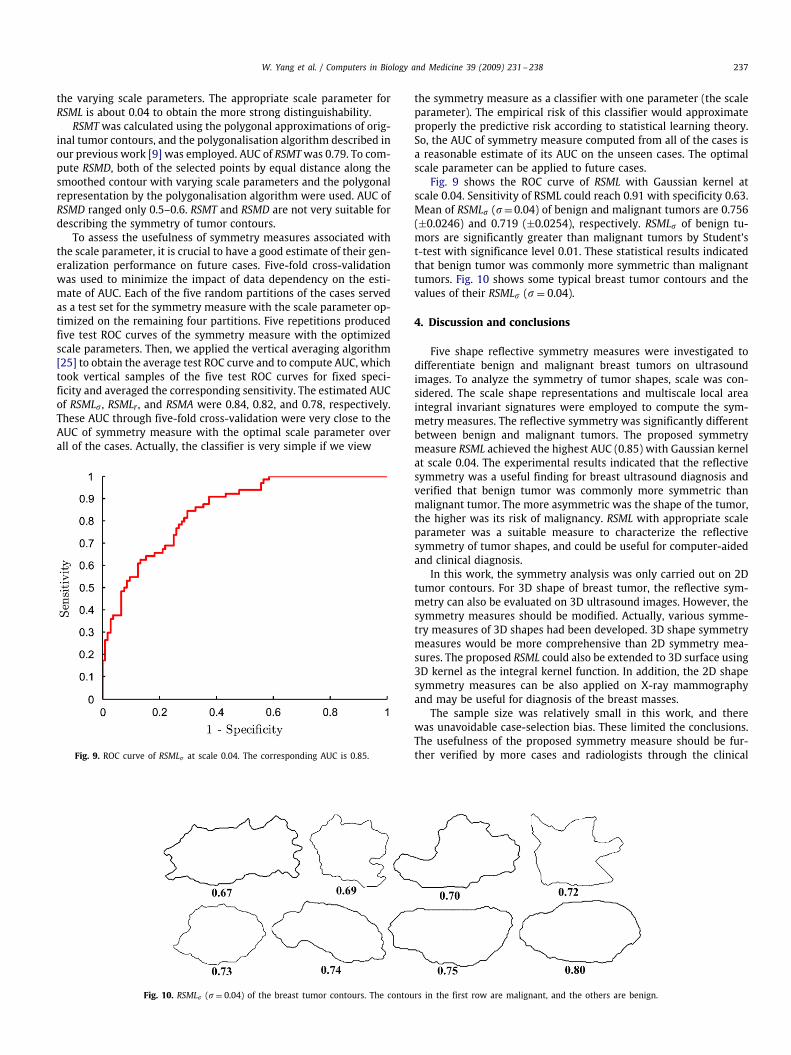
Fig. 9. ROC curve of RSML� at scale 0.04. The corresponding AUC is 0.85.
Fig. 10. RSML� (� = 0.04) of the breast tumor contours. The contours in the first row are malignant, and the others are benign.
the symmetry measure as a classifier with one parameter (the scaleparameter). The empirical risk of this classifier would approximateproperly the predictive risk according to statistical learning theory.So, the AUC of symmetry measure computed from all of the cases isa reasonable estimate of its AUC on the unseen cases. The optimalscale parameter can be applied to future cases.
Fig. 9 shows the ROC curve of RSML with Gaussian kernel atscale 0.04. Sensitivity of RSML could reach 0.91 with specificity 0.63.Mean of RSML� (�=0.04) of benign and malignant tumors are 0.756(±0.0246) and 0.719 (±0.0254), respectively. RSML� of benign tu-mors are significantly greater than malignant tumors by Student'st-test with significance level 0.01. These statistical results indicatedthat benign tumor was commonly more symmetric than malignanttumors. Fig. 10 shows some typical breast tumor contours and thevalues of their RSML� (� = 0.04).
4. Discussion and conclusions
Five shape reflective symmetry measures were investigated todifferentiate benign and malignant breast tumors on ultrasoundimages. To analyze the symmetry of tumor shapes, scale was con-sidered. The scale shape representations and multiscale local areaintegral invariant signatures were employed to compute the sym-metry measures. The reflective symmetry was significantly differentbetween benign and malignant tumors. The proposed symmetrymeasure RSML achieved the highest AUC (0.85) with Gaussian kernelat scale 0.04. The experimental results indicated that the reflectivesymmetry was a useful finding for breast ultrasound diagnosis andverified that benign tumor was commonly more symmetric thanmalignant tumor. The more asymmetric was the shape of the tumor,the higher was its risk of malignancy. RSML with appropriate scaleparameter was a suitable measure to characterize the reflectivesymmetry of tumor shapes, and could be useful for computer-aidedand clinical diagnosis.
In this work, the symmetry analysis was only carried out on 2Dtumor contours. For 3D shape of breast tumor, the reflective sym-metry can also be evaluated on 3D ultrasound images. However, thesymmetry measures should be modified. Actually, various symme-try measures of 3D shapes had been developed. 3D shape symmetrymeasures would be more comprehensive than 2D symmetry mea-sures. The proposed RSML could also be extended to 3D surface using3D kernel as the integral kernel function. In addition, the 2D shapesymmetry measures can be also applied on X-ray mammographyand may be useful for diagnosis of the breast masses.
The sample size was relatively small in this work, and therewas unavoidable case-selection bias. These limited the conclusions.The usefulness of the proposed symmetry measure should be fur-ther verified by more cases and radiologists through the clinical

238 W. Yang et al. / Computers in Biology and Medicine 39 (2009) 231–238
applications. In addition, the relationship between the computedsymmetry measures and the perceptive symmetry need also bestudied.
Conflict of interest statement
None declared.
Acknowledgements
This work is supported by National Basic Research Program ofChina (973 Program) (no. 2003CB716103), Project of Shanghai Sci-ence and Technology Committee (no. 064119632), and NSFC (no.60573033).
References
[1] A.T. Stavros, D. Thickman, C.L. Rapp, M.A. Dennis, S.H. Parker, G.A. Sisney, Solidbreast nodules: use of sonography to distinguish between benign and malignantlesions, Radiology 26 (1) (1995) 123–134.
[2] P. Skaane, K. Engedal, Analysis of sonographic features in the differentiationof fibroadenoma and invasive ductal carcinoma, Am. J. Roentgenol 170 (1998)109–114.
[3] Y.H. Chou, C.M. Tiu, G.S. Hung, S.C. Wu, T.Y. Chang, H.K. Chiang, Stepwise logisticregression analysis of tumor contour features for breast ultrasound diagnosis,Ultrasound Med. Biol. 27 (2001) 1493–1498.
[4] R. Sivaramakrishnaa, K.A. Powella, M.L. Lieberb, W.A. Chilcotec, R. Shekhara,Texture analysis of lesions in breast ultrasound images, Comput. Med. ImagingGraph. 26 (2002) 303–307.
[5] K. Horsch, M.L. Giger, L.A. Venta, C.J. Vyborny, Computerized diagnosis of breastlesions on ultrasound, Med. Phys. 29 (2002) 157–164.
[6] C.M. Chen, Y.H. Chou, K.C. Han, G.S. Hung, C.M. Tiu, H.J. Chiou, S.Y. Chiou,Breast lesions on sonograms: computer-aided diagnosis with nearly setting-independent features and artificial neural networks, Radiology 226 (2003)504–514.
[7] N. Piliouras, I. Kalatzis, N. Dimitropoulos, D. Cavouras, Development of thecubic least squares mapping linear-kernel support vector machine classifier forimproving the characterization of breast lesions on ultrasound, Comput. Med.Imaging Graph. 28 (5) (2004) 247–255.
[8] K.G. Kim, S.Y. Cho, S.J. Min, J.H. Kim, B.G. Min, K.T. Bae, Computerized schemefor assessing ultrasonographic features of breast masses, Acad. Radiol. 12 (2005)58–66.
[9] W. Yang, S. Zhang, W.Y. Li, Y.Q. Chen, Y.Z. Chen, Measuring shape complexity ofbreast tumors on ultrasound images, SPIE Medical Imaging 2008, Proceedingsof SPIE 6920 (2008) 69200J.
[10] J.U. Blohmer, G. Schmalisch, A. Kurten, R. Chaoui, W. Lichtenegger, Relevanceof sonographic criteria for differential diagnosis of mammary tumours, Eur. J.Ultrasound 6 (1) (1997) 35–41.
[11] V. Ng, B. Fung, T. Lee, Determining the asymmetry of skin lesion with fuzzyborders, Comput. Biol. Med. 35 (2) (2005) 103–120.
[12] H. Zabrodsky, S. Peleg, D. Avnir, Symmetry as a continuous feature, IEEE Trans.Pattern Anal. Mach. Intell. 17 (12) (1995) 1154–1166.
[13] S. Sheynin, A. Tuzikov, D. Volgin, Computation of symmetry measures forpolygonal shapes, Lecture Notes in Computer Science 1689 (1999) 183–190.
[14] B. Zavidovique, V.D. Gesù, The S-kernel: a measure of symmetry of objects,Pattern Recog. 40 (3) (2007) 839–852.
[15] S. Manay, D. Cremers, B.W. Hong, A. Yezzi, S. Soatto, Integral invariantsfor shape matching, IEEE Trans. Pattern Anal. Mach. Intell. 28 (10) (2006)1602–1618.
[16] B.W. Hong, E. Prados, L. Vese, S. Soatto, Shape representation based on integralkernels: application to image matching and segmentation, in: Proceedings of theIEEE Conference on Computer Vision and Pattern Recognition 2006 (CVPR'06),pp. 833–840.
[17] Z.M. Li, K.P. Hou, H. Li, Continuous symmetry measure of image, in: Proceedingsof the IEEE International Conference on Information Acquisition, 2006,pp. 824–828.
[18] A.D. Bimbo, P. Pala, Shape indexing by multi-scale representation, Image VisionComput. 17 (1999) 245–261.
[19] D.S. Zhang, G.J. Lu, Review of shape representation and description techniques,Pattern Recog. 37 (2004) 1–19.
[20] J. Sate, R. Cipolla, Affine integral invariants for extracting symmetry axes, ImageVision Comput. 15 (1997) 627–635.
[21] S. Zhang, W. Yang, H.T. Lu, Y.Z. Chen, W.Y. Li, Y.Q. Chen, Automatic featureextraction and analysis on breast ultrasound images, Comm. Comput. Info. Sci.2 (2007) 957–963.
[22] S.X. Yu, J. Shi, Multiclass spectral clustering, in: Proceedings of the IEEEInternational Conference on Computer Vision (ICCV'2003), pp. 313–319.
[23] W.A. Barrett, E.N. Mortensen, Interactive live-wire boundary extraction, Med.Image Anal. 4 (1) (1997) 331–341.
[24] A. Chodorowski, M. Ulf, L. Morgan, H. Ghassan, Color lesion boundary detectionusing live wire, in: Proceedings of SPIE Medical Imaging 2005, vol. 5747, 2005,pp. 1589–1596.
[25] T. Fawcett, An introduction to ROC analysis, Pattern Recog. Lett. 27 (8) (2006)861–874.
Wei Yang received the B.Sc. degree in automation from Wu Han University ofScience and Technology, China, in 2001 and the M.Sc. degree in control theory andcontrol engineering from Xia Men University, China, in 2005. He is currently workingtoward the Ph.D. degree with the Department of Biomedical Engineering, ShanghaiJiao Tong University, Shanghai, China. His research interests include image featureextraction, pattern recognition, and computerized-aid diagnosis.
Su Zhang is an Associate Professor with the Department of Biomedical Engineering,Shanghai Jiao Tong University, Shanghai, China. She received the Ph.D. degree inpattern recognition and intelligent control from Northwestern Polytechnical Univer-sity, China, in 2000. Her main research interests include medical image registration,image guided therapy technology, medical image analysis, and computerized-aiddiagnosis.
Yazhu Chen is an Academician with the Chinese Academy of Engineering, Beijing,China, and a Distinguished Professor with the Department of Biomedical Engineer-ing, Shanghai Jiao Tong University, Shanghai, China. Her main research areas aremultielement array ultrasound hyperthermia systems, high-intensity focused ultra-sound therapy technology, real-time medical information digital processing, 3-Dmedical image processing, and automatic control and electric technology. Prof. Chenwas a recipient of the Sate Science and Technology Award (First Prize) in 1987 forbeing a pioneer in the field of noninvasive technology.
Wenying Li received the B.M. degree from Forth Military Medical University, China,in 2004. She is currently working toward the M.D. degree with the Department ofMedicine, Shanghai Jiao Tong University, Shanghai, China. Her research interest isultrasound imaging of breast.
Yaqing Chen is a professor with Shanghai Jiao Tong University. She received theM.D. and Ph.D. degrees from Shanghai Second Medical University, China, in 2002 and2005, respectively. She is currently the director of Ultrasound Department, XinhuaHospital, Shanghai Jiao Tong University. Her research area is medical ultrasounddiagnosis.