Embed Size (px)
Citation preview

GLo
BA
Lwo
RTh
An
nu
AL R
ep
oR
T An
D Fin
An
CiA
L STATe
Me
nTS
2020
SHAPING THEBUSINESS FORTHE FUTURE —
PEOPLE — PLACES — TECHNOLOGY—
ANNUAL REPORT AND FINANCIAL STATEMENTS 2020

More on our values and behaviours on page 00
OUR PURPOSEGlobalworth’s mission is to create value for its shareholders, tenants, and the
local communities by acting consistently in an ethical and socially responsible manner.
Creating an environment in which people want to work and be associated with is a key objective for the Group, achieved through building a vibrant, modern
and greener portfolio.
OUR VALUESintegral to our culture is adhering to the highest standards
of ethical business practices and living by our values, which are:
OUR CULTURE– we believe that having the right culture within Globalworth has been integral to the
success of the Group over the past few years.
– elements of the culture are visible in the work of the Globalworth Foundation and other corporate social responsibility projects that we are engaged in.
– we have a management team that is focused on ensuring that we have a strong work ethic whilst also trying to create a positive working environment.
– our Board of Directors places significant importance on the roles of business ethics, sustainable development and corporate social responsibility within the overall approach
of the Group.
One Team Act with Integrity Respect, Diversity and Inclusion
Build an Environmentally
Friendly & Sustainable Future
Visit us online: WWW.GLOBALWORTH.COM

1Globalworth annual report and financial statements 2020
Overview strategic report portfolio review governance financial statements additional information
OverviewHighlights 1at a glance 2investment case 3covid-19 response 4
Strategic reportchief executive’s review 10our markets 14Business model 16strategy 18Key performance indicators 20standing portfolio review 24developments review 28asset management review 36capital markets review 42financial review 46
financing and liquidity review 52stakeholder engagement 54viability statement 58sustainable development update 60the globalworth foundation 64
Portfolio reviewportfolio snapshot 68present in 10 cities 70
Governanceintroduction to governance 76Board of directors 82directors’ report 84report of the audit committee 88report of the risk committee 94report of the nomination committee 103report of the remuneration committee 104
Financial Statementsconsolidated financial statements 110notes to the financial statements 114independent auditor’s report to the members of globalworth real estate investments limited 163
Additional informationschedule of properties 166new epra nav metrics 176investing policy 177glossary 178company directory 181
CONTeNTS
OUR PERFORMANCE2020 has been a year of significant challenges, with a first quarter full of optimism coming to an abrupt halt in March due to the COVID-19 pandemic. Our proactive approach, combined with the quality of our portfolio, and the strength of our team have resulted in a very resilient 2020 operating performance. We are in the best possible position to emerge stronger in due course and as a relative winner from the current turbulent times.
FiNANCiAL HiGHLiGHTS1 OPerATiONAL HiGHLiGHTS — total combined portfolio value remained effectively unchanged at €3.0 billion.
— €2.3 billion in environmentally certified properties.
— performed an extensive review of our cost base, passing on service charges savings to our tenants and reducing our administrative expenses by c.7.0% vs 2019.
— focused developments only on projects with significant pre-lets or advanced level of construction, delivering two class “a” offices and two high-quality industrial facilities in romania and poland with 95.8k sqm of gla.
— overall standing portfolio footprint increased by 4.7% to 1,271.3k sqm of gla.
— leasing transactions for a total of 303.5k sqm of commercial space at an average wall of 3.9 years.
— 74.3% related to lease renegotiations / extensions with our existing tenants.
— standing commercial occupancy remained high at 90.9% (91.7% including tenant options) as at year-end, impacted however by the delivery of properties under development still in lease-up stage and a 3.3% decrease in like-for-like occupancy due to the very challenging market conditions.
— annualised contracted rent of €183.4 million, of which 91.3% from office and industrial properties.
— rate of collections for rents invoiced and due remained high at 99.0% for the year.
— majority of portfolio now internally managed, by our team of over 220 professionals in poland and romania.
— maintained our investment grade by all three major rating agencies.
— issued our inaugural green bond, raising €400 million with a 6-year term, which was more than 2x oversubscribed.
— further improved our debt maturity profile, through the repurchase of c.41% of the notes maturing in 2022 at a 2.0% premium to their par value.
— c.€2.0 million contributed to our communities towards 27 initiatives in romania and poland, with the majority targeted towards the fight against covid-19.
Portfolio Open Market value
€3.0bn€3.0bn (2019)
iFrS earnings Before Tax
-€30.5m+€207.7m (2019)
iFrS earnings per Share
-21 cents+93 cents (2019)
ePrA NAv per Share
€8.68€9.30 (2019)
Dividend per Share
34 cents60 cents (2019)
Shareholders’ equity
€1.8bn€1.9bn (2019)
Adjusted Normalised eBiTDA
€141.6m€129.0m (2019)2
ePrA earnings per Share
37 cents44 cents (2019)
Net Operating income
€157.3m€147.7m (2019)
1. please refer to the glossary (pages 178-180) for the definitions used and the financial review section (pages 46-50) for further details.
2. the 2019 comparative has been adjusted downwards by €5.8 million, related to the apportionment of part of the noig/rga settlement.
HiGHLiGHTS

Poland 53.1%
Romania 46.9%
Other
Locations (% GAV) Property type (% GAV)
Developments (includes assets under refurbishment) 4.8%
Land for future development 2.7%
Standing properties 92.5%
Properties by status (% GAV)
Mixed use 9.0%
Logistics/Light- industrial 4.8%
4.4%
Of�ce 81.8%
32 Globalworth annual report and financial statements 2020Globalworth annual report and financial statements 2020
Overview strategic report portfolio review governance financial statements additional information
AT A GLANCe
CREATING ENVIRONMENTS WHERE BUSINESS CAN FLOURISH
Globalworth is a leading real estate company with a primary focus on Poland and Romania, the two largest markets in Central and Eastern Europe (“CEE”).
the company acquires, develops and manages commercial real estate assets, primarily in the office sector, with the objective of being the landlord of choice for the broad and growing variety of multinational corporations in the region.
globalworth has a real estate portfolio valued at €3.0 billion, managed by an internal team ofover 220 professionals mainly located in poland and romania.
OUr POrTFOLiO
Standing Properties
6461 (2019)
Standing GLA
1,271.3k sqm1,213.7k sqm (2019)
Contracted rent
€183.4m€191.0m (2019)
GLA Under Development
69.9k sqm176.2k sqm (2019)
Standing Commercial Occupancy
90.9% 94.7% (2019)
Combined Portfolio value (GAv)
€3.0bn€3.0bn (2019)
iNveSTMeNT CASeour established platform, clear strategy and financial strength provide firm foundations for future value creation.
See more information on page 68
Globalworth Tower
FOCUS ON THE LARGEST REAL ESTATE MARKETS IN THE CEE
STRONG MANAGEMENT PLATFORM WITH LOCAL PRESENCE
HIGH-QUALITY REAL ESTATE PORTFOLIO
– poland and romania, globalworth’s two focus markets, offer compelling macroeconomic and real estate fundamentals with broad opportunities for value creation.
– we are a multi-skilled platform, with substantial on-the-ground operations in our focus markets, with a team of over 220 experienced professionals combining local insight with an international approach.
– we own a sizeable and modern portfolio in prime locations, principally of class “a” offices, but also including a number of landmark and strategic investments mainly in mixed-use (office/commercial) and industrial properties.
See more information on page 14 See more information on page 62 See more information on page 68
STRONG CASH FLOWS TRACK RECORD OF CAPITAL DISCIPLINE AND ACCESS TO BOTH PUBLIC AND PRIVATE CAPITAL MARKETS
MULTIPLE GROWTH DRIVERS TO OUR BUSINESS
– our portfolio benefits from high occupancy rates and is predominantly leased to a diverse and international tenant base on triple-net, long-dated, euro-denominated leases.
– our assets, liabilities and revenues are principally euro-denominated, minimising local currency exposure.
– we take a conservative and sustainable approach to financing, with diversified sources of capital.
– we continuously explore our markets for value-added investment opportunities in poland and romania.
– we proactively seek asset management initiatives for our portfolio and operations, targeting enhanced revenue streams and improved efficiency.
See more information on page 46 See more information on page 42 and 52 See more information on page 18

54 Globalworth annual report and financial statements 2020Globalworth annual report and financial statements 2020
Overview strategic report portfolio review governance financial statements additional information
OUR RESPONSE TO COVID-19
The COVID-19 global pandemic has been unprecedented in terms of scale and pace of impact, creating significant uncertainty for the future, and changing the way we live and operate.
in this period, organisations and authorities have had to make significant decisions and adjustments, and globalworth was no exception, with several initiatives taken to effectively respond (to the extent possible) to a constantly changing and uncertain environment.
our top priority has been, and will continue to be, the safety and wellbeing of our people, partners, communities, and other stakeholders and shareholders, as we have been focusing on safeguarding our business, protecting our assets and minimising our exposure to the impact of covid-19.
OUr reSPONSe TeAMS
BOArD OF DireCTOrS eXeCUTive DireCTOrS & SeNiOr MANAGeMeNT reSPONSe TeAM
the Board has led the business’s covid-19 response and, together with globalworth’s executive directors, has considered a range of options as a response to the pandemic, taking into consideration our people, communities, shareholders and other stakeholders, as well as our business.
in this period, the Board has been frequently updated by the globalworth management team on measures taken by the authorities, the direct and indirect impact of covid-19 to the group’s business, and has overseen the implementation of the overall globalworth response to the pandemic, ensuring that it is in line with the agreed and evolving strategy.
the Board’s meetings have been held by phone or online, minimising travelling risk and maintaining a social distancing protocol.
– dedicated teams at group and country levels (poland and romania) were established to monitor and implement our covid-19 related strategy under the guidance of the Board.
– evolving strategy, respecting measures and guidelines set out in relation to the virus at a european level, by the world Health organization (“wHo”), and at country and local levels.
– senior management team meetings held throughout the period, with frequency subject to the state of the pandemic (daily, weekly, monthly), with dedicated email distribution lists established ensuring the timely flow of information.
OUr reSPONSe ACTiONS
BUSiNeSS CONTiNUiTY & MiNiMiSiNG FiNANCiAL eXPOSUre TO COviD-19
Utilised a risk-adjusted approach aimed at preserving as much cash in the business without jeopardising the safety and future growth of the Group.
Lowered the Occupational Cost of Our Tenants at Our Properties Through Active Supplier Negotiations – reviewed all our suppliers and supplier
contracts, aiming at achieving significant savings in the medium-long term, thus reducing the overall tenant occupational cost in our properties.
– lowered (capped) service charges in the short term, reducing the burden of our tenants, until we perform the final 2020 service charge reconciliation.
Targeted Building Capex on Lower risk-adjusted Developments – investment capex directed on
development projects with either significant pre-lets or for which construction was substantially completed or at a very advanced stage at the time the pandemic started.
– investment capex reduced by €36.0 million (original estimate was for +€90.0 million investment during the period).
– reductions, achieved through renegotiations with contractors, value-add engineering, scope reduction and works postponement.
Team Committed to Sustainable Long-term Future to Business and Stakeholders – lowered overheads and other costs,
including employee related costs across all levels and functions in the organisation.
– adjusted the group’s annual remuneration policy, with all 2019 bonuses now being paid in shares (vs. 50% cash and 50% shares).
– senior employees: 100% paid in shares in two tranches (march 21 and 22).
– other employees: 100% paid on march 21.
– shares will be transferred upon vesting at the fixed value of €7.00 per share and with no further vesting period or lock up.
Suspended investment for the Acquisition of New Standing Properties or Developments – focused our efforts in actively managing
our real estate portfolio, with all other developments or new acquisitions suspended.
– we continue to monitor the investment market for potential investment opportunities, and should, in the future, an investment opportunity, with particularly attractive potential returns arise, we may consider pursuing it.
Focused on Maintaining a High Cash Position and improved our Debt Profile – maintained a high cash balance position
throughout the covid-19 pandemic period with over +€500 million of cash and cash-equivalents held at balance sheet. cash as at year-end 2020 of +€527.8 million.
– improved our cost of debt, and maturity profile following the issue of our inaugural green bond in July raising €400 million with a 2.95% coupon.
– additional €215 million of rcf facility available to the group.
COviD-19 reSPONSe
THe GLOBALwOrTH FOUNDATiON — ASSiSTiNG FirST reSPONDerS
76 Globalworth annual report and financial statements 2020Globalworth annual report and financial statements 2020
Overview strategic report portfolio review governance financial statements additional information
OUr reSPONSe ACTiONS
HeALTH AND SAFeTY
Maintaining a healthy and safe environment for our people and for those who work at or visit our properties, as well as the wider communities to which we belong.
increasing Awareness About COviD-19 for Those who work and visit our Properties, and the wider Communities – detailed communication with tenants,
explaining measures taken by globalworth and providing links to important authority/government information relating to covid-19.
– continuous communication and monitoring of all suppliers regarding best practice procedures when entering and using our buildings.
– produced two sets of video materials, informing visitors and tenants on how to prevent contamination and demonstrating how we clean common spaces overnight (lobbies, stairs, elevators etc).
– adapted the editorial messaging on our social media platforms to be more informative on covid-19.
Preventive Measures at our Operating Buildings – introduced social distancing protocol in
our properties.
– frequent disinfections (every 2-4 hours) with specialised products in areas of high traffic.
– installation of hand disinfection stations in all our buildings’ lobbies and other public areas (with instructions for use).
– improved efficiency of the Heating, ventilation, and air conditioning (“Hvac”) systems, designed to achieve the environmental requirements of the comfort of our occupants and visitors, which are monitored and maintained at a high level.
– updated the designated areas for vendors and couriers in our properties which are sanitised at a higher frequency.
– detailed action plan for situations of covid-19 positive cases being detected.
Preventive Measures at our Development Sites – additional health and safety measures
taken at our construction sites, in close cooperation with our general contractors and other suppliers, including:
– covid-19 related updates and instructions for those who visit and work at our sites.
– installation of disinfection points at selected locations.
– professional and periodical disinfection of site offices and worker stations.
– information panels presenting hygiene practices and emergency contacts installed at site entrances and various other visible areas in our construction sites.
– detailed action plan for situations of covid-19 positive cases being detected.
Safeguarding our Team – regular communication with our team
members updating them on the latest covid-19 news.
– mandatory daily temperature checks on entering office premises.
– additional hygiene measures implemented within our workplaces, including installation of disinfectant dispensers in multiple locations in our offices and more frequent disinfection of areas which are most commonly used.
– implementation of return to office procedures for team members travelling or being away from the office for more than 5 days, with negative covid-testing (covered by the group) required to return to the office.
– additional risk assessments made for team members travelling in high-risk areas (provisional self-quarantine), or showing flu or any other associated symptoms (fever, blocked nose etc) who are requested to stay at home and seek medical advice.
– limited business travel to absolutely essential only, until it is deemed safe to resume travel again.
– Board meetings during this period have been performed exclusively through the use of technology.
Updated work Policies and iT Support to Support work requirements – flexible work arrangements (work-from-
home / rotation systems etc) implemented.
– communications through technology (phone, videoconferencing etc.), limiting internal and third-party meetings.
– it systems and support aligned with latest work policies.
– system stability, network robustness and data security ensuring uninterrupted and safe operation.
Focused our eSG efforts to Help Fight COviD-19 in romania and Poland – directed a substantial amount of our 2020
esg funds in assisting hospitals and related staff in romania and poland by donating more than €650k in the fight against covid-19.
– all events held at our buildings, including globalworth district events, have been cancelled until we have greater clarity on covid-19.
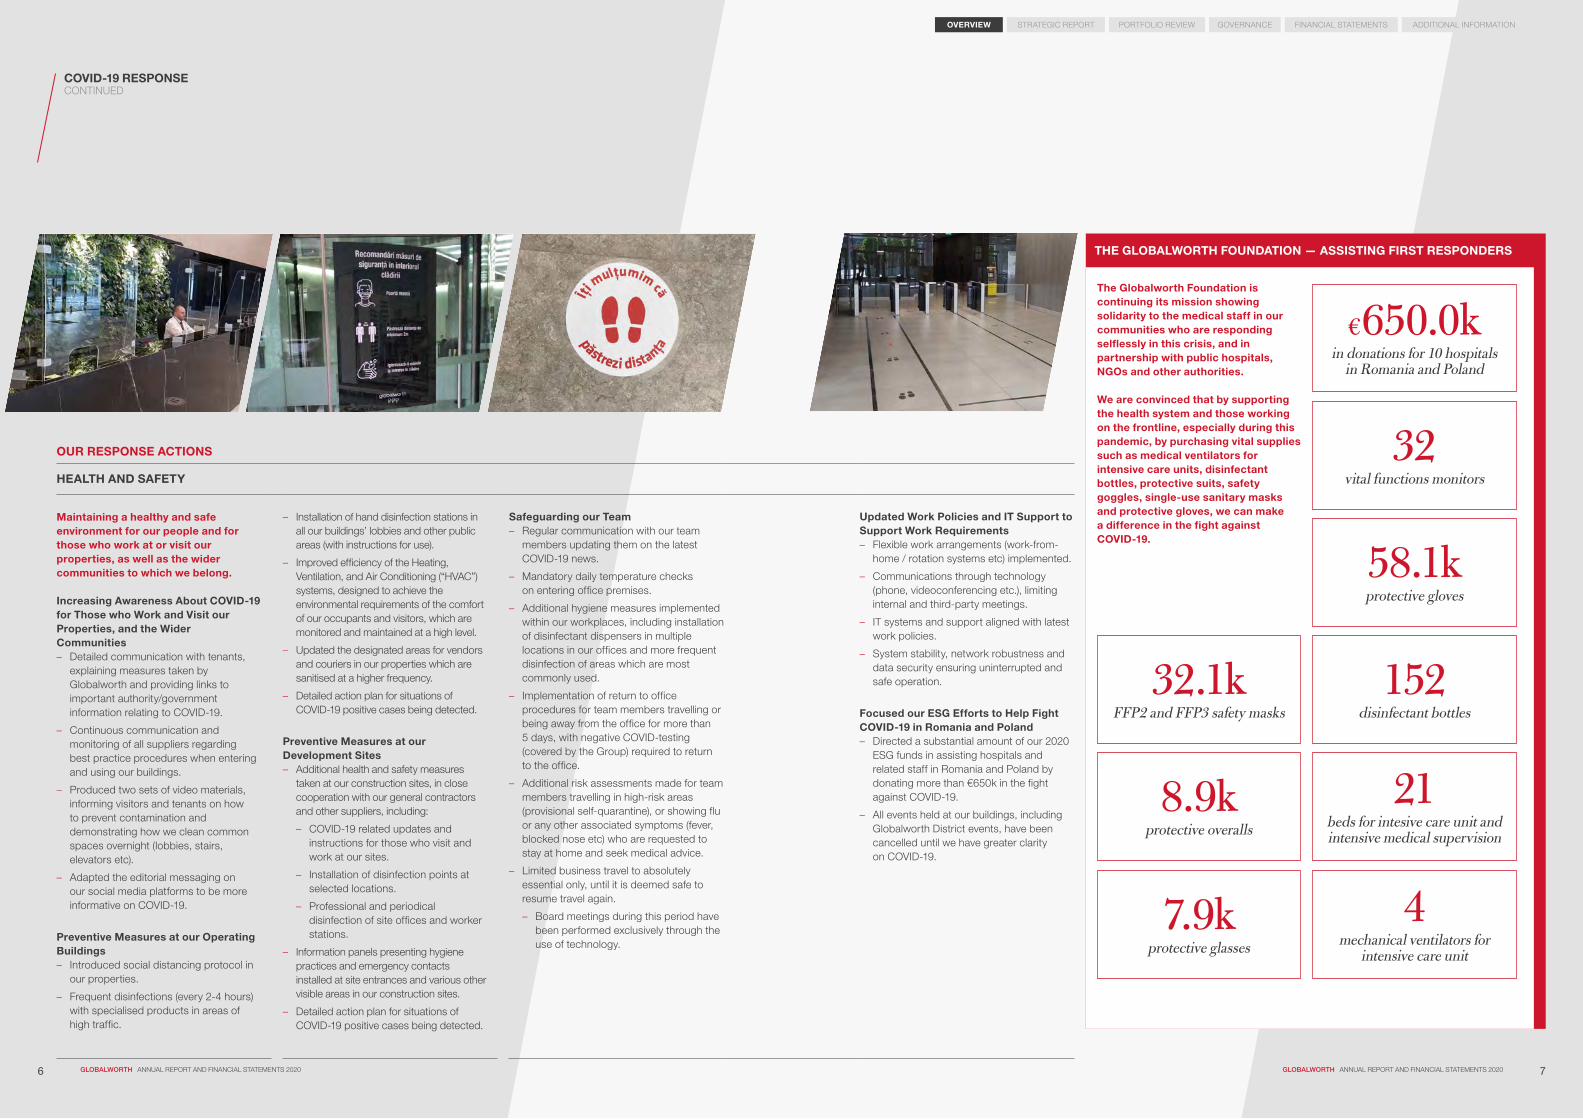
The Globalworth Foundation is continuing its mission showing solidarity to the medical staff in our communities who are responding selflessly in this crisis, and in partnership with public hospitals, NGOs and other authorities. we are convinced that by supporting the health system and those working on the frontline, especially during this pandemic, by purchasing vital supplies such as medical ventilators for intensive care units, disinfectant bottles, protective suits, safety goggles, single-use sanitary masks and protective gloves, we can make a difference in the fight against COviD-19.
COviD-19 reSPONSe continued
32.1k FFP2 and FFP3 safety masks
8.9k protective overalls
7.9k protective glasses
58.1k protective gloves
152 disinfectant bottles
21 beds for intesive care unit and intensive medical supervision
4 mechanical ventilators for
intensive care unit
€650.0k in donations for 10 hospitals
in Romania and Poland
32 vital functions monitors

9Globalworth annual report and financial statements 2020
overview STrATeGiC rePOrT portfolio review governance financial statements additional information
8 Globalworth annual report and financial statements 2020
STRATEGICREPORT
chief executive’s review 10our markets 14Business model 16strategy 18Key performance indicators 20standing portfolio review 24developments review 28asset management review 36capital market review 42financial review 46financing and liquidity review 52stakeholder engagement 54viability statement 58sustainable development update 60the globalworth foundation 64

Dimitris raptisChief Executive Officer
1110 Globalworth annual report and financial statements 2020Globalworth annual report and financial statements 2020
overview STrATeGiC rePOrT portfolio review governance financial statements additional information
we are well-prepared for the upcoming challenges and will continue focusing on delivering sustainable value to our investors, whilst at the same time we are ready and have the resources to take advantage of future attractive investment opportunities.
the covid-19 pandemic has created an unprecedented situation for our business and people, as we had to quickly adapt to this fast-paced and evolving environment. since the very early days of the pandemic, we have adopted a very hands-on and proactive approach, aiming at ensuring not only the maximum possible health and safety protection for all parties concerned, but also business continuity and long-term viability.
i am very pleased with the results of our actions over the year, which are primarily due to the positive attitude, resilience, commitment, and efficiency of our team, which has responded remarkably since the beginning of the pandemic, working under challenging circumstances. i would like to the thank all of them personally and on behalf of the Board.
Our Market since march 2020, the authorities in poland and romania, in line with many other countries, have adopted several measures to address the pandemic, including restrictions on peoples’ movement, travelling, opening hours of commercial spaces, as well as measures to protect affected business.
the measures implemented, to a certain extent, have followed the pace of the pandemic, becoming more restrictive or easing throughout the period, however at no point did they result in any forced closure of office, industrial premises, or essential retail businesses (supermarkets, pharmacies, convenience stores etc) which are the main areas of focus of our operations with over 95% of our contracted rent generated from such spaces.
the negative impact of covid-19 on the overall negative economic environment, however, was only partially manifested in the office sector, whereas the industrial market has witnessed accelerated growth.
in offices, we saw several companies being forced to reassess their occupational requirements and the duration of the leases signed, as occupiers have been working on plans to lower costs and re-enter their workplaces. in addition, the signing of new leases, typically for large multinational and national corporates, is taking longer in the current environment, thus impacting the overall take-up and occupancy rates in the market which both decreased in this period. we have adopted a very cooperative approach with all our tenants, understanding their needs and offering flexible and smart solutions. this is evidenced by the fact that across our roster of c.365 office tenants, we completed some 76 agreements (renegotiations, extensions, rent discounts/deferrals etc) spanning c.132.2k sqm representing approximately 15.7% of our leased office portfolio. this evidences the very strong tenant relationships we have cultivated and the strength of our in-house leasing and asset management teams.
the logistics / light-industrial sector, where we have been increasing our presence in recent years, was a clear winner in 2020, backed by significant demand mainly from e-commerce, pharmaceuticals and food retailers. we are very pleased that we have managed to make further successful investments in this sector during the year.
Our Pro-Active Approach During the Pandemicthe covid-19 pandemic has led us to rethink our overall strategy, while looking to our long-term activities and investments.
during the period, in order to ensure the health and safety of the people who work at or visit our properties, and to maintain business continuity for our tenants and ourselves, we implemented several preventative health and safety measures in our properties and construction sites, maintained a continuous open communication with our tenants and suppliers on matters related to covid-19 and established a detailed action plan in place should a covid-19 case be detected in one of our premises.
in addition, we reviewed all our suppliers and supplier contracts, aiming at improving efficiency and achieving significant savings which will benefit mainly our tenants, as we aim at lowering their occupational cost in our properties.
in terms of investments, we have utilised a risk-adjusted approach aiming at preserving as much cash in the business without jeopardising the future growth of the group. we continued focusing our investment capex on development projects with either significant pre-lets or for which construction was substantially completed or was very advanced at the time the pandemic started, while we suspended all other developments or new acquisitions.
Our Communityin addition to the support offered to our clients, we have remained as ever committed in supporting our communities of which we are an integral part off, supporting 27 initiatives with c.€2.0 million, with most of the funds contributed to the fight against covid-19. giving back to our community is an integral part of globalworth’s dna, and is not affected by the current challenging economic environment.
Our Portfolioour efforts have been, almost, exclusively focused in actively managing our portfolio of standing properties and development projects.
our overall portfolio value stood at €3.0 billion at year-end, remaining effectively unchanged compared to 2019, as the delivery of four new high-quality buildings in romania and poland, and further progress in the construction of the fifth building, offset the revaluation decrease mainly attributed to the covid-19 pandemic.
furthermore, i am very pleased with our efforts in leasing, with 303.5k sqm of commercial spaces taken-up or extended/renegotiated (more than 90% post pandemic), representing c.25% of our total standing commercial gla, at an average wall of 3.9 years. this represents the highest volume of leasing activity which we have ever achieved, mostly attributed to the successful negotiations with our existing tenants who appreciated our collaborative and flexible approach.
the average occupancy of our combined standing commercial portfolio as at 31 december 2020 was 90.9% (91.7% including tenant options), representing a 4.0% decrease compared to year-end 2019, due to the addition of properties with an average occupancy (79.6%) lower than the group average, and a 3.3% decrease in like-for-like properties, considered modest given the very challenging market conditions. from the net space returned to us in this period, c.70% did not relocate to other office properties, hence their decision to reduce space was purely driven by the pandemic.
Despite the significant disruption in the economic and social activity during most of 2020, I am pleased to report that our core strengths and competitive advantages have resulted in a very resilient operating performance and financial results. At the same time, we kept close to and supported our clients and the broader community within which we live and operate, reinforcing our position as THE landlord of choice in our home markets.
Whilst 2021 will continue to present a number of challenges, I firmly believe that the worst is behind us and I am confident and excited about the opportunities that lie ahead of us.
EPRA SBPR – Silver Award
EPRA SBPR – Most Improved Award
CEEQA – Investor of the Year in Poland
EUROBUILD AWARDS – Investor of the Year in Poland
CEE INVESTMENT AWARDS – Investor of the Year
FORBES BEST OFFICE BUILDINGS – The biggest owner of office buildings in Romania
SEE REAL ESTATE AWARDS – Investor of the Year
EURO CONSTRUCTION GALA – Development & Business Award of Excellence for Romania
INTERNATIONAL PROPERTY AWARDS – First place for Globalworth Campus for Romania
CIJ AWARDS – Best Leading Green Development & Developer for Romania
REAL ESTATE GALA – The office project of the year in Romania – The office developer of the year in Romania
OUr AwArDS
CHieF eXeCUTive’S review
LOOKING TO THE FUTURE WITH A RENEWED SENSE OF OPTIMISM
epra, european public real estate association, awarded globalworth, cee’s leading office landlord, two prizes:
Green Court

1312 Globalworth annual report and financial statements 2020Globalworth annual report and financial statements 2020
overview STrATeGiC rePOrT portfolio review governance financial statements additional information
the benefits of our longstanding strategy to establish long-term partnerships with high-quality national and multinational tenants, thus ensuring sustainable cash-flow generation, could not be more evident than during a period of pandemic, where we have been able to maintain a high rate of collection with over 99.0% of the rents invoiced being received in line with their customary cycle, while the level of claims received by tenants represented 6.1% of our annualised contracted rents. However the impact on yearly net operating income was limited to 2.3%.
Our results and Corporate Activity 2020 marks the first entire year since our initial investment in poland, where we have 100% consolidated results of our polish activities, following the acquisition and delisting of our globalworth poland subsidiary at the end of september 2019. the group during this period reported a solid uplift in earnings with an increase of 6.5% in our net operating income to €157.3 million, 9.8% in our adjusted normalised eBitda to €141.6 million and 1.7% in our epra earnings to €82.3 million, as compared to the same period in 2019. improvement in our performance is mainly attributed to our asset management initiatives and the impact of acquisitions and other property additions to our portfolio which were not fully reflected in 2019 and 2020.
during the year we paid the second interim dividend of €0.30 per share in respect to the 2019 financial year and €0.19 per share in respect to the first interim dividend of 2020. in addition, on 19 february 2021 we announced the second interim dividend for 2020 of €0.15 per share, resulting in a total dividend for the 2020 financial year of €0.34 per share. Both 2020 dividends represented an amount of at least 90% of the epra earnings for the first and second six months of the year, as stipulated by our articles of incorporation.
liquidity has always been a key area of focus, and especially since the covid-19 pandemic outbreak, we have taken several steps to ensure that we have sufficient cash in this period, with our liquidity at year-end being c.€527.8 million (vs c.€291.7 million at 2019 year-end).
as part of our ongoing effort to effectively manage and further improve our debt maturity profile, at the end of July we successfully closed our inaugural green bond raising €400 million, with a 2.95% coupon, while at the same time repurchasing c.41% of our 2022 notes at a small premium over par, essentially extending the maturity of a significant part of the notes maturing in June 2022 to July 2026. net ltv stood at 37.8% (vs 34.7% at 2019 year-end).
in addition, all three major rating agencies, following their 2020 review of globalworth, maintained their investment grade status for the group, with moody’s changing their outlook from “stable” to “negative”, while s&p and fitch outlooks remained “stable”.
the high level of confidence received from the debt capital markets and the rating agencies, followed that of the cpi property group, one of the largest property companies in the cee, which in february 2020 became the largest equity shareholder in globalworth holding 29.6% of the share capital.
Corporate Governance our Board of directors was partially reshaped in 2020, because of corporate activity and the decision to maintain a leaner Board. as a result, mr papalekas, mr alroy, mr fechter, mr muchanya and mr Buck stepped down from their positions, with mr Bartyzal and mr maimon being appointed new members on the Board. i would like to personally thank parting members for their significant contributions to the Board and wish the new members a successful tenure and look forward to working closely with them and the rest of the Board in steering globalworth in the future.
in december the founder and co-ceo of globalworth, mr papalekas, stepped down from his co-ceo role which i solely assumed. i have worked alongside ioannis since globalworth’s creation in 2012. He has been the visionary leader and driving force behind globalworth’s outstanding success and transformation from a small romania-focused office developer into the largest office investor and landlord in the wider cee region. i would also like to add my personal thanks to him for his friendship, counsel and trust over the years and wish him all the very best for the future.
in addition, i would like to welcome marian v. popa to the globalworth family, who joined us in march 2021 as managing director for romania. marian is one of the most recognised senior corporate operational leaders in the country with over 40 years of experience with outstanding results and success. i am looking forward to working closely with him and i am sure he will bring significant value and insight, not only to our romanian operations but to the group as a whole.
Outlook during 2021 our primary focus will continue to be the active management of our portfolio of high-quality properties. at the same time, we are ready and have the financial resources to act quickly if new attractive opportunities become available.
although the office of the future may need to be adjusted to potentially offer greater flexibility or alterative space planning arrangements, i strongly believe that its importance will not diminish. corporates/occupiers believe that the office environment increases productivity, promotes creativity, innovation, consistency, and fosters relationships and corporate culture, which are essential for the long-term sustainability and growth of their businesses.
CHieF eXeCUTive’S review continued
Conference Centre
Spektrum Tower
in addition, poland and romania should emerge as winners from this crisis as corporates continue to focus on containing costs, which will lead them to nearshoring additional operations in our two home markets.
we are very well-placed to continue to successfully address ongoing challenges and i firmly believe that we can achieve new levels of success in the future.
stay safe and healthy!
Dimitris raptisChief Executive Officer25 march 2021

ROMANIA’S SELECTED MARKET DATA
POLAND’S SELECTED MARKET DATA
investment volume
investment volume
€7.2
bn
2018
€7.7
bn
2019
€5.3
bn
2020
€5.1
bn
2017
€4.6
bn
2016
2019
€0.6
bn
2020€0
.9b
n2017
€1.0
bn
2018
€0.9
bn
2016
€0.9
bn
source: collierssource: colliers
source: collierssource: colliers
demand
supply
Office demand and supply balance
Office demand and supply balance
demand
supply
1.5m
sq
m
2018
0.7m
sq
m
1.6m
sq
m
2019
0.7m
sq
m
1.2m
sq
m
2020
0.7m
sq
m
1.5m
sq
m
2017
0.7m
sq
m
2018
0.3m
sq
m
0.2m
sq
m
2019
0.4m
sq
m
0.3m
sq
m
2020
0.3m
sq
m
0.2m
sq
m
2017
0.4m
sq
m
0.2m
sq
m
1514 Globalworth annual report and financial statements 2020Globalworth annual report and financial statements 2020
overview STrATeGiC rePOrT portfolio review governance financial statements additional information
OUr MArKeTS
The COVID-19 global pandemic has created significant disruption in the market, resulting in the biggest economic slowdown in the 21st century.
The impact in real estate was evidenced in most key indicators such as investment sentiment, demand vs. supply, effective rental levels, as well occupational trends.
Adapting quickly to the constantly evolving conditions, while maintaining a safe and healthy environment for people and businesses to operate in, provides several opportunities for the future as the fight against COVID-19 is won and markets recover.
POLAND’S TreNDS
Dynamics – poland is the largest, most mature and active real
estate market in the cee.
– investment volumes had been increasing annually over the past 6 years, and exceeded the €7.0 billion level in 2018 and 2019, falling back to an estimated €5.3 billion in 2020 due to general economic slowdown as a result of covid-19. However, even at current levels, poland maintained its position as the most liquid market in the region.
– the rise of remote work for wide categories of employees, and the emergence of e-commerce, as retail schemes were forced to close down during certain periods of the pandemic, resulted in increased investor interest for industrial spaces. industrial volumes accounted for the first time for approximately half of the annual investment volumes, followed by offices with c.40%.
– importance of office space, although its format is shifting to a more flexible / hybrid-ecosystem with less desk space and more collaborative areas, was reaffirmed by both investors and occupiers:
– by investors, as prime yields, although expanded in first half, stabilised and had partially contracted by year-end;
– by occupiers, as providing a healthy and safe working environment increases productivity, promotes creativity, innovation and consistency, and fosters relationships and corporate culture.
– average office vacancy rates increased in 2020, as several companies were forced to reassess their occupational plans, however projects which were under construction were delivered according to their respective schedules.
– vacancy rate further impacted as several tenants are looking to sub-lease part of the occupied spaces as a temporary solution to reduce costs.
– rental office levels have remained stable, however landlords have become more flexible in terms of incentives awarded to tenants and lease durations.
rOMANiA’S TreNDS
Dynamics – romania has been one of the best performing
countries in the eu in recent times, which has been reflected in its growing real estate market.
– Bucharest is the principal real estate hub in the country, although certain regional cities have been receiving increasing interest from both local and international investors and tenants.
– impact of covid-19 in real estate investment was not fully reflected in romania, where investment volumes reached €0.8 billion, mainly due to the fact that the biggest transactions in the market were either completed or agreed prior to the pandemic outbreak.
– office and industrial trends like in other major markets of the cee (such as poland) were also observed in romania, from both investors and occupiers.
– class “a” offices received the bulk of transactions (80%), however there has been increasing focus for high-quality industrial properties which accounted for over 10% of transaction volume, with investment yields remaining unchanged and contracting respectively compared to the previous year.
– Health and safety were the main focus for office tenants as they are adjusting to the operational and occupational challenges resulting from covid-19.
– average office vacancy rate increased in Bucharest, as new projects were delivered in 2020, while occupiers were forced to reassess their occupational plans and reduce costs (including sub-leasing part of their occupied spaces).
– demand for modern industrial spaces was high in 2020, being the best leasing year on record, however average occupancy marginally increased as several newly delivered projects are in the process of being let.
– prime rental office and industrial levels have remained stable, however landlords are becoming increasingly flexible in terms of incentives awarded to tenants and lease durations.
OPPORTUNITIES CHALLENGES & OUTLOOK
– maintain a healthy and safe environment in which people want to work and be associated with, resulting in increased confidence for employees and visitors, allowing businesses to grow.
– actively and efficiently managing our real estate portfolio, while establishing long-term partnerships with high-quality national and multinational tenants, ensuring sustainable cash flow generation.
– investing in new select opportunities as markets return to a more normalised state following the covid-19 pandemic, aiming at taking advantage of potential arbitrage opportunities emerging post crisis in top-quality locations in warsaw, Bucharest and large polish and romanian regional cities.
– the impact that the covid-19 pandemic will have on economic growth at both a european and global level, and on the performance of our business and the real estate markets in poland and romania.
– effectively addressing the evolving office and industrial trends in the market to be able to provide the “right” type of spaces to our existing and potential occupiers.
– managing the portfolio to safeguard occupancy and income levels at a time of greater uncertainty, due to the covid-19 pandemic.
– assessing the speed at which companies commit on development projects, and, in certain cases, delaying, or redesigning (including adjusting the end-product mix) of, projects.
2020 MARKET REVIEW

94.4% contracted GLA
secured with triple net contracts
77.1% of contracted rent
from multinational
tenants
100% of standing GAV with or under
certification
Office 81.8% of GAV
10 cities
prime locations in fast-growing regions of poland and romania
locations
primarily class a office, with mixed-use and industrial a secondary focus
Sector
modern high-quality standing properties with environmental certification,
or with potential to gain it
Properties
diversified base of large or established national and
multinational corporations
tenants
revenue streams backed by long-term, euro-denominated, triple net,
inflation-linked leases
lease terms
Manage our Portfolio
• Offer best-in-class asset and property management services
• enhance the attractiveness and performance of our properties and satisfy our partners’ requirements
• Create sustainable and efficient properties reflecting what matters to both our occupiers and the people who work in and use our premises
Create Communities• Create an environment in
which people want to work in and be associated with
• Connect with the local communities
• improve quality of life, interaction and communication, and promote, simplify and advance business
Invest in real Estate opportunities
• Acquire standing properties and land
• Develop (or refurbish) new properties
• Allocate capital to deliver growth and risk-adjusted returns
Deploy Capital Capital returns
PEOPLE PLACES
AND TECHNOLOGY
OUr reSOUrCeS AND reLATiONSHiPS
wHAT we DO TO CreATe vALUe
eMBeDDeD CULTUre AND vALUeS
PROVEN INVESTMENT MODEL OUR CORE ACTIVITIESCreATiNG SUSTAiNABLe LONG-TerM vALUe
One Team Act with integrity respect, Diversity and inclusion
Build an environmentally Friendly & Sustainable Future
financialgenerate long-term sustainable and attractive, risk-adjusted returns through yield and capital appreciation, allowing us to create the capacity to distribute dividends for our shareholders.
– rental growth
– portfolio value appreciation
– epra nav growth
– sustainable and recurring dividend
non-financialcreate a group and an environment in which people want to work, do business, and be associated with.
– invest in sustainable and environmentally friendly buildings.
– create safe and healthy spaces where people want to work and be associated with.
– assist and improve the communities in which we are part of.
1716 Globalworth annual report and financial statements 2020Globalworth annual report and financial statements 2020
overview STrATeGiC rePOrT portfolio review governance financial statements additional information
We aim to manage our resources to deliver attractive returns to shareholders and value to other stakeholders.
SKiLLeD TeAMin-house team of professionalswith strong functional and localknowledge of their markets.
See more information on page 62
FiNANCiAL STreNGTH Conservative financing policy,with simple debt structure andeuro-denominated assets,liabilities and revenues, and asupportive shareholder base.
See more information on page 52
SCALe AND rePUTATiONTrusted brand and scalecreating new opportunitiesand business efficiencies.
See more information on page 18
vALUeD reLATiONSHiPSLongstanding partnershipswith leading real estate industryspecialists and crediblefinancial institutions.
See more information on page 36
BUSiNeSS MODeL
GENERATING VALUE
See more information on page 60

1918 Globalworth annual report and financial statements 2020Globalworth annual report and financial statements 2020
overview Strategic report portfolio review Governance financial statements additional information
In view of the unprecedented challenges faced due to COVID-19, we expanded our strategic focus to ensure we could safeguard our business, protect our assets and minimise our exposure to the impact of the pandemic.
eFFectiVeLY MaNageoUr aSSetS
preSerVe or protect operatioNaL eFFicieNcY
MaiNtaiN aN eFFicieNt aND FLeXiBLe capitaLStrUctUre
iNVeSt iN SUStaiNaBLeeNViroNMeNtS &coMMUNitieS
– signed and/or extended 303.5k sqm of Gla at an average wall of 3.9yrs.
– 74.3% of our leasing activity involving lease renewals.
– maintained an overall high level of occupancy across our portfolio of 90.9% (91.7% incl. options).
– total contracted rent of €183.4 million (31 december 2020).
– contracted rent of standing commercial properties down 3.1% mostly due to reclassification of renoma from standing assets to assets under refurbishment.
– renovation & upgrade programme continued with €13.0 million invested in our properties in 2020.
– additional works of over €12.0 million planned for this year to be carried out in the future.
– portfolio predominantly comprising of office and industrial spaces with limited exposure to retail.
– continued to internalise property management, whereby almost our entire office and mixed-use portfolio is now managed in-house.
– claims representing for 6.1% of annualised contracted rent at year-end received and settled with tenants.
– c.54.0% of the claims by value were settled without a cash impact on the rental income.
– from the claims settled approximately half resulted to a lease maturity extension.
– rate of collections for rents invoiced and due remained high at 99.0%, with the remainder in the process of being collected.
– limited covid-19 impact on net operating income at 2.3%.
– maintained investment grade by all three major rating agencies.
– moody’s affirmed Globalworth’s Baa3 rating and changed its outlook to “negative” due to their change of outlook on romania in april.
– s&p and fitch affirmed Globalworth’s BBB- rating and “stable” outlook in may.
– issued our inaugural green bond, raising €400 million with a 6-year term (coupon 2.95%), in a transaction which was 2x oversubscribed.
– further improved our debt maturity profile, through the repurchase of c.41% of the notes maturing in 2022 at a 2.0% premium to their par value.
– increased the credit limit in our rcf to €215 million (undrawn at 31 december 2020) which is available to the Group until march 2024.
– environmentally certified 10 properties to our portfolio in 2020.
– podium park ii became the second property in our portfolio to receive the highest Breaam accreditation with Breeam outstanding.
– Globalworth campus tower 3, became the highest Breeam excellent rated property in our portfolio.
– 47 green certified standing properties, accounting for 81.8% of our standing commercial portfolio by value, and one green certified under refurbishment.
– 17 other properties in certification or re-certification process at year end.
– further formalised our commitment to green financing initiatives, through our Green Bond framework for which we received a second party confirmation by sustainalytics.
– issued our second sustainable development report for the Group for fY 2019.
StrategY
THE RIGHT STRATEGY TO SAFEGUARD THE BUSINESS
StratEGIC PIllar FocUS oN coViD-19 eNSUre tHeHeaLtH & SaFetYoF peopLe iN oUr propertieS aND tHe WiDer coMMUNitieS
StreNgtHeN oUr poSitioN iN oUr MarKetS oF operatioN BY FocUSiNg oN SeLecteD riSK-aDJUSteD iNVeStMeNtS
ProGrESS IN 2020 Global CoVID-19 pandemic outbreak in March 2020 impacting the way we live and operate – High number of confirmed cases,
with more than 114.7 million and 34.1 million cases globally and in europe respectively as at 28 february 2021.
– our markets of focus, poland and romania, have reacted relatively well to the pandemic.
– poland and romania rank 29th and 32nd in europe with 45.1k (1.0k deaths) and 41.9k of total confirmed cases per 1-million population respectively, as at 28 february 2021.
– Both countries declared a “state of emergency” for part of this period, and adopted several measures to address the pandemic, including restrictions on people’s movement, travelling, opening hours of commercial spaces and other.
Protecting the people who work in and visit our properties, as well as our wider communities – implemented several measures
aimed at minimising exposure to covid-19 and raising awareness.
– established detailed action plans in case of a covid-19 case being detected in one of our buildings.
– performed frequent disinfections of high traffic areas, maintained a continuous open communication with our tenants and suppliers on matters related to covid-19, installed hand disinfection stations, established a circulation protocol in our properties.
the Globalworth Foundation – Globalworth foundation focused
its efforts primarily in the fight against the covid-19 pandemic in romania and poland.
– contributed over €1.6 million contributed 26 initiatives in romania and poland, in the fight against covid-19, as well as the future of our communities.
– reviewed our development and investment pipeline considering the covid-19 pandemic outbreak.
– focused on developments with significant pre-lets or advance level of construction.
– delivered four high-quality properties in romania and poland with 95.8k sqm Gla.
– two class “a” offices in Bucharest and Krakow with 52.5k sqm.
– two high-quality industrial facilities in romania with 43.4k sqm.
– progressed with the construction of a class “a” office in Bucharest which upon completion will add 29.1k sqm Gla to our portfolio.
– €17.5 million remaining to be invested to completion.
– total investment of c.€54 million in developments in 2020.
– all other new investments were suspended or put on hold / under review.

rElatED StratEGY MEaSUrEMENt rElatED StratEGY MEaSUrEMENt rElatED StratEGY MEaSUrEMENt rElatED StratEGY MEaSUrEMENt
rElatED StratEGY MEaSUrEMENt rElatED StratEGY MEaSUrEMENt rElatED StratEGY MEaSUrEMENtrElatED StratEGY MEaSUrEMENt
3,032.93,045.1
2,462.1
1,815.4
977.5
%12%12
2016 2017 2018 2019 2020
Total GAV (€m)
€3,032.9m
2,349.72,262
1,633.2
988.0
441.8
%12%12
2016 2017 2018 2019 2020
Green Building (GAV €m)
€2,349.7m
1,271.31,213.7
1,042
791.0
420.0
%12%12
2016 2017 2018 2019 2020
Total Standing GLA (000s)
1,271.3k
48
43
30
18
7
%12%12
2016 2017 2018 2019 2020
Green Building (Number of Buildings)
48
1,238.91,180.1
1,004.8
748.1
370.0
%12%12
2016 2017 2018 2019 2020
Total Standing Commercial GLA (000s)
1,238.9k
%12183.4
191.0
159.5
115.9
61.0
2016 2017 2018 2019 2020
Contracted Rent (€m)
€183.4m
90.994.795.193.3
83.1 %12%12
2016 2017 2018 2019 2020
Occupancy Commercial Standing (%)
90.9%
%12
2016 2017 2018 2019 2020
GAV Concentration (% GAV )
73.4
21.4
12.9
11.410.4 10.7
23.524.122.19.4
6.1 4.74.9 5.4
29.630.027.328.15.2
43.5
34.630.5 30.8
rElatED StratEGY MEaSUrEMENt
2120 Globalworth annual report and financial statements 2020Globalworth annual report and financial statements 2020
overview STrATeGiC rePOrT portfolio review governance financial statements additional information
KeY PerFOrMANCe iNDiCATOrS
FIVE-YEAR PORTFOLIO EVOLUTION KeY
Bucharest new cBd
Bucharest other
warsaw regional romania
regional poland

160.5151.5
137.6
53.946.2
%12%12
2016 2017 2018 2019 2020
Rental Income (€m)
€160.5m
37.834.7
43.9
34.3
20.7
%12%12
2016 2017 2018 2019 2020
LTV (%)
37.8%
141.6
129.0119.0
42.836.3
%12%12
2016 2017 2018 2019 2020
Adjusted Normalised EBITDA (€m)
€141.6m
8.79.39.08.88.6 %12%12
2016 2017 2018 2019 2020
EPRA NAV/Share (€)
€8.7
37.0
44.046.0
18.0
13.0
%12%12
2016 2017 2018 2019 2020
EPRA Earnings/Share (€ cents)
37.0 cents
21.3
(3.5) (18.6)
36.3
16.8
%12%12
2016 2017 2018 2019 2020
Total Annual Shareholder Return (%)
(18.6)%
34.0
60.0
54.0
44.0
0.0
%12%12
2016 2017 2018 2019 2020
Dividends (€ cents)
34.0 cents
2.72.82.92.6
5.3
%12%12
2016 2017 2018 2019 2020
Cost of Debt (%)
2.7%
2322 Globalworth annual report and financial statements 2020Globalworth annual report and financial statements 2020
overview STrATeGiC rePOrT portfolio review governance financial statements additional information
KeY PerFOrMANCe iNDiCATOrS continued
FIVE-YEAR FINANCIAL PERFORMANCE

31 Dec 20
1,271.3
31 Dec 19
1,213.7
Like-for-Like Change*
Reclassi�cations NewDeliveries
(40.9)
095.8
Sales(& Other Adj**)
2.7
0
300
600
900
1,200
1,500
31 Dec 20
2,805.5
31 Dec 19
2,844.7
Like-for-Like Change*
Reclassi�cations NewDeliveries
(70.7)(114.4)
145.60.3
Sales(& Other Adj**)
0
600
1,200
1,800
2,400
3,000
2524 Globalworth annual report and financial statements 2020Globalworth annual report and financial statements 2020
overview STrATeGiC rePOrT portfolio review governance financial statements additional information
Our ongoing effort to further grow our portfolio of high-quality standing properties continued in 2020, with the addition of four newly constructed high-quality buildings in Romania and Poland.
As of year-end 2020, there were 37 standing investments in our portfolio, with a total of 64 standing properties.
our standing portfolio comprised 29 class “a” office investments (49 properties in total) and two mixed-use (with six properties in total) in central locations in Bucharest (romania), warsaw (poland) and five of the largest office markets/cities of poland (Krakow, wroclaw, Katowice, gdansk and lodz).
in addition, over the past years we have gradually been increasing our presence in the industrial market through mainly the development of high-quality logistic and light-industrial facilities in romania, where at year-end we solely owned two light-industrial parks with five facilities in timisoara and a modern warehouse in pitesti, and had a 50% ownership through a Joint venture in two other industrial parks in Bucharest and constanta. we also own part of a residential complex in Bucharest.
the total gross leasable area of our combined standing commercial portfolio increased by 58.8k sqm or 5.0% in 2020 to reach 1,238.9k sqm, with the overall combined standing portfolio gla increasing 4.7% to 1,271.3k sqm. the net increase in the size of our portfolio was attributed to the addition of 95.8k sqm from four developments
Standing GLA evolution (k sqm)
(*) like-for-like change represents the changes in gla or gav of standing properties owned by the group at 31 december 2019 and 2020 respectively.
(**) includes impact in areas (sqm) from the remeasurement of certain properties and other gav adjustments (redevelopment capex)
Standing Portfolio value evolution (€ m)
(*) like-for-like change represents the changes in gav of standing properties owned by the group at 31 december in 2019 and 2020.
STANDiNG POrTFOLiO review
BEST-IN-CLASS REAL ESTATE SPACE
Globalworth Combined Portfolio: Key Metrics
total standing properties 31 dec. 2018 31 dec. 2019 31 Dec. 2020
number of investments 31 37 37number of assets 52 61 64gla (k sqm) 1,042.0 1,213.7 1,271.3gav (€ m) 2,381.1 2,844.7 2,805.5contracted rent (€ m) 159.5 184.4 178.7
of which commercial properties 31 dec. 2018 31 dec. 2019 31 Dec. 2020
number of investments 30 36 36number of assets 51 60 63gla (k sqm) 1,004.8 1,180.1 1,238.9gav (€ m) 2,312.2 2,783.1 2,745.9occupancy (%) 95.1% 94.7% (95.0%*) 90.9% (91.7%*)contracted rent (€ m) 157.9 183.3 177.7potential rent at 100% occupancy (€ m) 167.5 195.9 199.4wall (years) 5.0 4.5 4.5
(*) including tenant options.
completed during the year, and the remeasurement of certain of our properties (3.9k sqm), partially offset by the reclassification of renoma (40.9k sqm), our landmark mixed-use property in wroclaw which is being refurbished / repositioned and the sale of certain residential and retail units in our upground residential complex.
globalworth campus tower 3 (Bucharest) and podium park ii (Krakow), offering total gla of 52.4k sqm were the two new office additions to our standing portfolio, and the first phases in the chitila industrial park and the constanta Business park added two new high-quality industrial facilities with 43.4k sqm of gla.
the appraised value of our combined standing portfolio as at 31 december 2020 was €2.8 billion. the inherent increase in total value from the addition of new properties was offset by the revaluations of properties held throughout the period (like-for-like), mainly because of the increased uncertainty from the covid-19 pandemic. value of like-for-like properties was 2.6% lower at the end of 2020 compared to the year before (additional information is in the “asset management review”).
furthermore, and consistent with our commitment to energy-efficient properties, we certified 10 buildings and made further progress in the certification or re-certification of 17 others in 2020. overall, at the end of the year, we owned 47 green certified standing properties in our portfolio valued at €2.2 billion, accounting for 81.8% of our standing commercial portfolio (additional information is in the “sustainability review” section).
we consider our standing commercial portfolio to be modern as 45 of our standing properties, accounting for 72.2% of our commercial gla and 73.8% of our standing commercial combined portfolio value, have been delivered or significantly refurbished in or after 2014.
Standing Properties Operation, renovation and Upgrade Programmeoffering best-in-class real estate space to our business partners is a key component of our strategy at globalworth.
as a long-term investor we are looking to maximise returns over the full life cycle of our properties. continuous active management and investment in our portfolio enables us to preserve and enhance value, generate long-term income, as well as offer best-in-class real estate space to our business partners.
providing a healthy and safe environment to work or visit became increasingly important in 2020 following the outbreak of the covid-19 pandemic, resulting in primarily focusing our efforts in ensuring that we provide such an environment in our properties.
the in-house experience and capabilities we have developed allowed us to quickly adjust our asset management strategy during the year and customise it to address the evolving pandemic, while attending to the medium to longer-term requirements of our portfolio.
depending on the stage in the life cycle of each of our properties, improvements in technology, and their prevailing conditions and trends, we may conduct works which extend from small-scale upgrades to large-scale refurbishments. typically, larger-scale refurbishments allow us to fully upgrade an asset, secure new leases and reset the life clock of the property.
we continued to implement this strategy in 2020, focusing on a more hands-on approach to the management and operation of our properties. internalising the property management of our portfolio is a prime area of focus for the group, and we are pleased to have been able to increase the number of properties we manage in-house in 2020, with podium park, warsaw trade tower, cB lubicz and five other properties in warsaw and Krakow being the latest additions. overall, we internally manage almost all our office and mixed-use properties in poland and romania, accounting for 89.2% of the total standing commercial portfolio by value (94.2% of office and mixed-use standing properties) as at 31 december 2020, aiming at internalising the management of the remainder of our offices in the future.
during this period we performed a detailed review of how we conduct our business, resulting in the termination and/or suspension or negotiation of our supplier contracts, achieving significant savings, the majority of which will benefit our tenants in the future.
with the largest part of leases being triple net (i.e. the tenant is responsible for all the expenses of the property including real estate taxes, building insurance, and ordinary maintenance), the majority of the savings achieved will be passed on to the tenants, with the typical approach used of ‘capping’ the service charge costs paid by the tenants in 2020, with the final reconciliation to take place in 2021, thereby assisting our tenants during this very difficult period.
overall in 2020, €13.0 million were invested in our standing portfolio, with additional works of over €12.0 million planned for this year have been deferred to the future. tenant fitout works were not affected during this period which continued as normal, but at renegotiated prices with suppliers and/or contractors.
one refurbishment / repositioning project that was being planned prior to the outbreak of the covid-19 pandemic, and for which we have taken the decision to commence, was in our renoma property. works involving this landmark mixed-use property in wroclaw will involve the conversion of certain retail / commercial spaces to office, as well as the reallocation of certain commercial uses, which are expected to be completed by the end of H1-2022.

Refurbishment focused on increasing Class “A” office
space and reconfiguring Renoma’s high-quality retail
& commercial spaces
Free Wi-Fi in common areas
Baby changing room
Fitness club
Premium Boutiques
Monitored bicycle parking
Large car park with c.500 bays
Healthcare centre
Electric vehicles charging station
Supermarket
RENOMA40 Świdnicka Street, Wrocław
2726 Globalworth annual report and financial statements 2020Globalworth annual report and financial statements 2020
overview STrATeGiC rePOrT portfolio review governance financial statements additional information
Renoma opened for the first time in 1930 and since then has become the landmark property for the city of Wroclaw.
its unique architecture and impressive façade with portrait sculptures of faces of people from different continents resulted in the property entering the historic monument registry in 1977 as a flagship example of european modernism.
renoma was last renovated in 2009 and we are now embarking on a new chapter for the property by refurbishing and reconfiguring a large part of its indoor areas aiming at increasing its class “a” office space and improving its commercial mix offering.
works are expected to be completed in H1-2022, with the total investment expected at €20 million.
refurbishment / repositioning is focused on increasing class “a” office space on the higher floors and reconfiguring its high-quality retail & commercial spaces with food and entertainment offering on the ground and lower floors, including select retail.
CASe STUDY
reNOMA: A LeGACY DeSTiNATiON MODerNiSeD
FOR THE FUTURE
ADDiTiONAL AMeNiTieS
rendering
Total Gross Leasable Area
47.4k sqm (16% increase)
indoor Car and Bicycle Parking Spaces
c. 500 & 100 spaces
Total retail Area
14.5k sqm (50% reduction)
Total Office Area
32.0k sqm (>3x increase)
rendering
renoma in 1929 renoma today

2928 Globalworth annual report and financial statements 2020Globalworth annual report and financial statements 2020
overview STrATeGiC rePOrT portfolio review governance financial statements additional information
Dimitris PergamalisGroup Head Globalworth Workplaces
review of Projects Delivered: Class “A” Offices we delivered two class “a” offices in Bucharest and Krakow, further increasing our footprint by 52.4k sqm.
Globalworth Campus Tower 3in January 2020, we delivered tower 3 (centre tower) of the globalworth campus development in the new cBd of Bucharest. the third tower, which represents the second and final phase of the project, is green certified with Breeam excellent accreditation, and offers 32.2k sqm of class “a” office space (c.96% of total gla) as well as other amenities such as a 750-seat conference centre (1.9k sqm).
the main office building extends over 14 floors above ground and two underground levels, and had its first tenants arriving at the beginning of 2020, with the property being 70.7% (90.8% including tenant options) let as at 31 december. fitouts for the interconnected conference centre remain in progress (delayed due to covid-19) and are expected to be completed in 2021.
Podium Park iipodium park ii is the first class “a” office we developed in poland, and is part of the office complex known as podium park which is developed in phases. this second office of the complex was delivered in september 2020, and has received the highest Breeam green accreditation with Breeam outstanding.
podium park ii is multi-let office and extends over 11 floors above ground and two underground levels, offering 18.8k sqm of high-quality gla, and was 82.6% let as at 31 december 2020 to tenants including ailleron and fmc technologies.
Developments our ability to develop high-quality properties remains a key feature of our group strategy, as it allows us to meet current and future tenant needs, and achieve higher risk-adjusted returns on our capital deployed.
we started 2020 with a very active pipeline of seven properties under development and several others selected for development in phases in the future, however amid the covid-19 pandemic, we significantly scaled back on our construction and development programme during the year.
in march and looking ahead to the uncertainty in the market, we further reviewed our development pipeline and decided to focus only on those which had significant pre-lets in place or construction was well underway or substantially completed. as a result, we principally focused on the development of five selected properties in romania and poland, thus reducing our original expected construction and development expenditure for 2020 by more than €36.0 million to €53.9 million.
in 2020 we delivered a class “a” office and two high-quality industrial facilities in romania and our first class “a” office development in poland. in addition, we further progressed with the construction of another class “a” office in Bucharest which is at an advanced stage of completion, and expected to be delivered in H1-2021. we are very pleased that despite the challenging environment due to the covid-19 pandemic, we managed to create a safe environment in our construction sites, allowing us to progress with our developments in accordance with our envisaged respective timetables.
overall during the year, we invested c.€54 million in our development projects and have €17.5 million remaining to be invested for the completion of the properties which were under construction in 2020.
industrial Facilities we delivered two new industrial facilities in romania offering a total of 43.4k sqm of high-quality gla through our Joint venture partnership where we have a 50% interest. Constanta Business Parkthe constanta Business park (“cBp”) represents our first development project in the eastern part of romania. the park will be developed in phases and on completion is expected to offer 561k sqm of high-quality logistics/light-industrial (c.80%), office and other commercial space.
in July 2020, phase “a” was delivered, involving the development of a logistics/light-industrial facility with 20.6k sqm of high-quality gla. the project has already attracted significant tenant interest, as cBp aims at becoming a new industrial and commercial hub in the eastern part of the country, and was 69.2% let at the end of 2020 to Quadrant amroq Beverages (pepsico), and four other corporates.
Chitila Logistics Hub the chitila logistics Hub (“clH”) is a high-quality logistics park to be developed in phases in the greater Bucharest area. this is our first industrial project we are developing in the capital and on completion of all its phases will offer a gla of 75.8k sqm.
phase “a” of this “last-mile” park was delivered in september 2020, offering 22.7k sqm of logistics space, with the facility fully leased as at 31 december 2020 to tenants including mega image, part of the delhaize group and green net (retailer).
DeveLOPMeNTS review
FOCUSED ON DEVELOPMENT OF HIGH-QUALITY PROPERTIES WHILE ADAPTING TO MARKET CONDITIONS
Podium Park
review of Projects Under Constructionat the end of 2020 we had one office project under construction in Bucharest. globalworth square, is a class “a” office development in the new cBd of Bucharest. the property under construction, is located between our own globalworth plaza and green court B offices, and on completion, estimated in H1-2021 will offer 29.1k sqm of high-quality gla and c.450 parking spaces over 15 floors above ground and three underground levels. as at the end of december 2020, construction is in progress with the building structure completed and the façade (almost fully completed) and other installations in progress. globalworth square is expected to receive a Breeam outstanding accreditation following its delivery, our first property in romania to receive the highest Breeam level accreditation awarded to buildings.
Developments completed in 2020
4Total GLA added to our portfolio
95.8k sqm
Construction and development expenditure
€54m
One Class “A” office under construction
Secured development pipeline to be developed in phases in the future

Globalworth Campus
3130 Globalworth annual report and financial statements 2020Globalworth annual report and financial statements 2020
overview STrATeGiC rePOrT portfolio review governance financial statements additional information
GLOBALWORTH CAMPUS TOWER 3 PODIUM PARK II
DeveLOPMeNTS review continued
OUR OFFICE PROJECTS DELIVERED IN 2020
Podium Park
Completed the final phase of the Globalworth Campus project in Bucharest.
The Globalworth Campus Projectthe globalworth campus represents our vision for the development of a best-in-class office community in Bucharest, using best practices from around the world to provide technically highly specified and environmentally friendly towers, offering 90.8k sqm of high-quality space balanced between class “a” offices, commercial and other supporting facilities, and a 750-seat conference centre.
Phase Aphase a comprised “twin” class “a” office towers with total gla of 57.2k sqm and 456 parking spaces, with each building extending over 12 floors above ground and two underground levels, and delivered in september 2017 and april 2018 respectively.
Phase Bphase B, which represents the final phase of the project, was completed with the delivery of the third (centre) tower of the globalworth campus development in January 2020. tower 3 offers in total 35.5k sqm of high-quality space, with its main features being a class “a” office building extending over 14 floors above ground offering 32.2k sqm of office, and a 750-seat conference centre (1.9k sqm). in addition there are c.500 parking spaces.
Green Certificationsthe globalworth campus project is green certified with Breeam excellent accreditation, with tower 3 being awarded the highest Breeam excellent accreditation among buildings in our portfolio.
Our Tenants all three office towers in globalworth campus are multi-tenanted by blue-chip tenants in the it and services sectors, including amazon, dell, allianz, unicredit services, stefanini and mindspace.
ProPErtY oVErVIEw – PhaSE b
Location:Bucharest new cBd
Type: class “a” office
Year of Completion:2020
GLA: 33.6k sqm
Parking Units:506
Layout: 2ug+gf+13f+tech floor
Typical Floor Plate:2.3k
Access:metro, tram and bus
Green Accreditation:Breeam excellent
KEY INVEStMENt hIGhlIGhtS – PhaSE b
Ownership100%
Occupancy:70.7% (90.8% incl. option)
Passing rent:€3.9m
Potential rent at 100% Occupancy€5.9m
est. Yield on Development Cost10.6%
Completed the second phase of Podium Park in Krakow.
The Podium Park Projectpodium park is an office complex project in the eastern part of Krakow, which on completion will comprise of three interconnected buildings offering in total 55.4k sqm of class “a” office space and over 1.0k parking spaces.
we acquired the complex in december 2019, with the first building having being delivered in september 2018 and the other two to be developed in the future. at the time of the acquisition, we signed an agreement with the vendor by which the latter will manage the design, development, construction and leasing process of buildings ii and iii.
Podium Park iipodium park ii was delivered in september 2020 and offers 18.8k sqm of high-quality gla and c.450 parking spaces over 11 floors above ground and two underground levels. the delivery of this class “a” office represents another milestone for the group, as it was our first development project in poland.
Green Certificationsthe podium park complex is green certified with Breeam outstanding accreditation, the highest level of certification awarded by Breeam.
Our Tenants podium park i and ii are multi-tenanted class “a” offices leased to blue-chip occupiers including revolut, ailleron and fmc technologies.
ProPErtY oVErVIEw – PoDIUM ParK II
Location:eastern part of Krakow
Type: class “a” office
Year of Completion:2020
GLA: 18.8k sqm
Parking Units:464
Layout: 2 ug, gf & 10
Typical Floor Plate:1.7k sqm
Access:private transport
Green Accreditation:Breeam outstanding
KEY INVEStMENt hIGhlIGhtS – PoDIUM ParK II
Ownership100%
Occupancy:82.6%
Passing rent:€2.9m
Potential rent at 100% Occupancy€3.4m
est. Yield on Development Cost7.9%

Constanta Business Park
Chitila Logistics Hub
3332 Globalworth annual report and financial statements 2020Globalworth annual report and financial statements 2020
overview STrATeGiC rePOrT portfolio review governance financial statements additional information
DeveLOPMeNTS review continued
OUR INDUSTRIAL PROJECTS DELIVERED IN 2020
ProPErtY aMENItIES
ProPErtY aMENItIES
Modern interiors
10.5m clear height
LeD lighting
Green energy solutions
excellent location (targeting infrastructure hubs and Pan-european Transportation Corridors).
Modern interiors
10.5m clear height
LeD lighting
Green energy solutions
excellent location (targeting infrastructure hubs and Pan-european Transportation Corridors).
CONSTANTA BUSINESS PARK
Completed the first phase of Constanta Business Park.
The Constanta Business Park Projectthe constanta Business park (“cBp”) is an industrial and commercial hub to be developed in phases in constanta, southeast romania.
the project is developed through a Joint venture established in 2019 in which we own a 50% interest. the total project on completion is expected to offer 561k sqm of high-quality logistics/light-industrial (c.80%), office and other commercial space.
Phase Aphase a commenced in november 2019 and was delivered in July 2020 and offers 20.6k sqm of high-quality logistics/light-industrial space, and represents a significant milestone for the group, as it is the first facility we have co-developed in the southern part of the country.
Our Tenantsthe project has already attracted significant tenant interest, as cBp aims at becoming a new industrial and commercial hub in the eastern part of romania, and was 69.2% let at the end of 2020 to Quadrant amroq Beverages (pepsico), maracana and three other tenants.
ProPErtY oVErVIEw
Location:constanta
Type: logistics
Year of Completion:2020
GLA:20.6k sqm
Layout: gf
Access:private transport
Green Accreditation:under review
KEY INVEStMENt hIGhlIGhtS
Ownership50%
Occupancy:69.2%
Passing rent:€0.6m
Potential rent at 100% Occupancy:€0.9m
est. Yield on Development Cost:8.9%
ProPErtY oVErVIEw
Location:greater Bucharest area
Type: logistics
Year of Completion:2020
GLA:22.7k sqm
Layout: gf
Access:private transport, bus
Green Accreditation:under review
KEY INVEStMENt hIGhlIGhtS
Ownership50%
Occupancy:100%
Passing rent:€0.9m
Potential rent at 100% Occupancy*:€1.1m
est. Yield on Development Cost:10.2%
*for calculation of Yield on cost we have applied
erv in short-term leases
CHITILA LOGISTICS HUB
Completed the first phase of Chitila Logistics Hub.
The Chitila Logistics Hub Projectthe chitila logistics Hub (“clH”) is a high-quality industrial park to be developed in phases in the greater Bucharest area, which on completion of all phases will offer a gla of 75.8k sqm.
clH is the second project in the industrial space, we are developing with a joint-venture partner which we established in 2019 where we own a 50% interest.
Phase Aconstruction of phase a took 10 months, with the first facility delivered in september 2020, offering 22.7k sqm of high-quality logistics space.
the facility represents another milestone for the group, as it is the first industrial facility we have developed in the greater Bucharest area.
Our Tenantsdemand for “last-mile” logistics has been increasing as the number of “business-to-consumer” deliveries have been growing, especially from e-commerce companies. this increased demand is evidenced in clH where the facility was 100% let at the end of 2020 to tenants including mega image and green net.

Chitila Logistics Hub
Constanta Business Park
Globalworth Square
3534 Globalworth annual report and financial statements 2020Globalworth annual report and financial statements 2020
overview STrATeGiC rePOrT portfolio review governance financial statements additional information
FUTUre DeveLOPMeNTS
PODiUM PArK iii
GLOBALwOrTH weST
CHiTiLA LOGiSTiCS
HUB(PHASe C)*
CONSTANTA BUSiNeSS
PArK(PHASeD)*
TiMiSOArA iNDUSTriAL
PArK i & ii(PHASeD) LUTerANA
GreeN COUrT D
Krakow west Bucharest Bucharest Constanta Timisoara CBD New CBD
Construction postponed
Construction postponed
Planned Planned Planned Planned Planned
17.7 33.4 37.5 519.1 185.1 26.4 16.2
8.5 5.2 2.3 11.5 7.6 7.4 2.5
9.6 7.8 2.8 20.6 11.3 14.0 5.9
29.7 38.7 15.3 248.9 71.1 40.2 24.4
3.1 5.1 1.6 27.3 7.6 5.8 3.0
8.1% 11.5% 9.3% 10.5% 9.6% 12.2% 11.2%
DeveLOPMeNTS – UNDer CONSTrUCTiON / DeveLOPMeNT PriOriTiSeD
GLOBALwOrTH SQUAre CONSTANTA BUSiNeSS PArK
(PHASe B)*CHiTiLA LOGiSTiCS HUB
(PHASe B)*
Location New CBD Constanta Bucharest
Status Under construction Development prioritised Development prioritised
expected Delivery H1-21 H2-21 H2-21
GLA (k sqm) 29.1 21.5 15.6
CAPeX to 31 Dec 20 (€ m) 39.8 0.5 1.0
GAv (€ m) 42.4 0.8 1.2
estimated CAPeX to Go (€ m) 17.5 10.3 6.4
erv (€ m) 5.6 1.0 0.7
estimated Yield on Development Cost 9.8% 8.9% 9.3%
we are currently progressing with select preparatory activities, including performing planning and/or permitting for this land bank, prioritising the subsequent phases of chitila logistics Hub and constanta Business park projects as a result of the success of their respective first phases and the increasing interest for space for these projects.
projects classified for “future development”, are periodically reviewed by the group, with the pace at which these projects are being developed being subject to tenant demand and general market conditions.
right of First Offerglobalworth has invested in the two-phase my place (formerly Beethovena) project in warsaw, in which it owns a 25% economic stake, with the right to acquire the remaining interests once certain conditions have been satisfied.
my place i & ii (formerly: Beethovena i & ii) are class “a” office projects in the south of warsaw comprising two, four-floor offices, which on completion will offer a total gla of 36.1k sqm. the two offices are of similar size (19.0k sqm and 17.1k sqm). the first phase, completed in Q2-2019, is currently c.92% leased to tenants such as Havas and mastercard, whereas phase ii was delivered in Q4-2020, and is partially leased, with first premises being handed over to the tenants at the beginning of 2021.
our total equity investment as at year-end 2020 in these two buildings was €6.4 million.
review of Future Developmentsas part of the review of our development projects amid the covid-19 pandemic, the two offices in Bucharest (globalworth west) and Krakow (podium park iii) which were at an early stage of development at the time of the outbreak were postponed and reclassified as projects for future development. these two class “a” office developments, upon completion are expected to add in total 51.1k sqm to our portfolio and had an appraised value of €17.4 million at 31 december 2020 (€16.4 million as at 31 december 2019).
in addition, we own, directly or through Jv partnerships, land plots in prime locations in Bucharest and other regional cities in romania, covering a total land surface of 1.4 million sqm (comprising 2.1% of the group’s combined gav), for future developments of office, industrial or mixed-use properties. when fully developed, these land plots have the potential to add in total a further 821.3k sqm (mainly office and logistics / light-industrial) of high-quality gla to our standing portfolio footprint.
DeveLOPMeNTS review continued
WE OWN SEVERAL HIGH-QUALITY PROJECTS WHICH WE AIM TO DEVELOP IN THE FUTURE
* 50:50 Joint venture; figures shown on 100% basis.

3736 Globalworth annual report and financial statements 2020Globalworth annual report and financial statements 2020
overview STrATeGiC rePOrT portfolio review governance financial statements additional information
ASSeT MANAGeMeNT review
SAFEGUARDING OUR PORTFOLIO & MINIMISING THE IMPACT OF COVID-19
Leasing review2020 was a year of two very different tales in our markets of focus in poland and romania, with the first few months benefiting from the strong leasing momentum of the previous years, followed by the covid-19 global pandemic outbreak where several companies were forced to reassess their occupational plans (extensions, expansions, relocations, release of spaces etc), as well as the duration of the leases signed.
notwithstanding these unprecedented times, the entire globalworth team, led by our dedicated leasing departments, successfully negotiated the take-up (including expansions) or extension of leases covering c.25% of our total standing commercial gla, an impressive performance considering the prevailing conditions in the market and is mostly attributed to the successful negotiations with our existing tenants who appreciated our collaborative and flexible approach.
New Leases in 2020, the group successfully negotiated the take-up (including expansions) or extension of 303.5k sqm of commercial spaces in poland (39.3% of transacted gla) and romania (60.7% of transacted gla), with an average wall of 3.9 years (179.5k sqm at an average wall of 5.5 years signed in 2019).
our principal focus for the year, and especially following the covid-19 pandemic outbreak, was the prolongation of leases with existing tenants in our portfolio, as the current market environment was not perceived favourable by several corporates to relocate or expand their operations, while in several cases were forced to downsize or even close-down their operations.
leases were renewed with 159 of our tenants, for a total of 225.5k sqm of gla, at a wall of 3.4 years, with the most notable extensions involving dacia (groupe renault), nokia, unicredit, dXc technology (formerly Hp) and nestlé, while c.89.6% of the renewals by gla signed were for leases that were expiring in 2021 or onwards.
the greater uncertainty in the market was reflected by the shorter duration of the leases prolonged, with 85% of the tenants who renewed their leases following the pandemic outbreak doing so at an average of 2.6 years, and only c.20 large multinationals and national corporates extended their occupation for periods of 5 years or longer. in addition, offering rent concessions in exchange for extensions in lease duration was one of the tools we used in settling claims with tenants, which also resulted in a lower overall wall for leases prolonged during the year.
new leases for 63.8k sqm of gla were signed at a wall of 5.8 years, accounting for 81.8% of total new take-up, and included tenants such as Brd (part of société générale group), pepsico and allegro as well as 51 other corporates. the remaining 14.2k sqm of space signed in the period related to expansions by 31 tenants, with an average wall of 4.9 years.
signing of new leases, typically for large multinational and national corporates, is taking longer in the current environment as potential tenants are reassessing their future occupational plans.
Summary Leasing Activity for Combined Portfolio in 2020gla (k sqm) no. of tenants* wall (yrs)
new leases (new contracts & expansions) 78.0 85 5.5renewals / extensions** 225.5 159 3.4
Total 303.5 229 3.9
* number of individual tenants.** short-term renewals of leases extended and expired in 2020 are excluded from the analysis.
Occupancy the average occupancy of our combined standing commercial portfolio as at 31 december 2020 was 90.9% (91.7% including tenant options), representing a 4.0% decrease over the past 12 months (94.7% as at 31 december 2020 / 95.0% including tenant options).
standing occupancy has been affected by the addition of four properties with an average occupancy (79.6%) lower than the group average, and the negative net uptake of space despite the signing of new contracts, resulting in a lower average standing commercial occupancy rate of our portfolio.
on a like-for-like basis, occupancy was lower by 3.3% to 91.8% at the end of 2020. this is a decrease considered modest given the very challenging market conditions. it is also important to note that from the net space returned to us during this period, c.70% was directly or indirectly impacted by covid-19, thus not relocating to other office properties. we remain confident that we will be able to lease the available spaces in our portfolio in the future as business conditions return to a more normalised state.
in addition, occupancy in our renoma mixed-use asset in wroclaw has also decreased, however this is due to the property undergoing a partial refurbishment / repositioning, and we have not included it in our occupancy metrics.
across the portfolio, as at 31 december 2020, we had 1,125.6k sqm of commercial gla leased to approximately 600 tenants in our standing properties (98.3% in standing commercial properties), at an average wall of 4.5 years, the majority of which is let to national and multinational corporates that are well known within their respective markets.
in addition, we had 25.2k sqm leased in renoma which is currently under refurbishment and not included in our standing portfolio.
Occupancy evolution 2020 (GLA 'k sqm) – Commercial Portfolio
polandoccupancy
rate (%) romaniaoccupancy
rate (%) groupoccupancy
rate (%)
Standing Available GLA – 31 Dec. 19 586.3 94.1% 593.8 95.3% 1,180.1 94.7%acquired gla – – –delivered gla 18.8 77.0 95.8net remeasurements/reclassifications* (38.9) 1.9 (37.0)
Standing Available GLA – 31 Dec. 20 566.2 89.4% 672.7 92.0% 1,238.9 90.9%
vacant Standing GLA – 31 Dec. 19 34.7 5.9% 28.0 4.7% 62.7 5.3%
delivered vacant gla 3.3 16.2 19.5expiries & Breaks 39.1 37.8 76.9renewals 87.6 120.9 208.5new take-up (13.3) (30.9) (44.2)other adj** (3.9) 2.4 (1.6)
vacant Standing GLA – 31 Dec. 20 59.8 10.6% 53.5 8.0% 113.3 9.1%
* includes the reclassification of renoma mixed-use property in poland from standing to refurbished / repositioned (40.9k sqm of gla).** includes the reclassification of vacant gla in renoma as of 31 dec 2019 from standing to under refurbishment (5.1k sqm of vacant gla). other lease expirations,
renewals or new take-up in relation to renoma are excluded from the table as the property was reclassified in Q3-2020.
rental Levelsmarket rental levels, although they can vary significantly between type of spaces, buildings and submarkets, remained relatively stable in our portfolio in both poland and romania during the year.
our overall commercial gla take-up in 2020 was agreed at an average rent of €10.9/sqm/m, lower compared to the previous year (€12.8/sqm/m for 2019), due to the relative high ratio of industrial spaces leased during the year which accounted for c.32.3% of the total leasing activity.
office leases were negotiated at an average rent of €14.5/sqm/month (€14.2/sqm/month for fY2019), with our overall office average being €14.2/sqm/month as at 31 december 2020, mainly due to signing renewals with tenants occupying spaces with higher rent (e.g. technology and financial institutions). industrial and retail spaces leased at €3.9 and €13.6/sqm/m respectively.
Contracted rents (on Annualised Basis) total annualised contracted rents in our standing commercial portfolio were €177.7 million at 31 december 2020, lower by 3.1% compared to 31 december 2019, increasing to €182.4 million when including rent from assets being refurbished / repositioned. in addition, €1.0 million of annualised rental income is generated by renting 157 residential units and other auxiliary spaces in upground, the residential complex in Bucharest which we partially own.
like-for-like annualised contracted rents in our standing commercial portfolio decreased by 4.2% to €169.4 million at 31 december 2020 compared to year-end 2019, as the increase in rents (1.0% on average) due to indexation was outweighed primarily by the lower occupancy.

3938 Globalworth annual report and financial statements 2020Globalworth annual report and financial statements 2020
overview STrATeGiC rePOrT portfolio review governance financial statements additional information
ASSeT MANAGeMeNT review continued
Annualised Contracted rent evolution 2020 (€ m)poland romania group
rent from Standing Commercial Properties (“SCP”) 31 Dec. 19 105.0 78.3 183.3less: properties reclassified (*) (6.5) – (6.5)
rent from SCP Adjusted for Properties reclassified 31 Dec. 19 98.5 78.3 176.8less: space returned (7.9) (7.1) (14.9)plus: rent indexation 0.9 0.8 1.7less: lease renewals (net impact) & other (0.4) (1.8) (2.2)plus: new take-up 3.1 4.9 8.0
Total L-f-L rent from Standing Commercial Properties 31 Dec. 20 94.1 75.2 169.4plus: developments completed during the period 2.9 5.5 8.4
Total rent from Standing Commercial Properties 97.0 80.7 177.7plus: residential rent – 1.0 1.0
Total rent from Standing Properties 97.0 81.7 178.7plus: leased space on developments projects 4.7 – 4.7
Total Contracted rent at 31 Dec. 2020 101.7 81.7 183.4
Combined Annualised Commercial Portfolio Contracted rent Profile as at 31 December 2020
poland romania group
Contracted rent (€ m) 101.7 80.7 182.4multinational 66.6% 90.9% 77.3%national 31.2% 7.8% 20.8%state owned 2.3% 1.3% 1.9%
note: contracted rent excludes c.€1.0 million from residential space as at 31 december 2020.
Annualised Commercial Contracted rent by Period of Commencement Date as at 31 December 2020 (€ m)
active leases2020 H1-2021 H2-2021 H1-2022 H2-2022 >2022 total
standing properties 173.9 3.2 – 0.3 0.0 0.3 178.7developments 4.7 0.0 – – – – 4.7
Total 178.6 3.2 – 0.3 0.0 0.3 182.4
Annualised Commercial Portfolio Lease expiration Profile as at 31 December 2020 (€ m)
Year 2021 2022 2023 2024 2025 ≥2026
total 22.6 22.1 21.9 33.4 17.2 65.0
% of Total 12.4% 12.1% 12.0% 18.3% 9.4% 35.8%
the group’s rent roll across its combined portfolio is well diversified, with the largest tenant accounting for 5.0% of contracted rents, while the top three tenants account for 10.6% and the top 10 account for 26.7%. we expect this diversity to grow further as the portfolio continues to expand.
Cost of renting Spacesrenting spaces typically involves certain costs which are incurred by the landlord. the base rent is the figure generally used as a reference point in the real estate market, but in assessing the profitability of a rental agreement, the effective rent can be a more useful indicator.
the difference between the base rent and the effective rent is determined by the level of incentives awarded to tenants as part of the lease agreement, including rent-free periods, fitout costs for the space leased, and brokerage fees. these incentives can vary significantly between leases, and range depending on type of lease (new take-up or lease extension), space leased (office, commercial, etc), duration of the contract and other factors considered.
for leases typically signed by globalworth the difference between base and effective rents ranges from 7% to 30%, however due to the high level of renewals with a shorter-term duration than what we normally sign, the average for the year was c.21% (25% in 2019).
weighted Average effective rent (€ / sqm / m) – 2020poland romania group
Headline Commercial rent 14.9 8.3 10.9less: rent free concessions (2.1) (0.7) (1.2)less: tenant fitouts (1.8) (0.5) (0.9)less: Broker fees (0.2) (0.1) (0.1)
effective Commercial rent 10.9 7.0 8.7
wALL (in years) 3.4 4.6 3.9
note: the average headline commercial rent was impacted by the signing of 97.9k sqm of industrial spaces in 2020 (53.1% from the total gla signed in romania, 32.3% from the total gla signed in 2020 at group level), most of it being signed in the second half of the year.
Headline commercial rent on office spaces for leases signed in 2020 stood at €14.5/sqm/m with average incentives of c.24%.
Tenant Demands/Claims review1
the impact of the global covid-19 pandemic, since it first broke out in mid-march, has forced poland and romania, similar to most countries in europe, to adopt very restrictive measures in terms of movement of people and travelling, as well as enforcing the closure of all but essential retail premises. these measures were somewhat relaxed during the summer period, however the increasing number of covid-19 cases since resulted in several measures and restrictions to be reintroduced.
in 2020, no government measures in either country of our focus implemented forced closure of office premises, industrial properties or essential retail businesses (supermarkets, pharmacies, convenience stores etc), however the direct and/or indirect impact of the restrictive and protective measures imposed, and the impact the crisis has had on certain businesses and industries, resulted in us receiving a growing number of tenant demands and claims.
since the beginning of the pandemic, we have had a very proactive approach in managing this constantly evolving situation by being in continuous communication with all our tenants and by adopting an open and collaborative approach, by providing assistance to tenants in this period of higher uncertainty, while ensuring the sustainability and longevity of our business.
of our €183.4 million of total contracted rent on the last day of the year, office rent accounted for 87.3% (including parking rent), with retail / commercial, industrial and other spaces accounting for 5.7%, 5.3% and 1.7% respectively.
overall, since the beginning of the pandemic and until the year-end, we have estimated the value of the claims received at c.€11.1 million2, reflecting c.6.1% of our contracted annual rent.
1 data as of 31 december 2020.2 the estimate results from the fact that a number of tenant claims received had no
value attached to them or are still under negotiation. the estimated claims value also excludes certain ones related to lease agreements which were already under extension negotiations before the start of the crisis.
the majority of the claims received were from occupiers operating in industries which saw immediate impact in their businesses from the covid-19 pandemic (e.g. tourism related or co-working) and occupiers who were directly or indirectly impacted by measures taken by the authorities (e.g. restaurants/canteens etc), however we also received claims from a number of tenants seeking to reduce costs.
in dealing with these claims we have considered each case separately, rather than applying a horizontal or vertical approach, trying to identify the best solution for our tenant and globalworth. some of the solutions implemented have been bringing forward to this year rent free months that were applicable in later years, awarding rent free months / reductions this year in exchange for lease extensions, or delayed payment dates on rent invoices.
approximately 54.0% of the claims by value were settled without a cash impact on the rental income and from the claims settled approximately half resulted to a lease maturity extension.
more importantly the impact on our net operating income was limited to 2.3%, with c.75% related to retail/commercial tenants as a result from direct or indirect restrictions imposed on the operation of non-essential retail/commercial tenants by the authorities.
in addition, we expect that the economic impact of these claims will be substantially mitigated by the cost-cutting initiatives already implemented across the group and through the extension of leases negotiated as part of the covid-related agreements reached with our tenants.

Skylight & Lumen
4140 Globalworth annual report and financial statements 2020Globalworth annual report and financial statements 2020
overview STrATeGiC rePOrT portfolio review governance financial statements additional information
ASSeT MANAGeMeNT review continued
Collections review3
the ability to collect – cash in – contracted rents is a key determinant for the success of a real estate company.
our rate of collections of rents invoiced and due in 2020 has remained high at 99.0% (99.3% for 2019), as a result of the long-term partnerships the group has established with high-quality national and multinational tenants, which have helped us minimise the impact on rent collections due to the covid-19 pandemic in our portfolio, and ensure sustainable cash flow generation.
more specifically, considering the current market environment, rent to be collected in 2020 was classified as: – rent eligible for invoicing: includes rents to be invoiced to tenants
in accordance with the terms of their lease agreements. such rents were either collected or subject to collection; and
– rent impacted by measures imposed by the authorities: such rent was to be collected based on the contractual agreements in place, however due to measures taken by the authorities in poland and romania, tenants were excluded from paying, and as such no invoices were issued by the group.
under normal conditions, the group during the year would have had €106.3 million of rent be invoiced and due, however €2.9 million was not invoiced due to measures taken by the authorities.
Portfolio valuation our entire portfolio in poland and romania was revalued, by independent appraisers, as at 31 december 2020. valuations were performed in accordance with our policy of revaluing our properties twice a year, at the end of June and december respectively. cBre and Knight frank valued our properties in poland, with colliers and cushman and wakefield valuing our properties in romania (more information is available under note 4 of the audited consolidated financial statements as of the period ended 31 december 2020).
our portfolio over the past periods has been growing in value, both on a like-for-like and absolute value basis, as a result of our asset management initiatives, and the performance of the real estate markets in poland and romania, resulting in healthy investor interest, tenant demand meeting or exceeding supply for quality real estate spaces, which led to contracting yields, stable or growing rental levels and lowering tenant incentives.
3 data as of 12 march 2021.
the covid-19 pandemic, however, has created uncertainty in the market which has also been reflected in the independent appraised valuation of our portfolio.
the total combined value of our real estate portfolio in poland and romania as at 31 december 2020 remained effectively unchanged at €3.0 billion, compared to 31 december 2019, as the net positive impact from our developments (delivered, in progress or under refurbishment) was partially offset from the negative revaluation from our standing portfolio. like-for-like appraised value of our standing commercial properties was €2.6 billion at year-end, 2.6% lower compared to 31 december 2019.
appraisers have taken a more cautious approach when valuing our properties, typically applying wider yields and higher discount rates (when applicable) for our office and mixed-used properties. the level at which yields and discount rates have been considered vary, taking into account factors such as the commercial profile of the property, its location and the country in which it is situated. for the majority of our office and mixed-use properties, yields and/or discount rates considered, were 10 – 50bps wider compared to december 2019. it is to be noted yields and/or discount rates used by appraisers were stabilised between 30 June and 31 december, and in certain cases contracted. our industrial properties, as well as the overall sector in romania, continue to perform well, with valuations improving compared to year-end 2019.
Combined Portfolio value evolution 2020 (€ m)poland romania group
Total Portfolio value at 31 Dec. 2019 1,647.4 1,397.7 3,045.1
plus: transactions / (disposals) – (2.1) (2.1) plus: capital expenditure 26.4 36.7 63.1 plus: net other changes (63.7) (9.4) (73.1)
Total Portfolio value at 31 Dec. 2020 1,610.1 1,422.8 3,032.9
o/w properties in Joint venture* – 51.2 51.2
(*) properties held through joint ventures are shown at 100%. globalworth owns a 50% stake in the respective joint ventures.
Combined Portfolio value Overview 2020 (€ m)
poland romania groupYoY
% changelfl
% change
Office 1,337.3 1,164.0 2,501.3 (0.3%) (3.0%) o/w standing properties 1,327.8 1,093.9 2,421.7 2.8% (2.3%) o/w developments in progress – 42.4 42.4 (63.2%) 68.9% o/w future developments 9.6 27.7 37.3 1.6% 1.6%
Mixed-Used 272.8 – 272.8 (9.0%) (9.0%) o/w standing properties 169.7 – 169.7 (43.4%) (8.4%) o/w properties under refurbishment 103.1 – 103.1 100.0% (9.8%)
industrial – 181.5 181.5 15.2% 3.0% o/w standing properties – 144.8 144.8 23.6% 1.6% o/w future developments – 36.7 36.7 (9.2%) 7.9%
Other – 77.3 77.3 (2.9%) (2.9%) o/w standing properties – 69.4 69.4 (3.1%) (3.1%)
o/w lands – 7.9 7.9 (1.3%) (1.3%)
Total Portfolio at 31 Dec. 2020 1,610.1 1,422.8 3,032.9 (0.4%) (3.3%)
(*) properties held through joint ventures are shown at 100%. globalworth owns a 50% stake in the respective joint ventures.note: developments include projects under construction and projects postponed to be developed in the future.

Growthpoint Properties 29.5%
Aroundtown 22.0%EBRD 5.0%
Other 8.6%
CPI Property Group 29.6%
Globalworth Shareholding (Information as at 31 December 2020)
Oak Hill 5.3%
1 Jan 20 31 Mar 20 31 Jun 20 31 Sep 20 31 Dec 20
50%
60%
70%
80%
90%
100%
110%
Mihai Zahariagroup capital markets director & Head of investments romania
4342 Globalworth annual report and financial statements 2020Globalworth annual report and financial statements 2020
overview STrATeGiC rePOrT portfolio review governance financial statements additional information
Globalworth continued to use the capital markets to raise funds to support its growth and manage its balance sheet. In 2020 the Group successfully accessed the debt capital markets, raising €400 million in its inaugural green bond issue.
equity Capital Market and Shareholder Structure Updatein the first quarter of 2020 we welcomed cpi property group (“cpipg”) who became the largest shareholder in globalworth, holding 29.6% of the share capital. cpipg, which is one of the largest owners of real estate in the cee with a portfolio of €9.8 billion as at 30 June 2020, acquired its stake through a series of share purchases, including the stake of globalworth’s founder and former ceo, mr papalekas.
in addition, oak Hill advisors (“oak Hill”), a leading alternative investment firm with c.$50 billion of assets under management globally became the fourth largest shareholder in globalworth, holding 5.3% of the share capital. oak Hill first entered the globalworth share
ftse/epra developed europe (ex uK)globalworth ftse/epra global
Globalworth 2020 Share Price Performance
CAPiTAL MArKeTS review
EQUITY CAPITAL MARKETS
Basic Data on Globalworth Shares (information as at 31 December 2020)
number of shares 220.8m (plus 1.6m shares held in treasury)share capital €1.7mwKn / isin gg 00B979fd04symbol gwifree float 18.5%exchange london aim
Globalworth Share Performance2019 2020
market capitalisation (€ m) (31/12) 2,074 1,28331-dec closing price (€) 9.35 7.1352-week high (€) 9.70 10.1052-week low (€) 7.80 4.90dividend per share (€) 0.60 0.34
Bonds Updatein our continuous effort to effectively manage the liabilities of the group and further improve our debt maturity profile, at the end of July we initiated a parallel process resulting in: – the issue of our inaugural green bond as part of our euro medium
term notes programme, raising €400.0 million, with a 2.95% coupon and maturing in July 2026 from the debt capital markets.
– the purchase of c.41% (€226.9 million) of gwi 17/22 outstanding eurobond, at a premium of 2.0% over par. as part of the transaction, any accrued and unpaid interest in respect of the purchased notes was also settled in cash. following the transaction, c.€323.1 million of the gwi 17/22 eurobond remain outstanding.
overall, we are very pleased with the outcome of our efforts, as our inaugural green bond was more than 2x oversubscribed by existing and new bond investors, further confirming our strong performance, the quality of our portfolio and team, as well our overall approach to sustainable development and the creation of long-term value for our stakeholders, in the period of increased uncertainty due to the covid-19 pandemic.
this latest bond issue follows our 2017 strategic decision to simplify our capital structure and improve the efficiency of our capital allocation, resulting in the group having most of its debt financing (+80%) in three bonds following subsequent capital markets transactions in June 2017, march 2018 and July 2020, where we raised a total of €1.5 billion, and at year-end 2020 had €1.3 billion remaining outstanding.
following the issue of the gwi 20/26 green bond, globalworth has raised €950 million as part of its €1.5 billion euro medium term notes (“emtn”) programme established in 2018, allowing for a further €550 million of bonds to be issued by the group in the future.
globalworth is rated from all three major agencies, with all of s&p, fitch and moody’s maintaining their investment credit rating following the 2020 review of the group, which is testament to the nature and quality of our portfolio, the resilience of our cash flow, and the protective measures we have taken to protect the business and its assets amidst very challenging market conditions.
register in 2014, and it has held various stakes since then, with its highest level being 13.5% in 2014-2015, reduced to below 3.0% in 2019.
globalworth’s share price performed well in the first part of 2020, trading at par or above its epra nav level at a weighted average trading price of €9.71 per share between 1 January and 4 march, and reaching its year- high at the end of January at €10.1 per share.
since then, our share price has been impacted by the covid-19 pandemic, gradually decreasing over time, reaching its lowest closing price in september at €4.90 per share, gradually recovering by 47%, closing at €7.20 per share on 21 december 2020.
the globalworth share price underperformed both ftse epra developed europe and the ftse epra global indices since mid-april, mainly due to very limited trading volumes.
on the last trading day of 2020, globalworth’s share price stood at €7.13 per share, representing a 23.8% decrease over the year.
including dividends paid, the total return for the year was (18.6)%.

– in line with good market practice and icma gBp recommendations, globalworth decided to obtain a second party opinion on its inaugural green Bond framework from sustainalytics.
– sustainalytics confirmed not only globalworth’s alignment with the green Bond principles, but also its contribution to the advancement of the un sustainable development goals 7: affordable & clean energy and 11: sustainable cities & communities.
– additionally, sustainalytics considers that the projects funded by the green bond proceeds will provide a positive environmental impact by improving the energy efficiency of the building portfolio owned and operated by globalworth.
– sustainalytics is of the opinion that globalworth’s sustainable development strategy demonstrates a strong commitment to sustainability, with a focus on three key environmental principles: (i) integrate efficient and sustainable operating policies, procedures and actions, (ii) be accountable as a team of professionals for environmental stewardship, and (iii) work with its shareholders and other stakeholders to make environmentally responsible decisions.
See more information www.globalworth.com/investor-relations/bonds
GLOBALWORTH’S GREEN BOND FRAMEWORK IS IN ALIGNMENT WITH AND/OR CONTRIBUTES TO:
01 Jan 20 31 Mar 20 31 Jun 20 31 Sep 20 31 Dec 20
0%
1%
2%
3%
4%
0.7%
1.5%
1.9%
YIE
LD T
O M
ATU
RIT
Y
4544 Globalworth annual report and financial statements 2020Globalworth annual report and financial statements 2020
overview STrATeGiC rePOrT portfolio review governance financial statements additional information
gwi bond 18/25 gwi bond 20/26gwi bond 17/222020 Gwi Bond Trading Development
Green Bond Frameworksustainalytics, a leading provider for external reviews in the green bond market, is of the opinion that the globalworth green Bond framework aligns with the four core components of the green Bond principles 2018. this assessment is based on the following:
USe OF PrOCeeDS PrOJeCT evALUATiON/SeLeCTiON
MANAGeMeNT OFPrOCeeDS
rePOrTiNG
the eligible categories for the use of proceeds, Green buildingsbenefitting from the two highest levels of certification frombrEEaM or lEED and Energy Efficiency, are aligned with thoserecognised by the Green bond Principles 2018. Sustainalyticsconsiders that the eligible categories will lead to positiveenvironmental impacts and advance the UN SustainableDevelopment Goals, specifically SDGs 7 and 11.
Globalworth’s internal process of evaluating and selectingprojects is carried out by the Green bond Committee. theCommittee is responsible for screening projects against the eligibility criteria and recommending eligible projects for inclusion in the Eligible Green Project Portfolio. the Portfolio will be reviewed annually to ensure projects’ eligibility and, if nolonger eligible, projects will be removed and replaced as soon aspractically feasible. Sustainalytics considers the project selectionprocess in line with market practice.
Globalworth will strive to ensure that the level of allocation tothe Eligible Green Projects Portfolio matches or exceeds thebalance of net proceeds from its outstanding green bonds. Incase of any unallocated proceeds, Globalworth will hold and/orinvest, at its own discretion, in its liquidity portfolio. this is in linewith market practice.
Globalworth intends to report on allocation of proceeds on itswebsite, on an annual basis, until full allocation. Globalworth willreport on the total amount of allocation, the share of financing vsrefinancing and the details of the portfolio. In addition, Globalworthis committed to reporting on relevant impact metrics.Sustainalytics views Globalworth’s allocation and impactreporting (where feasible) as aligned with market practice.
CAPiTAL MArKeTS review continued
we maintained our “BBB –” rating and “stable” outlook from s&p and fitch, with moody’s maintaining our “Baa3” rating, but changing their outlook from “stable” to “negative” mainly due to their house view on the romanian economy.
Basic Data on the Globalworth Bondsgwi bond 17/22 gwi bond 18/25 gwi bond 20/26*
isin Xs1577957837 Xs1799975922 Xs2208868914sedol Bd8Q3p6 Bd9mpv3segment euronext dublin, BvB euronext dublin, BvB euronext dublinminimum investment amount €100,000 €100,000 and €1,000 thereafter €100,000 and €1,000 thereaftercoupon 2.875% 3.000% 2.950%issuance volume €550 million €550 million €400 millionoutstanding 31 dec. 2020 €323 million €550 million €400 millionmaturity 20 June 2022 29 march 2025 29 July 2026
Performance of the Globalworth Bonds2019 2020
Gwi bond 17/22Year-end closing price 105.4% 103.2%Yield to maturity at year-end closing price 0.671% 0.674%Gwi bond 18/25Year-end closing price 107.8% 106.2%Yield to maturity at year-end closing price 1.440% 1.475%Gwi bond 20/26*Year-end closing price – 105.4%Yield to maturity at year-end closing price – 1.874%
(*) 2020 performance from time of issue.
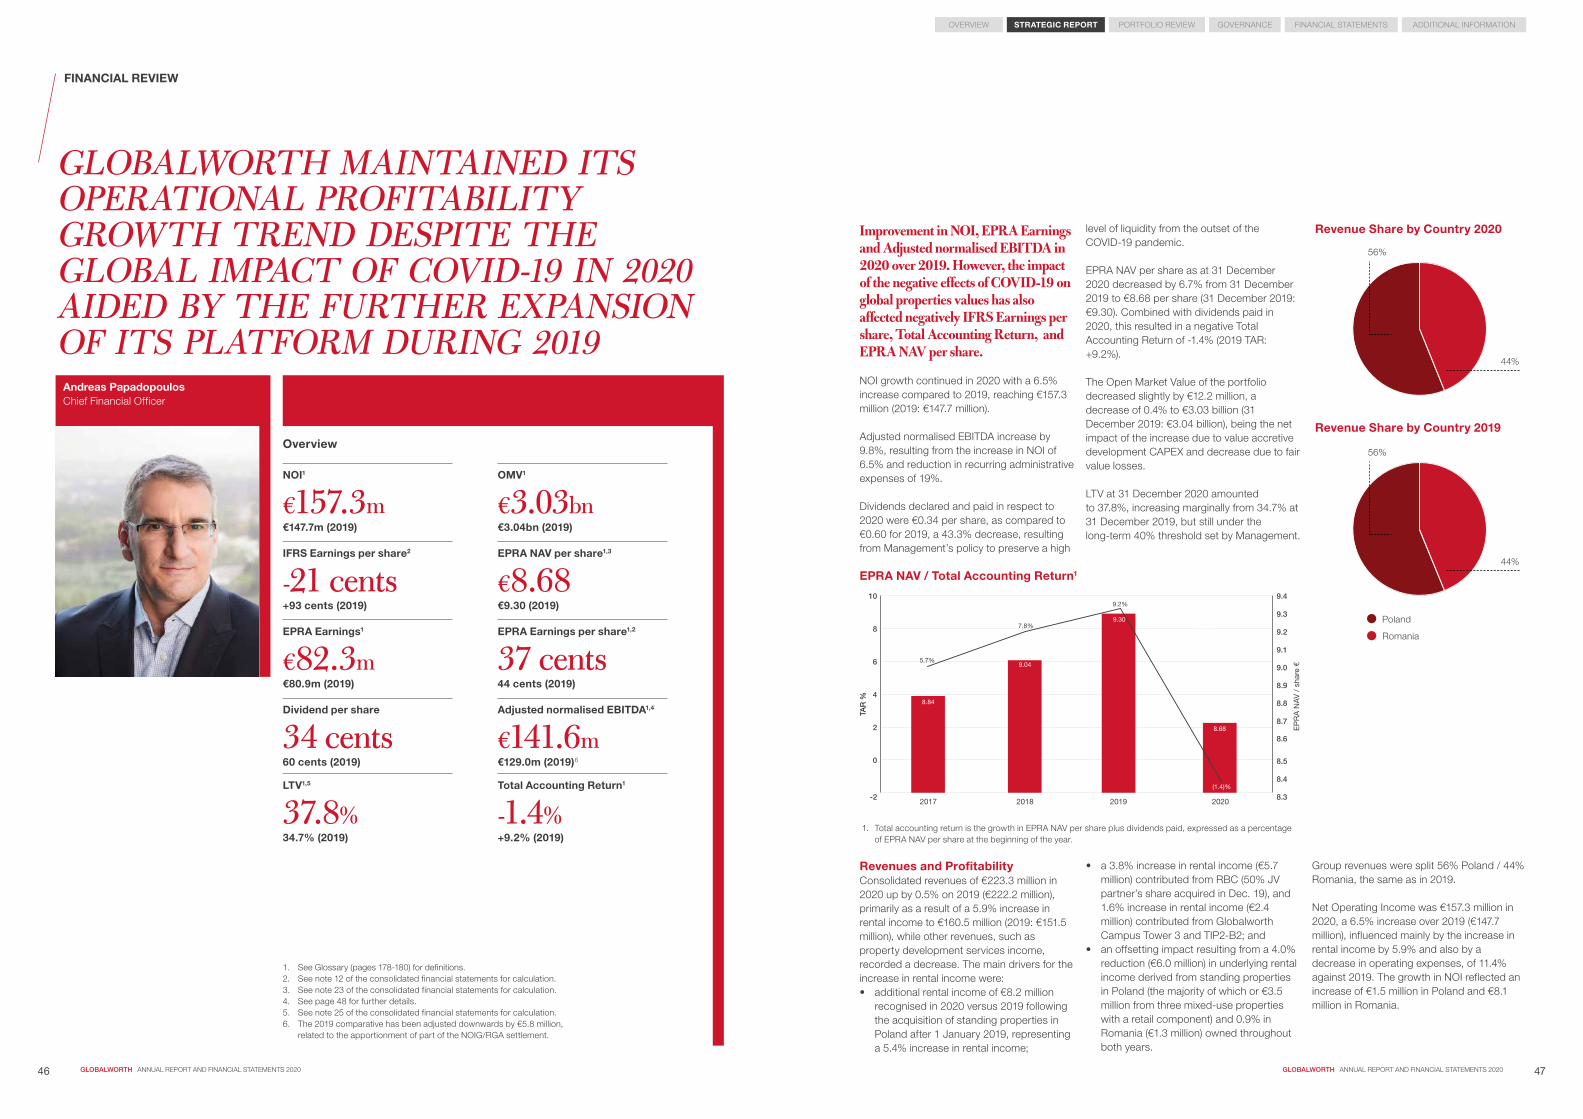
4746 Globalworth annual report and financial statements 2020Globalworth annual report and financial statements 2020
overview STrATeGiC rePOrT portfolio review governance financial statements additional information
FiNANCiAL review
GLOBALWORTH MAINTAINED ITS OPERATIONAL PROFITABILITY GROWTH TREND DESPITE THE GLOBAL IMPACT OF COVID-19 IN 2020 AIDED BY THE FURTHER EXPANSION OF ITS PLATFORM DURING 2019
NOi1
€157.3m€147.7m (2019)
iFrS earnings per share2
-21 cents+93 cents (2019)
ePrA earnings1
€82.3m€80.9m (2019)
Dividend per share
34 cents60 cents (2019)
LTv1,5
37.8%34.7% (2019)
OMv1
€3.03bn€3.04bn (2019)
ePrA NAv per share1,3
€8.68€9.30 (2019)
ePrA earnings per share1,2
37 cents44 cents (2019)
Adjusted normalised eBiTDA1,4
€141.6m€129.0m (2019)6
Total Accounting return1
-1.4%+9.2% (2019)
Overview
1. see glossary (pages 178-180) for definitions.2. see note 12 of the consolidated financial statements for calculation.3. see note 23 of the consolidated financial statements for calculation.4. see page 48 for further details.5. see note 25 of the consolidated financial statements for calculation.6. the 2019 comparative has been adjusted downwards by €5.8 million,
related to the apportionment of part of the noig/rga settlement.
Improvement in NOI, EPRA Earnings and Adjusted normalised EBITDA in 2020 over 2019. However, the impact of the negative effects of COVID-19 on global properties values has also affected negatively IFRS Earnings per share, Total Accounting Return, and EPRA NAV per share.
noi growth continued in 2020 with a 6.5% increase compared to 2019, reaching €157.3 million (2019: €147.7 million).
adjusted normalised eBitda increase by 9.8%, resulting from the increase in noi of 6.5% and reduction in recurring administrative expenses of 19%.
dividends declared and paid in respect to 2020 were €0.34 per share, as compared to €0.60 for 2019, a 43.3% decrease, resulting from management’s policy to preserve a high
level of liquidity from the outset of the covid-19 pandemic.
epra nav per share as at 31 december 2020 decreased by 6.7% from 31 december 2019 to €8.68 per share (31 december 2019: €9.30). combined with dividends paid in 2020, this resulted in a negative total accounting return of -1.4% (2019 tar: +9.2%).
the open market value of the portfolio decreased slightly by €12.2 million, a decrease of 0.4% to €3.03 billion (31 december 2019: €3.04 billion), being the net impact of the increase due to value accretive development capeX and decrease due to fair value losses.
ltv at 31 december 2020 amountedto 37.8%, increasing marginally from 34.7% at31 december 2019, but still under the long-term 40% threshold set by management.
ePrA NAv / Total Accounting return1
9.30
2017 2018 2019 2020
EP
RA
NA
V /
sha
re €
TAR
%
9.04
8.84
9.30
8.68
-2
0
2
4
6
8
10
8.3
8.4
8.5
8.6
8.7
8.8
8.9
9.0
9.1
9.2
9.3
9.4
5.7%
7.8%
9.2%
(1.4)%
1. total accounting return is the growth in epra nav per share plus dividends paid, expressed as a percentage of epra nav per share at the beginning of the year.
44%
44%
56%
56%
revenue Share by Country 2020
revenue Share by Country 2019
poland
romania
Andreas Papadopouloschief financial officer
revenues and Profitabilityconsolidated revenues of €223.3 million in 2020 up by 0.5% on 2019 (€222.2 million), primarily as a result of a 5.9% increase in rental income to €160.5 million (2019: €151.5 million), while other revenues, such as property development services income, recorded a decrease. the main drivers for the increase in rental income were:• additional rental income of €8.2 million
recognised in 2020 versus 2019 following the acquisition of standing properties in poland after 1 January 2019, representing a 5.4% increase in rental income;
• a 3.8% increase in rental income (€5.7 million) contributed from rBc (50% Jv partner’s share acquired in dec. 19), and 1.6% increase in rental income (€2.4 million) contributed from globalworth campus tower 3 and tip2-B2; and
• an offsetting impact resulting from a 4.0% reduction (€6.0 million) in underlying rental income derived from standing properties in poland (the majority of which or €3.5 million from three mixed-use properties with a retail component) and 0.9% in romania (€1.3 million) owned throughout both years.
group revenues were split 56% poland / 44% romania, the same as in 2019.
net operating income was €157.3 million in 2020, a 6.5% increase over 2019 (€147.7 million), influenced mainly by the increase in rental income by 5.9% and also by a decrease in operating expenses, of 11.4% against 2019. the growth in noi reflected an increase of €1.5 million in poland and €8.1 million in romania.

4948 Globalworth annual report and financial statements 2020Globalworth annual report and financial statements 2020
overview STrATeGiC rePOrT portfolio review governance financial statements additional information
Growth in Net Operating income (€ million)
0
32
64
96
128
160
NOI 2019 NOI 2020NOI growth (Poland) NOI growth (Romania)
147.7
157.31.5
8.1
€ m
illio
n
noi was split 57% poland / 43% romania, compared to 60% poland / 40% romania in 2019.
adjusted normalised eBitda1 amounted to €141.6 million, an increase of 9.8% over 2019 (€129.0 million2, which includes the share of minority interests), which correlates to the net effect of the increase in noi of 6.5% and a reduction in recurring administrative expenses of 19%.
1. earnings attributable to equity holders of the company before: finance cost, tax, depreciation, amortisation of other non-current assets, gain on acquisition of subsidiary (2020: €0.0 million; 2019: €2.9 million), fair value gains or losses on investment property and financial instruments (2020: loss of €116.2 million; 2019: gain of €119.6 million), non-recurring income (2020: €0.5 million; 2019: €0.9 million), acquisition costs (2020: €2.7 million; 2019: €0.2 million), non-recurring administration and other expense items (2020: €6.3 million; 2019: €9.2 million). the adjustments listed include the share of minority interests for year 2019 only as there were no minority interests in 2020.
2. the 2019 comparative has been adjusted downwards by €5.8 million, related to the apportionment of part of the noig / rga settlement amount, recorded in full in 2018 in line with related ifrs provisions.
iFrS ePS to ePrA ePS (€ cents per share)
-30
-20
-10
0
10
20
30
40
50
(21)
52
(0)
6 0 37
IFRS EPS
€ ce
nts
FV loss on properties
FV gain on �nancial instruments
Deferred tax JVs & Others EPRA EPS
finance costs increased by 13.5% in 2020 resulting mainly from the increase in the outstanding balance on the Bonds issued by the company, following the issuance of the €400 million new Bond in July 2020, as well as the interest associated with the drawdown of the €200 million rcf in march 2020 until its repayment in august 2020.
ifrs earnings were negative at €46.8 million (2019: +€170.2 million), resulting mainly from the €116.2 million fair value loss on investment property. excluding the impact of investment property valuations, the company would have generated a profit after tax, but before valuation changes of €69.4 million, 18.6% higher than in 2019 (€58.5 million).
ifrs earnings per share was negative at 21 cents (2019: positive 93 cents), mainly as a result of the impact of the fair value loss on investment property.
40%
43%
60%
57%
poland
romania
NOi Share by Country 2020
NOi Share by Country 2019
iFrS earnings to ePrA earnings (€ million)
-60
-40
-20
0
20
40
60
80
100
120
(46.8)
116.2
(0.5)
12.5 0.9 82.3
IFRS Earnings FV losson properties
FV gain on �nancial instruments
Deferred tax JVs & Others EPRA Earnings
€ m
illio
n
epra earnings improved over 2019 and reached €82.3 million, an increase of 1.7% compared to 2019 (€80.9 million). However, as a result of the two equity raises carried out in april 2019 and october 2019, the weighted average number of shares in 2020 increased to 221.1 million shares versus 182.1 million shares in 2019 and consequently epra earnings per share decreased in 2020 to 37 cents per share from 44 cents per share in 2019.
Balance Sheetthe open market value of the portfolio decreased by a modest €12.2 million, a decrease of 0.4%, to €3.03 billion (31 december 2019: €3.04 billion). this comprises €2.98 billion of investment property - freehold and a further €0.05 billion representing the 100% value of our Jv investment properties.
evolution in Portfolio value (€ million by location)
0
400
800
1,200
1,600
2,000
2,400
2,800
3,200
3,600
InvestmentProperty- Dec 19
€ m
illio
n
JV and others- Dec 19
OMV Dec 19
CAPEX Fair valueloss
Disposals JV's CAPEX & Uplift
OMV Dec 20
JV and others InvestmentProperty- Dec 20
1,369.5
1,647.4
28.2
1,397.7
1,647.4
33.1
49.5
(28.6)
(86.8)
(2.4) 23.0
1,422.8
1,610.1
1,371.6
1,610.1
(51.2)
3,016.9 3,045.13,032.9 2,981.7
total assets at 31 december 2020 reached €3.63 billion, increased by 4.3% from 31 december 2019 (€3.48 billion). epra nav (same as the new epra nrv metric) decreased to €1.92 billion at 31 december 2020, a decrease of 7.2% on 31 december 2019 (€2.07 billion), while epra nav per share decreased by 6.7% to €8.68 per share (31 december 2019: €9.30 per share). reflecting the dividend distributions made during 2020 of €0.49 per share, the adjusted epra nav per share at 31 december 2020 would be €9.17 per share, representing a negative total accounting return of nav for 2020 of 1.4% (2019: a positive return of 9.2%). in addition and in accordance with the october 2019 epra Best practices recommendations guidelines, we present on page 176 the three new nav metrics (epra nrv, epra nta, and epra nda).
FiNANCiAL review continued
Poland
romania
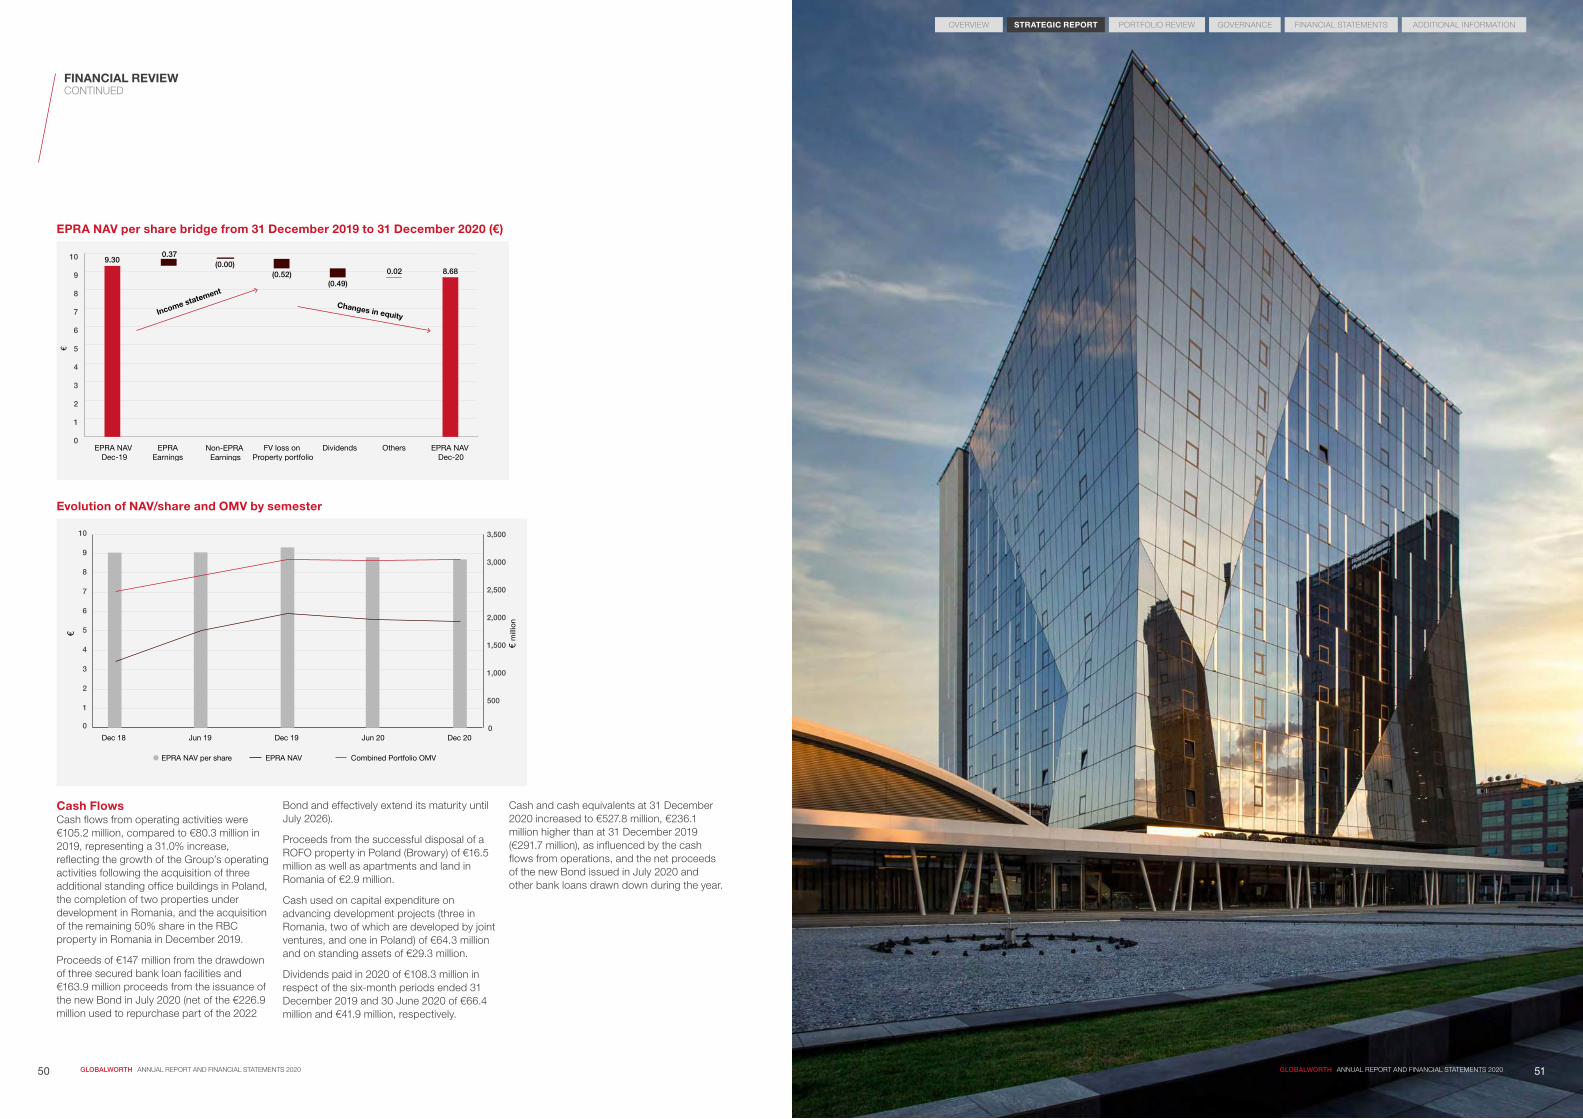
51Globalworth annual report and financial statements 2020
overview STrATeGiC rePOrT portfolio review governance financial statements additional information
50 Globalworth annual report and financial statements 2020
ePrA NAv per share bridge from 31 December 2019 to 31 December 2020 (€)
0
1
2
3
4
5
6
7
8
9
10
€
EPRA NAV Dec-19
EPRA NAV Dec-20
EPRA Earnings
FV loss on Property portfolio
Non-EPRA Earnings
OthersDividends
9.300.37
(0.00)(0.52)
(0.49)
0.02 8.68
Income statement
Changes in equity
evolution of NAv/share and OMv by semester
0
1
2
3
4
5
6
7
8
9
10
0
500
1,000
1,500
2,000
2,500
3,000
3,500
Dec 18 Jun 19 Dec 19 Jun 20 Dec 20
EPRA NAV per share EPRA NAV Combined Portfolio OMV
€ m
illio
n
€FiNANCiAL review continued
Cash Flowscash flows from operating activities were €105.2 million, compared to €80.3 million in 2019, representing a 31.0% increase, reflecting the growth of the group’s operating activities following the acquisition of three additional standing office buildings in poland, the completion of two properties under development in romania, and the acquisition of the remaining 50% share in the rBc property in romania in december 2019.
proceeds of €147 million from the drawdown of three secured bank loan facilities and €163.9 million proceeds from the issuance of the new Bond in July 2020 (net of the €226.9 million used to repurchase part of the 2022
Bond and effectively extend its maturity until July 2026).
proceeds from the successful disposal of a rofo property in poland (Browary) of €16.5 million as well as apartments and land in romania of €2.9 million.
cash used on capital expenditure on advancing development projects (three in romania, two of which are developed by joint ventures, and one in poland) of €64.3 million and on standing assets of €29.3 million.
dividends paid in 2020 of €108.3 million in respect of the six-month periods ended 31 december 2019 and 30 June 2020 of €66.4 million and €41.9 million, respectively.
cash and cash equivalents at 31 december 2020 increased to €527.8 million, €236.1 million higher than at 31 december 2019 (€291.7 million), as influenced by the cash flows from operations, and the net proceeds of the new Bond issued in July 2020 and other bank loans drawn down during the year.

5352 Globalworth annual report and financial statements 2020Globalworth annual report and financial statements 2020
overview STrATeGiC rePOrT portfolio review governance financial statements additional information
the evolution of the weighted average interest rate during the year is due to the drawing down and subsequent repayment of the rcf facility, which bears a lower than the weighted average interest rate.
Servicing of Debt During 2020during 2020, we refinanced €226.9 million (part of the notes due in June 2022) and repaid c.€203.3 million of debt capital (including the €200 million outstanding balance of the rcf). in addition c.€41.0 million was used to pay accrued interest on the group’s drawn debt facilities, including c.€33.0 million in relation to the coupon for the eurobonds of the company.
Liquidity & Loan to value ratioalthough as a result of the covid-19 pandemic the group temporarily suspended significant new investments, its aim is to maintain at all times sufficient liquidity in order to have the flexibility to react quickly at the moment when attractive new investment opportunities may arise.
as at 31 december 2020, the group had cash and cash equivalents of €527.8 million (31 december 2019: €291.7 million) out of which an amount of c.€9.8 million was restricted due to various conditions imposed by the financing Banks. on top of this, the group had available liquidity from committed undrawn loan facilities amounting to €215 million.
the group’s loan to value ratio at 31 december 2020 was 37.8%, compared to (34.7%) at 31 december 2019. this is consistent with the group’s strategy to manage its long-term target ltv of below 40%, whilst pursuing its strong growth profile.
Debt Structure as at 31 December 2020
Debt Structure — Secured vs. Unsecured Debtthe majority of the group’s debt at 31 december 2020 is unsecured: 77.7% (31 december 2019: 83.3%), with the remainder secured with real estate mortgages, pledges on shares, receivables and loan subordination agreements in favour of the financing parties.
the slight decrease in the percentage of the unsecured debt compared to 31 december 2019 is connected with the secured bank loans entered by the group in romania and poland due to the advantageous cost conditions obtained, hence the decrease in the weighted average interest rate.
Loans and Borrowings Maturity and Short-Term / Long-Term Debt Structure Mixthe group has at 31 december 2020 credit facilities and eurobonds with different maturities, all on medium and long-term, same as at 31 december 2019, as presented in the chart below.
Maturity by Year of the Principal Balance Outstanding at 31 December 2020 (€ Million)
2021 20262022 2023 2024 2025 20292027 2028
0
100
200
300
400
500
600
700
€ m
illion
Debt Denomination Currency and interest rate riskour loan facilities are entirely euro denominated and bear interest based either on one month’s or three months’ euribor plus a margin (8.7% of the outstanding balance compared to 9.5% at 31 december 2019), or at a fixed interest rate (91.3% of the outstanding balance compared to 90.5% at 31 december 2019).
the high degree of fixed interest rate debt ensures a natural hedging to the euro, the currency in which the most significant part of our liquid assets (cash and cash equivalents and rental receivables) is originally denominated and the reporting currency for the fair market value of our investment property.
Debt Covenantsthe group’s financial indebtedness is arranged with standard terms and financial covenants, the most notable as at 31 december 2020 being the following:
Unsecured eurobonds and revolving Credit Facility • the consolidated coverage ratio, with minimum value of 200%;• the consolidated leverage ratio, with maximum value of 60%; • the consolidated secured leverage ratio with a maximum value of 30%; and• the total unencumbered assets ratio, with minimum value of 125%.
Secured Bank Loans• the debt service cover ratio (“dscr”) / interest cover ratio (“icr”), with values ranging from
120% to 350% (be it either historic or projected); and• the ltv ratio, with contractual values ranging from 60% to 83%.
there have been no breaches of the aforementioned covenants occurring during the period ended 31 december 2020.
further details on the group’s debt financing facilities are provided in note 14 of the audited consolidated financial statements.
FiNANCiNG AND LiQUiDiTY review
in the context of the covid-19 pandemic, the group’s main focus during 2020 was to preserve the cash liquidity, to effectively extend the maturity of part of its Bond maturing in June 2022, and to protect its revenues and cash flows in order to mitigate the economic impact over its businesses.
the group had in 2020 an active year in the capital markets, conducting various debt financing activities, that helped preserve the cash position and minimise the negative impact of the covid-19 pandemic over its operations.
in march 2020, the group fully drew down the €200 million unsecured revolving credit facility (“rcf”) in order to increase its short term liquidity. further to this, in July 2020 exercised its option to increase the commitment and obtained from the syndicate of Banks an increase in the facility to €215 million.
in July 2020 the group successfully completed under its €1.5 billion euro medium term notes programme the issuance of the €400 million new notes due in 2026 at a competitive coupon rate. out of this amount, approximately €226.9 million was used in the tender for the repurchase of part of the €550 million notes due in June 2022 and the group collected net proceeds of €158.7 million. following the successful new Bond issuance,
the €200 million outstanding balance on the rcf was repaid in full and the €215 million facility remains available for utilisation until the end of march 2024, with maturity at the end of april 2024.
the most significant events during 2020 as regards to the secured bank loans financing are outlined below:
in romania:• in June 2020, the €15 million outstanding
balance on the bank loan secured on the unicredit HQ property was extended until may 2025;
• in april 2020, the contracted amount of the 10 year bank loan secured on globalworth tower was increased to €85 million under the same terms and conditions; the increase of €20 million was drawn down in June 2020; and
• in december 2020, a 50% owned subsidiary of the group signed an €8 million secured financing agreement for the refinancing of the chitila logistics Hub project, out of which the amount of €7 million was drawn down before 31 december 2020 and the remainder of €1 million will be drawn down during 2021.
in Poland:• in January 2020, the €65 million 10-year
bank loan secured on warsaw trade tower was drawn down; and
• in february 2020, the €62 million 7-year bank loan secured on retro House and silesia star properties was drawn down.
Dividendsin february 2020 the company paid an interim dividend of €0.30 per share (c.€66.57 million) in respect of the six-month period ended 31 december 2019, while in october 2020 paid an interim dividend of €0.19 per share (c.€41.95 million) in respect of the six-month period ended 30 June 2020. further to this another interim dividend of €0.15 per share (c.€33.1 million) was paid in march 2021 in respect of the six-month period ended 31 december 2020.
Debt Summarythe total debt portfolio of the group at 31 december 2020 of €1.63 billion (31 december 2019: €1.32 billion) comprises medium to long-term debt, denominated entirely in euro.
the group has extended in 2020 its strategy over the last few years of reducing the applicable weighted average interest rate. the weighted average interest rate decreased from 2.83% at 31 december 2019 to 2.73% at 31 december 2020, while the average period to maturity of 4.5 years increased from 4.3 years at 31 december 2019, as presented in the chart below:
FINANCING ACTIVITY IN 2020
2.30%
2.40%
2.50%
2.60%
2.70%
2.80%
2.90%
3.00%
Inte
rest
rat
e
Year
s
30 Jun18 31 Dec 18 30 Jun 19 31 Dec 19 30 Jun 20 31 Dec 20
0
1
2
3
4
5
6
weighted average interest rate versus debt duration to maturity
weighted average duration to maturity
weighted average interest rate
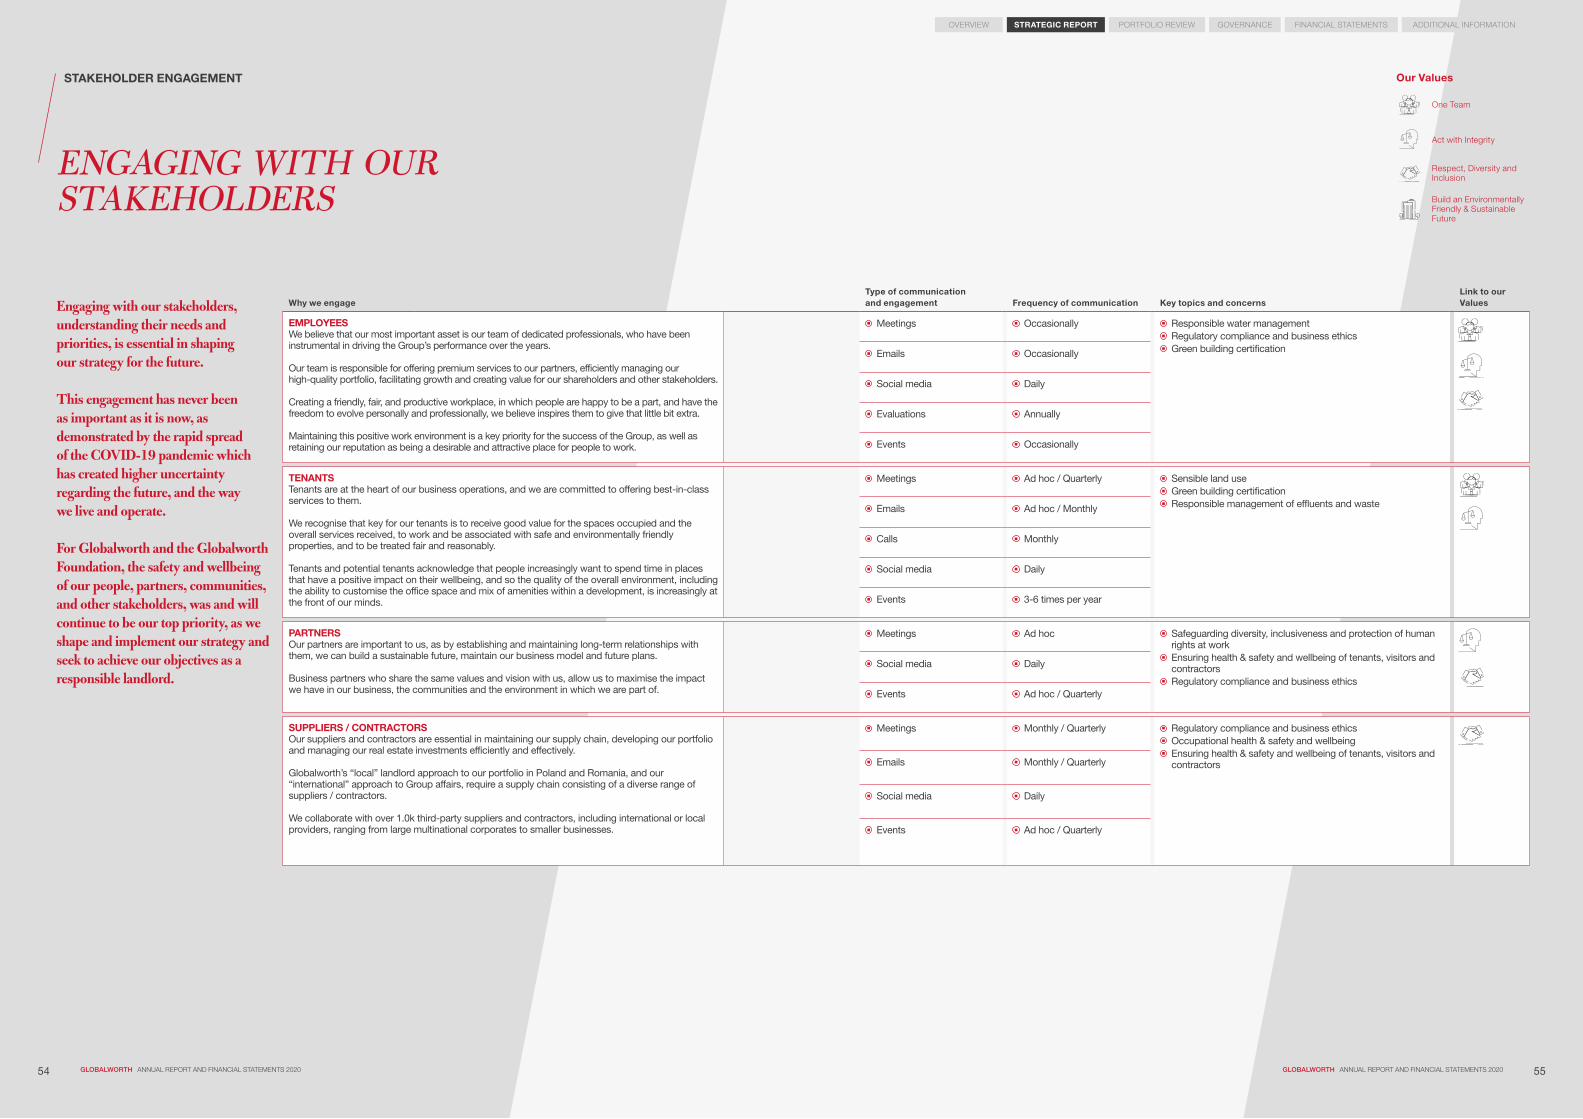
5554 Globalworth annual report and financial statements 2020Globalworth annual report and financial statements 2020
overview STrATeGiC rePOrT portfolio review governance financial statements additional information
why we engageType of communication and engagement Frequency of communication Key topics and concerns
Link to our values
eMPLOYeeSWe believe that our most important asset is our team of dedicated professionals, who have been instrumental in driving the Group’s performance over the years.
Our team is responsible for offering premium services to our partners, efficiently managing our high-quality portfolio, facilitating growth and creating value for our shareholders and other stakeholders.
Creating a friendly, fair, and productive workplace, in which people are happy to be a part, and have the freedom to evolve personally and professionally, we believe inspires them to give that little bit extra.
Maintaining this positive work environment is a key priority for the success of the Group, as well as retaining our reputation as being a desirable and attractive place for people to work.
Meetings Occasionally Responsible water management Regulatory compliance and business ethics Green building certification Emails Occasionally
Social media Daily
Evaluations Annually
Events Occasionally
TeNANTSTenants are at the heart of our business operations, and we are committed to offering best-in-class services to them.
We recognise that key for our tenants is to receive good value for the spaces occupied and the overall services received, to work and be associated with safe and environmentally friendly properties, and to be treated fair and reasonably.
Tenants and potential tenants acknowledge that people increasingly want to spend time in places that have a positive impact on their wellbeing, and so the quality of the overall environment, including the ability to customise the office space and mix of amenities within a development, is increasingly at the front of our minds.
Meetings Ad hoc / Quarterly Sensible land use Green building certification Responsible management of effluents and waste
Emails Ad hoc / Monthly
Calls Monthly
Social media Daily
Events 3-6 times per year
PArTNerSOur partners are important to us, as by establishing and maintaining long-term relationships with them, we can build a sustainable future, maintain our business model and future plans.
Business partners who share the same values and vision with us, allow us to maximise the impact we have in our business, the communities and the environment in which we are part of.
Meetings Ad hoc Safeguarding diversity, inclusiveness and protection of human rights at work
Ensuring health & safety and wellbeing of tenants, visitors and contractors
Regulatory compliance and business ethics
Social media Daily
Events Ad hoc / Quarterly
SUPPLierS / CONTrACTOrSOur suppliers and contractors are essential in maintaining our supply chain, developing our portfolio and managing our real estate investments efficiently and effectively.
Globalworth’s “local” landlord approach to our portfolio in Poland and Romania, and our “international” approach to Group affairs, require a supply chain consisting of a diverse range of suppliers / contractors.
We collaborate with over 1.0k third-party suppliers and contractors, including international or local providers, ranging from large multinational corporates to smaller businesses.
Meetings Monthly / Quarterly Regulatory compliance and business ethics Occupational health & safety and wellbeing Ensuring health & safety and wellbeing of tenants, visitors and contractors
Emails Monthly / Quarterly
Social media Daily
Events Ad hoc / Quarterly
Engaging with our stakeholders, understanding their needs and priorities, is essential in shaping our strategy for the future.
This engagement has never been as important as it is now, as demonstrated by the rapid spread of the COVID-19 pandemic which has created higher uncertainty regarding the future, and the way we live and operate.
For Globalworth and the Globalworth Foundation, the safety and wellbeing of our people, partners, communities, and other stakeholders, was and will continue to be our top priority, as we shape and implement our strategy and seek to achieve our objectives as a responsible landlord.
STAKeHOLDer eNGAGeMeNT
ENGAGING WITH OUR STAKEHOLDERS
one team
act with integrity
respect, diversity and inclusion
Build an environmentally friendly & sustainable future
Our values

renault Bucharest Connected
5756 Globalworth annual report and financial statements 2020Globalworth annual report and financial statements 2020
overview STrATeGiC rePOrT portfolio review governance financial statements additional information
why we engageType of communication and engagement Frequency of communication Key topics and concerns
Link to our values
SHAreHOLDerS & BONDHOLDerS The support and alignment of interest with our shareholders, bondholders and other providers of finance is key for the success of our business.
We engage with them regularly directly – meetings (face-to-face and/or via calls), investor conferences etc – and indirectly – through our financial reporting cycle, sustainability updates, regulatory and other updates – during the year to ensure that they are properly informed of our progress, as we firmly believe that through proper engagement and transparency we can receive the greatest level of support from them.
Meetings Ad hoc (multiple interactions per year)
Energy efficiency and climate change management Green building certification Regulatory compliance and business ethics
Calls
Emails
Roadshows
Participations in conferences and industry events
Corporate publications
Website, social media Daily
Shareholders Meetings (AGM / EGM)
Annually / Ad hoc
LOCAL COMMUNiTieSOur leading position in CEE’s real estate market, with over 1.2m sqm of high-quality space on offer, where more than 250k people work or visit on a daily basis (under normal conditions), makes us view our role increasingly important towards them, and the wider community of which we consider ourselves to be an integral part, as increasingly important.
Through the Globalworth Foundation and the wider Globalworth team, we are committed to making a positive contribution to the communities within which we operate.
Our ongoing dialogue with our communities, allows us to be able to identify the areas where we can have the highest impact and adapt our strategy accordingly.
We seek to have an effect on our communities by maintaining the highest levels of ethical standards and conducting our business in a responsible and sustainable way, committed to our three pillars of “People, Places and Technology”.
Meetings / calls / emails Daily Enhancing social integration and accessibility Engaging and investing in local communities Responsible supply chain
Online (corporate website, social media)
Daily
Press releases, interviews pitching, Q&A
Weekly
Events (corporate, consumer and internal), owned and sponsorships
Ad hoc (10-12 times per year)
Media buying, sponsorships, newsletters
Ad hoc (multiple interactions per year
STATe AND LOCAL AUTHOriTieSWe are members of a number of key industry initiatives, and through our participation and interaction in such task groups with leading professionals, developers, consultants, engineers and manufacturers, we gain practical insights into innovative solutions for effective property management and access to information on upcoming legislation and the process of EU law transposition as it is implemented or comes into force by region.
We believe that through an open and transparent dialogue with the regulatory and industry bodies in the countries in which we operate, we will improve public trust in the real estate sector through raising industry standards, and creating a sustainable environment for visitors, occupiers, landlords, investors and other stakeholders is fundamental to our business.
Meetings Ad hoc Occupational health and safety and wellbeing Enhancing social integration and accessibility Ensuring health & safety and wellbeing of tenants, visitors and contractors
Social media Ad hoc
STAKeHOLDer eNGAGeMeNT continued
one team
act with integrity
respect, diversity and inclusion
Build an environmentally friendly & sustainable future
Our values

59Globalworth annual report and financial statements 2020
overview STrATeGiC rePOrT portfolio review governance financial statements additional information
58 Globalworth annual report and financial statements 2020
viABiLiTY STATeMeNT
In accordance with provision 31 of the 2018 UK Corporate Governance Code, the Board has considered the Company’s viability over the next three years.
as a result of the long-term nature of the group’s commitments from its tenants for its properties in romania, as well as the long-term nature of the group’s properties, the Board is confident over the long-term viability of the group’s business; however, it is difficult to assess the long-terms trends in the real estate market in romania and poland, the long-term availability of funds in the european and global capital markets, and the european central bank’s long-term policies over the provision of liquidity to banks operating in the eurozone, the largest of which have subsidiaries in romania and poland. in addition, it is difficult to assess the regulatory, tax and political environment in which the group operates on a basis longer than a three-year period. therefore, the Board considered that a three-year period is an appropriate period to perform its viability analysis, as also supported by the following factors:
• three years is the period over which the group performs its cash flow projections and business plans due to the group’s dynamic growth plan;
• three years is the average period over which the group carries out its major development projects, starting from the date of purchase of land to the completion of the properties; and
• three years is considered as the optimum balance between the necessity to plan for the short to medium term and the requirement to maintain high levels of accuracy in the underlying projections.
in 2020, the viability assessment process comprised the following key steps:
1. a review and assessment by the risk committee of the principal risks facing the company. an outline of the identified principal risks, including changes in the assessed risk level from the prior year, is presented on pages 99-102.
2. identification of those principal risks that are more likely to have a potential impact on the company’s viability over the next three-year period, namely: – counterparty credit risk;
– valuation of portfolio;
– inability to lease space;
– changes in interest rates;
– lack of available financing; and
– breach of loan covenants.
3. analysis of the potential quantitative impact of the principal risks identified under step 2 above, should these occur in isolation or under certain possible combinations. it should be emphasised that, based on the assessment performed, a number of the above mentioned risks may have direct and indirect impact on the group’s property portfolio values and/or nav, but have been assessed as having very low probability of affecting the group’s viability over the next three years.
4. assessment of the possible, available strategies to minimise the potential impact of these principal risks over the next three years. such mitigation strategies include the possibility to raise additional equity capital, or refinance/ reschedule existing debt facilities, or to dispose of properties.
5. following the completion of the viability assessment, this has been presented and approved by the Board.
Based on the assessment performed, the Board concluded that it has a reasonable expectation that the company will be able to continue in operation and meet all its liabilities as they fall due up to march 2024.

Green certified properties
48Green certifited GAV
€2.3bn
BREEAM accredited properties (by value)
77.9%
Globalworth Foundation contribution to social initiatives
€1.6m
Social initiatives supported
27EPRA sBPR Awards 2020
2 awards
Green Accreditations – Standing commercial Portfolio
BREEAM Outstanding
BREEAM Excellent
BREEAM Very Good
LEED Platinum
LEED Gold
EDGE
% No. of Properties
% of Standing GAV
1.6%
28.1%
29.7%
1.6%
9.4%3.1%
1.8%
35.1%
23.5%
6.6%
10.2%3.0%
Stamatis SapkasDeputy Chief Investment Officer
6160 Globalworth annual report and financial statements 2020Globalworth annual report and financial statements 2020
overview StRAtEGic REPoRt portfolio review Governance financial statements additional information
SUStAiNABLE DEVELoPMENt UPDAtE
COMMITTED TO CREATING A SUSTAINABLE FUTURE
Green Accreditations – Standing commercial Portfolio% no. of properties % of standing Gav
3.1% Breeam outstanding 3.0%28.1% Breeam excellent 35.1%29.7% Breeam very Good 23.5%1.6% leed platinum 6.6%9.4% leed Gold 10.2%1.6% edGe 1.8%
tryton Business House
A4 Business Park
in addition, we are aiming for 100% of our portfolio to be green accredited and are currently in the process of certifying or recertifying 17 other properties in our portfolio, principally targeting Breeam certifications.
in our efforts to demonstrate further our commitment to sustainable development and access to Green financing (additional information under the “capital markets review” section of the report), we issued our Green Bond framework (“GBf”) for which we received a second party confirmation from sustainalytics, one of the leading providers for external reviews in the green bond market.
sustainalytics, following their review, confirmed that our Green Bond framework aligns with the four core components – use of proceeds, project evaluation / selection, management of proceeds, and reporting – of the Green Bond principles 2018. additionally, sustainalytics considered that the projects to be funded by the green bond proceeds will provide a positive environmental impact by improving the energy efficiency of the building portfolio owned and operated by Globalworth. finally, sustainalytics considered that Globalworth’s sustainable development strategy demonstrates a strong commitment to sustainability, with a focus on three key environmental principles:
• integrate efficient and sustainable operating policies, procedures and actions;
• be accountable as a team of professionals for environmental stewardship; and
• work with its shareholders and other stakeholders to make environmentally responsible decisions.
Social initiativesGlobalworth and Globalworth foundation remained committed to supporting our communities of which we are an integral part of, and intensified its efforts in this challenging environment, by supporting 27 initiatives and causes with over €2.0 million in 2020.
capital resources were raised through contributions made by the Globalworth Group, and for the first time through a free digital platform which simplifies the process of collecting tax deductible amounts in romania.
the foundation has, since march focused its efforts primarily in the fight against the covid-19 in romania and poland, where together with the Globalworth team, it supported directly and/or indirectly several initiatives to minimise the impact of the pandemic.
overall, our programme included:
• fight against covid-19 initiatives: supported hospitals, doctors, the red cross and related staff in the fight against covid-19 in poland and romania, allocating over €650k in 2020.
• educational initiatives: supported several education programmes, such as the “center of change in the community” developed in partnership with the united way foundation and the Hi-tech learning center in Bucharest. in addition, we established a new partnership with endeavor, a mission-driven global organisation that supports and accelerates high-impact entrepreneurs.
• social welfare: continued supporting initiatives concerning human welfare and the quality of life, as we are active advocates for improving access to quality medical services for those who need it the most, creating better conditions for the doctors and others who take care of those patients.
in poland, the warsaw trade tower and the retro office House in wroclaw were awarded with Breeam excellent accreditations, and the office buildings from our Hala Koszyki mixed-use property in warsaw were certified with Breeam very Good.
in addition, we completed the certification of our landmark tci office in Bucharest and of an industrial facility in timisoara both receiving Breeam very Good certifications.
overall, as at 31 december 2020 our combined standing portfolio comprised 47 green certified properties, accounting for
The focus of our Sustainability programme in 2020, was in investing and creating high-quality sustainable and environmentally friendly real estate spaces, and supporting our communities and stakeholders in the fight against COVID-19.
our Green Progress in 2020consistent with our commitment to energy- efficient properties, we added 10 properties with Breeam very Good or higher certifications to our portfolio.
the most notable additions were the 2020 delivered podium park ii (Krakow) and Globalworth campus tower 3 (Bucharest) which were certified Breeam outstanding and Breeam excellent respectively. podium park ii is the second property in our portfolio receiving the highest accreditation awarded by Breeam, while tower 3 of the Globalworth campus project received the highest excellent rating among our properties.
81.8% of our standing commercial portfolio by value. Breeam accredited properties account for 76.9% of our green certified standing portfolio by value, with the remainder of properties being of other certification (leed Gold or platinum, edge).
in addition, renoma which is currently under refurbishment / repositioning has maintained it Breeam excellent green accreditation, as the works performed are in accordance with a strict set of guidelines which do not impact its green certification status.

Gender Diversity
Female
Male
46%
54%
226
6362 Globalworth annual report and financial statements 2020Globalworth annual report and financial statements 2020
overview STrATeGiC rePOrT portfolio review governance financial statements additional information
People
Places Technology
in total at the end of 2020, our team comprised over 220 professionals, with c.130 and 85 members in our two main offices in warsaw and Bucharest, with the remainder being based in secondary cities in poland and romania, as well as in cyprus and the uK.
the group maintains a policy of employing the best available candidates for every position, regardless of gender, ethnic group or background. However, we actively try to maintain a balance between male and female professionals.
Our Communitieswe view our role as increasingly responsible towards the people that work at and visit our properties, as well as towards the wider community of which we consider ourselves to be an integral part.
we own over 1.2m sqm of high-quality real estate space in poland and romania, where more than 200k people work or visit daily under “normal” conditions. However, the covid-19 global pandemic outbreak in march 2020 has disrupted the way we live and operate.
Health and safety has been of increased focus, with additional measures implemented in our properties, and working together with our tenants, other partners and stakeholders we feel that we have been addressing this new challenge in an effective and efficient way.
furthermore, adapting to the current environment, (almost) all physical events planned at our properties, including globalworth district events, were cancelled.
However, we maintained our engagement with our communities online, increasing awareness, and implementing initiatives such as the “i miss my office” campaign which allowed our tenants in poland and romania to interact with us and each other over social media and radio.
in addition, we are pleased to partner with endeavor, a mission-driven global organisation that supports and accelerates high-impact entrepreneurs, through which we look to encourage entrepreneurship, which we consider a key factor for economic development which in turn leads to a sustainable and competitive entrepreneurship ecosystem.
investing and creating high-quality sustainable and environmentally friendly real estate spaces, in which people and business can flourish, is a priority for globalworth.
we principally target properties which have Breeam very good, leed gold or higher green certification or with the potential to achieve this, and at year-end 2020 we had 48 green certified properties in our portfolio with an appraised value of €2.4 billion.
we consider investment in energy-efficient properties important as it provides both a business advantage and positively impacts our communities, our shareholders, and other stakeholders.
– Local communities benefit from reduced carbon emissions generated by the properties.
– Tenants benefit from lower energy costs, positively impacting their profitability.
– employees benefit from improved working conditions due to temperature control and better flow and quality of air (which can also lead to improved productivity).
– Partners benefit by assisting us to develop, maintain and operate a green portfolio according to the respective specifications of each property.
– investors benefit through the creation of long-term sustainable value in the portfolio.
we are firm believers that technology has a positive impact on real estate, both for tenants and investors. as such, we invest directly or indirectly in selected opportunities and initiatives, including technology-related venture capital funds.
globalworth is currently participating in two venture capital funds, and we are also exploring the potential to make additional technology-related investments in the future.
– in 2018 we made a €2.0 million commitment to early games venture, a venture capital fund, focused on innovative companies in romania, co-funded by the european regional development fund and funded through the competitiveness operational programme (2014-2020).
– in 2019 we committed €2.4 million to gapminder venture partners, the vc fund investing in it software and services start-ups in romania and central eastern europe and in disruptive projects with regional, european and global ambitions.
in addition, in 2020 we continued with implementation of initiatives, such as:
– the ice storage system and geothermal energy systems in our globalworth square development which targets lower energy/occupational costs and efficiencies in the property.
– the Property App, which is focused on providing smart touchless solutions in the property, with emphasis on comfort, safer operation and efficiency, whilst preserving the same mandatory security standards. additional features to be developed will allow a more interactive engagement and operation between the people working in or visiting our buildings (currently in development stage).
– finally, we are particularly proud of our contribution through the globalworth foundation and in collaboration with the university of architecture and urbanism in Bucharest to a new Hi-Tech Learning Center. the centre will benefit over 3.5k future architects annually, as it will provide a mix of technologies such as a modular space equipped with a complete vr solution, allowing the building and communication of their creative ideas.
People
Places Technology
OUr FOCUS AreAS
Understanding Our impactas part of our sustainable development strategy, we focus on topics that substantively influence the judgement and decisions of our stakeholders, and those that are directly related to our significant economic, social and environmental impacts.
in accordance with the specifications of the gri standards on sustainability reporting, in 2019, together with our stakeholders we performed a detailed analysis on the materiality of these topics.
amid the covid-19 pandemic, we are in the process of reaffirming our findings, with more information to be provided in our 2020 sustainable development update, as we continue to focus on people, places and technology.
Group: Green GAv (€ m)
202020192018
7
1,632.2
2,262.02,349.7
SUSTAiNABLe DeveLOPMeNT UPDATe continued
Our Team our most important asset is our team of dedicated professionals, who have been instrumental in driving the group’s performance since inception. this team is responsible for offering premium services to our partners, efficiently managing our high-quality portfolio, facilitating growth and creating value for our shareholders and stakeholders.
the team, as part of our objective to meet the very highest standards, receives regular in-house and/or third-party led training programmes, designed to improve our skill set, knowledge, operational experience and interaction with our stakeholders.

Georgiana IliescuExecutive Director, Globalworth Foundation
65Globalworth annual report and financial statements 2020
overview StrateGIc report portfolio review Governance financial statements additional information
64 Globalworth annual report and financial statements 2020
We are grateful that we, at the Globalworth Foundation have continued: to get involved, to mobilise resources, to bring good people together, to respond to the needs of the most vulnerable members of the community.
throughout the year, we have helped provide critical care where it was needed as the pandemic unfolded, working closely with local organisations, local hospitals, and health workers to provide appropriate responses to the pandemic. nevertheless, we stayed focused on our mission to ensure access to digital education and health to disadvantaged communities from romania and poland.
3. Supporting Food Bank SoS in polandthe Globalworth foundation has donated €15k to the “donate food for the true spirit of christmas” campaign in partnership with food Bank sos in warsaw, poland.
4. Developing paediatric cardiovascular surgery centres in romaniathrough our investment of €300k over the next three years, the Globalworth foundation has funded medical missions allowing specialist international doctors to travel to romania to operate on children with heart malformations. over 1,100 children have received operations thanks to our project.
5. Globalworth colleagues have donated meals to polish hospitalsthis action ensured 3,860 meals, as part of the #property4heroes initiative.
6. 450 christmas wishes have been fulfilled by Globalworth colleaguesdue to the pandemic, the Globalworth christmas charity days has been transformed this year into a mobile caravan. this year the Globalworth foundation reached the homes of 450 children from 7 disadvantaged communities.
We would like to shine a special light on all the Globalworth employees who have becomes donors for the Globalworth Foundation’s projects.
Let’s continue to do good!Together!
10 hospitals
supported
the support of the health system was vital, and we focused on purchasing vital items such as medical ventilators for intensive care units, disinfectant bottles, protective suits, safety goggles, single-use sanitary masks and protective gloves.
€650k donated
450 children from 7 communities
3,860 meals donated
1,100 operations
€15k donated
tHe GLoBaLWortH FoUNDatIoN
BRINGING PEOPLE TOGETHER2. Digital education
3. Food donations
4. Medical missions
5. Meals to hospitals
6. christmas charity
1. Hospital donations
1. Hospital donations
Globalworth Foundation
€30k donated1. responding to the ongoingpandemic
in romania and polandunder the motto “everyone should get involved to make things better”, the Globalworth foundation’s philanthropic response to the covid-19 pandemic was nimble: we have acted as quickly as possible during this emergency to try to reduce the impact of covid-19 on our communities in poland and romania. in total, we have allocated €650k.
• Bucharest – dr. carol davila central military
emergency university Hospital
– clinical Hospital colentina
– the national institute for infectious diseases “prof. dr. matei Bals”
– “prof. dr. marius nasta” institute for pneumology
• onesti – municipal Hospital “sfântul ierarh
dr. luca”
– chorzow
– isolation Hospital
• Lodz – isolation Hospital
• Warsaw – wolski Hospital
• Katowice – murcki Hospital
• Kraków – rydygier Hospital2. Building the digital
future of education in romania
the Globalworth foundation donated €30k to the narada association for the first online platform that gathers, in real time, the needs of teachers and children from disadvantaged communities in romania, generated by the pandemic context.

6766 Globalworth annual report and financial statements 2020Globalworth annual report and financial statements 2020
overview strategic report POrTFOLiO review governance financial statements additional information
PORTFOLIO REVIEW
portfolio snapshot 68present in 10 cities 70

GAv
€3.0bnGAv as % of Total
46.9%GAv as % of Total
53.1%
Logistics 10.2% Mixed-Use 16.9%
Mixed-Use 9.0%
Others 9.4%
Logistics 4.8%
Of�ce 80.4% Of�ce 83.1%
Of�ce 81.8%
GAV Split by Asset Usage GAV Split by Asset UsageGAV Split by Asset Usage GAV Split by City GAV Split by CityGAV Split by City
Others 4.4%
Bucharest 88.5% Warsaw 44.2%Bucharest 41.5% Wroclaw 8.2%
Timisoara 5.7% Wroclaw 15.5%Timisoara 2.7% Katowice 5.7%
Pitesti 3.5% Katowice 10.8%Pitesti 1.6% Lodz 2.3%
Constanta 2.3% Lodz 4.3%Constanta 1.1% Krakow 11.5%
Krakow 21.6%Warsaw 23.5% Gdansk 1.9%
Gdansk 3.5%
69Globalworth annual report and financial statements 2020
overview strategic report POrTFOLiO review governance financial statements additional information
68 Globalworth annual report and financial statements 2020
POrTFOLiO review
Our real estate portfolio comprises high-quality properties in prime locations, either stand-alone or clusters, in the markets and sub-markets on which we focus in Poland and Romania. It is spread in across 10 cities, primarily comprises Class “A” offices, and had an overall aggregate value of €3.0 billion as at 31 December 2020.
CoMbINED PortFolIo roMaNIa PolaND
1. standing investments representing income producing properties. one investment can comprise multiple buildings, e.g. green court complex comprises three buildings or one investment.
2. includes all property assets, land and development projects valued at 31 december 2020 but excludes rofo assets in poland.
3. occupancy of standing commercial properties, and in the case of poland, including office rental guarantees.
4. includes pre-let commercial standing and development/redevelopment assets. wall of standing commercial properties in poland, romania and the combined portfolio are 3.5 years, 5.6 years and 4.5 years, respectively.
5. including 32.4k sqm of residential assets in romania.6. total rent comprises commercial (€177.7 million) and residential
(€1.0 million in romania) standing properties and rent from redevelopments and development pre-lets (€4.7 million in poland), and includes contracted rent under a master lease agreement.
PORTFOLIO SNAPSHOT
Standing investments(1): 20
GAv(2) / Standing GAv (€m): €1,610m / €1,497m
Occupancy(3): 89.4%
wALL(4): 3.6 years
Standing GLA (k sqm)(5): 566.2k sqm
Contracted rent (€m)(6): €101.7m
Standing investments(1): 17
GAv(2) / Standing GAv (€m): €1,423m / €1,308m
Occupancy(3): 92.0% (93.5% including tenant options)
wALL(4): 5.6 years
Standing GLA (k sqm)(5): 705.1k sqm
Contracted rent (€m)(6): €81.7m
Standing investments(1): 37
GAv(2) / Standing GAv (€m): €3,033m / €2,805m
Occupancy(3): 90.9% (91.7% including tenant options)
wALL(4): 4.5 years
Standing GLA (k sqm)(5): 1,271.3k sqm
Contracted rent (€m)(6): €183.4m

Of�ce 90.9%
Industrial – 1.1%
Other – 8.0% (incl. land for future development)
Industrial – 100.0% Industrial – 86.0%
Other – 14.0% (incl. land for future development)
Industrial – 35.9%
Other – 64.1% (incl. land for future development)
7170 Globalworth annual report and financial statements 2020Globalworth annual report and financial statements 2020
overview strategic report POrTFOLiO review governance financial statements additional information
POrTFOLiO review continued
We own and manage 43 high-quality real estate investments in Bucharest, Warsaw and eight regional markets/cities in Poland and Romania.
our principal focus is on class “a” environmentally friendly offices, which we either acquired or developed ourselves, offering a diverse mix of high-quality space. these properties accommodate front-office and support operations (mainly Business process outsourcing and shared services centres) in seven cities in poland and romania, accounting for 82.5% (including land to be developed in the future as offices) of our combined portfolio by value.
our presence in offices also extends through our ownership in three, highly recognisable, mixed-use, multifunctional properties in poland, which combine a high-quality retail and leisure experience with class “a” offices.
we also invest in industrial properties – typically logistics and light-industrial – in markets where we identify strong tenant demand. as of year-end 2020, all our industrial investments are in romania, where we either acquired or developed high-quality facilities directly or together with selected partners, increasing our exposure to one of the fastest growing market segments.
in addition, we have partial ownership of a residential complex with a retail component, adjacent and complementary to our office properties in the new cBd of Bucharest.
the majority of our investments are internally managed, and we aim, to the extent possible, to create significant presence in our cities of focus, thus benefitting from operational synergies while de-risking our reliance on any single market and/or sub-market.
Bucharest and warsaw, romania’s and poland’s respective capitals, are the cities where we have our largest concentration, with 27 investments (33 standing properties and 7 properties to be developed in the future) accounting for 65.0% of our combined portfolio value.
Bucharest is the city in which the group started operating in 2013 and the most important real estate market in romania, while warsaw is poland’s, and the cee’s, largest and most mature real estate market.
the remainder of our portfolio spans eight major regional cities across poland and romania, with our largest presence being in Krakow (12 standing properties, 150.1k sqm gla) and wroclaw (3 standing properties, 56.6k sqm gla), accounting for 11.5% and 8.2% respectively of the combined portfolio value.
gav
standing propertiesgla
standing occupancy
standing contracted rent
standing 100% potential rent
future gla
future erv
Timisoara
€80.9m
5
121.3k sqm
100.0% (100.0% incl. tenant options)
€5.5m
€5.5m
185.1k sqm (0k sqm contracted)
€7.6m (€0m contracted)
Pitesti
€49.4m
1
68.4k sqm
100.0% (100.0% incl. tenant options)
€3.4m
€3.4m
Bucharest
€1,259.1m
19
494.7k sqm
87.9% (89.9% incl. tenant options)
€72.2m
€81m
158.1k sqm (0k sqm contracted)
€21.8m (€0m contracted)
Constanta
€33.4m
1
20.6k sqm
69.2% (69.2% incl. tenant options)
€0.6m
€0.9m
540.6k sqm (0k sqm contracted)
€28.2m (€0m contracted)
ROMANIA
KeY
PRESENT IN 10 CITIES
GAv
€1.4bnContracted rent
€81.7m
Constanta Business ParkGlobalworth TowerPitesti industrial ParkTimisoara industrial Park

Of�ce – 100.0% Of�ce – 83.0%
Mixed-Use – 17.0%
Of�ce – 72.2%
Mixed-Use – 27.8%
Of�ce – 58.7%
Mixed-Use – 41.3%
Of�ce – 100.0% Of�ce – 100.0%
7372 Globalworth annual report and financial statements 2020Globalworth annual report and financial statements 2020
overview strategic report POrTFOLiO review governance financial statements additional information
POrTFOLiO review continued gav
standing propertiesgla
standing occupancy
standing contracted rent
standing 100% potential rent
future gla
future erv
KeY
warsaw Trade TowerQuattro Business ParkA4 Business Parkwest GateTryton Business House Green Horizon Office Center
Globalworth first invested in the Polish market at the end of 2017, with the Group now present in six major real estate cities, holding 21 investments, valued at €1.6 billion. POLAND
GAv
€1.6bnContracted rent
€101.7m
Krakow
€348.3m
12
150.1k sqm
85.7% (85.7% incl. tenant options)
€22.7m
€26.3m
17.7k sqm (0k sqm contracted)
€3.1m (€0m contracted)
warsaw
€711.3m
14
210.9k sqm
85.6% (85.6% incl. tenant options)
€42.4m
€49.8m
Katowice
€174.3m
6
87.6k sqm
95.7% (95.7% incl. tenant options)
€13.4m
€14.1m
wroclaw
€249.9m
3
56.6k sqm
97.7% (97.7% incl. tenant options)
€9.4m
€9.7m
40.9k sqm (25.2k sqm contracted)
€7.5m (€4.7m contracted)
Lodz
€69.3m
2
35.5k sqm
92.3% (92.3% incl. tenant options)
€4.9m
€5.4m
Gdansk
€57.0m
1
25.6k sqm
99.6% (99.6% incl. tenant options)
€4.2m
€4.2m

7574
overview strategic report portfolio review GOverNANCe financial statements additional information
7574
overview strategic report portfolio review GOverNANCe financial statements additional information
Globalworth annual report and financial statements 2020Globalworth annual report and financial statements 2020
GOVERNANCE
introduction to governance 76Board of directors 82directors’ report 84report of the audit committee 88report of the risk committee 94report of the nomination committee 103report of the remuneration committee 104

Geoff MillerChair of the Board
We need to recognise the longer-term trends and impacts for our strategy as the economy and the real estate market adapt to the new norms which will be established as a result of the pandemic.
GOverNANCe HiGHLiGHTS — priorities for the year were the oversight over Board changes and containing and mitigating its adverse effects of the covid-19 pandemic.
7776 Globalworth annual report and financial statements 2020Globalworth annual report and financial statements 2020
overview strategic report portfolio review GOverNANCe financial statements additional information
CHAIRMAN’S CORPORATE GOVERNANCE STATEMENT
iNTrODUCTiON TO GOverNANCe
DEAR SHAREHOLDER
on 16 march 2020, globalworth issued an rns announcement which referred to the two events that have dominated the Board’s discussions and governance priorities during 2020. one was the transition in the executive leadership of the company with ioannis papalekas, globalworth’s founder, stepping down from the Board but remaining as ceo for an interim period during which he worked with dimitris raptis to hand over the ceo’s responsibilities. this process completed in december. the other event was the company’s ongoing response to the covid-19 pandemic.
COviD-19following the outbreak of covid-19, we stated that the entire globalworth team was entirely focused on containing and mitigating its adverse effects. as a Board, our priority was to support the executive team in their efforts to ensure the safety and wellbeing of our people, clients and communities whilst making the right decisions to safeguard cash flow and protect income and assets.
it is fair to say that covid-19 has had a bearing on nearly every major decision that we have made during 2020. in the early stages of the pandemic, we had more interaction with the executive team than we would normally have, although we were conscious of the need not to burden the executive team with too much Board reporting when they had so many pressing priorities. of critical importance was the need to conserve cash to underpin globalworth’s financial resilience. we therefore reviewed plans prepared by management to save costs and we pared back our development programme to prioritise the completion of existing projects. our plans to restructure our long-term debt were slightly delayed by the pandemic but were successfully implemented in July. we also engaged with our larger shareholders to confirm how our dividend policy – enshrined in the company’s constitutional documents – could be applied in a way that would best support prudent cash management during the pandemic.
as 2020 progressed, the level of interaction between the Board and management team reverted to more usual levels of engagement. it is a continuing source of frustration that the pandemic has prevented the Board members from meeting with the management team and visiting globalworth’s assets in person. we hope that this will become possible again before too long.
whilst the day-to-day challenges of covid have receded in urgency, we need to recognise the longer-term trends and impacts for our strategy as the economy and the real estate market adapt to the new norms which will be established as a result of the pandemic. this will be an important area of focus for the Board in 2021.
Board Changesthere have been a number of changes to the composition of the Board in the early part of 2020. a number of these changes, including the resignation of ioannis papelekas, were the result of the sale of shares held by Zakiono enterprises limited to cpi property group sa. further detail about these Board changes are set out in the nominations committee report, however, it was critical that the transition of the role of ceo from ioannis to dimitris raptis went smoothly, particularly given the challenges presented by the pandemic. we are grateful to both ioannis and dimitris for making a success of this transition.
as a result of the changes to the non-executive membership of the Board, we have made a number of changes to our Board committee structure during 2020. notwithstanding those changes, we were able to maintain continuity in the work of the committees, especially the audit and risk committees which continue to benefit from the enhanced focus in their respective areas of responsibility which came about from splitting them into separate committees in late 2018.
Stakeholders, Sustainability and Climate Changeearly in the year, we published our second reporting update of our sustainability initiatives and performance. this report sets out details of our programmes for promoting stakeholder engagement and sustainable business. as a Board, we continue to value the sustainability of our business and its long-term impacts on society and the environment. in particular, we recognise that the buildings that we develop and own have an impact on climate and the environment, and our priority is to harness the technological solutions that are available to us to make our buildings as energy efficient as possible.
there is no doubt that 2020 was a year of unprecedented challenges for globalworth as it was for nearly all businesses as a result of the pandemic. the significant change in executive leadership as a result of ioannis moving on from the company provided a more unique challenge for us as a Board. i believe that we have navigated both those challenges as well as we possibly could. we know that there are new challenges awaiting us in 2021 but i am confident that we have the right Board in place to embrace those challenges and take the company in a firm and positive direction.
Geoff MillerChair25 march 2021

Green Horizon
7978 Globalworth annual report and financial statements 2020Globalworth annual report and financial statements 2020
overview strategic report portfolio review GOverNANCe financial statements additional information
CORPORATE GOVERNANCEPRINCIPLES
iNTrODUCTiON TO GOverNANCe continued
The Company has complied voluntarily with the main principles of good governance set out in the UK Corporate Governance Code (the UK Code) issued by the Financial Reporting Council in July 2018. The Board believes that the Company has complied throughout the year ended 31 December 2020 with the provisions set out in the UK Code, subject to the statements made below in this section.
The statements made below are all for the financial year ended 31 December 2020.
Board of Directorsintroductionduring the year ended 31 december 2020 there were a number of changes to the Board which resulted in a leaner structure whilst maintaining the independence of the Board.
as at 31 december 2020, the Board comprised the chair, who is a non-executive director, one executive director and six other non-executive directors.
Chairthe chair of the Board is geoff miller.
Senior independent DirectorJohn whittle holds the role of senior independent director, taking on this role following the resignation from the Board of eli alroy in march 2020.
DirectorsDirectors’ Duties and responsibilitiesthe roles of chair and chief executive are separate. the chair leads Board meetings and Board discussions and has responsibility for the Board’s overall effectiveness in directing the company. the chief executive is responsible for the achievement of the group’s strategic and commercial objectives, within the context of the group’s resources and the risk tolerances laid down by the Board.
the directors are responsible for the determination and oversight of the company’s investing policy and strategy and have overall responsibility for the company’s activities, including the review of its investment activity and performance, and the activities and performance of the management team.
each of the directors is committed to their role and has sufficient time available to meet their Board responsibilities. the Board, periodically reviews its policies, processes, information, time and resources to ensure that it is able to function effectively and efficiently.
details on the profile and experience of the executive and non-executive directors are set out on pages 82 to 83 of the annual report.
Committees of the Boardthe committees of the Board comprise the remuneration committee, the audit committee, the risk committee, the investment committee and the nomination committee. the composition and the terms of reference of each of the remuneration, audit, risk and nomination committees, and their work during the year, are provided in the respective reports for each committee on pages 88-107 of the annual report. committee meetings may be attended by non- members by invitation from the relevant chair. attendance by non-members is recorded in the relevant committee minutes.
following the Board changes referred to in the introduction, there were consequential changes to the Board committees, further details in respect of which are set out in in the respective reports for each committee on pages 88-107 of the annual report. the composition of the investment committee also changed as a result, such that as at 31 december 2020 it comprised geoff miller (chair of the committee), dimitris raptis, norbert sasse and david maimon. the terms of reference of the investment committee are available on the company’s website. during the year, all matters within the remit of the investment committee were discussed and considered by the full Board.
committee meetings of the Board are convened, when appropriate, to approve ad hoc matters between quarterly Board meetings, subject to authority levels, and comprise any two directors (of which one should always be independent and the majority of which must not be resident in the uK for tax purposes).
Stakeholder engagementa report on shareholder communications is considered at each quarterly Board meeting. regular trading updates are posted on the company’s website with commentary on significant events in the evolution of the company’s portfolio and performance.
the company’s senior management and its brokers maintain regular dialogue with institutional shareholders, feedback from which is reported to the Board. in addition, Board members – led by the chair – are available to answer shareholders’ questions at any time, and specifically at the annual general meeting (agm). the company secretary is available to answer general shareholder queries at any time during the year.
the Board monitors activity in the company’s shares and the discount or premium to net asset value at which the shares trade both in absolute terms and relative to the company’s peers.
collectively, our team commits considerable energy to planning and implementing the asset management of each of our assets to ensure that our buildings remain suited to our tenants’ needs both today and in the future. we believe that being a good landlord is about creating great communities for our tenants and other users. we consider investment in energy-efficient properties as a business advantage, as it allows us to give back to local communities, our investors, our tenants, our partners and the people who work in or live nearby our buildings: – local communities benefit from reduced carbon emissions
generated from the use of the property.
– our tenants benefit from lower energy costs, positively impacting the profitability of their operations.
– those working in our buildings benefit from improved conditions thanks to temperature control and better flow and quality of air (which can also lead to improved productivity).
– our partners benefit by assisting us to develop, maintain and operate a green portfolio according to the respective specifications of each property.
– our investors benefit through the creation of long-term sustainable value in the portfolio.
with regard to the globalworth workforce, we encourage open and constructive discussions throughout the group and, in 2019, we introduced an employee survey, the results of which help us understand how we can best provide a supportive workplace with career opportunities that enrich experience, develop skill sets and promote wellbeing.
we also have regular town hall meetings and, in non-covid times, hold an annual off-site team building event to which all employees are invited. whilst our plans for our non-executive directors to meet with our workforce during the year were hampered due to the covid pandemic, we look forward to further engagement as soon as this is possible and practicable.
workforce Policies and Practicesthe company is committed to conducting its business in an ethical manner, with integrity and in line with all relevant laws and regulations. the group has in place a number of policies and procedures including policies and training on anti-bribery and corruption, whistleblowing, information security and gdpr. all employees are made aware of the group’s policies on employment and this understanding is refreshed on no less than an annual basis. employees also receive training appropriate to their roles and responsibilities throughout the year. during the year, and in line with the Board’s commitment to high standards of integrity compliance, the Board reviewed the group’s written policies and procedures to ensure they remained proportionate and appropriate.

8180 Globalworth annual report and financial statements 2020
overview strategic report portfolio review GOverNANCe financial statements additional information
Globalworth annual report and financial statements 2020
iNTrODUCTiON TO GOverNANCe continued
Board Meetings and Directors’ Attendancethe number of meetings of the Board of directors attended by each director, as applicable, during the year ended 31 december 2020 is set out below.
directorQuarterly Board
meetingsad-hoc Board
meetingsBoard meetings
(total)
ioannis papalekas 1/1 1/4 2/5dimitris raptis 4/4 12/13 16/17geoff miller 4/4 13/13 17/17eli alroy 1/1 3/5 4/6John whittle 4/4 13/13 17/17andreea petreanu 4*/4 13*/13 17/17norbert sasse 4/4 11/13 15/17george muchanya 1/1 3/5 4/6peter fechter 1/1 5/5 6/6richard van vliet 4/4 12/13 16/17martin Bartyzal 3/3 8/8 11/11david maimon 3/3 6/6 9/9
Total Number of Meetings 4 13 17
* andreea petreanu was present at some Board meetings as an observer due to restrictions on participation as a result of geographical location.
where a director was unable to attend a Board meeting, they were separately briefed on the business of the meeting and provided any views beforehand.
in addition to the above Board meetings, the Board also appointed a sub-committee of the Board to deal with specific matters which met four times during the year and which was quorate on each occasion in accordance with the terms of that sub-committee.
Board induction, Training and Developmenton joining the Board, new members receive a comprehensive induction. individual training needs are identified as part of the annual Board evaluation process and training takes place as required. all directors receive regular updates on legal, regulatory and governance issues. during the year ended 31 december 2020, the Board considered papers and presentations on legal and regulatory developments including gdpr and modern slavery.
directors are also entitled to seek independent advice in relation to the performance of their duties at the company’s expense, subject to having first notified the chair.
Nomination Committee and Board evaluation the nomination committee consists of three independent non-executive directors and is chaired by geoff miller. the purpose of the committee is to consider the composition, skills and succession planning of the Board. any proposal for a new director will be discussed and approved by the Board, however, two significant shareholders (Zakiono enterprises ltd (“Zakiono”) and growthpoint properties ltd) have the power to appoint additional directors. during the year, the nomination committee focused attention, on behalf of the Board, on implementing the succession plan in relation to the departure of ioannis papalekas, the founder and ceo, from the company. this resulted in the appointment of dimitris raptis as co-ceo alongside mr papalekas for a period, before mr raptis took on the sole responsibilities of ceo in december. plans continue to be made for succession in relation to key roles. for details please refer to the nomination committee section of the annual report.
the Board formally considers on an annual basis its effectiveness as a Board: its composition, diversity and how effectively members work together to achieve objectives. as part of this evaluation, it considers the combination of skills, experience and knowledge in relation to both the Board itself and also its committees. the Board considers that it has an appropriate balance of skills and experience in relation to the activities of the company. the chair evaluates the performance of each of the directors on an annual basis, taking into account the effectiveness of their contributions and their commitment to the role. the performance and contribution of the chair is reviewed by the other directors. this formal evaluation is conducted by the company secretary circulating questionnaires seeking quantitative and qualitative feedback and reporting the outcomes to the appropriate Board members.
an evaluation of the performance of the Board members who served during the entire year ended 31 december 2020 has been undertaken. the performance of the chair of the Board was also evaluated by the other directors. the result of the evaluation carried out was that all directors’ performance is in line with the expectations set out at the point of their appointment to the Board.
independence evaluationthe Board considers the independence of each member of the Board at each quarterly Board meeting and is of the view that the chair has continued to demonstrate objective judgement throughout the year and that the majority of the Board comprises non-executive directors who are independent of the company and free from any relationship or circumstances which are likely to impair, or could appear to impair, the exercise of their independent judgement. with respect to martin Bartyzal (who was appointed pursuant to the right of Zakiono to appoint a specified number of directors according to its percentage shareholding in the company), david maimon (who sits on the advisory Board of aroundtown sa, a substantial shareholder in the company) and richard van vliet (who was originally appointed pursuant to growthpoint’s right to nominate a guernsey based director) the Board believes that they can each be considered to be independent for the following reasons: none of them has any cross-directorships or significant links with any other directors through involvement in other companies or bodies (other than mr van vliet as a non-executive of a growthpoint investment company but he has no other professional or personal connections with any of grt’s directors, officers or employees); there is continuing empirical evidence to demonstrate their independence in conduct, character and judgement.
Tenure and re-election of Directorsin accordance with the company’s articles of incorporation, the company’s non-executive directors, except martin Bartyzal (nominated and appointed pursuant to the right of Zakiono, to appoint a director) and norbert sasse (appointed pursuant to the right of growthpoint properties ltd to appoint a specified number of directors) and richard van vliet (appointed pursuant to growthpoint’s right to nominate a guernsey-based director), shall retire from office annually and may offer themselves for re-election by the members. at the next agm, geoff miller, John whittle, andreea petreanu and david maimon are required to retire from office and offer themselves for re- election. geoff miller, John whittle, e andreea petreanu and david maimon will stand for re-election at the forthcoming agm. the Board has reviewed their skills and experience and is recommending their re-election to shareholders.
at the next agm, dimitris raptis is not required to submit himself for re-election, unless required to do so by a two-thirds vote of the shareholders of the company.
Diversitywe believe in respecting individuals and their rights in the workplace. further details are provided on page 62 of the annual report.

8382 Globalworth annual report and financial statements 2020Globalworth annual report and financial statements 2020
overview strategic report portfolio review GOverNANCe financial statements additional information
THE RIGHT BLEND OF SKILLS AND EXPERIENCE
THe BOArD OF DireCTOrS
DiMiTriS rAPTiS GeOFF MiLLer JOHN wHiTTLe ANDreeA PeTreANU NOrBerT SASSe riCHArD vAN vLieT MArTiN BArTYZAL DAviD MAiMON
Chief Executive officer Independent Non-Executive Director & Chair of the board
Independent Non-Executive Director
Independent Non-Executive Director
Non-Executive Director Independent Non-Executive Director
Independent Non-Executive Director
Non-Executive Director
appointed 14 February 2013 6 June 2013 6 June 2013 29 September 2014 27 February 2017 27 February 2017 23 April 2020 28 May 2020
skills & experience Mr Raptis, a seasoned business leader with 25 years of experience in the financial services and real estate industries, is the CEO of Globalworth Group.
He joined the Group at incorporation in 2012 as Deputy CEO and Chief Investment Officer and held the position of Co-CEO between March and December 2020. During this period, he was primarily responsible for acquisitions and developments worth €2.7 billion, the raising of €5 billion of equity and debt capital, as well as the Group’s Polish business.
Mr Raptis joined Globalworth from Deutsche Bank where he spent 16 years as a senior member of its real estate investment management group (“RREEF”), having managed and executed transactions worth in excess of €12 billion. His last position was Managing Director and European Head of RREEF’s real estate private equity group.
Mr. Raptis has a First Class (HONS) BSc in Banking and International Finance from Cass Business School, London.
Mr Miller has over 20 years of experience in research and fund management in the UK, specialising in the finance sector, followed by moves to Moscow and then Singapore before becoming a Guernsey resident in 2011. He was formerly a number one rated UK mid and small-cap financials analyst, covering investment banks, asset managers, insurance vehicles, investment companies and real estate companies. Geoff is Chief Executive Officer and Co-Founder of Afaafa, a business which provides investment and consultancy services to early-stage companies focused on the financials and technology sectors. In addition, he is a Director of a number of private companies.
Mr Whittle has over 40 years of experience in business, accounting and finance. John is a Chartered Accountant, resident of Guernsey and is a non-executive Director of several LSE and AIM listed companies. He also acts as non-executive Director to other Guernsey investment funds. John previously was Finance Director of Close Fund Services1, and has held various positions with Price Waterhouse, Talkland International2, John Lewis and Windsmoor.
Ms Petreanu is a risk management professional with over 20 years of experience in the field. Andreea is Head of Credit Risk Management at Mizuho International in London, having previously held various risk management roles with Morgan Stanley, HSBC, Merrill Lynch, Bank of America and VTB Capital. Andreea holds an MBA from University of Cambridge, MSc from CASS Business School and is also an Associate of the Chartered Insurance Institute in London.
Mr Sasse has nearly 30 years of experience in real estate and corporate finance. Norbert is the Group Chief Executive Officer of Growthpoint Properties (GRT), South Africa’s largest REIT. He was instrumental in growing its portfolio to over ZAR 160 billion (c.€9bn), holding investments in South Africa, Australia, CEE and the UK. Prior to GRT he spent 10 years with EY Corporate Advisory and Investec Corporate Finance. He is also a Chartered Accountant.
Mr van Vliet is qualified as a Chartered Accountant in South Africa, England and Wales, with over 35 years of professional experience. Richard has been a Guernsey resident since 1997 and is Managing Director of Cannon Asset Management Limited. He is Chairman of The Cubic Property Fund, holds various Board positions on companies and investment funds exposed to property, equity and alternative investments, and sits on operational Boards of the subsidiaries of the LSE-listed Stenprop Limited. Previously he worked in South Africa at Price Waterhouse and was sole proprietor of an audit practice in Johannesburg.
Mr Bartyzal has over 25 years of international experience in finance and banking in Central and Eastern Europe. He has broad experience in structured financing, capital markets, corporate finance, and risk management across sectors in the CEE region and worked on a number of projects with major real estate companies in Central and Eastern Europe. Martin held various positions in corporate and investment banking at Deutsche Bank in the CEE region and also managed the business of Deutsche Bank in the Czech Republic as Chief Country Officer between 2009 and 2018. He holds a Master’s degree from the Economic University in Prague and is a member of the Czech & Slovak Chapter of YPO.
Mr Maimon serves as member of the Advisory Board of Aroundtown SA and Grand City Properties S.A., and is a Supervisory Board member at TLG immobilien AG – all public companies traded on the Prime Standard of the Frankfurt Stock Exchange. As member of such Advisory Boards he provides expert advice and assistance to the Board of Directors. In the past, David was the President and CEO of EL AL Airlines from 2014 to 2018. Prior to that, he was EVP of Commercial & Industry Affairs, Sales & Marketing and Customer Service in EL AL Airlines and served as a Director in various commercial companies such as Leumi Gemel Ltd, Hever and Sun D’Or International Airlines.
1. large independent fund administrator.
2. now vodafone retail.
committee membership
Committee membership
audit
investment
nomination
remuneration
risk
committee chair

8584 Globalworth annual report and financial statements 2020Globalworth annual report and financial statements 2020
overview strategic report portfolio review GOverNANCe financial statements additional information
The Directors present their Annual Report and the audited consolidated financial statements of the Group for the year ended 31 December 2020.
Directors’ indemnitiesthe company maintains a directors’ and officers’ insurance policy for the benefit of its directors, which applied throughout the year and remains in force at the date of this report. there are also third-party indemnity provisions in place for the directors in respect of liabilities incurred as a result of their office, as far as is permitted by law.
investing Policythe group’s investing strategy focuses on generating attractive risk-adjusted returns, made up of a combination of yield and capital appreciation, by investing in a diversified portfolio of properties. Key highlights of the company’s investing policy are presented below:
Profile of Underlying investments – focus on commercial properties (existing or to be developed);
– geographically located in central eastern europe with a primary focus on romania and poland;
– most of the income to be derived from multinational corporates and financial institutions; and
– euro-denominated, long-term, triple net and annually indexed leases, with corporate guarantees where possible.
investment themes – distressed investments;
– acquisition of unfinished or partially let commercial buildings at prices below replacement cost;
– restructuring;
– acquisition of real estate owned by financial institutions or others seeking to restructure their balance sheets through monetisation; and
– developments with pre-lettings from high-quality tenants.
the complete investing policy of the company can be found on its website under investor relations/aim rule 26 disclosures and on page 177 of the annual report.
results and Dividendsthe results for the year are set out in the consolidated statement of comprehensive income on page 110 of the annual report.
the company has already distributed in october 2020 and in march 2021 interim dividends of €0.19 per share and €0.15 per share, respectively, or €0.34 per share in total, in respect of the year ended 31 december 2020, to holders of shares at the respective record dates for each such interim dividend.
Going Concernas disclosed in note 1 of the consolidated financial statements, the directors believe that it is appropriate to continue to adopt the going concern basis in preparing the consolidated financial statements as the company expects to have access to adequate financial resources to continue in operational existence for the foreseeable future.
DireCTOrS’ rePOrT
Supply of information to the Boardthe Board meetings are the principal source of regular information for the Board, enabling it to determine policy and to monitor performance and compliance. a representative of the investment adviser attends each Board meeting, thus enabling the Board to discuss fully and review the company’s operations and performance. each director has direct access to the company secretary and may, at the expense of the company, seek independent professional advice on any matter that concerns them in the furtherance of their duties.
Delegation of Functionsthe Board has contractually delegated to external agencies the accounting and company secretarial requirements of the company and some of its subsidiaries. each of these contracts were entered into after full and proper consideration of the quality and cost of services offered.
investment Adviserunder the investment advisory agreement, the company has appointed the investment adviser, a wholly owned subsidiary of the group, subject to the overall control and supervision of the Board of the company, to act as investment adviser.
the investment adviser has no authority to act for or represent the company (or any other member of the group) in any other capacity. the appointment is on an exclusive basis.
the investment adviser is obliged to advise in respect of potential and actual investments of the company in pursuit of the company’s investing policy, subject to any applicable investment restrictions and having regard to any investment guidelines. investment advice and opportunities are presented for consideration/approval to the investment committee (or directly to the Board if above certain thresholds or otherwise deemed desirable or appropriate).
subject to any applicable law, the investment adviser complies with all reasonable instructions issued by the investment committee or the Board, if above certain thresholds (so long as these are not outside the investing policy as set out on the company’s website under investor relations/aim rule 26 disclosures or contrary to the exclusivity of the investment adviser in relation to the company’s investment activities).
the investment adviser is entitled to fees as approved by the Board, following recommendation by the remuneration committee of the Board. at quarterly Board meetings the investment adviser summarises its activities, proposals and achievements and the independent directors review the performance of the investment adviser and the executive directors in relation thereto. Having considered the portfolio performance and investment strategy, the Board has agreed that the interests of the shareholders as a whole are best served by the continuing appointment of the investment adviser on the terms agreed.
Substantial interestsat 31 december 2020 and 25 march 2021 the company has been notified that the following shareholders had substantial interests (3% or more) in the issued share capital of the company:
at 25 march 2021 at 31 december 2020
number of shares
% of issued share capital of the
companynumber of
shares
% of issued share capital of the
company
cpi property group 65,250,000 29.6% 65,250,000 29.6%
growthpoint properties ltd 65,238,742 29.5% 65,238,742 29.5%aroundtown 48,629,464 22.0% 48,629,464 22.0%oak Hill advisors 11,665,106 5.3% 11,665,106 5.3%european Bank for reconstruction and development 11,064,966 5.0% 11,064,966 5.0%
Directors’ intereststhe beneficial and non-beneficial interests of the directors in the share capital of the company as at 31 december 2020 and 2019 are as set out below:
number of shares held number of warrants held
2020 2019 2020 2019
ioannis papalekas (director until 16 march 2020) – 29,204,839 – 2,830,020dimitris raptis 739,854 1,291,710 – –geoff miller 12,500 10,000 11,000 11,000John whittle 11,900 11,900 9,000 9,000andreea petreanu – – – –norbert sasse 114,286 114,286 – –richard van vliet – – – –martin Bartyzal – – – –david maimon – – – –
warrantsas at 31 december 2020, a number of warrants were held by Zakiono enterprises limited, geoff miller and John whittle. pursuant to the warrant agreements, the warrants confer the right to subscribe, at the placing price, for a specific number of ordinary shares.
Non-executive Directors’ warrantson 24 July 2013 the company entered into a warrant agreement with inter alia geoff miller and John whittle under which the company agreed to issue to such persons at, and subject to, admission, warrants over 11,000 and 9,000 (respectively) ordinary shares, subject to the market price per ordinary share being at least €7.50 as a weighted average over a period of 60 consecutive days. in each case, the subscription price will be €5.00. these warrants have vested but have not yet been exercised.
Zakiono warrantson 24 July 2013 the company entered into a warrant agreement with mr ioannis papalekas, the company’s founder, and Zorviani limited (a company owned by mr papalekas). the rights and obligations under the warrant agreement were subsequently transferred from Zorviani limited to Zakiono enterprises limited.
as at 31 december 2020 the 2,830,020 outstanding Zakiono warrants, are still held by Zakiono enterprises limited, a company owned by cpi property group, and remain unvested in two tranches.
the Zakiono warrants, subject to vesting, are exercisable in whole or in part during the period which commenced on admission and ends on the date falling 10 years from the date of admission. the warrants are exercisable subject to the market price per ordinary share being at least €10.00 and €12.50 (respectively) for each of the two remaining tranches as a weighted average over a period of 60 consecutive days. in each case, the subscription price will be €5.00.
Auditorsthe auditors, ernst & Young cyprus limited, have indicated their willingness to continue in office. accordingly, a resolution for their reappointment will be proposed at the forthcoming agm.
Power to Buy Back Sharesthe company has the power to buy back shares in the market, the renewal of which power is sought from shareholders on an annual basis at the agm, and the Board considers on a regular basis the exercise of those powers. during the year ended 31 december 2020 the Board has exercised its power to buy back shares in the market.
at the 2020 agm, the directors were given power by the shareholders to make market purchases of ordinary shares representing up to 14.99% of its issued capital at that time, being 33,270,447 ordinary shares. this authority will also expire at the 2021 agm and it is proposed that the renewal of the authority will be sought.
during the year ended 31 december 2020, the company repurchased 1,560,136 ordinary shares for an aggregate consideration of €8.34 million, 449,698 of these shares were subsequently used to meet obligations arising under share award plans in place for the group. as such, there are currently 1,611,215 ordinary shares in treasury as at 31 december 2020 and 1,537,549 as at the date of this report.
further details relating to share capital, including movements during the year, are set out in note 21 of the financial statements on page 144.
Annual General Meetingthe agm of the company will be held on 21 June 2021 at 10am British summer time at anson court, la route des camps, st martin, guernsey.

8786 Globalworth annual report and financial statements 2020Globalworth annual report and financial statements 2020
overview strategic report portfolio review GOverNANCe financial statements additional information
87Globalworth annual report and financial statements 2020
overview strategic report portfolio review GOverNANCe financial statements additional information
DireCTOrS’ rePOrT continued
Statement of Directors’ responsibilitiesthe directors are responsible for preparing the directors’ report and the consolidated financial statements in accordance with applicable law and regulations.
the directors are required to prepare consolidated financial statements for each financial year in accordance with international financial reporting standards (ifrs), as adopted by the european union (eu), and applicable law.
the consolidated financial statements are required by law to give a true and fair view of the state of affairs at the end of the year and of the profit or loss for that year.
in preparing these consolidated financial statements, the directors are required to: – select suitable accounting policies and then apply them
consistently;
– make judgements and estimates that are reasonable and prudent;
– state whether applicable accounting standards have been followed, subject to any material departures disclosed and explained in the consolidated financial statements; and
– prepare the consolidated financial statements on the going concern basis unless it is inappropriate to presume that the company will continue in business.
the directors are responsible for ensuring that the company maintains proper accounting records which disclose, with reasonable accuracy at any time, the financial position of the company and to enable them to ensure that the consolidated financial statements comply with the companies (guernsey) law 2008, as amended. they have general responsibility for taking such steps as are reasonably open to them to safeguard the assets of the group and to prevent and detect fraud and other irregularities.
the directors confirm to the best of their knowledge that: – so far as each of the directors is aware, there is no relevant audit
information of which the company’s auditor is unaware, and each has taken all the steps he or she ought to have taken as a director to make himself or herself aware of any relevant information and to establish that the company’s auditor is aware of that information;
– these consolidated financial statements have been prepared in conformity with ifrs, as adopted by the eu, and give a true and fair view of the financial position of the group; and
– this annual report and consolidated financial statements, taken as a whole, are fair, balanced and understandable and provide the information necessary for the shareholders to assess the company’s position, performance, business model and strategy.
approved by the Board of directors and signed on behalf of the Board on 25 march 2021.
Geoff MillerDirector25 march 2021

John whittle Chair of the Audit Committee
The Audit Committee will continue to take a probing and realistic approach to our work to ensure, to the best of our ability, that Globalworth continues to be a financially resilient and sustainable business.
HiGHLiGHTS — increased scrutiny over the financial statements’ preparation and audit process; and — increased focus on the going concern assessment and viability analysis; both as a result of the potential global effects of the covid-19 pandemic on the real estate sector.
8988 Globalworth annual report and financial statements 2020Globalworth annual report and financial statements 2020
overview strategic report portfolio review GOverNANCe financial statements additional information
LETTER FROM THE CHAIR OF THE COMMITTEE
AUDiT COMMiTTee
DEAR SHAREHOLDER
the audit committee’s primary areas of focus during 2020 have remained unchanged from previous years; however, there have been some significant new questions for us to ask ourselves in discharging our duties as a result of the covid-19 pandemic. this became very clear at the beginning of the year when we reviewed the 2019 financial statements. in february, we were able to meet with the auditors in person before restrictions were introduced and satisfy ourselves that the financial statements were fair and reasonable. most of the work had already been completed at that stage. nevertheless, as a result of new regulatory guidance introduced by the frc, we took some additional time to satisfy ourselves that our assessment of the financial statements was rigorous and globalworth’s balance sheet was well-placed to withstand the changing environment arising from the pandemic. we were particularly mindful of the potential long-term consequences of the pandemic on the real estate markets in romania and poland and the likely impact on asset valuations. we requested management consider some additional sensitivities around going concern and re-evaluated the modelling given that the “plausible downside case” was now materially worse than before. these additional tests enabled us to reconfirm our view that the company remained very resilient because of its substantial cash balances and underlying net operating income. we would like to thank management for responding to these arduous additional requests so promptly and professionally. i believe our
approach was a sensible one to take which, importantly, allowed us to demonstrate that we had adopted the higher standards of care and scrutiny sought by the regulators.
we also spent time evaluating the work of the auditors, especially on the key areas of focus identified at the audit planning phase. we adopted a similar level of caution in our evaluation of the company’s position prior to issuing new bonds during the summer. we looked at potential downside scenarios to assess the impact on covenants, rental incomes and asset valuations arising from the current economic environment. with the pandemic continuing to make it difficult for the auditors to do their work and for the committee to be able to meet in person, we have had to work harder to ensure that there are good processes in place for the preparation and audit of the 2020 financial statements. technology has provided many tools to help the finance team, the auditors and the audit committee to do a solid job. consequently, whilst it has not been an easy task to undertake the year-end work for 2020 to a high and rigorous standard, it has not been impossible, and i believe everyone involved has acquitted themselves well.
as we move into 2021, we are well aware that globalworth’s market is changing, and will continue to do so. the ambitious growth plans that the company had a year or two ago have been scaled back whilst the Board and management assess the challenges that the company faces. However, the audit committee will continue to take a probing and realistic approach to our work to ensure, to the best of our ability, that globalworth continues to be a financially resilient and sustainable business.
John whittleChair of the Audit Committee25 march 2021
MeMBerSHiP AND ATTeNDANCe
director position
date of committee
appointment attendance
John whittle chair 6 Jun. 13 4/4
andreea petreanu member 8 Jun. 15 4/4
richard van vliet member 27 feb. 17 4/4
george muchanya (until 23 april 2020) observer n.a. 2/2
Total Number of Meetings 4
Structure and Compositionduring the year ended 31 december 2020 the audit committee comprised three independent non-executive directors: John whittle (chair of the audit committee), andreea petreanu and richard van vliet. george muchanya continued to act as an observer of the committee until his resignation from the Board on 23 april 2020.
the chair of the committee is appointed by the Board, and the members are appointed by the Board, in consultation with the chair of the committee. in compliance with the uK corporate governance code, the terms of reference of the committee state that it should comprise at least three independent non-executive directors.
all members of the committee are independent non-executive directors with recent, relevant financial experience, following the requirement of the uK corporate governance code that at least one member of the audit committee should have recent and relevant financial experience. the profiles of the chair and other members of the committee, including their relevant experience, are presented in the Board of directors sub-section of the annual report (pages 82 to 83).
the dates of appointment of the members of the committee, together with attendance at committee meetings during the year, are outlined in the table on the previous page.
Principal Duties of the Committeethe role of the committee includes the following:
Financial reporting:• monitoring the integrity of the consolidated financial statements
and any formal announcements regarding financial performance;• reviewing and reporting to the Board on the significant issues and
judgements made in the preparation of the group’s published financial statements, preliminary announcements and other financial information having regard to matters communicated by the independent auditors; and
• assessing whether the annual report and financial statements, taken as a whole, are fair, balanced and understandable and provide the information necessary for shareholders to assess the company’s performance, business model and strategy.
Controls and Safeguards:• reviewing the company’s arrangements for its employees to raise
concerns, in confidence, about possible wrongdoing in financial reporting or other matters and ensuring that these arrangements allow proportionate and independent investigation of such matters and appropriate follow-up action; and
• considering annually whether there is a need for the company to have its own internal audit function.
external Audit:• reviewing the effectiveness of the external audit process and the
auditor’s independence;• considering and making recommendations to the Board on the
appointment, reappointment, replacement and remuneration of the company’s independent auditor;
• developing and implementing a policy on the engagement of the external auditor to supply non-audit services; and
• reporting to the Board, identifying any matters in respect of which it considers that action or improvement is needed and making recommendations as to the steps to be taken.
further details of the committee’s formal duties and responsibilities are set out in the committee’s terms of reference, which can be found on the company’s website.
Activities of the Committeeduring the year ended 31 december 2020 and up to the date of this report the committee has been active in the following areas, presented below under the three key areas of focus of financial reporting, controls and safeguards, and external audit:
Financial reporting:• reviewed the annual report and consolidated financial statements
for the years ended 31 december 2019 and 31 december 2020 prior to their approval by the Board; and
• reviewed the interim report and unaudited interim consolidated financial statements for the half year ended 30 June 2020 prior to its approval by the Board.

9190 Globalworth annual report and financial statements 2020Globalworth annual report and financial statements 2020
overview strategic report portfolio review GOverNANCe financial statements additional information
AUDiT COMMiTTee continued
the committee has had regular contact with management during the process of preparation of the annual report and consolidated financial statements and the auditor during the audit thereof. in planning its work and reviewing the audit plan with the auditor, the committee took account of the most significant issues and risks, both operational and financial, likely to have an impact on the group’s financial statements and selected the most significant issues impacting the company’s financial statements and annual report disclosures, as presented in the following table together with the committee’s response thereon:
Significant financial reporting matters considered Audit Committee response
investment Property valuationsvaluations for investment property, property under construction and land bank are prepared by external valuers. the valuation of the investment property is inherently subjective, requiring significant estimates and assumptions by the valuer. errors in the valuation could have a material impact on the group’s net assets value. further information about the portfolio and inputs to the valuations are set out in notes 3 and 4 of the consolidated financial statements.
the potential effects of the covid-19 pandemic on the global real estate market has increased the level of attention and scrutiny over the independent valuations performed by qualified, independent and experienced valuers in the two markets where our group’s properties are located.
the Board and the committee discuss the outcome of the valuation process and the details of each property on a semi-annual basis. the management liaises with valuers on a regular basis and meet them on a semi-annual basis prior to the finalisation of the portfolio valuation.
the external auditor has access to the external valuers and comments on the key assumptions used in the valuations performed and movements on property values.the committee receives a detailed written report from ernst & Young (“eY”) presented to the committee upon finalisation of the audit fieldwork.
Accounting for Acquisitions and Disposalsthe committee notes that there is judgement involved in identifying and valuing the consideration given and the fair value of the assets acquired in a business combination, or in the acquisition of assets.
the committee also notes that there is judgement involved in the accounting for disposals, particularly around the valuation of the consideration receivable.
there were no significant acquisitions and no disposals of core properties during the year ended 31 december 2020.
revenue recognitionthe committee understands the importance of recognising accurately the revenue generated as a result of the rental contracts the group has entered with the tenants of its properties. this includes the correct accounting under ifrs of lease incentives and any other special clauses contained in lease agreements, as well as the correct application of new ifrss related to accounting for lease agreements.
following the outbreak of the covid-19 pandemic, management has been very active in negotiations with tenants primarily on the extension of lease agreements, which resulted in modifications in an increased number of lease agreements, compared to prior years, therefore, the committee and the auditors have increased their attention in this area.
the committee is updated by the auditor annually on theresults of the specific audit procedures performed in this area, which, as anticipated, were more stringent this year as a result of the modifications made in an increasing number of lease agreements.
Going Concern Principlethe committee considers the appropriateness of preparing the group’s financial statements on a going concern basis, being one of the fundamental principles under which the financial statements are prepared.
the committee has considered management’s assessment and conclusion of continuing to use the going concern assumption as a basis of preparation of the company’s financial statements, as supported by detailed cash flow projections for the period up to 30 June 2022 and supporting documentation.
following their review of management’s assessment, the committee concurred with management’s conclusion to continue using the going concern assumption as a basis of preparation of the company’s financial statements.
Significant financial reporting matters considered Audit Committee response
Underlying Cash Flow Projections and Sensitivity Analysis Supporting the viability Statementthe committee considers whether the assessment undertaken by management regarding the group’s long term viability appropriately reflects the prospects of the group and covers an appropriate period of time.
increasing attention was placed by the committee and the auditors this year on the sensitivity of the viability analysis to significant inputs and assumptions that may be affected due to the potential ongoing, medium-term, effects that the covid-19 pandemic may have on the real estate sector in particular.
the committee has considered management’s viability analysis, including the underlying cash flow projections for the three-year period to 31 march 2024, sensitivity analysis, results and conclusion.
following their review of the viability analysis, the committee concurred with management’s conclusion as reflected in the viability statement on page 58.
Fair, Balanced and Understandable Principlethe committee considers whether the annual report and financial statements, taken as a whole, are fair, balanced and understandable and provide the information necessary for shareholders to assess the company’s performance, financial position, business model and strategy.
the committee, in reviewing the company’s annual report and consolidated financial statements for the year ended 31 december 2020, has placed particular attention in ensuring adherence to this principle.
following its review, the committee has advised the Board that, in its opinion, the annual report and financial statements, taken as a whole, are fair, balanced and understandable and provide the information necessary to assess the company’s performance, operating model and strategy.
Controls and Safeguards:reviewed the risk matrix used to identify and monitor the significant risks encountered by the group, as well as the analysis underlying the viability report.
considered whether there is a need for an internal audit function:• the committee has not identified to date an imminent need for an
internal audit function, however, it continues to evaluate this requirement on a regular basis.
external Audit:Held regular meetings and discussions with the external auditor:• at the planning stage of the audit for the year ended 31 december
2020, the chair of the committee held a video call with the auditor in november 2020 at which the draft audit plan was presented by the auditor, reviewed and discussed. in addition, a discussion was held regarding the risks on which the audit would be focusing. following the video call with the auditor, the chair of the committee updated the other members of the committee accordingly.
• also, at the end of the audit, at the reporting stage, before the approval of the company’s consolidated financial statements and annual report for the year ended 31 december 2020, the committee discussed with the auditor the work performed under the key areas of focus identified at the audit planning phase and the results of the auditor’s work.
the auditor explained that the risks the audit would focus on were the following:• valuation of investment property whether in use or under
development;• revenue recognition: accounting for lease incentives, including
impact on valuation adjustments; and• risk of misstatement due to fraud and error (associated to the
significant risks).
moreover, the chair of the committee held in february 2021 a video call with the external auditor and discussed the findings from their audit of the consolidated financial statements for the year ended 31 december 2020, prior to publication of the preliminary results for the year ended 31 december 2020.
during march 2021 the committee also held a video call with the external auditor to discuss in detail the audit findings and the draft auditor’s report, following the conclusion of their audit fieldwork for the year ended 31 december 2020, prior to submission of the draft annual report to the Board for formal approval.
Assessed the independence and objectivity of the external auditor:the committee considers the reappointment of the external auditor, including rotation of the audit partner.
the uK corporate governance code recommends that the independent audit of ftse 350 companies is put out to tender every 10 years. the committee will continue to follow the developments around the financial reporting council’s (“frc”) related guidance on tendering at the appropriate time.
in addition, the external auditor is required to rotate the audit partner responsible for the group’s audit every five years. this is the fourth year that the current lead audit partner is responsible for the group’s audit.
the auditor has confirmed to the audit committee its independence of the group. the independence and objectivity of the independent auditor is reviewed by the committee, which also reviews the terms under which the independent auditor is appointed to perform non-audit services, in accordance with the company’s non-audit services policy.

9392 Globalworth annual report and financial statements 2020Globalworth annual report and financial statements 2020
overview strategic report portfolio review GOverNANCe financial statements additional information
services which are permissible in accordance with the auditor’s independence and other professional standards as well as the company’s non-audit services policy, such as tax compliance, special purpose audits and reviews, assurance non-audit services related to raising of bond notes, periodic reviews of financial information, and pre-acquisition due diligence reviews, are normally permitted to be performed by the independent auditor.
Audit Fees and Non-Audit Servicesthe table below summarises the remuneration of ernst & Young cyprus limited and other entities of eY during the years ended 31 december 2020 and 31 december 2019:
audit fees €‘000
non-audit fees €‘000
2020 2019 2020 2019
audit of financial statements 700 995 – –other assurance services – – 100 116other non-audit services – – 51 106
Total 700 995 151 222
the committee has reviewed the level of non-audit fees of the external auditor for the year ended 31 december 2020 and has considered that they are in line with the group’s level of development and fundraising activities, and concluded that they relate to permissible non-audit services under the auditor’s independence and other related professional standards.
reviewed the effectiveness of the external Auditor and recommended its reappointment to the Board: for the year ended 31 december 2020 the committee reviewed the effectiveness of the external auditors. this was facilitated through: the completion of a questionnaire by the relevant stakeholders (including members of the committee and key financial management of the group); interviews with finance staff; and a review of the audit plan and process for the year. in addition, as outlined above, the chair of the audit committee discussed with the external auditor in february 2021 their preliminary findings on the audit of the consolidated financial statements for the year ended 31 december 2020. furthermore, the committee discussed with the external auditor at the end of march 2021 their final findings on the audit of the annual report and consolidated financial statements for the year ended 31 december 2020 and their draft audit opinion thereon.
local statutory audits of individual subsidiary companies are also required in some jurisdictions in which the group operates. eY romania, eY poland and eY cyprus carry out these audits in romania, poland and cyprus, respectively.
following this review, the committee recommended to the Board that ernst & Young cyprus limited be reappointed as external auditors for the year ending 31 december 2021.
for any questions on the activities of the committee not addressed in this report, a member of the audit committee remains available to attend each annual general meeting to respond to such questions.
John whittleChair of the Audit Committee25 march 2021
AUDiT COMMiTTee continued

Andreea PetreanuChair of the Risk Committee
The pandemic has focused our attention on the need to ensure that our approach to risk is proactive and adaptable so that we continue to improve our ability to identify and evaluate emerging sources of risk.
HiGHLiGHTS — reassessment of risks at the outset of the covid-19 pandemic
— continuous engagement with management, especially in the period following the covid-19 pandemic outbreak
9594 Globalworth annual report and financial statements 2020Globalworth annual report and financial statements 2020
overview strategic report portfolio review GOverNANCe financial statements additional information
LETTER FROM THE CHAIR OF THE COMMITTEE
riSK COMMiTTee
DEAR SHAREHOLDER
last year, i explained that the principal objective of the risk committee was to provide focused oversight on the company’s governance of risk and internal controls and this has remained the driver for our work this year. our processes for identifying, evaluating, measuring and mitigating risk have continued notwithstanding the significant changes to our operating environment arising from the covid-19 pandemic. we were clear from the outset that the pandemic should not be singled out as a separate risk category. instead, we assessed its influence and impact on each of our principal risks to ensure that our overall view of globalworth’s risk portfolio remained balanced. we believe this was the right approach and it has enabled us to be clear in providing timely assessments of risk during the year.
the pandemic has also focused our attention on the need to ensure that our approach to risk is proactive and adaptable so that we continue to improve our ability to identify and evaluate emerging sources of risk and integrate them into our overall understanding of our risk universe. it has also prompted us to prioritise our focus on some of the key stakeholder risks such as employee health and wellbeing and ensuring business sustainability. as a result, we have refreshed and refined our assessment of those risks, which will undoubtedly have improved the quality of risk management in those important areas.
during the year, we welcomed martin Bartyzal and david maimon on to the risk committee, and both of them bring a wealth of fresh experience in real estate and risk management to the committee.
our priorities for 2021 are to continue to monitor globalworth’s business environment to ensure that our risk management framework keeps pace with it. during 2020, we have seen first-hand how quickly the world can change. with the separate focus on risk that we provide as a standalone Board committee, we believe we are well-placed to assess any new challenges and the risks that come with them.
Andreea PetreanuChair of the Risk Committee25 march 2021
MeMBerSHiP AND ATTeNDANCe
director position
date of committee
appointment
date of committee resignation attendance
andreea petreanu chair 1 nov. 18 - 2/2
richard van vliet member 1 nov. 18 - 2/2
geoff miller member 1 nov. 18 23 apr. 20 1/1
John whittle member 1 nov. 18 23 apr. 20 1/1
martin Bartyzal member 23 apr. 20 - 1/1
david maimon member 29 may 20 - 1/1
Total Number of Meetings 2
Globalworth’s risk Management Frameworkthe Board, represented by the risk committee, is responsible for establishing and maintaining the group’s system of internal control and for maintaining and reviewing its effectiveness. However, on a day-to-day basis risk is managed by each Business unit within the group’s risk management framework.
risk management is embedded within our strategy and culture and plays a significant role in the achievement of our business objectives. However, we believe that we have a conservative risk approach as we only accept risks associated with the nature of our business activities.
moreover, the continuous strengthening of risk management is a key element in creating a sustainable business and delivering attractive risk-adjusted returns to our shareholders and value to other stakeholders as part of profitable and sustainable growth.
our risk management framework and related processes focus on the identification, evaluation, formulation of response, monitoring and reporting on identified principal and other financial andnon-financial risks, as well as the identification of emerging risks, as explained in further detail on the following page.
our risk management strategy does not focus on eliminating risk entirely, but instead at striking an appropriate balance between managing our risks and maximising return from our business opportunities, ensuring a viable, profitable and sustainable business under normal and stressed market conditions.
our risk management approach includes a bottom-up risk management process as well as a top-down risk oversight process, as outlined in the diagram below.
orGaNISatIoNCUltUrE, PolICIES aND ProCEDUrES
bUSINESS ENVIroNMENt
boarDoVErSIGht
rISKCoMMIttEE
SENIor MaNaGEMENt tEaM
Bot
tom
up
ris
k M
anag
emen
t
top
dow
n r
isk
ove
rsig
ht
risk Oversight

9796 Globalworth annual report and financial statements 2020Globalworth annual report and financial statements 2020
overview strategic report portfolio review GOverNANCe financial statements additional information
identifythe Board and the risk committee have encouraged the risk ownership concept by Business units. therefore, as part of the bottom-up risk management process individual Business units within our group are responsible for identifying the risks related to their activities. identified risks are elevated to the risk committee for overview, comments and feedback.
the risk identification process is complemented by the top-down approach, where the Board and the risk committee, through the setting and approval of business strategy, identify potential additions to risks identified by Business units, or emerging risks which are being cascaded down to Business units for further assessment.
as part of the process of identification of risks, emerging risks are considered annually and risks that are identified but not assessed as principal risks are still evaluated and monitored. an example of such emerging risks in recent years is associated with the changes in tenants’ requirements for flexible, sustainable / green efficient and technologically advanced buildings. details on actions taken continuously by our group in these areas are provided on pages 60 to 63 of the annual report and in the separate sustainable development report for year 2019 which is available on our website.
it must also be emphasised that at the beginning of 2020, in light of the covid-19 pandemic, we made a careful assessment of the potential threats and impact that this pandemic may have on our business and its operations, as well as on the short to medium term future results and cash flows. following our analysis, whilst the risks posed by the covid-19 pandemic could be viewed as infiltrating all of our risks, we have specifically increased the level of risk on three of the already identified principal risks, namely: market conditions and
the economic environment in which we operate; our counterparty credit risk; and availability of financing. the changes have already been reflected in the level of risk associated with these principal risks in the risk report for the year ended 31 december 2019. in addition, the emergence of the covid-19 pandemic has made more frequent communication between the risk committee, the Board and management a necessity in order to manage collectively and swiftly risks as these are identified and communicated to the risk committee and the Board.
evaluateonce risks have been identified, they are assessed by the responsible Business units as to their potential severity of impact on the group’s performance (a negative impact on financial results) and to the probability of occurrence, that is risk indexation.
respondonce risks have been identified and evaluated, one or a combination of the following techniques are used to manage each particular risk:• avoid (eliminate, withdraw from, or not become involved in);• control (optimise - mitigate);• sharing (outsource or insure); and• retention (accept and budget).
the selection of a particular response strategy depends upon the magnitude of the impact, probability of occurrence, and existing internal and external controls.
risk management by the Business units is embedded in the culture of our group and how policies and procedures are put in place.
IDENtIFY
rEPort
EValUatE
rESPoND
MoNItor
rISK
IDENtIFICatIoN
& MaNaGEMENt
ProCESS
risk oversight cont.
riSK COMMiTTee continued
Monitorthe initial risk management strategy may not address all issues as expected.
the executive management and the risk committee encourage the escalation by Business units of risk related matters that may arise from time to time. this is complemented by the oversight of the risk committee, which discusses the risk framework and makes its recommendations to the Board, as considered necessary.
following reporting by the risk committee, the Board reassesses, at each quarterly meeting, whether the previously selected controls are still applicable and effective, and the possible risk level changes in the business environment.
in addition, since the emergence of the covid-19 pandemic, and in part due to the urgency of such risk management, there has been frequent and extensive communication between executive management and the whole Board with regard to the monitoring of risks related to, or affected by, the pandemic.
since its formation as a separate committee, the risk committee has taken under its responsibility the review, on an annual basis, of the effectiveness of the company’s internal controls and risk management systems.
the risk committee has therefore performed an assessment of the internal controls of the group, which has been in place for the financial year ended 31 december 2020 and up to the date of approval of the annual report and accounts, and in particular the controls over the most significant financial reporting risks.
this review was facilitated through the submission by the company’s chief financial officer of the updated report on controls over identified significant financial reporting risks, as prepared by management. following its review, the risk committee concluded that the related internal control environment is adequate considering the current size and activities of the company.
reportthe group presents the principal risks profile on pages 98 to 102 of the annual report.
Andreea PetreanuChair of the Risk Committee 25 march 2021

9998 Globalworth annual report and financial statements 2020Globalworth annual report and financial statements 2020
overview strategic report portfolio review GOverNANCe financial statements additional information
ProbabilityLess More
Internal control
Imp
act
Less
Exp
osu
re
Mo
re
10
9
7
4
5 3
11
8
6
2
1
riSK rePOrT: PriNCiPAL riSKS & UNCerTAiNTieS
INDEXATION OF PRINCIPAL RISKS
the diagram on the left portrays our current principal risks assessment in terms of their individual impact on the group’s future results and the probability of occurrence. the probability of risk occurrence is an estimate, since the past data on frequency is not readily available. after all, probability does not imply certainty.
the probability of risk occurrence is, by nature, difficult to estimate. likewise, the impact of the risk, in isolation, is estimated based on the executive management’s past experience in the real estate industry. further, both the above factors can change in magnitude depending on the adequacy of risk avoidance and prevention measures taken and due to changes in the external business environment.
Keythe following key is used in the table below to highlight the changes in risk exposures during the year ended 31 december 2020:
in addition, the risks marked with have been considered relevant for the viability statement analysis.
risk exposure has increased in the current year
risk exposure has reduced in the current year
no significant change in risk exposure since prior year
strategic objectives:
1. strengthen our position as the leading investor and landlord in our core markets
2. enhance value of existing investments
3. maintain an efficient and flexible capital structure
4. de-risk portfolio
5. investment in sustainable environment & communities
further details on our principal risks are outlined below, linking each risk to our strategic objectives, and explaining our risk mitigation strategies and the rationale for change in risk during the year. in 2020 we have merged 3 principal risks with 3 others of similar nature hence the total number of principal risks was reduced from 14 to 11 and consequently the numbering of certain principal risks has changed as compared to the prior year.
Strategic Objective Impact Mitigation Change from prior year
Business environment risks
1 Market Conditions and the economic environment, Particularly in romania and Poland
Negative trends in economic activity, and specifically the real estate markets in Poland and Romania may affect the occupier demand, rental rates and investment valuation in respect of the Group’s properties.
The Group is focused on leasing to multinational groups with either moderate exposure to developments in the Polish and Romanian economies and/or with very sound financial standing.
The Group also focuses on signing long-term lease agreements with financially sound tenants and that current leases are renewed prior to their expiry for a longer term and at index-linked rental rates, so as to maintain and improve sustainable revenues.
2 Changes in the Political or regulatory Framework in romania, Poland or the european Union
The Group focuses on property investments in Poland and Romania, and is therefore exposed to political and regulatory framework changes that may impact activities in these markets.
Adverse changes in taxation provisions and approach of the tax authorities in the jurisdictions the Group’s legal entities operate in may negatively affect its net results.
The Group monitors political or regulatory developments in Poland and Romania through its own resources and third-party information. In cases when changes in regulations occur, appropriate action is taken so as to maintain compliance with applicable regulations.
Management believes that both economies continue to have a stable outlook for the medium to long term.
The Group, through the Executive Management, the Group Head of Tax and engaging third-party specialist tax advisers on a regular basis in all the jurisdictions where its legal entities operate, monitor very closely the upcoming changes in taxation legislation and ensure that all steps are taken for compliance and tax efficiency of its Group structure.
Through regular tax compliance monitoring and conservative policies in this area the Group ensures that the risks associated with potential additional, unexpected tax assessments is minimised. Moreover, the Group is closely monitoring its compliance with changes in EU member states’ legislation (mainly for Poland, Romania and Cyprus).
Even though there have been significant changes in the Polish and Romanian corporate taxation legislation in recent years, these changes were in line with the EU anti-tax avoidance directive, which is an EU political priority, as opposed to specific initiatives in the countries where the Group operates.
Property Portfolio risks
3 execution of investment Strategy
Poor execution of the Group’s strategy of investing in high-quality properties at sufficiently attractive valuations would affect the Group’s objectives of maximisation in NAV and EPS.
In addition, inability to deliver pre-leased office space to tenants by the agreed dates due to delays caused by contractors or their possible default, could lead to potential costs overruns, penalties and loss of revenues.
The Group’s management team have a proven track record of acquiring high quality properties, most of them at a discount to their fair market values. The team remains in close contact with leading European real estate specialists with presence in its market of focus so as to get immediate access to potential opportunities.
The team takes the lead in negotiations with the sellers of properties and puts in place safeguards (involvement of legal, financial, tax and technical third-party reputable and experienced due diligence advisers) and ensures related agreements are concluded within a short period of time.
Risks for delay in completion of properties under development are passed on to the main contractors with whom fixed-cost turnkey contracts are signed and from which good execution guarantees are received. A portion of amounts payable to them, ranging from 5% to 15% of contracted value, are retained from the contractor’s monthly certified works until after the successful completion of the construction works.
Only experienced, reputable and financially sound contractors are selected for the construction of properties under development, which are supervised by our project management teams in Romania and Poland. Further, significant penalties are stipulated in the related construction contracts to minimise any loss due to the delayed completion of the development works.

101100 Globalworth annual report and financial statements 2020Globalworth annual report and financial statements 2020
overview strategic report portfolio review GOverNANCe financial statements additional information
Strategic Objective Impact Mitigation Change from prior year
Property Portfolio risks continued
4 valuation of Portfolio
Any error or negative trend in valuations of properties would significantly impact the results (NAV and EPS) of the Group.
Changes in occupational trends (e.g. requirement for more flexible space and building management technologies) can impact future revenue generating capacity and hence impact the valuation of properties.
The Group involves reputable third-party valuation specialists to measure the fair value of the investment property portfolio at least twice a year. Management closely monitors the valuation approach for each of its properties and the assumptions used in the valuation.
The Group strives to preserve and enhance property values through its property management and leasing initiatives, and where applicable its development strategy. In addition, our property development and leasing strategy anticipates the future needs of our tenants, especially those experiencing continuous growth and additional lease area requirements.
Our Group has also initiated an investment programme in the latest building management technologies for upgrading its existing buildings and consequently the services offered to its tenants.
5 inability to Lease Space
Potential loss of revenues leading to inability to maximise the EPS and FFO available for distribution of dividends to shareholders. Vacancy contributes to higher unrecoverable costs due to no service charge income.
Potential departure from market norms and rates as regards to headline rent and incentives to be provided to new and existing tenants in order to secure new leases or extension of existing leases.
The Group has a proven ability to attract tenants to its properties even before the inauguration of the construction works for properties under development.
The Group maintains a relatively low level of vacant space on completed properties, through the effective management of its portfolio, by its very experienced leasing and asset management teams based in Poland and Romania. In addition, the leasing teams cooperate closely with leading real estate specialists in their respective local markets to access new opportunities.
The Group’s Leasing Policy ensures that the key terms offered in new and/or extended lease agreements comply with the procedures established in order to prevent any significant departure from market norms and rates.
6 Counterparty Credit risk
Loss of income may result from the possible default of tenants.
Possible loss of deposits held with banks.
The Group has a diversified tenant base (over 650 tenants), the vast majority of which are reputable, blue-chip multinational and local groups of very good to excellent credit standing. Guarantee cash deposits or bank guarantee letters are received from all tenants for the credit period agreed in lease agreements.
During 2020 the Group continued to strengthen its Asset and Property Management teams in Poland and Romania, including resources dedicated to active monitoring of timely collections from tenants.
In accordance with the Group’s Treasury Policy guidelines, over the short term and until used in property investments, cash is placed with banks with investment grade rating and any exceptions to this must be approved by the Executive Management and the Board.
riSK rePOrT: PriNCiPAL riSKS & UNCerTAiNTieS continued
Strategic Objective Impact Mitigation Change from prior year
Property Portfolio risks continued
7 Sustainable Portfolio risk and response to Climate Change
Overall impact on our portfolio and businessdue to:• Increase in service
charges affecting attractiveness of our properties to tenants and thus profitability of our portfolio.
• Reduce the quality of working conditions for the people working or using our properties.
• Increase maintenance requirement of our properties affecting the long-term sustainable value of our portfolio.
• Changes in tenants’ requirements for sustainable / green efficient and technologically advanced buildings may lead to loss of current or potential new tenants to competition.
The Group is committed to responding to the effects of climate change and its Sustainability Policy covers the impact of the Group’s operations and processes, the long-term environmental performance of the properties owned and developed, as well as the reduction of energy consumption and greenhouse gas emissions.
The Group, therefore, actively invests in properties which are either certified as environmentally friendly or have the potential to be classified as such following our own initiatives.
Globalworth principally targets properties which have BREEAM Very Good / LEED Gold or higher green certification or with the potential to achieve this, and at the end of 2020 had 47 standing green certified properties, accounting for 81.8% of its standing commercial portfolio by value. In addition, Renoma which is currently under refurbishment / repositioning has maintained its BREEAM Excellent green accreditation, as the works performed are in accordance with a strict set of guidelines which do not impact its green certification status.
Financial, Financing & Liquidity risks
8 Lack of Available Financing and refinancing
This would negatively affect the Group’s ability to execute, to the full extent, its investment plan, maintain an optimal capital structure, and potentially make refinancing of maturing debt difficult.
The Group’s management team holds frequent meetings with current and potential equity and debt investors, as well as continuous discussions with leading global, European, and local institutions in connection with its financing requirements.
Since admission, the Group has raised c.€5 billion in equity and debt (including new loan facilities and rolled-over loan facilities on the acquisition of subsidiaries, as well as available facilities) to meet its financing requirements. In addition, as part of the €1.5 billion EMTN programme entered into in March 2018 the Group has €0.55 billion available for the issuance of additional bonds.
Moreover, the Group secured in 2020 a €15 million top-up on the available unsecured Revolving Credit Facility (“RCF”). In addition, two secured bank loans of €127.3 million in total were drawn down in Q1 2020 and another €27 million later in the year (including €7 million by one of our joint venture companies). The Group also took advantage of favourable market conditions in Q2 2020 to undertake an inaugural issue of €400 million green bonds in July 2020 and a contemporaneous repurchase of €226.9 million (c.41%) of its Bond maturing in June 2022.
Reduction due to reassessment of related risk in light of the successful new debt financing secured following the COVID-19 pandemic outbreak.

Geoff MillerChair of the Nomination Committee
New appointments made to the Board during 2020 provide a sound balance of skills, experience and perspectives to underpin the Board’s leadership of the Company.
GOverNANCe HiGHLiGHTS – the priority throughout 2020 was the
oversight of significant changes in both the executive and non-executive membership of the Board.
103102 Globalworth annual report and financial statements 2020Globalworth annual report and financial statements 2020
overview strategic report portfolio review GOverNANCe financial statements additional information
Strategic Objective Impact Mitigation Change from prior year
Financial, Financing & Liquidity risks continued
9 Breach of Loan Covenants
A breach may negatively affect the Group’s relationship with financing banks, may have going concern implications, and affect, negatively, its ability to raise further debt financing at competitive interest rates.
The Group monitors on a regular basis its compliance with loan covenants and has in the last couple of years increased its resources on monitoring in the area of loan contractual terms (including covenants) compliance.
10 Changes in interest and Foreign exchange rates
Additional financing costs may be incurred as a result of interest rate increases. Forecasting financing costs could become less accurate.
Significant fluctuations, especially in the Polish Zloty to Euro and the Romanian Leu to Euro exchange rates, may lead to significant realised foreign exchange losses.
The Group monitors on a regular basis the cost of its debt financing and has a preference towards fixed rate, longer term, financing, as depicted by the fact that c.91% of outstanding debt at 31 December 2020 bears fixed interest rates and has a weighted average period to maturity of 4.5 years (31 December 2019: 4.3 years). As a result, the impact of possible increases in interest rates for the medium term is minimal.
The Group continuously explores financing and refinancing options so as to diversify and potentially reduce its average debt financing costs.
The Group’s exposure to negative realised foreign exchange fluctuations is limited to cases where the date invoices are issued to tenants or received from contractors and suppliers and the date of their settlement differ significantly. The limited exposure to foreign exchange fluctuations is due to the fact that the pricing in all major contracts entered into (with tenants and contractors/suppliers) is agreed in Euro, hence providing for a natural cash flow hedge to a large extent.
The Group actively monitors, with the help and expertise of the Group Treasurer, on a daily basis, the fluctuations in the Polish Zloty to Euro and the Romanian Leu to Euro exchange rates and strives to minimise the period between the issuance and settlement of invoices to tenants and by its contractors/suppliers and the potential related, realised foreign exchange losses that may result.
regulatory risks
11 Compliance with Fire, Structural, Health and Safety or Other regulations
Non-compliance with related regulations in Poland and Romania may affect our reputation with existing and potential tenants.
It may lead to loss of right to operate our properties, and may also lead to severe legal implications for the directors of the property owning subsidiaries.
The Group has a specialised department dealing on a daily basis with matters related to compliance with such regulations in Poland and Romania, where the Group’s properties are located. Apart from in-house expertise, the Group also engages external consultants, when required, on specialised matters related to its compliance with these regulations.
Appropriate actions are taken as soon as a potential threat for non-compliance with such regulations is identified.
Andreea PetreanuChair of the Risk Committee 25 march 2021
riSK rePOrT: PriNCiPAL riSKS & UNCerTAiNTieS continued
LETTER FROM THE CHAIR OF THE COMMITTEE
NOMiNATiON COMMiTTee
DEAR SHAREHOLDER
this year has been a very busy year for the nomination committee as it has overseen significant changes in both the executive and non-executive membership of the Board. whilst these changes have been driven in part by changes on our share register, they have also allowed us to reduce the size of the Board whilst maintaining an appropriate balance of skills and experience. as a result, the Board may be leaner but it continues to be an effective group.
at the beginning of the year, ioannis papalekas informed us of his decision to sell his remaining stake in globalworth. thereafter, and for the remainder of the year, we have overseen the transfer of the ceo role and responsibilities across to dimitris raptis, and i am pleased that this process has run smoothly. the succession plan for a founder ceo is always a process which carries inherent risk and therefore the importance of successfully achieving that smooth transition, especially during the particular challenges of 2020, is not to be underestimated and it is a tribute to the management team that ioannis has developed over the years.
a key issue for the nomination committee through the Board changes in 2020 has been the need to retain the confidence of shareholders in the independence of the Board whilst retaining the entrepreneurial spirit that has driven globalworth’s growth over recent years. i believe that new
appointments made to the Board during 2020 have maintained that legacy and, at the same time, continue to provide a sound balance of skills, experience and perspectives to underpin the Board’s leadership of the company ahead of the challenges we can expect in 2021 and beyond.
i am satisfied that we are a diverse Board in terms of backgrounds and perspective and this mirrors our approach to diversity across the business as a whole. we don’t believe that diversity is an end in itself and therefore, while we recognise the value of diversity of gender and ethnicity on our Board and within our company, we will not treat it as something to be done for the sake of it.
we expect 2021 to be a quieter year as far as the membership of the Board and the work of the nomination committee is concerned.
Yours faithfully
Geoff MillerChairman25 march 2021
MeMBerSHiP AND ATTeNDANCe
director position
date of committee
appointment
date of committee resignation attendance
geoff miller chair 1 nov. 18 - 2/2
peter fechter member 1 nov. 18 23 apr. 20 1/1
eli alroy member 1 nov. 18 30 mar. 20 1/1
andreea petreanu member 30 mar. 20 - 1/1
richard van vliet member 23 apr. 20 - 1/1

Martin Bartyzal Chair of the Remuneration Committee
Going forward, we need to continue to monitor the effectiveness of the Remuneration Policy and ensure that our approach remains fit for purpose, in particular the long-term components of the Policy.
GOverNANCe HiGHLiGHTS – the principles of our remuneration
policy are robust and effective through the economic environment in 2020 affected by the pandemic.
105Globalworth annual report and financial statements 2020
overview strategic report portfolio review GOverNANCe financial statements additional information
104 Globalworth annual report and financial statements 2020
LETTER FROM THE CHAIR OF THE COMMITTEE
reMUNerATiON COMMiTTee
DEAR SHAREHOLDER
Having been appointed to the globalworth Board and as chair of the remuneration committee in april 2020, i am pleased to introduce myself to shareholders through this, my first remuneration report. i am delighted to join such a dynamic company and i look forward to serving on the Board and the remuneration committee going forward.
Having been appointed to the Board at such an operationally critical time, because of the pandemic, it was fortunate that a robust and well-structured group’ remuneration policy had been put in place already. consequently, the foundations were in place for aligning the incentivisation of the senior executive team with the group’s strategy. therefore, the committee’s focus in 2020 was on the implementation of the policy rather than redesigning the remuneration framework, and on ensuring the effectiveness and appropriateness of the remuneration policy in the more challenging market environment we are now in.
in the early stages of the pandemic, we considered whether the prevailing economic environment should cause us to revisit and/or even revise the remuneration approach previously agreed. the significant effect of the pandemic on the group’s operating environment and the challenges that this presented to operational and financial performance gave the remuneration committee plenty to think about when reviewing the impact of the pandemic on remuneration outcomes for the senior executive team.
MeMBerSHiP AND ATTeNDANCe
director position
date of committee
appointment
date of committee resignation attendance
martin Bartyzal chair 23 apr. 20 - 4/4
Bruce Buck chair 1 nov. 18 23 apr. 20 2/2
geoff miller member 23 apr. 20 - 4/4
John whittle member 30 mar. 20 - 4/4
eli alroy member 8 Jun. 15 30 mar. 20 2/2
peter fechter member 27 feb. 17 23 apr. 20 1/2
we decided that the principles of the remuneration policy were still valid, although some limited recalibration of incentive schemes were made on an exceptional basis to reflect the changes in the objectives and priorities of the executive team made necessary by the pandemic.
the appointment of dimitris raptis as new co-chief executive officer, which was announced in march 2020 and the fact that he took over the sole chief executive role at the end of the year, was a matter that we also had to monitor although parameters which had previously been set out in the remuneration policy meant that the transition did not create any significant issues for us to have to work through.
going forward, i believe that we need to continue to monitor the effectiveness of the remuneration policy and ensure that our approach remains fit for purpose, in particular the long-term components of the policy. therefore, some further adjustments may become necessary and we will consider this possibility during 2021.
given the challenging environment during the pandemic, i am particularly grateful to geoff miller and John whittle, as existing members of the Board and the remuneration committee before my appointment, for helping me understand the previous thinking of the committee in establishing the current remuneration policy. i have appreciated their wisdom and guidance during our discussions this year.
Martin BartyzalChair of the Remuneration Committee25 march 2021
reMUNerATiON rePOrT
Composition of the Committeeduring the year ended 31 december 2020 the remuneration committee comprised three independent non-executive directors at all times. mr martin Bartyzal took over the role of the chair of the committee on 23 april 2020 following the resignation from the Board of mr Bruce Buck. following changes made in the composition of the committee resulting from further Board member changes, since 23 april 2020, apart from mr Bartyzal as chair of the committee, the committee has had as members mr geoff miller and mr John whittle.
responsibilities of the Committeethe remuneration committee has as its remit, amongst other matters, the determination and review of the fees payable to gial, the company’s subsidiary, and the related emoluments of the executive directors and other senior employees of the company who are preference shareholders of gial, and the terms of any performance or incentive plans of gial, including the setting of performance thresholds, the allocation of any such entitlements as between shares and cash and the setting of any vesting periods (in each case, taking such independent advice as it considers appropriate in the circumstances). in addition, the remuneration committee reports at least annually to the Board in relation to its activities and recommendations.
the complete details of the remuneration committee’s formal duties and responsibilities are set out in its terms of reference, which can be found on the company’s website.
Directors’ remuneration Policydirectors’ emoluments comprise a fee or salary-based compensation plus, in the case of the two executive directors, dividends in their capacity as preference shareholders of gial, all in accordance with the investment management agreement signed between the company and gial on 24 July 2013, with the latest amendments made in february 2021.
Directors’ emolumentsthe emoluments of the directors is a matter for the Board, considering the recommendations received from the remuneration committee. no director may be involved in any decisions as to his own emoluments.
during the year ended 31 december 2020 the emoluments of the directors were as follows:
amounts in €‘000
company subsidiaries1
fees salarypension
allowance total dividends2
totalemoluments3
ioannis papalekas (until 16 march 2020) – 208 – 208 – 208dimitris raptis – 230 17 247 607 854geoff miller 261 – – – – 261eli alroy (until 30 march 2020) 50 – – – – 50John whittle 121 – – – – 121andreea petreanu 87 – – – – 87norbert sasse – – – – – –peter fechter (until 23 april 2020) 23 – – – – 23george muchanya (until 23 april 2020) – – – – – –richard van vliet 50 – – – – 50Bruce Buck (until 23 april 2020) 35 – – – – 35martin Bartyzal (from 23 april 2020) 30 – – – – 30david maimon (from 28 may 2020) – – – – – –
657 438 17 455 607 1,719
1. gial and globalworth Holdings cyprus limited for ioannis papalekas and gial for dimitris raptis.2. dimitris raptis receives dividends in his capacity as preference shareholder of gial, the amount of which depends on the performance and profitability of gial.
gial provides investment advisory services to the company and is rewarded for the services it provides pursuant to the investment management agreement signed on 24 July 2013, as amended from time to time (the “ima”). for dimitris raptis dividends include an accrual of €0.568 million (€0.343 million to be settled in cash and €0.225 million by the transfer of shares of the company).
3. the amounts indicated represent accrued amounts corresponding to the period during which the beneficiaries were members of the Board.
out of the amounts disclosed in the above table €0.698 million was payable to the directors as of 31 december 2020.

107106 Globalworth annual report and financial statements 2020Globalworth annual report and financial statements 2020
overview strategic report portfolio review GOverNANCe financial statements additional information
during the year ended 31 december 2019 the emoluments of the directors were as follows:
amounts in €‘000
company subsidiaries1
fees salary
subsidiaries1
pensionallowance total dividends2
totalemoluments
(excl. planterminationdividends)
planterminationdividends3
totalemoluments4
ioannis papalekas – 996 50 1,046 642 1,688 34,400 36,088dimitris raptis – 307 25 332 421 753 13,000 13,753geoff miller 225 – – – – 225 – 225eli alroy 200 – – – – 200 – 200John whittle 107 – – – – 107 – 107akbar rafiq (until 13 may 2019) – – – – – – – –alexis atteslis (until 11 march 2019) – – – – – – – –andreea petreanu 79 – – – – 79 – 79norbert sasse – – – – – – – –peter fechter 68 – – – – 68 – 68george muchanya – – – – – – – –richard van vliet 68 – – – – 68 – 68Bruce Buck 105 – – – – 105 – 105
852 1,303 75 1,378 1,063 3,293 47,400 50,693
1. gial and aserat properties srl for ioannis papalekas, gial and globalworth Holding Bv for dimitris raptis.2. the executive directors receive dividends in their capacity as preference shareholders of gial, the amount of which depends on the performance and profitability of
gial. gial provides investment advisory services to the company and is rewarded for the services it provides pursuant to the ima. for ioannis papalekas dividends include an accrual of €0.64 million (€0.32 million to be settled in cash and €0.32 million by the transfer of shares of the company); and for dimitris raptis dividends include an accrual of €0.32 million (€0.16 million to be settled in cash and €0.16 million by the transfer of shares of the company).
3. 50% of the plan termination dividends, awarded to the executive directors by gial in their capacity as preference shareholders of gial, were settled in cash and 50% were settled in the form of shares of the company.
4. the amounts indicated represent accrued amounts corresponding to the period during which the beneficiaries were members of the Board. out of the amounts disclosed in the above table €0.96 million was payable to the directors as of 31 december 2019. an additional amount of €7 thousand was due to the directors as of 31 december 2019 for out-of-pocket expenses incurred, which was settled subsequent to 31 december 2019.
Zakiono and Director warrant Agreements please refer to page 85 of the annual report for details on the Zakiono and directors’ warrant agreements concluded on 24 July 2013.
Summary of Group remuneration Policythe group remuneration policy, which has been in place since July 2019, is designed to achieve an appropriate balance between fixed and variable remuneration, and between variable remuneration based on short-term and longer-term performance. fixed remuneration includes base salary and benefits. variable remuneration includes an annual bonus, a significant portion of which will ordinarily be paid in deferred shares pursuant to a deferred annual bonus plan (“daBp”), and performance share plan awards made under a long-term incentive plan (“ltip”).
the group remuneration policy is intended to align with the strategy and business of the group and reflects the importance of generating a growing and sustainable cash flow and achieving value creation through the active management of real estate assets, including those under development.
the key objectives of the group remuneration policy remain to strongly align group employee and shareholder interests; to underpin an effective pay-for-performance culture; support the retention, motivation and recruitment of talented people; and to encourage company shareholding ownership amongst group employees.
the committee oversees the implementation of this policy and seeks to ensure that the investment manager and senior employees are fairly rewarded for globalworth’s performance over the short and longer term. a significant proportion of the potential total remuneration is therefore performance-related.
the following contains a summary of the key terms of the group remuneration policy, including the daBp and the ltip.
Base SalaryBase salaries are reviewed annually with any increases taking effect from 1 January. the level of increases take account of each senior employee’s experience, service to the company, external market benchmarks, and the importance of that person to the business. the performance of the company, salary increases awarded to the workforce as a whole, and external indicators such as inflation will also be taken into account.
Annual Bonus Planthe investment manager and selected senior employees are eligible to participate in an annual bonus plan. the annual bonus plan for participants in the scheme is paid through a combination of cash and deferred shares through the daBp.
participation in the annual bonus plan from year to year is at the sole discretion of the committee, although the investment manager and most senior employees would be expected to participate each year. the maximum award will not exceed 150% of annual salary, target performance will not exceed 75% of annual salary and threshold performance will not exceed 37.5% of annual salary.
the annual bonus plan provides that 50% of any bonus earned will be in deferred company shares under the daBp. awards under the daBp will vest in three instalments on the first, second and third anniversaries of the date of grant. participants will be entitled to receive dividend equivalents on the unvested shares until, and payable on or shortly after, they vest.
reMUNerATiON rePOrT continued
in general, the committee sets performance targets for the annual bonus at the start of each financial year to ensure performance measures and weightings are appropriate and support the business strategy and performance targets are primarily based upon Key performance indicators, although there may also be elements subject to other measures and factors at the discretion of the committee.
Long-term incentive Planthe ltip provides the long-term incentive arrangement for the investment manager and selected senior employees (the “ltip participants”).
under the ltip, it is intended that performance share awards are granted on an annual basis either in the form of company shares without cost to the ltip participant or nil (or nominal) cost options to subscribe to company shares.
annual awards are determined by reference to that number of shares which equals in value to a maximum of 100% of salary for employees who are not directors of the company and 150% of salary for directors of the company.
awards vest three years from the date of grant of the award (or upon the assessment of performance conditions if later) subject to the ltip participant’s continued service and the extent to which the performance conditions specified for the awards are satisfied. the committee has the discretion in certain circumstances to grant and/or settle an award in cash.
performance conditions applying to the first awards were based 50% on relative total shareholder return (“tsr”) and 50% on growth in total accounting return per share (“tar”) (defined as the growth in the company’s epra net asset value per share and dividend distributions per share paid over the three-year ltip performance period). the achievement of a threshold level of performance will result in vesting of 25% of the maximum award. full vesting will occur for equalling or exceeding the maximum performance target. a target level of performance may also be set between the threshold and maximum performance targets. the level of vesting for the achievement of target performance would take account of the difficulty of achieving target performance. straight-line vesting will take place for performance between threshold, target, and maximum.
dividend equivalents will be paid in relation to shares which vest until the normal vesting date or, if there is one, until the end of the holding period.
on 5 July 2019 the Board resolved to grant long term fees to the investment adviser under the investment management agreement between the company and gial of a maximum amount of c.€3.0 million, in the form of a total of 342,184 ltip shares at a price of €8.85 per share. in turn, the investment adviser resolved to grant the following maximum number of ltip shares to the executive director:
executive director award vesting basis
maximum number of
shares
end of performance
period
Dimitris Raptis 3 year cumulative tar & tsr performance
76,271 31 dec. 2021
the actual long term fees in the form of ltip shares to be awarded to the investment adviser and consequently the actual number of shares to be awarded by the investment adviser to the executive director and other executives of the investment adviser will be determined following the end of the performance period and after the publication of the tar of the company for the year ending 31 december 2021, as well as the availability of the tsr data for all the companies in 3 comparator groups.
Martin BartyzalChair of the Remuneration Committee25 march 2021

GoVErNaNCEStratEGIC rEPortoVErVIEw FINaNCIal StatEMENtS aDDItIoNal INForMatIoNPortFolIo rEVIEw
109108 Globalworth annual report and financial statements 2020Globalworth annual report and financial statements 2020
FINANCIAL STATEMENTS
consolidated financial statements 110notes to the financial statements 114independent auditor’s report to the members of globalworth real estate investments limited 163

GoVErNaNCEStratEGIC rEPortoVErVIEw FINaNCIal StatEMENtS aDDItIoNal INForMatIoNPortFolIo rEVIEw
111110 Globalworth annual report and financial statements 2020Globalworth annual report and financial statements 2020
CONSOLiDATeD STATeMeNT OF FiNANCiAL POSiTiONas at 31 decemBer 2020
CONSOLiDATeD STATeMeNT OF COMPreHeNSive iNCOMefor tHe Year ended 31 decemBer 2020
Note
31 December2020
€’000
31 December2019
€’000
Revenue 7 223,309 222,246Operating expenses 8 (66,031) (74,534)
Net operating income 157,278 147,712
Administrative expenses 9 (17,986) (19,302)Acquisition costs (2,689) (240)Fair value (loss)/gain on investment property 3 (116,153) 117,718Share-based payment expense 24 (1,071) (496)Depreciation on other long-term assets (466) (406)Other expenses (2,565) (7,192)Other income 494 932Gain resulting from acquisition of joint venture as subsidiary – 2,864Foreign exchange loss (395) (888)(Loss)/gain from fair value of financial instruments at fair value through profit or
loss 16 (47) 1,898
(140,878) 94,888
Profit before net financing cost 16,400 242,600
Net financing costFinance cost 10 (51,140) (45,050)Finance income 2,383 2,416
(48,757) (42,634)
Share of profit of equity-accounted investments in joint ventures 27 1,897 7,750
(Loss)/profit before tax (30,460) 207,716
Income tax expense 11 (16,335) (31,535)
(Loss)/profit for the year (46,795) 176,181
Other comprehensive income – –
Total comprehensive income (46,795) 176,181
(Loss)/profit attributable to: (46,795) 176,181
– Equity holders of the Company (46,795) 170,177– Non-controlling interests – 6,004
Cents Cents
earnings per share
– Basic 12 (21) 93– Diluted 12 (21) 93
Note2020
€’0002019
€’000
ASSeTSNon-current assetsInvestment property 3 3,013,014 3,048,955Goodwill 26 12,349 12,349Advances for investment property 5 4,215 32,440Investments in joint ventures 27 28,358 17,857Equity investments 17 10,369 9,840Other long-term assets 2,148 1,493Prepayments 432 619Financial assets at fair value through profit or loss 16 – 3,098Deferred tax asset 11 786 2,869
3,071,671 3,129,520
Current assetsFinancial assets at fair value through profit or loss 16 7,695 20,487Trade and other receivables 18 16,025 28,963Contract assets 2,819 5,257Guarantees retained by tenants 894 858Income tax receivable 931 255Prepayments 2,227 4,653Cash and cash equivalents 19 527,801 291,694
558,392 352,167
Total assets 3,630,063 3,481,687
eQUiTY AND LiABiLiTieSIssued share capital 21 1,704,374 1,704,374Treasury shares 24.5 (12,977) (8,379)Share-based payment reserve 24 6,184 5,571Retained earnings 57,783 213,101
equity attributable to ordinary equity holders of the Company 1,755,364 1,914,667
Non-current liabilitiesInterest-bearing loans and borrowings 14 1,604,043 1,299,616Deferred tax liability 11 144,843 134,302Lease liabilities 3.2 27,324 30,190Guarantees retained from contractors 2,235 1,074Deposits from tenants 3,449 3,460Trade and other payables 692 1,316
1,782,586 1,469,958
Current liabilitiesInterest-bearing loans and borrowings 14 26,051 24,304Guarantees retained from contractors 4,032 4,754Trade and other payables 15 40,209 44,633Contract liability 2,088 1,824Other current financial liabilities 20.3 875 1,498Current portion of lease liabilities 3.2 1,765 1,887Deposits from tenants 16,245 15,988Provision for tenant lease incentives 46 1,353Income tax payable 802 821
92,113 97,062
Total equity and liabilities 3,630,063 3,481,687
The financial statements were approved by the Board of Directors on 25 March 2021 and were signed on its behalf by:
John whittleDirector

GoVErNaNCEStratEGIC rEPortoVErVIEw FINaNCIal StatEMENtS aDDItIoNal INForMatIoNPortFolIo rEVIEw
113112 Globalworth annual report and financial statements 2020Globalworth annual report and financial statements 2020
CONSOLiDATeD STATeMeNT OF CHANGeS iN eQUiTY for tHe Year ended 31 decemBer 2020
CONSOLiDATeD STATeMeNT OF CASH FLOwSfor tHe Year ended 31 decemBer 2020
Note2020
€’0002019
€’000
(Loss)/profit before tax (30,460) 207,716Adjustments to reconcile profit before tax to net cash flowsFair value loss / (gain) on investment property 3 116,153 (117,718)Loss on sale of investment property 387 1,576Share-based payment expense 24 1,071 496Depreciation on other long-term assets 466 406Net movement in allowance for doubtful debts 20.2 1,152 (156)Foreign exchange loss 395 888Loss/(gain) from fair valuation of financial instrument 16 47 (1,898)Gain resulting from acquisition of joint venture as subsidiary 27 – (2,864)Share of profit of equity-accounted joint ventures 27 (1,897) (7,750)Net financing costs 48,757 42,634
Operating profit before changes in working capital 136,071 123,330Decrease/(increase) in trade and other receivables 16,696 (714)(Decrease)/increase in trade and other payables (3,149) 3,966Interest paid (40,958) (38,259)Interest received 1,048 782Income tax paid (4,746) (9,406)Interest received from joint ventures 199 627
Cash flows from operating activities 105,161 80,326
investing activitiesExpenditure on investment property completed and under development orrefurbishment (77,028) (92,784)Payment for land acquisitions – (925)Advances for investment property 5 – (25,040)Refund of advances given for property acquisition 24,000 –Payments for acquisition of investment property – (233,952)Proceeds from sale of investment property 2,870 5,773Investment in financial assets at fair value through profit or loss 16 (671) (5,980)Proceeds from sale of financial assets through profit and loss 16,517 –Payments for equity investments 17 (529) (1,003)Investment in and loans given to joint ventures 27 (16,555) (16,719)Proceeds from joint ventures for loans given 27 8,485 4,389Payment for the acquisition of remaining 50% stake in joint venture 27 (2,000) (8,131)Payment for purchase of other long-term assets (1,123) (588)
Cash flows used in investing activities (46,034) (374,960)
Financing activitiesProceeds from issuance of share capital 21 – 611,921Payment of transaction costs on issuance of shares 21 – (12,828)Purchase of own shares 24.5.1 (8,345) (7,295)Payments for the acquisition of shares from non-controlling interest – (33,491)Proceeds from interest-bearing loans and borrowings 14 737,353 64,545Payments of interest-bearing loans and borrowings 14 (430,200) (129,094)Payment for performance incentive scheme termination 24.4 – (25,813)Payment of interim dividend to equity holders of the Company 22 (108,324) (93,799)Payment for lease liability obligations 3.2 (1,771) (1,601)Payment of dividend to non-controlling interests in the subsidiary – (10,731)Payment of bank loan arrangement fees and other financing costs (11,614) (3,902)Change in long term restricted cash reserve 19 – 1,250
Cash flows from financing activities 177,099 359,162
Net increase in cash and cash equivalents 236,226 64,528Effect of exchange rate fluctuations on cash and bank deposits held (119) (1,111)Cash and cash equivalents at the beginning of the year 19 290,694 227,277
Cash and cash equivalents at the end of the year1 19 526,801 290,694
1 Net of the €1.0 million restricted cash reserve (31 December 2019: €1.0 million), see note 19.
Equity attributable to equity holders of the Company
Note
Issued share capital€’000
Treasury shares€’000
Share-based payment
reserve€’000
Retained earnings
€’000Total
€’000
Non- controlling
interests€’000
Total Equity€’000
As at 1 January 2019 897,314 (842) 2,117 186,326 1,084,915 212,407 1,297,322
Issuance of shares subscribed in cash 611,921 – – – 611,921 – 611,921
Transaction costs on issuance of shares (12,828) – – – (12,828) – (12,828)
Shares issued to the Executive Directors and other senior management employees 3,467 (2,564) (818) – 85 – 85
Interim dividends – – 128 (93,927) (93,799) – (93,799)Share based payment expense
under the subsidiaries’ employees share award plan – – 353 – 353 – 353
Shares vested under the subsidiaries’ employees share award plan – 784 (784) – – – –
Shares purchased in cash by the Company – (7,295) – – (7,295) – (7,295)
Shares issued for share swap with non-controlling interest holders 179,395 – – 5,840 185,235 (185,235) –
Shares acquired in cash from non-controlling interest holders in the subsidiary – – – (315) (315) (33,176) (33,491)
Performance incentive scheme termination 25,105 1,538 2,544 (55,000) (25,813) – (25,813)
Deferred annual bonus plan reserve for the year – – 1,888 – 1,888 – 1,888
Long-term incentive plan reserve for the year – – 143 – 143 – 143
Total comprehensive income for the year – – – 170,177 170,177 6,004 176,181
As at 31 December 2019 1,704,374 (8,379) 5,571 213,101 1,914,667 – 1,914,667
Shares issued to the Executive Directors and other senior management employees 24.2 – 392 (392) – – – –
Interim dividends 22 – 271 (72) (108,523) (108,324) – (108,324)Share based payment expense
under the subsidiaries’ employees share award plan 24.3 – – 1,071 – 1,071 – 1,071
Shares vested under the subsidiaries’ employees share award plan 24.3 – 540 (540) – – – –
Shares purchased with cash by the Company 24.5.1 – (8,345) – – (8,345) – (8,345)
Cash-based portion of deferred annual bonus plan converted to deferred shares settlement 24.4.1.2 – – 1,025 – 1,025 – 1,025
Deferred annual bonus plan reserve for the year 24.4.1 – – 2,065 – 2,065 – 2,065
Shares vested under the deferred annual bonus incentive plan 24.4.2 – 2,544 (2,544) – – – –
Total comprehensive income for the year – – – (46,795) (46,795) – (46,795)
As at 31 December 2020 1,704,374 (12,977) 6,184 57,783 1,755,364 – 1,755,364

GoVErNaNCEStratEGIC rEPortoVErVIEw FINaNCIal StatEMENtS aDDItIoNal INForMatIoNPortFolIo rEVIEw
115114 Globalworth annual report and financial statements 2020Globalworth annual report and financial statements 2020
NOTeS TO THe CONSOLiDATeD FiNANCiAL STATeMeNTSsection i: Basis of preparation
This section contains the Group’s significant accounting policies that relate to the consolidated financial statements as a whole. Significant accounting policies and related management’s estimates, judgements and assumptions in the application of those policies specific to a particular note are included with that note. Accounting policies relating to non-material items are not included in these financial statements.
1 Basis of PreparationCorporate informationGlobalworth Real Estate Investments Limited (“the Company” or “Globalworth”) is a company with liability limited by shares and incorporated in Guernsey on 14 February 2013, with registered number 56250. The registered office of the Company is at Anson Court, La Route des Camps, St Martin, Guernsey GY4 6AD. Globalworth, being a real estate Company, has had its ordinary shares admitted to trading on AIM (Alternative Investment Market of the London Stock Exchange) under the ticker “GWI” since 2013.
The Company’s Eurobonds have been admitted to trading on the Official List of the Irish Stock Exchange in June 2017, March 2018 and July 2020, respectively. In addition, the Company’s Eurobonds maturing in June 2022 and March 2025 have been admitted to trading on the Bucharest Stock Exchange in July 2017 and May 2018, respectively. The Group’s principal activities and nature of its operations are set out in the Strategic Report section of the Annual Report.
Basis of Preparation and ComplianceThese consolidated financial statements have been prepared in conformity with the International Financial Reporting Standards (“IFRS"), as adopted by the European Union (“EU”), give a true and fair view of the state of affairs at 31 December 2020 and of the profit or loss for the year then ended, and are in compliance with the Companies (Guernsey) Law 2008, as amended.
These consolidated financial statements (“financial statements”) have been prepared on a historical cost basis, except for investment property, financial assets at fair value through other comprehensive income and financial assets at fair value through profit or loss which are measured at fair value.
The significant accounting policies adopted are set out in the relevant notes to the financial statements and consistently applied throughout the periods presented except for the new and amended IFRS (see note 31), which were adopted on 1 January 2020. These consolidated financial statements are prepared in Euro (“EUR" or “€”), rounded to the nearest thousand (‘000) unless otherwise indicated, being the functional currency and presentation currency of the Company.
These financial statements are prepared on a going concern basis. The Directors believe that it is appropriate to adopt the going concern basis in preparing the financial statements. The Directors based their assessment on the Group’s detailed cash flow projections for the period up to 30 June 2022. These projections take into account the current very significant available cash resources of the Group of c.€528 million, the latest contracted rental income, anticipated additional rental income from new possible lease agreements during the period covered by the projections, modification of existing lease contracts due to COVID-19, as well as repayment of contracted debt financing, CAPEX, and other commitments. The Directors have also considered potential stress-test scenarios that could exert a downward pressure on projected cash flows and consequently affect debt covenant calculations as a result of factors outside the Group’s control, resulting from the COVID-19 pandemic and its potential economic effects in the countries the Group operates. The projections and related sensitivity analysis carried out show that, in the period up to 30 June 2022, the Company anticipates having sufficient liquid resources to continue to fund ongoing operations and asset development without the need to raise any additional debt or equity financing, or the need to reschedule existing debt facilities or other commitments. Further details on the Company’s response to the COVID-19 pandemic can be found in other sections of the Annual Report.
Basis of ConsolidationThese consolidated financial statements comprise the financial statements of the Company and its subsidiaries (“the Group”) as of and for the year ended 31 December. Subsidiaries are fully consolidated (refer to note 28) from the date of acquisition, being the date on which the Group obtains control, and continues to be consolidated until the date when such control ceases. The financial statements of the subsidiaries are prepared for the period from the date of obtaining control to 31 December, using consistent accounting policies. All intra-group balances, transactions and unrealised gains and losses resulting from intra-group transactions are eliminated in full. Non-controlling interest represents the portion of profit or loss and net assets not held by the Group and are presented separately in the income statement and within equity in the consolidated statement of financial position, separately from net assets and profit and loss attributable to equity holders of the Company.
Foreign Currency Transactions and BalancesForeign currency transactions during the year are initially recorded in the functional currency at the exchange rates approximating those ruling on the date of the transaction. Monetary assets and liabilities denominated in foreign currencies other than functional currency of the Company and its subsidiaries are retranslated at the rates of exchange prevailing on the statement of financial position date. Gains and losses on translation are taken to profit and loss. Non-monetary items that are measured in terms of historical cost in a foreign currency are translated using the exchange rates as at the dates of the initial transactions. Non-monetary items measured at fair value in a foreign currency are translated using the exchange rates at the date when the fair value was determined.
2 Critical Accounting Judgements, estimates and AssumptionsThe preparation of consolidated financial statements in conformity with IFRS requires management to make certain judgements, estimates and assumptions that affect reported amounts of revenue, expenses, assets and liabilities, and the accompanying disclosures and the disclosures of contingent liabilities.
Selection of Functional CurrencyThe Company and its subsidiaries used their judgement, based on the criteria outlined in IAS 21 “The Effects of Changes in Foreign Exchanges Rates”, and determined that the functional currency of all the entities is the EUR. In determining the functional currency consideration is given to the denomination of the major cash flows of the entity e.g., revenues and financing.
As a consequence, the Company uses EURO (€) as the functional currency, rather than the local currency Romanian Lei (RON) for the subsidiaries incorporated in Romania, Polish Zloty (“PLN") for the subsidiaries in Poland and Pounds Sterling (“GBP") for the Company and the subsidiary incorporated in Guernsey.
Judgements were made in assessing the impact of COVID-19 on the financial statements. The potential areas which may have been potentially affected by COVID-19 are identified throughout the notes to the financial statements.
Further additional critical accounting judgements, estimates and assumptions are disclosed in the following notes to the financial statements. – Investment Property, see note 3 and Fair value measurement and related estimates and judgements, see note 4; – Commitments (operating leases commitments – Group as lessor), see note 6; – Taxation, see note 11; – Equity investments, see note 17; – Financial assets at fair value through profit or loss, see note 16; – Trade and other receivables, see note 18; – Share-based payment reserve, see note 24; – Goodwill, see note 26; – Investment in Joint Ventures, see note 27; and – Investment in Subsidiaries, see note 28.
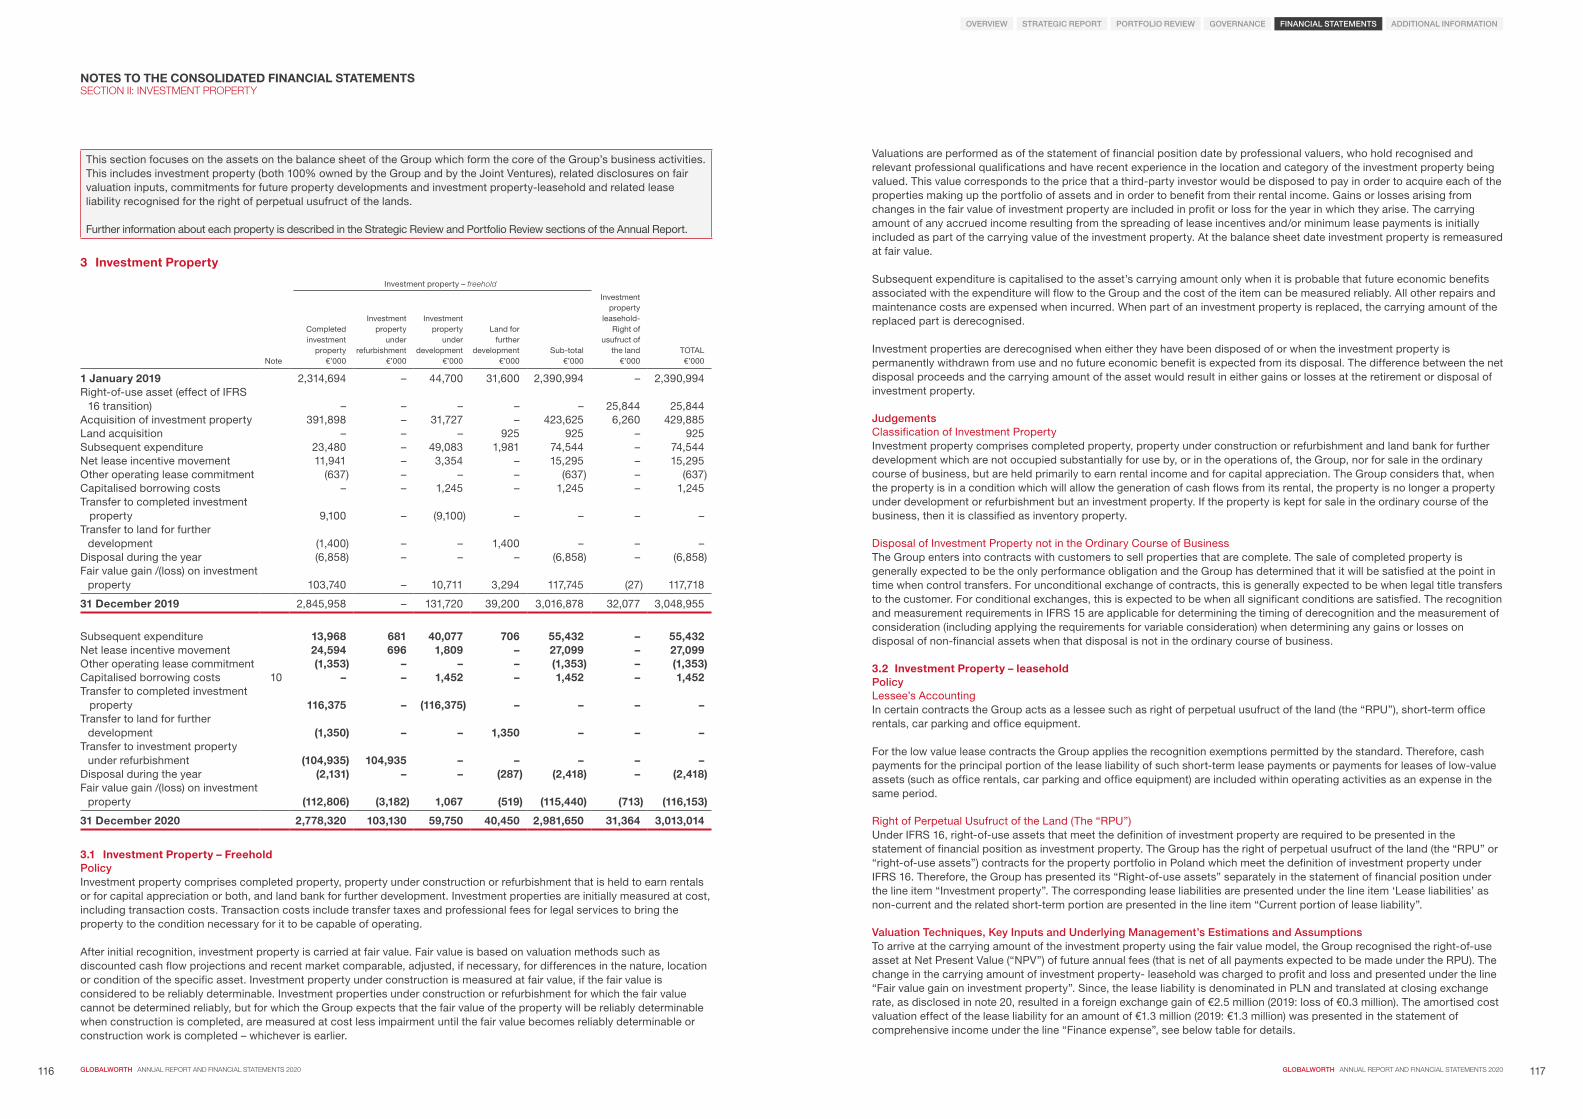
GoVErNaNCEStratEGIC rEPortoVErVIEw FINaNCIal StatEMENtS aDDItIoNal INForMatIoNPortFolIo rEVIEw
117116 Globalworth annual report and financial statements 2020Globalworth annual report and financial statements 2020
NOTeS TO THe CONSOLiDATeD FiNANCiAL STATeMeNTSsection ii: investment propertY
This section focuses on the assets on the balance sheet of the Group which form the core of the Group’s business activities. This includes investment property (both 100% owned by the Group and by the Joint Ventures), related disclosures on fair valuation inputs, commitments for future property developments and investment property-leasehold and related lease liability recognised for the right of perpetual usufruct of the lands.
Further information about each property is described in the Strategic Review and Portfolio Review sections of the Annual Report.
3 investment Property
Note
Investment property – freehold
Completed investment
property€’000
Investment property
under refurbishment
€’000
Investment property
under development
€’000
Land for further
development€’000
Sub-total€’000
Investment property
leasehold- Right of
usufruct of the land
€’000TOTAL€’000
1 January 2019 2,314,694 – 44,700 31,600 2,390,994 – 2,390,994Right-of-use asset (effect of IFRS
16 transition) – – – – – 25,844 25,844Acquisition of investment property 391,898 – 31,727 – 423,625 6,260 429,885Land acquisition – – – 925 925 – 925Subsequent expenditure 23,480 – 49,083 1,981 74,544 – 74,544Net lease incentive movement 11,941 – 3,354 – 15,295 – 15,295Other operating lease commitment (637) – – – (637) – (637)Capitalised borrowing costs – – 1,245 – 1,245 – 1,245Transfer to completed investment property 9,100 – (9,100) – – – –Transfer to land for further
development (1,400) – – 1,400 – – –Disposal during the year (6,858) – – – (6,858) – (6,858)Fair value gain /(loss) on investment
property 103,740 – 10,711 3,294 117,745 (27) 117,718
31 December 2019 2,845,958 – 131,720 39,200 3,016,878 32,077 3,048,955
Subsequent expenditure 13,968 681 40,077 706 55,432 – 55,432Net lease incentive movement 24,594 696 1,809 – 27,099 – 27,099Other operating lease commitment (1,353) – – – (1,353) – (1,353)Capitalised borrowing costs 10 – – 1,452 – 1,452 – 1,452Transfer to completed investment property 116,375 – (116,375) – – – –Transfer to land for further
development (1,350) – – 1,350 – – –Transfer to investment property
under refurbishment (104,935) 104,935 – – – – –Disposal during the year (2,131) – – (287) (2,418) – (2,418)Fair value gain /(loss) on investment
property (112,806) (3,182) 1,067 (519) (115,440) (713) (116,153)
31 December 2020 2,778,320 103,130 59,750 40,450 2,981,650 31,364 3,013,014
3.1 investment Property – FreeholdPolicyInvestment property comprises completed property, property under construction or refurbishment that is held to earn rentals or for capital appreciation or both, and land bank for further development. Investment properties are initially measured at cost, including transaction costs. Transaction costs include transfer taxes and professional fees for legal services to bring the property to the condition necessary for it to be capable of operating.
After initial recognition, investment property is carried at fair value. Fair value is based on valuation methods such as discounted cash flow projections and recent market comparable, adjusted, if necessary, for differences in the nature, location or condition of the specific asset. Investment property under construction is measured at fair value, if the fair value is considered to be reliably determinable. Investment properties under construction or refurbishment for which the fair value cannot be determined reliably, but for which the Group expects that the fair value of the property will be reliably determinable when construction is completed, are measured at cost less impairment until the fair value becomes reliably determinable or construction work is completed – whichever is earlier.
Valuations are performed as of the statement of financial position date by professional valuers, who hold recognised and relevant professional qualifications and have recent experience in the location and category of the investment property being valued. This value corresponds to the price that a third-party investor would be disposed to pay in order to acquire each of the properties making up the portfolio of assets and in order to benefit from their rental income. Gains or losses arising from changes in the fair value of investment property are included in profit or loss for the year in which they arise. The carrying amount of any accrued income resulting from the spreading of lease incentives and/or minimum lease payments is initially included as part of the carrying value of the investment property. At the balance sheet date investment property is remeasured at fair value.
Subsequent expenditure is capitalised to the asset’s carrying amount only when it is probable that future economic benefits associated with the expenditure will flow to the Group and the cost of the item can be measured reliably. All other repairs and maintenance costs are expensed when incurred. When part of an investment property is replaced, the carrying amount of the replaced part is derecognised.
Investment properties are derecognised when either they have been disposed of or when the investment property is permanently withdrawn from use and no future economic benefit is expected from its disposal. The difference between the net disposal proceeds and the carrying amount of the asset would result in either gains or losses at the retirement or disposal of investment property.
JudgementsClassification of Investment PropertyInvestment property comprises completed property, property under construction or refurbishment and land bank for further development which are not occupied substantially for use by, or in the operations of, the Group, nor for sale in the ordinary course of business, but are held primarily to earn rental income and for capital appreciation. The Group considers that, when the property is in a condition which will allow the generation of cash flows from its rental, the property is no longer a property under development or refurbishment but an investment property. If the property is kept for sale in the ordinary course of the business, then it is classified as inventory property.
Disposal of Investment Property not in the Ordinary Course of BusinessThe Group enters into contracts with customers to sell properties that are complete. The sale of completed property is generally expected to be the only performance obligation and the Group has determined that it will be satisfied at the point in time when control transfers. For unconditional exchange of contracts, this is generally expected to be when legal title transfers to the customer. For conditional exchanges, this is expected to be when all significant conditions are satisfied. The recognition and measurement requirements in IFRS 15 are applicable for determining the timing of derecognition and the measurement of consideration (including applying the requirements for variable consideration) when determining any gains or losses on disposal of non-financial assets when that disposal is not in the ordinary course of business.
3.2 investment Property – leaseholdPolicyLessee’s AccountingIn certain contracts the Group acts as a lessee such as right of perpetual usufruct of the land (the “RPU”), short-term office rentals, car parking and office equipment.
For the low value lease contracts the Group applies the recognition exemptions permitted by the standard. Therefore, cash payments for the principal portion of the lease liability of such short-term lease payments or payments for leases of low-value assets (such as office rentals, car parking and office equipment) are included within operating activities as an expense in the same period.
Right of Perpetual Usufruct of the Land (The “RPU”)Under IFRS 16, right-of-use assets that meet the definition of investment property are required to be presented in the statement of financial position as investment property. The Group has the right of perpetual usufruct of the land (the “RPU” or “right-of-use assets”) contracts for the property portfolio in Poland which meet the definition of investment property under IFRS 16. Therefore, the Group has presented its “Right-of-use assets” separately in the statement of financial position under the line item “Investment property”. The corresponding lease liabilities are presented under the line item ‘Lease liabilities’ as non-current and the related short-term portion are presented in the line item “Current portion of lease liability”.
Valuation techniques, Key Inputs and Underlying Management’s Estimations and assumptionsTo arrive at the carrying amount of the investment property using the fair value model, the Group recognised the right-of-use asset at Net Present Value (“NPV”) of future annual fees (that is net of all payments expected to be made under the RPU). The change in the carrying amount of investment property- leasehold was charged to profit and loss and presented under the line “Fair value gain on investment property”. Since, the lease liability is denominated in PLN and translated at closing exchange rate, as disclosed in note 20, resulted in a foreign exchange gain of €2.5 million (2019: loss of €0.3 million). The amortised cost valuation effect of the lease liability for an amount of €1.3 million (2019: €1.3 million) was presented in the statement of comprehensive income under the line “Finance expense”, see below table for details.

GoVErNaNCEStratEGIC rEPortoVErVIEw FINaNCIal StatEMENtS aDDItIoNal INForMatIoNPortFolIo rEVIEw
119118 Globalworth annual report and financial statements 2020Globalworth annual report and financial statements 2020
NOTeS TO THe CONSOLiDATeD FiNANCiAL STATeMeNTS continuedsection ii: investment propertY
investment Property Measured at Fair valueThe Group’s investment property portfolio for Romania was valued by Colliers Valuation and Advisory SRL and Cushman & Wakefield LLP and for Poland by Knight Frank Sp. z o.o. and CBRE Sp. z o.o. All independent professionally qualified valuers hold a recognised relevant professional qualification and have recent experience in the locations and segments of the investment properties valued using recognised valuation techniques.
The current economic environment has been impacted by the Novel Coronavirus (COVID-19) outbreak which was declared as a “Global Pandemic” by the World Health Organization on 11 March 2020. Since then, the effects of the COVID-19 outbreak on the financial markets and the overall business environment, including the real estate market, have begun to be felt globally, resulting in increased uncertainty, the full extents of which are difficult to quantify at this time.
As a consequence, the third-party professional valuers, although performing their valuations using an “open market approach” methodology as at 31 December 2020, have included a “material uncertainty clause” in their reports in order for their appraisals to be interpreted, given the present context of uncertainty, with a higher degree of caution than would normally be the case. Globalworth, independently values its entire portfolio of real estate properties twice a year (June and December), and is already in compliance (by having a third-party valuation twice a year) with the professional valuers, recommendation of performing valuations of a company’s real estate properties on a more frequent basis in periods of higher uncertainty.
Our Property valuation Approach and ProcessThe Group’s investment department includes a team that reviews twice in a financial year the valuations performed by the independent valuers for financial reporting purposes. For each independent valuation performed, the investment team along with the finance team: – verifies all major inputs to the independent valuation report; – assesses property valuation movements when compared to the initial valuation report at acquisition or latest period end
valuation report; and – holds discussions with the independent valuer.
The fair value hierarchy levels are specified in accordance with IFRS 13 Fair Value Measurement. Some of the inputs to the valuations are defined as “unobservable” by IFRS 13 and these are analysed in the tables below. Any change in valuation technique or fair value hierarchy (between Level 1, Level 2 and Level 3) is analysed at each reporting date or as of the date of the event or variation in the circumstances that caused the change. As of 31 December 2020 (2019: same) the values of all investment properties were classified as Level 3 fair value hierarchy under IFRS 13 and there were no transfers from or to Level 3 from Level 1 and Level 2.
valuation Techniques, Key inputs and Underlying Management’s estimations and AssumptionsProperty valuations are inherently subjective as they are made on the basis of assumptions made by the valuer. Valuation techniques comprise the discounted cash flows, the sales comparison approach and the residual value method.
The Group has based its assumptions and estimates on the parameters available when the consolidated financial statements were prepared, including the amendments or possible amendments of the current lease contracts due to COVID-19, delays to non-committed capital expenditure, cost-cutting initiatives and delays in construction activity. Consideration was also given to the possible impact of the stay at home and social distancing measures imposed by governments in countries in which it operates. The key assumptions concern the future and other key sources of estimation uncertainty at the reporting date, that have a significant risk of causing a material adjustment to the carrying amounts of assets and liabilities within the next financial year. However, all such assumptions or estimates are sensitive to change due to the current market environment in light of COVID-19. Such uncertainty is reflected in the assumptions used for the valuation and the Group disclosed below the sensitivity to different key inputs to overall valuation.
3 investment Property continued3.2 investment Property – Leasehold continuedThe NPV of right-of-use assets in order to determine the fair value of investment property- leasehold was calculated based on following key inputs:
Key inputs to determine the present value 31 December
202031 December
2019
Gross operating lease commitments (€’000) 128,179 139,712Remaining individual lease term (years) 69-86 70-87Number of properties under RPU 16 16Discount rate (%) 5.77 5.77
investment property – leasehold
31 December2020
€’000
31 December2019
€’000
Opening balance 32,077 25,844Acquisition of investment property – 6,260Fair value loss on investment property (713) (27)
Closing balance 31,364 32,077
The lease liability is denominated in PLN as disclosed in note 20. The Group measure the lease liability at the present value of the lease payments that are not paid until the financial position date. The lease payments are discounted at 5.77% after deducting from the opening carrying value the annual rental payments of €1.8 million (2019: €1.6 million) and translating at closing exchange rate of 4.6148 (2019: 4.2585) resulted in a foreign exchange gain of €2.5 million (2019: loss of €0.3 million). The interest expense for unwinding effect of the present value of the lease liability for an amount of €1.3 million (2019: €1.3 million) was presented in the statement of comprehensive income under the line “Finance expense”.
Lease liability
31 December2020
€’000
31 December2019
€’000
Opening balance 32,077 25,844Acquisition of investment property – 6,260Payment during the year (1,771) (1,601)Interest expense on lease liability 1,288 1,336Foreign exchange (gain)/loss (2,505) 238
Closing balance 29,089 32,077
- Current portion 1,765 1,887- Non-current portion 27,324 30,190
4 Fair value Measurement and related estimates and JudgementsPolicyAll assets and liabilities for which fair value is measured or disclosed in the financial statements are categorised within the fair value hierarchy, described as follows, based on the lowest level input that is significant to the fair value measurement as a whole: – Level 1 – Quoted (unadjusted) market prices in active markets for identical assets or liabilities. – Level 2 – Valuation techniques for which the lowest level input that is significant to the fair value measurement is directly or
indirectly observable. – Level 3 – Valuation techniques for which the lowest level input that is significant to the fair value measurement is
unobservable.
The Group measures at fair value the investment properties freehold and leasehold (non-financial assets), equity investments (through other comprehensive income) and financial assets at fair value through profit or loss at fair value (recurring) at each statement of financial position date. For financial liabilities, such as interest-bearing loans and borrowings carried at amortised cost using the effective interest rate method, the fair value is disclosed.
For assets and liabilities that are measured in the financial statements at fair value on a recurring basis after initial recognition, the Group determines whether transfers have occurred between levels in the fair value hierarchy by reassessing categorisation (based on the lowest level input that is significant to the fair value measurement as a whole) at the end of each reporting period.
Further information on financial assets such as equity investments and financial assets at fair value through profit and loss can be found in notes 13, 16 and 17.

GoVErNaNCEStratEGIC rEPortoVErVIEw FINaNCIal StatEMENtS aDDItIoNal INForMatIoNPortFolIo rEVIEw
121120 Globalworth annual report and financial statements 2020Globalworth annual report and financial statements 2020
NOTeS TO THe CONSOLiDATeD FiNANCiAL STATeMeNTS continuedsection ii: investment propertY
A quantitative sensitivity analysis, in isolation, of the most sensitive inputs used in the independent valuations performed, as of the statement of financial position date, is set out below:
Investment property Year Country
€0.5 change in rental value per month, per
sqm1
25 bps change in market yield
5% change in Capex
€50 change in sales prices per sqm2
2.5% change in vacancy in Perpetuity3
Increase€’000
Decrease€’000
Increase€’000
Decrease€’000
Increase€’000
Decrease€’000
Increase€’000
Decrease€’000
Increase€’000
Decrease€’000
– Completed 2020 Poland 41,020 (41,140) (64,510) 70,160 – – – – – –2020 romania 33,700 (34,000) (30,900) 33,600 – – 1,900 (1,800) (13,600) 10,200
2019 Poland 43,070 (43,160) (71,630) 78,050 – – – – – – 2019 Romania 30,200 (30,800) (29,500) 32,200 – – 1,900 (1,900) (11,600) 9,800
– Under development
2020 Poland 1,450 (1,450) (1,670) 1,810 (1,530) 1,530 – – – –2020 romania 3,600 (3,600) 1,400 (1,100) (2,700) 2,600 – – – –
2019 Poland 2,780 (2,810) (3,840) 4,150 (2,960) 2,950 – – – – 2019 Romania 3,800 (3,700) (4,700) 5,000 (3,500) 3,600 – – (1,200) 1,000
– Under refurbishment
2020 Poland 3,620 (3,610) (4,720) 5,090 (1,750) 1,750 – – – –
2019 Poland – – – – – – – – – –
– Further development
2020 Poland – – – – – – – – – –2020 romania 2,000 (2,000) (1,800) 2,000 (2,200) 2,200 1,450 (1,600) – –
2019 Poland – – – – – – – – – – 2019 Romania 800 (800) (300) 200 (400) 300 700 (700) – –
1. The quantitative sensitivity analysis was computed as €0.25 change in rental value per month, per sqm for two industrial properties.2. The quantitative sensitivity analysis was computed as €1.5 change in sales price per sqm for two (2019: one) industrial properties.3. The vacancy in perpetuity sensitivity analysis is not followed for the Polish properties portfolio as this factor is considered in the valuation methodology as
part of yields and not a variable in isolation.
Other Disclosures related to investment PropertyInterest-bearing loans and borrowings are secured on investment property, see note 14 for details. Further information about individual properties is disclosed in the Portfolio Review section of the Annual Report.
4.1 investment Properties Owned by Joint ventures
Note
Completed investment
property€’000
Investment property under
development€’000
Land for further development
€’000TOTAL€’000
1 January 2019 69,400 3,200 – 72,600
Acquisition of investment property – – 12,500 12,500Land acquisition – – 4,824 4,824Subsequent expenditure 6,422 4,335 315 11,072Net lease incentive movement 3,937 – – 3,937Capitalised borrowing costs – 56 144 200Transfer to investment property under
development – 2,064 (2,064) –Fair value gain on investment property 3,541 4,245 7,381 15,167Impact of joint venture purchased as subsidiary (83,300) (7,500) – (90,800)
31 December 2019 – 6,400 23,100 29,500
Subsequent expenditure 965 14,600 522 16,087Net lease incentive movement 223 102 – 325Capitalised borrowing costs – 311 – 311Transfer to investment property under
development 24,976 (24,976) – –Fair value gain/(loss) on investment property (364) 3,563 1,778 4,977
31 December 2020 25,800 – 25,400 51,200
Sensitivity analysis on Significant Estimates used in the Valuation of Investment Properties owned by the Joint VentureAs disclosed in note 27, the Group also has investment in two joint ventures where investment properties were valued at fair value under the similar Group accounting policies by Colliers Valuation and Advisory SRL.
4 Fair value Measurement and related estimates and Judgements continuedvaluation Techniques, Key inputs and Underlying Management’s estimations and Assumptions continuedKey information about fair value measurements, valuation technique and significant unobservable inputs (Level 3) used in arriving at the fair value under IFRS 13 are disclosed below:
Class of property
Carrying value
2020€’000
2019€’000
ValuationTechnique Country Input 2020 2019
Completed Investment property
1,497,420 1,619,350 DCF Poland Rent per sqm €11.5–€24 €11.5–€24 Discount rate 4.18%–10.87% 3.52%–10.19%
Exit yield 5.34%–8.50% 5.05%–8.25%1,119,000 1,062,153 DCF Romania Rent per sqm €2.90–€35.00 €2.87–€45.40
102,300 102,900 DC Romania Discount rate 7.50%–8.75% 7.50%–8.50%Exit yield 6.25%–8.00% 6.25%–8.00%
Sub-total 2,718,720 2,784,40359,600 61,555 SC Romania Sales value (sqm) €1,843 €1,831
2,778,320 2,845,958
Investment property under development
9,550 28,020 RM Poland Rent per sqm €13.50 €13.50Discount rate 6.50%-7.64% 6.26%-7.17%
Exit yield 6.50% 6.00%-6.25%Capex (€m) €27.98 €84.35
50,200 32,600 RM Romania Rent per sqm €11.00–€15.00 €11.00–€14.50– 71,100 DCF Romania Discount rate 9.00% 7.75%-9.00%
Exit yield 7.00%-7.75% 6.75%-7.75%Capex (€m) €57.40 €77.40
Investment property under refurbishment
103,130 – RM Poland Rent per sqm €14.00 –Discount rate 4.53%-9.18% –
Exit yield 6.88% –Capex (€m) €29.14 –
Land bank – for further development
17,050 37,800 SC Romania Sales value (sqm) €25.00-2,500 €24.00-2,546Rent per sqm €2.75-16.50 €2.75
23,400 1,400 RM Romania Exit yield 7.00%-8.25% 8.50%
TOTAL 2,981,650 3,016,878
DCF: Discounted Cash Flows, DC: Direct Capitalisation, SC: Sales Comparison, RM: Residual Method.
All classes of property portfolio were categorised as Level 3 under fair value hierarchy. The fair value movement on investment property recognised, as loss, in the income statement includes an amount of €116.2 million (2019: gain of: €117.7 million) for fair value measurements as of the statement of financial position date related to investment properties categorised within Level 3 of the fair value hierarchy. In arriving at estimates of market values as at 31 December 2020 and 2019, the independent valuation experts used their market knowledge and professional judgement and did not rely solely on comparable historical transactions. In these circumstances, there was a greater degree of uncertainty in estimating the market values of investment properties than would have existed in a more active market.
Sensitivity Analysis on Significant estimates Used in the valuationThe assumptions on which the property valuations have been based include, but are not limited to, rent per sqm (per month), discount rate, exit yield, cost to complete, comparable market transactions for land bank for further development, tenant profile for the rented properties, and the present condition of the properties. These assumptions are market standard and in line with the International Valuation Standards (“IVS"). Generally, a change in the assumption made for the rent per sqm (per month) is accompanied by a similar change in the rent growth per annum and discount rate (and exit yield) and an opposite change in the other inputs.

GoVErNaNCEStratEGIC rEPortoVErVIEw FINaNCIal StatEMENtS aDDItIoNal INForMatIoNPortFolIo rEVIEw
123122 Globalworth annual report and financial statements 2020Globalworth annual report and financial statements 2020
NOTeS TO THe CONSOLiDATeD FiNANCiAL STATeMeNTS continuedsection ii: investment propertY
5 Advances for investment Property
2020€’000
2019€’000
Advances for land and other property acquisitions 2,000 27,208Advances to contractors for investment properties under development 2,215 5,232
4,215 32,440
During the year ended 31 December 2020, advances for land and other property acquisitions decreased mainly due to the cancellation of the acquisition of two office developments in Warsaw (Chmielna 89) and Krakow (Tischnera Office) which were signed and announced in November 2019. In 2019, the Group provided €25 million advances for these two properties, and following the cancellation of the transaction with the seller on 9 June 2020, the Group received €24 million in cash and the remaining €1 million was expensed under acquisition costs in the Income Statement.
6 CommitmentsCommitments for investment PropertyAs at 31 December 2020 the Group had agreed construction contracts with third parties and is consequently committed to future capital expenditure in respect of completed investment property of €11.30 million (2019: €8.4 million), investment property under development and refurbishment of €21.0 million (2019: €95.3 million) and had committed with tenants to incur incentives (such as fit-out works, leasing fees and other lease incentives) of €15.9 million (2019: €29.2 million).
The Group’s Joint Ventures were committed to the construction of investment property for the amount of €0.1 million at 31 December 2020 (2019: €7.0 million).
Operating Leases Commitments – Group as LessorPolicyThe determination of whether an arrangement is, or contains, a lease is based on the substance of the arrangement at inception date, whether fulfilment of the arrangement is dependent on the use of a specific asset or assets, or the arrangement conveys a right to use the asset, even if that right is not explicitly specified in an arrangement. Leases in which the Group does not transfer substantially all the risks and benefits of ownership of an asset are classified as operating leases and such lease agreements fall within the scope of IFRS 16; see note 7 for policies on revenue recognition for properties under operating leases.
Judgements Made for Properties Under Operating Leases, Being the LessorThe Group has determined, based on an evaluation of the terms and conditions of the arrangements, that it retains all the significant risks and rewards of ownership of the investment properties leased to third parties and, therefore, being the lessor accounts for these leases as operating leases.
The duration of these leases is one year or more (2019: one year or more) and rentals are subject to annual upward revisions based on the consumer price index. The future aggregate minimum rentals receivable under non-cancellable operating leases for investment properties – freehold are as follows:
2020€’000
2019€’000
Not later than 1 year 171,841 180,978Later than 1 year and not later than 5 years 433,228 482,215Later than 5 years 186,307 166,987
791,376 830,180
4 Fair value Measurement and related estimates and Judgements continued4.1 investment Properties Owned by Joint ventures continuedThe table below describes key information about fair value measurements, valuation technique and significant unobservable inputs (Level 3) used in arriving at the fair value under IFRS 13.
Class ofJoint venture property
Carrying value range
2020€’000
2019€’000
valuation technique Country input 2020 2019
Completed investment 13,800 – DCF Romania Rent per sqm €3.00–€8.50 – property 12,000 – DC Discount rate 8.50%–8.75% –
Exit yield 7.75% –
Investment property under development
– 6,400 RM Romania Rental value (sqm) – €4.00–€8.00
Discount rate – 9.00%–9.25%Exit yield – 8.00%
Capex (€m) – €14.60
Land bank – for further development
25,400 23,100 SC Romania Sales value sqm €23.00-€42.00 €21.00-€40.00
TOTAL 51,200 29,500
DCF: Discounted Cash Flows, DC: Direct Capitalisation, SC: Sales Comparison, RM: Residual Method
A quantitative sensitivity analysis (for properties owned by joint ventures), in isolation, of the most sensitive inputs used in the independent valuations performed, as of the statement of financial position date, is set out below:
Joint VenturesInvestmentProperty Year Country
€0.25 change in rental value per month, per
sqm25 bps change in
market yield 5% change in capex€1.5 change in sales
prices per sqm1
2.5% change in vacancy in perpetuity
Increase€’000
Decrease€’000
Increase€’000
Decrease€’000
Increase€’000
Decrease€’000
Increase€’000
Decrease€’000
Increase€’000
Decrease€’000
– Completed 2020 romania 1,200 (1,100) (400) 400 – – – – (400) 400
2019 Romania – – – – – – – – – –
– Under 2020 romania – – – – – – – – – –
development 2019 Romania 1,300 (1,200) – – (800) 700 – – – –
– Further 2020 romania – – – – – – 1,600 (1,500) – – development 2019 Romania – – – – – – 1,700 (1,700) – –
1. For 2019, the sales prices per sqm sensitivity analysis for one land for future development was based on €3.0.

GoVErNaNCEStratEGIC rEPortoVErVIEw FINaNCIal StatEMENtS aDDItIoNal INForMatIoNPortFolIo rEVIEw
125124 Globalworth annual report and financial statements 2020Globalworth annual report and financial statements 2020
NOTeS TO THe CONSOLiDATeD FiNANCiAL STATeMeNTSsection iii: financial results
7.2c) Rendering of ServicesRevenue from asset management fees, marketing and other income which are recognised at the time the service is provided.
2020€’000
2019€’000
Contracted rent 180,926 165,348
Adjustment for lease incentives (20,474) (13,852)
rental income 160,452 151,496
revenue from contracts with customers – Service charge income 58,345 62,341 – Fit-out services income 3,796 8,002 – Asset management fees – 125 – Marketing and other income 716 282
62,857 70,750
223,309 222,246
The adjustment for lease incentives include €0.8 million amortisation impact for COVID-19-related rent concession given during the year-ended 2020.
The total contingent rents and surrender premia recognised as rental income during the year amount to €0.5 million (2019:€0.8 million) and €1.5 million (2019: €0.6 million), respectively.
Principal Rather than AgentThe Group arranges for third parties to provide certain services to the tenants either as part of service charges or fit-out services. Under IFRS 15, the Group concluded it was the principal because it is primarily responsible for fulfilling the promise to perform the specific services and the Group bears all risks (e.g. credit risk and inventory risk on these transactions as it is obliged to pay the service provider even if the customer defaults on a payment). The Group determined that it controls the service before it is provided to the tenant and, hence, it is the principal rather than the agent in these contracts. As a result, the Group has concluded that it is acting as a principal in all of the above-mentioned revenue arrangements.
8 Operating expensesPolicya) Service CostsService costs paid, as well as those borne on behalf of the tenants, are included under direct property expenses. Reclaiming them from tenants is presented separately under revenue, see note 7.
b) Works Carried Out on PropertiesWorks carried out which are the responsibility of the building’s owner and which do not add any extra functionality to, or enhance significantly, the standard of comfort of the building, are considered as current expenditure for the year and recorded in the income statement as expenses.
2020€’000
2019€’000
Property management, utilities and insurance 60,096 66,212Property maintenance costs and other non-recoverable costs 1,661 850
Property expenses arising from investment property that generate rental income 61,757 67,062
Property expenses arising from investment property that did not generate rental income 689 138Fit-out services costs 3,585 7,334
66,031 74,534
This section quantifies the financial impact of the operations for the year; further analysis on operations is presented in the Financial Review section of the Annual Report. This section includes the results and performances of the Group, including earnings per share and EPRA Earnings. This section also includes details about the Group’s tax position in the year and deferred tax assets and liabilities held at the year-end.
7 revenuePolicy7.1 rental IncomeFor investment properties held primarily to earn rental income, the Group enters as a lessor into lease agreements that fall within the scope of IFRS 16. Rental income is measured at the fair value of the consideration received or receivable, except for contingent rental income which is recognised when it arises. The value of lease agent commission, rent-free periods, fit-out incentives and all similar lease incentives is spread on a straight-line basis over the term of the lease.
Rental income from operating leases is recognised on a straight-line basis over the term of the relevant lease unless another systematic basis is more representative of the time pattern in which the benefit derived from the leased asset is diminished. If the annual lease rent increases as a result of a price index to cover inflationary cost, then the policy is not to spread the amounts but to recognise them when the increase takes place (applied prospectively when the right to receive it arises). The amounts received from tenants to terminate non-cancellable operating leases are recognised in the statement of comprehensive income when the right to receive them arises.
7.2 revenue from Contract with Customers7.2a) Service Charge IncomeThe lease agreements include certain services offered to tenants comprising the overall property management, including common area maintenance services as well as other administrative and support services. The Group has determined that these services constitute distinct non-lease components (transferred separately from the right to use the underlying asset) and are within the scope of IFRS 15. These services are specified in the lease agreements and separately invoiced.
The Group has concluded that these services represent a series of daily services that are satisfied over time and apply a time-elapsed measure of progress. The consideration charged to tenants for these services includes fees charged based on the area occupied by the tenant and reimbursement of certain expenses incurred. The Group has determined that this variable consideration generally relates to this non-lease component and that allocating it over the period of service meets the variable consideration allocation criteria under IFRS 15. The Group has identified a few lease agreements with non-triple net clauses, where service charge was capped, which required the reclassification of €0.6 million from the rental revenues to service charge revenue during 2020 (2019: €0.5 million).
7.2b) Fit-out Services IncomeFor contracts relating to fit-out services, the Group is responsible for the overall management of the project and identifies various goods and services to be provided, including architectural work, procurement of materials, site preparation, framing and plastering, mechanical and electrical work, installation of fixtures and finishing work. In such contracts, the Group has determined that the goods and services are not distinct and has accounted for them as a single performance obligation.
Under IFRS 15, the Group recognises revenue over time because it expects that control will transfer over time. In certain fit-out contracts, its performance creates an asset that the tenant controls as the asset is created. In other cases, its performance does not create an asset with alternative use to the Group and the Group has concluded that it has an enforceable right to payment for performance completed to date.
The Group has measured the stage of completion (i.e. performance measurement over time) for the revenue recognition from distinctive fit-out projects using a cost input method, by reference to the costs incurred to date on a project for the satisfaction of a performance obligation relative to the total budgeted costs of the project to the completion.

GoVErNaNCEStratEGIC rEPortoVErVIEw FINaNCIal StatEMENtS aDDItIoNal INForMatIoNPortFolIo rEVIEw
127126 Globalworth annual report and financial statements 2020Globalworth annual report and financial statements 2020
NOTeS TO THe CONSOLiDATeD FiNANCiAL STATeMeNTS continuedsection iii: financial results
10.1 Debt Cost amortisation and other Finance Costs
2020€’000
2019€’000
Debt issue cost amortisation – secured bank loans 299 679Debt issue cost amortisation – unsecured revolving facility 1,434 –Debt issue cost amortisation – fixed rate bonds 6,202 4,431Debt close-out costs 11 1,107
7,946 6,217
The Company capitalised borrowing costs in the value of investment property, amounting to €1.5 million (2019: €1.2 million), using a capitalisation weighted average rate of 3.40% (2019: 3.43%).
11 TaxationPolicyCurrent Income taxCurrent income tax represents the tax payable on the taxable income of the year applying the tax rates applicable at the statement of financial position date. In cases where the final tax outcome is different from the amounts that were initially recorded, such differences will impact the income statement in the period in which the determination is made. The tax cost for the year is included in the income statement except to the extent that it relates to items recognised directly in equity, in which case the related tax is recognised in equity.
Deferred income tax is recognised on all temporary differences arising between the tax bases of assets and liabilities and their carrying amounts in the consolidated financial statements at the income tax rate applicable at the reporting date, with the following exceptions: – the temporary difference arises from the initial recognition of goodwill, or of an asset, or liability in a transaction that is not a
business combination. As a result at the time of the transaction affects neither accounting nor taxable profit or loss; – deferred tax assets are only recognised to the extent that it is foreseeable that there will be taxable profit available to be
utilised against the deductible temporary differences, carried forward tax credits or tax losses; and – in respect of taxable temporary differences related to investments in subsidiaries where the timing of the reversal of the
temporary difference can be controlled and it is most likely that the temporary difference will not be reversed in the foreseeable future.
The unrecognised deferred income tax asset is reassessed at each reporting date and is recognised to the extent, it is become probable that the future taxable profit will allow for the recovery of such deferred tax asset. Deferred tax assets and liabilities are offset, if provided by law and the deferred taxes relate to the same taxable entity and the tax authority.
2020€’000
2019€’000
Current income tax expense 3,711 6,750
– Related to current year 3,480 6,608 – Related to prior year 231 142
Deferred income tax expense 12,624 24,785
16,335 31,535
The corporate income tax rate (“CIT”) applicable to the Company in Guernsey is nil. The subsidiaries in Romania, Poland and Cyprus are subject to tax on local sources of income. The current income tax expense of €3.7 million (2019: €6.8 million) represents the profit tax for the Group. The taxable income arising in each jurisdiction is subject to the following standard corporate income tax rates: Poland at 19% (small entities with revenue up to €1.2 million in the given tax year and entities starting a new business for their first tax year of operation, under certain conditions, are charged a reduced rate of 9% (2019: 9%), Romania at 16% and Cyprus at 12.5%.
The Group’s subsidiaries in Poland are subject to the minimum tax, which is applied to income from ownership of certain high-value fixed assets having an initial value of the asset exceeding PLN 10 million at a rate of 0.035% per month. From 2019, the taxpayer has a right to apply for the refund of previously paid minimum tax which was not deducted from the advance corporate income tax. This minimum tax can be set-off against CIT if CIT is higher. The tax is applied only to leased buildings while no tax applies on vacant buildings or on vacant space in partially occupied buildings. Due to the COVID-19 pandemic the minimum tax scheme was suspended for the period from 1 March 2020 until the Pandemic will remain enforce and the Group’s subsidiaries are subject to corporate income tax.
9 Administrative expensesPolicyAdministrative expenses are expensed as incurred with the exception of expenditure on long-term developments, see note 3. Subsidiary acquisition costs are presented separately in the consolidated statement of comprehensive income as “Acquisition costs”.
Note2020
€’0002019
€’000
Directors’ emoluments1 1,359 2,565Salaries and wages1,2 7,181 8,565Accounting, secretarial and administration costs 587 1,076Legal and other advisory services 1,995 1,577Audit and non-audit services3 874 1,603Corporate social responsibility 9.1 1,761 929Travel and accommodation 262 487Marketing and advertising services 443 1,419Post, telecommunication and office supplies 607 632Stock exchange expenses 601 449Non-recurring restructuring and COVID-19 expenses 2,316 –
17,986 19,302
1. Costs of €3.8 million (2019: €1.2 million) associated with the team of Executive Directors and other employees who worked on development projects were capitalised in line with the progress made on the properties under development during the year. In addition, nil (2019: €0.04 million) was capitalised as debt issue costs.
2. During the year, the Group contributed €0.2 million (2019: €0.2 million) and €0.01 million (2019: €0.02 million) to the mandatory Government Pension Fund of the employees and key management of the Group, respectively.
3. Refer to the Audit Committee report for details on the fees charged by the Company’s Auditors for the year.
9.1 Corporate Social responsibility
2020€’000
2019€’000
Total expenditure of the Globalworth Foundations during the year 1,966 1,016Donations from employees and Executive Directors (205) (87)
Corporate social responsibility expenditure supported by the Group 1,761 929
10 Finance CostPolicyBorrowing costs associated with direct expenditure on properties under development or undergoing major refurbishment are capitalised. Where borrowings are associated with specific developments, the amount capitalised is the gross interest less finance income (if any) incurred on those borrowings. Interest is capitalised as from the commencement of the development work until the date of practical completion. Arrangement fees are amortised over the term of the borrowing facility. All other borrowing costs are expensed in the period in which they occur.
Note2020
€’0002019
€’000
Interest on secured loans 6,906 5,955Interest on unsecured revolving facility 1,028 –Interest on fixed rate bonds 33,013 31,067Debt cost amortisation and other finance costs 10.1 7,946 6,217Other financial expenses – 46Interest on lease liability 3.2 1,288 1,336Bank charges 959 429
51,140 45,050

GovernanceStrateGic reportoverview Financial StatementS additional inFormationportFolio review
129128 Globalworth ANNUAL REPORT AND FINANCIAL STATEMENTS 2020Globalworth ANNUAL REPORT AND FINANCIAL STATEMENTS 2020
NOTES TO THE CONSOLIDATED FINANCIAL STATEMENTS CONTINUEDSECTION III: FINANCIAL RESULTS
deferred income tax expense
Net deferred tax
Consolidated statement of financial position
Consolidated statement of comprehensive income
2020€’000
2019€’000
2020€’000
2019€’000
Acquired through asset acquisition – (330) 330 –Valuation of investment property at fair value 171,197 157,621 13,576 28,982Deductible temporary differences (3,657) (1,522) (2,135) 88Interest expense and foreign exchange loss on intra-group loans (20,017) (13,844) (6,173) (4,227)Discounting of tenant deposits and long-term deferred costs 63 75 (12) 21Share issue cost recognised in equity (7) (7) – –Valuation of financial instruments at fair value 112 1,225 (1,113) 693Recognised unused tax losses (3,634) (11,785) 8,151 (772)
144,057 131,433 12,624 24,785
The Group has unused assessed tax losses carried forward of €63.4 million (2019: €77.9 million) in Romania and €20.2 million (2019: €34.2 million) in Poland that are available for offsetting against future taxable profits of the entity which has the tax losses. The tax losses in Romania and Poland can be carried forward over seven and five consecutive tax years from the year of origination, respectively. In Poland, in any particular tax year, the taxpayer may not deduct more than 50% of the loss incurred in the year for which it was reported. Additionally, starting from 2020, the taxpayer may utilise one-time tax losses generated after 31 December 2018 in the amount of being greater of PLN 5 million or 50% of tax loss of given fiscal year in the following five fiscal years.
As of the statement of financial position date the Group had recognised deferred tax assets of €3.6 million (2019: €11.8 million) in Romania and Poland for which deferred tax asset recognition criteria were met under IAS 12, out of the total available deferred tax assets of €14.0 million (2019: €19.1 million), calculated at the corporate income tax rates of 16% in Romania and 19% (9% for small entities) in Poland, respectively.
Expiry year 2021 2022 2023 2024 2025 2026 2027 Total
Total available deferred tax assets (€m) 2.0 2.5 2.8 5.0 0.4 1.0 0.3 14.0
From the above total available deferred tax assets, €10.4 million (2019: €7.3 million) deferred tax asset was not recognised (Romanian and Poland) in the income statement of the Group as the amount could not be realised from the future taxable income as per the criteria under IAS 12.
There are also temporary non-deductible interest expenses and net foreign exchange losses of €192.2 million, €32.8 million in Romania and €159.4 million in Poland (2019: €87.9 million, €23.5 million in Romania and €64.4 million in Poland) related to intercompany and bank loans. Such amounts can be carried forward indefinitely, and each year an amount up to 30% of tax EBITDA (but not less than PLN 3 million in Poland) would become tax deductible, for which €20.0 million (€1.5 million in Romania and €18.5 million in Poland) deferred tax asset was recorded (2019: €13.8 million, €1.7 million in Romania and €12.1 million in Poland).
Judgements, Estimates and assumptions Used for Assessed Tax Losses and Related Deferred Tax AssetsAt each statement of financial position date, the Group assesses whether the realisation of future tax benefits is sufficiently probable to recognise deferred tax assets. This assessment requires the exercise of judgement on the part of management with respect to, among other things, benefits that could be realised from available tax strategies and future taxable income, as well as other positive and negative factors. Based on the above assessment, the Group recognised €8.2 million deferred tax loss (2019: deferred tax income of €0.8 million) representing derecognition of deferred tax assets of €2.7 million (2019: derecognition of €0.7 million) in Romania, due to improved actual tax results and transition of some subsidiaries to a taxable profit position, and derecognition of deferred tax assets of €5.5 million (2019: recognition of €1.5 million) in Poland, due to utilisation of tax losses from the previous years.
The recorded amount of total deferred tax assets could be reduced if estimates of projected future taxable income, or if changes in current tax regulations are enacted that impose restrictions on the timing or extent of the Group’s ability to utilise future tax benefits.
11 Taxation continuedPolicy continuedThe Group’s subsidiaries registered in Cyprus need to comply with the tax regulations in their respective countries; however, the Group does not expect to generate significant taxable income, other than dividend and interest income, these being the most significant future sources of income of the Group companies registered in Cyprus. Dividend income is tax exempt under certain conditions and interest income, however, is subject to corporate income tax at the rate of 12.5% in Cyprus.
Judgements and assumptions Used in the computation of current income tax liabilityThere are uncertainties in Romania and Poland where the Group has significant operations and this is due to the interpretation of complex tax regulations, changes in tax laws, and the amount and timing of future taxable income. Differences arising between the actual results and the assumptions made, or future changes to such assumptions, could necessitate future adjustments to tax income and expense already recorded. Such differences of interpretation may arise on a wide variety of issues depending on the conditions prevailing in the respective company’s domicile. In Romania and Poland, the tax position is open to further verification for five years and no subsidiary in Romania has had a corporate income tax audit in the last five years while in Poland some entities are currently under tax audit with respect to the corporate income tax settlement for the fiscal years 2016 and 2017.
reconciliation between applicable and effective rax rateThe reconciliation between tax expense and the product of accounting profit multiplied by the Company’s income tax rate for the year ended 31 December 2020 and 31 December 2019 is as follows:
2020€’000
2019€’000
(Loss)/profit before tax (30,460) 207,716
Less: (Non-deductible)/non-taxable unrealised fair value (loss)/gain on investment property (116,153) 117,718
Profit before fair value (loss)/gain on investment property and tax 85,693 89,998
At the Company’s income tax rate 0% (2019: 0%) – –Effect of higher tax rates in foreign jurisdictionsTax in Romania– Corporate income tax 1,289 830– Deferred tax expense for taxable temporary differences 4,489 10,601
– related to current year 1,291 10,559 – related to prior year’s tax losses 3,198 42
Tax in Cyprus– Corporate income tax 125 610Tax in Poland– Corporate income tax 2,297 5,310– Deferred tax expenses for taxable temporary differences 8,135 14,184
– related to current year 299 15,448 – related to prior year’s tax losses 7,836 (1,264)
Tax expense reported in the income statement 16,335 31,535
Effective tax rate, including deferred tax expenses (%) 19.1% 35.0%Effective tax rate, excluding deferred tax expenses (%) 4.3% 7.5%
deferred tax (asset)/liabilities
2020€’000
2019€’000
Deferred tax asset (786) (2,869)Deferred tax liabilities 144,843 134,302
144,057 131,433

GoVErNaNCEStratEGIC rEPortoVErVIEw FINaNCIal StatEMENtS aDDItIoNal INForMatIoNPortFolIo rEVIEw
131130 Globalworth annual report and financial statements 2020Globalworth annual report and financial statements 2020
NOTeS TO THe CONSOLiDATeD FiNANCiAL STATeMeNTS continuedsection iii: financial results
12 earnings Per ShareThe following table reflects the data used in the calculation of basic and diluted earnings per share per IFRS, and EPRA guidelines:
Date Event Note
Number of shares issued(‘000)
% of theyear
Weighted average
(‘000)
1 Jan 2019 At the beginning of the year 132,458 132,458
Jan-April 2019 – Shares issued for share swap with non-controlling interest holders in the subsidiary 19,933 75 14,890
April 2019 – Shares issued for cash 38,202 72 27,505April 2019 – Shares purchased with cash by the Company (300) 68 (204)July 2019 – Shares issued for performance incentive scheme 2,929 49 1,435July 2019 – Shares issued for Executive share option plan (vested and
exercised) 51 49 25Aug 2019 – Shares purchased for Subsidiaries’ employee Share Award
plan (vested) 87 41 36Oct 2019 – Shares issued for cash 28,572 21 6,000Nov 2019 – Shares purchased with cash by the Company (500) 10 (50)Dec 2019 – Shares issued under the Executive share option plan (vested
and exercised) 47 9 4
2019 Shares in issue at year-end (basic) 221,479 182,099
Jan-Dec 2019 Effect of dilutive shares 931 78 724
2019 Shares in issue at year-end (diluted) 222,410 182,823
1 Jan 2020 At the beginning of the year 221,479 221,479April-Sep 2020 – Shares purchased with cash by the Company 24.5.1 (1,562) 37 (578)July 2020 – Shares issued under the Executive share option plan (vested
and exercised) 24.2 43 48 21July-Sep 2020 – Shares allotted under Subsidiaries’ employee Share Award
plan (vested) 24.3 337 41 138
2020 Shares in issue at year-end (basic) 220,297 221,060
Jan–Dec 2020 Effect of dilutive shares 1,189 86 1,021
2020 Shares in issue at year-end (diluted) 221,486 222,081
Subsequent to 31 December 2020, no new shares were issued.
Unvested share option warrants of 2.85 million were not included in basic or diluted number of shares being unvested and anti-dilutive on issue date (refer to note 24.1 for further information). However, 20,000 share option warrants which were vested and exercisable at 31 December 2020 were included in the dilutive number of shares outstanding at 31 December 2020 (2019: same).
2020€’000
2019€’000
(Loss)/profit attributable to equity holders of the Company for the basic and diluted earnings per share (46,795) 170,177
iFrS earnings per share cents cents
– Basic (21) 93– Diluted (21) 93
Key Financial Performance MeasuresThe Company distributes on a semi-annual basis dividends to its shareholders of not less than 90% of the Company’s funds from operations, estimated using EPRA earnings, subject to solvency and other legal requirements. EPRA earnings is a non-IFRS measure.
ePrA earnings Per ShareThe following table reflects the reconciliation between IFRS earnings as per the statement of comprehensive income and EPRA earnings (non-IFRS measure):
Note2020
€’0002019
€’000
Earnings attributable to equity holders of the Company (IFRS) (46,795) 170,177Changes in fair value of financial instruments and associated close-out costs (584) 519Fair value gain on investment property 3 116,153 (117,718)Losses on disposal of investment properties 387 1,576Changes in value of financial assets at fair value through profit or loss 16 47 (1,898)Acquisition costs 2,689 240Tax credit relating to losses on disposals – (13)Deferred tax charge in respect of above adjustments 12,464 29,674Adjustments in respect of joint ventures and other items (2,049) (4,358)Non-controlling interests in respect of the above – 2,667
EPRA earnings attributable to equity holders of the Company 82,312 80,866
ePrA earnings per share cents cents
– Basic 37 44– Diluted 37 44

GoVErNaNCEStratEGIC rEPortoVErVIEw FINaNCIal StatEMENtS aDDItIoNal INForMatIoNPortFolIo rEVIEw
133132 Globalworth annual report and financial statements 2020Globalworth annual report and financial statements 2020
NOTeS TO THe CONSOLiDATeD FiNANCiAL STATeMeNTSsection iv: financial assets and liaBilities
This section focuses on financial instruments, together with the working capital position of the Group and financial risk management of the risks that the Group is exposed to at year-end.
13 Financial instruments PolicyA financial instrument is any contract that gives rise to a financial asset of one entity and a financial liability or equity instrument of another entity. Financial instruments are recognised on the balance sheet when the Group becomes a party to the contractual obligations of the instrument. The Group determines the classification of its financial assets and financial liabilities at initial recognition.
Under IFRS 9 the Group classifies its financial assets in the two main measurement categories: those to be measured subsequently at fair value (either through OCI or through profit or loss) and those to be measured at amortised cost. The classification of the financial asset in either of the above categories depends on the Group’s business model for managing the financial asset and the contractual terms of the cash flows. The Group reclassifies the financial instrument, when and only, when its business model for managing those assets changes.
For assets measured at fair value, gains and losses will either be recorded in profit or loss or OCI. For investments in equity instruments that are not held for trading, this will depend on whether the Group has made an irrevocable election at the time of initial recognition to account for the equity investment at fair value through other comprehensive income (FVOCI).
Under IFRS 9 transaction costs that are directly attributable to the acquisition of the financial asset are recognised in the carrying amount at initial date in case of a financial asset not at fair value through profit or loss (FVPL). Transaction costs of financial assets carried at FVPL are expensed in profit or loss.
A financial asset and a financial liability are offset and the net amount is reported in the statement of financial position if, and only if, the Group has a legally enforceable right to offset the recognised amounts and intends either to settle on a net basis, or to realise the asset and settle the liability simultaneously.
Financial assetsFinancial assets of the Group mainly include cash and cash equivalents, contract assets, trade and other receivables and guarantees retained by tenants, loan receivables from joint ventures, equity investments and financial assets at fair value through profit or loss.
A financial asset (or, where applicable, a part of a financial asset or part of a group of similar financial assets) is derecognised when the rights to receive cash flows from the asset have expired; or the Group has transferred its rights to receive cash flows from the asset or has assumed an obligation to pay the received cash flows in full without material delay to a third party under a “pass-through” arrangement; and either: (a) the Group has transferred substantially all the risks and rewards of the asset; or(b) the Group has neither transferred nor retained substantially all the risks and rewards of the asset but has transferred control of the asset.
Regular way purchases and sales of financial assets are recognised on trade-date, the date on which the Group commits to purchase or sell the asset. Financial assets are derecognised when the rights to receive cash flows from the financial assets have expired or have been transferred and the Group has transferred substantially all the risks and rewards of ownership.
Financial Assets at Amortised CostsCash and cash equivalents, contract assets, trade and other receivables, other receivables, guarantees retained by tenants, vat and other taxes receivable, income tax receivable and loan receivables from joint ventures.
The Group classifies its financial assets as at amortised cost only if both of the following criteria are met: – the asset is held within a business model whose objective is to collect the contractual cash flows: and – the contractual terms give rise to cash flows that are solely payments of principal and interest.
Interest income from the financial assets at amortised costs is included in finance income using the effective interest rate method and are subject to impairment. Any gain or loss arising on derecognition is recognised directly in profit or loss and presented in other income or expenses.
Note 20.2 provides information about the Group’s exposure to credit risk and the impairment loss recognised during the year on the of financial assets subject to impairment.
Cash and Cash EquivalentsCash and cash equivalents include highly liquid investments that are readily convertible into cash and which are subject to an insignificant risk of change in value. Such investment includes cash in hand and cash balances at banks and short-term bank deposits with maturity of three months or less. In the prior year, long-term restricted cash was held in separate debt service reserve accounts for the obligation resulting from bank loans in Poland and was not available to the Group for general purposes.
Trade and Other ReceivablesTrade receivables are amounts due from tenants for rent and services performed in the ordinary course of business. They are generally due for settlement within 30 days and assessed as working capital in the ordinary course of business; therefore, they are all classified as current. Trade receivables are recognised initially at the amount of consideration under IFRS 15 that is unconditional unless they contain significant financing components, when they are recognised at fair value. The Group holds the trade receivables with the objective to collect the contractual cash flows and therefore measures them subsequently at amortised cost using the effective interest method.
Trade and other receivables, together with the associated provision if any, are written off when there is no realistic prospect of future recovery and all collateral has been realised or has been transferred to the Group. If collection is expected in more than one year, they are classified as non-current assets.
Contract AssetA contract asset is initially recognised for revenue earned from service charge income, fit-out services income and rendering of other services. The revenue stream is disclosed in note 7, because the receipt of consideration is conditional on successful completion of the services. Once a fiscal invoice is issued after the completion of services the contract asset is reclassified to trade receivables.
Equity Investments Through Other Comprehensive Income (With no Recycling of Cumulative Gains and Losses Upon Derecognition)Financial assets at fair value through other comprehensive income (“FVOCI") comprise equity investments which are not held for trading, and at initial recognition the Group, at its sole irrevocable option under IFRS 9, designates the unquoted equity investment as financial assets at fair value through other comprehensive income. Under this option, qualifying dividends are recognised in profit or loss. Changes in fair value, net of deferred tax if any, are recognised in other comprehensive income. Subsequently if the equity investment will be derecognised then the impact of derecognition will remain in the other comprehensive income and will not be reclassified to profit and loss.
The fair value of financial instruments that are not traded in an active market is determined using valuation techniques. The fair value under these valuation techniques is classified as Level 3. The Group uses its judgement to select a variety of methods (including external transactions with third parties to raise equity or convertible debt by the investee, enterprise value using future cash flows, performance of investee, annual budget and future business plans) and make assumptions that are mainly based on market conditions existing at the end of each reporting period.
Financial Assets at Fair Value Through Profit or LossFinancial assets at fair value through profit or loss are carried in the statement of financial position at fair value with net changes in fair value recognised in the statement of profit or loss.
Financial LiabilitiesFinancial liabilities of the Group mainly comprise interest-bearing loans and borrowings, contract liabilities, trade and other payables, guarantees retained from contractors, finance lease payables, other derivative financial liabilities and tenant security deposits.
A financial liability is derecognised when the obligation under the liability is discharged or cancelled or expires. When an existing financial liability is replaced by another from the same lender on substantially different terms, or the terms of an existing liability are substantially modified, such an exchange or modification is treated as a derecognition of the original liability and the recognition of a new liability, and the difference in the respective carrying amounts is recognised in the income statement.
Contract LiabilityA contract liability is recognised if a payment is received or a payment is due (whichever is earlier) from a customer before the Group transfers the related services. Contract liabilities are recognised as revenue when the Group performs under the contract.
Interest-bearing Loans and BorrowingsAll loans and borrowings are initially recognised at the fair value of the consideration received, net of transaction costs, and are subsequently measured at amortised cost using the effective interest rate method. The effective interest rate is the rate that exactly discounts estimated future cash payments through the expected life of the financial liability, or, where appropriate, a shorter period. the calculation takes into account any premium or discount on acquisition and includes transaction costs and fees that are an integral part of the effective interest rate.
Derivative Financial InstrumentsDerivatives are recognised initially and are subsequently remeasured at fair value. Derivatives are classified as assets when their fair value is positive or as liabilities when their fair value is negative. Derivative assets and liabilities arising from different transactions are offset only if the transactions are with the same counterparty, a legal right of offset exists, and the parties intend to settle the cash flows on a net basis. Fair value movements on derivative financial instruments at fair value through the profit and loss account are recognised in the statement of comprehensive income.

GoVErNaNCEStratEGIC rEPortoVErVIEw FINaNCIal StatEMENtS aDDItIoNal INForMatIoNPortFolIo rEVIEw
135134 Globalworth annual report and financial statements 2020Globalworth annual report and financial statements 2020
Based on the above factors the Company concluded that the exchange should be reflected as a modification of the existing notes as opposed to their derecognition. Therefore, unamortised finance costs of €1.5 million and the 2% buy-back premium on the exchanged €226.9 million June 2022 notes were added to the issuance cost of July 2026 notes and would be amortised over the term of the July 2026 notes. If instead the existing notes would have been derecognised these amounts would have been recognised in the current period profit or loss and the interest expense in the following periods (up to the maturity of the new notes) would have been lower by the same amount.
Financial CovenantsFinancial covenants on unsecured fixed rate bonds are calculated on a semi-annual basis at 30 June and 31 December each year and include the Consolidated Coverage Ratio, with a minimum value of 200%, the Consolidated Leverage Ratio, with a maximum value of 60%, and the Consolidated Secured Leverage Ratio with a maximum value of 30%.
Unsecured revolving Credit FacilityAt the end of October 2019, the Group entered into a €200 million unsecured Revolving Credit Facility (“RCF”) with a syndicate of local and international banks. On 18 March 2020, the full amount was drawn down in order to further strength the liquidity during the pandemic period, however, following the successful bond issuance, the €200 million outstanding balance on the RCF was repaid in full on 13 August 2020.
In July 2020, the Group exercised its option to increase the RCF credit line by €15 million under a pre-existing commitment from the syndicate of banks, thus as at 31 December 2020, the entire RCF facility of €215 million was available for utilisation and will continue to be available until the end of March 2024, with maturity at the end of April 2024.
The RCF loan terms have been structured to, generally, align with the Company's existing Euro Medium Term Note (“EMTN") programme for fixed rate bonds. In addition to the financial covenants applicable for unsecured fixed rate bonds, the RCF facility contains a supplementary financial covenant of the Total Unencumbered Assets Ratio with a minimum value of 125%.
14.2 Secured FacilitiesrepaymentsOn 7 April 2020, the Group prepaid an amount of €0.8 million (Loan 16) from existing cash resources.
New Facilities On 30 January 2020, the Group drew down the €65 million 10-year long-term debt facility (Loan 46), from Berlin Hyp AG secured with mortgage on Warsaw Trade Tower Property in Poland. The facility carries a fixed interest rate charge. The proceeds from the loan were used to fund general corporate purposes.
On 20 February 2020, the Group drew down the €62 million 7-year long-term debt facility (Loan 44 and Loan 45), from ING Bank Slaski S.A. secured with mortgage on Silesia Star and Retro House Properties in Poland. The facility carries a fixed interest rate charge. The proceeds from the loan were used to fund general corporate purposes.
On 12 June 2020, the Group drew down the €20 million increase of the €85 million long-term debt facility (Loan 41), which was secured from Erste Bank Group AG (part of Erste Bank Group). The facility carries a floating interest rate charge and is secured with mortgage on the Globalworth Tower investment property in Romania. The new proceeds from the loan were used to fund the development of new investment properties and general corporate purposes.
Financial CovenantsFinancial covenants on secured loans are calculated based on the individual financial statements of the respective subsidiaries and subject to the following ratios: – gross loan-to-value ratio (“LTV”) with maximum values ranging from 60%–83% (2019: 48%–83%). LTV is calculated as the
loan value divided by the market value of the relevant property (for a calculation date); – the debt service cover ratio (“DSCR”) minimum values of 120% (2019: 120%). DSCR is calculated, depending on the
respective credit facility, on the preceding 12-months historical ratio or projected future 12-month period ratio; and – minimum interest cover ratio (“ICR”), historic with minimum values from 350% and projected with minimum values from
250% (2019: 250%-350%), which was applicable to two properties as at 31 December 2020 (31 December 2019: same). Historic ICR is calculated, as Actual Net Rental Income as a percentage of the Actual Interest Costs for the twelve preceding months period from the calculation date. Projected ICR is calculated as Projected Net Rental Income as a percentage of the Projected Interest Costs for the twelve months period commencing immediately after the date of the calculation.
Secured bank loans are secured by investment properties which were recognised in the statement of financial position at fair value of €796.7 million at 31 December 2020 (2019: €546.4 million) and also carry pledges on rent receivable balances of €2.5 million (2019: €3.0 million), VAT receivable balances of €0.7 million (2019: €0.2 million) and a moveable charge on the respective bank accounts (refer to note 19).
Impact of CoVID-19 on Financial loan Covenants on Unsecured FacilitiesThe Group is in compliance with all financial covenants and there were no payment defaults during the year 2020 (2019: same). As of 31 December 2020, the Group had undrawn borrowing facilities of €215 million (2019: €265 million).
14 interest-bearing Loans and BorrowingsThis note describes information on the material contractual terms of the Group’s interest-bearing loans and borrowings. For more information about the Group’s exposure to market risk, currency risk and liquidity risks, see note 20.
2020€’000
2019€’000
CurrentCurrent portion of secured loans and accrued interest 3,580 3,378Accrued interest on unsecured fixed rate bonds 22,471 20,926
Sub-total 26,051 24,304
Non-currentSecured loans 358,836 215,947Unsecured fixed rate bonds 1,245,207 1,083,669
Sub-total 1,604,043 1,299,616
TOTAL 1,630,094 1,323,920
14.1 Key Terms and Conditions of Outstanding Debt:
Facility Currency Nominal interest rate Maturity date
2020 2019
Face value€’000
Carryingvalue€’000
Face value€’000
Carryingvalue€’000
Loan 16 EUR EURIBOR 1 month + margin May 2025 14,724 14,721 16,651 16,651Loan 25 EUR Fixed rate Bond June 2022 328,066 325,460 558,404 550,819Loan 37 EUR Fixed rate Bond March 2025 562,522 555,324 562,522 553,776Loan 381 EUR Fixed rate & Floating rate EURIBOR
3 months + marginMay 2025
100,111 99,405 100,112 99,260Loan 41 EUR EURIBOR 3 month + margin March 2029 85,313 84,505 65,239 64,490Loan 43 EUR EURIBOR 3 month + margin December 2024 37,599 37,438 39,122 38,924Loan 44/45 EUR Fixed rate February 2027 62,295 61,935 – –Loan 46 EUR Fixed rate November 2029 65,105 64,412 – –Loan 48 EUR Fixed rate Bond July 2026 405,011 386,894 – –
Total 1,660,746 1,630,094 1,342,050 1,323,920
1. Loan 38 was drawn down in two tranches – 95% of the facility carries a fixed interest rate and 5% carries a floating interest rate.
Unsecured Corporate bondsIn June 2017, the Company issued a €550 million unsecured Eurobond (Loan 25). The five-year Euro-denominated Bond matures on 20 June 2022 and carries a fixed interest rate of 2.875%. In March 2018, the Group issued a €550 million unsecured Eurobond (Loan 37). The seven-year Euro-denominated Bond matures on 29 March 2025 and carries a fixed interest rate of 3.0%.
In July 2020 the Company successfully completed under its €1.5 billion Euro Medium Term Notes Programme the issuance of €400 million new Notes, due in 2026, by exchanging €226.9 million of the €550 million Notes due in June 2022 (Loan 25) and the remaining amount of €158.7 million, after deduction of buy-back premium and issuance fees, was received in cash which further enhanced the liquidity position of the Group.
In July 2020 the Company successfully completed under its €1.5 billion Euro Medium Term Notes Programme the issuance of a €400 million new Notes, due in 2026, by exchanging €226.9 million of the €550 million Notes due in June 2022 (Loan 25) and the remaining amount €158.7 million, after deduction of buy-back premium and issuance fees, was received in cash which further enhanced the liquidity position of the Group. In determining whether the exchange represents an extinguishment of the existing debt and a recognition of a new financial liability the Company analysed whether the July 2026 notes (new issue) are substantially different as compared to the June 2022 notes (old issue), in the context of IFRS 9 requirements regarding derecognition of financial liabilities. In making its judgements the management considered, among others: – the difference between the net present value of the new notes discounted with the effective interest rates of the existing
notes and the amortised cost of the existing notes – which is less than 10% of the respective amortised cost, – the fact that the new issue followed and was conditional upon successful negotiations with existing lenders, who had
preference in the allocation of the new issued notes, – the fact that the exchange was not part of a pre-existing early redemption option in the existing notes, – the type of interest (fixed) and the currency of the notes were not modified.
NOTeS TO THe CONSOLiDATeD FiNANCiAL STATeMeNTSsection iv: financial assets and liaBilities

GovernanceStrateGic reportoverview Financial StatementS additional inFormationportFolio review
137136 Globalworth ANNUAL REPORT AND FINANCIAL STATEMENTS 2020Globalworth ANNUAL REPORT AND FINANCIAL STATEMENTS 2020
17 Equity InvestmentsName of investees
2020€’000
2019€’000
Mindspace Ltd 8,837 8,837Early Game Venture Fund I Coöperatief U.A. 614 313Gapminder Fund Coöperatief U.A. 918 690
Equity investments (unquoted) 10,369 9,840
JudgementsThe Group considers investment in the above entities as strategic and their classification as financial asset at fair value through other comprehensive income is more relevant instead of financial asset at fair value through the income statement. The classification criteria were assessed separately for each investment at initial date.
Estimates Used in the Valuation Technique and Key InputsIn determining fair value, the Group relied on the financial data of investees’ portfolios and on estimates by the management of the investee portfolio companies as to the effect of future developments. Although the Group uses its best judgement, there are inherent limitations in any estimation techniques. Any change in the discount rate and/or EBITDA multiple used in valuation may have a significant impact on the estimated value at 31 December 2020. The fair value estimates attempt to present the amount the Group could realise in a current transaction; the final realisation may be different as future events will also affect the current estimates of fair value.
Investment in Mindspace LtdIn 2018, the Group entered into an agreement with Mindspace Ltd, receiving a 4.99% stake in Mindspace Ltd in return for investing €8.6 million in the company’s Preferred A-2 class shares. Mindspace Ltd commenced its operations in 2013 with subsidiaries in Cyprus, Poland, Germany, the UK, the USA, the Netherlands and Romania. The company leases office spaces for long-term periods, renovates them and turns them into modern shared offices/co-working spaces while providing its customers with office spaces and additional services. The company is also a tenant of the Group, in Poland and Romania.
The fair value of the Group’s participation in Mindspace Ltd was calculated, internally by the management, based on the net present value of estimated future cash flows, using a discounted cash flows model. The valuation methodology requires to make certain assumptions about the key inputs used, including forecasted discounted cash flows (which were based on the investee’s forecast earnings as per business plan for the next 5 years from 2021 to 2025), the discount rate of 5.0% and EBITDA multiple of 20 (which was based on the 30 June 2020 EBITDA multiple of a comparable quoted global company operating in a similar industry). Based on the above analysis as at 31 December 2020, the fair value amount was not materially lower than the initial investment cost of the Group therefore no fair value decrease was recorded in the other comprehensive income. Furthermore, as at 31 December 2020, a 5% change in EBITDA multiple or 25 bps change in discount rate would have increased or decreased the carrying value by €0.6 million.
Investment in Venture FundsGlobalworth Tech Limited, a fully owned subsidiary of the Group, invested €0.3 million in Early Game Venture Fund I Coöperatief U.A. (“Early Game”) in the prior year. The subsidiary participated in further equity calls in 2020 and invested another €0.3 million. Early Game is a venture fund which invests in tech start-ups in Romania through the Competitiveness Operational Program and is co-funded by the European Regional Development Fund. The Group is committed to invest in total €2.0 million in to this fund.
Similarly, in the prior year, Globalworth Tech Limited invested €0.7 million in Gapminder Fund Coöperatief U.A. (“Gapminder”) and participated in further equity calls of €0.2 million during 2020. Gapminder is a venture fund which invests in tech start-ups in Romania through the Entrepreneurship Accelerator and Seed Fund Financial Instrument in Romania and is co-funded by the European Investment Fund. The Group is committed to invest in total €2.4 million out of the fund’s total planned investment value of €40.1 million.
At 31 December 2020, the Group assessed the fair value of its investments based on latest available management accounts of both funds and the underlying enterprise value of the each tech start-ups and seed investments by Early Game and Gapminder. The enterprise value of underlying investments is based on last capital raises initiated by such seed investment and pre-seed investment which is participated by third parties. Based on this analysis no fair value gain was recognised in other comprehensive income as the change in the value of both investments was insignificant to the cost of initial investment.
15 Trade and Other Payables2020
€’0002019
€’000
Current
Payable for property service charges 8,574 9,905Payable to suppliers for properties under development 7,965 10,039Consideration payable for property acquisitions 9,580 10,469Deferred income for rent 6,430 5,962Directors’ emoluments payable 473 501Salaries and related payables 2,361 1,843Accruals for administrative expenses 2,286 3,722Accruals for non-recurring costs 271 5Other taxes payable 2,014 1,934Other short-term payables 255 253
40,209 44,633
Non-current
Consideration payable for business acquisition 692 1,316
40,901 45,949
16 Financial Assets at Fair Value Through Profit or Loss
Project name Interest rate Maturity date2019
€’000Additions
€’000Disposal
€’000Valuation Gain
€’000Reclassification
€’0002020
€’000
Short term:
Browary Stage J fixed December 2020 16,501 – (16,503) 45 – 43My Place I
(formerly: Beethovena I) fixed June 2021 3,986 213 – 30 – 4,229My Place II
(formerly: Beethovena II) fixed June 2021 – – – – 3,423 3,423
Sub-total 20,487 213 (16,503) 75 3,423 7,695
Long term:My Place II
(formerly: Beethovena II) fixed June 2021 3,098 461 (14) (122) (3,423) –
TOTAL 23,585 674 (16,517) (47) – 7,695
Right of First Offer Agreements (“ROFO”) The fair value of the financial assets (ROFO bonds) is individually determined by taking into account a number of factors (the significant key factors are fair value of underlying investment properties, outstanding cost to complete the construction and leasing progress). Any significant change in inputs may result in significant change in the fair value of ROFO especially considering the current COVID-19 environment. As at 31 December 2020 e.g. a 5% change in outstanding cost to complete or the fair value of underlying investment property would have increased or decreased the ROFO fair value by €0.9 million and €0.9 million (2019: €0.8 million and €0.6 million) respectively.
The maturity dates presented in the table above are stated in the agreements, however, the planned repayment dates of debentures would take place upon completion of each ROFO project. The fair value of debentures is calculated based on percentage of completion of each ROFO projects and developer margin of the project which is calculated as a difference between each ROFO Project value upon completion and the project’s construction budget. As at 31 December 2020, a loss of €0.05 million (2019: gain of €1.6 million) from the fair valuation of the above financial instruments was recognised in the statement of comprehensive income, categorised Level 3 within the fair value hierarchy.
The Group is committed to invest in each of the ROFO Assets 25% of the funds required by each of the ROFO SPVs (less the external construction bank financing at a loan to construction ratio of 60%) to complete the development of each respective ROFO Asset. As of 31 December 2020, the cumulative investment made by the Group under the ROFO Agreement amounts to €16.6 million (2019: €15.9 million) out of which €0.7 million was invested during the current year. Due to COVID-19 the completion date of the Beethovena development project was delayed to June 2021.
During the current year, the Group sold ROFO bonds related to Browary Stage J for an amount of €16.5 million and a significant amount was cashed during the current year from Echo Investment S.A., the majority stake holder.
NOTES TO THE CONSOLIDATED FINANCIAL STATEMENTSSECTION IV: FINANCIAL ASSETS AND LIABILITIES

GoVErNaNCEStratEGIC rEPortoVErVIEw FINaNCIal StatEMENtS aDDItIoNal INForMatIoNPortFolIo rEVIEw
139138 Globalworth annual report and financial statements 2020Globalworth annual report and financial statements 2020
The Group’s exposure to foreign currency risk was as follows (based on nominal amounts):
Amounts in €’000 equivalent value
2020 2019
Denominated in Denominated in
rON PLN GBP USD RON PLN GBP USD
ASSeTSCash and cash equivalents 27,672 16,136 71 18 24,715 39,138 27 2Trade and other receivables 7,573 8,219 – – 15,130 11,663 – –Contract assets 1,506 1,311 – – 2,270 2,987 – –Income tax receivable 192 725 – – 208 47 – –
Total 36,943 26,391 71 18 42,323 53,835 27 2
LiABiLiTieSTrade and other payables 10,418 9,909 – – 11,342 10,919 – –Lease liability – 29,089 – – – 32,077 – –Income tax payable 632 170 – – 402 348 – –Guarantees from subcontractors – 2,165 – – – 2,107 – –Deposits from tenants 3,271 5,954 – – 3,068 6,151 – –
Total 14,321 47,287 – – 14,812 51,602 – –
Net exposure 22,622 (20,896) 71 18 27,511 2,233 27 2
Foreign Currency Sensitivity AnalysisAs of the statement of financial position date, the Group is mainly exposed to foreign exchange risk in respect of the exchange rate fluctuations of the RON and PLN. The following table details the Group’s sensitivity (impact on income statement before tax and equity) to a 5% devaluation in RON, PLN and GBP exchange rates against the Euro, on the basis that all other variables remain constant.
The 5% sensitivity rate represents management’s assessment of the reasonably possible change in foreign exchange rates. The sensitivity analysis includes only outstanding foreign currency denominated monetary items and adjusts their translation at the reporting date for a 5% appreciation in the Euro against other currencies.
All amounts in €’000
2020 2019
Profit or (loss) equity Profit or (loss) Equity
RON (1,131) (1,131) (1,376) (1,376)PLN 1,045 1,045 (112) (112)USD (1) (1) – –GBP (4) (4) (1) (1)
A 5% devaluation of the Euro against the above currencies would have had an equal but opposite impact on the above currencies to the amounts shown above, on the basis that all other variables remain constant.
20.1 b) Interest rate riskInterest rate price risk is the risk that the value of a financial instrument will fluctuate due to changes in market interest rates relative to the interest rate that applies to the financial instrument. Interest rate cash flows risk is the risk that the interest cost will fluctuate over time.
The Group’s interest rate risk principally arises from interest-bearing loans and borrowings. As at 31 December 2020, the total outstanding balance of interest-bearing loans and borrowing 91.3% (2019: 90.5%) carry fixed rate interest, as a consequence, the Group is exposed to fair value interest rate risk, which has been disclosed under IFRS. As of 31 December 2020, the fair value of such fixed rate debt was higher by €93 million (2019: higher by €89 million) than the carrying value as disclosed below in the fair value hierarchy table.
Furthermore, as at 31 December 2020, from the total outstanding interest-bearing loans and borrowing balance of 8.7% (2019: 9.5%) carry variable interest rate, which range from EURIBOR 1-month to EURIBOR 3-month rates; see note 14 for details on each individual loan. These loans expose the Group to cash flow interest rate risk and in order to minimise this risk, the Group hedged 10.3% (2019: 13.3%) of such variable interest rate exposure with fixed-variable interest rate swap instrument and a further 30.0% (2019: 25.8%) was hedged with interest rate cap instruments.
Based on the Group’s debt balances at 31 December 2020, an increase or decrease of 25 basis points in the EURIBOR will result in an increase or decrease (net of tax) in the result for the year of €2.3 million (2019: €2.2 million), with a corresponding impact on equity for the same amount. This analysis assumes that all other variables, in particular foreign currency rates, remain constant.
18 Trade and Other receivables2020
€’0002019
€’000
CurrentRent and service charges receivable 10,785 14,407VAT and other taxes receivable 5,028 13,810Consideration receivable from the sellers for property acquisitions – 338Advances to suppliers for services 90 154Sundry debtors 122 254
16,025 28,963
rent and Service Charges receivableRent and service charges receivable are shown, in above the table, net of an allowance for bad or doubtful debts of €4.9 million (2019: €4.0 million). Rent and service charges receivable are non-interest-bearing and are typically due within 30-90 days (see more information on credit risk and currency profile in note 20.2). For the terms and conditions for related party receivables, see note 30.
19 Cash and Cash equivalents
2020€’000
2019€’000
Cash at bank and in hand 300,704 192,989Short-term deposits 226,097 97,705
Cash and cash equivalents as per statement of cash flows 526,801 290,694Guarantee deposits – cash reserve 1,000 1,000
Cash and cash equivalents as per statement of financial position 527,801 291,694
Cash at bank and in hand includes restricted cash balances of €6.4 million (2019: €10.8 million) and short-term deposits include restricted deposits of €3.2 million (2019: €3.1 million). The restricted cash balance can be used to repay the outstanding debts and repayment of deposits to tenants. The restricted cash balance of €0.2 million (2019: €0.2 million) held by the Globalworth Foundations (Fundatia Globalworth and Fundacja Globalworth) can only be used for charity purposes.
Details of cash and cash equivalents denominated in foreign currencies are disclosed in note 20.
Short-term deposits are made for varying periods depending on the immediate cash requirements of the Group and earn interest at rates on Euro deposits ranging from minus 0.60% to minus 0.35% (2019: minus 0.61% to minus 0.35%) per annum, for PLN deposits from nil to 1.48% (2019: nil to 1.48%) per annum and for RON deposits from 0.62% to 2.55% (2019: 1.14% to 3.23%) per annum. For RON deposits the highest interest rate was earned on overnight deposits.
20 Financial risk Management – Objective and PoliciesThe Group is exposed to the following risks from its use of financial instruments: – Market risk (including currency risk and interest rate risk); – Credit risk; and – Liquidity risk.
20.1 Market riskMarket risk is the risk that the fair value or future cash flows of a financial instrument will fluctuate because of changes in market prices.
The Group’s market risks arise from open positions in: (a) foreign currencies; and (b) interest-bearing assets and liabilities, to the extent that these are exposed to general and specific market movements.
20.1 a) Foreign Currency riskThe Group has entities registered in several EU countries, with the majority of operating transactions arising from its activities in Romania and Poland.
Therefore, the Group is exposed to foreign exchange risk, primarily with respect to the Romanian Lei (“RON") and Polish Zloty (“PLN"). Foreign exchange risk arises in respect of those recognised monetary financial assets and liabilities that are not in the functional currency of the Group.
NOTeS TO THe CONSOLiDATeD FiNANCiAL STATeMeNTSsection iv: financial assets and liaBilities

GoVErNaNCEStratEGIC rEPortoVErVIEw FINaNCIal StatEMENtS aDDItIoNal INForMatIoNPortFolIo rEVIEw
141140 Globalworth annual report and financial statements 2020Globalworth annual report and financial statements 2020
The movements in the provision for impairment of receivables during the respective periods were as follows:
2020€’000
2019€’000
Opening balance 4,030 4,546Provision for specific doubtful debts 1,370 428Reversal of impairment based on the simplified approach under IFRS 9 – (140)Reversal of provision for doubtful debts (218) (444)Utilised (62) (301)Foreign currency translation income (144) (59)
Closing balance 4,976 4,030
The analysis by credit quality of financial assets, cumulated for rent, service charge and property management, is as follows:
2020 (€’000)
Neither past due nor
impaired
Due but not impaired
<90 days <120 days <365 days >365 days Total
Trade and other receivable - gross 5,905 3,481 478 2,139 3,758 15,761
Less: Specific provison – 51 46 761 3,758 4,616Less: Expected credit loss 6 266 20 68 360
Carrying amount 5,899 3,164 412 1,310 – 10,785expected credit loss rate 0.1% 8.4% 4.8% 5.2% –
2019 (€’000)
Neither past due nor
impaired
Due but not impaired
<90 days <120 days <365 days >365 days Total
Trade and other receivable - gross 5,237 7,932 621 2,344 2,303 18,437Less: Specific provison 4 60 215 1,088 2,303 3,670Less: Expected credit loss 7 267 20 66 – 360
Carrying amount 5,226 7,605 386 1,190 – 14,407expected credit loss rate 0.1% 3.5% 5.1% 5.6% –
The customer balances which were overdue but not provisioned are due to the fact that the related customers committed and started to pay the outstanding balances subsequent to the year-end. Further deposits payable to tenants may be withheld by the Group in part or in whole if receivables due from the tenant are not settled or in case of other breaches of contractual terms.
Vat and other taxes receivableThis balance relates to corporate income tax paid in advance, VAT and other taxes receivable from the tax authorities in Romania and Poland. The balances are not considered to be subject to significant credit risk as all the amounts receivable from Government authorities are secured under sovereign warranty.
Cash and Cash EquivalentsThe credit risk on cash and cash equivalents is very small, since the cash and cash equivalents are held at reputable banks in different countries. During 2020 the cash and cash equivalents balance was kept with several international banks having credit rating profile (assigned by S&P, Moody’s or Fitch) in upper-medium grade range (i.e. A+ to A- for long-term and P-1, P2, F-1, F-2 for short-term) for 70% (2019: 73%) of the cash and cash equivalents balance of the Group, in lower-medium grade range (BBBs) for 29% (2019: 12%) of the cash and cash equivalents balance of the Group and only 1% (2019: 15%) in non-investment grade. Surplus funds from operating activities are deposited only for short-term periods, which are highly liquid with reputable institutions.
20 Financial risk Management – Objective and Policies continued20.2 Credit riskCredit risk refers to the risk that a counterparty will default on its contractual obligations resulting in financial loss to the Group. The Group’s policy is to trade with recognised and creditworthy third parties. The Group’s exposure is continuously monitored and spread amongst approved counterparties. The Group’s maximum exposure to credit risk, by class of financial asset, is equal to their carrying values at the statement of financial position date.
Note2020
€’0002019
€’000
Financial assets measured at fair value through profit or loss 16 7,695 23,585Loan receivable from joint venture 27 16,451 7,847Trade receivables – net of provision 18 10,785 14,407Contract assets 2,819 5,257Other receivables 122 592Guarantees retained by tenants 894 858VAT and other taxes receivable 18 5,028 13,810Income tax receivable 931 255Cash and cash equivalents 19 527,801 291,694
572,526 358,305
Financial assets at Fair Value through Profit or loss and other Comprehensive IncomeThe Group places funds in financial instruments issued by reputable real estate companies with high credit worthiness.
Contract assets and trade receivablesA trade receivable is recognised if an amount of consideration that is unconditional is due from the customer (only the passage of time is required before payment of the consideration is due).
There is no significant concentration of credit risk with respect to contract assets and trade receivables, as the Group has a large number of tenants, most of which are part of multinational groups, internationally dispersed, as disclosed in the Leasing Review of the Annual Report. For related parties, including the joint ventures, it is assessed that there is no significant risk of non-recovery.
Estimates and assumptions Used for Impairment of trade receivables and Contract assetsThe Group’s trade receivables do not contain any financing component and mainly represent lease receivables. Therefore, the Group applied the simplified approach under IFRS 9 and measured the loss allowance based on a provision matrix that is based on historical collection and default experience adjusted for forward-looking factors in order to estimate the provision on initial recognition and throughout the life of the receivables at an amount equal to lifetime ECL (Expected Credit Losses). The assessment is performed on a six-month basis and any change in original allowance will be recorded as gain or loss in the income statement.
The COVID-19 pandemic and work from home policies have created a challenging environment for many industries and businesses and, in particular, for some of our retail tenants. We are in close contact with our tenants and we are communicating on a regular basis in order to understand and respond to their challenges, including the amendment of lease terms and also rescheduling of outstanding receivables on a few occasions. We continue to monitor the cash collections of rents daily throughout the entire portfolio. As of the financial statements approval date, we have observed insignificant instances, primarily in our retail portfolio in the mixed-use segment, where invoices were not collected from tenants within due date or tenants requested rescheduling of outstanding invoices. This indicates, as per instances observed until the end of January 2021, a lower likelihood of possible business failures, though we continue to monitor closely all customers, especially tenants who are facing financial difficulties due to COVID-19. We expect to see low to moderate risk delays in rent collection or low risk of non-payment of rent in the future, considering the current conditions and the availability of vaccines or other solutions against the COVID-19 pandemic. Refer to pages 4 to 7 of the Annual Report, subsection COVID-19 Response, for further details.
NOTeS TO THe CONSOLiDATeD FiNANCiAL STATeMeNTSsection iv: financial assets and liaBilities
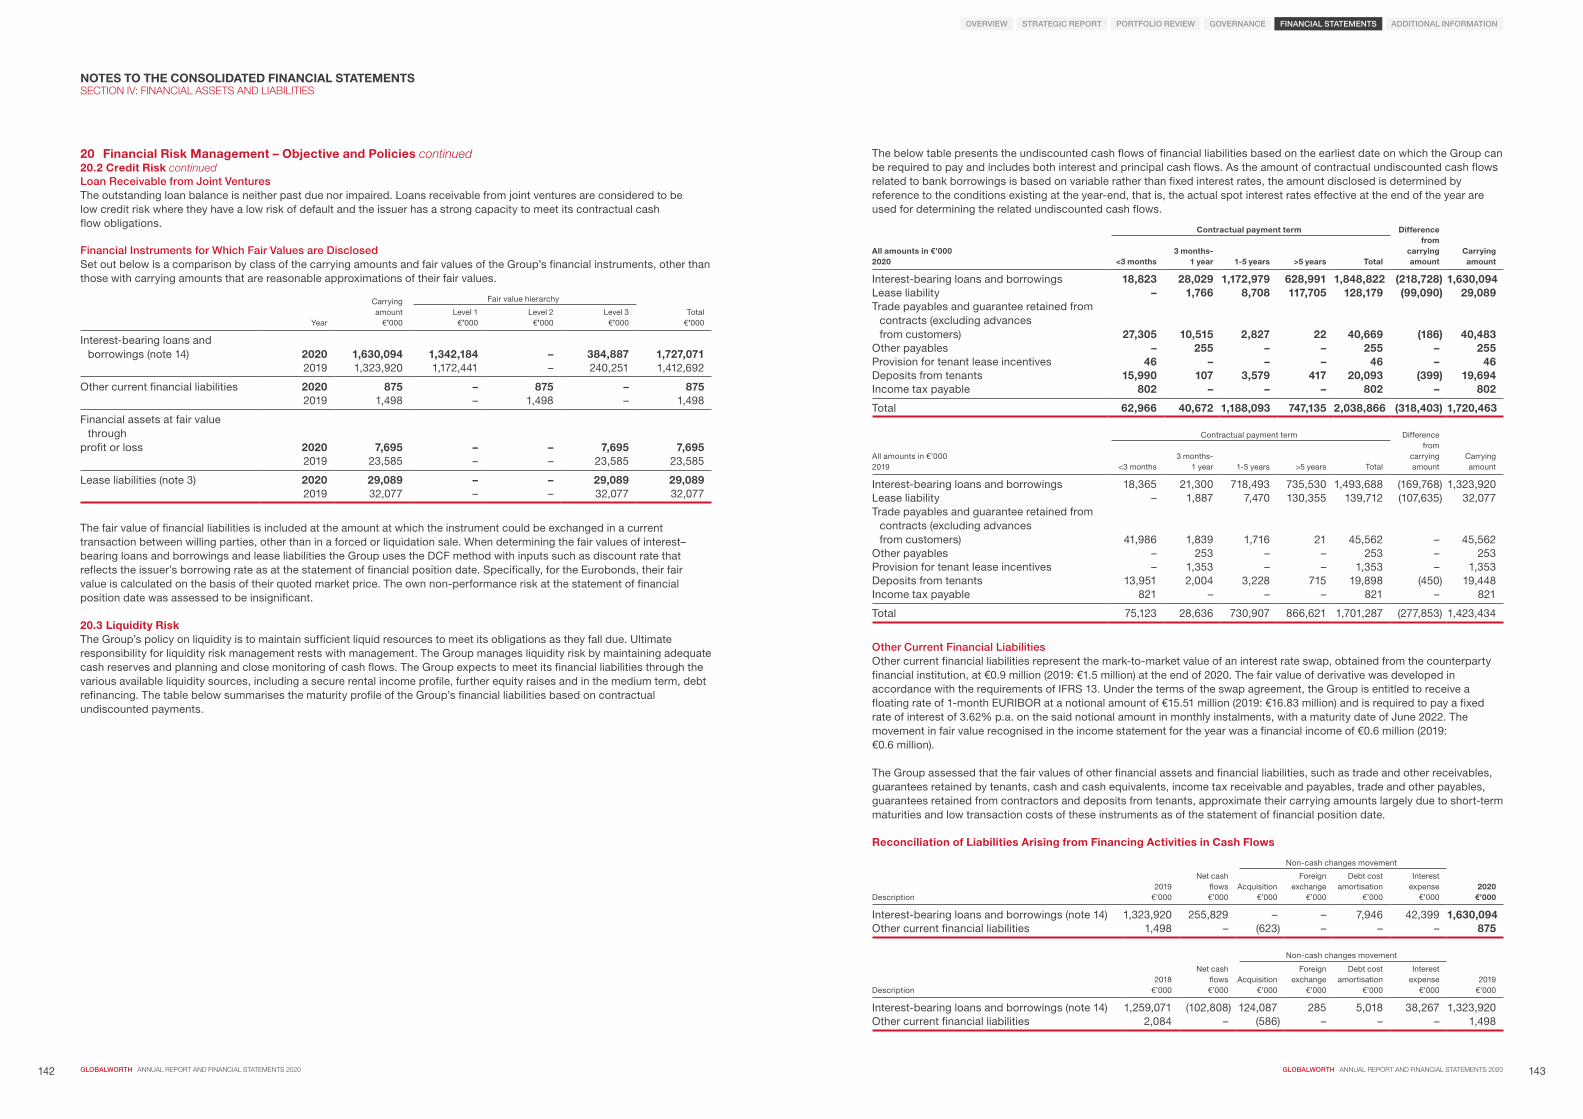
GoVErNaNCEStratEGIC rEPortoVErVIEw FINaNCIal StatEMENtS aDDItIoNal INForMatIoNPortFolIo rEVIEw
143142 Globalworth annual report and financial statements 2020Globalworth annual report and financial statements 2020
The below table presents the undiscounted cash flows of financial liabilities based on the earliest date on which the Group can be required to pay and includes both interest and principal cash flows. As the amount of contractual undiscounted cash flows related to bank borrowings is based on variable rather than fixed interest rates, the amount disclosed is determined by reference to the conditions existing at the year-end, that is, the actual spot interest rates effective at the end of the year are used for determining the related undiscounted cash flows.
All amounts in €’0002020
Contractual payment term Difference from
carrying amount
Carrying amount<3 months
3 months-1 year 1-5 years >5 years Total
Interest-bearing loans and borrowings 18,823 28,029 1,172,979 628,991 1,848,822 (218,728) 1,630,094Lease liability – 1,766 8,708 117,705 128,179 (99,090) 29,089Trade payables and guarantee retained from
contracts (excluding advances from customers) 27,305 10,515 2,827 22 40,669 (186) 40,483
Other payables – 255 – – 255 – 255Provision for tenant lease incentives 46 – – – 46 – 46Deposits from tenants 15,990 107 3,579 417 20,093 (399) 19,694Income tax payable 802 – – – 802 – 802
Total 62,966 40,672 1,188,093 747,135 2,038,866 (318,403) 1,720,463
All amounts in €’0002019
Contractual payment term Difference from
carrying amount
Carrying amount<3 months
3 months-1 year 1-5 years >5 years Total
Interest-bearing loans and borrowings 18,365 21,300 718,493 735,530 1,493,688 (169,768) 1,323,920Lease liability – 1,887 7,470 130,355 139,712 (107,635) 32,077Trade payables and guarantee retained from
contracts (excluding advances from customers) 41,986 1,839 1,716 21 45,562 – 45,562
Other payables – 253 – – 253 – 253Provision for tenant lease incentives – 1,353 – – 1,353 – 1,353Deposits from tenants 13,951 2,004 3,228 715 19,898 (450) 19,448Income tax payable 821 – – – 821 – 821
Total 75,123 28,636 730,907 866,621 1,701,287 (277,853) 1,423,434
other Current Financial liabilitiesOther current financial liabilities represent the mark-to-market value of an interest rate swap, obtained from the counterparty financial institution, at €0.9 million (2019: €1.5 million) at the end of 2020. The fair value of derivative was developed in accordance with the requirements of IFRS 13. Under the terms of the swap agreement, the Group is entitled to receive a floating rate of 1-month EURIBOR at a notional amount of €15.51 million (2019: €16.83 million) and is required to pay a fixed rate of interest of 3.62% p.a. on the said notional amount in monthly instalments, with a maturity date of June 2022. The movement in fair value recognised in the income statement for the year was a financial income of €0.6 million (2019: €0.6 million).
The Group assessed that the fair values of other financial assets and financial liabilities, such as trade and other receivables, guarantees retained by tenants, cash and cash equivalents, income tax receivable and payables, trade and other payables, guarantees retained from contractors and deposits from tenants, approximate their carrying amounts largely due to short-term maturities and low transaction costs of these instruments as of the statement of financial position date.
reconciliation of Liabilities Arising from Financing Activities in Cash Flows
Description2019
€’000
Non-cash changes movement
2020€’000
Net cashflows€’000
Acquisition€’000
Foreign exchange
€’000
Debt cost amortisation
€’000
Interest expense
€’000
Interest-bearing loans and borrowings (note 14) 1,323,920 255,829 – – 7,946 42,399 1,630,094Other current financial liabilities 1,498 – (623) – – – 875
Description2018
€’000
Non-cash changes movement
2019€’000
Net cashflows€’000
Acquisition€’000
Foreignexchange
€’000
Debt costamortisation
€’000
Interestexpense
€’000
Interest-bearing loans and borrowings (note 14) 1,259,071 (102,808) 124,087 285 5,018 38,267 1,323,920Other current financial liabilities 2,084 – (586) – – – 1,498
20 Financial risk Management – Objective and Policies continued20.2 Credit risk continuedloan receivable from Joint VenturesThe outstanding loan balance is neither past due nor impaired. Loans receivable from joint ventures are considered to be low credit risk where they have a low risk of default and the issuer has a strong capacity to meet its contractual cash flow obligations.
Financial Instruments for which Fair Values are DisclosedSet out below is a comparison by class of the carrying amounts and fair values of the Group’s financial instruments, other than those with carrying amounts that are reasonable approximations of their fair values.
Year
Carryingamount
€’000
Fair value hierarchy
Total€’000
Level 1€’000
Level 2€’000
Level 3€’000
Interest-bearing loans and borrowings (note 14) 2020 1,630,094 1,342,184 – 384,887 1,727,071
2019 1,323,920 1,172,441 – 240,251 1,412,692
Other current financial liabilities 2020 875 – 875 – 8752019 1,498 – 1,498 – 1,498
Financial assets at fair value through
profit or loss 2020 7,695 – – 7,695 7,6952019 23,585 – – 23,585 23,585
Lease liabilities (note 3) 2020 29,089 – – 29,089 29,0892019 32,077 – – 32,077 32,077
The fair value of financial liabilities is included at the amount at which the instrument could be exchanged in a current transaction between willing parties, other than in a forced or liquidation sale. When determining the fair values of interest–bearing loans and borrowings and lease liabilities the Group uses the DCF method with inputs such as discount rate that reflects the issuer’s borrowing rate as at the statement of financial position date. Specifically, for the Eurobonds, their fair value is calculated on the basis of their quoted market price. The own non-performance risk at the statement of financial position date was assessed to be insignificant.
20.3 Liquidity riskThe Group’s policy on liquidity is to maintain sufficient liquid resources to meet its obligations as they fall due. Ultimate responsibility for liquidity risk management rests with management. The Group manages liquidity risk by maintaining adequate cash reserves and planning and close monitoring of cash flows. The Group expects to meet its financial liabilities through the various available liquidity sources, including a secure rental income profile, further equity raises and in the medium term, debt refinancing. The table below summarises the maturity profile of the Group’s financial liabilities based on contractual undiscounted payments.
NOTeS TO THe CONSOLiDATeD FiNANCiAL STATeMeNTSsection iv: financial assets and liaBilities

GoVErNaNCEStratEGIC rEPortoVErVIEw FINaNCIal StatEMENtS aDDItIoNal INForMatIoNPortFolIo rEVIEw
145144 Globalworth annual report and financial statements 2020Globalworth annual report and financial statements 2020
NOTeS TO THe CONSOLiDATeD FiNANCiAL STATeMeNTS continuedsection v: sHare capital and reserves
23 Financial Position Key Performance MeasuresThe net asset value (“NAV”), EPRA NAV and the numbers of shares used for the calculation of each key performance measure on the financial position of the Group and the reconciliation between IFRS and EPRA measures are shown below.
Note2020
€’0002019
€’000
Net assets attributable to equity holders of the Company 1,755,364 1,914,667
Number of ordinary shares used for the calculation of:Number
(‘000)Number
(‘000)
NAV per share 12 220,297 221,479Diluted NAV and EPRA NAV per share 12 221,486 222,410
€ €
NAv per share 7.97 8.64Diluted NAv per share 7.93 8.61
EPRA Net Asset Value (‘EPRA NAV’) Per Share Note2020
€’0002019
€’000
Net assets attributable to equity holders of the Companyexclude:Deferred tax liability on investment property 11
1,755,364
171,197
1,914,667
157,621Fair value of interest rate swap instrument 20 872 1,498Goodwill as a result of deferred tax 26 (5,697) (5,697)Adjustment in respect of the joint venture for above items 1,742 1,301
ePrA NAv attributable to equity holders of the Company 1,923,478 2,069,390
€ €
ePrA NAv per share 8.68 9.30
24 Share-based Payment reservePolicyEquity-settled transactions where vesting is conditional upon a market or non-vesting condition, are treated as vesting irrespective of whether the market or non-vesting condition is satisfied, provided that all service conditions are satisfied. The cost of equity-settled transactions is recognised in the income statement, together with a corresponding increase in other reserves in equity (share-based payment reserve), over the period in which the service conditions are fulfilled.
The cumulative expense recognised for equity-settled transactions at each reporting date until the vesting date reflects the extent to which the vesting period has expired. Where the share scheme has market-related performance criteria, the Group has used a binomial option pricing model to establish the relevant fair values at grant date, considering the terms and conditions. The following table analyses the components of the share-based payment reserve and total cost outstanding at year-end.
Share-based payments reserve Note 2020
Treasury shares
Number(‘000)
2019€’000
Treasury shares
Number(‘000)
Executive share option plan 24.1 158 – 158 –Shares granted to Executive Directors and other
senior management employees – not transferred 24.2 353 (43) 838 (86)Subsidiaries’ Employees Share Award Plan 24.3 531 – – –Performance Incentive Scheme – – 2,544 –Deferred annual bonus plan 24.4.1 4,999 – 1,888 –Long-term incentive plan 24.4.2 143 – 143 –
6,184 (43) 5,571 (86)
Share-based payments expense Note2020
€’0002019
€’000
Subsidiaries’ Employees Share Award Plan 24.3 1,071 353Long-term incentive plan 24.4.2 – 143
Total expense during the year 1,071 496
The disclosures in this section focus on dividend distributions, the share schemes in operation and the associated share- based payment charge to profit or loss. Other mandatory disclosures, such as details of capital management, are also disclosed in this section.
21 issued Share CapitalPolicyOrdinary shares are classified as equity. The costs of issuing or acquiring equity are recognised in equity (net of any related income tax benefit), as a reduction of equity on the condition that these are incremental costs directly attributable to the equity transaction that otherwise would have been avoided. The costs of an equity transaction that is abandoned are recognised as an expense. Those costs might include registration and other regulatory fees, amounts paid to legal, accounting and other professional advisers, printing costs and stamp duties.
2020 2019
€’000Number
(’000) €’000Number
(’000)
Opening balance 1,704,374 222,407 897,314 132,599
Shares issued to the Executive Directors and other senior management employees – transferred – – 439 –
Shares issued for cash – – 611,921 66,774Shares issued in exchange for GPRE shares – – 179,395 19,933Transaction costs on the issuance of shares – – (12,828) –Shares issued and held by the subsidiary – – 3,028 342Shares issued for Long-Term Plan termination – – 25,105 2,759
Balance at 31 December 1,704,374 222,407 1,704,374 222,407
Ordinary shares carry no right to fixed income but are entitled to dividends as declared from time to time. Each ordinary share is entitled to one vote at meetings of the Company. There is no limit on the authorised share capital of the Company. The Company can issue no par value and par value shares as the Directors see fit. No new shares were issued by the Company during 2020.
Under Guernsey company law there is no distinction between distributable and non-distributable reserves, requiring instead that a company passes a solvency test in order to be able to make distributions to shareholders. Similarly, the share premium for the issuance of shares above their par value per share was recognised directly under share capital and no separate share premium reserve account was recognised.
22 DividendsPolicyThe Company recognises a liability to pay a dividend when the distribution is authorised, and the distribution is no longer at the discretion of the Company. As per the articles of incorporation of the Company and Guernsey Company Law, a distribution is authorised when it is approved by the Board of Directors of the Company. A corresponding amount is recognised directly in equity. There are no income tax consequences attached to the payment of dividends in either 2020 or 2019 by the Group to its shareholders.
2020€’000
2019€’000
Declared and paid during the yearInterim cash dividend: €0.49 per share (2019: €0.57 per share) 108,324 93,799
On 16 January 2020, the Board of Directors of the Company approved the payment of an interim dividend in respect of the six-month financial period ended 31 December 2019 of €0.30 per ordinary share, which was paid on 7 February 2020 to the eligible shareholders.
On 26 August 2020, the Company announced that its Board of Directors has approved the payment of an interim dividend in respect of the six-month financial period ended 30 June 2020 of €0.19 per ordinary share, which was paid on 2 October 2020 to the eligible shareholders.

GoVErNaNCEStratEGIC rEPortoVErVIEw FINaNCIal StatEMENtS aDDItIoNal INForMatIoNPortFolIo rEVIEw
147146 Globalworth annual report and financial statements 2020Globalworth annual report and financial statements 2020
24 Share-based Payment reserve continuedPolicy continued24.1 Executive Share option PlanUnder the plan, the Directors of the Group were awarded share option warrants as remuneration for services performed. The share options granted to the Directors of the Group are equity-settled.
In 2013, the Group granted warrants to the Founder (at 31 December 2020 the unvested warrants were held by Zakiono Enterprises Limited, a company owned by CPI Property Group) and the Directors’ which entitle each holder to subscribe for ordinary shares in the Company at an exercise price of €5.00 per share if the market price of an ordinary share, on a weighted average basis over 60 consecutive days, exceeds a specific target price and the holder is employed on such date. The contractual term of each warrant granted is 10 years. There are no cash settlement alternatives, and the Group does not have the intention to offer cash settlement for these warrants.
As of 31 December 2020, under share option warrants scheme Zakiono Enterprises Limited has right to subscribe in two tranches 2.85 million ordinary shares (1.425 million in each tranche) at an exercise price of €5.00 per share if the market price of an ordinary share, on a weighted average basis over 60 consecutive days, exceeds €10.00 per share and €12.50 per share for each tranche respectively. As defined per IAS 33 “Earnings per share” ordinary shares to be issued for each unvested share option warrants were not included in basic or diluted number of shares disclosed in the note 13. The fair value of the warrants was estimated at the grant date (i.e. July 2013) at €0.073 per share. There have been no cancellations or modifications to any of the plans during the year.
The following table analyses the total cost of the executive share option plan (warrants), together with the number of options outstanding:
2020 2019
Cost€’000
Number(‘000)
Cost€’000
Number(‘000)
Closing balance 158 2,850 158 2,850
Weighted average remaining contractual life (years) 3.33 3.58Warrants vested and exercisable as at 31 December 20 20
24.2 Shares Granted to Executive Directors and other Senior Management Employees
2020€’000
2019€’000
At the beginning of the year 838 1,528Shares granted to Executive Directors and other senior management employees – 85Shares issued to the Executive Directors and other senior management employees (392) (903)Dividend transferred on vest shares (26) –Unpaid dividend on unvested shares 34 128Unallocated dividend transferred to treasury shares (101) –
Closing balance 353 838
Shares Issued to the Executive Directors and Other Senior Management EmployeesDuring the year 2020, the Company delivered 0.04 million ordinary shares (ordinary shares of no par value), out of treasury shares held by the Company, to the Executive Directors and other senior management employees as settlement for the share-based payment reserve, in their capacity as Globalworth Investment Advisers Limited’s (“GIAL”) preference shareholders, on behalf of its subsidiary GIAL, in order to settle the second tranche of 0.04 million ordinary shares, comprising part of the ordinary shares that were allotted to GIAL in part settlement of the fee due to GIAL by the Company for the year ended 31 December 2018.
As at 31 December 2020, 0.04 million shares (2019: 0.08 million shares) held by GIAL and not transferred by that date are accounted for as treasury shares. The shares rank pari passu with the existing shares of the Company.
24.3 Subsidiaries’ Employees Share award PlanUnder the share award plan, the subsidiaries’ employees are required to remain in service for a one-year period following the date of acceptance of the share offer letter. During the year, the Company recorded €1.1 million (2019: €0.4 million) as share-based payment expense in the income statement for the lapsed vesting period. Also during the year, the Group allotted 0.05 million ordinary shares to employees (vested shares) in order to settle the share-based reserve under this scheme.
2020€’000
2019€’000
Opening balance – 431Share-based payment expense during the year 1,071 353Shares vested and exercised during the year (540) (784)
Closing balance 531 –
Weighted average remaining unvested period (years) 0.25 –Weighted average price per share – vested and exercised shares 7.00 –Weighted average price per share – unvested shares 7.00 –
Under the share award plan, the subsidiaries’ employees are required to remain in service for a one-year period after the date of acceptance of the share offer letter. The Company anticipates that all employees will remain in service until the expiry of the unvested period.
24.4 Current Group remuneration PolicyPolicyThe current Group remuneration policy is designed to achieve an appropriate balance between fixed and variable remuneration, and between variable remuneration based on short-term and longer-term performance. Fixed remuneration includes base salary and benefits. Variable remuneration includes an annual bonus, a significant portion of which are ordinarily paid in deferred shares pursuant to a new deferred annual bonus plan (“DABP”), and performance share plan awards made under a new long-term incentive plan (“LTIP”).
The current Group remuneration policy is intended to align with the strategy and business of the Group and reflects the importance of generating a growing and sustainable cash flow and achieving value creation through the active management of real estate assets, including those under development. The principal objectives of the current Group remuneration policy are to attract, retain and motivate management of the quality required to run the Company successfully.
24.4.1 Deferred Annual Bonus Plan (“DABP”)The Investment Manager and selected senior employees are eligible to participate in an annual bonus plan. The current annual bonus plan for participants in the scheme is paid through a combination of maximum 50% cash and the balance in deferred shares. The maximum award for each participant cannot exceed 150% of annual salary, target performance cannot exceed 75% of annual salary and threshold performance cannot exceed 37.5% of annual salary. Awards under the DABP vest in three instalments on the first, second and third anniversaries of the date of grant, unless otherwise approved by the Company’s Remuneration Committee and the Board of Directors. Participants are entitled to receive dividend equivalents on the unvested shares until, and payable on or shortly after, they vest.
The Remuneration Committee sets performance targets for the annual bonus at the start of each financial year to ensure performance measures and weightings are appropriate and support the business strategy. The performance targets are primarily based upon Key Performance Indicators, although there may also be elements subject to other measures and factors.
Deferred annual bonus plan – equity settlement Note
31 December 2020
€’000
31 December 2019
€’000
At the beginning of the year 1,888 –Share-based incentive bonus for the year 24.4.1.1 2,065 3,776Cash-based portion of annual incentive plan – (1,888)Unpaid dividend on unvested shares 21 –Cash-based portion of annual incentive plan converted to equity-settled plan 24.4.1.2 1,025 –
Closing balance 4,999 1,888
NOTeS TO THe CONSOLiDATeD FiNANCiAL STATeMeNTS continuedsection v: sHare capital and reserves

GoVErNaNCEStratEGIC rEPortoVErVIEw FINaNCIal StatEMENtS aDDItIoNal INForMatIoNPortFolIo rEVIEw
149148 Globalworth annual report and financial statements 2020Globalworth annual report and financial statements 2020
24 Share-based Payment reserve continuedPolicy continued24.4.1.1 Share-based Incentive Bonus for the YearFollowing the assessment performed of the current year’s achievements for the specific key performance indicators compared to the target amounts set for the year, the Group has provisioned €4.0 million for the benefit of DABP participants as of 31 December 2020. Out of the total incentive amount, €3.8 million was capitalised as cost of new lease addendum signed during the year and would be amortised on such lease term in the income statement and a corresponding credit was made under trade and other payables, representing the 48% cash element, for an amount of €1.9 million. In addition, a share-based payment reserve was set up, representing the 52% of deferred shares element, for an amount of €2.1 million. Dividend equivalents are paid in relation to shares which vest until the normal vesting date or, if there is one, until the end of the holding period.
24.4.1.2 Cash-based Portion of Annual Incentive Plan Converted to Equity Settled PlanFollowing the assessment performed of the 2019 annual year’s achievements for the specific key performance indicators compared to the target amounts set for 2019, the Group has provisioned €3.8 million for the benefit of DABP participants as of 31 December 2019 representing the 50% cash element, for an amount of €1.9 million and a similar amount as thedeferred shares element. However, due to COVID-19, the Board converted the remaining cash-based liability into an equity-settled performance plan in order to maintain the level of liquidity.
24.4.2 Long-term Incentive PlanThe LTIP provides the long-term incentive arrangement for the Investment Manager and selected senior employees (the “LTIP Participants”). Under the LTIP, it is intended that performance share awards will be granted on an annual basis either in the form of Company shares without cost to the LTIP participant or nil (or nominal) cost options to subscribe to Company shares. Annual awards will be determined by reference to that number of shares which equals in value to a maximum of 100% of salary for employees who are not a Directors of the Company and 150% of salary for the Executive Director of the Company.
Awards vest three years from the date of grant of the award (or upon the assessment of performance conditions if later) subject to the LTIP participant’s continued service and the extent to which the performance conditions specified for the awards are satisfied.
Performance conditions applying to the first awards will be based 50% on relative Total Shareholder Return (“TSR”) and 50% on growth in Total Accounting Return per share (“TAR”) (defined as the growth in the Company’s EPRA Net Asset Value per share and dividend distributions per share paid over the three-year LTIP performance period). The achievement of a threshold level of performance will result in vesting of 25% of the maximum award. Full vesting will occur for equalling or exceeding the maximum performance target. A target level of performance may also be set between the threshold and maximum performance targets. The level of vesting for the achievement of target performance would take account of the difficulty of achieving target performance. Straight-line vesting will take place for performance between threshold, target, and maximum. Dividend equivalents will be paid in relation to shares which vest until the normal vesting date or, if there is one, until the end of the holding period.
In the prior year, the Group recorded €0.14 million provisional expense considering the performance of Company’s TAR performance for the year ended 31 December 2019, however, during the current year no further provision was recorded due to the negative growth in TAR and significant share price decrease during the year.
24.5 treasury Shares
Note
2020 2019
Amount€’000
Number(‘000)
Amount€’000
Number(‘000)
Opening balance (8,379) (929) (842) (94)Shares purchased with cash by the Company 24.5.1 (8,345) (1,562) (7,295) (800)Shares for Executive Directors and other senior management
employees 24.2 392 43 464 51Shares for subsidiaries’ employee share award plan 24.3 540 62 784 87Shares for performance incentive plan termination 24.4 – – 1,538 169Shares for long-term incentive plan – – (3,028) (342)Transfer of vested shares for performance incentive scheme
termination 2,544 277 – –Dividend on treasury shares held by subsidiary 271 – – –
Closing balance (12,977) (2,109) (8,379) (929)
24.5.1 Shares Purchased with Cash by the CompanyDuring the period from April 2020 to September 2020, the Group purchased 1.5 million of its own ordinary shares of no par value for the total amount of €8.345 million in order to meet obligations arising under share award plans in place for the Group.
24.5.2 Former Performace Incentive SchemeIn the prior year the Group decided to terminate the incentive fee arrangements existing at that time (the “Plan”) for Globalworth Investment Advisers Ltd (“GIAL” or the “Investment Manager”) a wholly owned subsidiary of the Group. Following the recommendation of the Remuneration Committee, the Board of the Company approved that the fair termination value of the Plan is €55 million. On 5 July 2019, the termination value of €55 million was charged to retained earnings in accordance with the related provisions of IFRS 2 (Share-based Payment). The termination value was for an amount of €25.8 million settled in cash and for an amount of €29.2 million settled with the delivery of 3.2 million shares to participants.
25 Capital ManagementThe Company has no legal capital regulatory requirement. The Group’s policy is to maintain a strong equity capital base so as to maintain investor, creditor and market confidence and to sustain the continuous development of its business. The Board considers from time to time whether it may be appropriate to raise new capital by a further issue of shares. The Group monitors capital primarily using an LTV ratio and manages its gearing strategy to a long-term target LTV of less than 40%.
The LTV is calculated as the amount of outstanding debt (Group’s debt balance plus 50% of joint ventures’ debt balance), less cash and cash equivalents (Group’s cash balance plus 50% of joint ventures’ cash balance), divided by the open market value of its investment property portfolio (Group’s investment property- freehold portfolio plus 50% of joint ventures’ investment property – freehold value) as certified by external valuers. The future share capital raise or debit issuance are influenced, in addition to other factors, by the prevailing LTV ratio.
Note2020
€’0002019
€’000
Interest-bearing loans and borrowings (face value) 14 1,660,746 1,342,050Less:Cash and cash equivalents 19 527,801 291,694
Group interest-bearing loans and borrowings (net of cash) 1,132,945 1,050,356
Add:50% Share of Joint Ventures’ interest-bearing loans and borrowings 3,514 –50% Share of Joint Ventures’ cash and cash equivalents (311) (129)
Combined interest-bearing loans and borrowings (net of cash) 1,136,148 1,050,227
Investment propertyLess:Other operating lease commitment
2,981,650
–
3,016,878
1,308
Group open market value as of financial position date 2,981,650 3,015,570
Add:50% Share of Joint Ventures’ open market value as of financial position date 27 25,600 14,750
Open market value as of financial position date 3,007,250 3,030,320
Loan-to-value ratio (“LTv”) 37.8% 34.7%
Since the carrying value of the lease liability closely matches with the fair value of the investment property – leasehold at 31 December 2020 under the applicable accounting policy as per IFRS 16, both asset and liability, related to the right of perpetual usufruct of the lands, are excluded from the above calculation.
NOTeS TO THe CONSOLiDATeD FiNANCiAL STATeMeNTS continuedsection v: sHare capital and reserves

GoVErNaNCEStratEGIC rEPortoVErVIEw FINaNCIal StatEMENtS aDDItIoNal INForMatIoNPortFolIo rEVIEw
151150 Globalworth annual report and financial statements 2020Globalworth annual report and financial statements 2020
NOTeS TO THe CONSOLiDATeD FiNANCiAL STATeMeNTS continuedsection vi: investment in suBsidiaries, Joint ventures and related disclosure
27 investment in Joint venturesPolicyThe Group’s investments in its joint ventures is accounted for using the equity method in the consolidated financial statements. Under the equity method, the investment in a joint venture is initially recognised at cost. The carrying amount of the investment is adjusted to recognise the change in the Group’s share of net assets of the joint venture since the acquisition date. Goodwill relating to the joint venture is included in the carrying amount of the investment and is not tested for impairment separately.
After application of the equity method, the Group determines whether it is necessary to recognise an impairment loss on its investment in its joint venture. The Group’s share of the results of operations of the joint venture is recorded in the income statement after adjusting the transaction between the Group and the joint venture to the extent of the interest in the joint venture. When necessary, adjustments are made to bring the accounting policies in line with those of the Group.
Judgements and assumptions Used for Joint VenturesJoint control is the contractually agreed sharing of control of an arrangement, which exists only when decisions about the relevant activities require the unanimous consent of the parties sharing control. The considerations made in determining significant influence or joint control are similar to those necessary to determine control over subsidiaries. Following such assessment the Group’s investment was classified as a joint venture.
As at 31 December 2020, the Group determined that there is no objective evidence that the investments in the joint venture are impaired. The financial statements of each joint venture are prepared for the same reporting period as the Group. The joint ventures had no other contingent liabilities or commitments as at 31 December 2020 (2019: €nil), except construction commitments as disclosed in note 6.
Investments Note2020
€’0002019
€’000
Opening balance 10,010 5,319Investments in the joint ventures (including acquisition costs) 27.1 – 6,452Transition of joint venture to subsidiary with change of control – (9,511)Share of profit during the year 1,897 7,750
Sub-total 11,907 10,010
Loans receivable from joint venturesOpening balance 7,847 32,997Loan provided to the joint ventures 16,555 10,267Loan repayments from the joint ventures (8,485) (4,389)Interest repayment from the joint ventures (199) (627)Interest income on the loans to joint ventures 733 1,046Transition of Joint venture to subsidiary with change of control – (31,447)
Sub-total 16,451 7,847
TOTAL 28,358 17,857
Judgements and assumptions Used for Joint VenturesJoint control is the contractually agreed sharing of control of an arrangement, which exists only when decisions about the relevant activities require the unanimous consent of the parties sharing control. The considerations made in determining significant influence or joint control are similar to those necessary to determine control over subsidiaries. Following such assessment, the Group’s investment was classified as a joint venture.
27.1 Investments in the Joint VenturesIn April 2019, the Group’s subsidiary, Globalworth Holdings Cyprus Limited, entered into a joint venture agreement with Bucharest Logistic Park SRL, through which it acquired a 50% shareholding interest (€0.09 million investment) in Global Logistics Chitila SRL (“Chitila Logistics Hub”), an unlisted company in Romania, owning land for further development, at acquisition date, in Chitila, Romania. As at 31 December 2020 and 31 December 2019, the land was classified under the industrial segment for the Group.
In June 2019, the Group’s subsidiary, Globalworth Holdings Cyprus Limited, entered into a joint venture agreement with Mr. Sorin Preda through which it acquired a 50% shareholding interest (€6.36 million investment) in Black Sea Vision SRL (“Constanta Business Park”), an unlisted company in Romania, owning land for further development, at acquisition date, in Constanta, Romania. As at 31 December 2020 and 31 December 2019, the land was classified under the industrial segment for the Group.
26 GoodwillPolicyGoodwill only arises upon a business combination, and is initially measured at cost, being the excess of the aggregate of the consideration transferred and the amount recognised for non-controlling interests, and any previous interest held, after recognising the acquiree’s identifiable assets, liabilities and contingent liabilities.
Subsequently, goodwill is carried at cost and is subject to reviews for impairment at each year-end or whenever there is an indication of impairment. At the date of acquisition, goodwill is allocated to one or more cash-generating units that are expected to benefit from the combination. The recoverable amount of a cash-generating unit, for the purpose of impairment testing, is determined using the discounted cash flows method and is applied to the full cash-generating unit rather than each legal entity. Where the recoverable amount of the cash-generating unit is less than their carrying amount, an impairment loss is recognised. Impairment losses relating to goodwill cannot be reversed in future periods.
Where goodwill arises as a result of deferred tax liabilities, recognised under a business combination on acquisition date, the impairment of this goodwill is calculated according to the amounts of tax optimisation existing at the date of reporting. Where goodwill has been allocated to a cash-generating unit and part of the operation within that unit is disposed of, the goodwill associated with the disposed operation is included in the carrying amount of the operation when determining the gain or loss on disposal. Goodwill disposed in these circumstances is measured based on the relative values of the disposed operation and the portion of the cash-generating unit retained.
2020€’000
2019€’000
Balance at 31 December 12,349 12,349
Goodwill is allocated to the Group’s cash-generating units (“CGUs”) which represented individual properties acquired under business combinations. The opening balance represents goodwill from deferred tax liabilities, recognised at the acquisition date of a subsidiary (Globalworth Asset Managers SRL), and its property management activities.
Key estimates and Assumptions Used for Goodwill impairment TestingThe Group’s impairment test for goodwill is based on value-in-use calculations that use a discounted cash flows model. The cash flows are derived from the budget for the next four years approved by management and significant future investments that will enhance the asset base of the cash-generating unit being tested. These calculations require the use of estimates which mainly include the assumptions on the financial performance of a CGU’s operations. The recoverable amount is most sensitive to the discount rate used for the discounted cash flows model as well as the expected future cash-inflows and the growth rate used for extrapolation purposes.
At 31 December 2020, the goodwill related to property management activity with a carrying value of €6.7 million (2019: €6.7 million) was tested for impairment. No impairment charge arose as a result of this assessment at year-end. Management believes that as of 31 December 2020 no reasonable change in the main assumptions could result in an impairment charge (31 December 2019: same).
At 31 December 2020 and 2019 respectively, the value-in-use of the property management activity was determined based on the following main assumptions: – forecasts for 4 years; – discount rate of 5.3% p.a. as of 31 December 2020 (2019: 5.1% p.a.); and – extrapolation to perpetuity from year 4 onwards, considering a growth rate of 2.5% p.a. (2019: 2.5% p.a.).
The goodwill with a carrying value of €5.7 million (2019: €5.7 million) related to deferred tax liabilities recognised on acquisition was not tested for impairment as there were no changes in the tax circumstances of the relevant entities or other events that would indicate an impairment thereof.

GoVErNaNCEStratEGIC rEPortoVErVIEw FINaNCIal StatEMENtS aDDItIoNal INForMatIoNPortFolIo rEVIEw
153152 Globalworth annual report and financial statements 2020Globalworth annual report and financial statements 2020
2019€’000
ConstantaBusiness
Park
2019€’000Chitila
LogisticsHub
2019€’000
Combined
Completed investment property – – –Investment property under development 3,300 3,100 6,400Land bank – for further development 19,300 3,800 23,100Other non-current assets 1,074 1,203 2,277
Total non-current assets 23,674 8,103 31,777
Other current assets 506 368 874Cash and cash equivalents 98 159 257
Total assets 24,278 8,630 32,908
Loans payable to the Group 2,909 4,938 7,847Loan from joint venture partner 153 – 153Other non-current liabilities 2,495 108 2,603
Total non-current liabilities 5,557 5,046 10,603
Loan from joint venture partner – 2,614 2,614Other current liabilities 897 456 1,353
Total liabilities 6,454 8,116 14,570
Net assets 17,824 514 18,338
The Group has signed loan facilities, amounting to €23 million (€20.5 million at 31 December 2019), with the Chitila Logistics Hub and Constanta Business Park joint ventures to fund the development costs of the projects, out of which €7.2 million was available for future drawdown as of 31 December 2020 (€10.5 million at 31 December 2019). Further details on investment property is disclosed in note 4.1.
Summarised Statements of Financial Performance of the Joint Ventures during 2020The table below includes individual and combined income statements of the joint ventures extracted from the individual financial statements of each joint venture without adjusting for the transactions with the Group.
2020€’000
ConstantaBusiness
Park
2020€’000
ChitilaLogistics
Hub
2020€’000
Combined
Revenue 107 288 395Operating expenses (83) (103) (186)Administrative expenses (50) (40) (90)Fair value gain on investment property 2,556 2,423 4,979Foreign exchange loss (33) (46) (79)
Profit before net financing cost 2,497 2,522 5,019Finance expense (206) (332) (538)Finance income 8 7 15Income tax expense (453) (427) (880)
Total comprehensive income for the year 1,846 1,770 3,616
27 investment in Joint ventures continuedJudgements and assumptions Used for asset acquisitionAt the time of acquisition, the Group considered whether the acquisition represented an acquisition of a business or an acquisition of an asset. In the absence of an integrated set of activities required for a business other than the property, the Group concluded the acquisition of the subsidiary does not represent a business therefore accounted for it as an acquisition of a group of assets and liabilities. The cost to acquire the entity is allocated between the identifiable assets and liabilities of the entity based upon their relative fair values at acquisition date and no goodwill or deferred tax is recognised.
Fair Value of Group’s 50% Share in the Net Equity of the Joint VentureUntil the disposal date, the carrying amount of the investment in the joint venture was recorded at cost plus the change in the Group’s share of net assets of the joint venture until the disposal date. Following the acquisition of a 50% stake from the joint venture partner, the Group derecognised the investment in the ioint venture and loans receivable from the joint venture at 50% of the net assets of the venture company, representing identifiable assets and liabilities with their fair values at the acquisition date without deferred tax liability outstanding in the individual financial statements of the venture.
Summarised Statements of Financial Position of the Joint Ventures as at 31 DecemberThe summarised statements of financial position of the joint ventures is disclosed below, which represents the assets and liabilities recognised in the financial statements of each joint venture without adjusting of the balance payable to or receivable from the Group. Transactions and balances receivable or payable between the Group and the individual joint ventures are disclosed in note 30.
2020€’000
ConstantaBusiness
Park
2020€’000
ChitilaLogistics
Hub
2020€’000
Combined
Completed investment property 12,000 13,800 25,800Land bank – for further development 21,400 4,000 25,400Other non-current assets 29 96 125
Total non-current assets 33,429 17,896 51,325
Other current assets 403 345 748Cash and cash equivalents 420 203 623
Total assets 34,252 18,444 52,696
Loans payable to the Group 11,060 5,391 16,451Bank loans (at amortised cost) – 6,976 6,976Loan from joint venture partner 150 2,670 2,820Other non-current liabilities 3,009 534 3,543
Total non-current liabilities 14,219 15,571 29,790
Loan from joint venture partner 9 276 285Other current liabilities 356 313 669
Total liabilities 14,584 16,160 30,744
Net assets 19,668 2,284 21,952
NOTeS TO THe CONSOLiDATeD FiNANCiAL STATeMeNTS continuedsection vi: investment in suBsidiaries, Joint ventures and related disclosure

GoVErNaNCEStratEGIC rEPortoVErVIEw FINaNCIal StatEMENtS aDDItIoNal INForMatIoNPortFolIo rEVIEw
155154 Globalworth annual report and financial statements 2020Globalworth annual report and financial statements 2020
28 investment in SubsidiariesPolicyThe Group assesses whether it has control over a subsidiary or an investee, in order to consolidate the assets, liabilities, income and expenses of the subsidiary or the investee in the Group’s consolidated financial statements, based on certain judgements and assumptions.
Key Judgements and assumptions Used in Determining the Control over an Entity: – Power over the investee (i.e. existing rights, directly or indirectly, in the investee that give it the current ability to direct the
relevant activities of the investee). If the Group has less than a majority of the voting or similar rights of an investee, the Group considers all relevant facts and circumstances in assessing whether it has power over an investee, including the contractual arrangement with the other vote holders of the investee, rights arising from other contractual arrangements and the Group’s voting rights and potential voting rights.
– Exposure, or rights, to variable returns from its involvement with the investee. – The ability to use its power over the investee to affect its returns (such as the appointment of an administrator or director in
the subsidiary or investee).
Details on all direct and indirect subsidiaries of the Company, over which the Group has control and consolidated as of 31 December 2020 and 31 December 2019, are disclosed in the table below. The Group did not have any restrictions (statutory, contractual or regulatory) on its ability to transfer cash or other assets (or settle liabilities) between the entities within the Group.
As of 31 December 2020, the Group consolidated the following subsidiaries, being holding companies as principal activities.
Subsidiary Note
31 December2020
Shareholdinginterest (%)
31 December2019
Shareholdinginterest (%)
Place ofincorporation
Globalworth Investment Advisers Limited 100 100 Guernsey,Channel
Globalworth Finance Guernsey Limited 28.2 – 100 Islands
Globalworth Holding B.V. Globalworth Poland Real Estate N.V.
28.1 ––
100100
Netherlands
Elgan Automotive Kft. 28.1 100 100 Hungary
Globalworth Holdings Cyprus LimitedZaggatti Holdings LimitedTisarra Holdings LimitedRamoro LimitedVaniasa Holdings LimitedSerana Holdings LimitedKusanda Holdings LimitedKifeni Investments Limited
Casalia Holdings Limited 28.3 100 100 Cyprus
Pieranu Enterprises LimitedDunvant Holding LimitedOystermouth Holding LimitedKinolta Investments LimitedGlobalworth Tech LimitedMinory Investments LimitedSaniovo Holdings Limited 28.2 – 100 Cyprus
IB 14 Fundusz Inwestycyjny Zamkniety Aktywow NiepublicznychWagstaff Investments Sp. z o.o.GPRE Management Sp. z o.o.Lima Sp. z o.o.Luapele Sp. z o.o. w likwidacji 28.2GPRE Property Management Sp. z o.o.West Gate Wroclaw Sp. z.o.o. 100 100 Poland
27 investment in Joint ventures continued
2019€’000
RenaultBucharest
Connected & Globalworth West
2019€’000
ConstantaBusiness
Park
2019€’000Chitila
LogisticsHub
2019€’000
Combined
Revenue 6,092 – – 6,092Operating expenses (1,538) – – (1,538)Administrative expenses (145) (13) (25) (183)Fair value gain on investment property 6,529 7,990 644 15,163Foreign exchange loss (95) (13) (18) (126)
Profit before net financing cost 10,843 7,964 601 19,408Finance expense (1,579) – – (1,579)Finance income 11 1 1 13Income tax expense (1,858) (1,282) (107) (3,247)
Total comprehensive income for the year 7,417 6,683 495 14,595
Income tax expense mainly represents deferred tax expense on the valuation of investment property.
Share of Profit of Equity-accounted Investments in Joint VenturesThe following table presents a reconciliation between the profit for the years ended 31 December 2020 and 2019 recorded in the individual financial statements of the joint ventures with the share of profit recognised in the Group’s financial statements under the equity method.
2020€’000
ConstantaBusiness
Park
2020€’000
ChitilaLogistics
Hub
2020€’000
Combined
Profit for the year 1,846 1,770 3,616
Group 50% share of profit for the year 923 885 1,808
Adjustments for transaction with the Group 43 46 89
Share of profit of equity-accounted investments in joint ventures 966 931 1,897
2019€’000
RenaultBucharest
Connected & Globalworth West
2019€’000
ConstantaBusiness
Park
2019€’000Chitila
LogisticsHub
2019€’000
Combined
Profit for the year 7,417 6,683 495 14,595
Group 50% share of profit for the year 3,709 3,342 248 7,299
Adjustments for transaction with the Group 483 (2) (30) 451
Share of profit of equity-accounted investments in joint ventures 4,192 3,340 218 7,750
NOTeS TO THe CONSOLiDATeD FiNANCiAL STATeMeNTS continuedsection vi: investment in suBsidiaries, Joint ventures and related disclosure

GoVErNaNCEStratEGIC rEPortoVErVIEw FINaNCIal StatEMENtS aDDItIoNal INForMatIoNPortFolIo rEVIEw
157156 Globalworth annual report and financial statements 2020Globalworth annual report and financial statements 2020
Changes in Group Structure During 202028.1 Mergers During the YearDuring the year ended 31 December 2020 the following subsidiaries merged: – Charlie RE Sp. z o.o. absorbed two entities, Lamantia Investments Sp. z o.o. and Lamantia Sp. z o.o. As part of the merger
process Charlie RE Sp. z o.o. was renamed to Lamantia Sp. z o.o. All companies were registered in Poland. Lamantia Investments Sp. z o.o. was the owner of Philips House investment property and the other companies were holding companies.
– Elissea Investments Sp. z o.o. absorbed two entities, namely West Link Investments Sp. z o.o. and West Link Sp. z o.o. As part of merger process Elissea Investments Sp. z o.o. was renamed to West Link Sp. z o.o. All companies were registered in Poland. West Link Investments Sp. z o.o. was the owner of West Link investment property and the other companies were holding companies.
– Gold Project Sp. z o.o. absorbed two entities, namely Gold Project Investments Sp z o.o. and Light Project Sp z o.o. All absorbed companies were holding companies registered in Poland. Gold Project Investments Sp z o.o. was the owner of Skylight & Lumen investment property and the other companies were holding companies.
– Akka RE Sp. z o.o. absorbed two entities, namely Nordic Park Investments Sp. z o.o. and Nordic Park Offices Sp. z o.o. As part of merger process Akka RE Sp. z o.o. was renamed to Nordic Park Offices Sp. z o.o. All companies were registered in Poland. Nordic Park Investments Sp. z o.o. was the owner of Nordic Park investment property and the other companies were holding companies.
– December RE Sp. z o.o. absorbed two entities, namely Dom Handlowy Renoma Investments Sp. z o.o. and Dom Handlowy Renoma Sp. z o.o. As part of the merger process December RE Sp. z o.o. was renamed to Dom Handlowy Renoma Sp. z o.o. All companies were registered in Poland. Dom Handlowy Renoma Investments Sp. z o.o. was the owner of the Renoma investment property and the other companies were holding companies.
– Globalworth Holdings Cyprus Limited absorbed Globalworth Holding B.V. – During 2020 Kinolta Investments Limited and Elgan Automotive Kft. have started a cross-border merger process which is
expected to be finalised in 2021.
28.2 liquidations During the YearGlobalworth Finance Guernsey Limited and Saniovo Holdings Limited were stricken off from the registers of the Registrars of Companies in Guernsey and Cyprus, on 7 July 2020 and 13 July 2020, respectively.
At 31 December 2020, the Polish entity Luapele Sp. z o.o. w likwidacji was under a liquidation process, following which it will be stricken off from the Registrar of Companies in Poland during 2021.
28.3 Subsidiaries Under Voluntary liquidation ProcessDuring the year following companies transferred all assets to Globalworth Holdings Cyprus Limited as settlement for the equity investment and shareholder loans from Globalworth Holdings Cyprus Limited. These companies have applied for voluntary liquidation: Ramoro Limited, Zaggatti Holdings Limited, Vaniasa Holdings Limited, Oystermouth Holding Limited, Pieranu Enterprises Limited, Dunvant Holding Limited and Casalia Holdings Limited.
28 investment in Subsidiaries continued
As of 31 December 2020, the Group consolidated the following subsidiaries, which own real estate assets in Romania and Poland, being asset holding companies as their principal activities, except Globalworth Building Management SRL with building management activities, and Fundatia Globalworth and Fundacja Globalworth Poland, non-profit organisations with corporate social responsibility activities.
Subsidiary Note
31 December 2020
Shareholding interest (%)
31 December 2019 Shareholding
interest (%)Place of
incorporation
Aserat Properties SRLBOB Development SRLBOC Real Property SRLCorinthian Five SRLCorinthian Tower SRLCorinthian Twin Tower SRLElgan Automotive SRLElgan Offices SRLGlobalworth Asset Managers SRLGlobalworth Building Management SRL 100 100 RomaniaGlobalworth EXPO SRLSPC Beta Property Development Company SRLSPC Epsilon Property Development Company SRLSPC Gamma Property Development Company SRLNetron Investment SRLSEE Exclusive Development SRLTower Center International SRLUpground Estates SRLFundatia Globalworth
DH Supersam Katowice Sp. z o.o.Hala Koszyki Sp. z o.o.Dolfia Sp. z o.o.Ebgaron Sp. z o.o.Bakalion Sp. z o.o.Centren Sp. z o.o.Tryton Business Park Sp. z o.o.A4 Business Park Sp. z o.o.West Link Sp. z o.o.Lamantia Sp. z o.o.Dom Handlowy Renoma Sp. z o.o.Nordic Park Offices Sp. z o.o.Warta Tower Sp. z o.o. 28.1 100 100 PolandQuattro Business Park Sp. z o.o.West Gate Investments Sp. z o.o.Gold Project Sp. z o.o.Spektrum Tower Sp. z o.o.Warsaw Trade Tower 2 Sp. z o.o.Rondo Business Park Sp. z o.o.Artigo Sp. z o.o.Ingadi Sp. z o.o.Imbali Sp. z o.o.Kusini Sp. z o.o.Podium Park Sp. z o.o.Fundacja Globalworth Poland
NOTeS TO THe CONSOLiDATeD FiNANCiAL STATeMeNTS continuedsection vi: investment in suBsidiaries, Joint ventures and related disclosure

GoVErNaNCEStratEGIC rEPortoVErVIEw FINaNCIal StatEMENtS aDDItIoNal INForMatIoNPortFolIo rEVIEw
159158 Globalworth annual report and financial statements 2020Globalworth annual report and financial statements 2020
NOTeS TO THe CONSOLiDATeD FiNANCiAL STATeMeNTS continuedsection vii: otHer disclosures
2020 2019
Office€’000
Mixed-use
€’000residential
€’000Other€’000
inter-segment
eliminations€’000
Total€’000
Office€’000
Mixed use€’000
Residential€’000
Other€’000
Inter-segment
eliminations€’000
Total€’000
rental income – Total 136,598 13,045 1,640 9,609 (440) 160,452 123,867 16,659 1,892 9,251 (173) 151,496
Romania 58,460 – 1,640 9,609 (274) 69,435 51,549 – 1,892 9,251 (66) 62,626
Poland 78,138 13,045 – – (166) 91,017 72,318 16,659 – – (107) 88,870
revenue from contract with customers – Total 52,799 6,454 526 5,358 (2,280) 62,857 56,787 7,251 812 6,257 (357) 70,750
Romania 23,746 – 526 5,358 (369) 29,261 29,058 – 812 6,257 (308) 35,819
Poland 29,053 6,454 – – (1,911) 33,596 27,729 7,251 – – (49) 34,931
revenue–Total 189,397 19,499 2,166 14,967 (2,720) 223,309 180,654 23,910 2,704 15,508 (530) 222,246
Operating expenses (53,512) (7,206) (934) (5,462) 1,083 (66,031) (59,967) (7,751) (1,111) (6,010) 305 (74,534)
Segment NOi 135,885 12,293 1,232 9,505 (1,637) 157,278 120,687 16,159 1,593 9,498 (225) 147,712
NOI – Romania 57,645 – 1,232 9,505 (474) 67,908 48,749 – 1,593 9,498 (69) 59,771
NOI – Poland 78,240 12,293 – – (1,163) 89,370 71,938 16,159 – – (156) 87,941
Administrative expenses (10,966) (1,231) (197) (7,066) 1,474 (17,986) (12,923) (2,492) (515) (7,521) 4,149 (19,302)
Acquisition costs (2,907) – – 218 – (2,689) (232) – – (8) – (240)
Fair value (loss)/gain on investment property (82,068) (32,924) (536) (625) – (116,153) 120,217 (8,414) (999) 6,914 – 117,718
Depreciation on other long-term assets (402) (2) (62) – – (466) (190) – (66) (150) – (406)
Other expenses (1,271) (543) *(421) (330) – (2,565) (4,720) (206) *(1,613) (653) – (7,192)
Other income 260 236 7 52 (61) 494 349 9 97 482 (5) 932
Gain resulting from acquisition of joint venture as subsidiary – – – – – – 2,864 – – – – 2,864
Foreign exchange loss (71) (33) (22) (269) – (395) (676) (22) 1 (191) – (888)
Finance cost (51,506) (12,304) 17 (598) 13,251 (51,140) (43,329) (1,427) (4) (290) – (45,050)
Finance income 14,568 8 13 132 (12,338) 2,383 2,087 22 35 272 – 2,416
Segment result 1,522 (34,500) 31 1,019 689 (31,239) 184,134 3,629 (1,471) 8,353 3,919 198,564
Share-based payment expense – – (13) (1,071) 13 (1,071) – – – (496) – (496)
Gain from fair value of financial instruments (47) – – – – (47) 1,898 – – – – 1,898
Share of profit of equity–accounted investments in joint ventures – – – 1,897 – 1,897 4,192 – – 3,558 – 7,750
Profit before tax 1,475 (34,500) 18 1,845 702 (30,460) 190,224 3,629 (1,471) 11,415 3,919 207,716
* Other expenses include a loss on sale of non-core investment property (apartments) and other one-off expenses.
This section includes segmental disclosures highlighting the core areas of Globalworth’s operations in the Office, Mixed use, Residential and other (Industrial and Corporate segments). There were no significant transactions between segments except for management services provided by the offices segment to the residential and other (industrial) segments.
This section also includes the transactions with related parties, new standards and amendments, contingencies that existed at the year-end and details on significant events which occurred in 2020.
29 Segmental informationThe Board of Directors is of the opinion that the Group is engaged mainly in real estate business, comprising Offices, Mixed-use, Industrial and Residential investment properties segment and property management services, in two geographical areas, Romania and Poland.
Operating segments are reported in a manner consistent with the internal reporting provided to the chief operating decision- makers. The chief operating decision-makers who are responsible for allocating resources and assessing performance of the operating segments, have been identified as the Executive Directors.
The Group earns revenue and holds non-current assets (investment properties) in Romania and Poland, the geographical area of its operations. For investment property, discrete financial information is provided on a property-by-property basis (including those under construction or refurbishment) to members of executive management, which collectively comprise the Executive Directors of the Group. The information provided is Net Operating Income (“NOI" i.e. gross rental income less property expenses) and valuation gains/losses from property valuation at each semi-annual basis. The individual properties are aggregated into Office, Mixed-use, Industrial and Residential segments.
Industrial property segment and head office segments are presented on a collective basis as Others in below table since their individual assets, revenue and absolute profit (or loss) are below 10% of all combined total asset, total revenue and total absolute profit (or loss) of all segments. All Other segments are disclosed separately as these meet the quantitative threshold of IFRS 8.
Consequently, the Group is considered to have four reportable operating segments: the Offices segment (acquires, develops, leases and manages offices and spaces), the Residential segment (builds, acquires, develops and leases apartments), Mixed-use and the Other segment (acquires, develops, leases and manages industrial spaces and corporate office). Share-based payments expense is not allocated to individual segments as underlying instruments are managed at Group level. Segment assets and liabilities reported to executive management on a segmental basis are set out below:

GoVErNaNCEStratEGIC rEPortoVErVIEw FINaNCIal StatEMENtS aDDItIoNal INForMatIoNPortFolIo rEVIEw
161160 Globalworth annual report and financial statements 2020Globalworth annual report and financial statements 2020
30 Transactions with related PartiesThe Group’s related parties are joint ventures, the Company’s Executive and Non-executive Directors, key other executives, as well as all the companies controlled by them or under their joint control, or under significant influence. The related party transactions are set out in the table below:
Name Nature of transactions/balances amounts
Income statement Statement of financial position amounts owing (to)/fromIncome/(expense)
2020€’000
2019€’000
2020€’000
2019€’000
Mindspace Ltd.1 Trade and other receivables – – n/a1 36Revenue 665 3,016 n/a1 –Deposits from tenant – – n/a1 (1,167)Lease incentive cost2 – – n/a1 4,582Trade and other payables – – n/a1 (144)
Elgan Offices SRL (50% Joint Venture)3
Finance income – 966 – –Management fees – 125 – –Office rent – 24 – –
Global Logistics Chitila SRL (50% Joint Venture)
Shareholder loan receivable – – 5,391 4,939Finance income 402 71 – –Office rent 12 11 – –
Black Sea Vision SRL (50% Joint Venture)
Shareholder loan receivable – – 11,060 2,909Finance income 331 9 – –Office rent 12 6 – –
Mr. Adrian Danoiu (Chief Operating Officer – Romania)
Trade and other receivables – – – 35Revenue from sale of commercial
property – 133 – –
Mr. Ioannis Papalekas (Chief Executive Officer – until 16 December 2020)
Donation made to Fundatia Globalworth
200 75 – –
Mr. Dimitris Raptis (Chief Executive Officer – from 16 December 2020)
Other income from sale of fully depreciated car
– 10 – –
Rent revenue 2 2 – –
1. A key Executive of Mindspace Ltd. is a close family member of a former Non-Executive Director of the Company. The former Non-Executive Director of the Company resigned from the Board of the Company on 30 March 2020, therefore, the above table only includes the transactions entered between the subsidiaries of Mindspace Limited (namely Mindspace Co-working SRL and Mindspace Poland S.A.) and certain subsidiaries of the Company until the end of his term in office as a Non-Executive Director of the Company.
2. Lease incentives costs granted in the year were capitalised in the value of Investment Property.3. Amounts disclosed in this table represent pre-acquisition date transactions with Elgan Offices SRL being Joint Venture from 1 January 2019 to
19 December 2019. Elgan Offices SRL was consolidated as a subsidiary from 20 December 2019 (see details in notes 27 and 28).
Key Management remunerationThe Executive Directors and non-Executive Directors are the key management personnel. Their aggregate emoluments, including the amounts awarded under the deferred annual bonus plan applicable only to the Executive Directors, is €1,719 thousand (2019: €50,963 thousand, which included the amount of €47,400 thousand in relation to the termination of the previous performance plan, applicable for the Executive Directors). Out of these amounts, €0.698 million was payable to the Directors as of 31 December 2020 (2019: EUR €0.96 million, plus €7 thousand for out-of-pocket expenses). Further details are disclosed in the Remuneration Committee Report on pages 104 to 107.
29 Segmental information continuedRevenues are derived from a large number of tenants and no tenant contributes more than 10% of the Group’s rental revenues for the year ended 31 December 2020 (2019: €nil).
Segments
2020 2019
Office€’000
Mixed-use
€’000residential
€’000Other€’000
inter segment
eliminations€’000
Total€’000
Office€’000
Mixed-use
€’000Residential
€’000Other€’000
Inter segment
eliminations€’000
Total€’000
Segment
non-current
assets 2,585,332 281,260 66,909 138,577 (407) 3,071,671 2,618,082 313,788 69,108 132,908 (4,366) 3,129,520
Romania 1,222,364 – 66,909 138,577 (200) 1,427,650 1,214,910 – 69,108 132,908 (200) 1,416,726
Poland 1,362,968 281,260 – – (207) 1,644,021 1,403,172 313,788 – – (4,166) 1,712,794
Total assets 3,016,712 287,463 69,516 257,078 (706) 3,630,063 2,829,245 319,639 71,535 267,566 (6,298) 3,481,687
Total liabilities 1,834,889 22,243 4,582 13,914 (929) 1,874,699 1,454,551 22,225 25,403 63,002 1,839 1,567,020
Additions to non-current assets
– Romania 29,440 – 512 3,162 – 33,114 59,004 – 334 6,550 – 65,888
– Poland 45,032 4,484 – – – 49,516 22,820 2,664 – – – 25,484
None of the Group’s non-current assets are located in Guernsey except for goodwill (there are no employment benefit plan assets, deferred tax assets or rights arising under insurance contracts) recognised on business combination.
NOTeS TO THe CONSOLiDATeD FiNANCiAL STATeMeNTS continuedsection vii: otHer disclosures

GoVErNaNCEStratEGIC rEPortoVErVIEw FINaNCIal StatEMENtS aDDItIoNal INForMatIoNPortFolIo rEVIEw
163162 Globalworth annual report and financial statements 2020Globalworth annual report and financial statements 2020
iNDePeNDeNT AUDiTOr’S rePOrT to tHe memBers of gloBalwortH real estate investments limited
31 New and Amended StandardsStarting from 1 January 2020 the Group adopted the following new and amended standards and interpretations. The new standards and amendments had no significant impact on the Group’s financial position and performance.
Narrow scope amendments and new Standardseffective date
(eU endorsement)
Amendments to IFRS 4 Insurance Contracts – Deferral of IFRS 19 (issued on 25 June 2020) Jan-20Amendments to References to the Conceptual Framework in IFRS Standards (issued on 29 March 2018) Jan-20Amendment to IFRS 16 Leases Covid 19 – Related Rent Concessions (issued on 28 May 2020) Jan-20Amendments to IFRS 3 Business Combinations (issued on 22 October 2018) Jan-20Amendment to IAS 1 and IAS 8: Definition of Material Jan-20Amendments to IFRS 9, IAS 39 and IFRS 7: Interest Rate Benchmark Reform (issued on 26 September
2019) Jan-20
For other standards issued but not yet effective and not early adopted by the Group, the management believes that there will be no significant impact on the Group’s consolidated financial statements.
Narrow scope amendments and new Standardseffective date
(eU endorsement)
IFRS 17 Insurance Contracts Jan-23Amendments to IFRS 9, IAS 39, IFRS 7, IFRS 4 and IFRS 16: Interest Rate Benchmark Reform – Phase 2 Jan-21Amendments to IAS 16 Property, Plant and Equipment Jan-22Amendments to IAS 37 Provisions, Contingent Liabilities and Contingent Assets Jan-22Amendments to IFRS 3 Business Combinations Jan-22Annual Improvements 2018 - 2020 Jan-22Amendments to IFRS 4 Insurance Contracts – Deferral of IFRS 19 Jan-21Amendments to IAS 1 Presentation of Financial Statements and IFRS Practice Statement 2: Disclosure
of Accounting Policies Jan-22Amendments to IAS 1 Presentation of Financial Statements: Classification of Liabilities as Current or
Non-current Jan-23
32 ContingenciesTaxationAll amounts due to State authorities for taxes have been paid or accrued at the balance sheet date. The tax system in Romania and Poland undergoes a consolidation process and is being harmonised with the European legislation. Different interpretations may exist at the level of the tax authorities in relation to the tax legislation that may result in additional taxes and penalties payable. Where the State authorities have findings from reviews relating to breaches of tax laws, and related regulations these may result in confiscation of the amounts in case; additional tax liabilities being payable; fines and penalties (that are applied on the total outstanding amount). As a result, the fiscal penalties resulting from breaches of the legal provisions may result in a significant amount payable to the State. The Group believes that it has paid in due time and in full all applicable taxes, penalties and penalty interests in the applicable extent.
Transfer PricingAccording to the applicable relevant tax legislation in Romania and Poland, the tax assessment of related party transactions is based on the concept of market value for the respective transfers. Following this concept, the transfer prices should be adjusted so that they reflect the market prices that would have been set between unrelated companies acting independently (i.e. based on the “arm’s length principle”). It is likely that transfer pricing reviews will be undertaken in the future in order to assess whether the transfer pricing policy observes the “arm’s length principle” and therefore no distortion exists that may affect the taxable base of the taxpayer in Romania and Poland.
Legal ProceedingsIn recent years the Romanian State Authorities initiated reviews of real estate restitution processes and in some cases commenced legal procedures where it has considered that the restitution was not performed in accordance with the applicable legislation. The Group is involved in one such case, which is currently at a very early stage and may take a very long time to be concluded, and management believes that the risk of any significant loss occurring in future is remote.
33 Subsequent eventsOn 19 February 2021, the Company announced that its Board of Directors had approved the payment of an interim dividend in respect of the six-month financial period ended 31 December 2020 of €0.15 per ordinary share, which was paid on 19 March 2021 to shareholders on the register as at close of business on Friday 5 March 2021 with a corresponding ex-dividend date of Thursday 4 March 2021.
NOTeS TO THe CONSOLiDATeD FiNANCiAL STATeMeNTS continuedsection vii: otHer disclosures
OpinionWe have audited the consolidated financial statements of Globalworth Real Estate Investments Limited (“the Company”) and its subsidiaries (together “the Group”), which comprise the consolidated statement of financial position as at 31 December 2020, and the consolidated statement of comprehensive income, consolidated statement of changes in equity and consolidated statement of cash flows for the year then ended, and notes to the consolidated financial statements, including a summary of significant accounting policies.
In our opinion, the accompanying consolidated financial statements give a true and fair view of the consolidated financial position of the Group as at 31 December 2020 and its consolidated financial performance and its consolidated cash flows for the year then ended in accordance with International Financial Reporting Standards as adopted by the European Union (“IFRS”) and in compliance with the Companies (Guernsey) Law, 2008, as amended.
Basis for OpinionWe conducted our audit in accordance with International Standards on Auditing (“ISA”). Our responsibilities under those standards are further described in the Auditor’s responsibilities for the audit of the consolidated financial statements section of our report. We are independent of the Group in accordance with the International Code of Ethics for Professional Accountants (including International Independence Standards) (“IESBA Code”), and we have fulfilled our other ethical responsibilities in accordance with the IESBA Code. We believe that the audit evidence we have obtained is sufficient and appropriate to provide a basis for our opinion.
Key Audit MattersKey audit matters are those matters that, in our professional judgment, were of most significance in our audit of the consolidated financial statements of the current period. These matters were addressed in the context of our audit of the consolidated financial statements as a whole, and in forming our opinion thereon, and we do not provide a separate opinion on these matters. For each matter below, our description of how our audit addressed the matter is provided in that context.
We have fulfilled the responsibilities described in the Auditor’s responsibilities for the audit of the consolidated financial statements section of our report, including in relation to these matters. Accordingly, our audit included the performance of procedures designed to respond to our assessment of the risks of material misstatement of the consolidated financial statements. The results of our audit procedures, including the procedures performed to address the matters below, provide the basis for our audit opinion on the accompanying consolidated financial statements.
Key audit Matter how our audit addressed the Key audit Matter
valuation of investment Property (€2,982 million)
The valuation of investment property is the key driver of the Group’s net asset value and total return. Valuation of investment property requires specialist expertise and the use of significant judgements, estimates and assumptions, giving rise to a higher risk of misstatement. The impact of the COVID-19 pandemic on the current economic environment resulted in increased subjectivity and required further consideration from the audit team, including our internal specialists.
For this reason, we consider valuation of investment property a key audit matter.
The Group’s disclosures regarding its accounting policy, fair value measurement and related judgments, estimates and assumptions used for investment property are in notes 3 and 4 of the consolidated financial statements.
The audit procedures performed on the valuation of investment property included among others the following: – We documented our understanding and walkthrough to
confirm the processes, policies and methodologies used by management for valuing investment property; specific attention was given to COVID 19 impact through discussion with management and EY valuation specialists.
– We agreed the valuations recorded in the consolidated financial statements to the values reported by the Group’s independent experts (“specialists”);
– We agreed a sample of the significant inputs, particularly rental data, let areas and projected capex, used by the specialists to value investment property to contractual documentation and development plans;
– We tested the arithmetical accuracy of the calculations done by specialists for the main assumptions in the models, by performing a sample of their calculations;
– We involved our own internal valuation specialists from Romania and Poland to assist us to: – evaluate, using their knowledge of the market, and
corroborate the market related judgements and valuation inputs (including discount rates, exit yields and sales values) used by the specialists, for a sample of properties (properties with significant value, risky or with significant changes in values or conditions);
– assess the conformity of the valuation methods applied with the applicable valuation standards; and
– evaluate the competence, capability and objectivity of the external valuation specialists.
We also considered the adequacy of disclosures in relation to the investment property valuation.

GoVErNaNCEStratEGIC rEPortoVErVIEw FINaNCIal StatEMENtS aDDItIoNal INForMatIoNPortFolIo rEVIEw
165164 Globalworth annual report and financial statements 2020Globalworth annual report and financial statements 2020
iNDePeNDeNT AUDiTOr’S rePOrT continuedto tHe memBers of gloBalwortH real estate investments limited
Key audit Matter how our audit addressed the Key audit Matter
recognition of rental income including accounting for lease incentives (€160.5 million);
Revenue from rental income is a significant metric and indicator of the Group’s progress and its susceptibility to management override of controls gives rise to a higher risk of misstatement.
The Group provides various lease incentives to its tenants. In order to avoid double counting, the carrying amount of the lease incentives is initially included as part of the carrying value of the investment property. At the balance sheet date investment property is remeasured at fair value. Such lease incentives are amortized in the income statement over the duration of the lease together with the rental income. In addition, during the current year there were certain lease concessions granted to tenants due to COVID-19 which in principal led to the extension of the lease contracts.
For these reasons we consider recognition of rental income a key audit matter.
The Group’s disclosures regarding its accounting policy for rental income and lease incentives are in note 7 of the consolidated financial statements.
The audit procedures performed for the audit of revenue included among others the following: – We documented our understanding of the processes, policies
and methodologies used by management in respect of revenue recognition and performed walkthrough tests to confirm our understanding of the systems and controls implemented;
– We performed reasonability tests on rental income to identify any inconsistencies in rental income patterns;
– On a sample basis we agreed rental rates to tenancy agreements and rent received to bank statements;
– On a sample basis we reviewed tenancy agreements signed within 2020 to identify any lease incentives;
– For a sample of tenancy agreements with lease incentives, we recalculated the spreading of the incentives over the period of the contract by reference to the terms of the agreements and we assessed the appropriateness of the accounting treatment by reference to the requirements of IFRS;
– We enquired the Group’s commercial teams about unusual lease terms and we evaluated the completeness of lease incentives through scrutiny of other agreements in place with the tenants;
– We analyzed the accounting treatment for lease concessions and discounts as a response to COVID-19.
We also considered the adequacy of disclosures in relation to rental income.
Other information included in the Group’s 2020 Annual reportThe Directors are responsible for the other information. Other information consists of the information included in the Annual Report, other than the consolidated financial statements and our auditor’s report thereon.
Our opinion on the consolidated financial statements does not cover the other information and we do not express any form of assurance conclusion thereon.
In connection with our audit of the consolidated financial statements, our responsibility is to read the other information and, in doing so, consider whether the other information is materially inconsistent with the consolidated financial statements or our knowledge obtained in the audit or otherwise appears to be materially misstated. If, based on the work we have performed, we conclude that there is a material misstatement of this other information, we are required to report that fact. We have nothing to report in this regard.
responsibilities of Directors and Audit Committee for the Consolidated Financial StatementsDirectors are responsible for the preparation and fair presentation of the consolidated financial statements in accordance with IFRS and in compliance with the Companies (Guernsey) Law, 2008, as amended, and for such internal control as the Directors determine is necessary to enable the preparation of consolidated financial statements that are free from material misstatement, whether due to fraud or error.
In preparing the consolidated financial statements, Directors are responsible for assessing the Group’s ability to continue as a going concern, disclosing, as applicable, matters related to going concern and using the going concern basis of accounting unless the Directors either intend to liquidate the Group or to cease operations, or have no realistic alternative but to do so.
The Audit Committee is responsible for overseeing the Group’s financial reporting process.
Auditor’s responsibilities for the Audit of the Consolidated Financial StatementsOur objectives are to obtain reasonable assurance about whether the consolidated financial statements as a whole are free from material misstatement, whether due to fraud or error, and to issue an auditor’s report that includes our opinion. Reasonable assurance is a high level of assurance, but is not a guarantee that an audit conducted in accordance with ISAs will always detect a material misstatement when it exists. Misstatements can arise from fraud or error and are considered material if, individually or in the aggregate, they could reasonably be expected to influence the economic decisions of users taken on the basis of these consolidated financial statements.
As part of an audit in accordance with ISAs, we exercise professional judgment and maintain professional skepticism throughout the audit. We also: – Identify and assess the risks of material misstatement of the consolidated financial statements, whether due to fraud or
error, design and perform audit procedures responsive to those risks, and obtain audit evidence that is sufficient and appropriate to provide a basis for our opinion. The risk of not detecting a material misstatement resulting from fraud is higher than for one resulting from error, as fraud may involve collusion, forgery, intentional omissions, misrepresentations, or the override of internal control.
– Obtain an understanding of internal control relevant to the audit in order to design audit procedures that are appropriate in the circumstances, but not for the purpose of expressing an opinion on the effectiveness of the Group’s internal control.
– Evaluate the appropriateness of accounting policies used and the reasonableness of accounting estimates and related disclosures made by the Directors.
– Conclude on the appropriateness of the Directors’ use of the going concern basis of accounting and, based on the audit evidence obtained, whether a material uncertainty exists related to events or conditions that may cast significant doubt on the Group’s ability to continue as a going concern. If we conclude that a material uncertainty exists, we are required to draw attention in our auditor’s report to the related disclosures in the consolidated financial statements or, if such disclosures are inadequate, to modify our opinion. Our conclusions are based on the audit evidence obtained up to the date of our auditor’s report. However, future events or conditions may cause the Group to cease to continue as a going concern.
– Evaluate the overall presentation, structure and content of the consolidated financial statements, including the disclosures, and whether the consolidated financial statements represent the underlying transactions and events in a manner that achieves fair presentation.
– Obtain sufficient appropriate audit evidence regarding the financial information of the entities or business activities within the Group to express an opinion on the consolidated financial statements. We are responsible for the direction, supervision and performance of the group audit. We remain solely responsible for our audit opinion.
We communicate with the Audit Committee regarding, among other matters, the planned scope and timing of the audit and significant audit findings, including any significant deficiencies in internal control that we identify during our audit.
We also provide the Audit Committee with a statement that we have complied with relevant ethical requirements regarding independence, and to communicate with them all relationships and other matters that may reasonably be thought to bear on our independence, and where applicable, related safeguards.
From the matters communicated with the Audit Committee, we determine those matters that were of most significance in the audit of the consolidated financial statements of the current period and are therefore the key audit matters. We describe these matters in our auditor’s report unless law or regulation precludes public disclosure about the matter or when, in extremely rare circumstances, we determine that a matter should not be communicated in our report because the adverse consequences of doing so would reasonably be expected to outweigh the public interest benefits of such communication.
The engagement partner on the audit resulting in this independent auditor’s report is Andreas Hadjidamianou.
ernst & Young Cyprus Limited Certified Public Accountants and Registered AuditorsJean Nouvel Tower, 6 Stasinos Avenue, P.O.Box 21656, 1511 Nicosia, Cyprus
25 March 2021

aDDItIoNal INForMatIoNGoVErNaNCEStratEGIC rEPortoVErVIEw FINaNCIal StatEMENtS aDDItIoNal INForMatIoNPortFolIo rEVIEw
165164 Globalworth annual report and financial statements 2020Globalworth annual report and financial statements 2020
ADDITIONAL INFORMATION
schedule of properties: poland 166schedule of properties: romania 168standing portfolio – Breakdown by location & type 170portfolio – Breakdown by location & type 172portfolio analyses 174new epra nav metrics 176investing policy 177glossary 178company directory 181

aDDItIoNal INForMatIoNGoVErNaNCEStratEGIC rEPortoVErVIEw FINaNCIal StatEMENtS aDDItIoNal INForMatIoNPortFolIo rEVIEw
167166 Globalworth annual report and financial statements 2020Globalworth annual report and financial statements 2020
Property nameNumber of Properties Location Address
Year of completion / Latest Refurbishment
GLA (k sqm)
Occupancy(%)
Contracted rent(€m)
WALL (years)
Potential rent at 100%
occupancy (€m)(1)
GAV(€m) Select Tenants
Office(2)
Batory Building (1) 1 Warsaw 212A Jerozolimskie Av. 2000 / 2017 6.6 84.8% 0.9 1.2 1.1 11.4 Solid Group, Impuls Leasing
Bliski Centrum 1 Warsaw 8 Zurawia St. 2000 / 2018 4.9 96.5% 1.0 5.6 1.1 13.7 Eurozet, eToto
Nordic Park 1 Warsaw 8 Herberta St. 2000 / 2018 9.0 86.9% 1.6 2.8 1.9 23.3 Baxter, ZBP
Philips 1 Warsaw 195A Jerozolimskie Av. 1999 / 2018 6.2 91.9% 1.1 1.4 1.2 13.6 Philips, Trane
Skylight & Lumen 2 Warsaw 59 Zlota St. 2007 49.2 83.8% 11.0 3.3 13.2 213.5 Pernod Ricard, Mars, InOffice, Orbis, SEB Leasing
Spektrum Tower 1 Warsaw 18 Twarda St. 2003 / 2015 32.1 90.9% 6.5 3.8 7.3 112.1 CityFit, The View, Westwing, Ecovadis
Warsaw Trade Tower 1 Warsaw 51 Chłodna St. 1999 / 2016 46.8 79.5% 8.2 4.8 10.3 142.8 AXA, MSD Polska
WARTA Tower 1 Warsaw 85 Chmielna St. 2000 33.7 85.7% 5.9 1.0 6.9 59.7 TUiR Warta, ITmagination
CB Lubicz 2 Krakow 23, 23A Lubicz St. 2000 & ‘09 / 2018 & ‘09 25.9 86.3% 4.6 3.4 5.3 74.2 International Paper, Capita, Deutsche Bank
Podium Park I: 2018 18.9 53.9% 1.8 4.0 3.2 Podium Park II: 2020 18.8 82.6% 2.9 4.9 3.4
Podium Park 3 Krakow al. Jana Pawła II 43a Podium Park III: F.D. 17.7 – – – 3.1 93.6 Revolut Ltd, W. Kruk, Ailleron, FMC Technologies
Quattro Business Park 5 Krakow 25 Bora-Komorowskiego Av. 2010, ‘11, ‘13, ‘14 & ‘15 66.2 94.9% 10.5 2.1 11.1 144.4 Capgemini, Google, Luxoft, EPAM
Rondo Business Park 3 Krakow 38 Lublańska St. 2007 - ‘08 20.3 87.3% 2.9 2.9 3.3 36.1 Capgemini, CRIF
Retro Office House 1 Wroclaw 69/73, Piłsudskiego 2019 23.2 96.0% 3.9 3.3 4.1 62.4 Infor, Olympus, Intive
West Gate & West Link 2 Wroclaw 2 Szybowcowa St. 2015 / 2018 33.5 98.9% 5.5 9.2 5.6 84.4 Nokia, Deichmann
A4 Business Park 3 Katowice 42 Francuska St. 2014 - ‘16 33.1 100.0% 5.3 1.9 5.3 67.6 Rockwell, PKP Cargo, IBM
Silesia Star 2 Katowice 10 aleja Rońdzieńskiego 2016 30.2 93.2% 4.7 2.6 4.9 58.3 Getin Bank, Siemens, Idea Getin Leasing, Hireright
Green Horizon 2 Lodz 106a Pomorska St. 2012 - ‘13 35.5 92.3% 4.9 3.4 5.4 69.3 Infosys, Capita, PKO BP
Tryton 1 Gdansk 11 Jana z Kolna St. 2016 25.6 99.6% 4.2 1.9 4.2 57.0 Intel, Kainos, Ciklum
Mixed-Use(2)
Hala Koszyki 5 Warsaw 63 Koszykowa St. 5x2016 22.3 89.9% 6.3 4.6 7.0 121.3 Mindspace, Multimedia, Eneris
Renoma (under refurbishment) 1 Wroclaw 40 Swidnicka St. 2009 40.9 61.6% 4.7 5.5 7.5 103.1 DXC, TK Maxx, Apcoa, Empik, LPP Group,
Supersam 1 Katowice 8 Piotra Skargi St. 2015 24.3 92.9% 3.4 3.1 3.8 48.4 Groupon, LPP Group, JAMF, Sports Direct
right of First Offer (“rOFO”)(3)
My Place I 1 Warsaw Beethovena Street 2019 19.0 92% n/a n/a 3.4 43.4 Havas, MasterCard, DuPont
My Place II 1 Warsaw Beethovena Street 2020 17.1 21% n/a n/a 3.1 27.0 Ars Thanea
Total Standing Commercial Portfolio
No of Commercial Investments: 20 38 566.2 89.4% 97.0 3.5 109.4 1,497.4
Notes(1) Contracted rent at 100% occupancy (including ERV on available spaces).(2) All properties are 100% owned by Globalworth Poland. Globalworth at 31 Dec 2020 held 100.0% in Globalworth Poland.(3) Globalworth Poland has a 25% economic interest in the ROFO assets.
SCHeDULe OF PrOPerTieS: POLAND

aDDItIoNal INForMatIoNGoVErNaNCEStratEGIC rEPortoVErVIEw FINaNCIal StatEMENtS aDDItIoNal INForMatIoNPortFolIo rEVIEw
169168 Globalworth annual report and financial statements 2020Globalworth annual report and financial statements 2020
Property nameNumber of Properties Location Address
Year of completion / Latest Refurbishment
GLA (k sqm)(1)
Occupancy (%)
Contracted rent (€m)
WALL (years)
Potential rent at 100% occupancy
(€m)(2)
GAV (€m) Select Tenants
Office (Standing or Under Construction)
BOB 1 Bucharest 6A Dimitrie Pompeiu Blvd, District 2 2008/2017 22.4 63.7% 2.5 3.5 3.7 47.0 Deutsche Bank, NX Data
BOC 1 Bucharest 3 George Constantinescu St., District 2 2009/2014 57.1 83.8% 8.3 4.0 9.9 140.0 Honeywell, HP, Nestle, Mood Media
City Offices 2 Bucharest 2 – 4A Oltenitei Street., District 4 2014/2017 36.1 79.9% 4.3 6.2 6.0 69.7 Vodafone, BRD, Edenred, RCS-RDS
Gara Herastrau 1 Bucharest 4B Gara Herastrau Street, District 2 2016 12.0 95.9% 2.2 2.2 2.2 28.4 ADP, Qualitest, Baker Tilly
Green Court Complex 3 Bucharest 4 Gara Herastrau, District 2 2014/2015/2016 54.3 98.5% 10.1 3.1 10.3 147.1 Orange, Carrefour, General Motors
Globalworth Campus 3 Bucharest 4-6 Dimitrie Pompeiu Blvd, District 2 2017/2018/2020 90.8 82.0%
(93.0%*) 12.1 8.1 15.0 208.1 Amazon, Unicredit Services, Allianz, Stefanini, Dell,
Mindspace
Globalworth Plaza 1 Bucharest 42 Pipera Road, District 2 2010/2017 24.1 86.9% 4.0 5.7 4.6 61.4 Cegedim, Patria Bank, AC Nielses, Gothaer, Coface
Globalworth Square 1 Bucharest 44 Pipera Street, District 2 2021(E) 29.1 – – – 5.6 42.4 –
Globalworth Tower 1 Bucharest 201 Barbu Vacarescu Street, District 2 2016 54.7 99.3% 12.0 5.1 12.2 184.3 Vodafone, Huawei, NNDKP, Wipro, Mega Image
Renault Bucharest Connected 2 Bucharest Preciziei 3G, District 6 2018 42.3 100.0% 5.7 9.1 5.7 82.1 Automobile Dacia
Tower Center International 1 Bucharest 15-17 Ion Mihalache Blvd, District 1 2012 22.4 99.5% 5.1 4.1 5.1 74.6 EY, Hidroelectrica, Cegeka, Tradeshift, Mindspace
Unicredit HQ 1 Bucharest 1F Expozitiei Blvd, District 1 2012 17.4 100.0% 3.5 4.4 3.5 51.2 Unicredit
industrial (Standing or Under Construction)
Pitesti Industrial Park 1 Pitesti 1 Dacia A1 Street, Oarja, Arges County 2010 68.4 100.0% 3.4 9.9 3.4 49.4 Automobile Dacia
Timisoara Industrial Park I 4 Timisoara Lipovei Way, Giarmata, Timis 2011 103.4 100.0% 4.7 7.0 4.7 59.6 Continental, Valeo Lighting, Honeywell, Litens,
Coca Cola
Timisoara Industrial Park II 1 Timisoara Lipovei Way, Giarmata, Timis 2019 17.9 100.0% 0.8 2.0 0.8 10.0 NDB Logistica, DS Smith Packaging. Mainfreight
Chitila Logistics Hub I(3) 1 Bucharest Chitila, jud. Ilfov 2020 22.7 100.0% 0.9 3.3 0.9 13.8 Mega Image, Dante International
Constanta Business Park I(3) 1 Constanta Lazu, jud. Constanta 2020 20.6 69.2% 0.6 5.8 0.9 12.0 Quadrant Amroq Beverages (Pepsi), Maracana, Maspex
retail / residential (Standing)
Upground Towers 1 Bucharest 9B Fabrica de Glucoza Street, District 2 2011 38.4 Retail: 80.9% /
Resi: 60.1%Retail: 0.6 /
Resi: 1.0Retail: 9.7 /
Resi: 0.9Retail: 0.8 /
Resi: 1.0 69.4 World Class, Mega Image (Delhaize group)
Land for future development
Globalworth West - Bucharest Preciziei 3F -12.1 / 33.4 – – – – 7.8
Green Court D - Bucharest 1 Dimitrie Pompeiu Blvd, District 2 - 4.0 / 16.2 – – – – 5.9
Luterana - Bucharest 7-13 Luterana Street, District 1 - 6.6 / 26.4 – – – – 14.0
Chitila Logistics Hub(3) - Bucharest Chitila, jud. Ilfov -95.5 /
53.0 – – – – 4.0
Constanta Business Park(3) - Constanta Lazu, jud. Constanta -918.6 / 540.6 – – – – 21.4
Timisoara Industrial Park (I and II) - Timisoara Lipovei Way, Giarmata, Timis -
346.3 / 185.1 – – – – 11.3
Herastrau One - Bucharest 48-50 Soseaua Nordului, District 1 - 3.2 / n.a. – – – – 7.9
Total Standing Commercial Portfolio
No of Commercial Investments: 16 25 672.7 92.0% / 93.5%* 80.7 5.6 89.8 1,248.5
Notes(1) GLA of “Land for future development” represents size of land plot / expected GLA upon completion of development.(2) Contracted rent at 100% occupancy (including ERV on available spaces).(3) Properties owned through JV agreements (Chitila Logistics Park and Constanta Business Park) are presented on the 100% basis. Globalworth holds a 50% share in the respective JV companies.(*) Includes tenant options.
SCHeDULe OF PrOPerTieS: rOMANiA

aDDItIoNal INForMatIoNGoVErNaNCEStratEGIC rEPortoVErVIEw FINaNCIal StatEMENtS aDDItIoNal INForMatIoNPortFolIo rEVIEw
171170 Globalworth annual report and financial statements 2020Globalworth annual report and financial statements 2020
STANDiNG POrTFOLiO – BreAKDOwN BY LOCATiON & TYPe(data as of 31 decemBer 2020)
Number of Value Area Occupancy Rate Rent Contracted Headline Rent / Sqm or Unit
Office Portfolio Investments
(#) Properties
(#)GAV (€m)
GLA (k sqm)
by GLA (%)
Contracted Rent (€m)
WALL Years
100% Rent (€m)
Office (€/sqm/m)
Commercial (€/sqm/m)
Logistics / L.I. (€/sqm/m)
Bucharest New CBD 7 11 816.3 315.4 87.7% 51.1 5.1 57.9 14.1 14.1 –
Bucharest Other 4 6 277.6 118.2 93.7% 18.6 6.2 20.4 13.3 13.1 –
romania: Office 11 17 1,093.9 433.6 89.4% 69.7 5.4 78.3 13.9 13.8 –
Warsaw 8 9 590.0 188.6 85.0% 36.1 3.3 42.8 17.1 17.0 –
Krakow 4 12 338.8 150.1 85.7% 22.7 3.0 26.3 13.3 13.3 –
Wroclaw 2 3 146.8 56.6 97.7% 9.4 6.8 9.7 13.3 13.2 –
Lodz 1 2 69.3 35.5 92.3% 4.9 3.4 5.4 11.7 11.8 –
Katowice 2 5 125.9 63.3 96.7% 10.0 2.2 10.2 12.8 12.6 –
Gdansk 1 1 57.0 25.6 99.6% 4.2 1.9 4.2 12.5 12.4 –
Poland: Office 18 32 1,327.8 519.6 89.3% 87.3 3.4 98.6 14.4 14.3 –
Total Office Portfolio 29 49 2,421.7 953.3 89.3% 157.0 4.3 176.9 14.2 14.1 –
Mixed-Use Portfolio
Warsaw 1 5 121.3 22.3 89.9% 6.3 4.6 7.0 22.5 24.0 –
Wroclaw – – – – – – – – – – –
Katowice 1 1 48.4 24.3 92.9% 3.4 3.1 3.8 13.8 11.6 –
Total Mixed-Use Portfolio 2 6 169.7 46.6 91.5% 9.7 4.1 10.8 19.6 17.5 –
Logistics / Light-industrial
Timisoara 2 5 69.6 121.3 100.0% 5.5 6.3 5.5 6.3 3.7 3.5
Pitesti 1 1 49.4 68.4 100.0% 3.4 9.9 3.4 4.2 4.2 4.2
Constanta 1 1 12.0 20.6 69.2% 0.6 5.8 0.9 7.0 3.6 3.3
Bucharest 1 1 13.8 22.7 100.0% 0.9 3.3 0.9 7.1 3.3 3.2
Total Logistics / Light-ind. Portfolio 5 8 144.8 233.1 97.3% 10.4 7.2 10.7 6.0 3.8 3.7
Other Portfolio
Bucharest New CBD Upground Complex – Residential 1 1 59.6 32.4 nm 1.0 0.9 1.0 – – –
Bucharest New CBD Upground Complex – Commercial – – 9.8 6.0 80.9% 0.6 9.7 0.8 – 9.9 –
Total Other Portfolio 69.4 38.4 nm 1.6 4.3 1.8 – 9.9 –
Total Standing Commercial Portfolio 36 63 2,745.9 1,238.9 90.9% 177.7 4.5 199.2 14.2 12.1 3.7
Of which Romania 16 25 1,248.5 672.7 92.0% 80.7 5.6 89.8 13.6 10.1 3.7
Of which Poland 20 38 1,497.4 566.2 89.4% 97.0 3.5 109.4 14.6 14.6 –

aDDItIoNal INForMatIoNGoVErNaNCEStratEGIC rEPortoVErVIEw FINaNCIal StatEMENtS aDDItIoNal INForMatIoNPortFolIo rEVIEw
173172 Globalworth annual report and financial statements 2020Globalworth annual report and financial statements 2020
POrTFOLiO – BreAKDOwN BY LOCATiON & TYPe (data as of 31 decemBer 2020)
GAV (€m) GLA (k sqm) Contracted Rent and ERV (€m)
ERV of Available Spaces Total
Office PortfolioNo. of Standing Investments (#)
Standing Properties (#)
Standing Properties
Under Construction
Land & Future Developments
Total Portfolio
Standing Properties
Under Construction
Future Developments
Total Portfolio
Standing Properties
Under Construction
Future Developments Standing U/C & Future
Standing & U/C Future
Bucharest New CBD 7 11 816.3 42.4 5.9 864.6 315.4 29.1 16.2 360.7 51.1 – – 6.8 5.6 / 3.0 63.5 3.0
Bucharest Other 4 6 277.6 – 29.7 307.3 118.2 – 59.8 178.0 18.6 – – 1.8 – / 10.9 20.4 10.9
romania: Office 11 17 1,093.9 42.4 35.6 1,171.9 433.6 29.1 76.0 538.7 69.7 – – 8.6 5.6 / 13.9 83.9 13.9
Warsaw 8 9 590.0 – – 590.0 188.6 – – 188.6 36.1 – – 6.7 – / – 42.8 –
Krakow 4 12 338.8 – 9.6 348.3 150.1 – 17.7 167.8 22.7 – – 3.7 – / 3.1 26.3 3.1
Wroclaw 2 3 146.8 – – 146.8 56.6 – – 56.6 9.4 – – 0.2 – / – 9.7 –
Lodz 1 2 69.3 – – 69.3 35.5 – – 35.5 4.9 – – 0.5 – / – 5.4 –
Katowice 2 5 125.9 – – 125.9 63.3 – – 63.3 10.0 – – 0.2 – / – 10.2 –
Gdansk 1 1 57.0 – – 57.0 25.6 – – 25.6 4.2 – – 0.0 – / – 4.2 –
Poland: Office 18 32 1,327.8 – 9.6 1,337.3 519.6 – 17.7 537.4 87.3 – – 11.3 – / 3.1 98.6 3.1
Total Office Portfolio 29 49 2,421.7 42.4 45.2 2,509.2 953.3 29.1 93.7 1,076.0 157.0 – – 19.9 182.5 17.0
Mixed-Use Portfolio
Warsaw 1 5 121.3 – – 121.3 22.3 – – 22.3 6.3 – – 0.7 – / – 7.0 –
Wroclaw – – – 103.1 – 103.1 – 40.9 – 40.9 – 4.7 – – 2.8 / – 7.5 –
Katowice 1 1 48.4 – – 48.4 24.3 – – 24.3 3.4 – – 0.4 – / – 3.8 –
Total Mixed-Use Portfolio 2 6 169.7 103.1 – 272.8 46.6 40.9 – 87.5 9.7 4.7 – 1.1 2.8 / – 18.3 –
Logistics / Light-industrial
Timisoara 2 5 69.6 – 11.3 80.9 121.3 – 185.1 306.4 5.5 – – – – / 7.6 5.5 7.6
Pitesti 1 1 49.4 – – 49.4 68.4 – – 68.4 3.4 – – – – / – 3.4 –
Constanta 1 1 12.0 – 21.4 33.4 20.6 – 540.6 561.3 0.6 – – 0.3 – / 28.2 0.9 28.2
Bucharest 1 1 13.8 – 4.0 17.8 22.7 – 53.0 75.8 0.9 – – – – / 2.3 0.9 2.3
Total Logistics / Light-ind. Portfolio 5 8 144.8 – 36.7 181.5 233.1 – 778.7 1,011.8 10.4 – – 0.3 – / 38.1 10.7 38.1
Other Portfolio
Bucharest New CBD Upground Complex - Residential 1 1 59.6 – – 59.6 32.4 – – 32.4 1.0 – – – – / – 1.0 –
Bucharest New CBD Upground Complex - Commercial – – 9.8 – – 9.8 6.0 – – 6.0 0.6 – – 0.2 – / – 0.8 –
Total Other Portfolio – – 69.4 – – 69.4 38.4 – – 38.4 1.6 – – 0.2 – / – 1.8 –
Total Commercial Portfolio 36 63 2,745.9 145.5 81.9 2,973.3 1,238.9 69.9 872.4 2,181.3 177.7 4.7 – 21.5 8.4 / 55.1 212.3 55.1
Of which Romania 16 25 1,248.5 42.4 72.3 1,363.2 672.7 29.1 854.7 1,556.5 80.7 – – 9.1 5.6 / 52.0 95.4 52.0
Of which Poland 20 38 1,497.4 103.1 9.6 1,610.1 566.2 40.9 17.7 624.8 97.0 4.7 – 12.4 2.8 / 3.1 116.9 3.1
Note: Renoma mixed-use asset in Wroclaw, which is under refurbishment, is included in the properties under construction.

aDDItIoNal INForMatIoNGoVErNaNCEStratEGIC rEPortoVErVIEw FINaNCIal StatEMENtS aDDItIoNal INForMatIoNPortFolIo rEVIEw
175174 Globalworth annual report and financial statements 2020Globalworth annual report and financial statements 2020
Portfolio Analysis by value and Property Type
Combined Portfolio (“CP”)
(€m) % of TotalJV included in CP
(€m)
Consolidated Portfolio
(€m)
Adj. for JV ownership
(€m)Group Share
(€m) % of Total
romaniaOffice 1,144.1 37.7% – 1,144.1 – 1,144.1 38.0%Light Industrial /
Logistics 144.8 4.8% (25.8) 119.0 12.9 131.9 4.4%Residential & Lands 133.9 4.4% (25.4) 108.5 12.7 121.2 4.0%
Total romania 1,422.8 46.9% (51.2) 1,371.6 25.6 1,397.2 46.5%
PolandOffice 1,337.3 44.1% – 1,337.3 – 1,337.3 44.5%Mixed-Use 272.8 9.0% – 272.8 – 272.8 9.1%
Total Poland 1,610.1 53.1% – 1,610.1 – 1,610.1 53.5%
Grand Total 3,032.9 100.0% (51.2) 2,981.7 25.6 3,007.3 100.0%
Note: Globalworth includes 100% of the portfolio value of the investments made under JV agreements, in the Combined Portfolio.
Romania
Combined Portfolio (“CP”)
(€m) % of TotalJV included in CP
(€m)
Consolidated Portfolio
(€m)
Adj. for JV ownership
(€m)Group Share
(€m) % of Total
Bucharest – New CBD 934.0 30.8% – 934.0 – 934.0 31.1%Bucharest – Other 325.1 10.7% (17.8) 307.3 8.9 316.2 10.5%
Portfolio Analysis by value and Location
Combined Portfolio (“CP”)
(€m) % of TotalJV included in CP
(€m)
Consolidated Portfolio
(€m)
Adj. for JV ownership
(€m)Group Share
(€m) % of Total
romaniaBucharest 1,259.1 41.5% (17.8) 1,241.3 8.9 1,250.2 41.6%Timisoara 80.9 2.7% – 80.9 – 80.9 2.7%Pitesti 49.4 1.6% – 49.4 – 49.4 1.6%Constanta 33.4 1.1% (33.4) – 16.7 16.7 0.6%
Total romania 1,422.8 46.9% (51.2) 1,371.6 25.6 1,397.2 46.5%
PolandWarsaw 711.3 23.5% – 711.3 – 711.3 23.7%Krakow 348.3 11.5% – 348.3 – 348.3 11.6%Wroclaw 249.9 8.2% – 249.9 – 249.9 8.3%Katowice 174.3 5.7% – 174.3 – 174.3 5.8%Lodz 69.3 2.3% – 69.3 – 69.3 2.3%Gdansk 57.0 1.9% – 57.0 – 57.0 1.9%
Total Poland 1,610.1 53.1% – 1,610.1 – 1,610.1 53.5%
Grand Total 3,032.9 100.0% (51.2) 2,981.7 25.6 3,007.3 100.0%
Note: Globalworth includes 100% of the portfolio value of the investments made under JV agreements, in the Combined Portfolio.
Portfolio Analysis by Commercial Contracted rent and Property Type as at 31 December 2020
Combined Portfolio (“CP”)
(€m) % of TotalJV included in CP
(€m)
Consolidated Portfolio
(€m)
Adj. for JV ownership
(€m)Group Share
(€m) % of Total
romaniaOffice 69.7 38.0% – 69.7 – 69.7 38.2%Light-Industrial /
Logistics 10.4 5.7% (1.5) 8.9 0.8 9.7 5.3%Residential & Other 1.6 0.9% – 1.6 – 1.6 0.9%
Total romania 81.7 44.5% (1.5) 80.1 0.8 80.9 44.3%
PolandOffice 87.3 47.6% – 87.3 – 87.3 47.8%Mixed-Use 14.4 7.9% – 14.4 – 14.4 7.9%
Total Poland 101.7 55.5% – 101.7 – 101.7 55.7%
Grand Total 183.4 100.0% (1.5) 181.8 0.8 182.6 100.0%
Note: Globalworth includes 100% of Contracted Rent from investments made under JV agreements, in the Combined Portfolio.
Portfolio Analysis by Contracted rent and Location
Combined Portfolio (“CP”)
(€m) % of TotalJV included in CP
(€m)
Consolidated Portfolio
(€m)
Adj. for JV ownership
(€m)Group Share
(€m) % of Total
romaniaBucharest 72.2 39.4% (0.9) 71.3 0.5 71.7 39.3%Timisoara 5.5 3.0% – 5.5 – 5.5 3.0%Pitesti 3.4 1.9% – 3.4 – 3.4 1.9%Constanta 0.6 0.3% (0.6) – 0.3 0.3 0.2%
Total romania 81.7 44.5% (1.5) 80.1 0.8 80.9 44.3%
PolandWarsaw 42.4 23.1% – 42.4 – 42.4 23.2%Wroclaw 14.1 7.7% – 14.1 – 14.1 7.7%Krakow 22.7 12.4% – 22.7 – 22.7 12.4%Katowice 13.4 7.3% – 13.4 – 13.4 7.3%Lodz 4.9 2.7% – 4.9 – 4.9 2.7%Gdansk 4.2 2.3% – 4.2 – 4.2 2.3%
Total Poland 101.7 55.5% – 101.7 – 101.7 55.7%
Grand Total 183.4 100.0% (1.5) 181.8 0.8 182.6 100.0%
Note: Globalworth includes 100% of Contracted Rent from investments made under JV agreements, in the Combined Portfolio.
Portfolio Analysis by Commercial Contracted rent and Tenant Origin as at 31 December 2020
Combined Portfolio (“CP”)
(€m) % of TotalJV included in CP
(€m)
Consolidated Portfolio
(€m)
Adj. for JV ownership
(€m)Group Share
(€m) % of Total
romaniaMulti 73.7 40.2% (1.1) 72.5 0.6 73.1 40.0%National 6.9 3.8% (0.4) 6.5 0.2 6.7 3.7%State Owned 1.1 0.6% – 1.1 – 1.1 0.6%
Total romania 81.7 44.5% (1.5) 80.1 0.8 80.9 44.3%
PolandMulti 67.7 36.9% – 67.7 – 67.7 37.1%National 31.7 17.3% – 31.7 – 31.7 17.4%State Owned 2.3 1.3% – 2.3 – 2.3 1.3%
Total Poland 101.7 55.5% – 101.7 – 101.7 55.7%
Grand Total 183.4 100.0% (1.5) 181.8 0.8 182.6 100.0%
Note: Globalworth includes 100% of Contracted Rent from investments made under JV agreements, in the Combined Portfolio.
POrTFOLiO ANALYSeS(data as of 31 decemBer 2020)

aDDItIoNal INForMatIoNGoVErNaNCEStratEGIC rEPortoVErVIEw FINaNCIal StatEMENtS aDDItIoNal INForMatIoNPortFolIo rEVIEw
177176 Globalworth annual report and financial statements 2020Globalworth annual report and financial statements 2020
EPRA NRV(1)
31-Dec-20€’000
EPRA NRV(1)
31-Dec-19€’000
EPRA NTA31-Dec-20
€’000
EPRA NTA31-Dec-19
€’000
EPRA NDA31-Dec-20
€’000
EPRA NDA31-Dec-19
€’000
EPRA NAV(1)
31-Dec-20€’000
EPRA NAV(1)31-Dec-19
€’000
Net assets attributable to equity holders of the parent 1,755,364 1,914,667 1,755,364 1,914,667 1,755,364 1,914,667 1,755,364 1,914,667
Include / excludeI) Hybrid instruments – – – – – – – –
Diluted NAv 1,755,364 1,914,667 1,755,364 1,914,667 1,755,364 1,914,667 1,755,364 1,914,667
Include:II. a) Revaluation of IP
(if IAS 40 cost option is used) – – – – – – – – II. b) Revaluation of IPUC
(if IAS 40 cost option is used) – – – – – – – – II. c) Revaluation of other
non-current investments – – – – – – – – III) Revaluation of tenant leases
held as finance leases – – – – – – – –
IV) Revaluation of trading properties – – – – – – – –
Diluted NAv at fair value 1,755,364 1,914,667 1,755,364 1,914,667 1,755,364 1,914,667 1,755,364 1,914,667
Exclude:V) Deferred tax in relation
to fair value gains of IP 171,197 157,621 85,599 78,811 n/a n/a 171,197 157,621 VI) Fair value of financial
instruments 872 1,498 872 1,498 872 1,498 872 1,498 VII) Goodwill as a result
of deferred tax (5,697) (5,697) (5,697) (5,697) (5,697) (5,697) (5,697) (5,697)VIII. a) Goodwill as per
the IFRS balance sheet n/a n/a (6,652) (6,652) (6,652) (6,652) n/a n/a VIII. b) Intangibles as per
the IFRS balance sheet n/a n/a (49) (45) (49) (45) n/a n/a IX) Adjustment in respect
of joint venture for above 1,742 1,301 1,742 1,301 n/a n/a 1,742 1,301 Include:IX) Fair value of fixed
interest rate debt n/a n/a n/a n/a (93,441) (88,772) n/a n/a X) Revaluation of intangibles
to fair value n/a n/a n/a n/a n/a n/a n/a n/a
XI) Real estate transfer tax / acquisition costs – – – – n/a n/a – –
NAv 1,923,478 2,069,390 1,831,179 1,983,883 1,650,397 1,814,999 1,923,478 2,069,390
Fully diluted number of shares 221,486 222,410 221,486 222,410 221,486 222,410 221,486 222,410
NAV per share (EUR) 8.68 9.30 8.27 8.92 7.45 8.16 8.68 9.30
(1) EPRA NRV is equivalent to the previous EPRA NAV as presented in the above table. From 2021 onwards, the Group will report only the new metrics.
New ePrA NAv MeTriCS iNveSTiNG POLiCY
investing StrategyThe Company’s primary focus is to invest in a diversified portfolio of real estate assets situated in Romania and Poland, the two largest markets in Central and Eastern Europe. The Company may also invest in real estate assets located in other South-Eastern European and Central Eastern European countries. The Directors believe its primary markets of investment represent an attractive real estate investment proposition over the medium to long term.
By investing in income-generating properties, asset repositioning and development opportunities, and seeking to derive most of its income from multinational corporate groups and institutional financial tenants on long, triple net leases, the Company intends to provide investors with an attractive, risk-adjusted combination of yield and capital appreciation.
Globalworth is internally managed, with all investment advisory and portfolio management services exclusively provided by Globalworth Investment Advisers Ltd (“GIAL”), a wholly owned subsidiary of the Company. Asset management services to the Company’s real estate portfolio are provided by Globalworth Asset Managers (“GAM”), another wholly-owned subsidiary of Globalworth.
Assets or Companies in which the Company can investInvestments made by the Company may take the form of, but are not limited to, single real estate assets, real estate portfolios and companies, joint ventures, loan portfolios and equity and debt instruments.
Strategy Through which the investing Policy is AchievedThe Company’s strategy is to focus on acquiring underperforming or undervalued properties (due to financial distress, mismanagement or otherwise) and, through active asset management, to transform these into performing and marketable assets. Most of the current or expected income from these assets is derived from multinational corporate groups and institutional financial tenants on long, triple net and annually indexed leases.
investment ApproachThe Company assumes a proactive approach to every real estate investment in the Company’s portfolio and pursues various asset management initiatives according to the most appropriate business plan for each investment. These initiatives may include: repositioning of existing assets (including re-letting, refurbishment or re-development); development of new assets, corporate restructuring and reorganisation; portfolio break-ups (for example, “wholesale” to “retail” trades); and optimising capital structure.
Holding Period for investmentsThe typical holding period for any investment is expected to be five to seven years. The decision to exit a particular investment will be taken by the Company’s board of directors (“the Board”) following the recommendation of the Investment Adviser, and may be less or greater than the expected holding period. Such a decision may result from a variety of factors, including the need to optimise the risk/return of the investment, responding to asset or market dynamics, or taking advantage of an unsolicited enquiry, but always with a view to ensuring that returns to shareholders are maximised.
Gearing and Cross Holdings PoliciesThe Company is permitted, directly or indirectly, to borrow for working capital, investment and any other purpose. Debt financing is expected to be an important component of the structuring and execution of the Company’s investments, to improve returns for both developmental and income- generating assets. Borrowings may be undertaken by the Company itself or by any of its subsidiaries or project companies. The amount of leverage employed in respect of an investment is dependent on the nature of the opportunity, however, it is expected that the maximum loan-to-value for the Group will not exceed 60%.
Hedging instrumentsIn connection with third-party debt, the Company may enter into one or a series of interest rate hedging products (including, among others, swaps, caps, collars or options) to protect the returns of the relevant investment against adverse interest rate fluctuations. Although it is anticipated that all rentals and debt finance will be in Euro, the Company may also enter into one or a series of currency hedging instruments (including, among others, swaps, caps, collars or options) to protect the returns of the relevant investment against adverse currency fluctuations.
investing restrictionsUnless the Board (at its absolute discretion) approves otherwise, the Company will not acquire or invest in commercial properties which do not satisfy the minimum pre-letting commitment targets which are as follows: – for any logistics or warehouse property, pre-letting
commitments for a minimum of 60%. of the gross leasable area of such property; and
– for any other commercial property, pre-letting commitments for a minimum of 50%. of the gross leasable area of such property. These above restrictions will not preclude the Company making investments in short-dated cash or near-cash equivalent securities, which form part of its cash management practices.
Nature of returns that the Company Seeks to Deliver to ShareholdersTo support shareholder dividends, the Directors anticipate that a sustainable cash flow will be generated through stable and recurring rental income, increased where appropriate through active asset management. The determination as to whether or not to reinvest some of the proceeds of the disposal of an asset, and the declaration of dividends, is at the absolute discretion of the Board. It is intended that not less than 90% of the Company’s funds from operations will be distributed to shareholders of the Company on a semi-annual basis, subject to solvency or other legal requirements.

aDDItIoNal INForMatIoNGoVErNaNCEStratEGIC rEPortoVErVIEw FINaNCIal StatEMENtS aDDItIoNal INForMatIoNPortFolIo rEVIEw
179178 Globalworth annual report and financial statements 2020Globalworth annual report and financial statements 2020
Asset or PropertyRepresents the individual land plot or building under development or standing building which forms part or the entirety of an investment.
Bargain Purchase GainAny excess between the fair value of net assets acquired and consideration paid, in accordance with IFRS 3 “Business Combination”.
BreeAMBuilding Research Establishment Assessment Method (“BREEAM”), which assesses the sustainability of the buildings against a range of criteria.
CAPeXRepresents the estimated Capital Expenditure to be incurred for the completion of the development projects.
Capitalisation ratesBased on actual location, size and quality of the properties and taking into account market data at the valuation date.
CBDCentral Business District.
CeeCentral and Eastern Europe.
CiTCorporate income tax.
Commercial PropertiesComprises the office, light-industrial and retail properties or areas of the portfolio.
Combined PortfolioIncludes the Group’s property investments consolidated on the balance sheet under Investment Property-Freehold as at 31 December 2020, plus those properties held as Joint Ventures (currently the lands relating to Chitila Logistics Hub and Constanta Business Park projects) presented at 100%.
Completed investment PropertyCompleted developments consist of those properties that are in a condition which will allow the generation of cash flows from its rental.
Completion DatesThe date when the properties under development will be completed and ready to generate rental income after obtaining all necessary permits and approvals.
Contracted rentThe annualised headline rent as at 31 December 2020 that is contracted on leases (including pre-leases) before any customary tenant incentive packages.
Debt Service Cover ratio (“DSCr”)It is calculated as net operating income for the year as defined in specific loan agreements with the respective lenders, divided by the principal plus interest due over the same year.
Discount ratesThe discount rate is the interest rate used to discount a stream of future cash flows to their present value.
Discounted Cash Flow Analysis (“DCF”)Valuation method that implies income projections of the property for a discrete period of time, usually between 5-10 years. The DCF method involves the projection of a series of periodic cash flows either to an operating property or a development property. Discounted cash flow projections based on significant unobservable inputs, taking into account the costs to complete and completion date.
earnings Per Share (“ePS”)Profit after tax divided by the basic/diluted weighted average number of shares in issue during the year or period.
Adjusted eBiTDA (normalised)Earnings before finance cost, tax, depreciation, amortisation of other non-current assets, purchase gain on acquisition of subsidiaries, fair value movement, and other non-operational and/or non-recurring income and expense items. This includes the share of minority interests for the year ended 31 December 2019. During the year ended 31 December 2020 there were no minority interests.
eDGeExcellence in Design for Greater Efficiencies (“EDGE”). An innovation of the International Finance Corporation (“IFC”), member of the World Bank Group, EDGE is a green building standard and a certification system for more than 160 countries.
ePrAThe European Public Real Estate Association is a non-profit association representing Europe’s publicly listed property companies.
ePrA earningsProfit after tax attributable to the equity holders of the Company, excluding investment property revaluation, gains, losses on investment property disposals and related tax adjustment for losses on disposals, bargain purchase gain on acquisition of subsidiaries, acquisition costs, changes in the fair value of financial instruments and associated close-out costs and the related deferred tax impact of adjustments made to profit after tax. ePrA earnings Per ShareEPRA Earnings divided by the basic or diluted number of shares outstanding at the year or period end.
ePrA NAv Per ShareEPRA NAV divided by the basic/diluted number of shares outstanding at the year or period end.
ePrA Net Assets (“ePrA NAv”)Net assets per the statement of financial position, excluding the mark-to-market on effective cash flow hedges and related debt adjustments and deferred taxation on revaluations excluding goodwill.
GLOSSArY
ePrA Net reinstatement value (“ePrA Nrv”)The objective of the EPRA Net Reinstatement Value measure is to highlight the value of net assets on a long-term basis. Assets and liabilities that are not expected to crystallise in normal circumstances such as the fair value movements on financial derivatives and deferred taxes on property valuation surpluses are therefore excluded. Since the aim of the metric is to also reflect what would be needed to recreate the company through the investment markets based on its current capital and financing structure, related costs such as real estate transfer taxes are included, as applicable.
ePrA Net Tangible Assets (“ePrA NTA”)The underlying assumption behind the EPRA Net Tangible Assets calculation assumes entities buy and sell assets, thereby crystallising certain levels of deferred tax liability.
ePrA Net Disposal value (“ePrA NDv”)The EPRA Net Disposal Value provides the reader with a scenario where deferred tax, financial instruments, and certain other adjustments are calculated as to the full extent of their liability, including tax exposure not reflected in the Balance Sheet, net of any resulting tax. This measure should not be viewed as a “liquidation NAV” because, in many cases, fair values do not represent liquidation values.
estimated rental value (“erv”)ERV is the external valuers’ opinion as to the open market rent which, on the date of valuations, could reasonably be expected to be obtained on a new letting or rent review of a property.
estimated vacancy ratesRepresent vacancy rates computed based on current and expected future market conditions after expiry of any current lease.
eUriBOrThe Euro Interbank Offered Rate: the interest rate charged by one bank to another for lending money, often used as a reference rate in bank facilities.
Financial YearPeriod from 1 January to 31 December.
FFOFree funds from operations, estimated as the EPRA Earnings for the relevant period.
GLAGross leasable area.
iFrSInternational Financial Reporting Standards as adopted by the European Union.
interest Cover ratio (“iCr”)Calculated as net operating income divided by the debt service / interest.
investmentRepresent a location in which the Company owns / has interests in.
iPOAdmission to the AIM Market of the London Stock Exchange.
Land Bank for Further DevelopmentLand bought for further development but for which the Group did not obtain all the legal documentations and authorisation permits in order to start the development process.
LeeDLeadership in Energy & Environmental Design (“LEED”), a green building certification programme that recognises best-in-class building strategies and practices.
Loan-to-Cost ratio (“LTC”)Calculated by dividing the value of loan drawdowns by the total project cost.
Loan to value (“LTv”)Calculated as the total outstanding debt excluding amortised cost, less cash and cash equivalents as of financial position date, divided by the appraised value of owned assets as of the financial position date. both outstanding debt and the appraised value of owned assets include our share of these figures for joint ventures, which are accounted for in the consolidated financial statements under the equity method.
Maintenance CostsIncluding necessary investments to maintain functionality of the property for its expected useful life.
Master LeaseMaster lease, includes various rental guarantees, which range between 3 and 5 years, covering certain vacant spaces in certain properties owned in Poland.
NBPNational bank of Poland.
Net Assets value (“NAv”)Equity attributable to shareholders of the Company and/or net assets value.
Net Asset value (“NAv”) Per ShareEquity attributable to owners of the Company divided by the number of Ordinary shares in issue at the period end.
Net Operating income (“NOi”)Net operating income (being the gross operating income less operating expenses that are not paid by or rechargeable to tenants, excluding funding costs, depreciation and capital expenditure).
NOiG/rGA settlementRefers to the settlement in December 2018 of Master lease and NOI guarantee agreement related to some properties in Poland which were acquired as part of GPRE acquisition in 2017.

180 Globalworth annual report and financial statements 2020
Non-Controlling interest (“NCi”)The equity in a subsidiary not attributable, directly or indirectly, to the parent.
Occupancy rateThe estimated let sqm (GLA) as a percentage of the total estimated total sqm (GLA) of the portfolio, excluding development properties and in certain cases (where applicable) spaces subject to asset management (where they have been taken back for refurbishment and are not available to let as of the financial position date).
Passing rentIt is the gross rent, less any ground rent payable under the head leases.
Open Market value (“OMv” or “GAv”)Open market value means the fair value of the Group’s investment properties and the Joint ventures (where the Group owns 50%) determined by Colliers Valuation and Advisory SRL (“Colliers”), Cushman & Wakefield LLP (C&W), Knight Frank Sp. z o.o (“Knight Frank”) and CBRE Sp. z o.o. (“CBRE”) independent professionally qualified valuers who hold a recognised relevant professional qualification and have recent experience in the locations and segments of the investment properties valued, using recognised valuation techniques.
Property Under DevelopmentProperties that are in development process that do not meet all the requirements to be transferred to completed investment property.
Property Under refurbishmentProperties that are in the process of being refurbished and do not meet all the requirements to be transferred to completed investment property.
rCFRevolving Credit Facility.
residual value MethodValuation method that estimates the difference between the market value of the building upon completion that can be built on the plot of land and all the building’s construction costs, as well as the developer’s profit. This method relies on the contribution concept by estimating from the future income of the building, the amount that can be distributed to the land.
rOBOrRomanian Interbank Offer Rate.
Sales Comparison ApproachValuation method that compares the subject property with quoted prices of similar properties in the same or similar location.
SPAShare sale purchase agreement.
SQMSquare metres.
The Company or the GroupGlobalworth Real Estate Investments Limited and its subsidiaries.
The investment AdviserGlobalworth Investment Advisers Limited, a wholly owned holding subsidiary incorporated in Guernsey.
Total Accounting returnTotal accounting return is the growth in EPRA NAV per share plus dividends paid, expressed as a percentage of EPRA NAV per share at the beginning of the year.
Total Unencumbered Assets ratioCalculated as the Unsecured Consolidated Total Assets divided by Unsecured Consolidated Total Indebtedness.
Unsecured Consolidated Total AssetsMeans such amount of Consolidated Total Assets that is not subject to any security granted by any subsidiary of the Group.
Unsecured Consolidated Total indebtedness Means the Consolidated Total Indebtedness less Secured Consolidated Total Indebtedness.
wALLRepresents the remaining weighted average lease length of the contracted leases as of the financial position date, until the lease contracts’ full expiration.
weighted Average interest rateThe average of the interest rate charged on the Group’s loans, weighted by the relative outstanding balance of each loan at the year or period end.
wiBOrWarsaw Interbank Offered Rate.
GLOSSArY continued

GLOBALWORTH AnnuAL RepoRT AnD FinAnCiAL STATeMenTS 2020
oVeRView STRATeGiC RepoRT poRTFoLio ReView GoVeRnAnCe
181
FinAnCiAL STATeMenTS ADDITIONAL INFORMATION
Registered OfficeAnson Court La Route des Camps St MartinGuernseyGY4 6AD
Nominated Adviser and Joint Brokerpanmure Gordon (uK) Limitedone new ChangeLondoneC4M 9AFunited Kingdom
Investment Adviser*Anson Court La Route des Camps St MartinGuernseyGY4 6AD
Auditorsernst & Young Cyprus LimitedJean nouvel Tower6 Stasinos Avenue1511 nicosiaCyprus
AdministratoriQ eQ (Guernsey) LimitedAnson CourtLa Route Des Camps St MartinGuernsey GY4 6AD
Company Secretarynicola MarrinAnson CourtLa Route Des Camps St MartinGuernsey GY4 6AD
Joint BrokerJefferies international LimitedVintners place68 upper Thames StreetLondoneC4V 3BJunited Kingdom
RegistrarLink Market Services (Guernsey) LimitedMont Crevalt houseBulwer AvenueSt. SampsonGuernseyGY2 4Lh
* wholly owned subsidiary of the Company.
COMPANY DIRECTORY

GLOBALWORTH REAL ESTATE INVESTMENTS LIMITED
Anson Court Globalworth TowerLa Route des Camps 26th FloorSt Martin 201 Barbu Vacarescu StreetGuernsey GY4 6AD 2nd district Bucharest 020276 Romania
Tel: +40 (0) 372 800 000Fax: +40 (0) 371 600 000Email: [email protected]
W W W . G L O B A L W O R T H . C O M
GLo
BA
Lwo
RTh
An
nu
AL R
ep
oR
T An
D Fin
An
CiA
L STATe
Me
nTS
2020