Embed Size (px)
Citation preview

General DisclaimerThe information in this document may contain predictive statement including, without limitation, statements regarding the future financial and operating results, future product portfolios, new technologies, etc. There are a number of factors that could cause actual results and developments to differ materially from those expressed or implied in the predictive statements. Therefore, such information is provided for reference purpose only and constitutes neither an offer nor an acceptance. Huawei may change the information at any time without notice.
Copyright © 2020 HUAWEI TECHNOLOGIES CO., LTD. All Rights Reserved.No part of this document may be reproduced or transmitted in any form or by any means without prior written consent of Huawei Technologies Co., Ltd.
Tradememark Notice , , are trademarks or registered trademarks of Huawei Technologies Co., Ltd.Other Trademarks, product, service and company names mentioned are the property of thier respective owners.
Mapping your transformation into a digital economy with GCI 2020
Shaping the New Normal withIntelligent Connectivity

Contents
Foreword 01
Executive Summary 03Countries face a new normal as they rebound their economies
Country Rankings 09Countries step up efforts to promote digital transformation
Economic and Technological Impact 16Countries build resilience for future economic development
Impact on Industries 37ICT investments digitalize industries and help economies move into higher-order productivity
Recommendations 52
Appendix 54
09Starters are proactivelynarrowing the gap with the leading economies
37ICT investments digitalize industries and help economies move intohigher-order productivity
16Organizations in
Frontrunner countries want tomaintain IT expenditure

01 | GLOBAL CONNECTIVITY INDEX 2020
Foreword
COVID-19 has decimated national economies and revealed the fragility of global supply chains.
A natural reaction to the pandemic has been for nations to cut spending. And most have, with investment in digital infrastructure remaining flat in 2020 after years of growth. However, that’s the exact opposite of what needs to happen — ICT is the key to kickstarting recovery and even surpassing pre-pandemic productivity levels.
While we have seen some acceleration in digital transformation, such cases have tended to leverage existing ICT infrastructure. As a result, not all economies have been able to transform at the same pace. Those with more developed digital infrastructure are better able to respond to the pandemic, set out on the road to economic recovery, and build resilience for the future.
Since 2015, the GCI has tracked the progress of 79 economies in deploying digital infrastructure and capabilities. This year, a survey of organizations across the three GCI clusters — Starter, Adopter, and Frontrunner — shows that organizations in nations with high GCI scores are 2.5 to 3.5 times less likely to reduce their ICT budgets.
Economies with higher GCI scores have greater digital readiness thanks to mature infrastructure, which has lessened the impact of the pandemic. People and businesses in these Frontrunner economies have been able to transition faster to remote work, school, business, and services thanks to strong digital infrastructure like high-speed broadband and cloud. Even before COVID-19, economies that were investing in digital infrastructure build out and capabilities enjoyed faster GDP growth during their transition to digital economies. Full recovery from the pandemic requires two things to happen. One, it requires recovery from lockdowns and border shutdowns, so that school, work, and global trade can resume via communication and collaboration tools. Two, it requires a return to the same level of economic activity before the pandemic hit.
Achieving these goals requires a range of digital capabilities. These include making remote learning as effective or more effective than classroom learning by using 5G-powered AR and VR, leveraging AI and IoT to boost the productivity of workers, adopting AI and robotics to enhance healthcare services, and deploying 5G networks and edge computing to provide
a more immersive experience for community interaction and entertainment.
Future-looking policymakers and industry leaders should focus on building digital capabilities in key economic sectors, with the digital agenda placed at the heart of socioeconomic recovery plans.
We have identified five orders of productivity across five key economic sectors that are central to the global economy. Policy makers and industry leaders need to consider which order of productivity their key economic sectors are operating in. We compared productivity in manufacturing and agriculture across different economies, and saw that nations with higher digitalization maturity are many times more productive per worker or hour worked than other economies. To accelerate the recovery of the economy to pre-pandemic levels, policymakers and leaders need to consider how to bring their economic sectors up to a higher order of productivity.
They need to review the status of their digital infrastructure readiness, as tracked by the GCI, to develop ICT strategies and plans that facilitate the digital transformation of these sectors, power economic recovery, and build future resilience.
FOREWORD | 02

03 | GLOBAL CONNECTIVITY INDEX 2020
Executive SummaryCountries face a new normal as they rebound their economies
Percentage of Companies in the COVID-19 Recovery Stage
What stage of the recovery cycle is your business currently in?
15
32
19 1815
20
29
1621
14
3
19 2126
31
13
48
22
8 10
24
31
1919
7
Global NA APAC LATAM EMEA
BusinessContinuity
EconomicSlowdown Recession Return to
GrowthThe NewNormal
EXECUTIVE SUMMARY | 04
At the beginning of 2020, nobody expected the world to change so drastically in a matter of months. As economies work to recover from the COVID-19 pandemic, we are now moving into a new normal in which society, governments, and industries have adapted to a new way of living and operating. Moving forward, this new normal may be a better way for economies to run and for nations to build competitiveness and resilience.
Economies tend to go through the following recovery curve:
1. Business continuity. The first phase in which organizations respond to the crisis and focus on business continuity. Globally, about 15% of organizations in major industries were in this stage as of September 2020, with many moving to a cost-optimization phase.
2. Business slowdown. By stabilizing business after
revenues have slowed, organizations move into cost optimization mode. This curve is where over 25% of global organizations were in late 2020
3. Business revenue decline. As revenues are expected to be in a prolonged state of decline, organizations focus on building business resilience and looking to their future recovery. Another 25% of global organizations were in this phase as of 4Q 2020, planning for recovery and the new normal.
4. Business growth recovery. As revenues pick up, organizations are looking to invest more aggressively to build competitiveness. The majority of organizations in Asia Pacific are in this phase and the next phase.
5. The new normal. As businesses stabilize into the new normal, organizations will work to operate more as digital organizations.
Executive SummaryCountries face a new normal as they rebound their economies
05 | GLOBAL CONNECTIVITY INDEX 2020
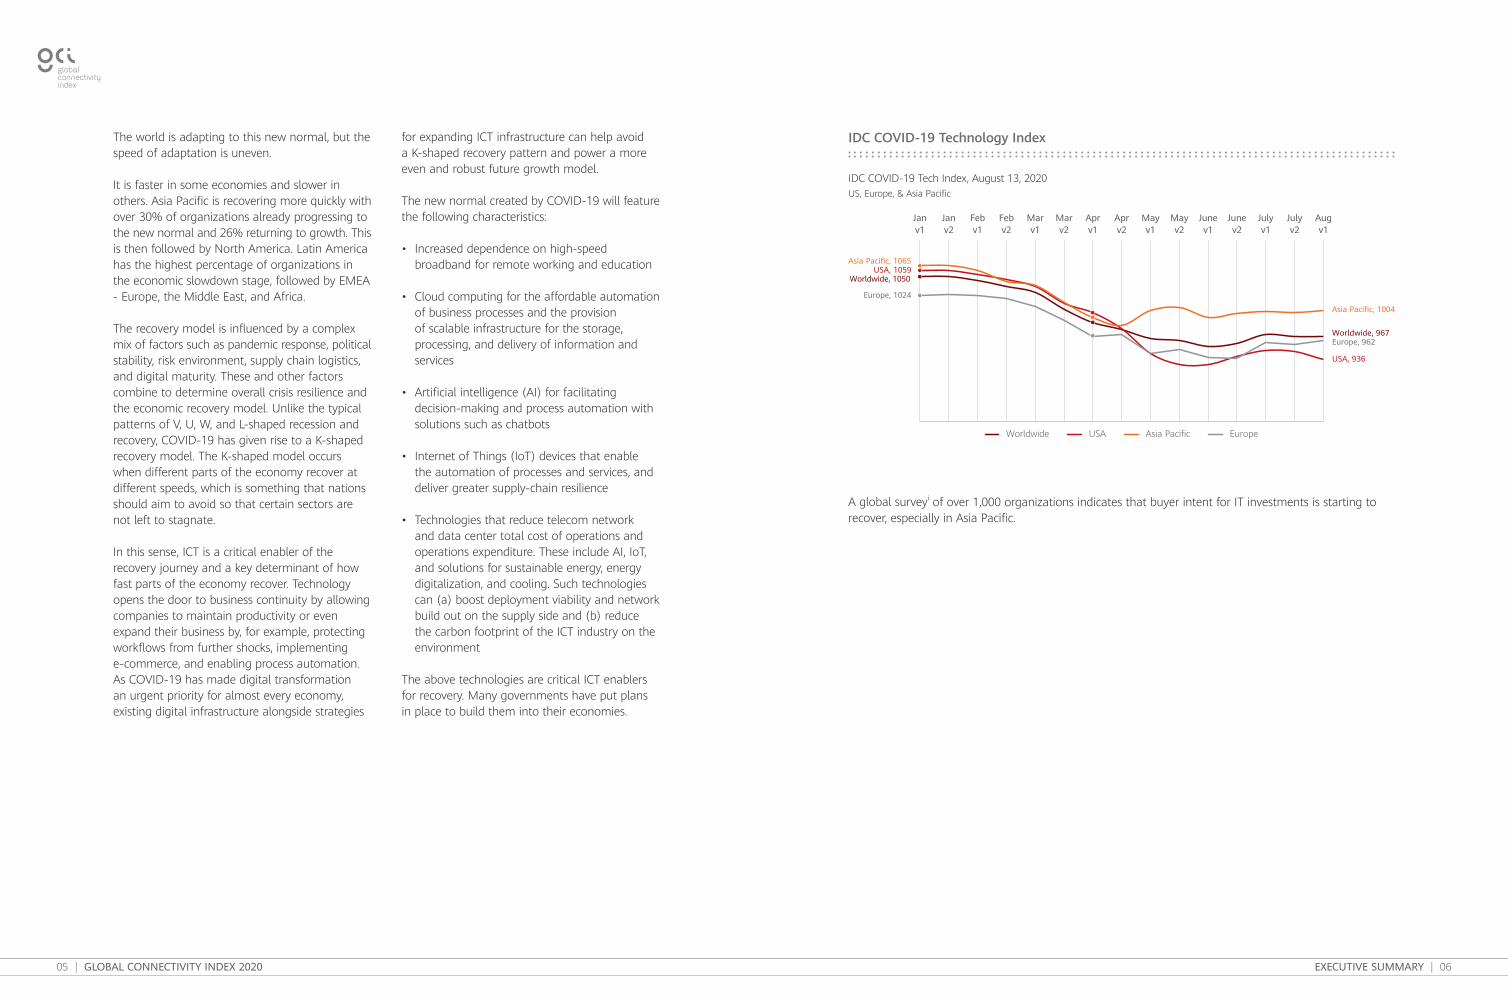
The world is adapting to this new normal, but the speed of adaptation is uneven.
It is faster in some economies and slower in others. Asia Pacific is recovering more quickly with over 30% of organizations already progressing to the new normal and 26% returning to growth. This is then followed by North America. Latin America has the highest percentage of organizations in the economic slowdown stage, followed by EMEA - Europe, the Middle East, and Africa.
The recovery model is influenced by a complex mix of factors such as pandemic response, political stability, risk environment, supply chain logistics, and digital maturity. These and other factors combine to determine overall crisis resilience and the economic recovery model. Unlike the typical patterns of V, U, W, and L-shaped recession and recovery, COVID-19 has given rise to a K-shaped recovery model. The K-shaped model occurs when different parts of the economy recover at different speeds, which is something that nations should aim to avoid so that certain sectors are not left to stagnate.
In this sense, ICT is a critical enabler of the recovery journey and a key determinant of how fast parts of the economy recover. Technology opens the door to business continuity by allowing companies to maintain productivity or even expand their business by, for example, protecting workflows from further shocks, implementing e-commerce, and enabling process automation. As COVID-19 has made digital transformation an urgent priority for almost every economy, existing digital infrastructure alongside strategies
for expanding ICT infrastructure can help avoid a K-shaped recovery pattern and power a more even and robust future growth model.
The new normal created by COVID-19 will feature the following characteristics:
• Increased dependence on high-speed broadband for remote working and education
• Cloud computing for the affordable automation of business processes and the provision of scalable infrastructure for the storage, processing, and delivery of information and services
• Artificial intelligence (AI) for facilitating decision-making and process automation with solutions such as chatbots
• Internet of Things (IoT) devices that enable the automation of processes and services, and deliver greater supply-chain resilience
• Technologies that reduce telecom network and data center total cost of operations and operations expenditure. These include AI, IoT, and solutions for sustainable energy, energy digitalization, and cooling. Such technologies can (a) boost deployment viability and network build out on the supply side and (b) reduce the carbon footprint of the ICT industry on the environment
The above technologies are critical ICT enablers for recovery. Many governments have put plans in place to build them into their economies.
A global surveyi of over 1,000 organizations indicates that buyer intent for IT investments is starting to recover, especially in Asia Pacific.
IDC COVID-19 Technology Index
IDC COVID-19 Tech Index, August 13, 2020US, Europe, & Asia Pacific
Worldwide, 1050USA, 1059
Asia Pacific, 1065
Europe, 1024
USA, 936
Asia Pacific, 1004
Worldwide, 967Europe, 962
Augv1
Julyv2
Julyv1
Junev2
Junev1
Mayv2
Mayv1
Aprv2
Aprv1
Marv2
Marv1
Febv2
Febv1
Janv2
Janv1
Worldwide USA Asia Pacific Europe
EXECUTIVE SUMMARY | 06

07 | GLOBAL CONNECTIVITY INDEX 2020
PMI Service Activity Versus the COVID-19 Lockdown Stringency Index
Chan
ge in
PM
I Ser
vice
s A
ctiv
ity
Change in Stringency Index
0
-5
-10
-15
-20
-25
-30
-35
-40
-45
-50
-551009590858075706560555045403530
China
Australia
Brazil
France Italy
Ireland
SpainIndia
Russia
Sweden
y = -0.6159x + 12.054R2 = 0.8426
Median PMI Services change: -39.3
Germany
Japan
US
UK
GCI 2020 Highlights
Starters are narrowing the gap with the leading economies thanks to improvements in broadband coverage and affordability.
Some starters are proactively catching up with the other clusters. Over the last 5 years Starters increased their mobile broadband adoption by over 2.5X with several countries having close to 100% coverage, and their 4G subscribers from an average of 1% to an average of 19% in 2019, with some countries reaching over 30% of their population having high speed 4G mobile broadband coverage. The mobile broadband affordability as measured by the cost of mobile broadband divided by GNI per capita have also dropped by 25% (more affordable). These increased internet access have opened up new economic opportunities causing e-Commerce spending to almost double since 2014 to over US$2,000 per person annually in 2019. Some Starters were moving up the GCI cluster, increased their GCI scores by up to 17%, and managed to raise GDP to a level that was 22% higher than some peers. Vietnam and Peru both became adopter economies in 2020.
Economies with higher ICT maturity can drive digital transformation to respond quicker to the COVID-19 pandemic, mitigating the negative impact on GDP per capita by 50%.
Organizations in economies with higher GCI scores are able to react faster to the COVID-19 pandemic and use digital tools and services to mitigate the impact of lockdowns and social distancing. Due to the availability of high-speed broadband, cloud services, AI, and IoT solutions, they can quickly implement distributed workforce models, migrate to e-commerce platforms, and digitally transform their operations to maintain business continuity. The forecast decline in their GDP per capita is about 50% lower than for emerging GCI economies.
Organizations in countries with more mature digital infrastructure are prioritizing maintaining IT budgets over non-IT budgets. Despite the impact of COVID-19 on business
investment, organizations from Frontrunner countries still want to maintain expenditure on IT.
Research shows that the willingness of companies to invest in IT varies depending on where they are based. Organizations in Frontrunner and Adopter nations are prioritizing maintaining their IT budgets over non-IT budgets. They have also cut their IT budgets by 2.5 to 3.5 times less than organizations in other countries on average. Nations with more mature digital infrastructure are better positioned to minimize the economic impact of the pandemic, recover faster, and ensure the continuity of their transformation into higher-order productivity models.
Digital transformation of economic sectors will help economies develop “higher-order” productivity to spur economic recovery and future competitiveness.
The race to recovery and making up for lost productivity because of the pandemic is dependent on increasing productivity in key economic sectors such as agriculture, energy, mining, manufacturing, services, and research. Economies with more advanced productivity markers enabled by ICT generally enjoy a much higher gross value-added (GVA) per worker or hours worked.
ICT maturity takes industry digital transformation through five stages of productivity: task efficiency, functional efficiency, system efficiency, organizational efficiency and agility, and ecosystem efficiency and resilience.
As economies improve their GCI scores, they are able to progressively use ICT to evolve their economic sectors toward higher-order operating models through use cases enabled by high-speed broadband to access compute and storage capabilities, as well as implement AI and IoT solutions. Economies can move from a mainly manual model to a computerized model and finally to an integrated intelligent model.
Economies that recover faster are in a more competitive position because they can resume business earlier. The following chart by Oxford University and EFGAMii shows the decline in service activity due to lockdown measures. As the pandemic situation improves, we can expect lockdown
measures to relax and economic activity to return.
The Global Connectivity Index 2020 (GCI 2020) assesses how economies use ICT to accelerate economic recovery and identify what other steps they can take.
EXECUTIVE SUMMARY | 08

09 | GLOBAL CONNECTIVITY INDEX 2020 COUNTRY RANKINGS | 10
GCI Cluster Descriptor
GCI SCORE RANGE 65-89 40-64 23-39
AVERAGE GDP PER CAPITA(2019) (US$) 56,400 15,600 3,600
CHARACTERISTICS Frontrunners are mainly developed economies
that focus on enhancing user experience. Their
priorities have shifted to investing in 5G, big data, AI, and IoT to develop
smarter and more innovative economies.
Adopters experience the largest GDP growth from investment in ICT
infrastructure. They focus on increasing demand for high-speed connectivity
to cloud to facilitate industry digitalization and
economic growth.
Starters are in the early stage of ICT infrastructure build-out. Their focus is
on expanding connectivity coverage to give more people access to the
digital economy.
FRONTRUNNERS ADOPTERS STARTERS
Country RankingsCountries step up efforts to promote digital transformation
The GCI tracks the relationship between ICT infrastructure investment and economic growth to provide policy makers with the trends and information they need for sound decisionmaking. GCI 2020’s research methodology has been expanded to better reflect the emergence of 5G and explain the technologies that we believe will drive economic growth in the near future.
GCI 2020 showcases the influence of 5G and AI on GDP growth, which is particularly important for policy makers as they strive to help lead
their economies from the COVID-19 pandemic towards a more competitive position through the digitalization of their economies.
GCI 2020 follows the digital development of 79 countries. Each is assigned a GCI score, which plots it on an S-curve graph. Countries on the S-curve are grouped into three clusters — Starters, Adopters and Frontrunners — according to their level of ICT investment, maturity, and economic development.
Country RankingsCountries step up efforts to promote digital transformation
11 | GLOBAL CONNECTIVITY INDEX 2020
Although most of the numbers report what each economy has achieved in 2019, GCI 2020 also identifies how a more advanced GCI position
before the COVID-19 pandemic has helped economies mitigate the pandemic's impact, as well as accelerate recovery by leveraging ICT maturity.
GCI 2020 Country Rankings
85
83
81
81
78
75
75
75
74
74
74
72
70
69
68
67
65
65
65
65
69
70
SCORE
85
83
81
81
78
75
75
75
74
74
74
72
70
69
68
67
69
70
SCORE
85
83
81
81
78
75
75
75
74
74
74
72
70
69
68
67
65
69
70
SCORE
85
83
81
81
78
75
75
75
74
74
74
72
70
69
68
67
65
65
69
70
SCORE
FRONTRUNNERS ADOPTERS STARTERS
1
2
3
4
5
6
7
8
9
10
11
12
13
14
15
16
17
18
19
20
RANK
United States
Singapore
Switzerland
Sweden
Denmark
Finland
Netherlands
United Kingdom
Japan
Norway
Australia
New Zealand
South Korea
Luxembourg
Germany
France
Canada
Ireland
Belgium
Austria
COUNTRIES
21
22
23
24
25
26
27
28
29
30
31
32
33
34
35
36
37
38
39
RANK
40
41
42
43
44
45
46
47
48
49
50
51
52
53
54
55
56
57
RANK
58
59
60
61
62
63
64
65
66
67
68
69
70
71
72
73
74
75
76
77
78
79
RANKCOUNTRIES
Uruguay
Romania
Russia
Oman
Brazil
Kazakhstan
Thailand
Belarus
Kuwait
Turkey
Argentina
Serbia
Ukraine
Mexico
Colombia
Vietnam
South Africa
Peru
COUNTRIES
United Arab Emirates
China
Spain
Estonia
Portugal
Italy
Lithuania
Czech Republic
Slovenia
Chile
Hungary
Slovakia
Saudi Arabia
Malaysia
Greece
Bulgaria
Bahrain
Croatia
Poland
COUNTRIES
Indonesia
Philippines
Morocco
Ecuador
Paraguay
India
Egypt
Venezuela
Jordan
Lebanon
Bolivia
Algeria
Kenya
Botswana
Ghana
Bangladesh
Namibia
Pakistan
Nigeria
Uganda
Tanzania
Ethiopia
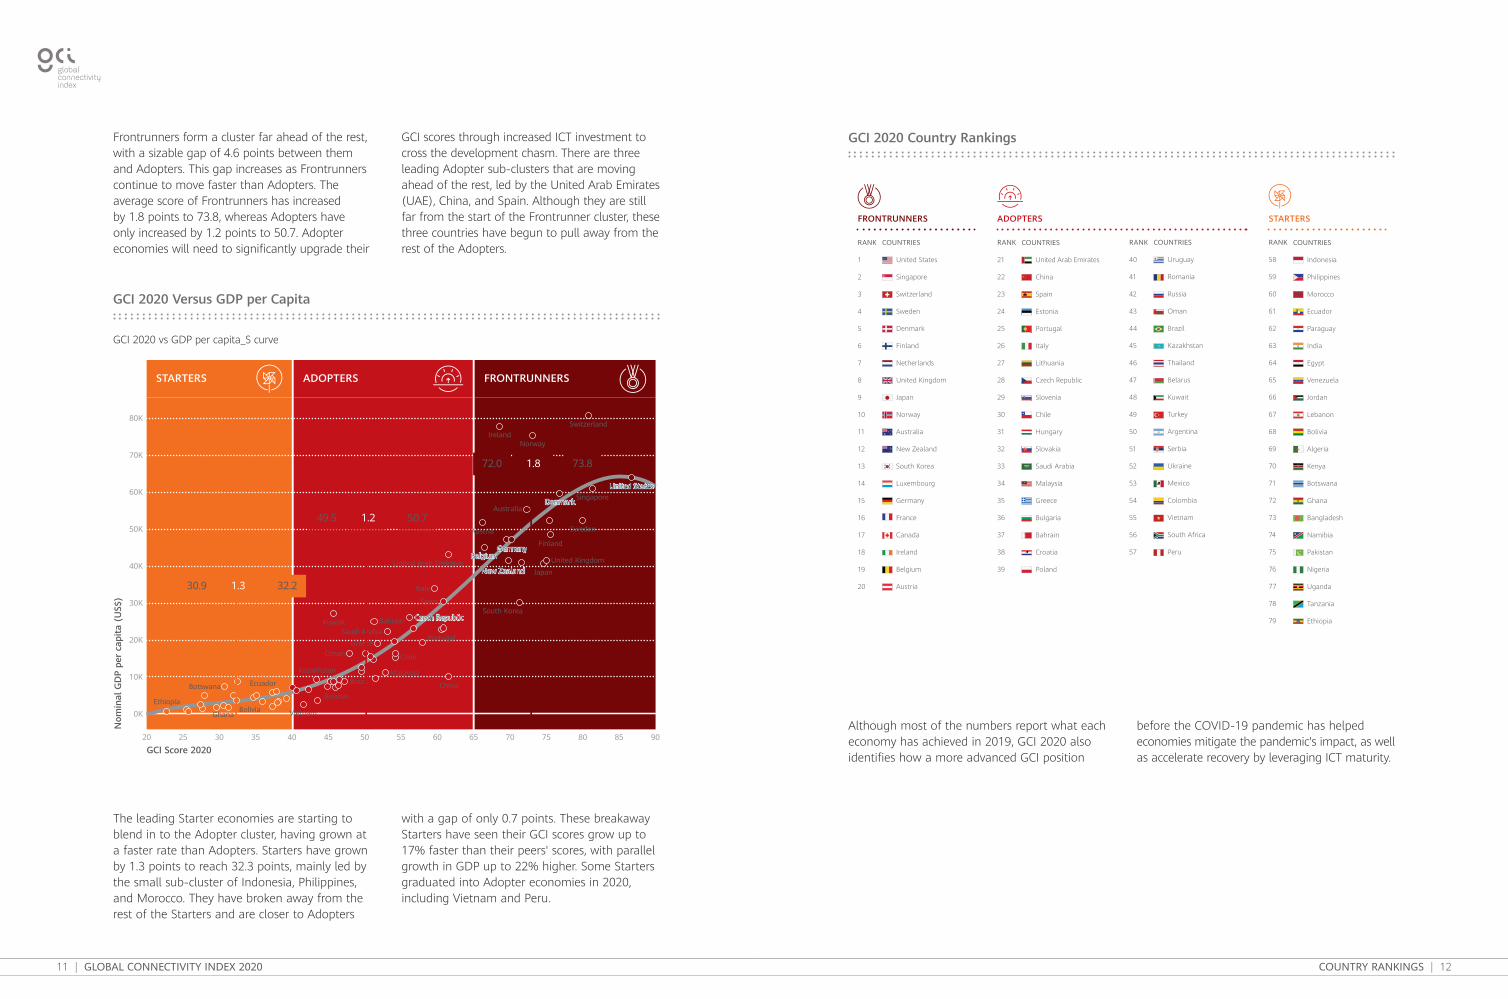
Frontrunners form a cluster far ahead of the rest, with a sizable gap of 4.6 points between them and Adopters. This gap increases as Frontrunners continue to move faster than Adopters. The average score of Frontrunners has increased by 1.8 points to 73.8, whereas Adopters have only increased by 1.2 points to 50.7. Adopter economies will need to significantly upgrade their
GCI scores through increased ICT investment to cross the development chasm. There are three leading Adopter sub-clusters that are moving ahead of the rest, led by the United Arab Emirates (UAE), China, and Spain. Although they are still far from the start of the Frontrunner cluster, these three countries have begun to pull away from the rest of the Adopters.
The leading Starter economies are starting to blend in to the Adopter cluster, having grown at a faster rate than Adopters. Starters have grown by 1.3 points to reach 32.3 points, mainly led by the small sub-cluster of Indonesia, Philippines, and Morocco. They have broken away from the rest of the Starters and are closer to Adopters
with a gap of only 0.7 points. These breakaway Starters have seen their GCI scores grow up to 17% faster than their peers' scores, with parallel growth in GDP up to 22% higher. Some Starters graduated into Adopter economies in 2020, including Vietnam and Peru.
GCI 2020 Versus GDP per Capita
GCI 2020 vs GDP per capita_S curve
Brazil
Saudi ArabiaGreece
South Korea
Nom
inal
GD
P pe
r ca
pita
(U
S$)
GCI Score 2020
80K
70K
60K
50K
40K
30K
20K
10K
0K
908580757065605550454035302520
FRONTRUNNERSADOPTERSSTARTERS
Australia
Austria
Denmark
FinlandGermany
Ireland
Japan
Norway
Singapore
Sweden
Switzerland
United Kingdom
United States
Belgium
Bahrain
Belarus
Vietnam
Chile
China
Malaysia
Italy
Kazakhstan
Kuwait
Oman
Portugal
Spain
Czech Republic
Ecuador
Ethiopia
GhanaBolivia
Botswana
New Zealand
1.3
1.249.5 50.7
72.0 73.81.8
30.9 32.2
United Arab Emirates
COUNTRY RANKINGS | 12
13 | GLOBAL CONNECTIVITY INDEX 2020
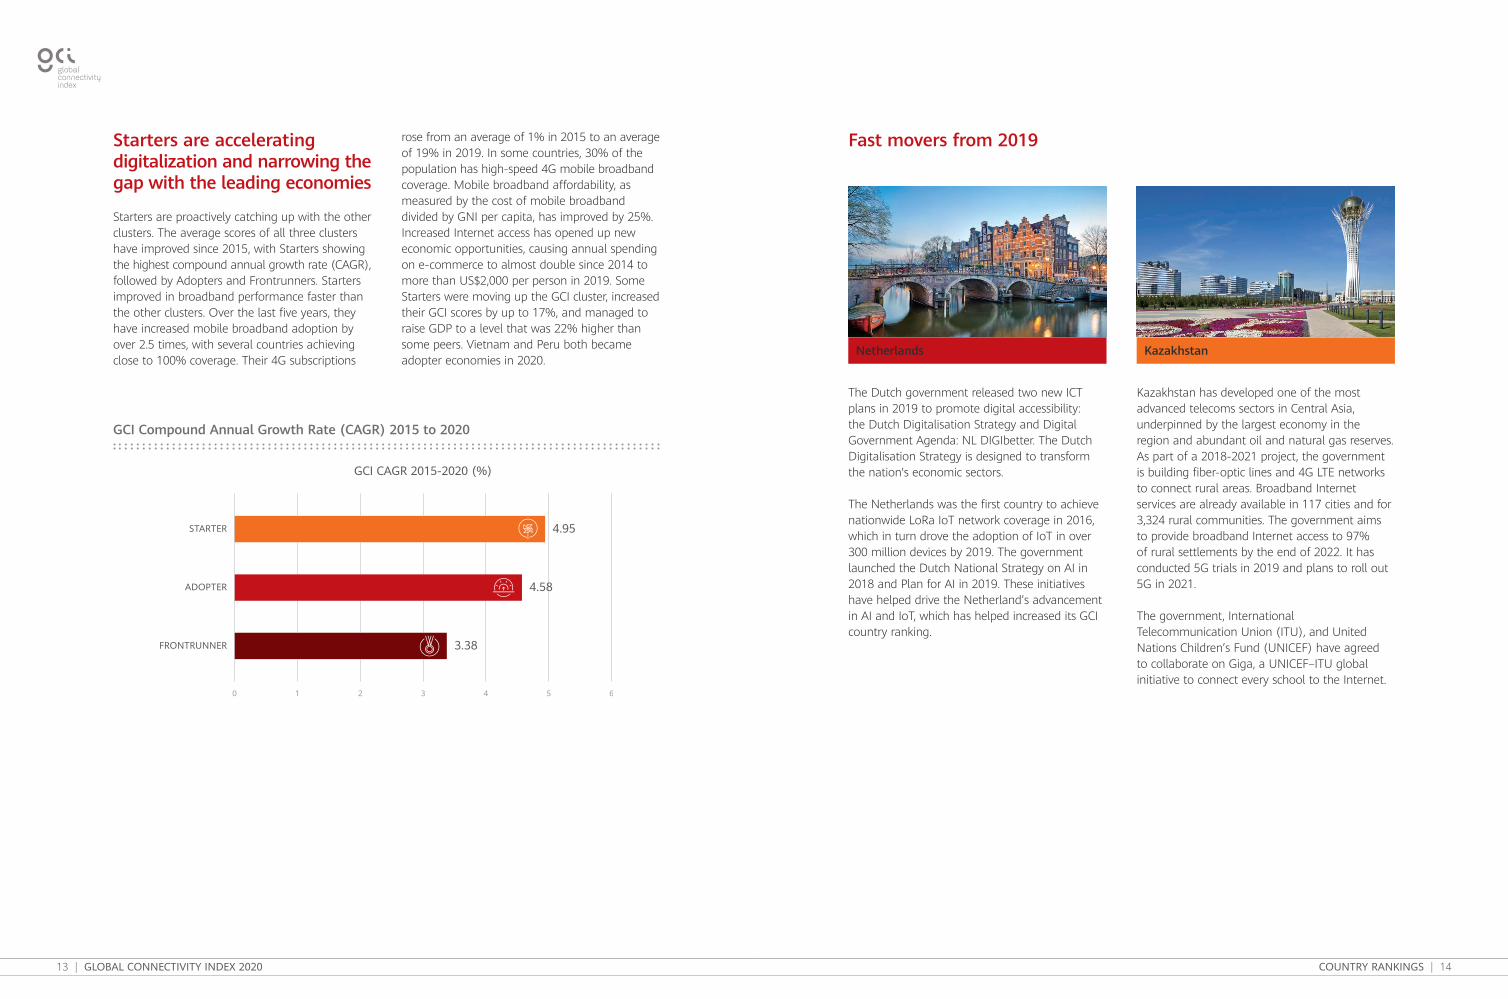
Fast movers from 2019
The Dutch government released two new ICT plans in 2019 to promote digital accessibility: the Dutch Digitalisation Strategy and Digital Government Agenda: NL DIGIbetter. The Dutch Digitalisation Strategy is designed to transform the nation's economic sectors.
The Netherlands was the first country to achieve nationwide LoRa IoT network coverage in 2016, which in turn drove the adoption of IoT in over 300 million devices by 2019. The government launched the Dutch National Strategy on AI in 2018 and Plan for AI in 2019. These initiatives have helped drive the Netherland’s advancement in AI and IoT, which has helped increased its GCI country ranking.
Netherlands
Kazakhstan has developed one of the most advanced telecoms sectors in Central Asia, underpinned by the largest economy in the region and abundant oil and natural gas reserves. As part of a 2018-2021 project, the government is building fiber-optic lines and 4G LTE networks to connect rural areas. Broadband Internet services are already available in 117 cities and for 3,324 rural communities. The government aims to provide broadband Internet access to 97% of rural settlements by the end of 2022. It has conducted 5G trials in 2019 and plans to roll out 5G in 2021.
The government, International Telecommunication Union (ITU), and United Nations Children’s Fund (UNICEF) have agreed to collaborate on Giga, a UNICEF–ITU global initiative to connect every school to the Internet.
Kazakhstan
Starters are accelerating digitalization and narrowing the gap with the leading economies
Starters are proactively catching up with the other clusters. The average scores of all three clusters have improved since 2015, with Starters showing the highest compound annual growth rate (CAGR), followed by Adopters and Frontrunners. Starters improved in broadband performance faster than the other clusters. Over the last five years, they have increased mobile broadband adoption by over 2.5 times, with several countries achieving close to 100% coverage. Their 4G subscriptions
rose from an average of 1% in 2015 to an average of 19% in 2019. In some countries, 30% of the population has high-speed 4G mobile broadband coverage. Mobile broadband affordability, as measured by the cost of mobile broadband divided by GNI per capita, has improved by 25%. Increased Internet access has opened up new economic opportunities, causing annual spending on e-commerce to almost double since 2014 to more than US$2,000 per person in 2019. Some Starters were moving up the GCI cluster, increased their GCI scores by up to 17%, and managed to raise GDP to a level that was 22% higher than some peers. Vietnam and Peru both became adopter economies in 2020.
GCI Compound Annual Growth Rate (CAGR) 2015 to 2020
GCI CAGR 2015-2020 (%)
FRONTRUNNER
ADOPTER
STARTER
0 1 2 3 4 5 6
3.38
4.58
4.95
COUNTRY RANKINGS | 14

15 | GLOBAL CONNECTIVITY INDEX 2020
Economic and Technological ImpactCountries build resilience for future economic development
The government of Saudi Arabia established Saudi Vision 2030 to develop a thriving digital society, digital government, and digital economy, and a future characterized by innovation. Its ICT strategy for 2019–2023 aims to improve the telecommunications market, drive more local digital content, and grow a vibrant ICT ecosystem and emerging technology cluster. Saudi Arabia has achieved 72% 4G coverage and 58% fiber-to-the-home (FTTH) coverage, with average download speeds of 45 Mbps. It spends about 2% of its GDP annually on ICT.
The nation is slowly but surely diversifying its economy away from a heavy dependence on oil and gas, towards a digital economy. The service sector now contributes about 25% of national GDP.
Saudi Arabia
Thailand is experiencing the fruits of its ICT Policy Framework 2011–2020. As of 2019, 78% of the population was covered by 4G, with the mobile broadband connection rate reaching 132% of the population. Although the nation only has a computer penetration rate of 16%, its smartphone penetration rate is 92%.
Thailand's use of cloud computing has tripled in the last three years, and the Thailand 4.0 plan is further driving digital transformation.
Thailand

17 | GLOBAL CONNECTIVITY INDEX 2020 ECONOMIC AND TECHNOLOGICAL IMPACT | 18
Economic and Technological ImpactCountries build resilience for future economic development
GCI 2020 tracks ICT maturity to mitigate the impact of COVID-19 and spur recovery
The COVID-19 pandemic has made digital transformation a priority for all economies as they grapple with maintaining business operations in the midst of lockdown and social distancing. When we compare economies with differing levels of GCI maturity, we see that those with higher GCI scores have been less impacted by the COVID-19 pandemic based on the lower estimated decline in their GDP per capita. Their pre-pandemic GDP per capita forecasts and revised forecasts for after the pandemic hit show that GDP decline was lower for countries with higher GCI scores. On average, the GDP of Frontrunner economies are forecast to drop by about 7%, compared with 14% for Adopters. Although there are many factors that impact economic decline, the COVID-19 pandemic has brought ICT to the forefront as a critical enabler of business continuity. Organizations in more mature GCI economies can restart business earlier and faster, and transition more smoothly to remote working because of higher ICT maturity. In general, their higher ICT maturity is able to lessen the impact of the pandemic by 50% more than Adopter economies.
Organizations in Frontrunner economies with higher broadband and cloud adoption find it easier to stay in business and continue to operate even during lockdown. AI and IoT solutions
help organizations in these economies operate more effectively and enable health authorities to identify and predict new clusters of infections for preemptive action.
Comparison of Predicted Decline in GDP per Capita Before and During Covid-19 Versus GCI 2020 Scores
GCI Score 2020
2%
0%
-2%
-4%
-6%
-8%
-10%
-12%
-14%
-16%
-18%
-20%
-22%
-24%
-26%
-28%
85807570656055504540
Economies with X higher GCI have a Y lower decline in GDP per Capita for 2020
Source: GCI and EIU November 2020 Update
Perc
enta
ge d
eclin
e of
for
ecas
ted
GD
P pe
r Ca
pita
202
0 fr
om b
efor
e Co
vid-
19
FRONTRUNNERSADOPTERS
Average declineof AD is -14%
Average decline of FR is -7%
China Switzerland
South KoreaNetherlands
Australia
United Kingdom
Finland
Denmark
Norway
SingaporeCanada
Belgium
Austria
France
Ireland
Poland
VietnamRomania
Hungary
GreeceKazakhstan
Brazil
TurkeyPeru
ColombiaRussia
Malaysia
Spain
Portugal
Chile
Argentina
Ukraine
ThailandBulgaria
Saudi
50%
UAE
19 | GLOBAL CONNECTIVITY INDEX 2020
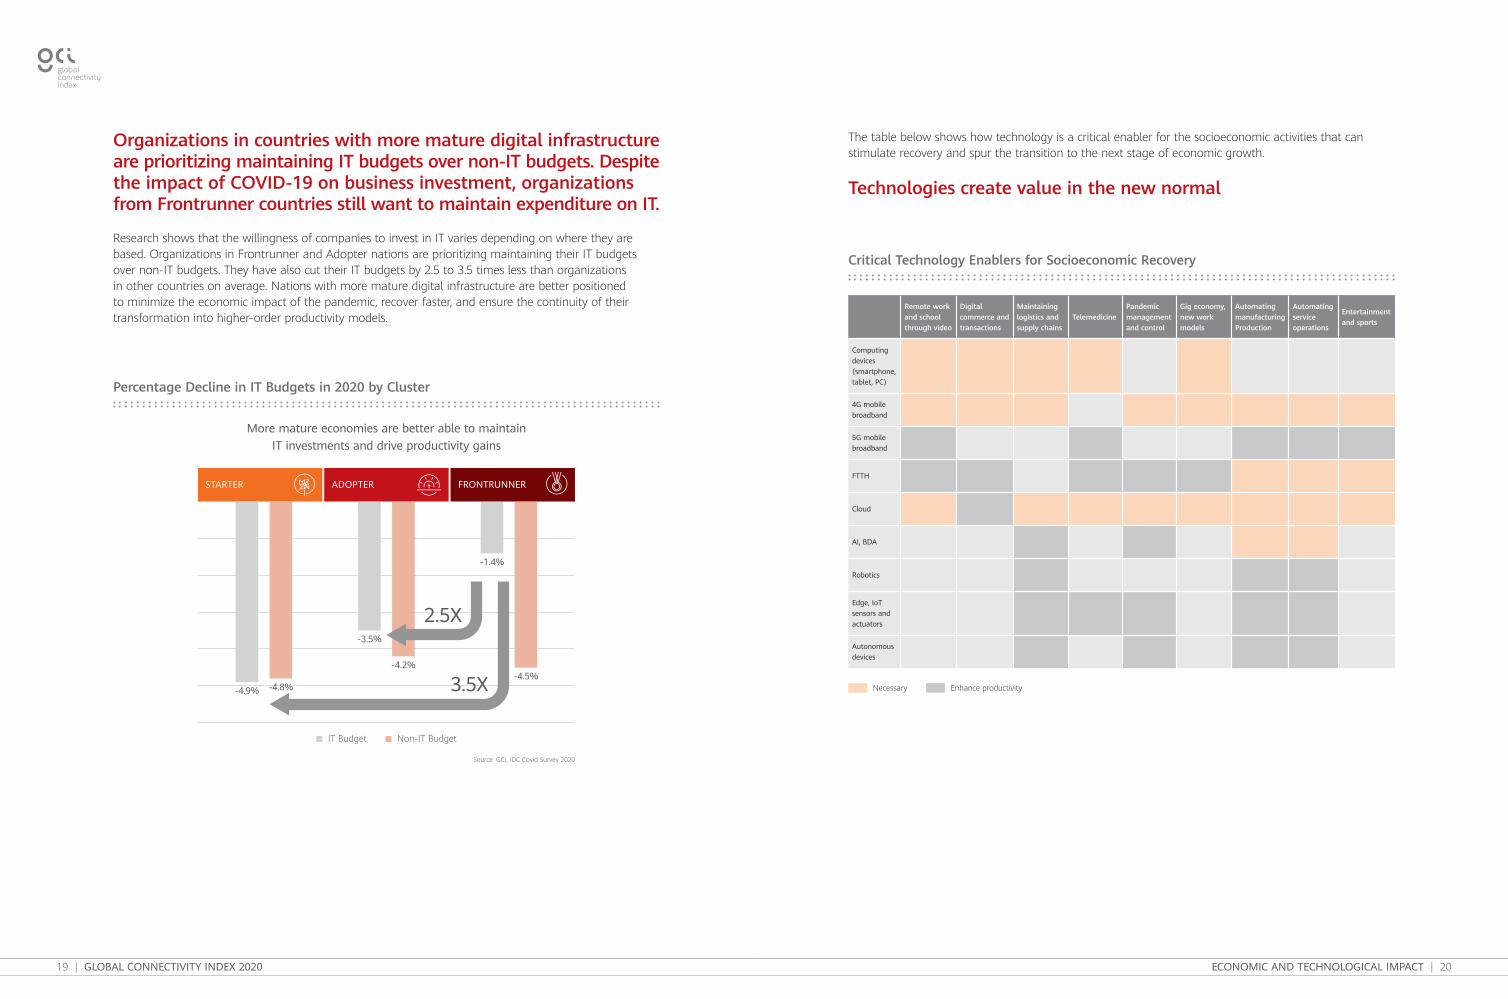
Organizations in countries with more mature digital infrastructure are prioritizing maintaining IT budgets over non-IT budgets. Despite the impact of COVID-19 on business investment, organizations from Frontrunner countries still want to maintain expenditure on IT.
Research shows that the willingness of companies to invest in IT varies depending on where they are based. Organizations in Frontrunner and Adopter nations are prioritizing maintaining their IT budgets over non-IT budgets. They have also cut their IT budgets by 2.5 to 3.5 times less than organizations in other countries on average. Nations with more mature digital infrastructure are better positioned to minimize the economic impact of the pandemic, recover faster, and ensure the continuity of their transformation into higher-order productivity models.
The table below shows how technology is a critical enabler for the socioeconomic activities that can stimulate recovery and spur the transition to the next stage of economic growth.
Technologies create value in the new normal
Critical Technology Enablers for Socioeconomic Recovery
Remote work and school through video
Digital commerce and transactions
Maintaining logistics and supply chains
TelemedicinePandemic management and control
Gig economy, new work models
Automating manufacturing Production
Automating service operations
Entertainment and sports
Computing devices (smartphone, tablet, PC)
4G mobile broadband
5G mobile broadband
FTTH
Cloud
AI, BDA
Robotics
Edge, IoT sensors and actuators
Autonomous devices
Necessary Enhance productivity
Percentage Decline in IT Budgets in 2020 by Cluster
More mature economies are better able to maintainIT investments and drive productivity gains
Source: GCI, IDC Covid Survey 2020
IT Budget Non-IT Budget
-4.9% -4.8%
-3.5%
-4.2%
-1.4%
-4.5%
FRONTRUNNERADOPTERSTARTER
2.5X
3.5X
ECONOMIC AND TECHNOLOGICAL IMPACT | 20

21 | GLOBAL CONNECTIVITY INDEX 2020
Countries have benefited from the construction and application of 5G infrastructure
Many countries went into lockdown to fight the spread of COVID-19, with health and safety positioned as top priorities. Services, such as healthcare, government services, banking, and supply chains, took advantage of digital channels to quickly respond and serve more than 1 billion people. The switch happened almost overnight, people adapted, and many lives were saved.
The speed, latency, and capacity of 5G has become even more crucial for powering business resilience and overall recovery. 5G phones may not appear to be useful in the post–COVID-19 world, but their ability to provide broadband connectivity, host augmented reality and virtual reality (AR/VR), and enable content-streaming at higher resolution — both for entertainment and service delivery — make them an essential first step in the widespread deployment of 5G and its use cases.
Japanese companies committed to investing more than US$45 billion in 5G deployment, the intention of which was ensuring 5G coverage for the 2020 Summer Olympic Games. Although the COVID-19 pandemic led to the postponement of the Olympics, Japan still intends to push ahead with its 5G plans. The event is planned to take place in Japan in 2021, but the infrastructure investments in fiber networks and cellular 5G will still be in place to support whatever the post-pandemic future holds. For the Olympics, as showcased in the 2018 Korean Winter Olympics, 5G use cases in terms of augmented experience (additional viewing angles, statistics, and immersion in sports such as swimming and the marathon) expanded the reach of the games to a far broader audience. Similarly, the 2018 Commonwealth Games in Queensland used HD streaming coupled with 5G-enabled handsets, enhancing both the
in-event and remote experience.
The same opportunity now presents itself in any country adversely affected by the COVID-19 pandemic. The migration to remote working and remote learning is unlikely to end with a return to the "old world" approach. Lockdowns and shelter-in-place mandates define how people work and play from home. They are consuming large amounts of data, much of which is critical data for things like learning, video conferencing, and collaboration. One hour of a live webinar in standard definition requires 700 MB of data transfer and full HD requires even more. Many remote workers cite the lack of video quality as a major impediment to creating a more realistic and engaging experience. Since the pandemic, Spain has seen an average increase of 40% in bandwidth use even as its download speeds declined by 8%. As use cases for remote working, remote learning, smart home, and content-streaming increase, data transfers are only going to rise as the world adjusts to the new normal for an increasingly remote global workforce.
A further evolution of video connections is AR/VR. Both can be used in a wide range of entertainment, industrial, and educational scenarios. However, use cases are currently constrained by (a) bandwidth (requirements are 50 Mbps for 4K/basic 3D AR/VR and 100 Mbps for 8K/immersive 3D AR/VR) and (b) latency (requirements are sub 20 ms). Neither are possible on 4G (LTE) networks. A 4G network can support AR/VR up to 1080p (approximately 2K) with limited applications.
However, applications such as remote services and guided services are already being enhanced by AR/VR solutions. One example in healthcare comes from Aris MD, which uses diagnostic images (DICOMiii) to create 3D visualizations of patient anatomy displayed over the patient, so surgeons can see individual internal physiology.
ECONOMIC AND TECHNOLOGICAL IMPACT | 22
This reduces mistakes due to anatomical variances (the differences between each person’s individual anatomy) and improves efficiency in the operating room. In addition to visualizing the patient's anatomy, Aris MD’s automated segmentation technology allows images to be separated into individual organs and parts, without the need for either a radiologist to manually mark up images or the use of 3D modeling techniques.
High-speed, low-latency networks can deliver 4K high-resolution videos without causing interference in the operating environment. During the COVID-19 pandemic, the use of telemedicine to diagnose and treat patients has surged. Real-time video communication between doctors and patients in secure environments minimizes the risk of in-person interactions and expedites diagnosis and treatment.
In manufacturing, plants can harness 5G to power IoT solutions in smart factories, increasing productivity and ROI. The use cases across distribution and services, manufacturing and resources, and the public sector will be worth US$311 billion by the end of 2024. Keeping workers out of harm’s way is a priority in mining, oil and gas, and manufacturing. Autonomous mining dump trucks are being deployed in Russia in the Siberian Coal Energy Company's (SUEK) open-pit coal mine in Khakassia to test the potential of 5G as part of an autonomous haulage system. Secure 5G connectivity is the leading contender for private networks at the mine site.
Similarly, remote-operated oil rigs are being trialled by operators, such as Royal Dutch Shell, to reduce the need for on-site personnel and improve safety in hazardous locations.
Other 5G use cases that will grow are online shopping and robot deliveries. Japan started deploying robots to deliver products to consumers in 2019. COVID-19 and its aftermath could
see 5G enabling many new robot delivery use cases, and many countries are well-placed for this to happen. In addition, governments have incentives to encourage innovative delivery models that reduce the spread of the virus and enable a heavily distributed workforce. During the pandemic, Japanese start-ups also developed robots for medical use and contactless deliveries.
Countries that can build and use 5G infrastructure can reap the benefits that this technology already offers. Nations that do not invest heavily in this direction will fall behind from the benefits of its revolutionary applications.
As of early 2020, about 53 countries had started deploying 5G.
23 | GLOBAL CONNECTIVITY INDEX 2020
eportals, multimedia, television, and YouTube (such as the Edu TV Kenya YouTube channel) to ensure that education continued. Most countries have deployed e-learning solutions that include online and offline content and applications. In Egypt, the Ministry of Education and Technical Education (MoETE) implemented distance learning and assessments, extended access to the Egyptian Knowledge Bank (EKB) to students, and provided content by grade level and subject, which is accessible by phone or computer. Its site features education content through multimedia, including textbooks and videos. It also launched a digital platform that enabled communication between 22 million students and teachers in 55,000 schools in a manner that was similar to being at school. Even students who are not in the country can use the electronic platform and digital library.
In Bulgaria, each higher education institution independently organized the distance learning process for its students using various communication channels. These include online platforms and video conferencing software, such as Office 365, Skype, and Blackboard, through which distance learning sessions are conducted.
To address unequal access to technology and enable e-learning, governments and corporations have come together to address broader access needs. Argentina has zero-rated its Educ.ar education portal, and telephone companies have guaranteed that using digital platforms will be free of charge and will not consume data. In Kenya, the government worked with technology providers to provide wider Internet coverage to all students and families through the deployment of Loon balloons floating over Kenyan airspace carrying 4G base stations. Loon is a network of stratospheric balloons that provide Internet connectivity for rural and remote communities.
Cloud has also helped organizations pivot to
better enable business. Although air cargo experienced growth fueled in part by the increase in e-commerce and online shopping, efficient network coverage and capacity were still issues. In Europe, Air France KLM Martinair (AF-KLM) Cargo launched Kickcharter, a new collaborative platform for charter flights to address capacity issues and widen their network to serve destinations not in their usual network, or affected by airline shutdowns. To address gaps in the network, charter services had to be operated with enough shipments to mitigate the cost of servicing the area. Kickcharter was developed by an in-house team as part of digital transformation. The new platform enables customers to book cargo capacity to ensure freighter flights are full and flown to destinations not on its scheduled network.
All economies are expected to accelerate the adoption of modern, cloud-native application platforms and distributed cloud infrastructure options that enable bidirectional scalability, workload portability, and a promise of continual enhancement from cloud to core to edge. These increase ease of mobility across infrastructures and platform options, while reducing constraints. As organizations move from crisis management to recuperation and then onto remediation, a faster and more extensive adoption of cloud technologies, deployment models, and operational practices will help flatten dips in any future crises.
Enterprises accelerate the migration of applications to the cloud.
The COVID-19 pandemic has underscored the importance of digital transformation in the eyes of policy makers across most economies. Industries that have accelerated their digital transformation plans have coped better with the crisis. With a recession on the horizon, or already happening in many countries, organizations have to decide whether it is enough to follow the same course of cost-cutting as they did in previous recessions, or engage in other strategies to flatten their own recessionary curve by leveraging technology. Economies that have invested in digital transformation see an opportunity to flatten the curve using technology to minimize the impact of the current crisis and emerge resilient on the other side of the curve — more digitally fit and agile, and better equipped to capture their share of new opportunities as part of the new normal.
Cloud continues to be the underpinning platform for all digital transformation initiatives, and has therefore seen an acceleration in demand in the wake of the pandemic. All that cloud promised in terms of elastic consumption, agile development, and global reach is being tested now. Cloud platforms (including public, hosted, private, and the recently introduced local cloud-as-a-service [LCaaS], a compute, storage, and network bundle from IT suppliers) are playing a critical role in helping enterprises react to the crisis, deal with the slowdown, and enable operational resilience.
As safe distancing rules kicked in, telemedicine solutions have also seen a rise in adoption, as healthcare providers have sought to keep both patient and healthcare workers safe and productive. Some African countries are using video conferencing to replace in-person consultations. In many other countries, healthcare providers
offer virtual clinics and have seen a significant uptake of such solutions. These cloud-based solutions help to quickly scale out the offering to reach many more users, often on existing devices.
Healthcare providers are increasingly leveraging hybrid cloud models in key areas such as data management and IT infrastructure. Although this was a trend even before the pandemic, it became critical as COVID-19 swept the globe. The move to cloud computing and software-defined architectures offers secure, flexible, and highly scalable compute and storage resources that far exceed those of legacy on-premise platforms.
In many countries, the pandemic forced governments to close schools, with students learning from home. Governments and educators employed a range of technologies, including
ECONOMIC AND TECHNOLOGICAL IMPACT | 24

25 | GLOBAL CONNECTIVITY INDEX 2020
AI facilities virus diagnoses and development of new medicine.
AI, along with a host of other technologies, is mitigating some of the pandemic’s negative consequences both in healthcare and business in general.
The most obvious area of AI application is in healthcare. Hospitals and public health agencies are spearheading efforts against the spread of the virus. Investment in AI-based healthcare solutions has doubled from about US2 billion globally as a result of the pandemic. We expect it to continue growing at more than 30% for several years to come. AI can help detect the virus; for example, AI-enabled thermal cameras reduce the reliance of frontline staff to manually measure individuals' temperatures using forehead thermometers. This increases the accuracy of readings, takes less time to measure temperatures, and reduces the risk of frontline staff contracting the virus.iv
Frontline medical services have been severely stretched across the world. Technologies like AI-enabled chatbots, telemedicine, drones, and physical robots have been used to reduce interaction between patients and doctors and cut the risk of infection for medical staff.v For example, the Centers for Disease Control and Prevention (CDC) in the United States built a chatbot to respond to people who potentially have COVID-19 symptoms. In addition, the US has also put up an online triage system to respond to individuals with more serious symptoms, so that the authorities can locate them earlier.vi
In Singapore, medics at the National University Hospital use a clinical chat assistant smartphone app to keep pace with the fast-changing information about the pandemic. AI in hospitals goes beyond providing insights. Should healthcare
services be further overwhelmed, AI can help by optimizing patient management and operations to reduce the workload on healthcare staff. Also in Singapore, AI provides real-time visibility of ground operations at Tan Tock Seng Hospital (TTSH) from admission to discharge, including keeping track of resources, such as hospital workers, beds, critical equipment, personal protective gear, and other supplies. AI is even used to predict operational problems before they occur, outputting information on how resources can be better allocated. In February 2020, TTSH saw a surge in attendance at its COVID-19 screening center, coinciding with increased in-patient admissions at the National Centre for Infectious Diseases (NCID), which is located next to TTSH. Guided by its internal AI tools, TTSH was able to pull together the manpower, equipment, and other resources to quickly open five wards at the NCID and strengthen its screening center.vii
AI-based tracking, combined with advanced graphical analytics, can help predict the spread of the virus, require local lockdowns, and give authorities the information they need to prevent the virus from spreading further. By tracking movement through mobile devices, AI can give scientists prior warning and provide countries and hospitals advance notice of potential virus risks.viii
AI is accelerating the process of diagnosis, vaccine creation, and testing, helping to identify genome sequences to build an effective vaccine.
Traditional manual tests are extremely slow by comparison. BenevolentAI from the UK used its AI drug discovery platform to identify approved drugs to potentially inhibit the progression of COVID-19. It used AI to derive contextual relationships between genes, diseases, and drugs, suggesting a number of possible vaccines. In just days, BenevolentAI found a vaccine candidate in late-stage clinical trials in the US. AI enables the testing of a potential vaccine within months instead of
ECONOMIC AND TECHNOLOGICAL IMPACT | 26
years, as was the case with the SARS epidemic. That said, testing a potential vaccine on animals and then people is a very slow process that requires careful design and is by no means certain of success. For example, fearing a pandemic, a vaccine was rushed out for the 1976 swine flu, exposing millions of people to an increased risk of the neurological disorder Guillain-Barre syndrome. The best strategy therefore is coordination across national research and development (R&D) efforts to find a cure. Again, AI, particularly in the form of natural language processing (NLP), is being used to track scientific papers and identify potential directions for new research on the virus.ix
Many enterprises and industries, such as transport, logistics, agriculture, and communications, are adopting AI to help them scale and operate effectively to meet the fast-changing needs of their customers and employees while social distancing and quarantine measures remain in place. With the COVID-19 crisis continuing for the foreseeable future, more companies are moving
beyond crisis management and towards business resilience and growth.x Many speculate what the new normal will look like, but it is almost certain that businesses will ensure they are able to operate and interact with their customers digitally. As such, AI is increasing in prominence as a way for enterprises to adapt to the increased use of digital platforms while increasing productivity and efficiency. Use cases involving AI chatbots, intelligent automation, voice analytics, and AI cybersecurity tools, have all increased despite the general economic slowdown brought about by the pandemic.
With the COVID-19 pandemic, AI has proven itself to be a valuable tool in making economies, industries, societies, and individuals more resilient to similar threats. The debate is no longer AI versus people; the new challenge will be how to use AI to improve knowledge workers' productivity. By 2024, we expect more than a third of knowledge workers to spend a significant time at work interacting with AI-based tools.
27 | GLOBAL CONNECTIVITY INDEX 2020
IoT creates contactless experiences
The combination of ubiquitous high-speed networks and advanced deployment of intelligent endpoints has gone a long way to mitigate the impact of COVID-19.
Remote care solutions that can collect data on at-risk populations have become a priority as large numbers of people become displaced, medical facilities become overwhelmed, and treatment must be delivered over an extended period and geographical scope. With an increasing influx of patients caused by the pandemic, temporary hospitals are being set up around the world. However, infrastructure may be lacking in temporary locations for full-scale networking. During a health crisis, healthcare facilities create temporary patient care areas that require a method for patients to call for nurses. Low-power WAN (LPWAN) IoT tools can be deployed to use unlicensed spectrum to enable emergency workers and patient care. The use of telemedicine across the Middle East and some African countries to reduce contact with potentially infected individuals, while delivering initial triage and ongoing outpatient care, has become widespread not only in critical care, but also counseling, physiotherapy, and elderly care. Similarly, specialized network devices can be deployed to continuously monitor and detect the most common symptoms of respiratory illness, including increased body temperature and breathing rate, persistent coughs, and accelerated heart rates, so that high-risk individuals can be remotely monitored without being confined at home or in the hospital.
Although government-sponsored contact-tracing initiatives have been put in place by governments across Asia, Latin America, and Europe for the duration of the pandemic, the workplace will see major transformation post–COVID-19. Enterprises are already considering the introduction of new technologies to monitor and supervise employees. This should not only include non-contact temperature checks at work, but also related mobile apps that run on employees' phones
using Bluetooth and Wi-Fi to measure proximity. Whether at the office, factory, or construction site, each employee can be equipped with a compact wearable proximity sensor that enables the easy monitoring of interactions within common areas to work alongside security badges for access control. When the sensors record that two or more people have exceeded the safety limit, it warns them with an audible or visual alarm.
Social distancing is only one aspect of managing work after the pandemic. Businesses everywhere are looking to keep working, especially where remote work is not practical. As a result, distancing must be augmented with increased sanitation awareness. A number of start-ups have developed contactless monitoring stations that scan employees' hands for contamination and monitor how they wash their hands. Digital sanitary policy enforcement and traceability solutions are essential tools to help workers follow distancing rules and control their exposure to potential contaminations, therefore preventing the shutdown of plants and facilities.
IoT has developed to the point that many useful devices existed prior to the arrival of the pandemic. As a result, technologies need to be adapted, scaled, and secured to help in the fight against the COVID-19 pandemic. Today, IoT companies are teaming up with NGOs and governments by developing new technology solutions that can be used to help fight COVID-19 and provide relief to people and businesses. Some examples deployed in recent months include:
• Connected thermometers. As having a fever is one of the basic COVID-19 symptoms, this IoT technology allows millions of devices to feed data into a national database that allows for the production of real-time maps showing at a glance where there are a spike in people with fevers. Germany, Italy, and other European countries are incorporating temperature checks in an overall COVID-19 management regimen.
• Wearables. Sensors that can be worn by patients and staff allow for the real-time flow of data related to vital signs such as temperature, heart rate, and blood oxygen. One type of smart
ECONOMIC AND TECHNOLOGICAL IMPACT | 28
wristband monitors when wearers touch their face, which is one way to contract the virus. Another type of wristband in Brazil tracks people who recently arrived to the country to ensure they adhere to home quarantine protocols.
• e-commerce. The COVID-19 pandemic has greatly affected the way businesses conduct payments and accounting, especially as companies have been forced to transition to virtual collaboration and remote work. Implementing IoT in commercial transactions changes the flow of data because it provides digital receipts of all financial-related knowledge and real-time data. The pandemic has accelerated the adoption of cashless models in markets from Singapore to China to Argentina. Combined e-commerce solutions will enable faster issue assessments and risk analyses and let businesses respond to issues much faster than they could otherwise.
• Robots. 5G-connected robots have been programmed to deliver food, drinks, and medication to patients. This not only reduces time-pressures for human staff, but also cuts human interaction with COVID-19 patients, thereby reducing the risk of virus transfer. Robotic deliveries in Washington, D.C. have allowed people in isolation to directly receive food and other supplies.
• Drones. The ability to gather data using remote-operated devices, such as low-cost drones, assists in monitoring quarantine and moving critical supplies during lockdown. In April 2020, the Irish Aviation Authority approved drone operator Manna.aero to deliver medicines and critical supplies to a dozen households under confinement in the rural town of Moneygall. Delivery works in a closed-loop end-to-end system. After a video consultation, local doctors prescribe medication that is then dropped off at the patient's home by drones, which can transport up to 4 kg of products each. Other examples on how drones have been used include:
◦ Transporting medical supplies into hotspots without putting more human lives at risk, which is also faster and reduces road traffic
◦ Monitoring public gatherings and relaying information to authorities when social distancing protocols are violated
◦ Spraying disinfectant in public areas and vehicles traveling into or out of hotspots
Many business leaders now view IoT as a critical lever, one that if integrated correctly will not only ensure a safe and secure return to work but also give rise to recurring dividends for years to come. For instance, consider the supply chain hindrances visible with shortages of essential supplies and empty supermarket shelves. The backstory reveals the global supply chain disruption, production slowdown, and shortage of raw materials and sub-assemblies.
In this scenario, IoT can facilitate a real-time view of production programs, inventories, and expected delivery times between all supply chain participants, thus mitigating supply chain risks. Signals from connected machines supported by geolocation tags can offer insights into the status of raw materials in factories and the location of upcoming supplies.
It is only natural that IoT will be a key pillar of digitalization. It is this change in culture and philosophy at the industry level that will ensure a safe and successful return to economic growth and safeguard against future setbacks.

29 | GLOBAL CONNECTIVITY INDEX 2020
The GCI path to economic resilience in the new normal As economies come to grips with the pandemic and emerge from it, they need to consider how to transform their industries to be competitive in the new normal. ICT will be at the forefront of any organization’s strategy from now on. It is imperative that policy makers understand how the competitive landscape has changed and how to build a national competitive advantage. American Economist Michael Porter argues that an economy’s competitive advantagexi is driven by a differentiating combination of basic and more advanced national factor endowments nurtured in the context of local demand and related local suppliers, all working together for the national good.
Basic factor endowments are typically hard to develop or acquire. For example:
• Natural resources, such as oil and gas in Brunei and Saudi Arabia, copper in Chile, timber in Russia, and sand in Egypt
• Climate that makes certain industries attractive, such as agriculture in Canada and tourism in tropical countries
• Geographical locations that influence the movement of goods and people, such as Singapore and the UAE
• Demographics, such as the large populations of China and India or the highly skilled population of the Czech Republic
Basic factors are inherited and require little or no new investment to be utilized in the production process. Factor endowments are not static. With education and training, for example, the characteristics of the labor force can change. Basic factors alone do not explain how countries such as Singapore, Japan, and Ireland can grow their economies beyond the advantages that basic factors confer.
Investments in advanced factors can support economic recovery
In contrast to basic factors, advanced factors are human-made. They are then upgraded through reinvestment and innovation to become specialized factors. According to Porter, these form the basis for the sustainable competitive advantages of a country. Countries with limited basic factors can (and are often forced to) outcompete their peers by developing advanced factors.
Basic and Advanced Factor Endowments for National Competitiveness
Advanced factor endowments play a greater role in conferring competitive advantages in the new normal.
Source: Porter’s Competitiveness of Nations
National Factor EndowmentsA nation’s position in factors of production such as skilled labor or infrastructure necessary to compete:
Advanced factor endowments. The result of investmentby people, companies, and governments that are morelikely to lead to competitive advantages. If a country hasno basic factors, it must invest in advanced factors
CommunicationsSkilled laborResearchTechnologyEducation
Basic factor endowments. The factors present in a country. Basic factors can provide an initial advantage and must be supported by advanced factors to be used successfully
Natural resourcesClimateGeographical locationDemographics
Government policies play a key role in developing advanced factors. Investments in selected advanced factors are needed to help an economy boost productivity and product quality, and move into higher-value sectors that will generate economic wealth and jobs in the new normal. This is similar to how advanced factors can enable a country to enhance its productivity and quality of life and work. Porter outlined the following advanced factor endowments
as critical, and noted that their developments need to be carefully coordinated so that the factors build upon each other synergistically: Investments in secondary and university education support the development of skilled labor and technology research, while digital infrastructure supports better national-level communications and enables new technology innovations, spurring further education and research.
Advanced Factor Endowments: Description, Requirements, and Examples
Advanced factor endowments build on each other
Advanced FactorEndowment
Description Requirements Examples
1. Education Investments in general human capital. Training in languages, STEM, analytics, design.
Skilled labor (teachers) and some basic technology infrastructure
Schools, technical colleges, internal training, E-based learning
2. Technologyinfrastructure
Investments in technology infrastructure, tools for mobility, communications, education, skills development, research
Skilled labor and research. Electricity, water, schools, 4G/5G broadband, Cloud, Edge
3. Skilled Labor Investments in specific human capital, skilled workers with experience who use the technology infrastructure.
Education and technology infrastructure
Availability of DevOps, deep learning specialists, radiographers, crane operators
4. Communications Ability and willingness to share insights, results, and use cases between individuals, institutions, and companies
Technology infrastructure and education
Common standards, regulations, policies, case studies
5. Research Investments in research into best practices, use cases, and standards.
Education, skilled labor, technologies and communications.
Academic institutions producing vision statements, research papers, standards, guidelines, strategies, plans, case studies
Carefully coordinated investments in advanced factors can create clusters of related and supporting industries that further enhance competitive advantages. In developing countries,
these investments can also leverage more basic factors and help them transform their economies with higher-value products and services.
ECONOMIC AND TECHNOLOGICAL IMPACT | 30

31 | GLOBAL CONNECTIVITY INDEX 2020
Below are some examples of COI in action.
Pakistan: Digital technologies are contributing to the development of Pakistan's core industries. The nation is another young and fast-growing Asian market that is increasingly nurturing deep tech. Over the past few years, improved communications have seen Internet traffic grow to accommodate over 83 million users. More than 97% of Pakistanis now access the Internet on their mobile phones. This rapid expansion is due to the provision of 3G/4G services by major telecom players. The 4G penetration rate has tripled over the last three years and Pakistan's GCI position has improved by two places. In 2019, Pakistan ranked as the region’s fastest-growing country for digital freelancers. The government also appointed an MIT-trained executive to head the Digital Pakistan initiative. Much of its digital innovation is focused on clusters that enhance traditional industries, like agriculture, which makes up almost 19% of the nation's GDP and employs 40% of its labor force. Emerging technology has been disrupting traditional farming and boosting productivity and efficiency. Several apps are starting to transform the agricultural sector of Pakistan, enabling farmers to improve crop yields by better livestock management, soil preparation, more timely weather updates, and e-marketplaces.
India: Digital skills are an important condition for developing innovation clusters. While India lags behind East Asian nations in R&D spending and filing patents, it ranks second only to China in the number of computer science graduates it produces each year. By training software engineers to become data scientists and machine learning specialists, India almost doubled its AI workforce from 40,000 in 2018 to 72,000 in 2019. This labor pool is deeply involved in national initiatives such as a universal identification project that has already registered more than 1 billion citizens and and a new facial recognition database for law enforcement agencies. Many global companies have set up AI research centers in Bengaluru, and one multinational AI company has raised more than US$325 million to boost enterprise efficiency with AI. India’s AI investments have grown on average by 46% a year since 2015, helping India to improve its GCI ranking.
Clusters of Innovation (COI) describe groups of interconnected companies and associated institutions in a particular field. Together, they support and encourage the continued generation and co-creation of business and technology innovations within the cluster. The poster child of innovation clusters is California's Silicon Valley, but innovative startup and research clusters are emerging rapidly in various global locations, including London, Israel, Japan, and Singapore. These clusters indicate a technological leapfrogging to come. They can help economies transform by building higher value and more productive economic sectors.
Clusters typically build on several factors to create success. Early-stage clusters are often best defined by their closeness to leading educational institutions, such as Stanford University in the US, Tokyo University in Japan, Cambridge University in the UK, and NUS in Singapore. Science parks and research triangles co-founded by universities abound in the developed world, for
example, in London, Paris, Berlin, and Singapore. Another common theme is support for the cluster from much larger multinationals such as IBM, Microsoft, Google, Huawei, Baidu, Infosys, and Mitsubishi. They can bring international innovation requirements and high-quality business skills to local partners and startups, supporting and nurturing their collective growth over time. As clusters evolve, an additional requirement for their survival is flexible startup financing from Venture Capital funds, banks, or governments. But perhaps even more important than any of these technical factors is a social one — the development of strong interpersonal networks of people willing to interact and share ideas. The seeds from which clusters grow are usually planted by policymakers. They can provide the right incentives, ICT investments, and regulatory environment to build or attract educational institutions or larger multinationals to set up in the region, or to facilitate sharing and interaction between industry, society, and institutions.
Advanced Factor Endowments Nurturing Clusters
Advanced factor endowments Clusters of related and support industries
“Advanced factor endowments are clusters of related and support industries, such as networks of specialised input providers, institutions and the spill-over effects of local rivalry, that become the true source of competitive advantage. Clusters represent environments in which learning, innovation and operating productivity can flourish. These kinds of localised clusters are a prominent feature of virtually any advanced economy but are lacking in developing countries, which limits productivity growth in those economies.” Mike Porter (1998c, 2000).
ResearchEducationTechnologySkilled laborCommunications
Nurture Clusters
ECONOMIC AND TECHNOLOGICAL IMPACT | 32

33 | GLOBAL CONNECTIVITY INDEX 2020
Middle Eastern nations are promoting digital transformation in every part of their infrastructures, building digital innovation around clusters of innovation. Plans and vision statements abound for broadband, AI, and 5G, and play a key role in galvanizing national support for critical national goals. However, real incentives and investments are needed to make these visions reality. Many nations are using government funds to enable local demand for ICT in the form of smart city programs such as the UAE's National Smart Government and Cities plans.
Romania is active in the smart city domain, which is a strong means of encouraging local clusters of innovation. In partnership with the broadband Internet and mobile provider Orange Romania, the municipal administration of Alba Lulia in Transylvania set its sights on building the first smart city in Romania back in 2018. The project involved deploying IoT networks to provide services such as smart parking and transportation, intelligent lighting, water metering, waste management, and environmental monitoring This project has caused some local startups to emerge — the beginnings of a local innovation cluster. However, it remains to be seen whether these local initiatives will have the funding or scale to credibly build clusters that are viable in the broader competitive marketplace.
Chile combines digital technologies with abundant natural resources. Like most Latin American and developing countries, Chile has many industries that focus on natural resources, including mining and salmon farming. Today, for example, more than 200 companies are involved in its salmon industry. These include manufacturers of aquiculture equipment, breeding cages, and nets; salmon food companies; floating houses and warehouses; laboratories; vaccine and drug producers; air and land transportation companies; underwater services; quality control; training centers, research centers, and educational institutions; financial and insurance companies; and specialized legal consulting and advisory services. ICT is having a major impact on helping this cluster better communicate and coordinate successfully in a competitive global market.
Saudi Arabia has aggressively invested in 5G capabilities in line with the targets of Saudi Vision 2030, the nation's strategic framework for reducing the kingdom's dependence on oil; diversifying its economy; and developing public service sectors such as health, education infrastructure, recreation, and tourism. In August 2019, the Ministry of Communications and Information Technology (MCIT) announced the government's ICT Strategy 2019-2023, which comprises 13 national priorities. These include improving competition in fixed retail and wholesale markets, increasing the share of local content in the IT industry, and improving the tech skills of the local ICT workforce. The government has also funded 24 initiatives for building a connected and innovative Saudi Arabia, including establishing technology clusters in oil and gas, healthcare, and logistics. Many involve government mega projects to jump start these local clusters, for example, transport and mobility schemes like Riyadh Metro, social infrastructure developments such as the Ministry of Housing’s Sakani program, and energy mega projects like the state-owned Aramco’s Berri and Marjan oil fields. Other initiatives involve working with national and regional champions (particularly IT companies and telcos) to accelerate segments such as IoT, data analytics, AR/VR, smart homes, and autonomous vehicles. Saudi Arabia’s GCI rank has jumped 10 places since 2016 to reach 33 in GCI 2020.
ECONOMIC AND TECHNOLOGICAL IMPACT | 34

35 | GLOBAL CONNECTIVITY INDEX 2020
Japan has introduced new manufacturing methods to meet the potential needs of its society. Another factor for the development of local clusters is strong local demand and alignment with national technological priorities. For example, as a GCI Frontrunner economy, Japan's focus has very much been on building clusters of IoT and robotics companies and leveraging its expertise in areas such as sensors, wearable technology, wireless modules, and AI. In 2004, Japan’s Ministry of Internal Affairs and Communications (MIC) created the u-Japan Policy to accelerate cluster growth in robotics and IoT, both for B2B clients and for use in smart devices designed for the Japanese public. Japan is seeing a strong demand for IoT from its older population, most notably for healthcare. For example, sensors can identify trends and potential issues in blood sugar levels in minutes to improve diabetes care. Japan’s large-scale push into analytics and IoT sensor deployment will spur innovation and generate more data to further improve analytics, an area that will only grow in importance as developed nations around the globe adapt to demographic changes.
Singapore has implemented an AI strategy to improve its innovation capabilities. Ranking 2nd in GCI 2020, Singapore has an ambitious vision for AI deployment and has shown success in bringing disparate cluster innovation factors together. As it ramps up 5G deployment to cover half the island in the coming years, Singapore’s latest AI strategy includes all the key ingredients for it to become a leading AI cluster. It has prioritized AI initiatives in five national projects: logistics, housing, healthcare, education, and security. As well as a regulatory framework for overseeing data protection, ethics in AI, and capital investments for startups, the government is training 25,000 professionals in AI basics. Singapore’s holistic approach to innovation helped it rank as the third most innovative country in the world. (South Korea is second and the US is ninth.)
Geography is important in the early stages of developing local innovation clusters. But as time goes by, innovation inevitably diffuses and megaclusters operating across multiple countries start to emerge.
Technology Enablers for Developing Advanced Factor Endowments
The GCI accelerates the development of advanced factors for increasing economic competitiveness and recovery
How ICTsupportsinfrastructure: AIBroadband/5G IoTCloud
Remote learning, theuse of better qualitymaterials globally
Greater availability andaccessibility of content
Personalized andinteractive learning
Immersive andtactile learning
Training, remote workopportunities
Greater availability andaccessibility of tools andapps
Software robots. Support in remotelocations
Historical storage Video analytics Surveillance
Skilled Labor
Real-time analytics andresponse
Platform for scalabledeployment of apps,tools, and solutions
Digital twins,predictive models
Sensors and actuators,monitoring, maintenance.
GeneralInfrastructure
Sharing of researchfindings globally
Storage and computecapabilities for complexresearch
Analysis of complexpatterns in vast data sets
Vast amounts of newdata for research
Education
Video conferencing,sharing of data, content
Communications/Collaboration
Research
In financial services, for example, leading companies are investing in clusters outside their home markets. For example, companies from Japan, China, South Korea, and Singapore are all lead investors in one of Singapore’s most promising startups, with services ranging from ride-sharing to e-payments. One e-commerce and gaming company launched in Singapore with funding from a Chinese multinational conglomerate. In 2017, it became the region’s first tech company to conduct an IPO on the New York Stock Exchange.
ICT plays a critical role in advanced factor development
Not all advanced factor investments are equally effective at promulgating national productivity. In an increasing digitalized world, advanced factor
investments in ICT concentrate an economy's value-add in a self-reinforcing cycle of innovation. Within a few years, we expect that the bulk of global GDP will be driven by digital products and services enabled by ICT. The GCI has been monitoring this innovation process for severalyears now.
As highlighted by the GCI, ICT investments in 5G, broadband, cloud, AI, and IoT are especially important because they have multiplier effects on other basic and advanced factor investments, dramatically increasing the economic value to society. For example, investments in 5G and broadband can revolutionize remote learning (education), IoT with 5G can optimize physical assets (infrastructure), and AI can personalize interactions (education) and help scientists mine vast IoT data sets for insights (research).
ECONOMIC AND TECHNOLOGICAL IMPACT | 36

37 | GLOBAL CONNECTIVITY INDEX 2020 IMPACT ON INDUSTRIES | 38
Impact on IndustriesICT investments digitalize industries and help economies move into higher-order Productivity
GCI tracks the tools that help economies to transform
The polarized choices of laissez-faire and costcutting versus government intervention will no longer work in the post–COVID-19 environment. The great recession has limited government funds to stimulate economies in lockdown. Market forces have always struggled to transform the market gloom associated with recessions. Targeted investments in ICT from government and industries across the world are needed — investments that build up advanced factor endowments and create a virtuous cycle of innovation. These are the same cycles the GCI has been tracking; only now, the stakes are higher than ever.
Investments in ICT need to be contextualized to a particular country's unique set of existing factor endowments. Multipliers need to have something to multiply. In general, economies are made up of a combination of different sectors with one or two tending to dominate. ICT needs to build on a nation's strengths, not its weaknesses. Hence, developing a national ICT response needs to build on economies' historical sectoral strengths.
Most economies focus primarily on one of a number of different economic sectors:
• Energy-and mining-intensive. This includes the extraction and processing of raw materials. Output and exports are tangible, and physical materials are in various stages of processing.
Australia, Saudi Arabia, Brunei, and Brazil are examples of economies that rely heavily on this sector.
• Agriculture-intensive. This involves growing and producing livestock, fish, poultry, and crops. Output and exports are tangible, and physical goods are relatively unprocessed. The Netherlands, China, Australia, and Indonesia rely heavily on this sector.
• Product- and manufacturing-intensive. This involves fabricating, processing, and preparing products from raw materials and commodities into finished goods, either for consumption or integration into more complex products. China, Japan, and Germany are well-known manufacturing-intensive economies.
• Service-intensive. This includes the provision of services or intangible goods such as teaching, nursing, customer services, banking, and consulting. The US, the Netherlands, the UK, Switzerland, and Singapore are representative economies of this model.
• Innovation-intensive. This includes knowledge-oriented activities involving research and innovation such as IT and R&D. Germany, the US, the UK, Singapore, and Japan are examples of innovation-intensive economies.
Generally, most economies are made up of a combination of these sectors, but usually one or two tend to dominate GDP. The examples given in the list above are not exhaustive.
Impact on IndustriesICT investments digitalize industries and help economies move into higher-order Productivity

39 | GLOBAL CONNECTIVITY INDEX 2020
The countries in each sector have different levels of productivity or gross value added (GVA) per person. The list shows different levels of value added per worker or per hour worked for agriculture and manufacturing. Countries
with lower productivity are less competitive when it comes to global trade. Thus, they have to invest in ICT to build advanced factors to transform their economies into a higher order of production.
Sectors that Form Economies
While economies are generally made up of several of the following sectors, 1 or 2 of these sectors tend to dominate.
AustraliaSaudi Arabia
BruneiS.AfricaChileChina
NetherlandsChina
AustraliaIndonesiaThailand
BrazilIndia
ChinaJapan
GermanyIndiaItaly
MexicoPoland
United StatesNetherlands
United KingdomSwitzerlandSingaporePhilippines
India
GermanyUnited States
United KingdomSingapore
JapanS.Korea
Switzerland
Countryexamples
Energy & MiningIntensive
ServiceIntensive
AgricultureIntensive
InnovationIntensive
Product &Manufacturing Intensive
Description Extraction andprocessing of rawmaterials. Output andexports are tangible,physical materials are invarious stages ofprocessing.
Growing and producinglivestock, fish, poultryand crops. Output andexports are tangible,physical goods arerelatively unprocessed.
Provision of services orintangible goods, e.g.,teaching, nursing,customer services,banking, and consulting
Knowledge-orientedactivities involvingresearch and innovatione.g., IT research& development
Fabricating, processing,or the preparation of products from rawmaterials and commodities into finished goods, either for consumption or integration into morecomplex products.
Worker Productivity in Different Economies for Manufacturing and Agriculture
Economies enjoy different levels of productivity within the same sector
Source: Worldbank DatabaseSource: The Conference Board International Labor Comparisons program, January 2020
Manufacturing Agriculture
Value Added per Worker Hour 2018(US$ M)
Value Added per Worker 2018(US$ K)
Japan Germany S.Korea Italy Mexico Poland
454
545
207167
7045
Australia Netherlands Brazil Indonesia Thailand India
93.7
79.5
12.43.6 3 1.7
ICT investments digitalize industries and help economies move into higher-order productivityThere are two major reasons why certain economies have higher value-add than others. First, there are differences between more and less productive sectors. High-tech manufacturing is typically more productive than agriculture, and services are typically more productive than resources. Second, differences exist within each sector. This is driven by the degree of automation and industry transformation in the country.
The higher digitalization of industry will increase value-add. Moving to higher value goods, for example, from homewares to electronics, will result in a larger jump. Transforming agriculture helps improve yield per hectare and also requires fewer people to manage each hectare. Industry transformation is enabled by ICT as tracked by the GCI. It is thus not that surprising that economies with higher GCI scores generally have higher GVA per worker or per hour.
There are five orders of productivity that can drive the competitiveness of industries, help economies accelerate recovery, and build resilience for the new normal.
The Five Orders of Productivity for Building Competitiveness
ICT maturity takes economic sectors through five stages of productivity
Higher value added
Greater investments are needed for higher GCI performance
3G, manual processing,printed orders, email andphone communications
Firs
t ord
er: T
ask
Activities involving laborand heavy equipment.Technologies focus oncommunication andtracking financialrecords. Mechanizationand taskcomputerizationprovide task-levelefficiency.
Seco
nd o
rder
: Fun
ctio
n
Technology useshistorical periodic datacollection aboutactivities, outputs, andtransactions, withperformance andquality driven locally.Automation of severaltasks to achieve acertain functionprovides functionalefficiency.
Third
ord
er: S
yste
m
Digitalization offunctions within coresystems enable systemsto run efficiently.Organizationsmonitor key systemperformance measuresi.e., outputs, flows, andquality levels. Dataand analytics focustracking KPIs onimproving systems andoperations in line withbusiness strategies.
Fift
h or
der:
Ecos
yste
m
Digital ecosystems thatenable automatedcoordination acrossstakeholders highlyresponsive to marketchanges buildecosystem efficiencyand resiliency.Technology use goesbeyond the enterpriseto use the ecosystem’soperational and assetdata, which will driverequirements forconnectivity, collection,storage, and intelligentautonomouscapabilities.Fo
urth
ord
er: O
rgan
izat
ion
Digitalization of systemsacross the entireorganization providesorganizationalefficiency and agility.Organizations trackperformance andexceptions over timeand across differentsites to learn how toimprove aggregateorganizationalperformance and yields.Technology use focuseson boosting levels ofvisibility and automationacross multiple sites.
4G/networks, spreadsheets,order processing and/orproduction systemssystems (MES, invoicing)
4G/networks, ERP/innovation managementsoftware, servers, networks,cloud
4G, on-premise cloud/edge, IoT, AI/ML, platforms,collaborative robots(cobots) and robots
5G, real-time data visibilityfor decision automation andactuation, IoT, intelligentplatforms, ecosystemintegration, lights-outproduction and operations,autonomous robotics
IMPACT ON INDUSTRIES | 40

41 | GLOBAL CONNECTIVITY INDEX 2020
• First order: Task efficiency. This is the basic stage in which most production activities involve manual labor and heavy equipment in small numbers of locations. Any technology used is mainly for the mechanization of a process, and is less about automation or digitalization. Technology helps improve task efficiency, as workers are able to do individual tasks (such as planting a field, fitting a part of a product, or serving a customer) more efficiently with the use of machinery. This is the industry model in many Starter economies. Identifying operational problems and coordinating a response to these issues is done by individuals on the ground, often interacting face-to-face, or as they scale using mobile communications that depend on the availability of 2G and 3G networks. Where sufficient scale exists and network coverage is sufficient, email/SMS may be used to more widely disseminate issues and solutions. This is also true for dealing with more complex but less frequent financial issues that occur at end-of-quarter or year-end closing. Such issues may require the sharing of Word documents or spreadsheet data to be modified and validated by different parties working remotely. Again, bandwidth requirements although not huge, must be adequate to support these interactions. Operational data with large data requirements obtained from multiple locations is rarely a priority.
• Second order. Functional efficiency. Building on first-order activities, processes in this stage are computerized or automated using ICT. Usage spans several tasks and boosts functional efficiency; for example, the automation of an entire production line or online shop with ordering, payment, and customer support functions. However, the automation is standalone and not connected to any enterprise systems. The computerization of local processes allows organizations to collect historical data periodically captured. Such data typically concerns local activities, outputs, and transactions with the goal of improving production yields, operational
performance, and quality control. Industries in this stage use ICT to improve productivity with functions like manufacturing execution systems and invoicing. This requires capabilities such as databases, ETL, BI, and analytics operating on an ongoing basis in multiple locations. It also requires skilled individuals to manage and use these resources. Only larger local organizations in leading Starter and most Adopter economies are in this stage. To support these complex interactions (as well as first-order ones), they need 3G, some 4G, and fixed network coverage for the communication and sharing of static datasets. A few companies may be experimenting with cloud.
• Third order. System efficiency. In this stage, the automation and computerization of functions is quite common for enabling the digitalization of an entire system. Systems are linked together at the local enterprise level, for example, an entire production system covering inbound logistics, production, outbound logistics, warranty, and quality control, or end-to-end customer-handling, from multi-channel interaction to customer records and history. The majority of organizations will monitor key performance measures (i.e., outputs, flows, and quality levels) using digital tools. They have a much more extensive focus on data and analytics for tracking key performance indicators (KPIs) to improve operations and deliver on business strategies, albeit at the local system, plant or office level. Their data requirements are much greater, for example, real-time data on equipment and resources. This dramatically increases the data storage and communications loads. Organizations in this stage may require capabilities like streaming and data lakes. For specialized applications that are internationally competitive, they may be looking at IoT and advanced analytics approaches such as Machine Learning for functions like preventive maintenance or quality control. They also require and have wide 4G coverage, and may be deploying FTTH to enable the higher adoption of cloud. The leading Adopter and some Frontrunner countries are in this stage.
Technologies such as 5G, IoT, and robotics will flourish in this transition and create opportunities for new business models, new ways of doing things, and new products that we have yet to see. Few if any companies have the scale and scope to really reach this fifth order yet, and perhaps only a few of the most advanced economies realize the importance of industry ecosystems. But to take just one example, we are starting to see some exciting systems thinking going on in the development of national 5G initiatives.
We have attempted to describe how the five orders will look for each of the five economic sectors we described earlier. The national examples are where we believe the overall sector is operating at, although there might be a few advanced organizations within a given nation.
• Fourth order. Organizational efficiency and agility. In this stage, many organizations track performance constantly, and track exceptions over time and across different sites/plants or offices to learn how to improve aggregate performance and yields. Technology use is pervasive throughout the enterprise (functions and business areas), with most processes digitalized and integrated with an organization-wide enterprise system across locations and countries. Technology use tends to focus on enabling increased levels of near real-time visibility and automation, not just across multiple sites within a country, but across multiple countries, time zones, regulatory systems, and languages. This enables organizational efficiency as well as the agility to respond to changing market conditions, as systems are integrated across the organization. Fourth-order companies jealously guard and build upon their data and analytical insights, arguing correctly that these ultimately contribute to their competitive advantages in the international markets in which they have to operate. This stage is exemplified in Frontrunner economies by high 4G and FTTH coverage, high cloud adoption, embedded AI solutions, and IoT deployment.
• Fifth order. Ecosystem efficiency and resilience. The future is likely to see digitalization not just within organizations, but across entire ecosystems. Digital ecosystems enable automated coordination across all stakeholders and are highly responsive to market changes. Organizations can quickly pivot their entire ecosystem to develop new products, services, mass customization, and even new business models. As the competitive, economic, political, and ecological landscapes in which they operate become more volatile, this level of responsiveness, flexibility, and resilience will not be a luxury — it will become a necessity for survival as organizations evolve from product-led to service-led. ICT use will go beyond the enterprise, instead using the ecosystem’s operations and asset data to drive requirements for connectivity, collection, storage, and intelligent autonomous capabilities.
IMPACT ON INDUSTRIES | 42

43 | GLOBAL CONNECTIVITY INDEX 2020
Energy and Mining
Energy and Mining
First order:Task
Activities in energy and mining use labor and heavy equipment. Technology use focuses on communications and record-keeping.
Egypt has massive amounts of natural resources and mineral wealth. Examples of mining operations in Egypt vary from artisanal mines that use labor-intensive processes for extraction to mineral processing to larger mines that use equipment for extraction. In both cases, management makes decisions based on experience. Little data is collected, and any data that is collected will not be used to inform decisions, but to tally production and sales. Safety is a lower priority and equipment and assets are manually maintained based on breakdowns. Technology use is largely to maintain production records for financial targets.
Second order:Function
Historical data collection allows miners and operators to perform basic analytics to improve the quantity and quality of output, usually at individual project level. Opportunities exist to increase unit prices based on quality improvements to the raw materials produced, resulting in higher revenue in relation to resources used.
Third order:System
Analytics and the use of KPIs increase process efficiencies of materials extraction to improve quality and yields from sites, resulting in higher revenues. Companies are able to implement programs for maintaining equipment to prevent breakdowns that can costs tens to hundreds of thousands of dollars per hour in lost productivity.
Five Orders of Productivity for Energy and Mining
Energy and Mining
Fourth order:Organization
The emphasis on measurable performance, visibility, and automation extends throughout the organization and improves exchanges with customers and suppliers. Leading organizations are integrating with customers and suppliers to create awareness of opportunities and disruptions that may occur. This will increase the ability to, for example, find an alternate supply for a chemical required for mineral extraction ahead of competitors. This will result in faster time to market for their product, meet contractual obligations, and enable the charging of a premium if supply is constrained. For automation, sites will use autonomous trucks, thereby driving site and asset profitability.
Australia is known for its plentiful natural resources and mineral wealth. It has widely deployed analytics and autonomous solutions in mining. Examples include Rio Tinto’s use of a control center to monitor autonomous mining equipment in Pilbara. The autonomous mining vehicles improve productivity and vehicle utilization as well as reduce the carbon footprint of the organization. Australian miners also operate autonomous blast hole drill rigs. Other examples include the use of real-time data to benchmark performance against best practices and develop predictive analytics models to identify opportunities to improve asset performance, increase productivity, and identify new business models.
Fifth order:Ecosystem
The integration of data from the ecosystem will enable automated engagement between stakeholders, allowing mining companies to anticipate price fluctuations and focus on increasing productivity through automation, or on process and network optimization to save costs. Similarly, if there are constraints or disruptions, ecosystem integration will raise alerts and potentially assist with decision-making that will allow companies to take advantage of early opportunities. One example might be constraints on space on shipping routes due to a disaster. Companies with early knowledge are able to act early to make alternate arrangements instead of holding on to weeks of inventory while waiting for the market to address constraints, thereby becoming more resilient to disruptions.
IMPACT ON INDUSTRIES | 44

45 | GLOBAL CONNECTIVITY INDEX 2020
Agriculture
Agriculture
First order:Task
Agricultural activities use labor and heavy equipment. Technology use is focused on communications and record keeping.
Second order:Function
Historical data collection and the monitoring of stock will allow some basic analysis to improve quantity and quality of outputs, resulting in better land utilization or greater reproduction by livestock. Healthier crops and animals will allow producers to charge more for better quality products and increase field/plot yields.
Indonesia has diverse agricultural practices, from crop farming to small family-run plots, which are still vital income generators.
Indonesia is seeing significant efforts from start-ups and the government in assisting the yields of small farmers. One example includes the development of a mobile phone app that collects weather data and uses a data model to help farmers make better decisions for planting, fertilizing, and harvesting. The farmers are also able to view market information and provide feedback by entering disaster reports in their villages.
Third order:System
Farmers are wanting to track exceptions, aggregate information across multiple farms, improve field/plot yields, and analyze supply and demand to increase market prices and yields. Additionally, farmers are able to implement programs to maintain equipment and prevent breakdowns that cost lost harvests or livestock.
Fourth order:Organization
Visibility and automation allows farmers to focus on productivity and connected asset management. Maintenance is proactive or predictive, decreasing costs and further increasing output. Site-specific application software can reduce the amount of pesticides and fertilizer used, reducing ecological impact and costs. Investments in automation that assist with milking or feeding, for example, can monitor herds and boost animal health, longevity, and productivity. The automation of crop production can help alleviate issues with finding and retaining agricultural workers. Farmers seek alternate crops or farming techniques that allow for greater revenues or yields.
Japan is using data visualization for better yields and increased sustainability.
Examples of benefits to farmers through agrotech in Japan include the use of cloud for data analysis and the use of sensors (IoT) in paddy fields to detect and measure air and soil temperature, humidity, soil moisture, and soil fertility. Combined with the use of cameras for visual comparison over time, the use of data has been aggregated across multiple farms to improve the quantity and quality of rice to meet the needs of Saki brewers Asahi Shuzo.
Five Orders of Productivity for Agriculture
Agriculture
Fifth order:Ecosystem
An ecosystem of interconnected technology will allow farmers to uncover nuances in each field and across farm holdings by collecting and analyzing data, helping to reduce inputs and costs. Farmers can conserve natural resources. Weather, soil, and other indicator-sharing and analysis platforms allow for data-sharing regionally or enable comparisons with similar ecosystems. Connectivity to market partners, including food producers, will provide operational decision support, allowing for scenario analysis. Connected workers with wearables will give farmers access to data across vast distances and multiple sites, allowing them to react quickly to natural disasters, thus reducing negative impacts and the loss of crops, yields, and livestock.
IMPACT ON INDUSTRIES | 46

47 | GLOBAL CONNECTIVITY INDEX 2020
Product and Manufacturing
Product and Manufacturing
First order:Task
Activities in product and manufacturing are manually performed and paper-based. Technology use is focused on communications and record keeping.
Pakistan is known for high-quality garment production but is reliant on manual processes.
The garment industry is the second largest sector in Pakistan and companies rely on labor-driven processes fulfilled by factory workers, contract laborers, and homeworkers, who are usually paid on a per-piece basis. Because of electricity supply issues, machines are manually operated to increase productivity. Order management and cost sheets are usually handled manually or with limited computer support (e.g., using a spreadsheet to create invoices).
Second order:Function
Data is gathered to manage inventories and identify problems and basic quality issues at the product or line level. Improvements in quality and better consistency across batches means that manufacturers can secure better and more lucrative contracts. There are fewer errors with invoicing, which results in manufacturers being paid faster and with fewer disputes.
Third order:System
Analytics and the use of KPIs allow for increases in quality and output, as well as improved consistency in production. Manufacturers are able to monitor production equipment and implement programs for maintenance and repairs, allowing for the scheduling of downtime and fewer breakdowns, which can cost tens to hundreds of thousands of dollars per hour in lost productivity.
Five Orders of Productivity for Product and Manufacturing
Product and Manufacturing
Fourth order:Organization
The emphasis on measurable performance, visibility, and automation extends to suppliers and customers. Disruptions to supply or demand shocks will result in early alerts to more advanced organizations. This will allow them to find alternate supply sources or schedule resources to accommodate surges or constraints. Automation in the manufacturing industry results in reduced lead times, allowing producers to win contracts against those that are unable to produce as quickly. Robotics can allow greater loads or speeds than may be humanly possible, which means manufacturers can increase throughput. Asset issues on the shop floor can be addressed before they become critical and within minutes, instead of when equipment fails. Production loads can be switched to alternative lines or sites to ensure throughput is only minimally affected, and maintenance can be performed at the initial stage instead of waiting for a catastrophic breakdown.
Germany is the creator of the Industry 4.0 concept and possesses sophisticated manufacturing capabilities.
There are plenty of examples of manufacturing automation and predictive capabilities in the automotive and aerospace industries in Germany. For instance, BMW is using machine learning/AI in its smart manufacturing facility to assist in the quality inspection process. BMW has multiple models being produced on the same production lines, outputting 9,000 vehicles per day and supporting up to 1 billion feature combinations (for the BMW 3 series). Platform-driven smart analytics capabilities support innovative automation and assistance systems, visual inspection for quality, process control, and asset maintenance for detecting anomalies.
Fifth order:Ecosystem
Manufacturers will be deeply integrated with their supply chains and able to automatically adapt to changing ecosystem opportunities in real-time. Constraints in component or raw materials supply or disruptions to shipping routes can be addressed through the use of marketplaces or pre-negotiated contracts. Decision automation through a connected ecosystem will allow for the redirection of shipments or placing orders with alternate suppliers. In the case of demand spikes, production capacity can be scaled up through marketplace arrangements where additional factory capacity is purchased and brought online. Under-utilized factories are able to develop alternate revenue streams by making their capacity available to other producers. Products will incorporate embedded information capabilities that will extend product offerings through services, creating new business models. Examples include connected products that can predict component failures and location-enabled chipsets to track lost electronics.
IMPACT ON INDUSTRIES | 48

49 | GLOBAL CONNECTIVITY INDEX 2020
Services
Services
First order:Task
The services sector uses labor-intensive service provision with manual processing. Technology use is focused on communications and record keeping.
The Philippines is known for providing support services to organizations, especially English language support.
In instances in which large amounts of document processing or call center assistance are required, companies, such as Magellan Solutions, assist with outsourced labor that can perform form processing, virtual assistants, call center staffing, and content creation/moderation. Systems manage human resources, work-scheduling, time, attendance, and invoicing. However, most of the processing work is labor-intensive.
Second order:Function
Services are delivered according to documented processes. This results in a more consistent service offering, which increases customer satisfaction. Returning customer business then decreases the cost of attracting new ones and results in referrals. This allows organizations to start to scale the improvement process to ensure service consistency.
Oman's services sector has increased its contribution to national GDP from 29.4% in 1980 to 52.6% in 2019, driven in part by its logistics (maritime transport) and financial services sectors. The ongoing progress towards the 2030 Digital Oman Strategy (eOman) has helped build the broadband and cloud infrastructure that accelerated the digital transformation of the financial, government, and transportation sectors.
This enabled the financial services sector to develop fintech products and services for driving growth. The government and the nation's airports and ports have accelerated the digitalization of most of their services. Oman now has one of the fastest import and export compliance times of all Gulf States, making it one of the most efficient logistics hubs in the region. Data capture is facilitated by barcode scanners, which increases information accuracy. Cloud-based freight systems assist with the provision of consistent fast service experiences for customers, including the ability for customers to log on to the customer portal for self-service enquiries.
Five Orders of Productivity for Services
Services
Third order:System
Analytics and the use of KPIs allows for better tracking of customer service metrics. Customer service continues to improve and become a point of differentiation. Increased service standards result in higher employee morale and allow businesses to attract a better quality of employee. Pride develops in the company. The levels of service offered are higher and employees go the extra mile for customers. This results in further increases in sales, customer retention, and lower recruitment costs.
Fourth order:Organization
Service automation streamlines processes, saving time and money. The automation of routine tasks such as work order management or bookings can reduce errors and free up staff to better focus on customer requirements. Increased productivity in this area will save costs. Reduced errors during service encounters creates a more seamless customer experience, resulting in increased customer satisfaction. Field services, for example, benefit from automation through the better coordination of jobs, reducing travel time and costs, and ensuring representatives have information when they need it in the field rather than having to contact the office. Resource optimization allows for better customer service and increased profitability. Automated processing and alerts open up additional methods of engagement with customers, allowing them to use preferred contact methods with the organization.
Fifth order:Ecosystem
Integration of service networks enables service capabilities to be extended beyond the capabilities of the company. Examples in the B2C space include the ability to use a single airline app to book ride-sharing transport for the ongoing journey once the passenger leaves the airport. The same app can be used for ordering from a food service or arranging a meal to be delivered shortly after arrival home. Alternative revenue streams are activated through commissions, or cross payments occur to the airline for generating demand for the ridesharing and food delivery services. Companies will integrate with more partners to extend service capabilities and ensure stickiness within their network. This results in additional sources of revenue and the extension of business models.
IMPACT ON INDUSTRIES | 50

51 | GLOBAL CONNECTIVITY INDEX 2020
Research
Research
First order:Task
Research activities are conducted with manual record keeping. Spreadsheets may be used for the tabulation of data and presentation of findings.
Second order:Function
Data collection is more sophisticated, with the digitization of data reducing errors and speeding up the processing of results. Outcomes will be more accurate and digital data collection will allow for additional parameter collection. In the case of commercial innovation, this will increase the opportunity to include customer/market input, thereby improving commercial outcomes from innovation efforts.
Third order:System
The addition of analytics to the innovation process allows for faster result processing and greater incremental steps. Larger pools of data can be accessed and processed, which supports operations efficiencies in the research process, in addition to developing innovations that lead to greater strategic outcomes and comparative/competitive advantages for economies and companies.
Germany is known for innovation and engineering.
The Bremen Center for Computational Materials Science has industrialized the inventive process of materials using data. Researchers take millions of material compounds and place them through numerous tests. The results are captured as data. As the material progresses through each testing phase, the results are categorized and recorded, resulting in large datasets composed of structured and unstructured data. This data is then searched and compared, and used as the basis for documents, which speeds up and scales the development of new materials.
Fourth order:Organization
Access to cloud and automation is improving the pace and scale of innovation dramatically. IoT (sensors) and telematic data used as data sources increase the precision and volume of data that can be used in the research process. Automating analysis and applying generative AI capabilities to model development allows for the dynamic refinement of research parameters. The generative model development provides business opportunities for organizations in everything from quality checking on production lines to analyzing weather patterns for farmers. It also supports the development of new business models.
Fifth order:Ecosystem
Collaboration across ecosystems — national and international — impels innovation and development networks that combine emerging technologies with the innovation process to develop new pathways for IT, new product development, materials science, science, and more. Generative design by digital twins driven by AI/ML not only self-simulates and self-innovates the physical product, but extends to process and ecosystem digital twins that model commercial outcomes of product-as-a-service offerings.
Five Orders of Productivity for Research Recommendations
53 | GLOBAL CONNECTIVITY INDEX 2020
Recommendations
First order:Task
Focus on basic infrastructure that incorporates 3G and use it to support national public health, basic education, transportation, and logistics. Use simple, resilient technologies to gather and maintain operational data about critical processes around key industries such as agriculture, mining, and transport. Build shared platforms to share information on what works locally. Start identifying opportunities for using data to evaluate key metrics and KPIs that can assist with yield, productivity, and quality, and explore how cloud over mobile can be used to share data and build knowledge.
Second order:Function
Prioritize factor investments in higher education and increasingly in operational skills. Collect data on robust operational processes critical to the economy, outputs, inputs, transactions, and quality. Look to use simple database technologies and analytics on the cloud or locally to identify opportunities for continuous improvements in essential use cases. Build a culture that is supportive of data and analytics to support evidence-based decision-making. Build national databases of best practices and standards. Enforce quality standards with good governance practices. Identify opportunities for connectivity that enable nationwide collaboration to facilitate data-driven operational improvements. Look for opportunities for using IoT to increase speed and accuracy.
Third order:System
Emphasize analytics and process skills to help deliver opportunities for decision support, automation, and visibility. Start the development of automation, advanced analytics, and AI centers in the government and larger enterprises. Encourage analytics use on cloud platforms, borrow from international best practices on analytics, AI, and physical and digital automation use cases in selected industries. Encourage the implementation of hardware and software robots, IoT and 4G, and ecosystem integration. Begin the move to 5G technologies.
Fourth order:Organization
Encourage research capabilities in universities, enterprises, and governments and deepen public–private research partnerships to accelerate innovation. Start implementing AI at scale to solve specific critical use cases in industries. Use analytics to predict and improve through automation rather than monitor and check for exceptions. Publicize the results and successes. Move to 5G to increase data flows across digital ecosystems to support new analytics and AI development that allow for visibility, coordination, integration, and control beyond the enterprise. Establish a country-level brand in the marketplace for fourth-order services.
Fifth order:Ecosystem
Integrate the government and industries with transparent data governance and identify international champions to work with national leaders in carefully designed ecosystems relevant to national capabilities. Determine critical information flows from devices to consumers, with all parties in the ecosystem able to view and contribute appropriate information to extract and provide value. Technologies, such as AI, 5G, and robotics, can enable value creation through these information pipelines, accelerating innovation, productivity, and transparency.
Recommendations for Each of the Five Orders of Productivity
Appendix

55 | GLOBAL CONNECTIVITY INDEX 2020 APPENDIX | 56
POTENTIALEXPERIENCESUPPLY DEMAND
FOUNDATION
INTERNET OFTHINGS
CLOUD
BROADBAND
ICT Investment
Telecom Investment
ICT Laws
International Internet Bandwidth
Security SoftwareInvestment
Measures current levels of supply for ICT products and services used for digitaltransformation.
IoT Investment
Cloud Investment
Fiber Optic
4G&5G Connections
App Downloads
Smartphone Penetration
e-commerce Transactions
Computer Households
Secure Internet Servers
IoT Installed Base
Cloud Migration
Fixed Broadband Subscriptions
Mobile Broadband Subscriptions
E-Government Services
Telecom Customer Services
Internet Participation
Broadband DownloadSpeed
Cybersecurity Awareness
IoT Analytics
Cloud Experience
Fixed Broadband Affordability
Mobile Broadband Affordability
R&D Expenditure
ICT Patents
IT Workforce
Software Developers
ICT Influencing New Business Models
Gauges demand forconnectivity in the contextof users and activities relating to digital transformation initiatives.
Comprises variables for analyzing the experience of connectivity for end users and organizations in today’s digital economy.
Comprises a forwardlooking set of indicators that point towards the future development of the digital economy.
IoT Potential
ARTIFICIALINTELLIGENCE
AI Investment AI Demand Data Creation AI Potential
Cloud Potential
Broadband Potential
Mobile Potential
Four Pillars
Four
Tec
hnol
ogy
Enab
lers
The GCI analyzes the full spectrum of measurements for intelligent connectivity and provides a detailed map of the global digital economy.
The index benchmarks 79 countries according to their performance in 40 indicators that track the impact of ICT on a nation’s economy, digital competitiveness, and future growth. Combined, these countries account for 95 percent of global GDP.
Research FrameworkThe GCI analyzes digital transformation from basic levels of connectivity to supplementary, advanced technologies. The GCI has adapted its methodology over time to capture how technology evolves and to better evaluate the correlation of ICT investment with GDP growth. In 2019, the GCI’s methodology was expanded to highlight Intelligent Connectivity’s role in boosting the digital economy. We consolidated Intelligent Connectivity’s four
enabling technologies into four: Broadband, Cloud, Internet of Things, and Artificial Intelligence. Two notable changes we made were to merge the Data Centers perimeter into Cloud and incorporate Big Data into a newly created AI perimeter. Please refer to the diagram below for details.
These advanced technologies are built on a foundation layer of technologies such as telecom infrastructure, e-commerce, and the overall adoption of computers, smartphones, and the Internet - all of which have been key determiners of the growth and development of digital economies over the past two decades. The GCI also includes forward-looking factors such as ICT patents, R&D and the outlook for each technology’s compound annual growth rate.
The research framework thus covers a complete combination of advanced and fundamental technologies, enabling us to analyze how yesterday, today, and tomorrow intersect.
GCI Methodology 2020 The Four Pillars: SDEPThe four pillars encompass the entire chain of ICT development and digital transformation to provide a 360-degree view of the digital economy. Each pillar has a set of 10 data indicators.
The Four Technology EnablersThe index allows the horizontal analysis of four technology enablers that are crucial signposts to help benchmark the relative strengths, weaknesses, opportunities, and challenges facing digital economies: Broadband, Cloud, IoT, and AI
Each horizontal layer includes at least one variable from each of the four pillars: supply, demand, experience and potential.
Thus, the GCI can be analyzed both vertically (supply, demand, experience, potential) and horizontally (Broadband, Cloud, IoT, and AI).
This allows an extremely detailed analysis on the relative strengths and weaknesses of individual countries to pinpoint the areas in which additional investment is needed to advance connectivity and economic benefits.
Additionally, this structure enables the detailed analysis of correlations between advanced connectivity services like IoT and the key areas of supply, demand, experience, and potential. This reveals the most successful roadmaps for growth and development, and possible areas where leapfrog technology adoption has proved more successful than others.
The GCI is a rich and deep dataset that serves as a blueprint for individuals and organizations to analyze a wide range of factors relating to digital transformation, ICT development, and the economic benefits of connectivity. The overall index rankings provide a snapshot of the current state of connectivity across the global digital economy, forming a leading indicator for the next decade of ICT expansion and evolution.
The ICT FundamentalsThe four technology enablers need to function on a platform of robust core measurements of ICT fundamentals for a nation to transform into a digital economy and build upon these fundamentals in a self-reinforcing loop.
Examples of these fundamentals and their functions are as follows:
ICT laws are essential for Supply: They set down regulatory boundaries that govern privacy, confidentiality, and safe and legal use. The digital IP, digital assets, identities, and privacy of businesses and consumers must be protected against abuse and misuse, ICT laws make it feasible for the public and private sectors to invest in supplying ICT products and services to the mass market safely and under regulations.
Applications drive demand. Delivered on broadband networks, stored in data centers, and distributed via cloud services for mass consumption, they enable technology to produce outcomes. Applications feed data to analytics solutions for processing into information that can effect changes through IoT devices.
Customer experience is driven by quality of service (QoS). It ensures that ICT services meet the expectations and requirements of businesses and consumers in a way that encourages greater use and investment. For example, a country could have strong investment in cloud solutions but poor network performance or reliability, which will hinder the ability of end users to derive economic benefits.
Patents lead to potential. They form the basis that stimulate the innovation of new products and services. High demand coupled with a good experience builds strong future potential to accelerate digital transformation and make economic gains. The four technology enablers require patents for innovation.
A strong IT workforce ensures that a skilled and technology- literate population is available to drive future digital transformation through innovation based on real-world use. A shortage of skilled workers can be a significant inhibitor to a country’s potential transformation. Equally an educated workforce is needed to make the most of digital technology.
Other fundamental layer measurements include telecom infrastructure investment, Internet bandwidth, e-Commerce, smartphone and computer penetration, e-government, Internet participation, average download speed, R&D expenditure, and number of software developers.
Measurement and normalizationThe variables are measured against factors such as GDP PPP, number of households, and total population.
These factors assess the full picture of connectivity for each country, including measurements like app downloads per person or fiber optic penetration against total households.
In emerging economies, connectivity levels in major metropolitan areas tend to be much higher than their national scores, because these nations are still in the early stages of ICT adoption. This provides an important metric for understanding the potential of the increased economic benefits that these emerging economies will probably see over the next decade and beyond, as they close the digital divide through rapid investment and adoption programs.
In all cases, the data inputs are first measured against a normalizing variable like population size, so the index can benchmark countries according to relative levels of connectivity rather than absolute market size, which would be more reflective of economy size.

57 | GLOBAL CONNECTIVITY INDEX 2020 APPENDIX | 58
Where the average values are significantly lower than the median, the formula is adjusted to include meaningful differentiation at the lower end of the scale and avoid excessive clustering of countries with equal (low) GCI scores.
For example, for Fiber Optics, we use a formula that differentiates between a value of 1% to 5% of the Target (GCI Score=1) and a value of 6% to 10% of the Target (GCI Score=2). This reflects the fact that average Fiber Optics penetration rates are much lower than the median value.
These indicator scores are then aggregated to form a total score for each of the four GCI pillars: Supply, Demand, Experience and Potential. These run from a scale of 10 to 100 (where 10 is the lowest possible total score, equivalent to a score of 1 for each of the 10 indicators within a segment).
The final index score is then calculated by aggregating the four segments:
GCI Total = (Supply + Demand + Experience + Potential) / 4 See “GCI Definitions” for a full list of data category definitions and sources.
Additional NotesFor variables weighted against GDP, we use the GDP at Purchasing Power Parity (PPP) calculation. This is generally the best way to calculate in-country purchasing power after it has been adjusted for the cost of living. This measures the relative wealth of a nation in terms of its ability to purchase goods and services within the national economy.
The data is always the most recent that is available, depending on the source. Data sources include: OECD, ITU, GSMA, WEF, World Bank, United Nations, Ookla, IDC, and Huawei. We’ve estimated the data for missing values based on geographical cohorts. Numbers in the charts might appear different from direct calculation due to rounding adjustments. Historical data shown in GCI 2020 may be different from data used in GCI reports of previous years, as it has been updated with the most recent actual data to improve accuracy.
Scoring and AggregationFor each variable, a country receives a rating of 1 (low) to 10 (high), depending on the data input.
Each indicator has a scale based on a realistic target value for 2025, and beyond with a score of “10” indicating that the target value has been reached.
These target values are extrapolated from market penetration projections based on the highest ranked countries, historical market performance, and expert opinions. Each country’s score is then determined by its normalized raw data value in relation to this scale. In most baseline cases, a value that is less than 10% of the target value will be allocated a score of 1. A value of between 10% and 20% of the target value is allocated a score of 2, and so on. This is shown in the table:
1-10 %
11-20 %
21-30 %
31-40 %
41-50 %
51-60 %
61-70 %
71-80 %
81-90%
91-100%
1
2
3
4
5
6
7
8
9
10
VALUE(% of target value)
GCI SCORE
SupplyInternational Internet BandwidthInternational Internet bandwidth refers to the total used capacity of international Internet bandwidth, in megabits per second (Mbit/s). Used international Internet bandwidth refers to the average traffic load of international fibre-optic cables and radio links for carrying Internet traffic. The average is calculated over the 12-month period of the reference year and takes into consideration the traffic of all international Internet links. International Internet bandwidth (bit/s) per Internet user is then calculated by converting to bits per second and dividing by the total number of Internet users, and this is used to calculate the index scores.Calculation: per internet user
Telecom InvestmentTelecom Service Provider investment in modern network infrastructure over an aggregated five-year period. This focuses on key carrier network technologies which are integral to the delivery of cloud, mobile and high-speed data services including service provider routers, service provider switches and wireless infrastructure (including 3G, 4G and 5G). Aggregate spending over the most recent five-year period is used, in order to provide a more holistic measurement of Telco infrastructure deployments in the context of carrier investment cycles and economic wild cards. Calculation: % of GDP
ICT LawsA survey on how developed a nation’s ICT laws are (e.g. electronic commerce, digital signatures and consumer protection).Calculation: n/a
IoT InvestmentInvestment on IoT solutions and deployment including systems, sensors, modules, infrastructure, networks, specialized devices, security, software, connectivity services, IT and installation services, content services, OT (operational technology) and ongoing services (including consumer services). Weighed against the size of the population (IoT per capita).Calculation: per capita
ICT InvestmentThe overall size of the traditional ICT market in each country, as defined by the total amount of end-user spending on IT hardware (servers, storage, PCs, devices, peripherals, network equipment), software, IT services and telecom services. The total market size is measured against the overall size of the economy (GDP), which provides a
measurement of market supply maturity.Calculation: % of GDP
4G & 5G ConnectionsA weighted score of the percentage of mobile device connections which use a 5G connection (accounting for 20% of the score) and the percentage of mobile device connections which use a 4G connection but do not use a 5G connection (accounting for 80% of the score). This measurement is not based on geographic land mass, so is a more accurate measurement of the actual supply of 4G and 5G services to individuals and organizations. Users who haven’t subscribed to 4G services but who use a 4G phone aren’t counted; users who haven’t subscribed to 5G services but use a 5G phone are counted in 4G if they have a 4G connection and are otherwise not counted. Calculation: 80% of 4G connections, 20% of 5G connections
Fiber OpticThe number of Fiber to the Home (FTTH) subscriptions, measured against the total number of households in each nation. “Fiber to the Home” is defined as a communications architecture in which the final connection to the subscriber’s property is Optical Fiber. The fiber optic communications path is terminated on or in the premise for the purpose of carrying communications to the subscriber.Calculation: % of total households
Security Software InvestmentInvestment in software related to the security of ICT resources and data. These security products may be deployed in data centers, on networks and on devices. Spending by all end-user segments is included (private and public sector). The data is weighted by the total size of population. Calculation: per capita
AI InvestmentThe sum of investments for the deployment of artificial intelligence (AI) solutions by private and public institutions. This includes AI-related investments in hardware systems, software platforms and professional services. Calculation: % of GDP
Cloud InvestmentOverall investment in public cloud infrastructure services (Infrastructure as a Service), leveraged for the supply of server (compute) and storage infrastructure resources in a public cloud environment. This provides a direct measurement of the supply of services from public cloud infrastructure deployments to end-users. It is weighted against GDP. Calculation: % of GDP
GCI Definitions

59 | GLOBAL CONNECTIVITY INDEX 2020 APPENDIX | 60
DemandFixed Broadband SubscriptionsTotal number of subscriptions that access the internet through a wireline (including satellite) broadband internet connections. Calculation: per capita
Mobile Broadband SubscriptionsTotal number of mobile broadband services subscribers measured in relation to the overall size of the population.Calculation: per capita
Smartphone PenetrationSmartphone penetration expressed as a percentage of total connections (excluding M2M). A smartphone is defined as a mobile handset with advanced access to internet-based services and computing functions.Calculation: % of total connections
App DownloadsThe total number of new mobile application downloads in the calendar year on all major mobile platforms (including all Android and iOS). This is measured against the overall size of the population, and refers to new app downloads, not the existing installed base. Calculation: per capita
E-commerce TransactionsE-commerce involves orders placed on the internet (i.e., the buyer clicks an order button on the internet) in a commitment for paid goods or services. Total e-commerce measures the volume of all e-commerce transactions, both B2B and B2C (including volume purchases). Calculation: per capita
Cloud MigrationAn index based on the percentage of traditional software budgets which have migrated from traditional on-premise licensing to ‘as a service’ cloud deployments, in order to measure demand for advanced Public Cloud Services in relation to overall ICT investment. Calculation: % of total annual software investment
AI DemandThe percent of third-party software spending and investment that is on artificial intelligence software in a country. Calculation: % of total annual software investment
IoT Installed BaseTotal installed base of IoT devices and systems (including Intelligent Systems). Calculation: per capita
Secure Internet ServersSecure Internet Servers (per 1 million people) refers to the number of distinct, publicly-trusted TLS/SSL certificates according to the Netcraft Secure Server Survey. Calculation: per capita
Computer HouseholdsThe number of households with access to a computer – a fixed desktop computer, laptop, or tablet (or similar handheld computer). Excludes smartphones.Calculation: % of total households
ExperienceFixed Broadband AffordabilityThe price of a monthly subscription to an entry-level fixed broadband plan of a minimum of 5 GB. For plans that limit the monthly amount of data transferred by including data volume caps below 5 GB, the cost for the additional bytes is added to the basket. The minimum speed of a broadband connection is 256 kbit/s. The calculation is a percentage of a nation’s average monthly GNI per capita. Calculation: per GNI
Mobile Broadband AffordabilityThe price of a monthly subscription to prepaid and postpaid data services across a variety of service plans and device types. Up to 2017, prices are for 1 GB of data for a USB/dongle, computer-based subscription. 2018 onwards it is mapped to the 1.5 GB subscription, irrespective of the device used. This is calculated as a percentage of a nation’s average monthly GNI per capita. Calculation: per GNI
Broadband Download SpeedAverage download speed for each country. These metrics leverage billions of Internet and mobile network tests to provide a current view and analysis of global Internet access speeds.Calculation: n/a
Cybersecurity AwarenessThe Global Cybersecurity Index is a trusted reference that measures the commitment of countries to cybersecurity at a global level. As cybersecurity has a broad field of application, cutting across many industries and various sectors, each country’s level of development or engagement is assessed along five categories: Legal Measures, Technical Measures, Organizational Measures, Capacity Building and Cooperation; and then aggregated into an overall score. Scores are derived from an online survey, which also allowed for the collection of supporting evidence. Through consultation with experts, these survey responses were then weighted in order to arrive at the final index scores. Calculation: n/a
Telecom Customer ServiceCurrent service levels provided by telecom operators based on previous research and surveys conducted within each nation. Calculation: n/a
Internet ParticipationThe total number of individuals accessing the internet at least once during the 12-month period, via wireline and/or mobile internet access. Calculation: per capita
E-Government ServiceThese scores are sourced directly from the United Nations E-Government Survey, which benchmarks countries according to ratings derived from a survey to assess the e-government development status of all UN member states. Calculation: n/a
IoT AnalyticsTotal investment on analytics software relating to IoT data analysis. These software tools that extract value from the mass of data being created via IoT to improve the experience of a nation or organization with an IoT platform that transforms IoT data into actionable information. Calculation: per capita
Data CreationBased on the estimated availability of target-rich, actionable data (TB) which can be leveraged by Artificial Intelligence (AI) platform and analytics tools in order to enhance the experience and ROI of organizations investing in the deployment of AI solutions. To improve the experience of this technology, the scalability of created data needs to be considered. Calculation: TB per capita
Cloud ExperienceThe percent of total IT investment within a country that is by cloud service providers. Calculation: % of IT investment
PotentialICT PatentsThe total number of patents filed under the PCT within the ICT technology domain in the inventor’s country of
residence, as measured and tracked by the OECD (stats.oecd.org). Calculation: per capita
IT WorkforceTotal employment in the supply and management of IT for each nation. This includes workers employed directly in the IT industry (hardware manufacturers, software vendors, service providers and channel organizations), and IT staff employed by end-users in IT departments for the management, deployment, support, and strategic implementation of technology solutions. Calculation: per capita
R&D ExpenditureExpenditure on R&D means current public and private capital expenditure on creative work to increase knowledge, including knowledge of humanity, culture, and society, and the use of knowledge for new applications. R&D covers basic research, applied research, and experimental development. Calculation: % of GDP
Software DevelopersThe total number of software developers in each nation. Professional software developers are engaged in employment where the primary activity is constructing software or supervising its construction. Calculation: per capita
ICT Market PotentialAn index derived from local nation survey data on the potential for market development and the economic benefits to be derived from adoption of adopting Cloud, AI, IoT and Broadband solutions. In order to assess future potential for development, the five-year forecasted CAGR (compound annual growth rate) is used for the time period through 2025. This CAGR accounts for current market assumptions relating to technological development, penetration rates, macroeconomic growth and the ability of customers in each country to invest in these ICT markets. Calculation: n/a
ICT Influencing New Business Models Based on a survey conducted by the World Economic Forum, in which respondents were asked to evaluate the extent to which ICTs enable new business models.Calculation: n/a

61 | GLOBAL CONNECTIVITY INDEX 2020
Powering IntelligentConnectivity with
Global Collaboration
Shaping the New Normal with Intelligent
Connectivity
Harnessing thePower of
Connectivity
Tap Into New Growthwith Intelligent
Connectivity
New EconomicBarometer
BenchmarkingThe Digital
Economy Journey
Connect Whereit Counts
APPENDIX | 62
The Evolution of the GCI: Benchmarking the Digital Economy Journey
CONNECTIVITY INTELLIGENT CONNECTIVITY
2014 2015 2016 2017 2018 2019 2020
Broadband investment is a key requirement identified by industries to build a digital
economy
Realizing economic transformation with five enabling technologies
Countries need to move up the technology stack to drive
further GDP gains
ICT infrastructure investment initiates a chain reaction to digital transformation, with cloud as a potent catalyst
AI readiness isintegral to
success in thedigital economy
Cloud and IoT investment set the stage for AI and
5G to takeoff; and 5G will contextualize data in real-time
ICT technologies accelerate the development of advanced factors for increasing economic competitiveness and recovery
TechnologyImpact
A one point increase in GCI correlates with a 1.4% -1.9%
increase in GDP
A 20% growth in ICTinvestment will increase a
country’s GDP by 1%
A one point increase in GCI correlates with a 2.1% increase
in national competitiveness, 2.2% increase in innovation,
and 2.3% in productivity
The digital divide becomes a digital chasm: the rich get
richer and the poor get poorer
AI is turning Intelligent Connectivity into a gateway for a new cycle of economic
growth
Intelligent Connectivitycreates value through
collaborative ecosystems
Starters are accelerating digitalization; Maintaining IT investments is the consensus
among Frontrunners
EconomicImpact
TECH4ALL: Intelligent Connectivity can be the answer to many of society’s complicated and deeply rooted challenges.
TECH4ALL:Intelligent Connectivity helpsthe response to COVID-19
Social Impact
ICT maturity takes industry digital transformation through five stages
of productivity: task efficiency, functional efficiency, system
efficiency, organizational efficiency and agility, and ecosystem efficiency and resilience.
Industry Impact

63 | GLOBAL CONNECTIVITY INDEX 2020
i IDC Covid-19 Survey of global organizations May-July 2020ii https://www.efginternational.com/coronavirus/21-May-2020.htmliii https://www.dicomstandard.org/iv https://govinsider.asia/innovation/COVID-coronavirus-singapore-ihis-kronikare-temperature-ai/v https://thenextweb.com/neural/2020/03/21/why-ai-might-be-the-most-effective-weapon-we-have-to-fight-COVID-19/vi https://blogs.microsoft.com/blog/2020/03/20/delivering-information-and-eliminating-bottlenecks-with-cdcs-COVID-19-assessment-bot/vii https://www.straitstimes.com/tech/tapping-ai-to-battle-COVID-19viii https://singularityhub.com/2020/03/17/how-deepminds-ai-is-working-to-decode-coronavirus/ix https://www.bbc.com/news/technology-51717164 https://www.geekwire.com/2020/ai-vs-coronavirus-artificial-intelligence-now-helping-fight-COVID-19/x https://www.idc.com/getdoc.jsp?containerId=AP46648020andpageType=PRINTFRIENDLYxi https://hbr.org/1990/03/the-competitive-advantage-of-nations