Embed Size (px)
Citation preview

Shareholder LetterQ1 2021
Quarterly Key Performance Indicators:
Financial Highlights
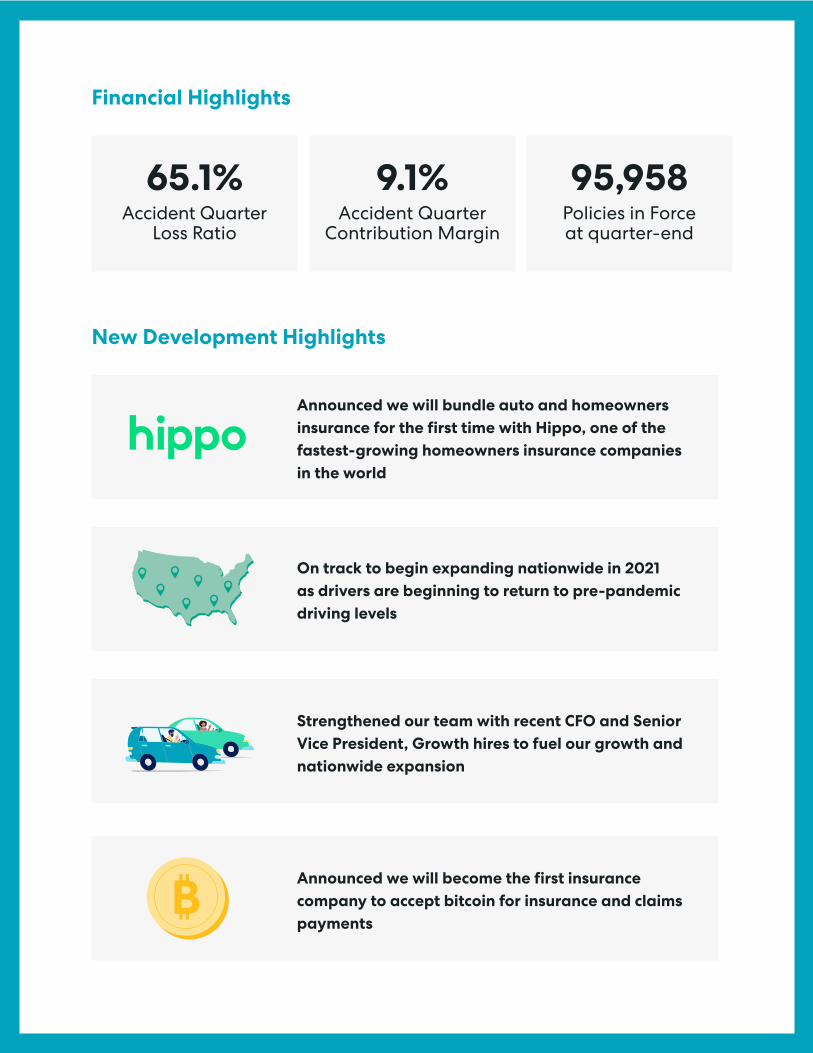
65.1% Accident Quarter
Loss Ratio
9.1% Accident Quarter
Contribution Margin
95,958 Policies in Force at quarter-end
New Development Highlights
Announced we will bundle auto and homeowners insurance for the first time with Hippo, one of the fastest-growing homeowners insurance companies in the world
On track to begin expanding nationwide in 2021 as drivers are beginning to return to pre-pandemic driving levels
Announced we will become the first insurance company to accept bitcoin for insurance and claims payments
Strengthened our team with recent CFO and Senior Vice President, Growth hires to fuel our growth and nationwide expansion
Dear Shareholders, We hope all of you are well and appreciate your continued support of Metromile. We had a solid start to 2021 as we continue to ramp our marketing spend and build our infrastructure in anticipation of our nationwide expansion that we expect to begin in the back half of the year. Among our key first quarter 2021 highlights:
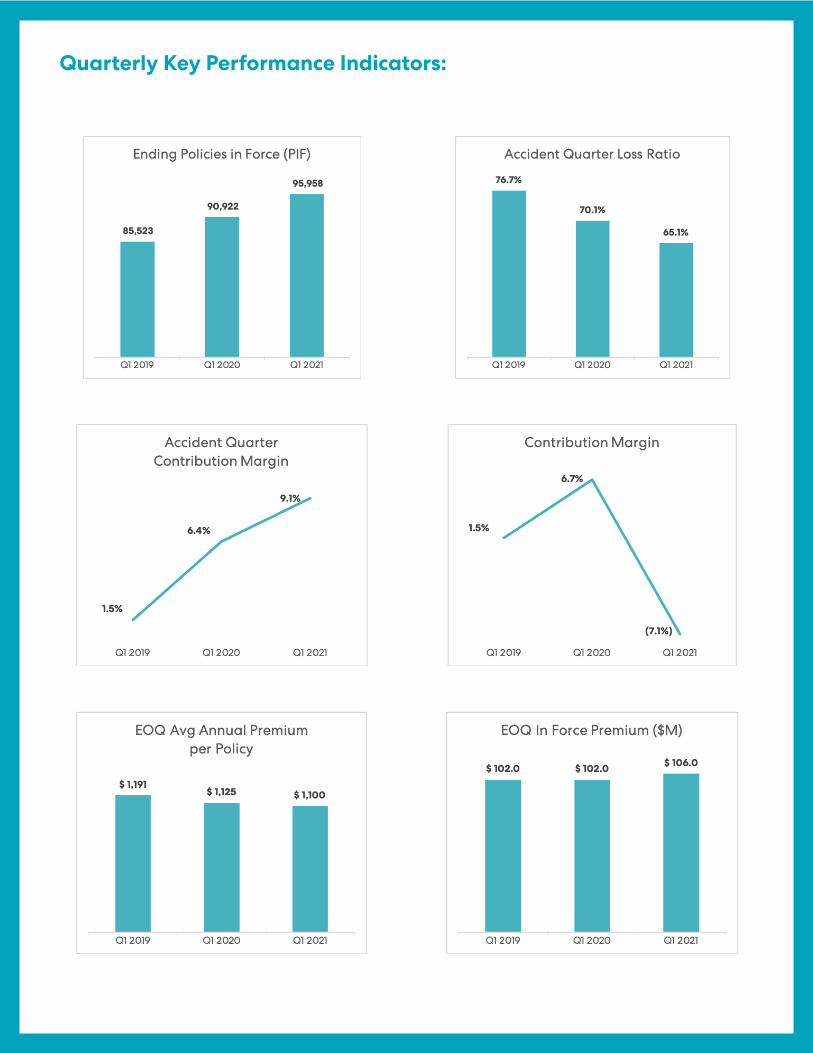
• We ended the quarter with Policies in Force of 95,958 — at the top end of our prior outlook.
• Accident Quarter Loss Ratio of 65.1% was solidly within our expectations for the quarter.
• Accident Quarter Contribution Profit of $2.4 million was an improvement year-over-year and led to Accident Quarter Contribution Margin of 9.1% — again, solid-ly meeting our expected outlook for the quarter.
We are pleased with our first-quarter performance and believe we remain on track to deliver our full-year 2021 outlook in all areas.
In our last letter, published less than seven weeks ago, we set out three key goals for 2021:
• Protect and enhance our unit economic advantage through our differentiated levers in technology, modeling, and cost efficiencies.
• Rapidly scale the business in existing states through known and new channels, and begin bundling homeowners insurance and other products, enabling growth in our Policies in Force. We believe these efforts will open opportunities to reach customers who have broader insurance needs and strengthen retention among existing customers by creating stickier relationships.
• Begin expanding nationwide in the second half of 2021 to reach a total address-able market greater than 50% of potential customers, which we expect will en-able substantial growth in 2022 and 2023.

We believe we are making strong progress toward these goals, particularly in recent weeks. We continue to prioritize unit economics as the backbone of our business. As we not-ed in our last letter, we have continued to make significant progress in recent months, creating additional cost efficiencies that we believe will become more evident in our results over time:
• Beginning in the second quarter of 2021, our Pulse devices will cost 26% less to deliver, install, and use.
• Further, we’ve reduced the data cost for these new Pulse devices by 65%.
• Our realized savings are coinciding with our upcoming nationwide expansion. As we enter new states with our new, lower-cost devices, we expect to be able to ac-quire new customers at a lower cost, which we believe will ultimately increase our unit economic advantage over time.
With our robust balance sheet, we believe we are well-capitalized to execute our growth plans for 2021 and beyond successfully.
Driving growth
In order to successfully execute these growth plans, we’re making significant progress in three key areas: strategic leadership, product bundling, and nationwide expansion.
New senior hires strengthen our already deep bench Last Friday, we announced we hired Troy Dye, a 20-year veteran of Capital One, as our new Senior Vice President, Growth. Troy was most recently Capital One’s head of U.S. credit card marketing, engagement, and insights. We’re thrilled to bring on a senior leader of Troy’s caliber, who’ll bring to bear his extensive experience at a digi-tal-first, data-driven company recognized for balancing growth and profitability at a massive scale. Troy’s leadership in mass marketing, brand strategy, consumer insights, and customer engagement will be critical as we deepen growth in our existing states and expand nationwide.

Troy’s hiring comes on the heels of our announcement last month that Regi Vengalil is joining us as our new Chief Financial Officer, leading our finance team and ensuring we maintain our unit economic advantage. Regi comes to us from Egencia, Expedia Group’s corporate travel division, and brings to Metromile an impressive record of financial stewardship and corporate development experience. Regi and Troy both start on May 24.
Auto-homeowners bundle will unlock new growth opportunities We shared last quarter that we expected to begin offering bundled auto and home-owners insurance products before the end of 2021. Today, we are delighted to an-nounce that we have partnered with Hippo, one of the fastest-growing homeowners insurance companies in the world, to offer a modern auto and homeowners insurance bundle. More than half of U.S. insurance consumers bundle their auto and homeowners insur-ance. With this partnership, we expect to reach these consumers, further strengthen our high retention and average lifetime value, and lower customer acquisition costs. The current life expectancy of a Metromile policy for a new customer is 3.4 years, and industry research shows that bundlers have twice the tenure of a monoline auto insur-ance customer. This will be the first time customers of either digital insurance platform can bundle auto and homeowners insurance. It will allow customers to save up to an additional 15% on both their auto and homeowners insurance policies when bundled and enjoy a holistic, digital experience. Like Metromile for auto insurance, Hippo was founded on the belief that homeowners deserve better and fairer insurance. Hippo provides a digital-first insurance offer-ing for its customers using real-time data and technology. The values-based culture, mission, and service-oriented approach of Metromile and Hippo couldn’t be more aligned, and we believe the partnership is a perfect fit.
Laying the foundation for nationwide expansion We’re actively preparing for our nationwide expansion. Operating from a comprehen-sive state launch playbook, we’re making key hires to lead new state launches, work-ing closely with regulators, building out our telematics platform, and much more. We expect that state expansion, along with adding homeowners bundling with our core product, will enable us to reach millions more Americans over the coming quarters. We look forward to providing more details about our Hippo partnership and state expansion plans in the months and quarters ahead.
Always Innovating: Adopting Bitcoin for Payments
As the adoption of cryptocurrency grows rapidly worldwide, it is becoming clear that the decentralization of finance has the potential to shift consumer behavior and fi-nancial infrastructure. As we announced in mid-May, we are proud that we will be-come the first insurance company to allow policyholders the option to pay for insur-ance and receive payment for eligible claims in either bitcoin or dollars. We believe that allowing cryptocurrency payment is fully aligned with our commitment to innova-tion, equitability, and promoting financial resilience.
Metromile Enterprise We continue to be pleased with Metromile Enterprise’s progress. Deployments are un-derway as planned with current customers, and two carriers are in the final stages of contract negotiations. Notably, Toggle, a member of the Farmers Insurance family, is expanding our deployments to additional lines of business. Toggle is the first time an insurer is using Enterprise in a P&C line outside of auto and is a powerful validation of our technology’s applicability across other P&C lines.
Looking Ahead
We had a solid start to 2021 and are making strong progress on several fronts as we prepare for our nationwide expansion. Our leadership team is solidly built out, and we are currently adding new team members to support the states we will be entering.
Our expansion is coming at the right time, as miles driven are steadily increasing and inching toward pre-pandemic levels. For instance, in March, the miles driven by our customers in the Midwest and on the East Coast were at 87% of pre-pandemic driv-ing levels. Notably, Americans are returning to the roads in new ways as hybrid work models take hold and moving to suburban and rural communities. Our data also shows that mid-day trips are replacing riskier morning commutes and late-night driv-ing. We expect this new behavior to evolve rapidly over time, creating a more diverse set of needs. In turn, flexible insurance models are becoming more necessary and relevant and highlight the opportunity ahead. As drivers return to the roads, we plan to be ready to provide them with differentiated and fairer insurance that puts them at the center of choice. We’ve succeeded in getting the unit economics right, which is paramount for any insurer to succeed. Now, we are laying the groundwork to bring Metromile to over 100 million drivers in the U.S., generate disciplined, strong growth that we believe will de-liver substantial shareholder returns over the long term, and drive the digital evolution of auto insurance for decades to come.
Q1 2021 Results, KPIs, and Non-GAAP Financial Measures Policies in Force
• We grew Policies in Force by 3.6% from year-end 2020 to 95,958.
• We expect to begin expanding nationwide in the second half of 2021 to reach a total addressable market greater than 50% of potential customers, which we ex-pect to enable substantial growth in 2022 and 2023.
Premium• Direct Earned Premium in Q1 2021 was $25.8 million, a 4.2% increase from the pri-
or-year period.
• Average Annual Premium per Policy, defined as annualized Direct Earned Premi-um divided by the Average Policies in Force for the period, was $1,100 as of March 31, 2021, compared to $1,125 on March 31, 2020, due to lower miles driven on a year-over-year basis.

• Premium Run-Rate, defined as ending Policies in Force multiplied by Average Annual Premium per Policy, was $106.0 million as of March 31, 2021, compared to $102.0 million on March 31, 2020.
Retention• As of March 31, 2021, one-year new customer retention was 69.9% for policies that
completed their second term in Q1 2021. We define retention as the percentage of new customers who remain with us after their first two policy terms, inclusive of all cancellation reasons. One-year retention for new customers in Q1 2021 continues to be slightly elevated over our original and future expectations, as some cancel-lations resulting from non-payment were not processed due to government-man-dated COVID-19 payment extensions. We expect to process the majority of these cancellations in Q2 2021 and note that while these cancellations will have an impact on our Policies in Force at the end of the second quarter, we have antici-pated this impact in our outlook for end-of-year 2021 Policies in Force.
• The average policy life expectancy for a new customer was 3.4 years as of the end of Q1 2021. As policies age, retention rates improve, and thus the overall policy life expectancy of our overall book remains significantly higher than our new policy life.
GAAP Gross Margin• Q1 2021 GAAP Gross Margin was (12.0)%, compared to (46.5)% in Q1 2020, pri-
marily due to other income recorded due to the commutation of our reinsurance agreement with Horseshoe Re Limited.
• GAAP Gross Margin includes the effects of reinsurance, which increases the mea-sure’s volatility, and may not accurately reflect the company’s underlying business or operations. We are continuing to renegotiate the remainder of our current reinsurance program.
Accident Quarter Loss Ratio and Contribution Profit/Margin• Our Accident Quarter Loss Ratio was 65.1% in Q1 2021, a 500-basis point improve-
ment from 70.1% in the prior-year period, resulting from year-over-year pricing improvements, advantages from our per-mile and behavioral pricing, enhanced fraud detection, and our focus on investing in known profitable segments.
• Our Accident Quarter Loss Adjustment Expense Ratio was 11.5% in Q1 2021, com-pared to 10.3% for the prior-year period.

• Servicing Expenses in Q1 2021 were $4.1 million, or 15.8% of Direct Earned Premium, compared to $3.6 million, or 14.7% of Direct Earned Premium, in the prior-year pe-riod. We expect Servicing Expenses to return to more normalized levels beginning in Q2 2021, primarily due to an expected reduction in bad debt expenses. At the end of Q1 2021, we estimate our incremental Servicing Expenses for each marginal new policy sold was approximately 9%.
• Accident Quarter Contribution Profit in Q1 2021 was $2.4 million, an increase from $1.6 million in the prior-year period. Accident Quarter Contribution Margin was 9.1%, a 270-basis point improvement from Q1 2020. These non-GAAP financial measures exclude the results of prior period development on loss and loss adjust-ment expenses. Because Accident Quarter Contribution Margin represents the best estimate of the profitability of the in-force portfolio, this is the financial mea-sure we use to estimate the lifetime value of a customer.
• We had $4.3 million of unfavorable prior period loss development in Q1 2021, compared to $0.1 million of favorable prior period loss development in Q1 2020. About 85% of the increase in reserves was from bodily injury claims due to an increase in attorney-represented claims with a higher proportion of soft-tissue in-juries. Given the smaller size of the carrier today, a handful of large losses (out of 30 in Q1 2021) can create a wider short-term variance in reserves. We expect our focus on the early closure of injury cases to mitigate these exposures.
• Incorporating prior period development, Calendar Quarter Contribution Loss in Q1 2021 was $1.9 million, compared to Contribution Profit of $1.7 million in the pri-or-year period.

Enterprise Software Revenue• Total enterprise software revenue was $1.0 million in Q1 2021, an increase from
$0.6 million in the prior-year period.
• Our primary KPI for Metromile Enterprise is recurring software revenue, and we ended Q1 2021 with $4.2 million of booked annual recurring revenue.
Operating Expense (R&D, G&A, and Enterprise Costs)• Total operating expense, which excludes loss, loss adjustment expenses, mar-
keting and sales, and variable costs associated with servicing policies, was $12.5 million in Q1 2021, an increase of $0.8 million compared to the prior-year period, driven primarily by an increase in overhead costs related to our transition to a public company.
Acquisition Expense• Total marketing, sales, underwriting, and device costs were $8.5 million in Q1 2021,
compared to $6.8 million in the prior-year period. As previously noted, we are ramping up marketing spend to fuel our 2021 and longer-term growth initiatives.
Reinsurance• We are continuing our work to restructure our current reinsurance programs to en-
able us to manage our surplus at the insurance carrier at a lower cost of capital. The financial effect of reinsurance costs, recently and historically, are represented in our GAAP Gross Profit.
Cash• Cash and cash equivalents totaled $221.5 million on March 31, 2021, compared to
$19.2 million on December 31, 2020.

Full Year 2021 Outlook
We are reaffirming our previous outlook for the full year 2021:
• Policies in Force: We continue to expect to end the year with between 125,000 and 133,000 Policies in Force. We expect Policies in Force will steadily increase throughout the year as marketing channels mature and we launch in additional markets.
• Premium Run-Rate: In an effort to provide more transparency, we are initiating our outlook for the end-of-year 2021 Premium Run-Rate of between $143 million and $176 million. At the bottom end of the range, we are assuming driving contin-ues at Q1 2021 levels for the remainder of the year, while at the top of the range, we are assuming driving returns to pre-pandemic levels observed in 2019.
• Accident Year Loss Ratio: We continue to expect the Accident Year Loss Ratio will be between 65% and 70%.
• Accident Year Contribution Margin: We continue to expect to record Accident Year Contribution Margin between 8.5% and 13.5%.

Financial Summary:
Metromile, Inc.All values in $M, except Policies and Avg Prem Q1 20 Q1 21
Ending Policies in Force 90,922 95,958
Average Policies in Force 89,976 95,044
Average Annual Premium per Policy 1,125 1,100
Ending in Force Premium ($M) 102.0 106.0
P&L
Direct Earned Premium 24.8 25.8
Other Income 0.4 0.4
Insurance Revenue 25.2 26.2
Accident Period Losses 17.4 16.8
Accident Period Loss Adjustment Expense 2.5 3.0
Servicing Expense 3.6 4.1
Accident Period Contribution Profit 1.6 2.4
Prior Period Development (0.1) 4.3
Contribution Profit/(Loss) 1.7 (1.9)
Enterprise Software Revenue 0.6 1.0
Software Development, G&A, and EBS Costs 11.7 12.5
Depreciation, Amortization and Stock Comp 0.6 3.5
Operating Profit Before Acquisition Expense (10.0) (16.8)
Total Acquisition Expenses (cash basis) 6.8 8.5
Operating Profit After Acquisition Expense (16.8) (25.3)

About Metromile
Metromile (NASDAQ: MILE, MILEW) is a leading digital insurance platform in the United States. With data science as its foundation, Metromile offers real-time, person-alized auto insurance policies by the mile, instead of the industry standard approxi-mations and estimates that have historically made prices unfair. Metromile’s digitally native offering is built around the modern driver’s needs, featuring automated claims, complimentary smart driving features and annual average savings of 47% over what they were paying their previous auto insurer.
In addition, through Metromile Enterprise, it licenses its technology platform to insur-ance companies around the world. This cloud-based software as a service enables carriers to operate with greater efficiency, automate claims to expedite resolution, reduce losses associated with fraud, and unlock the productivity of employees.
For more information about Metromile, download our iOS and Android apps or visit metromile.com and enterprise.metromile.com.
Stay connected with us on LinkedIn and Twitter.
Media inquiries: [email protected] Relations: [email protected]
Non-GAAP Financial Measures
This letter contains information relating to contribution profit/(loss), accident quar-ter contribution profit/(loss), contribution margin, and accident quarter contribution margin. The non-GAAP financial measures below have not been calculated in accor-dance with generally accepted accounting principles in the United States (“GAAP”) and should be considered in addition to results prepared in accordance with GAAP and should not be considered as a substitute for or superior to GAAP results.
In addition, contribution profit/(loss), accident quarter contribution profit/(loss), con-tribution margin, and accident quarter contribution margin should not be construed as indicators of our operating performance, liquidity, or cash flows generated by op-erating, investing and financing activities, as there may be significant factors or trends

that these non-GAAP measures fail to address. We caution investors that non-GAAP financial information, by its nature, departs from traditional accounting conventions. Therefore, its use can make it difficult to compare our current results with our results from other reporting periods and with the results of other companies. Our manage-ment uses these non-GAAP financial measures, in conjunction with GAAP financial measures, as an integral part of managing our business and to, among other things: (1) monitor and evaluate the performance of our business operations and financial performance; (2) facilitate internal comparisons of the historical operating perfor-mance of our business operations; (3) facilitate external comparisons of the results of our overall business to the historical operating performance of other companies that may have different capital structures and debt levels; (4) review and assess the oper-ating performance of our management team; (5) analyze and evaluate financial and strategic planning decisions regarding future operating investments; and (6) plan for and prepare future annual operating budgets and determine appropriate levels of operating investments.
For more information regarding the non-GAAP financial measures discussed in this letter, please see “Reconciliation of GAAP to non-GAAP financial measures” below.
Forward-Looking Statements
This letter contains “forward-looking statements” within the meaning of the Private Securities Litigation Reform Act of 1995. Forward-looking statements may be identi-fied by the use of words such as “anticipate,” “believe,” “continue,” “could,” “estimate,” “expect,” “intends,” “may,” “might,” “plan,” “possible,” “potential,” “predict,” “project,” “seek,” “should,” “target,” “will,” “would” or the negative of such terms or other similar expressions that predict or indicate future events or trends or that are not statements of historical matters. These forward-looking statements include, but are not limited to, statements regarding our future financial performance, including under the caption “Full Year 2021 Outlook,” that our nationwide expansion will begin in the back half of the year, that we believe we remain on track to deliver our full-year 2021 outlook in all areas which we expect will enable substantial growth in 2022 and 2023, that we will experience additional cost efficiencies, our expectation that we should be able to acquire new customers at a lower cost which will ultimately increase our unit econom-ic advantage over time, that we are well-capitalized to execute our growth plans for 2021 and beyond successfully, and our expectation that we will launch our bundle to Metromile and Hippo customers by the end of 2021 and the expected benefits. Any
statements that refer to projections, forecasts, or other characterizations of future events or circumstances, including any underlying assumptions, are forward-looking statements.
These forward-looking statements are subject to known and unknown risks, uncer-tainties and assumptions about us that may cause our actual results, levels of activ-ity, performance or achievements to be materially different from any future results, levels of activities, performance or achievements expressed or implied by such for-ward-looking statements, including, but not limited to, our ability to recognize the anticipated benefits of our business combination with INSU Acquisition Corp. II, which may be affected by, among other things, competition and the ability of the combined business to grow and manage growth profitably; our financial and business perfor-mance, including financial projections and business metrics and any underlying as-sumptions thereunder; changes in our strategy, future operations, financial position, estimated revenues and losses, projected costs, prospects and plans; the implemen-tation, market acceptance and success of our business model; our ability to scale in a cost-effective manner; developments and projections relating to our competitors and industry; the impact of health epidemics, including the COVID-19 pandemic, on our business and the actions we may take in response thereto; our expectations regarding our ability to obtain and maintain intellectual property protection and not infringe on the rights of others; our future capital requirements and sources and uses of cash; our ability to obtain funding for future operations; our business, expansion plans and opportunities; and the outcome of any known and unknown litigation and regulatory proceedings.
These and other important factors are discussed under the captions “Risk Factors” and “Management’s Discussion and Analysis of Financial Condition and Results of Oper-ations” in our Registration Statement on Form S-1 and Current Report on Form 8-K, each filed with the Securities and Exchange Commission (the “SEC”) on February 12, 2021, and in our other filings with the SEC. While we may elect to update or revise such forward-looking statements at some point in the future, we disclaim any obligation to do so.
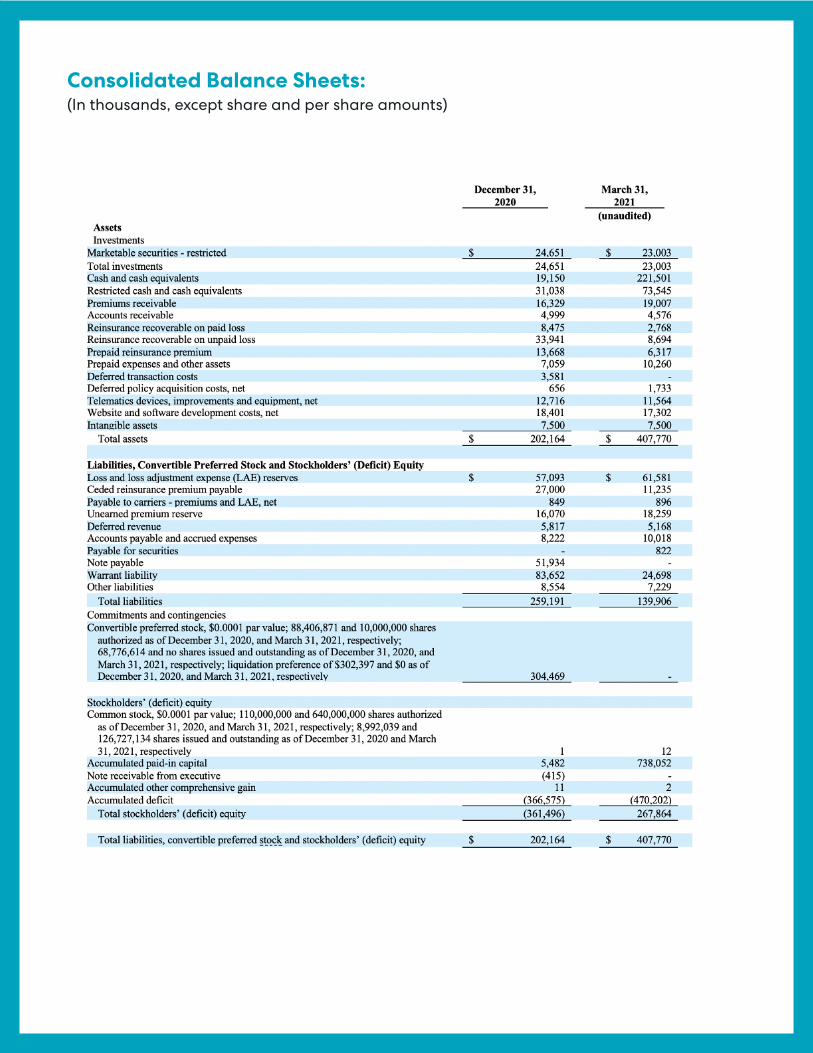
Consolidated Balance Sheets:(In thousands, except share and per share amounts)

Consolidated Statements of Operations :(In thousands, except share and per share amounts)
¹ Other revenue increase was primarily attributable to an $11.3 million gain recognized on reinsurance commutation settlement.
² Loss and loss adjustment expenses increase was driven by ceding less losses and thereby retaining more losses as a result of commuting a portion of our reinsurance program, which represented approximately $2.5 million and a reserve adjustment for periods prior to the first quarter of 2021 of $3.9 million.
³ Sales, marketing, and other acquisition costs increase was primarily reinsurance-related in connection with re-structuring our reinsurance program and related commutation comprising $41.4 million.
⁴ Research and development increase was primarily attributable to a decrease of $2.1 million in capitalized soft-ware costs which serve as an offset to research and development expense, which in turn was offset by a decrease of $1.1 million in personnel costs attributable to a reduction in force in response to the COVID-19 pandemic.
⁵ Other operating expenses increase was primarily driven by stock-based compensation expense of $2.8 million.
⁶ Interest expense increase was primarily attributable to a $14.1 million non-recurring write-off of unamortized debt issuance costs and debt prepayment fees related to debt pay-off during the three months ended March 31, 2021. As of March 31, 2021, all debt had been repaid, and no outstanding debt remains on the balance sheet.

Consolidated Statements of Cash Flows :(In thousands)
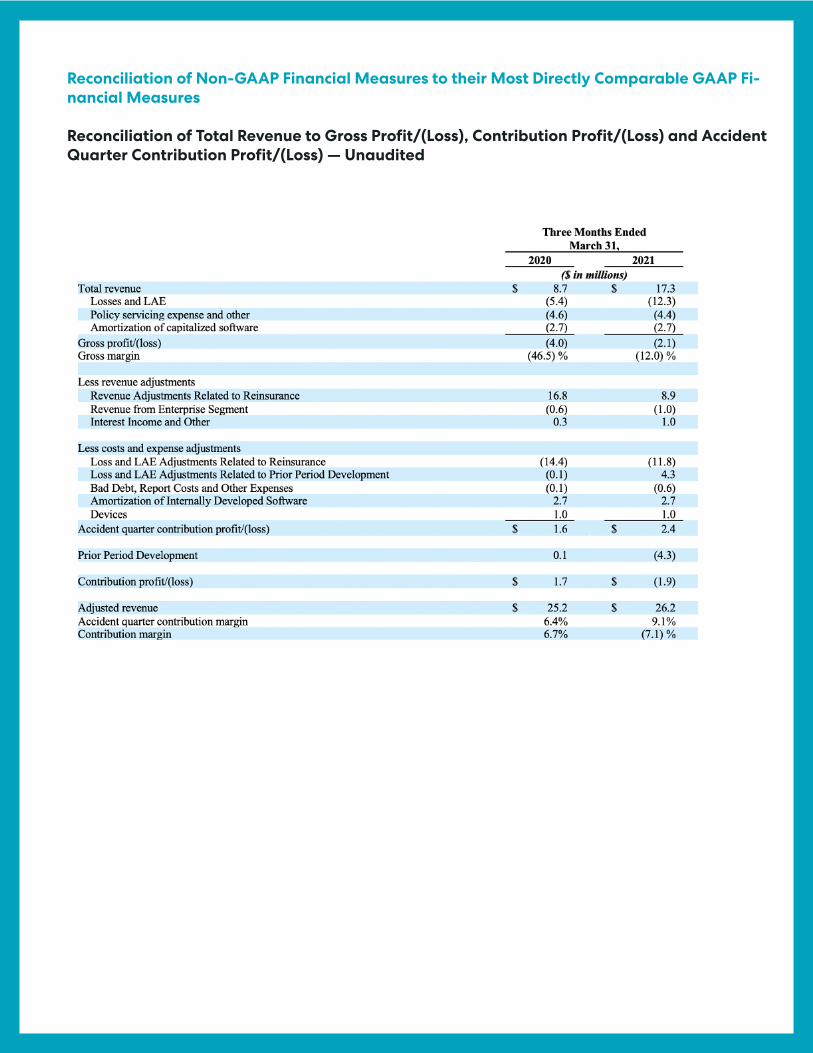
Reconciliation of Non-GAAP Financial Measures to their Most Directly Comparable GAAP Fi-nancial Measures Reconciliation of Total Revenue to Gross Profit/(Loss), Contribution Profit/(Loss) and Accident Quarter Contribution Profit/(Loss) — Unaudited

Key Performance Indicators - Unaudited: