Embed Size (px)
Citation preview

1 | P a g e
For the year ended December 31, 2020
ANNUAL HIGHLIGHTS As at and for the year ended
($000s except $ per share)
FINANCIAL
Revenue - realized oil and gas sales 121,642 202,749 223,388
Funds flow (1) 27,789 96,261 107,251
Per share - basic and diluted 0.83 2.88 3.22
Dividend payout ratio 4% 4% 34%
Cash flow from operations 32,073 81,132 115,963
Per share - basic and diluted 0.96 2.43 3.48
Payout ratio 3% 5% 32%
Cash dividends per share 0.03 0.12 1.11
Net earnings (loss)(2) (306,889) 21,923 7,167
Per share - basic and diluted (9.19) 0.66 0.22
Capital expenditures 43,728 53,627 78,737
Total assets 731,859 1,087,817 1,103,833
Net debt(3) 315,573 292,810 328,941
Shareholders' equity 196,633 503,949 483,970
OPERATIONS
Light oil -bbl per day 5,832 7,310 8,119
-average price ($ per bbl) 44.31 66.34 65.51
NGLs -bbl per day 1,032 986 995
-average price ($ per bbl) 18.65 25.83 40.32
Conventional natural gas -MCF per day 22,268 24,053 24,549
-average price ($ per MCF) 2.46 1.87 1.63
Total barrels of oil equivalent per day (BOE) (4) 10,575 12,305 13,206
December 31,
2020
December 31,
2019
December 31,
2018
(1) Funds flow is not a recognized measure under IFRS. For these purposes, the Company defines funds flow as funds provided by operations including proceeds from sale of investments and investment income received excluding the effects of changes in non-cash working capital items and decommissioning expenditures settled.
(2) In the first quarter of 2020 the Company recorded a $331,678,000 impairment provision less a $54,107,000 deferred income tax recovery related to its Alberta CGU’s oil and gas assets due to the impact of COVID-19 effect on the forward benchmark prices for crude oil.
(3) Net debt is not a recognized measure under IFRS. The Company defines net debt as current liabilities less current assets plus long-term bank debt and subordinated debt.
(4) BOE may be misleading, particularly if used in isolation. A BOE conversion ratio of 6 MCF: 1 bbl is based on an energy conversion method
primarily applicable at the burner tip and does not represent a value equivalency at the wellhead.
TSX: BNE www.bonterraenergy.com

2 | P a g e
QUARTERLY HIGHLIGHTS
As at and for the periods ended
($ 000s except $ per share) Q4 Q3 Q2 Q1
Financial
Revenue - oil and gas sales 31,761 29,155 22,171 38,555
Funds flow (1) 2,668 6,266 4,249 14,670
Per share - basic and diluted 0.08 0.19 0.13 0.44
Dividend payout ratio 0% 0% 0% 7%
Cash flow from (used in) operations (1,199) 6,370 4,429 22,473
Per share - basic and diluted (0.04) 0.19 0.13 0.67
Dividend payout ratio 0% 0% 0% 4%
Cash dividends per share 0.00 0.00 0.00 0.03
Net earnings (loss) (11,071) (5,211) (5,954) (284,653) (2)
Per share - basic and diluted (0.33) (0.16) (0.18) (8.53)
Capital expenditures 19,064 2,819 104 21,741
Total assets 731,859 722,910 732,462 743,533
Net debt(3) 315,573 295,168 299,445 300,688
Shareholders' equity 196,633 207,325 212,342 218,211
Operations
Light oil (barrels per day) 5,371 5,355 5,553 7,058
Average price ($ per bbl) 47.16 45.73 33.31 49.67
NGLs (barrels per day) 960 1,064 1,104 999
Average price ($ per bbl) 24.78 19.29 12.14 19.21
Conventional natural gas (MCF per day) 22,560 21,510 21,142 23,864
Average price ($ per MCF) 3.02 2.40 2.14 2.26
Total BOE per day(4) 10,091 10,004 10,181 12,034
2020
(1) Funds flow is not a recognized measure under IFRS. For these purposes, the Company defines funds flow as funds provided by operations
including proceeds from sale of investments and investment income received excluding the effects of changes in non-cash working capital items and decommissioning expenditures settled.
(2) In the first quarter of 2020 the Company recorded a $331,678,000 impairment provision less a $54,107,000 deferred income tax recovery related to its Alberta CGU’s oil and gas assets due to the impact of COVID-19 on forward benchmark prices for crude oil.
(3) Net debt is not a recognized measure under IFRS. The Company defines net debt as current liabilities less current assets plus long-term bank debt and subordinated debt.
(4) BOE may be misleading, particularly if used in isolation. A BOE conversion ratio of 6 MCF: 1 bbl is based on an energy conversion method
primarily applicable at the burner tip and does not represent a value equivalency at the wellhead.

3 | P a g e
REPORT TO SHAREHOLDERS
Bonterra Energy Corp. (“Bonterra” or the “Company”) exited 2020 in a strong position with access to liquidity-enhancing support from the Business Development Bank of Canada (“BDC”) and Export Development Canada (“EDC”), the ability to accelerate abandonment and reclamation efforts with Alberta’s Site Rehabilitation Program (“SRP”), and a strategic go-forward plan centered on long-term sustainable value creation. As the economy recovers following the global impact of COVID-19, Bonterra is aiming to return production volumes to pre-COVID levels. Meaningful debt repayment remains the focus, with the ultimate goal of generating Free Funds Flow1 and executing a prudent capital program to drive value for shareholders.
Bonterra 2020 Highlights
• Invested $43.7 million into a conservative capital program for the year (approximately 43 percent of whichwas invested in Q4 2020) with $37.1 million directed to drilling 24 gross (23.8 net) operated wells and thecompletion, equip and tie-in of 23 gross (22.9 net) operated wells which were placed on production, alongwith $6.6 million directed to related infrastructure and recompletions.
• Continued to focus on incremental operating cost savings across the organization, with production costs perBOE declining three percent to $15.12 per BOE, and costs to drill, complete, equip and tie-in approximately23 percent lower than 2019.
• Generated Funds Flow1 of $27.8 million ($0.83 per share) in 2020, which supported continued funding ofBonterra’s capital program and debt repayment.
• Averaged 10,575 BOE per day2 of production in 2020 reflecting modest capital spending in the year coupledwith approximately 875 BOE per day of shut-in production volumes related to facility maintenance and lowcommodity prices.
• Supported by the SRP, successfully abandoned 143 net wells during 2020, demonstrating the Company’songoing focus on responsible ESG initiatives.
Bonterra’s Strengths
Numerous successes were realized through 2020 despite one of the most challenging financial and operating environments in recent memory, all of which helped to position the Company for resiliency, sustainability and to create long-term shareholder value. In addition to addressing the effects brought about by COVID-19, Bonterra also faced a highly conditional unsolicited bid to acquire all of the issued and outstanding common shares in exchange for shares of Obsidian Energy Ltd. (the “Hostile Bid”) starting in August of 2020. Since that time, Bonterra’s Board of Directors has continued to reiterate its recommendation to reject the Hostile Bid as it is not in the best interests of Bonterra shareholders. Bonterra’s shareholders have demonstrated agreement with the Board’s recommendation to date by continuing to reject the offer and not tender despite numerous extensions to the expiry of the Hostile Bid.
“Bonterra is positioned for success and remains focused on generating strong and sustainable Free Funds Flow1
which can be directed to debt reduction and capital spending when supported by commodity prices.”
In 2020, Bonterra was one of the first Canadian energy producers to qualify and be approved for both the EDC and BDC government support programs, a condition of which is financial viability, providing $83.4 million of secured lending commitments. As a result of these financing initiatives, Bonterra’s go-forward strategic plan is projected to grow average annual production to pre-COVID levels of approximately 12,800 to 13,200 BOE per day3 in 2021, putting the Company in a strong position to benefit from rising commodity prices. The Company’s banking syndicate also supports our strategic plan and has extended the maturity date of Bonterra’s $300 million senior credit facility to December 31, 2021.
1 "Funds Flow”, "Free Funds Flow" and “net debt” do not have standardized meanings. See “Cautionary Statements”. 2 Comprised of 5,832 bbls per day of light and medium crude oil; 22,268 MCF per day of conventional natural gas; and 1,032 bbls per day of natural gas liquids. 3 Comprised of 7,050 to 7,400 bbls per day of light and medium crude oil; 26,100 to 26,500 MCF per day of conventional natural gas; and 1,390 to
1,400 bbls per day of natural gas liquids.

4 | P a g e
Outlook
Through 2021, we intend to maintain a fully-funded capital program between $65 and $75 million, targeting high rate-of-return, low-risk light oil opportunities and carefully control the pace of development to retain flexibility to rapidly respond to changing commodity prices. The Company plans to run a single drilling rig through 2021 with approximately $58 million allocated to drill, complete and tie-in 43 gross (38.1 net) wells, with the balance directed to facilities, pipelines, recompletion and workover costs.
Subsequent to the end of 2020, the Company successfully drilled nine gross (9.0 net) wells, with seven gross (6.8 net) wells tied-in and placed on production, generating current production volumes, based on field estimates, of approximately 12,500 BOE per day4. Bonterra aims to further improve drilling and completions efficiencies, with estimated per well drill, complete and tie-in costs forecast to be approximately $1.4 to 1.6 million. Based on forecasted 2021 commodity prices, capital budget and production, Bonterra’s guidance for 2021 is Funds Flow5 of approximately $80 to $88 million, and free funds flow5 of approximately $13.0 to $13.9 million. Holding all other variables constant, if WTI increased to US $65 per barrel, modeling indicates approximately $30 million of Free Funds Flow5 could be generated.
Bonterra’s 2021 budget also includes $3 million targeting well abandonment and reclamation initiatives to reduce the Company’s operated inactive well count by approximately 191 net wells by the end of 2021, or approximately 60 percent based on current approvals through the SRP and other provincial programs.
With an established history of operational execution and commitment to long‐term sustainability for shareholders, Bonterra has the assets and the people to drive profitable development of its high‐quality, Cardium light oil asset base, and be positioned to generate value for years to come. The Board of Directors and management of the Company thank all shareholders for their continued support over the past year, and to all employees and consultants for their valued contributions.
George F. Fink Chief Executive Officer and Chairman of the Board
4 Comprised of 7,200 bbls per day of light and medium crude oil; 24,100 MCF per day of conventional natural gas; and 1,300 bbls per day of natural
gas liquids. 5 "Funds Flow”, "Free Funds Flow" and “net debt” do not have standardized meanings. See “Cautionary Statements”.

5 | P a g e
MANAGEMENT’S DISCUSSION AND ANALYSIS The following report dated March 9, 2021 is a review of the operations and current financial position for the year ended December 31, 2020 for Bonterra Energy Corp. (“Bonterra” or “the Company”) and should be read in conjunction with the audited financial statements presented under International Financial Reporting Standards (IFRS), including the notes related thereto.
Use of Non-IFRS Financial Measures Throughout this Management’s Discussion and Analysis (MD&A) the Company uses the terms “payout ratio”, “field netback”, “cash netback” and “net debt” to analyze operating performance, which are not standardized measures recognized under IFRS and do not have a standardized meaning prescribed by IFRS. These measures are commonly used in the oil and gas industry and are considered informative by management, shareholders and analysts. These measures may differ from those made by other companies and accordingly may not be comparable to such measures as reported by other companies. The Company calculates payout ratio percentage by dividing cash dividends paid to shareholders by cash flow from operating activities, both of which are measures prescribed by IFRS which appear on its statement of cash flows. Bonterra calculates cash and field netback by dividing various financial statement items as determined by IFRS by total production for the period on a barrel of oil equivalent basis. The Company calculates net debt as long-term debt plus working capital deficiency (current liabilities less current assets).
Frequently Recurring Terms Bonterra uses the following frequently recurring terms in this MD&A: “WTI” refers to West Texas Intermediate, a grade of light sweet crude oil used as benchmark pricing in the United States; “MSW Stream Index” or “Edmonton Par” refers to the mixed sweet blend that is the benchmark price for conventionally produced light sweet crude oil in Western Canada; “AECO” refers to Alberta Energy Company, a grade or heating content of natural gas used as benchmark pricing in Alberta, Canada; “bbl” refers to barrel; “NGL” refers to Natural gas liquids; “MCF” refers to thousand cubic feet; “MMBTU” refers to million British Thermal Units; “GJ” refers to gigajoule; and “BOE” refers to barrels of oil equivalent. Disclosure provided herein in respect of a BOE may be misleading, particularly if used in isolation. A BOE conversion ratio of 6 MCF: 1 bbl is based on an energy conversion method primarily applicable at the burner tip and does not represent a value equivalency at the wellhead.
Numerical Amounts The reporting and the functional currency of the Company is the Canadian dollar.

6 | P a g e
ANNUAL COMPARISONS
As at and for the year ended($000s except $ per share)
FINANCIAL
Revenue - realized oil and gas sales 121,642 202,749 223,388
Cash flow from operations 32,073 81,132 115,963
Per share - basic and diluted 0.96 2.43 3.48
Dividend payout ratio 3% 5% 32%
Cash dividends per share 0.03 0.12 1.11
Net earnings (loss)(1) (306,889) 21,923 7,167
Per share - basic and diluted (9.19) 0.66 0.22
Capital expenditures 43,728 53,627 78,737
Total assets 731,859 1,087,817 1,103,833
Net debt 315,573 292,810 328,941
Shareholders' equity 196,633 503,949 483,970
OPERATIONS
Light oil -bbl per day 5,832 7,310 8,119
-average price ($ per bbl) 44.31 66.34 65.51
NGLs -bbl per day 1,032 986 995
-average price ($ per bbl) 18.65 25.83 40.32
Conventional natural gas -MCF per day 22,268 24,053 24,549
-average price ($ per MCF) 2.46 1.87 1.63
Total BOE per day 10,575 12,305 13,206
December 31,
2020
December 31,
2019
December 31,
2018
(1) In the first quarter of 2020 the Company recorded a $331,678,000 impairment provision less a $54,107,000 deferred income tax recovery
related to its Alberta CGU’s oil and gas assets due to the impact of COVID-19 on the forward benchmark prices for crude oil.
7 | P a g e
QUARTERLY COMPARISONS
As at and for the periods ended
($ 000s except $ per share) Q4 Q3 Q2 Q1
Financial
Revenue - oil and gas sales 31,761 29,155 22,171 38,555
Cash flow from operations (1,199) 6,370 4,429 22,473
Per share - basic and diluted (0.04) 0.19 0.13 0.67
Dividend payout ratio 0% 0% 0% 4%
Cash dividends per share 0.00 0.00 0.00 0.03
Net loss (1) (11,071) (5,211) (5,954) (284,653)
Per share - basic and diluted (0.33) (0.16) (0.18) (8.53)
Capital expenditures 19,064 2,819 104 21,741
Total assets 731,859 722,910 732,462 743,533
Net debt 315,573 295,168 299,445 300,688
Shareholders' equity 196,633 207,325 212,342 218,211
Operations
Light oil (barrels per day) 5,371 5,355 5,553 7,058
NGLs (barrels per day) 960 1,064 1,104 999
Conventional natural gas (MCF per day) 22,560 21,510 21,142 23,864
Total BOE per day 10,091 10,004 10,181 12,034
2020
(1) In the first quarter of 2020 the Company recorded a $331,678,000 impairment provision less a $54,107,000 deferred income tax recovery
related to its Alberta CGU’s oil and gas assets due to the impact of COVID-19 on forward benchmark prices for crude oil.
As at and for the periods ended
($ 000s except $ per share) Q4 Q3 Q2 Q1
Financial
Revenue - oil and gas sales 50,743 47,320 54,852 49,834
Cash flow from operations 20,767 19,774 25,468 15,123
Per share - basic and diluted 0.62 0.59 0.76 0.45
Dividend payout ratio 5% 5% 4% 7%
Cash dividends per share 0.03 0.03 0.03 0.03
Net earnings (loss) (1,389) (1,276) 23,131 1,457
Per share - basic and diluted (0.04) (0.04) 0.69 0.04
Capital expenditures 5,678 17,845 9,042 21,062
Total assets 1,087,817 1,133,137 1,123,513 1,124,043
Net debt 292,810 308,069 310,783 326,733
Shareholders' equity 503,949 506,011 507,659 484,980
Operations
Light oil (barrels per day) 7,255 7,157 7,746 7,081
NGLs (barrels per day) 1,016 1,009 970 949
Conventional natural gas (MCF per day) 24,697 23,820 23,750 23,938
Total BOE per day 12,387 12,136 12,674 12,020
2019

8 | P a g e
Business Environment and Sensitivities Bonterra’s financial results are significantly influenced by fluctuations in commodity prices, including price differentials, as well as production volumes and foreign exchange rates. The following table depicts selective market benchmark commodity prices, differentials and foreign exchange rates in the last eight quarters to assist in understanding how past volatility has impacted Bonterra’s financial and operating performance. The increases or decreases in Bonterra’s realized average price for oil and natural gas for each of the eight quarters is also outlined in detail in the following table.
Q4-2020 Q3-2020 Q2-2020 Q1-2020 Q4-2019 Q3-2019 Q2-2019 Q1-2019
Crude oil
WTI (U.S.$/bbl) 42.66 40.93 27.85 46.17 56.96 56.45 59.81 54.90
WTI to MSW Stream Index
Differential (U.S.$/bbl)(1) (4.07) (3.51) (6.14) (7.58) (5.37) (4.66) (4.62) (4.85)
Foreign exchange
U.S.$ to Cdn$ 1.3031 1.3316 1.3860 1.3445 1.3201 1.3207 1.3375 1.3293
Bonterra average realized
oil price (Cdn$/bbl) 47.16 45.73 33.31 49.67 63.37 65.49 71.27 64.87
Natural gas
AECO (Cdn$/mcf) 2.63 2.23 1.98 2.02 2.46 0.91 1.03 2.61Bonterra average realized
gas price (Cdn$/mcf) 3.02 2.40 2.14 2.26 2.71 0.96 1.09 2.70 (1) This differential accounts for the majority of the difference between WTI and Bonterra’s average realized price (before quality adjustments and
foreign exchange).
The overall volatility in Bonterra’s average realized commodity prices can be impacted by numerous events or factors, however none have been as impactful as the ongoing effects of the COVID-19 pandemic. Volatility in WTI benchmark pricing began to stabilize in the fourth quarter of 2020, leading to an increase of just under US$2 per barrel in the average WTI price to US$42.66 relative to the third quarter of 2020. Continuous crude oil demand improvements were met with consistent and measured increases in OPEC+ supply, mitigating significant price increases. Demand increases are expected to continue into 2021 as COVID-19 vaccinations roll out around the world and public restrictions are eased to pre-COVID-19 levels. However, the pace of economic recovery is still highly uncertain as adequate supply will be needed to balance commodity markets which may pose a challenge. As such, it is likely that pricing volatility will continue through 2021. Canadian crude oil differentials widened marginally in Q4 2020 compared to the previous quarter due to a combination of factors, but ultimately were largely offset by stable storage levels in Canada, adequate egress and steady production levels. Currently, there are several pipeline projects underway with the most significant being the Enbridge Line 3 Expansion and the Trans Mountain Expansion. Completion of any proposed pipeline expansion projects or increasing Canada’s export capabilities by expanding capacity on existing lines is anticipated to have a positive effect on the movement and pricing of Canadian barrels. Conversely, the recent cancellation of TC Energy's Keystone XL pipeline system and renewed concerns around the fate of Enbridge’s Line 5 crossing into Michigan are factors that could have a negative effect on the pricing differential between WTI and MSW or Edmonton Par pricing. The AECO benchmark price for natural gas increased in the fourth quarter of 2020 due largely to seasonal factors, improved access to storage, limited maintenance on TC Energy Corporation’s NGTL pipeline system and reduced drilling activity compared to past years. Forecast pricing into 2021 continues to reflect an improved and stable AECO market, and planned facility additions for the NGTL system and progress by LNG Canada for the Kitimat liquefied natural gas export facility may improve market sentiment towards western Canadian-based natural gas producers. While these projects do not impact near-term supply and demand imbalances, they do have positive implications for the longer term.

9 | P a g e
The following chart shows the Company’s sensitivity to key commodity price variables. The sensitivity calculations are performed independently and show the effect of changing one variable while holding all other variables constant.
Annualized sensitivity analysis on cash flow, as estimated for 2021 (1)
Impact on cash flow Change ($) $000s $ per share(2)
Realized crude oil price ($/bbl) 1.00 2,462 0.07
Realized natural gas price ($/mcf) 0.10 991 0.03
U.S.$ to Canadian $ exchange rate 0.01 1,231 0.04
(1) This analysis uses current royalty rates, annualized estimated average production of 13,100 BOE per day and no changes in working capital. (2) Based on annualized basic weighted average shares outstanding of 33,511,316.
Business Overview, Strategy and Key Performance Drivers Bonterra is an upstream oil and gas company that is primarily focused on the development of its Cardium land within the Pembina and Willesden Green areas located in central Alberta. The Pembina Cardium reservoir is the largest conventional oil reservoir in western Canada that features large original oil in place with very low recoveries to date. Bonterra operates approximately 90 percent of its production and operates the majority of its related oil and gas processing facilities, which require minimal additional capital to support an increase of production. Beginning in March 2020, the COVID-19 pandemic caused a severe deterioration in world oil demand leading to unprecedented declines in oil prices, which actually went into negative territory. Bonterra remains focused on preserving and growing the value of its crude oil reserves for an eventual oil price recovery. As Bonterra moves forward, the Company reiterates its recommendation to shareholders to reject Obsidian Energy Ltd.’s (“Obsidian’s”) highly conditional, unsolicited bid to acquire all of the issued and outstanding common shares of Bonterra. The Company continues to recommend shareholders reject the hostile bid and take no action. Bonterra is proud of its established history of working within a challenging market environment to pursue long-term sustainability and value generation. Subsequent to year end 2020, the Company completed and tied in four gross (3.8 net) wells that had been drilled in 2020. With a 2021 capital program between $65 million to $75 million, the Company expects 2021 annual production to average between 12,800 to 13,200 BOE per day, an increase of approximately 30 percent compared to Q4 2020 and in line with production levels prior to COVID-19. The Company achieved many milestones throughout a challenging year in 2020, including drilling, completion and equipping cost savings of approximately 23 percent compared to 2019, funding secured through the Business Development Bank of Canada ("BDC") and Alberta’s Site Rehabilitation Program ("SRP"), and a lending backstop from Export Development Canada. The near-term liquidity from the BDC second lien non-revolving four-year term facility for $45 million supported Bonterra’s 2020-2021 winter drilling program. The 2020-2021 winter drilling program supports long-term, sustainable net asset value per share growth as the economy recovers. Supported by the SRP, Bonterra successfully abandoned 143 net wells during 2020, and as the Company continues to execute its abandonment program through 2021, a further 191 net wells are forecast to be abandoned. Bonterra expects to reduce its inactive well count by approximately 60 percent by the end of 2021 under current approvals. The Company averaged 10,575 BOE per day for 2020, a decrease of 1,730 BOE per day from 2019, caused primarily by an average of 875 BOE per day of voluntary shut-in production (as high as 1,800 BOE per day in the second quarter of 2020) and a deferred capital program since the beginning of the COVID-19 pandemic in March 2020. The Company invested a total of $43.7 million with approximately 43 percent allocated to the fourth quarter of 2020. Of the total capital invested, $37.1 million was directed to the drilling of 24 gross (23.8 net) operated wells and the completion, equip and tie-in of 23 gross (22.9 net) operated wells, of which three of the completed and equipped wells were drilled late in 2019. Of the 24 wells drilled, one was not completed and abandoned due to subsurface fractures causing loss of well bore integrity. An amount of $1,299,000 was fully depleted for unsuccessful drill costs. Included in the total capital program of $43.7 million, approximately $6.6 million was spent primarily on related infrastructure and recompletions.

10 | P a g e
To further support stability while facing continued market volatility, and as part of Bonterra’s ongoing efforts to diversify commodity pricing and to protect future cash flow, the Company executed physical delivery sales and risk management contracts for the 2021 year. For the balance of 2021, Bonterra has secured a WTI price between $36.00 USD to $50.50 USD per bbl on 2,250 bbls per day, with a WTI to Edmonton par differential of $7.23 on 1,460 bbls per day. In addition, the Company has secured a natural gas price of $2.53 on 7,801 GJ per day for the 2021 year (representing approximately one-third of Bonterra’s crude oil and natural gas production).
Bonterra is committed to employing local services in Drayton Valley and to being a key economic contributor to rural and surrounding communities located within central Alberta. The Company’s upstream oil and gas assets are primarily focused on the development of the Pembina and Willesden Green Cardium lands within central Alberta. The Pembina Cardium reservoir is the largest conventional oil reservoir in western Canada that features large original-oil-in-place with very low recoveries to date. Bonterra operates approximately 90 percent of its production and operates the majority of its related oil and gas processing facilities, which require minimal additional capital to support an increase in production. Bonterra’s successful operations are dependent upon several factors including, but not limited to: commodity prices, efficient management of capital spending, the ability to maintain desired levels of production, control over infrastructure, efficiency in developing and operating properties, and the ability to control costs. The Company’s key measures of performance with respect to these drivers include but are not limited to: average daily production volumes, average realized prices, and average production costs per unit of production. Disclosure of these key performance measures can be found in this MD&A and/or previous interim or annual MD&A disclosures.
Drilling
Gross(1) Net(2) Gross (1) Net(2) Gross (1) Net(2) Gross(1) Net(2) Gross (1) Net(2)
Crude oil horizontal-operated 13 12.8 3 3.0 3 3.0 24 23.8 23 23.0
Crude oil horizontal-non-operated 3 0.1 - - 1 0.1 3 0.1 7 0.7
Total 16 12.9 3 3.0 4 3.1 27 23.9 30 23.7
Success rate 100% 100% 100% 96% 100%
Three months ended Year endedDecember 31,
2020
September 30,
2020
December 31,
2019
December 31,
2020
December 31,
2019
(1) “Gross” wells are the number of wells in which Bonterra has a working interest.
(2) “Net” wells are the aggregate number of wells obtained by multiplying each gross well by Bonterra’s percentage of working interest.
During 2020, the Company drilled 24 gross (23.8 net) operated wells and completed, tied-in and placed on production 22 gross (21.9 net) operated wells. Three of the wells completed and tied-in during Q1 2020 were drilled in late 2019. Five gross (4.8 net) operated wells drilled in 2020 were not completed as one well was abandoned due to subsurface fractures causing loss of well bore integrity and the remaining four wells were placed on production in the first quarter of 2021. Due to unsuccessful drill costs related to the abandoned well, the Company has depleted its full cost of $1,299,000 . Subsequent to the end of the 2020, Bonterra drilled nine gross (9.0 net) wells, all of which are expected to be completed, tied-in and placed on production by the end of April 2021.
Production
December 31,
2020
September 30,
2020
December 31,
2019
December 31,
2020
December 31,
2019
Crude oil (barrels per day) 5,371 5,355 7,255 5,832 7,310
NGLs (barrels per day) 960 1,064 1,016 1,032 986
Natural gas (MCF per day) 22,560 21,510 24,697 22,268 24,053
Average BOE per day 10,091 10,004 12,387 10,575 12,305
Three months ended Year ended
The Company averaged 10,575 BOE per day in 2020, compared to 12,305 BOE per day for the same period in 2019. The decrease in production largely commenced in the second quarter as the Company voluntarily shut-in uneconomic production of 1,800 BOE per day and deferred its capital program due to low commodity prices stemming from the
11 | P a g e
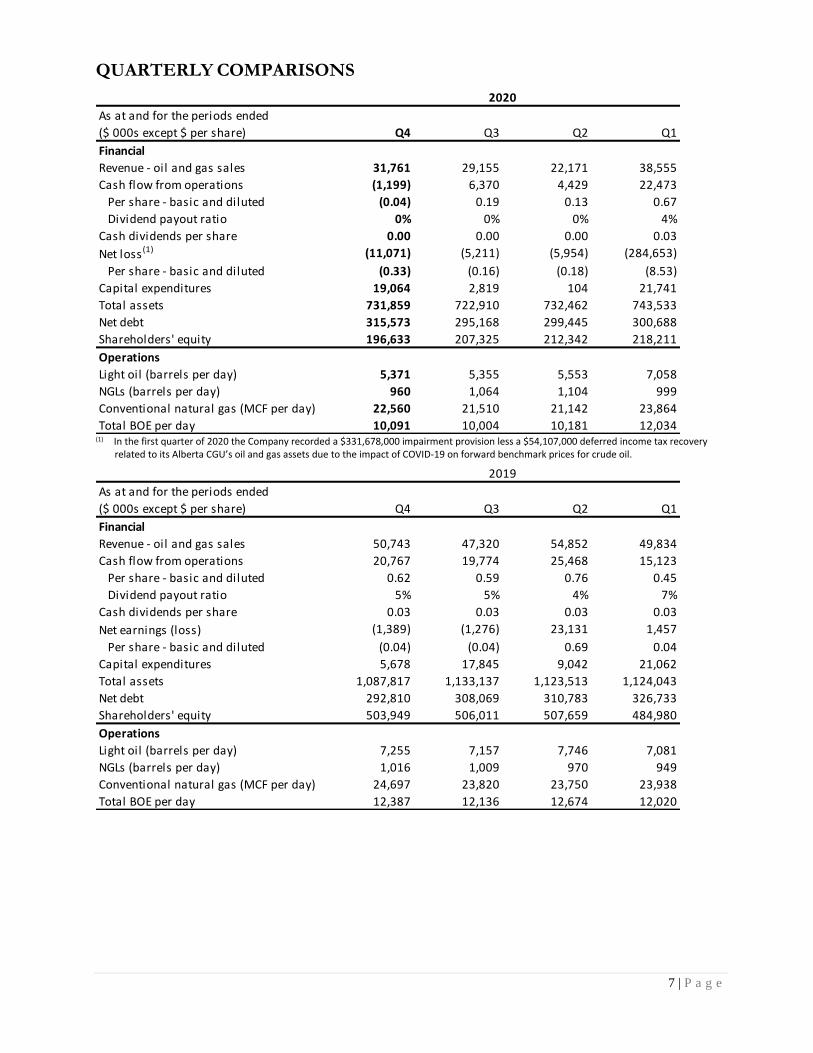
effects of the COVID-19 pandemic. Q4 2020 production remained relatively stable compared to Q3 2020 as production declines were offset by new wells being placed on production primarily in the last month of 2020. The Company expects production to increase during the first quarter of 2021 with 7 gross (6.8 net) new wells coming on production and the further reactivation of shut-in wells during the period.
Cash Netback The following table illustrates the calculation of the Company’s cash netback from operations for the periods ended:
$ per BOE
December 31,
2020
September 30,
2020
December 31,
2019
December 31,
2020
December 31,
2019
Production volumes (BOE) 928,332 920,387 1,139,615 3,870,369 4,491,303
Gross production revenue 34.21 31.68 44.53 31.43 45.14
Risk management contracts realized gain
(loss) (0.58) (1.66) (0.39) 0.10 (0.10)
Royalties (2.11) (1.73) (2.24) (2.02) (3.18)
Production costs (17.30) (13.33) (16.94) (15.12) (15.51)
Field netback 14.22 14.96 24.96 14.39 26.35
General and administrative (4.07) (3.07) (1.68) (2.54) (1.53)
Interest and other (7.28) (5.08) (3.05) (4.67) (3.39)
Cash netback 2.87 6.81 20.23 7.18 21.43
Three months ended Year ended
Cash netbacks decreased in 2020 compared to 2019 primarily due to lower realized oil prices, higher general and administrative costs and an increase in the Company’s credit facility interest rates. Quarter-over-quarter cash netbacks decreased primarily due to service rig costs and facility maintenance as the Company reactivated more production. The benefits of reactivating additional wells that have been down and the drilling of new wells in Q4 2020 is expected to result in higher production volumes and a lower production cost per BOE in Q1 2021. The Company incurred approximately $1.52 per BOE of non-recurring general and administrative costs in the second half of 2020, largely attributable to unsolicited bid costs related to the Company’s shares, and to a lesser extent, finance costs relating to the BDC program.
Oil and Gas Sales
December 31,
2020
September 30,
2020
December 31,
2019
December 31,
2020
December 31,
2019
Revenue - oil and gas sales ($ 000s)
Crude oil 23,301 22,526 42,297 94,567 176,996
NGL 2,188 1,889 2,280 7,044 9,300
Natural gas 6,272 4,740 6,166 20,031 16,453
31,761 29,155 50,743 121,642 202,749
Average realized prices:
Crude oil ($ per barrel) 47.16 45.73 63.37 44.31 66.34
NGLs ($ per barrel) 24.78 19.29 24.39 18.65 25.83
Natural gas ($ per MCF) 3.02 2.40 2.71 2.46 1.87
Average ($ per BOE) 34.21 31.68 44.53 31.43 45.14
Average BOE per day 10,091 10,004 12,387 10,575 12,305
Three months ended Year ended
Revenue from oil and gas sales in 2020 decreased by $81,107,000, or 40 percent, compared to the same period in 2019. The decrease in oil and gas sales was primarily driven by a 33 percent decrease in Bonterra’s realized crude oil prices from weak demand caused by the COVID-19 pandemic. Quarter-over-quarter, oil and gas sales increased as the Company benefited from a further oil price recovery while natural gas prices increased due to colder weather.

12 | P a g e
The Company’s product split on a revenue basis was weighted approximately 84 percent to crude oil and NGLs for 2020.
Royalties
($ 000s)
December 31,
2020
September 30,
2020
December 31,
2019
December 31,
2020
December 31,
2019
Crown royalties 913 656 780 4,104 7,230
Freehold, gross overriding and
other royalties 1,044 933 1,770 3,717 7,044
Total royalties 1,957 1,589 2,550 7,821 14,274
Crown royalties - percentage of
revenue 2.9 2.3 1.5 3.4 3.6
Freehold, gross overriding and
other royalties - percentage of
revenue 3.3 3.2 3.5 3.1 3.5
Royalties - percentage of revenue 6.2 5.5 5.0 6.5 7.1
Royalties $ per BOE 2.11 1.73 2.24 2.02 3.18
Three months ended Year ended
Royalties paid by the Company consist of both crown royalties to the Provinces of Alberta, Saskatchewan and British Columbia and other royalties. Total royalties for the year ended December 31, 2020 decreased by $1.16 per BOE compared to the same period in 2019. The decrease was primarily the result of a reduction in crude oil prices. The increase in royalties in Q4 2020 compared to Q3 2020 is due to an increase in commodity prices.
Production Costs
($ 000s except $ per BOE)
December 31,
2020
September 30,
2020
December 31,
2019
December 31,
2020
December 31,
2019
Production costs 16,064 12,274 19,304 58,525 69,673
$ per BOE 17.30 13.33 16.94 15.12 15.51
Three months ended Year ended
Production costs for 2020 decreased from the same period in 2019 primarily due to shutting-in higher cost batteries due to depressed crude oil prices in the second quarter of 2020 as a result of the COVID-19 pandemic and the OPEC+ price war. Shutting-in higher cost batteries reduced well and facility maintenance, chemical and trucking costs in 2020 compared to 2019. Production costs for Q4 2020 increased by $3,790,000 compared to Q3 2020 primarily due to increased service rig and facility maintenance as the Company continued to reactivate production.
Other Income
($ 000s)
December 31,
2020
September 30,
2020
December 31,
2019
December 31,
2020
December 31,
2019
Investment income 12 19 21 50 64
Administrative income 71 54 64 211 144
Gain on sale of property - - 70 - 75
Deferred consideration 214 201 346 889 1,273
Government grant in-kind 1,689 - - 1,689 -
Realized gain (loss) on risk
management contracts (540) (1,524) (443) 401 (443)
Unrealized gain (loss) on risk
management contracts (3,451) 1,141 (76) (3,464) (134)
(2,005) (109) (18) (224) 979
Three months ended Year ended

13 | P a g e
Deferred consideration relates to a deferred gain on the sale of a two percent overriding royalty interest, which is recognized into revenue using the same unit-of-production method as the encumbered property, plant, and equipment assets. The market value and carrying value of the investments held by the Company on December 31, 2020 was $295,000 (December 31, 2019 - $286,000). There were no dispositions for the year ended December 31, 2020 or December 31, 2019. Dispositions that result in a gain or loss on sale are recorded as an equity transfer between accumulated other comprehensive income and retained earnings. The Company receives administrative income for various oil and gas administrative services provided and production equipment rentals to other companies. The Government of Alberta’s SRP provides grant funding through service providers to abandon or remediate oil and gas sites. The Company derecognized approximately $1,689,000 of asset retirement obligations as an in-kind grant (2019 - $Nil). The benefit of the in-kind grant is recognized through other income. To minimize commodity price risk on crude oil and natural gas sales, Bonterra has entered into financial derivatives. During 2020, a total of 442,500 barrels of crude oil (approximately 4,500 barrels of oil per day at certain times during the year) received fixed Edmonton Par prices ranging from $19.25 to $69.60 per barrel. The financial derivatives outstanding are for the period from January 1, 2021 to March 31, 2022 and are for a total of 773,750 barrels of light crude oil (approximately 1,750 barrels of oil per day for 2021 year and 1,500 barrels of oil per day for Q1 2022) at fixed WTI prices ranging from $36.00 USD to $68.00 USD per barrel, with a fixed differential from WTI to Edmonton Par prices in Canadian dollars for 532,750 barrels of oil (approximately 1,460 barrels of oil per day) at prices ranging from $6.34 to $8.10 per barrel. Bonterra also fixed 1,800 GJ per day of natural gas for 2021 at $2.24 per GJ. These contracts are not considered normal sales contracts and are recorded at fair value.
General and Administration (G&A) Expense
($ 000s except $ per BOE)
December 31,
2020
September 30,
2020
December 31,
2019
December 31,
2020
December 31,
2019
Employee compensation 1,412 650 1,367 3,903 4,569
Office and administrative - recurring 1,077 647 550 3,093 2,304
Total G&A recurring 2,489 1,297 1,917 6,996 6,873
Office and administrative - nonrecurring 1,287 1,531 - 2,818 -
Total G&A 3,776 2,828 1,917 9,814 6,873
$ per BOE recurring 2.68 1.41 1.68 1.81 1.53
$ per BOE nonrecurring 1.39 1.66 - 0.73 -
$ per BOE total 4.07 3.07 1.68 2.54 1.53
Three months ended Year ended
Employee compensation expense decreased by $666,000 for 2020 compared to 2019 as a result of factors relating to the COVID-19 pandemic, including reduced work weeks, lower overall compensation in the second and third quarter of 2020 and the CEWS government wage subsidy program which has benefited Bonterra since the beginning of the second quarter. Office and administrative recurring expenses for 2020 increased by $789,000 compared to the same period in 2019 primarily due to an increase in bank renewal fees. The quarter-over-quarter increase of $430,000 was primarily due to legal fees and office space costs. Non-recurring office and administrative costs are expenditures related to defending an unsolicited bid for the Company of approximately $2,255,000, with additional bank finance costs related to government programs.

14 | P a g e
Finance Costs
($ 000s except $ per BOE)
December 31,
2020
September 30,
2020
December 31,
2019
December 31,
2020
December 31,
2019
Interest on bank debt 6,566 4,476 3,337 17,352 14,540
Other interest 274 271 222 1,004 801
Interest expense 6,840 4,747 3,559 18,356 15,341
$ per BOE 7.37 5.16 3.12 4.74 3.42Unwinding of the discounted value
of decommissioning liabilities 800 780 798 3,134 3,019
Total finance costs 7,640 5,527 4,357 21,490 18,360
Three months ended Year ended
Interest on bank debt increased in 2020 compared to 2019 due to an increase in interest rates from the negative effects of COVID-19 on the Company’s net debt to earnings before income taxes and depletion and amortization (or “EBITDA” as defined by the Company’s bank facility) ratio and a new interest rate grid for the term portion of the facility, which was partially offset by a $14,815,000 decrease in the average bank debt balance outstanding. Quarter-over-quarter, interest rates increased as EBITDA decreased with commodity prices collapsing due to the COVID-19 pandemic in the second quarter, resulting in a higher interest rate grid in part of the third quarter and all of the fourth quarter. Interest rates for the current quarter are determined based on the trailing quarter and calculated by taking the ratio of total debt (excluding accounts payable and accrued liabilities) to EBITDA (defined as net income excluding finance costs, provision for current and deferred taxes, depletion and depreciation, share-option compensation, gain or loss on sale of assets and impairment of assets) multiplied by four. Other interest relates primarily to amounts paid to a related party (see related party transactions for details) and a $7,604,000 subordinated promissory note from a private investor. For more information about the subordinated promissory note, refer to Note 11 of the December 31, 2020 audited annual financial statements. A one percent increase (decrease) in the Canadian prime rate would decrease (increase) both annual net earnings and comprehensive income by approximately $1,942,000.
Share-Option Compensation
($ 000s)
December 31,
2020
September 30,
2020
December 31,
2019
December 31,
2020
December 31,
2019
Share-option compensation 194 147 319 438 2,147
Three months ended Year ended
Share-option compensation is a statistically calculated value representing the estimated expense of issuing employee stock options. The Company records a compensation expense over the vesting period based on the fair value of options granted to directors, officers and employees. Share-option compensation decreased by $1,709,000 in the twelve months of 2020 compared to 2019. This decline is primarily due to the higher share price volatility on most of the options issued in 2018 (which were fully amortized in 2019) relative to the options issued in the first and fourth quarter of 2020 (which will be fully amortized in 2021). Based on the outstanding options as of December 31, 2020, the Company has an unamortized expense of $976,000, of which $939,000 will be recorded for 2021, and $37,000 thereafter. For more information about options issued and outstanding, refer to Note 16 of the December 31, 2020 audited annual financial statements.

15 | P a g e
Depletion and Depreciation, Exploration and Evaluation (E&E) and Impairment
($ 000s)
December 31,
2020
September 30,
2020
December 31,
2019
December 31,
2020
December 31,
2019
Depletion and depreciation 14,439 13,404 23,718 59,225 89,861
Impairment of oil and gas assets - - - 331,678 -
Three months ended Year ended
The provision for depletion and depreciation (D&D) decreased in 2020 compared to 2019 primarily due to less capital to deplete and depreciate in the last three quarters of 2020 due to the impairment provision. The increase in D&D in Q4 2020 compared to Q3 2020 was due to a decrease in proved plus probable developed reserves from significantly reduced capital spending. At March 31, 2020 the Company determined that the carrying value of the Company’s Alberta cash generating unit (“CGU”) exceeded its recoverable amount. A total impairment loss of $331,678,000 was recognized, with $234,302,000 recognized on the Company’s property, plant and equipment ("PP&E"), $92,810,000 was applied to the Company’s goodwill and an additional $4,566,000 was applied to the Company’s E&E assets. The impairment loss was the result of the COVID-19 pandemic's effect on the forward commodity benchmark prices used in impairment testing at March 31, 2020. The value of the Company’s assets was estimated based on independent evaluator pricing, proved plus probable reserves and a discount rate of 15 percent. No further indicators of impairment or impairment reversals were identified as of December 31, 2020. The impairment charge does not impact the Company’s cash flow or the amount of credit available under our bank credit facilities. The impairment can be reversed in future periods up to the original carrying value less any associated D&D for PP&E assets, should there be indicators that the value of the assets has increased. For more information about PP&E and impairment, refer to Note 8 of the December 31, 2020 annual audited financial statements.
Taxes The Company recorded a deferred income tax recovery of $60,684,000 (2019 – $19,475,000). The deferred income tax recovery for 2020 was primarily due to the impairment provision taken in the first quarter of 2020, and in 2019, the deferred income tax recovery was due to a decrease in the Alberta corporate income tax rate. For additional information regarding income taxes, see Note 15 of the December 31, 2020 audited annual financial statements.
Net Earnings (Loss)
($ 000s except $ per share)
December 31,
2020
September 30,
2020
December 31,
2019
December 31,
2020
December 31,
2019
Net earnings (loss) (11,071) (5,211) (1,389) (306,889) 21,923
$ per share - basic (0.33) (0.16) (0.04) (9.19) 0.66
$ per share - diluted (0.33) (0.16) (0.04) (9.18) 0.66
Three months ended Year ended
Net earnings for 2020 decreased by $328,812,000 compared to the same period in 2019. The decrease in net earnings was primarily attributed to the impairment provision taken in Q1 2020 because of significantly reduced forward commodity benchmark prices due to the effects of the COVID-19 pandemic and lower D&D expense in the second and third quarter of 2020 from the reduced PP&E carrying value, which was partially offset by deferred income tax recovery on the impairment provision. Net earnings decreased quarter-over-quarter primarily due to increased service rig and facility maintenance as the Company continued to reactivate production, an unrealized risk management contracts loss, an increase in depletion and depreciation which was partially offset by an increase in oil and gas sales and government grants received in-kind.

16 | P a g e
Other Comprehensive Loss Other comprehensive loss for 2020 consists of an unrealized gain before tax on investments (including investment in a related party) of $7,000 relating to an increase in the investments’ fair value (December 31, 2019 – unrealized loss of $88,000). Realized gains decrease accumulated other comprehensive income as these gains are transferred to retained earnings. Other comprehensive income varies from net earnings by unrealized changes in the fair value of Bonterra’s holdings of investments, including the investment in a related party, net of tax.
Cash Flow from Operations
($ 000s except $ per share)
December 31,
2020
September 30,
2020
December 31,
2019
December 31,
2020
December 31,
2019
Cash flow from operations (1,199) 6,370 20,767 32,073 81,132
$ per share - basic (0.04) 0.19 0.62 0.96 2.43
$ per share - diluted (0.04) 0.19 0.62 0.96 2.43
Three months ended Year ended
In 2020, cash flow from operations decreased by $49,059,000 compared to 2019. This was primarily due to a decrease in oil and gas sales and non-recurring G&A costs, which was partially offset by decreased royalties and production costs and an increase in non-cash working capital. Quarter-over-quarter, cash flow from operations decreased due to an increase in production costs for reactivating production, a decrease in non-cash working capital and non-recurring G&A costs primarily related to unsolicited bid costs for the Company’s shares.
Related Party Transactions Bonterra holds 1,034,523 (December 31, 2019 – 1,034,523) common shares in Pine Cliff Energy Ltd. (“Pine Cliff”) which represents less than one percent ownership in Pine Cliff’s outstanding common shares. Pine Cliff’s common shares had a fair market value as of December 31, 2020 of $233,000 (December 31, 2019 – $155,000). The Company provides marketing services for Pine Cliff. All services performed were charged at estimated fair value. As at December 31, 2020, the Company had an account receivable from Pine Cliff of $62,000 (December 31, 2019 – $47,000). As at December 31, 2020, a loan to Bonterra provided by the Company’s CEO, Chairman of the Board and major shareholder totaled $12,366,000 (December 31, 2019 - $12,000,000). Effective April 1, 2020 to June 1, 2020 the loan’s interest rate temporarily decreased from five and a half percent to three percent and had no set repayment terms but was payable on demand. As of June 1, 2020, the interest rate was increased back to five and a half percent. Security under the debenture is over all of the Company’s assets and is subordinated to any and all claims in favour of the syndicate of senior lenders providing credit facilities to the Company. Interest paid on this loan during 2020 was $224,000 (December 31, 2019 - $421,000). Effective June 1, 2020, principal payments cannot be paid without bank approval. An additional $366,000 in interest was accrued in accounts payable and accrued liabilities and cannot be settled for cash but may be settled by the issuance of common shares. No common shares have been issued to date.
Liquidity and Capital Resources Net Debt to Cash Flow from Operations Bonterra continues to focus on monitoring overall debt while managing its cash flow and capital expenditures. The Company’s net debt to twelve-month trailing cash flow ratio as of December 31, 2020 was 9.8 to 1 times (versus 3.6 to 1 times at December 31, 2019). The increased net debt to cash flow ratio is the result of a decrease in the Company’s twelve-month trailing cash flow that is primarily due to the effect of the COVID-19 pandemic on crude oil prices and non-recurring G&A costs related to the unsolicited bid on the Company’s shares. Compared to Q4 2019, net debt at Q4 2020 increased by $22,763,000 due to an increased capital program supported by the BDC facility which is designed to allow the Company to achieve 2021 average annual production at or above pre-COVID-19 levels of approximately

17 | P a g e
13,000 BOE per day. Effective April 1, 2020 the Company suspended both its monthly dividend and capital program as crude oil prices reached record lows in May. The Company’s primary focus remains on reducing its bank debt during a period of highly volatile commodity prices. Bonterra will continue to assess its capital expenditures compared to cash flow from operations on a quarterly basis. Working Capital Deficiency and Net debt
($ 000s)
December 31,
2020
December 31,
2019
Working capital deficiency 287,412 19,745
Long-term bank debt and suboridinated debt 28,161 273,065
Net Debt 315,573 292,810
Net debt is a combination of long-term bank debt and working capital. As of December 31, 2020, the Company’s bank facility has a maturity date of June 30, 2021 and has been moved to current liabilities. Bonterra actively monitors its credit availability and working capital to ensure that it has sufficient available funds to meet its financial requirements as they come due. Any of these events present risks that could affect Bonterra’s ability to fund ongoing operations. If required, Bonterra will also consider short-term or long-term financing alternatives in order to meet its future liabilities. Net debt for December 31, 2020 increased by $22,763,000 compared to December 31, 2019 primarily due to utilizing $28 million out of the $45 million available on the BDC second lien non-revolving four-year term loan for the Company’s capital program in the fourth quarter, to return production to pre-COVID-19 levels and increase funds flow. Increased net debt was also the result of decreased cash flow in Q2 and Q3 2020 due to the effects of the COVID-19 pandemic on crude oil prices. For additional information on subordinated debt, see note 13 of the December 31, 2020 audited annual financial statements. Working capital is calculated as current assets less current liabilities. Included in the working capital deficiency as at December 31, 2020 is $19,970,000 of debt relating to the subordinated promissory note and the amount due to a related party and $252,255,000 of bank debt that was reflected in long-term debt in previous periods. Effective June 1, 2020, the Company cannot make principal payments on the related party loan or the subordinated promissory note without bank approval. Interest has been either accrued in accounts payable and accrued liabilities or settled on issuance of common shares. To date, 122,520 common shares have been issued for interest related to the subordinated promissory note. During each quarter, the Company manages net debt by monitoring capital spending relative to cash flow from operations. Financial Risk Management In order to manage commodity risk, in 2020 the Company executed physical delivery sales contracts, which are considered normal sales contracts and are not recorded at fair value in the financial statements, and also executed risk management contracts which are not considered normal sales contracts and are recorded at fair value. For more information on physical delivery and risk management contracts in place see Note 19 of the December 31, 2020 audited annual financial statements. Capital Expenditures During the year ended December 31, 2020, the Company incurred capital expenditures of $43,728,000 (December 31, 2019 - $53,627,000), primarily in the first and fourth quarters of the year. Of the total capital invested, $37,079,000 was directed to the drilling of 24 gross (23.8 net) wells and the completion, equip and tie-in of 23 gross (22.9 net) wells, of which three of the completed and equipped wells were drilled in 2019. Of the 24 wells drilled, one was not completed due to current economic prices and one well was abandoned due to subsurface fractures causing loss of well bore integrity. An amount of $1,299,000 was fully depleted for unsuccessful drill costs. An additional $6,649,000 was spent primarily on related infrastructure and recompletions. Subsequent to year end 2020, the Company completed and tied in four gross (3.8 net) wells that were drilled in 2020.

18 | P a g e
Decommissioning Liabilities Bonterra has entered into the province of Alberta’s Area-Based Closure (“ABC”) program to reduce abandonment and reclamation costs and liabilities. This program provides numerous incentives to efficiently manage decommissioning liabilities that reduce overall cost. The ABC program currently requires the Company to spend an annual commitment of approximately $3.3 million on its inactive wells, pipelines and facilities. Due to the impact of COVID-19, the current year requirement has been extended to the end of 2021. Through Alberta’s SRP and other provincial programs, Bonterra expects to reduce its inactive well count by 60 percent by the end of 2021, under current approvals. Bank Debt Bank debt represents the outstanding amounts drawn on the Company’s bank facility as described in the notes to the Company’s audited annual financial statements. On November 13, 2020, the Company’s credit facility was confirmed at $300,000,000 (December 31, 2019 - $325,000,000), comprised of a $125,000,000 syndicated revolving credit facility, a $25,000,000 non-syndicated revolving credit facility and a term loan of $150,000,000. The amount drawn under the total bank facility at December 31, 2020 was $252,255,000 (December 31, 2019 - $273,065,000). The amounts borrowed under the renewed bank facility bear interest at a floating rate based on the applicable Canadian prime rate or Banker’s Acceptance rate, plus between 2.00 percent and 10.00 percent, depending on the type of borrowing and the Company’s consolidated debt to EBITDA ratio. The terms of the total revolving bank facility provide that the loan facility is revolving to June 30, 2021, with a maturity date of December 31, 2021. The available lending limit of the bank facility is scheduled to be reviewed on June 30, 2021. Under the current credit facility, the Company is restricted from making any payment of principal or interest on account of subordinated debt or dividend distributions. In addition, the Company is also limited to expenditures each quarter which cannot:
• exceed 110 percent or be less than 90 percent of the forecasted decommissioning expenditures settled;
• exceed 110 percent of forecasted capital expenditures, and;
• exceed 110 percent of the forecasted operating expenses. The Company was within all forecasted expenditure limits for the year ended December 31, 2020. As at December 31, 2020, Bonterra classified its bank debt as a current liability and had a working capital deficiency. The Company was in compliance with all financial covenants on its total bank facility as at December 31, 2020. After examining the economic factors that are causing the liquidity risk facing the Company, the judgment applied to these factors, and the various initiatives that the Company has and will undertake to strengthen its financial position, the Company believes it will have sufficient liquidity to support its ongoing operations and meet its current financial obligations as they come due for at least the next twelve months. There can be no assurance that the borrowing base review will not result in a material reduction in the borrowing base, and that the necessary funds will be available to meet its obligations as they become due, subject to other alternative sources of financing. Advances drawn under the bank facility are secured by a fixed and floating charge debenture over the assets of the Company. In the event the bank facility is not extended or renewed, amounts drawn under the facility would be due and payable on the maturity date. The size of the committed credit facilities is based primarily on the value of the Company’s producing petroleum and natural gas assets and related tangible assets as determined by the lenders. For more information see Note 12 of the December 31, 2020 annual audited financial statements. Shareholders’ Equity The Company is authorized to issue an unlimited number of common shares without nominal or par value. The Company is also authorized to issue an unlimited number of Class “A” redeemable Preferred Shares and an unlimited number of Class “B” Preferred Shares. There are currently no outstanding Class “A” redeemable Preferred Shares or Class “B” Preferred Shares.

19 | P a g e
Issued and fully paid - common shares Number
Amount
($ 000s) Number
Amount
($ 000s)
Balance, beginning of year 33,388,796 765,276 33,388,796 765,276
Issued pursuant to the Company's share option plan - - - -
Transfer from contributed surplus to share capital
Shares issued for interest on subordinated debt 122,520 139 - -
Balance, end of year 33,511,316 765,415 33,388,796 765,276
December 31, 2020 December 31, 2019
The Company provides a stock option plan for its directors, officers and employees. Under the plan, the Company may grant options for up to 3,351,131 (December 31, 2019 – 3,338,880) common shares. The exercise price of each option granted will not be lower than the market price of the common shares on the date of grant and the option’s maximum term is five years. For additional information regarding options outstanding, see Note 16 of the December 31, 2020 annual audited financial statements.
Dividend Policy For the year ended December 31, 2020, the Company declared and paid dividends of $1,002,000 ($0.03 per share) (December 31, 2019 – $4,007,000) ($0.12 per share). Bonterra’s dividend policy is regularly monitored and is dependent upon production, commodity prices, cash flow from operations, debt levels and capital expenditures. On March 10, 2020, the Company’s Board of Directors elected to suspend its monthly dividend, commencing on April 1, 2020. This is in response to the significant reduction in commodity pricing. Quarterly Financial Information
For the periods ended
($ 000s except $ per share) Q4 Q3 Q2 Q1
Revenue - oil and gas sales 31,761 29,155 22,171 38,555
Cash flow from operations (1,199) 6,370 4,429 22,473
Net earnings (loss) (11,071) (5,211) (5,954) (284,653)
Per share - basic (0.33) (0.16) (0.18) (8.53)
Per share - diluted (0.33) (0.16) (0.18) (8.53)
2020
For the periods ended
($ 000s except $ per share) Q4 Q3 Q2 Q1
Revenue - oil and gas sales 50,743 47,320 54,852 49,834
Cash flow from operations 20,767 19,774 25,468 15,123
Net loss (1,389) (1,276) 23,131 1,457
Per share - basic (0.04) (0.04) 0.69 0.04
Per share - diluted (0.04) (0.04) 0.69 0.04
2019
The fluctuations in the Company’s revenue and net earnings from quarter-to-quarter are caused by variations in production volumes, realized commodity pricing and the related impact on royalties, production, G&A and finance costs. In 2020, the Company’s net earnings significantly decreased mainly due to the effect of the COVID-19 pandemic on crude oil demand. Cash flow from operations also decreased in the second quarter of 2020 due to low commodity prices in the peak of COVID-19’s effect on oil prices. Although prices increased since the second quarter of 2020 the Company incurred $2,255,000 of costs related to an unsolicited bid and an increase in bank finance costs which negatively impacted cash flow. With the utilization of the BDC funding on the Company’s capital program and well reactivation costs in the fourth quarter of 2020, the Company expects higher production and cash flow from
20 | P a g e
operations in the first quarter of 2021. Net earnings for Q2 2019 increased due to a deferred tax recovery from a decrease in the Alberta corporate income tax rate.
Critical Accounting Estimates
There have been no changes to the Company’s critical accounting policies and estimates as of the period ended in the financial statements.
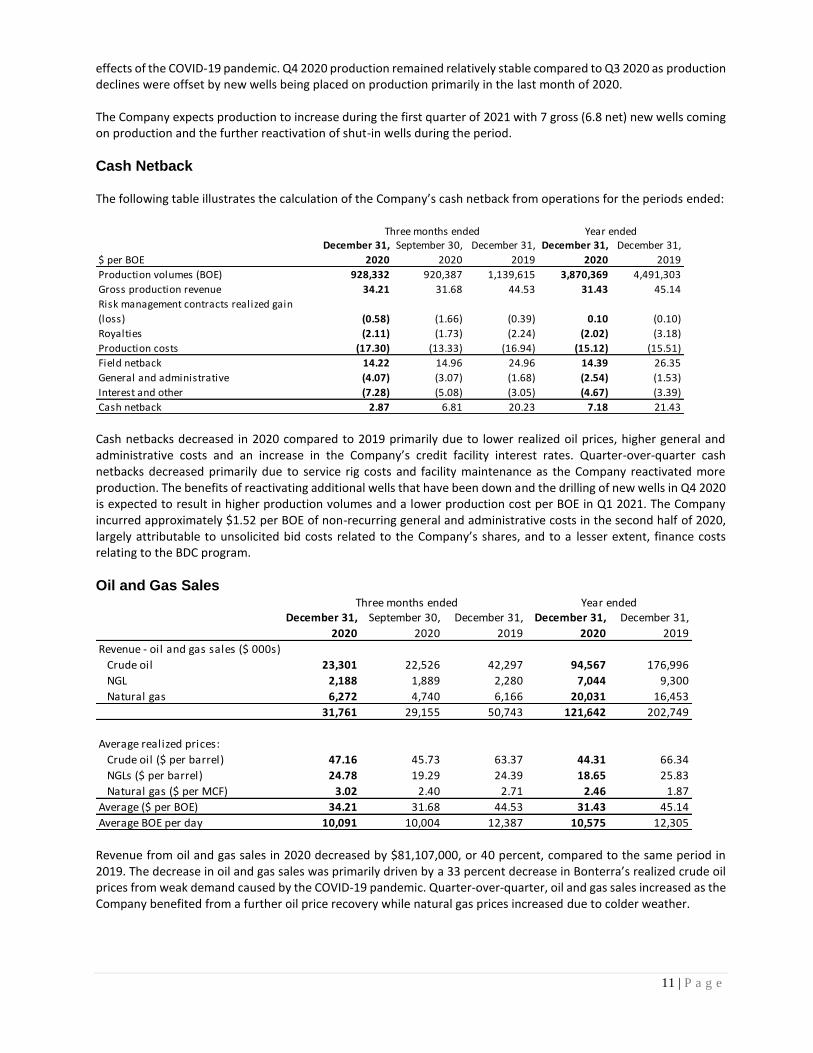
Forward-Looking Information
Certain statements contained in this MD&A include statements which contain words such as “anticipate”, “could”, “should”, “expect”, “seek”, “may”, “intend”, “likely”, “will”, “believe” and similar expressions, relating to matters that are not historical facts, and such statements of our beliefs, intentions and expectations about development, results and events which will or may occur in the future, constitute “forward-looking information” within the meaning of applicable Canadian securities legislation and are based on certain assumptions and analysis made by us derived from our experience and perceptions. Forward-looking information in this MD&A includes, but is not limited to: expected cash provided by continuing operations; cash dividends; future capital expenditures, including the amount and nature thereof; oil and natural gas prices and demand; expansion and other development trends of the oil and gas industry; business strategy and outlook; expansion and growth of our business and operations; and maintenance of existing customer, supplier and partner relationships; supply channels; accounting policies; credit risks; and other such matters. All such forward-looking information is based on certain assumptions and analyses made by us in light of our experience and perception of historical trends, current conditions and expected future developments, as well as other factors we believe are appropriate in the circumstances. The risks, uncertainties, and assumptions are difficult to predict and may affect operations, and may include, without limitation: foreign exchange fluctuations; equipment and labour shortages and inflationary costs; general economic conditions; industry conditions; changes in applicable environmental, taxation and other laws and regulations as well as how such laws and regulations are interpreted and enforced; the ability of oil and natural gas companies to raise capital; the effect of weather conditions on operations and facilities; the existence of operating risks; volatility of oil and natural gas prices; oil and gas product supply and demand; risks inherent in the ability to generate sufficient cash flow from operations to meet current and future obligations; increased competition; stock market volatility; opportunities available to or pursued by us; and other factors, many of which are beyond our control. The foregoing factors are not exhaustive. Actual results, performance or achievements could differ materially from those expressed in, or implied by, this forward-looking information and, accordingly, no assurance can be given that any of the events anticipated by the forward-looking information will transpire or occur, or if any of them do, what benefits will be derived therefrom. Except as required by law, Bonterra disclaims any intention or obligation to update or revise any forward-looking information, whether as a result of new information, future events or otherwise. The forward-looking information contained herein is expressly qualified by this cautionary statement. Disclosure Controls and Procedures
Disclosure controls and procedures (“DC&P”), as defined in National Instrument 52-109 Certification of Disclosure in
Issuers’ Annual and Interim Filings, are designed to provide reasonable assurance that information required to be
disclosed in the Company’s annual filings, interim fillings or other reports filed, or submitted by the Company under
securities legislation is recorded, processed, summarized and reported within the time periods specified under
securities legislation and include controls and procedures designed to ensure that information required to be
disclosed is accumulated and communicated to management, including the Chief Executive Officer and Chief Financial
Officer, as appropriate, to allow timely decisions regarding required disclosure. The Chief Executive Officer and Chief
financial Officer of Bonterra evaluated the effectiveness of the design and operation of the Company’s DC&P. Based
on that evaluation, the Chief Executive Officer and the Chief Financial Officer concluded that Bonterra’s DC&P were
effective at December 31, 2020.

21 | P a g e
Internal Controls Over Financial Reporting Internal control over financial reporting (“ICFR”), as defined in National Instrument 52-109, includes those policies and procedures that:
1. Pertain to the maintenance of records that, in reasonable detail, accurately and fairly reflect transactions and
dispositions of Bonterra;
2. Are designed to provide reasonable assurance that transactions are recorded as necessary to permit preparation
of financial statements in accordance with generally accepted accounting principles and that receipts and
expenditures of Bonterra are being made in accordance with authorizations of management and Directors of
Bonterra; and
3. Are designed to provide reasonable assurance regarding prevention or timely detection of authorized
acquisition, use, or disposition of the Company’s assets that could have a material effect on the financial
statements.
The CEO and CFO have designed, or caused to be designed under their supervision, ICFR as defined in National Instrument 52-109 of the Canadian Securities Administrators, in order to provide reasonable assurance regarding the reliability of financial reporting and the preparation of financial statements for external purposes in accordance with IFRS. The control framework the Company used to design its ICFR was in accordance with the Committee of Sponsoring Organizations of the Treadway Commission (COSO 2013). The Company’s CEO and CFO have evaluated, or caused to be evaluated under their supervision, the effectiveness of the Company’s internal controls over financial reporting at the financial period end of the Company and concluded that such internal controls over financial reporting are effective as of December 31, 2020. It should be noted that while Bonterra’s CEO and CFO believe that the Company’s internal controls and procedures provide a reasonable level of assurance and are effective; they do not expect that these controls will prevent all errors and fraud.

22 | P a g e
MANAGEMENT’S RESPONSIBILITY FOR FINANCIAL STATEMENTS The information provided in this report, including the financial statements, is the responsibility of management. The timely preparation of the financial statements requires that management make estimates and use judgment regarding the reported amounts of assets and liabilities and disclosures of contingent assets and liabilities as at the date of the financial statements and the reported amounts of revenues and expenses during the period. Such estimates primarily relate to unsettled transactions and events as at the date of the financial statements. Accordingly, actual results may differ from estimated amounts as future confirming events occur. Management believes such estimates have been based on careful judgments and have been properly reflected in the accompanying financial statements. Management maintains a system of internal controls to provide reasonable assurance that the Company’s assets are safeguarded and to facilitate the preparation of relevant and timely information. Deloitte LLP has been appointed by the Shareholders to serve as the Company’s external auditors. They have examined the financial statements and provided their auditor’s report. The audit committee has reviewed these financial statements with management and the auditors, and has reported to the Board of Directors. The Board of Directors has approved the financial statements as presented in this annual report. “Signed George F. Fink” “Signed Robb D. Thompson” George F. Fink Robb D. Thompson Chief Executive Officer and Chief Financial Officer Chairman of the Board March 9, 2021 March 9, 2021

23 | P a g e
INDEPENDENT AUDITOR’S REPORT To the Shareholders of Bonterra Energy Corp. Opinion We have audited the financial statements of Bonterra Energy Corp. (the “Company”), which comprise the statements of financial position as at December 31, 2020 and 2019, and the statements comprehensive income, cash flow and changes in equity for the years then ended, and notes to the financial statements, including a summary of significant accounting policies (collectively referred to as the “financial statements”). In our opinion, the accompanying financial statements present fairly, in all material respects, the financial position of the Company as at December 31, 2020 and 2019, and its financial performance and its cash flows for the years then ended in accordance with International Financial Reporting Standards (“IFRS”). Basis for Opinion We conducted our audit in accordance with Canadian generally accepted auditing standards (“Canadian GAAS”). Our responsibilities under those standards are further described in the Auditor’s Responsibilities for the Audit of the Financial Statements section of our report. We are independent of the Company in accordance with the ethical requirements that are relevant to our audit of the financial statements in Canada, and we have fulfilled our other ethical responsibilities in accordance with these requirements. We believe that the audit evidence we have obtained is sufficient and appropriate to provide a basis for our opinion. Key Audit Matters Key audit matters are those matters that, in our professional judgment, were of most significance in our audit of the financial statements for the year ended December 31, 2020. These matters were addressed in the context of our audit of the financial statements as a whole, and in forming our opinion thereon, and we do not provide a separate opinion on these matters.
Property, Plant and Equipment - Oil and gas properties - Refer to Notes 4 and 8 to the financial statements
Key Audit Matter Description
The Company’s property, plant and equipment includes oil and gas properties. Oil and gas properties are measured by depleting the assets on a unit-of-production basis (“depletion”) and are evaluated for impairment using the future net cash flows of the underlying proved plus probable crude oil and natural gas reserves. The Company engages an independent reserve evaluator to estimate crude oil and natural gas reserves using estimates, assumptions and engineering data. The development of the Company’s reserves and the related future net cash flows used to evaluate any impairment requires management to make significant estimates and assumptions related to crude oil and natural gas prices, discount rates, reserves, and future costs.
Given the significant judgments made by management related to future crude oil and natural gas prices, discount rates, reserves, and future operating and development costs, these estimates and assumptions are subject to a high degree of estimation uncertainty. Auditing these estimates and assumptions required auditor judgement in applying audit procedures and in evaluating the results of those procedures. This resulted in an increased extent of audit effort including the involvement of fair value specialists.
How the Key Audit Matter Was Addressed in the Audit
Our audit procedures related to future crude oil and natural gas prices, discount rates, reserves, and future operating and development costs used to measure oil and gas properties included the following, among others:
• With the assistance of fair value specialists, o Evaluated future crude oil and natural gas prices by independently developing a reasonable range
of forecasts based on reputable third-party forecasts and market data and comparing those to the

24 | P a g e
future crude oil and natural gas prices selected by management. o Evaluated the reasonableness of the discount rates by testing the source information underlying the
determination of the discount rates and developing a range of independent estimates and comparing those to the discount rates selected by management.
• Evaluated the Company’s independent reserve evaluator: o Examining reports and assessed their scope of work and findings. o Assessing the competence, capability and objectivity by evaluating their relevant professional
qualifications and experience.
• Evaluated the reasonableness of reserves by testing the source financial information underlying the reserves and comparing the reserve volumes to historical production volumes.
• Evaluated the reasonableness of future operating and development costs by testing the source financial information underlying the estimate, comparing future operating and development costs to historical results, and evaluating whether they are consistent with evidence obtained in other areas of the audit.
• Performed a retrospective review to evaluate management’s ability to accurately forecast and to assess for indications of estimation bias over time.
Other Information Management is responsible for the other information. The other information comprises:
● Management’s Discussion and Analysis
● The information, other than the financial statements and our auditor’s report thereon, in the Annual Report.
Our opinion on the financial statements does not cover the other information and we do not and will not express any form of assurance conclusion thereon. In connection with our audit of the financial statements, our responsibility is to read the other information identified above and, in doing so, consider whether the other information is materially inconsistent with the financial statements or our knowledge obtained in the audit, or otherwise appears to be materially misstated. We obtained Management’s Discussion and Analysis prior to the date of this auditor’s report. If, based on the work we have performed on this other information, we conclude that there is a material misstatement of this other information, we are required to report that fact in this auditor’s report. We have nothing to report in this regard. The Annual Report is expected to be made available to us after the date of the auditor’s report. If, based on the work we will perform on this other information, we conclude that there is a material misstatement of this other information, we are required to report that fact to those charged with governance. Responsibilities of Management and Those Charged with Governance for the Financial Statements
Management is responsible for the preparation and fair presentation of the financial statements in accordance with IFRS, and for such internal control as management determines is necessary to enable the preparation of financial statements that are free from material misstatement, whether due to fraud or error. In preparing the financial statements, management is responsible for assessing the Company’s ability to continue as a going concern, disclosing, as applicable, matters related to going concern and using the going concern basis of accounting unless management either intends to liquidate the Company or to cease operations, or has no realistic alternative but to do so. Those charged with governance are responsible for overseeing the Company’s financial reporting process.

25 | P a g e
Auditor’s Responsibilities for the Audit of the Financial Statements Our objectives are to obtain reasonable assurance about whether the financial statements as a whole are free from material misstatement, whether due to fraud or error, and to issue an auditor’s report that includes our opinion. Reasonable assurance is a high level of assurance, but is not a guarantee that an audit conducted in accordance with Canadian GAAS will always detect a material misstatement when it exists. Misstatements can arise from fraud or error and are considered material if, individually or in the aggregate, they could reasonably be expected to influence the economic decisions of users taken on the basis of these financial statements. As part of an audit in accordance with Canadian GAAS, we exercise professional judgment and maintain professional skepticism throughout the audit. We also:
● Identify and assess the risks of material misstatement of the financial statements, whether due to fraud or error, design and perform audit procedures responsive to those risks, and obtain audit evidence that is sufficient and appropriate to provide a basis for our opinion. The risk of not detecting a material misstatement resulting from fraud is higher than for one resulting from error, as fraud may involve collusion, forgery, intentional omissions, misrepresentations, or the override of internal control.
● Obtain an understanding of internal control relevant to the audit in order to design audit procedures that are appropriate in the circumstances, but not for the purpose of expressing an opinion on the effectiveness of the Company’s internal control.
● Evaluate the appropriateness of accounting policies used and the reasonableness of accounting estimates and related disclosures made by management.
● Conclude on the appropriateness of management’s use of the going concern basis of accounting and, based on the audit evidence obtained, whether a material uncertainty exists related to events or conditions that may cast significant doubt on the Company’s ability to continue as a going concern. If we conclude that a material uncertainty exists, we are required to draw attention in our auditor’s report to the related disclosures in the financial statements or, if such disclosures are inadequate, to modify our opinion. Our conclusions are based on the audit evidence obtained up to the date of our auditor’s report. However, future events or conditions may cause the Company to cease to continue as a going concern.
● Evaluate the overall presentation, structure and content of the financial statements, including the disclosures, and whether the financial statements represent the underlying transactions and events in a manner that achieves fair presentation.
We communicate with those charged with governance regarding, among other matters, the planned scope and timing of the audit and significant audit findings, including any significant deficiencies in internal control that we identify during our audit. We also provide those charged with governance with a statement that we have complied with relevant ethical requirements regarding independence, and to communicate with them all relationships and other matters that may reasonably be thought to bear on our independence, and where applicable, related safeguards. From the matters communicated with those charged with governance, we determine those matters that were of most significance in the audit of the financial statements of the current period and are therefore the key audit matters. We describe these matters in our auditor's report unless law or regulation precludes public disclosure about the matter or when, in extremely rare circumstances, we determine that a matter should not be communicated in our report because the adverse consequences of doing so would reasonably be expected to outweigh the public interest benefits of such communication.

26 | P a g e
The engagement partner on the audit resulting in this independent auditor’s report is David Langlois. “Signed Deloitte LLP” Chartered Professional Accountants Calgary, Alberta March 9, 2021

27 | P a g e
STATEMENT OF FINANCIAL POSITION
As at
($ 000s) Note
Assets
Current
Accounts receivable 12,891 21,764
Crude oil inventory 598 672
Prepaid expenses 3,920 3,908
Investments 62 131
17,471 26,475
Investment in related party 6 233 155
Exploration and evaluation assets 7 373 3,980
Property, plant and equipment 8 704,921 955,536
Investment tax credit receivable 15 8,861 8,861
Goodwill 8 - 92,810
731,859 1,087,817
Liabilities
Current
Accounts payable and accrued liabilities 9 28,229 25,423
Risk management contract 19 3,599 134
Due to related party 10 12,366 12,000
Subordinated promissory note 11 7,604 7,500
Bank debt 12 252,255 -
Deferred consideration 830 1,163
304,883 46,220
Bank debt 12 - 273,065
Subordinated debt 13 28,161 -
Deferred consideration 11,709 12,266
Decommissioning liabilities 14 137,002 138,171
Deferred tax liability 15 53,471 114,146
535,226 583,868
Shareholders' equity
Share capital 16 765,415 765,276
Contributed surplus 30,672 30,234
Accumulated other comprehensive loss (750) (748)
Deficit (598,704) (290,813)
196,633 503,949
731,859 1,087,817
Commitments and contingencies 20
Subsequent events 13, 19
December 31,
2020
December 31,
2019
See accompanying notes to these financial statements. On behalf of the Board:
“Signed George F. Fink” “Signed Rodger A. Tourigny” George F. Fink Rodger A. Tourigny
Director Director

28 | P a g e
STATEMENT OF COMPREHENSIVE INCOME
For the year ended December 31
($ 000s, except $ per share) Note 2020 2019
Revenue
Oil and gas sales, net of royalties 17 113,821 188,475
Other income 18 1,950 283
Deferred consideration 889 1,273
Loss on risk management contracts 19 (3,063) (577)
113,597 189,454
Expenses
Production 58,525 69,673
Office and administration 5,911 2,304
Employee compensation 21 3,903 4,569
Finance costs 5 21,490 18,360
Share-option compensation 438 2,147
Depletion and depreciation 8 59,225 89,861
Impairment of oil and gas assets 8 331,678 -
481,170 186,914
Earnings (loss) before income taxes (367,573) 2,540
Taxes
Current income tax expense 15 - 92
Deferred income tax recovery 15 (60,684) (19,475)
(60,684) (19,383)
Net earnings (loss) for the year (306,889) 21,923
Other comprehensive income (loss)
Unrealized gain (loss) on investments 7 (88) Deferred taxes on unrealized loss (gain) on investments (9) 4
Other comprehensive loss for the year (2) (84)
Total comprehensive income (loss) for the year (306,891) 21,839
Net earnings (loss) per share - basic and diluted 16 (9.19) 0.66
Comprehensive income (loss) per share - basic and diluted 16 (9.19) 0.65
See accompanying notes to these financial statements.

29 | P a g e
STATEMENT OF CASH FLOW
For the years ended December 31
($ 000s) Note 2020 2019
Operating activities
Net earnings (loss) (306,889) 21,923
Items not affecting cash
Deferred income taxes (60,684) (19,475)
Deferred consideration (889) (1,273)
Share-option compensation 438 2,147
Gain on sale of property and equipment - (75)
Unrealized loss on risk management contracts 19 3,465 134
Depletion and depreciation 59,225 89,861
Government grant in-kind 21 (1,689) -
Impairment of oil and gas assets 331,678 -
Unwinding of the discount on decommissioning liabilities 14 3,134 3,019
Investment income (50) (64)
Interest expense 18,357 15,340
Change in non-cash working capital accounts:
Accounts receivable 8,917 (13,854)
Crude oil inventory 20 (10)
Prepaid expenses (12) (725)
Accounts payable and accrued liabilities (2,655) 2,129
Decommissioning expenditures 14 (2,706) (2,605)
Interest paid (17,587) (15,340)
Cash provided by operating activities 32,073 81,132
Financing activities
Decrease of bank debt (20,810) (25,595)
Subordinated promissory note - (2,500)
Subordinated debt 28,000 -
Dividends (1,002) (4,007)
Cash provided (used) by financing activities 6,188 (32,102)
Investing activities
Investment income received 50 64
Exploration and evaluation expenditures 7 (959) -
Property, plant and equipment expenditures 8 (42,769) (53,627)
Proceeds on sale of property - 95
Change in non-cash working capital accounts:
Accounts payable and accrued liabilities 5,461 4,551
Accounts receivable (44) (113)
Cash used in investing activities (38,261) (49,030)
Net change in cash in the year - -
Cash, beginning of year - -
See accompanying notes to these financial statements.
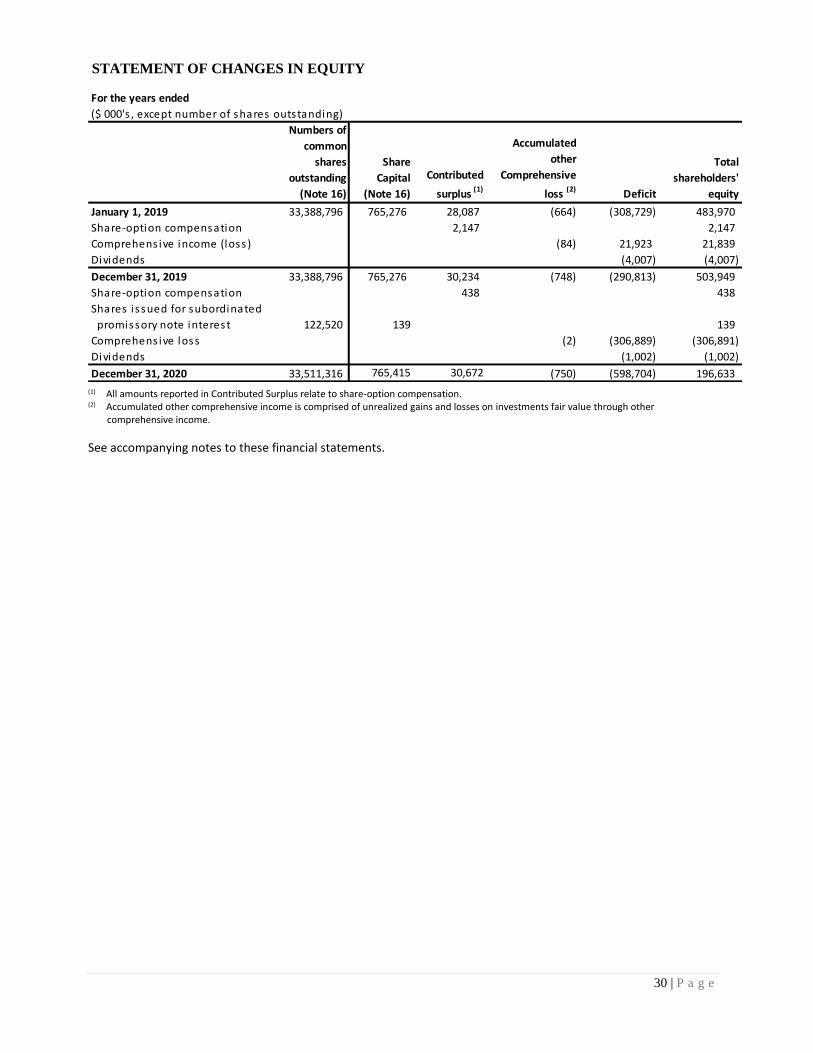
30 | P a g e
STATEMENT OF CHANGES IN EQUITY
For the years ended
($ 000's , except number of shares outstanding)
Numbers of
common
shares
outstanding
(Note 16)
Share
Capital
(Note 16)
Contributed
surplus (1)
Accumulated
other
Comprehensive
loss (2)
Deficit
Total
shareholders'
equity
January 1, 2019 33,388,796 765,276 28,087 (664) (308,729) 483,970
Share-option compensation 2,147 2,147
Comprehens ive income (loss ) (84) 21,923 21,839
Dividends (4,007) (4,007)
December 31, 2019 33,388,796 765,276 30,234 (748) (290,813) 503,949
Share-option compensation 438 438
Shares i ssued for subordinated
promissory note interest 122,520 139 139
Comprehens ive loss (2) (306,889) (306,891)
Dividends (1,002) (1,002)
December 31, 2020 33,511,316 765,415 30,672 (750) (598,704) 196,633
(1) All amounts reported in Contributed Surplus relate to share-option compensation. (2) Accumulated other comprehensive income is comprised of unrealized gains and losses on investments fair value through other
comprehensive income.
See accompanying notes to these financial statements.

31 | P a g e
NOTES TO THE FINANCIAL STATEMENTS As at and for the years ended December 31, 2020 and 2019.
1. NATURE OF BUSINESS AND SEGMENT INFORMATION Bonterra Energy Corp. (“Bonterra” or the “Company”) is a public company listed on the Toronto Stock Exchange (the “TSX”) and incorporated under the Business Corporations Act (Alberta). The address of the Company’s registered office is Suite 901, 1015-4th Street SW, Calgary, Alberta, Canada, T2R 1J4. Bonterra operates in one industry and has only one reportable segment which is the development and production of oil and natural gas in the Western Canadian Sedimentary Basin.
2. BASIS OF PREPARATION AND FUTURE OPERATIONS
a) Statement of Compliance These financial statements have been prepared by management in accordance with International Financial Reporting Standards (IFRS). The financial statements were authorized for issue by the Company’s Board of Directors on March 9, 2021. b) Basis of Measurement These financial statements have been prepared on a historical cost basis, except for certain financial instruments and share-based payment transactions which are measured at fair value. c) Functional and Presentation Currency
The Company’s functional and presentation currency is the Canadian dollar. Foreign currency denominated monetary assets and liabilities are translated into Canadian dollars at the rates prevailing on the reporting date. Non-monetary assets and liabilities are translated into Canadian dollars at the rates prevailing on the transaction dates. Exchange gains and losses are recorded as income or expense in the period in which they occur. d) Significant Accounting Estimates and Judgments
The timely preparation of financial statements requires management to make estimates and assumptions that affect the reported amounts of assets and liabilities and disclosure of contingent assets and liabilities as at the date of the statement of financial position as well as the reported amounts of revenues, expenses and cash flows during the periods presented. Such estimates relate primarily to unsettled transactions and events as of the date of the financial statements. Actual results could differ materially from estimated amounts. See Note 4 for more information.
3. SIGNIFICANT ACCOUNTING POLICIES a) Revenue Recognition
Revenue associated with the sale of crude oil, natural gas and natural gas liquids is measured based on the consideration specified in contracts with customers. Revenue from contracts with customers is recognized when or as Bonterra satisfies a performance obligation by transferring a promised good or service to a customer. A good or service is transferred when the customer obtains control of that good or service. The transfer of control of oil, natural gas, and natural gas liquids usually coincides with title passing to the customer and the customer taking physical possession. The Company principally satisfies its performance obligations at a point in time and the amounts of revenue recognized relating to performance obligations satisfied over time are not significant. Collection of revenue

32 | P a g e
associated with the sale of crude oil, natural gas and natural gas liquids occurs on or about the 25th of the month following production. Items such as royalties for crown, freehold, gross overriding (GORR) and Saskatchewan surcharge are netted against revenue. These items are netted to reflect the deduction for other parties’ proportionate share of the revenue. Administration fee income is recorded when services are provided. b) Joint Arrangements
Certain exploration, development and production activities are conducted jointly with others. These financial statements reflect only the Company’s interests in such activities. A jointly controlled operation involves the use of assets and other resources of the Company and those of other joint venture participants through contractual arrangements rather than through the establishment of a corporation, partnership or other entity. The Company has no interests in jointly controlled entities. The Company recognizes in its financial statements its interest in assets that it owns, the liabilities and expenses that it incurs and its share of income earned by the joint arrangement. c) Inventories
Inventories consist of crude oil. Crude oil stored in the Company’s tanks is valued on a first-in, first-out basis at the
lower of cost or net realizable value. The inventory cost for crude oil is determined based on the combined average
per barrel operating costs, and depletion and depreciation for the period, while net realizable value is determined
based on estimated sales price less transportation costs.
d) Investments and Investment in Related Party
Investments and investment in related party consist of equity securities. The Company’s investments are measured as fair value through other comprehensive income (“FVTOCI”), with gains or losses arising from changes in fair value recognized in other comprehensive income and accumulated in the fair value instrument. The cumulative gain or loss will not be reclassified to profit or loss on disposal of the investments. Fair value is determined by multiplying the period end trading price of the investments by the number of common shares held as at period end. e) Exploration and Evaluation Assets
General exploration and evaluation (“E&E”) expenditures incurred prior to acquiring the legal right to explore are charged to expense as incurred. E&E expenditures represent undeveloped land costs, licenses and exploration well costs. Undeveloped land costs, licenses and exploration well costs are initially capitalized and, if subsequently determined
to have not found sufficient reserves to justify commercial production, are charged to expense. E&E assets continue
to be capitalized as long as sufficient progress is being made to assess the reserves and economic viability of the asset.
Once technical feasibility and commercial viability has been established, E&E assets are transferred to property, plant
and equipment (“PP&E”). E&E assets are assessed for impairment annually, upon transfer to PP&E assets or whenever
indications of impairment exist to ensure they are not at amounts above their recoverable amounts.
f) Property, Plant and Equipment
PP&E assets include transferred-in E&E costs, development drilling and other subsurface expenditures. PP&E assets are carried at cost less depletion and depreciation of all development expenditures and include all other expenditures associated with PP&E assets. Oil and Gas Properties
The initial cost of an asset is comprised of its purchase price or construction cost, including expenditures such as drilling costs; the present value of the initial and changes in the estimate of any decommissioning obligation associated

33 | P a g e
with the asset; and finance charges on qualifying assets that are directly attributable to bringing the asset into operation and to its present location.
Production Facilities
Production facilities are comprised of costs related to petroleum and natural gas plant and production equipment. Leases Leases or contractual obligations are capitalized as right of use assets (“ROUs”) with a corresponding right of use lease obligation using the present value of future lease payments on the statement of financial position. The discount rate used to determine the ROU is the stated rate in the lease contract. If no discount rate is provided, the Company’s incremental borrowing rate is used. Certain lease payments will continue to be expensed in the statement of comprehensive income. These leases are contractual obligations that contain any of the following: are equal to or less than twelve months; are for oil and gas extraction; are variable payments; the Company does not control the asset; or no asset is identified in the lease. Depletion and Depreciation
Depletion and depreciation is recognized in the statement of comprehensive income (loss). PP&E properties, excluding surface costs are depleted using the unit-of-production method over their proved plus probable developed reserve life, when commercial production in an area has commenced. Proved plus probable developed reserves are determined annually by qualified independent reserve engineers. Changes in factors such as estimates of proved plus probable developed reserves that affect unit-of-production calculations are accounted for on a prospective basis. Surface costs such as production facilities and furniture, fixtures and other equipment are depreciated over their estimated useful lives. Production facilities, furniture, fixtures and other equipment are depreciated over the individual assets estimated economic lives, less estimated salvage value of the assets at the end of their useful lives. These assets are depreciated as follows: Production facilities Declining balance method at 10 percent per year Furniture, fixtures and other equipment Declining balance method at 10 to 20 percent per year Right of use assets Straight line method over the term of the associated lease g) Business Combinations and Goodwill
The purchase price used in a business combination is based on the fair value at the date of acquisition. The business combination is accounted for based on the fair value of the assets acquired and liabilities assumed. All acquisition costs are expensed as incurred. Contingent liabilities are recognized at fair value at the date of the acquisition, and subsequently re‐measured at each reporting period until settled. The excess of cost over fair value of the net assets and liabilities acquired is recorded as goodwill. h) Impairment of Assets
Impairment of Financial Assets
A financial asset is considered to be impaired if objective evidence indicates that one or more events have had a negative effect on the estimated future cash flow of that asset. An impairment loss in respect of a financial asset measured at amortized cost is calculated as the difference between its carrying amount and the present value of the estimated future cash flow discounted at the original effective interest rate. Significant financial assets are tested for impairment on an individual basis. The remaining financial assets are assessed collectively in groups that share similar credit risk characteristics.

34 | P a g e
All impairment losses are recognized in net earnings. An impairment loss is reversed if there is an indicator that the impairment reversal can be related objectively to an event occurring after the impairment loss was recognized. Any subsequent recovery of an impairment loss in respect of an investment in an equity instrument classified as FVTOCI is reversed through other comprehensive income instead of net earnings. For financial assets measured at amortized cost, the reversal is recognized in net earnings. Impairment of Non-Financial Assets
The carrying amounts of the Company's non-financial assets are reviewed at the end of each reporting period to determine whether there is any indication of impairment. If such indication exists, then the assets’ carrying amounts are assessed for impairment. For the purpose of impairment testing, assets (which include E&E, PP&E and goodwill) are grouped together into the smallest group of assets that generate cash flows from continuing use which are largely independent of the cash flow of other assets or groups of assets (the cash-generating unit or “CGU”). Goodwill is allocated to the CGU expected to benefit from the synergies of the combination. The recoverable amount of an asset or a CGU is the greater of its value-in-use (“VIU”) and its fair value less costs to sell (“FVLCS”). The Company has a core CGU composed of its Alberta properties and secondary CGUs for its British Columbia (BC) and Saskatchewan properties. An impairment loss is recognized if the carrying amount of an asset or its CGU exceeds its recoverable amount. Impairment losses are recognized in the statement of comprehensive income (loss). Impairment losses recognized in respect of a CGU are allocated first to reduce the carrying amount of any goodwill allocated to the CGU and then to reduce the carrying amount of the other assets of the CGU on a pro-rata basis. In respect of assets other than goodwill, impairment losses recognized in prior periods are assessed at each reporting date for any indications that the impairment loss has reversed. If the amount of the impairment loss reverses in a subsequent period and the reversal can be objectively related to an event occurring after the impairment was recognized, the impairment loss is reversed only to the extent that the asset's carrying amount does not exceed the carrying amount that would have been determined, net of depletion and depreciation, if no impairment loss had been recognized and recorded in the statement of comprehensive income (loss). An impairment loss in respect of goodwill cannot be reversed. i) Deferred Consideration
Deferred consideration is generated when a sale of a royalty interest linked to production at a specific property occurs. Consideration is given to the specific terms of each arrangement to determine whether a disposal of an interest in the reserves of the respective property has occurred and whether the counterparty is entitled to the associated risks and rewards attributable to the property over its estimated life. These include the contractual terms and implicit obligations related to production, such as the holder of the royalty having the option of either being paid in cash or in kind and the associated commitments, if any, to develop future expansions or projects at the property. Proceeds for sale of a royalty interest on petroleum properties are then attributed to two components: a payment for partial disposal of an interest in PP&E; and an upfront payment received for future extraction services that will generate future royalties. Discounted future cash flows of future development and operating costs multiplied by the royalty rate are used to derive the upfront payment received for future extraction services, which is accounted for as deferred consideration and recognized as revenue over the reserve life of the encumbered properties (as this represents the efforts incurred towards the extraction performance obligation). Upon commencement of the royalty interest the deferred consideration is depleted (recognized into revenue) using the same unit-of-production method as the depletion of the encumbered PP&E asset’s carrying value. j) Decommissioning Liabilities
The fair value of the statutory, contractual, constructive or legal liabilities associated with the retirement and reclamation of oil and gas properties is recorded when incurred, with a corresponding increase to the carrying amount

35 | P a g e
of the related PP&E. The amount recognized is the estimated cost of decommissioning, discounted to its present value using the Company’s risk-free rate. Changes in the estimated timing of decommissioning or decommissioning cost estimates and changes to the risk-free rates are dealt with prospectively by recording an adjustment to the decommissioning liabilities, and a corresponding adjustment to PP&E. The unwinding of the discount on the decommissioning provision is charged to net earnings as a finance cost. The Company recognizes a decommissioning liability in the period in which it is incurred when a reasonable estimate of the liability can be made. On a periodic basis, management will review these estimates and changes and if there are any, they will be applied prospectively. The fair value of the estimated provision is recorded as a long-term liability, with a corresponding increase in the carrying amount of the related asset. The capitalized amount is depleted on a unit-of-production basis over the life of the proved plus probable developed reserves. The liability amount is increased each reporting period due to the passage of time and this amount is charged to earnings in the period. Actual costs incurred upon settlement of the obligations are charged against the provision to the extent of the liability recorded and any remaining balance of actual costs is recorded in the statement of comprehensive income (loss). k) Income Taxes
Tax expense comprises current and deferred taxes. Tax is recognized in the statement of comprehensive income (loss) or directly in equity. Current tax expense is based on the results for the period as adjusted for items that are not taxable or not deductible. Current tax is calculated using tax rates and laws that are substantively enacted at the end of the reporting period. Management periodically evaluates positions taken in tax returns with respect to situations in which applicable tax regulation is subject to interpretation. Provisions are established where appropriate on the basis of amounts expected to be paid to the tax authorities. Deferred tax is recognized using the liability method, providing for unused tax losses, unused tax credits and temporary differences between the carrying amounts of assets and liabilities for financial reporting purposes and the amounts used for taxation purposes. Deferred tax is not recognized for the following temporary differences: the initial recognition of assets and liabilities in a transaction that is not a business combination and that affects neither accounting nor taxable profit, and differences relating to investments in subsidiaries to the extent that they are unlikely to be reversed in the foreseeable future. Deferred tax is measured at the tax rates that are expected to be applied to the temporary differences when they reverse, based on the laws that have been enacted or substantively enacted by the reporting date. A deferred tax asset is recognized to the extent that it is probable that future taxable profits will be available against which unused tax losses, unused tax credits and temporary differences can be utilized. Deferred tax assets are reviewed at each period end and are reduced to the extent that it is no longer probable that the related tax benefit will be realized. The amount and timing of reversals of temporary differences will also depend on the Company’s future operating results, and acquisitions and dispositions of assets and liabilities. A significant change in any of the preceding assumptions could materially affect the Company’s estimate of the deferred income tax asset or liability. l) Share-option Compensation
The Company accounts for share-option compensation using the fair-value method of accounting for stock options granted to directors, officers, employees and other service providers using the Black-Scholes option pricing model. Share-option payments are recognized through the statement of comprehensive income (loss) over the vesting period with a corresponding amount reflected in contributed surplus in equity. For awards issued in tranches that vest at different times, the fair value of each tranche is recognized over its respective vesting period. At the grant date and at the end of each reporting period, the Company assesses and re-assesses for subsequent periods its estimates of the number of awards that are expected to vest and recognizes the impact of the revisions in

36 | P a g e
the statement of comprehensive income (loss). Upon exercise of share-based options, the proceeds received net of any transaction costs and the fair value of the exercised share-based options is credited to share capital. Employees may elect to have the Company settle any or all options vested and exercisable using a cashless equity settlement. In connection with any such exercise, an employee shall be entitled to receive, without any cash payment (other than the taxes required to be paid in connection with the exercise), whole shares of the Company. The number of shares under option multiplied by the difference of the fair value at the time of exercise less the option exercise price, divided by the fair value at the time of exercise, determines the number of whole shares issued. m) Financial Instruments
The Company classifies its financial instruments into one of the following categories: financial assets at amortized cost, financial liabilities at amortized costs; and fair value through profit or loss. All financial instruments are measured at fair value on initial recognition. Measurement in subsequent periods is dependent on the classification of the respective financial instrument. Fair value through profit or loss financial instruments are subsequently measured at fair value with changes in fair value recognized in net earnings. All other categories of financial instruments are measured at amortized cost using the effective interest rate method. Cash, account receivables and certain other long-term assets are classified as financial assets at amortized cost since it is the Company’s intention to hold these assets to maturity and the related cash flows are mainly payments of principle and interest. The Company’s investments are measured at FVTOCI, with gains or losses arising from changes in fair value recognized in other comprehensive income and accumulated in the fair value instrument. The cumulative gain or loss will not be reclassified to profit or loss on disposal of the investments. Accounts payable, accrued liabilities, and certain other long-term liabilities and long-term debt are classified as financial liabilities at amortized cost. Risk management assets and liabilities are classified as fair value through profit or loss. n) Fair Value Measurement Financial instruments consisting of accounts receivable, accounts payable and accrued liabilities, due to related party, subordinated promissory note and bank debt on the statement of financial position are carried at amortized cost. Investments and investment in related party are carried at fair value. All of the investments are transacted in active markets. Bonterra determines the fair value of these transactions according to the following hierarchy based on the amount of observable inputs used to value the instrument. Level 1 – Quoted prices are available in active markets for identical assets or liabilities as of the reporting date. Active markets are those in which transactions occur in sufficient frequency and volume to provide pricing information on an ongoing basis. Level 2 – Pricing inputs are other than quoted prices in active markets included in Level 1. Prices in Level 2 are either directly or indirectly observable as of the reporting date. Level 2 valuations are based on inputs, including quoted forward prices for commodities, time value and volatility factors, which can be substantially observed or corroborated in the marketplace. Level 3 – Valuations in this level are those with inputs for the asset or liability that are not based on observable market data. Bonterra’s investments and investments in related party have been assessed on the fair value hierarchy described above and are all considered Level 1. o) Risk Management Contracts
The Company is exposed to market risks resulting from fluctuations in commodity prices, foreign currency exchange rates and interest rates in the normal course of its business. The Company may use a variety of instruments to manage

37 | P a g e
these exposures. For transactions where hedge accounting is not applied, the Company accounts for such instruments using the fair value method by initially recording an asset or liability and recognizing changes in the fair value of the instruments in earnings as unrealized gains or losses on risk management contracts. Fair values of financial instruments are based on third party quotes or valuations provided by independent third parties. Any realized gains or losses on risk management contracts are recognized in net earnings in the period they occur. Bonterra’s risk management contracts have been assessed on the fair value hierarchy described above and are all considered Level 2. p) Net Earnings and Comprehensive Income Per Share
Per share amounts are calculated by dividing the net earnings or comprehensive income (loss) attributable to common shareholders of the Company by the weighted average number of common shares outstanding during the reporting period. Diluted per share amounts are calculated similar to basic per share amounts except that the weighted average common shares outstanding are increased to include additional common shares from the assumed exercise of dilutive share-options. The number of additional outstanding common shares is calculated by assuming that the outstanding in-the-money share-options were exercised and that the proceeds from such exercises were used to acquire common shares at the average market price during the reporting period. q) Government Grants
The Company may receive government grants which provide financial assistance as compensation for costs or expenditures to be incurred. Government grants are accounted for when there is reasonable assurance that conditions attached to the grants are met and that the grants will be received. The Company recognizes government grants in net earnings on a systematic basis and in line with recognition of the expenses that the grants are intended to compensate.
4. SIGNIFICANT ACCOUNTING ESTIMATES AND JUDGMENTS Estimates and underlying assumptions are reviewed on an ongoing basis. Revisions to accounting estimates are recognized in the year in which the estimates are revised and in any future years affected. The following are the estimates and judgments applied by management that most significantly affect the Company’s financial statements. Exploration and Evaluation Expenditures E&E costs are initially capitalized with the intent to establish commercially viable reserves. E&E assets include undeveloped land and costs related to exploratory wells. The Company is required to make estimates and judgments about future events and circumstances regarding the future economic viability of extracting the underlying resources. Changes to project economics, resource quantities, expected production techniques, unsuccessful drilling, expired mineral leases, production costs and required capital expenditures are important factors when making this determination. To the extent a judgment is made that the underlying reserves are not viable, the E&E costs will be impaired and charged to net earnings. Impairment of Non-Financial Assets PP&E and goodwill are aggregated into CGUs based on their ability to generate largely independent cash flows and are assessed for impairment or in the case of PP&E impairment reversals. CGUs have been determined based on similar geological structure, shared infrastructure, geographical proximity, commodity type, and similar market risks. Oil and gas prices and other assumptions will change in the future, which may impact the Company’s recoverable amounts and may therefore require a material adjustment to the carrying value of PP&E. The determination of the Company's CGUs is subject to management's judgment. The Company has a core CGU composed of its Alberta properties and secondary CGUs for its BC and Saskatchewan properties.

38 | P a g e
The recoverable amount of E&E, PP&E, and goodwill is determined based on the fair value less costs of disposal using a discounted cash flow model and is assessed at the CGU level. The period the Company used to project cash flows is approximately 50 years or the CGUs reserve life. Growth in cash flow from a single well would be determined based on the extent of total reserves assigned, which is produced at declining rates over the estimated reserve life. The fair value measurement of the Company’s E&E, PP&E, and goodwill is designated Level 3 on the fair value hierarchy. The Company performs an impairment test on all of its CGUs for any potential impairment or related recovery at least annually or when impairment or recovery indicators arise. For the year ended December 31, 2020 the Company also performed an impairment test due to a decrease in market capitalization for Bonterra and other Canadian Oil and Gas producers. In making these evaluations, the Company uses the following information:
1) The net present value of the pre-tax cash flows from oil and gas reserves of each CGU based on reserves estimated by the Company’s independent reserve evaluator; and
2) Key input estimates used in the determination of cash flows from oil and gas reserves include the following:
a) Reserves - Assumptions that are valid at the time of reserve estimation may change significantly when
new information becomes available. Changes in forward price estimates, production costs or recovery rates may change the economic status of reserves and may ultimately result in reserves being revised.
b) Crude oil and natural gas prices - Forward price estimates of the crude oil and natural gas prices are used
in the discounted cash flow model. These prices are adjusted for quality differentials, heat content and distance to market. Commodity prices have fluctuated widely in recent years due to global and regional factors including supply and demand fundamentals, inventory levels, exchange rates, weather, economic and geopolitical factors.
The following table from external sources outlines the forecast benchmark commodity prices used in the impairment calculation as at December 31, 2020. Bonterra ‘s key assumptions for Impairment:
2021 2022 2023 2024 2025 2026 2027 2028 2029 2030 2031(2)
WTI Crude oil $US/Bbl (1)47.17 50.17 53.17 54.97 56.07 57.19 58.34 59.50 60.69 61.91 63.15
AECO C-Spot $Mmbtu (1)2.78 2.70 2.61 2.65 2.70 2.76 2.81 2.87 2.92 2.98 3.04
Exchange rate US$/$Cdn 0.77 0.77 0.76 0.76 0.76 0.76 0.76 0.76 0.76 0.76 0.76 (1) The forecast benchmark commodity prices listed above are adjusted for quality differentials, heat content, transportation and
marketing costs and other factors specific to the Company’s operations in performing the Company’s impairment tests. (2) Forecast benchmarks commodity prices are assumed to increase by 2.0% in each year after 2031 to end of the reserve life.
c) Discount rate - The Company uses a pre-tax discount rate of fifteen percent that reflects risks specific to
the assets for which the future cash flow estimates have not been adjusted. The discount rate was determined based on the Company’s assessment of risk based on past experience. Changes in the general economic environment could result in material changes to this estimate.
Reserves Estimation The capitalized costs of oil and gas properties and deferred consideration are depleted on a unit-of-production basis at a rate calculated by reference to proved plus probable developed reserves determined in accordance with National Instrument 51-101 and the Canadian Oil and Gas Evaluation handbook. Commercial reserves are determined using best estimates of oil and gas in place, recovery factors and future oil and gas prices. Amounts used for impairment calculations are also based on estimates of crude oil and natural gas reserves and future costs required to develop those reserves.

39 | P a g e
Risk Management Contract The Company accounts for such instruments using the fair value method by initially recording an asset or liability, and recognizing changes in the fair value of the instruments in net earnings as unrealized gains or losses on risk management contracts. Fair values of financial instruments are based on third party futures quotes for commodities. Any realized or unrealized gains or losses on risk management contracts are recognized in net earnings in the period they occur. Share-option Compensation The Company measures the cost of equity-settled transactions with employees by reference to the fair value of the equity instruments at the date they are granted. Estimating the fair value requires the determination of the most appropriate valuation model for a grant, which is dependent on the terms and conditions of the grant. This also requires the determination of the most appropriate inputs to the valuation model including the expected life of the option, risk-free interest rates, volatility and dividend yield. Deferred Consideration Deferred consideration is incurred when the sale of a royalty interest occurs that has contractual terms or implicit obligations that requires future performance such future development costs and operating costs. Management uses judgments in determining those cash flows such as cost, inflation and the discount rate to determine the portion of proceeds that is deferred. Decommissioning and Restoration Costs Decommissioning and restoration costs will be incurred by the Company at the end of the operating lives of the Company’s oil and gas properties. Provisions for decommissioning liabilities are based on cost estimates which can vary in response to many factors including timing of abandonment, inflation, changes in legal requirements, new restoration techniques and interest rates. Income Taxes The Company recognizes the net deferred tax benefit or expense related to deferred income tax assets or liabilities to the extent that it is probable that the deductible temporary differences will reverse in the foreseeable future. Assessing the recoverability of investment tax credit receivable requires the Company to make significant estimates related to expectations of future taxable income. The provision for income taxes is based on judgments in applying income tax law and estimates of the timing, likelihood and reversal of temporary differences between the accounting and tax basis of assets and liabilities. The ability to realize on the deferred tax assets and investment tax credit receivable that are recorded on the balance sheet may be compromised to the extent that any interpretation of tax law is challenged or taxable income differs significantly from estimates. Further details regarding accounting estimates and judgments are disclosed in Note 3.
5. FINANCE COSTS A breakdown of finance costs for the years ended:
($ 000s)
December 31,
2020
December 31,
2019
Interest expense on bank debt 17,353 14,540
Interest expense on amounts owing to related party 590 421
Interest expense on subordinated promissory note 413 380
Unwinding of the fair value of decommissioning liabilities 3,134 3,019
21,490 18,360

40 | P a g e
6. INVESTMENT IN RELATED PARTY The investment consists of 1,034,523 (December 31, 2019 – 1,034,523) common shares in Pine Cliff Energy Ltd. (“Pine Cliff”), a company with some common directors with Bonterra. The investment in Pine Cliff represents less than one percent ownership in the outstanding common shares of Pine Cliff and is recorded at fair value through other comprehensive income. The common shares of Pine Cliff trade on the TSX under the symbol PNE.
7. EXPLORATION AND EVALUATION ASSETS ($ 000s)
Cost and carrying amount
Balance at January 1, 2019 4,422
Transfers to property, plant and equipment (442)
Balance at December 31, 2019 3,980
Additions 959
Impairment (Note 8) (4,566)
Balance at December 31, 2020 373
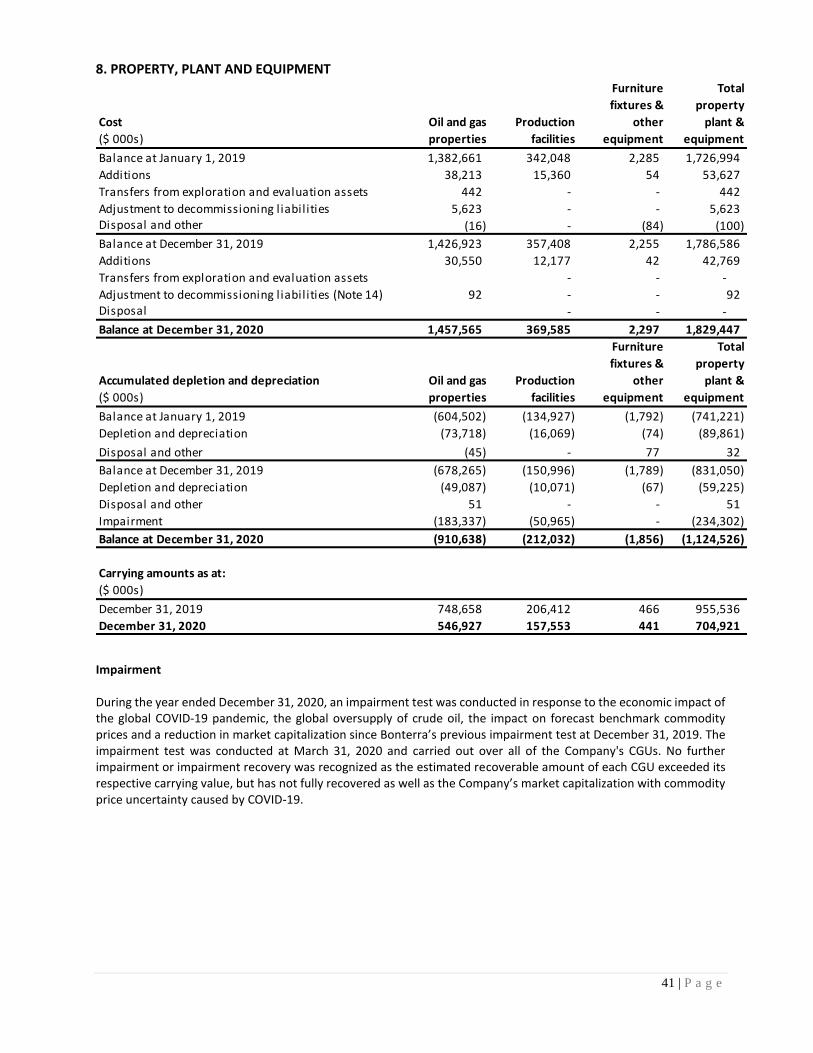
41 | P a g e
8. PROPERTY, PLANT AND EQUIPMENT
Cost
($ 000s)
Oil and gas
properties
Production
facilities
Furniture
fixtures &
other
equipment
Total
property
plant &
equipment
Balance at January 1, 2019 1,382,661 342,048 2,285 1,726,994
Additions 38,213 15,360 54 53,627
Transfers from exploration and evaluation assets 442 - - 442
Adjustment to decommissioning liabilities 5,623 - - 5,623 Disposal and other (16) - (84) (100)
Balance at December 31, 2019 1,426,923 357,408 2,255 1,786,586
Additions 30,550 12,177 42 42,769
Transfers from exploration and evaluation assets - - -
Adjustment to decommissioning liabilities (Note 14) 92 - - 92 Disposal - - -
Balance at December 31, 2020 1,457,565 369,585 2,297 1,829,447
Accumulated depletion and depreciation
($ 000s)
Oil and gas
properties
Production
facilities
Furniture
fixtures &
other
equipment
Total
property
plant &
equipment
Balance at January 1, 2019 (604,502) (134,927) (1,792) (741,221)
Depletion and depreciation (73,718) (16,069) (74) (89,861)
Disposal and other (45) - 77 32
Balance at December 31, 2019 (678,265) (150,996) (1,789) (831,050)
Depletion and depreciation (49,087) (10,071) (67) (59,225)
Disposal and other 51 - - 51
Impairment (183,337) (50,965) - (234,302)
Balance at December 31, 2020 (910,638) (212,032) (1,856) (1,124,526)
Carrying amounts as at:
($ 000s)
December 31, 2019 748,658 206,412 466 955,536
December 31, 2020 546,927 157,553 441 704,921
Impairment During the year ended December 31, 2020, an impairment test was conducted in response to the economic impact of the global COVID-19 pandemic, the global oversupply of crude oil, the impact on forecast benchmark commodity prices and a reduction in market capitalization since Bonterra’s previous impairment test at December 31, 2019. The impairment test was conducted at March 31, 2020 and carried out over all of the Company's CGUs. No further impairment or impairment recovery was recognized as the estimated recoverable amount of each CGU exceeded its respective carrying value, but has not fully recovered as well as the Company’s market capitalization with commodity price uncertainty caused by COVID-19.

42 | P a g e
The following table outlines the forecasted benchmark commodity prices and the exchange rates used in the impairment calculation of Bonterra’s goodwill E&E and PP&E at March 31, 2020.
2020 2021 2022 2023 2024 2025 2026 2027 2028 2029 2030(2)
WTI Crude oil $US/Bbl (1)31.67 42.57 50.51 58.17 60.66 61.97 63.21 64.47 65.77 67.08 68.43
AECO C-Spot $Mmbtu (1)1.90 2.28 2.45 2.58 2.65 2.73 2.78 2.84 2.89 2.94 3.01
Exchange rate US$/$Cdn 0.71 0.73 0.75 0.76 0.77 0.77 0.77 0.77 0.77 0.77 0.77 (1) The forecast benchmark commodity prices listed above are adjusted for quality differentials, heat content, transportation and marketing costs
and other factors specific to the Company’s operations in performing the Company’s impairment tests. (2) Forecast benchmarks commodity prices are assumed to increase by 2.0% in each year after 2030 to end of the reserve life. Discount rate - The Company used a pre-tax discount rate of 15 percent that reflects risks specific to the assets for which the future cash flow estimates have not been adjusted. The discount rate was determined based on the Company’s assessment of risk based on experience. Changes in the general economic environment could result in material changes to this estimate. At March 31, 2020 the Company determined that the carrying value of the Company’s Alberta CGU exceeded its recoverable amount. A total impairment loss of $331,678,000 was recognized, with $234,302,000 recognized on the Company’s PP&E, $92,810,000 was applied to the Company’s goodwill and an additional $4,566,000 was applied to the Company’s exploration and evaluation assets (“E&E”). The impairment loss was the result of the decline for the forward commodity benchmark prices used in impairment testing at March 31, 2020. In future periods, the impairment can be reversed for PP&E up to the original carrying value less any associated depletion and depreciation, if the recoverable amounts of the Alberta CGU exceed the carrying value. Goodwill impairment cannot be reversed. The following table summarizes the impairment expense for the period ended March 31, 2020:
CGU
($000s, except %)
Recoverable
amount Discount rate Impairment
Alberta 580,621 15.00% 331,678 Changes in any of the key judgments, such as a revision in reserves, changes in forecast benchmark commodity prices, discount rates, foreign exchange rates, capital or operating costs would impact the recoverable amounts of assets and any recoveries or impairment changes would affect net earnings. The most sensitive assumptions to the calculation are the discount rate and forecast benchmark commodity price estimates at March 31, 2020. The following sensitivities show the resulting impact on income before tax of the changes with all other variables held constant:
CGU
($000s) Increase 1% Decrease 1% Increase 5% Decrease 5%
Alberta (34,176) 37,407 71,563 (72,032)
Discount rate Commodity prices
9. ACCOUNTS PAYABLE AND ACCRUED LIABILITIES
($ 000s)
December 31,
2020
December 31,
2019
Accounts payable 20,092 15,744
Accrued liabilities 8,137 9,679
28,229 25,423

43 | P a g e
10. TRANSACTIONS WITH RELATED PARTIES
As at December 31, 2020, a loan to Bonterra provided by the Company’s CEO, Chairman of the Board and major shareholder totaled $12,366,000 (December 31, 2019 - $12,000,000). Effective April 1, 2020 to June 1, 2020 the loan’s interest rate temporarily decreased from five and a half percent to three percent and had no set repayment terms but was payable on demand. As of June 1, 2020, the interest rate was increased back to five and a half percent. Security under the debenture is over all of the Company’s assets and is subordinated to any and all claims in favour of the syndicate of senior lenders (including subordinated debt) providing credit facilities to the Company. Interest paid on this loan during 2020 was $224,000 (December 31, 2019 - $378,000). Effective June 1, 2020, principal payments cannot be paid without bank approval, and $366,000 in interest was accrued in accounts payable and accrued liabilities. Amounts owing cannot be settled for cash but may be settled by the issuance of common shares. No common shares have been issued to date. The Company provides executive and marketing services for Pine Cliff Energy Ltd. (Pine Cliff). All services performed were charged at estimated fair value. As at December 31, 2020, the Company had an account receivable from Pine Cliff of $62,000 (December 31, 2019 – $47,000). Compensation for Key Management Personnel
($ 000s)
December 31,
2020
December 31,
2019
Compensation 1,721 1,708
Share-based payments 205 961
Total compensation 1,926 2,669 11. SUBORDINATED PROMISSORY NOTE As at December 31, 2020, Bonterra had $7,604,000 (December 31, 2019 - $7,500,000) outstanding on a subordinated note to a private investor. The loan bears interest at five and a half percent. The subordinated promissory note was callable only after thirty days’ written notice by either party. Security consists of a floating demand debenture over all of the Company’s assets and is subordinated to any and all claims in favor of the syndicate of senior lenders (including subordinated debt) providing credit facilities to the Company. Interest settled on the subordinated promissory note for the year ended December 31, 2020 was $171,000 (December 31, 2019 - $378,000) in cash and $139,000 (December 31, 2019 - $Nil) by issuance of common shares. Effective June 1, 2020, the principal payments cannot be paid without bank approval. An additional $104,000 in interest was accrued to December 31, 2020 in accounts payable and accrued liabilities and cannot be settled for cash but may be settled by the issuance of common shares.
12. BANK DEBT On July 14, 2020, the Company’s credit facility was confirmed at $300,000,000 (December 31, 2019 - $325,000,000), comprised of a $125,000,000 syndicated revolving credit facility, a $25,000,000 non-syndicated revolving credit facility and a term loan of $150,000,000. The amount drawn under the total bank facility at December 31, 2020 was $252,255,000 (December 31, 2019 - $273,065,000). The amounts borrowed under the renewed bank facility bear interest at a floating rate based on the applicable Canadian prime rate or Banker’s Acceptance rate, plus between 2.00 percent and 10.00 percent, depending on the type of borrowing and the Company’s consolidated debt to EBITDA ratio. EBITDA is defined as net income for the period excluding finance costs, provision for current and deferred taxes, depletion and depreciation, share-option compensation, gain or loss on sale of assets and impairment of assets. The terms of the total revolving bank facility provide that the loan facility is revolving to June 30, 2021, with a maturity date of December 31, 2021. The available lending limit of the bank facility is scheduled to be reviewed on June 30, 2021. The amount available for borrowing under the bank facility is reduced by outstanding letters of credit. Letters of credit totaling $1,245,000 were issued as at December 31, 2020 (December 31, 2019 - $900,000). Security for the bank facility consists of various floating demand debentures totaling $750,000,000 (December 31, 2019 - $750,000,000)

44 | P a g e
over all of the Company’s assets and a general security agreement with first ranking over all personal and real property. Under the credit facility, the Company is restricted from making any payment of principal or interest on account of subordinated promissory note and due to related party debt or dividend distributions. In addition, the Company is also limited to expenditures each quarter which cannot:
• exceed 110 percent or be less than 90 percent of the forecasted decommissioning expenditures settled;
• exceed 110 percent of forecasted capital expenditures; and
• exceed 110 percent of the forecasted operating expenses. As at December 31, 2020, Bonterra had a working capital deficiency, however, was in compliance with all financial covenants on its total bank facility.
13. SUBORDINATED DEBT Effective November 13, 2020, the Company entered into a second lien non-revolving four-year term facility from Business Development Bank of Canada (the “BDC”) for $45,000,000, through the Business Credit Availability Program (the “BCAP”). The total amount of the BCAP facility is to be drawn within a 12-month period following the closing of the financing. The amount drawn under the BCAP facility at December 31, 2020 was $28,000,000 (December 31, 2019 - $Nil). Interest on amounts borrowed under the BCAP facility is accrued and added to principal at five percent for the first year from the effective date. Thereafter interest (including accrued interest) will be paid monthly at an interest rate the greater of the revolving bank facility rate plus between 1.00 percent or a fixed interest rate of 6.00 percent, increasing by 1.00 percent in each of the subsequent years. Security consists of a floating demand debenture over all of the Company’s assets and is subordinated to any and all claims in favor of the syndicate of senior lenders providing credit facilities to the Company. Interest accrued and capitalized on the BCAP facility during 2020 was $161,000 (December 31, 2019 - $Nil). On February 22, 2021, the Company drew the remaining $17,000,000 available on the BCAP facility.
14. DECOMMISSIONING LIABILITIES At December 31, 2020, the Company used a 2.0 percent inflation rate (December 31, 2019 – 2.0 percent inflation rate) and a risk-free nominal rate of 2.3 percent (December 31, 2019 – 2.3 percent) to calculate the present value of the decommissioning provision. Due to forces currently influencing global capital markets, long-term risk-free nominal rates in Canada are below target inflation rates, implying a negative real rate of return. The Company determined that applying these rates to current cost estimates would not provide an accurate measurement of the decommissioning liability as observable stand-alone risk-free real rates of return continue to be positive. To provide a more accurate measurement of the liability, the Company applied a risk-free real return rate of 0.3 percent to estimate the present value of the decommissioning provision at December 31, 2020, resulting in a change in estimate. The risk-free real return rate represents an observable, market based risk-free rate of return after adjusting for inflation. Changes in the measurement of the decommissioning provision are added to, or deducted from, the cost of the related asset in property, plant and equipment. When a re-measurement of the decommissioning provision relates to a retired asset, the amount is recorded in the statement of comprehensive income (loss). At December 31, 2020, the estimated total uninflated and undiscounted amount required to settle the decommissioning liabilities was $156,573,000 (December 31, 2019- $155,614,000). These obligations will be settled at the end of the useful lives of the underlying assets, which extend up to 50 years into the future.

45 | P a g e
($ 000s)
December 31,
2020
December 31,
2019
Decommissioning liabilities, January 1 138,171 132,134
Changes in estimate 92 5,623
Liabilities settled during the period (2,706) (2,605)
Government grant in-kind (Note 21) (1,689) -
Unwinding of the discount on decommissioning liabilities 3,134 3,019
Decommissioning liabilities, end of year 137,002 138,171 15. INCOME TAXES
($ 000s)
December 31,
2020
December 31,
2019
Deferred tax asset (l iability) related to:
Investments 80 81
(100,243) (149,134)
Investment tax credits (2,041) (2,041)
Decommissioning liabilities 31,558 31,824
Corporate tax losses carried forward 20,496 6,714
Financial derivative 829 31
Corporate capital tax losses carried forward 7,488 7,488
Unrecorded benefits of capital tax losses carried forward (7,488) (7,488)
Unrecorded benefits of successored resource related pools (4,150) (1,621)
Deferred tax asset (l iability) (53,471) (114,146)
Exploration and evaluation assets and property, plant and equipment
Income tax expense varies from the amounts that would be computed by applying Canadian federal and provincial income tax rates as follows:
($ 000s)
December 31,
2020
December 31,
2019
Earnings (loss) before taxes (367,573) 2,540
Combined federal and provincial income tax rates 24.03% 26.67%
Income tax provision calculated using statutory tax rates (88,314) 677
Increase (decrease) in taxes resulting from:
Change in statutory tax rates (1) - (18,946)
Share-option compensation 105 573
Impairment of goodwill 22,299 -
Change in unrecorded benefits of tax pools 2,529 (1,569)
Change in estimates and other 2,697 (118)
(60,684) (19,383) (1) Effective July 1, 2020 the combined federal and provincial tax rate for Bonterra is approximately 23.00% due to the provincial tax rate for
Alberta, Canada decreasing from 10% to 8%.
The Company has the following tax pools, which may be used to reduce taxable income in future years, limited to the applicable rates of utilization:

46 | P a g e
($ 000s)
Rate of
Utilization (%) Amount
Undepreciated capital costs 7-100 62,834
Canadian oil and gas property expenditures 10 77,564
Canadian development expenditures 30 106,808
Canadian exploration expenditures 100 8,587
Federal income tax losses carried forward (1) 100 102,081
Provincial income tax losses carried forward (2)100 64,021
421,895
(1) Federal income tax losses carried forward expire in the following years: 2035 - $8,156,000; 2036 - $35,823,000; 2037 - $182,000; 2039-$2,163,000; 2040 - $55,757,000.
(2) Provincial income tax losses carried forward expire in the following years: 2036 - $5,562,000; 2037 - $182,000; 2039 - $2,520,000; 2040 - $55,757,000.
The Company has $8,861,000 (December 31, 2019 - $8,861,000) of investment tax credits that expire in the following years: 2024 - $1,319,000; 2025 - $2,258,000; 2026 - $2,405,000; 2027- $2,009,000; 2028 - $745,000; 2034 - $99,000; and 2037 - $26,000. The Company has $65,015,000 (December 31, 2019 - $65,015,000) of capital losses carried forward which can only be claimed against taxable capital gains.
16. SHAREHOLDERS’ EQUITY Authorized The Company is authorized to issue an unlimited number of common shares without nominal or par value.
Issued and fully paid - common shares Number
Amount
($ 000s) Number
Amount
($ 000s)
Balance, beginning of year 33,388,796 765,276 33,388,796 765,276 Share issued for interest on subordinated promissory note 122,520 139 - -
Balance, end of year 33,511,316 765,415 33,388,796 765,276
December 31, 2020 December 31, 2019
The Company is authorized to issue an unlimited number of Class “A” redeemable Preferred Shares and an unlimited number of Class “B” Preferred Shares. There are currently no outstanding Class “A” redeemable Preferred Shares or Class “B” Preferred Shares. The weighted average common shares used to calculate basic and diluted net earnings per share for the year ended December 31 is as follows:
December 31,2020 December 31, 2019
Basic shares outstanding 33,403,860 33,388,796
Dilutive effect of share options (1)16,784 -
Diluted shares outstanding 33,420,644 33,388,796
(1) The Company did not include 2,246,700 share-options (December 31, 2019 – 1,945,000) in the dilutive effect of share-options calculations as these share-options were anti-dilutive.
For the year ended December 31, 2020, the Company declared and paid dividends of $1,002,000 ($0.03 per share) (December 31, 2019 - $4,007,000 ($0.12 per share)). The dividend was suspended effective April 1, 2020. The Company provides an equity settled option plan for its directors, officers and employees. Under the plan, the Company may grant options for up to 3,351,131 (December 31, 2019 – 3,338,880 common shares). The exercise price
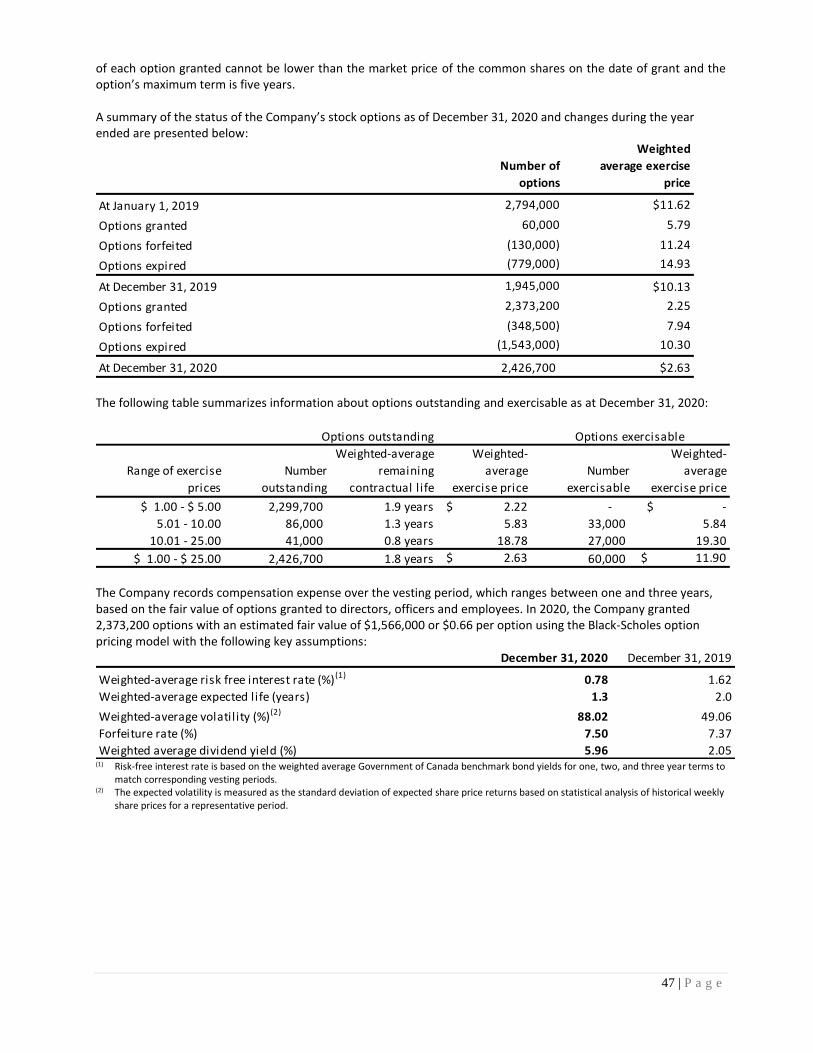
47 | P a g e
of each option granted cannot be lower than the market price of the common shares on the date of grant and the option’s maximum term is five years. A summary of the status of the Company’s stock options as of December 31, 2020 and changes during the year ended are presented below:
Number of
options
Weighted
average exercise
price
At January 1, 2019 2,794,000 $11.62
Options granted 60,000 5.79
Options forfeited (130,000) 11.24
Options expired (779,000) 14.93
At December 31, 2019 1,945,000 $10.13
Options granted 2,373,200 2.25
Options forfeited (348,500) 7.94
Options expired (1,543,000) 10.30
At December 31, 2020 2,426,700 $2.63 The following table summarizes information about options outstanding and exercisable as at December 31, 2020:
Range of exercise
prices
Number
outstanding
Weighted-average
remaining
contractual l ife
Weighted-
average
exercise price
Number
exercisable
Weighted-
average
exercise price
$ 1.00 - $ 5.00 2,299,700 1.9 years $ 2.22 - $ -
5.01 - 10.00 86,000 1.3 years 5.83 33,000 5.84
10.01 - 25.00 41,000 0.8 years 18.78 27,000 19.30
$ 1.00 - $ 25.00 2,426,700 1.8 years $ 2.63 60,000 $ 11.90
Options outstanding Options exercisable
The Company records compensation expense over the vesting period, which ranges between one and three years, based on the fair value of options granted to directors, officers and employees. In 2020, the Company granted 2,373,200 options with an estimated fair value of $1,566,000 or $0.66 per option using the Black-Scholes option pricing model with the following key assumptions:
December 31, 2020 December 31, 2019
Weighted-average risk free interest rate (%)(1) 0.78 1.62
Weighted-average expected life (years) 1.3 2.0
Weighted-average volatility (%)(2) 88.02 49.06
Forfeiture rate (%) 7.50 7.37
Weighted average dividend yield (%) 5.96 2.05 (1) Risk-free interest rate is based on the weighted average Government of Canada benchmark bond yields for one, two, and three year terms to
match corresponding vesting periods. (2) The expected volatility is measured as the standard deviation of expected share price returns based on statistical analysis of historical weekly
share prices for a representative period.
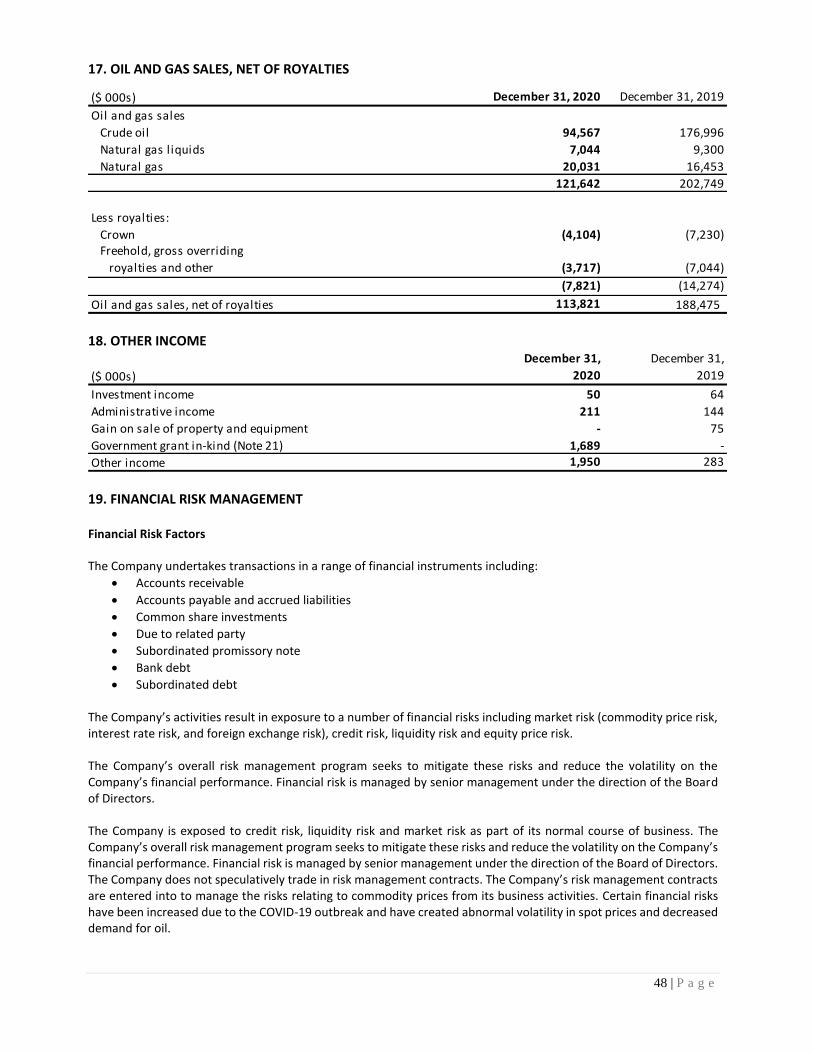
48 | P a g e
17. OIL AND GAS SALES, NET OF ROYALTIES
($ 000s) December 31, 2020 December 31, 2019
Oil and gas sales
Crude oil 94,567 176,996
Natural gas liquids 7,044 9,300
Natural gas 20,031 16,453
121,642 202,749
Less royalties:
Crown (4,104) (7,230)Freehold, gross overriding
royalties and other (3,717) (7,044)
(7,821) (14,274)
Oil and gas sales, net of royalties 113,821 188,475 18. OTHER INCOME
($ 000s)
December 31,
2020
December 31,
2019
Investment income 50 64
Administrative income 211 144
Gain on sale of property and equipment - 75
Government grant in-kind (Note 21) 1,689 -
Other income 1,950 283 19. FINANCIAL RISK MANAGEMENT Financial Risk Factors
The Company undertakes transactions in a range of financial instruments including:
• Accounts receivable
• Accounts payable and accrued liabilities
• Common share investments
• Due to related party
• Subordinated promissory note
• Bank debt
• Subordinated debt
The Company’s activities result in exposure to a number of financial risks including market risk (commodity price risk, interest rate risk, and foreign exchange risk), credit risk, liquidity risk and equity price risk. The Company’s overall risk management program seeks to mitigate these risks and reduce the volatility on the Company’s financial performance. Financial risk is managed by senior management under the direction of the Board of Directors. The Company is exposed to credit risk, liquidity risk and market risk as part of its normal course of business. The Company’s overall risk management program seeks to mitigate these risks and reduce the volatility on the Company’s financial performance. Financial risk is managed by senior management under the direction of the Board of Directors. The Company does not speculatively trade in risk management contracts. The Company’s risk management contracts are entered into to manage the risks relating to commodity prices from its business activities. Certain financial risks have been increased due to the COVID-19 outbreak and have created abnormal volatility in spot prices and decreased demand for oil.

49 | P a g e
Liquidity Risk Management
Liquidity risk is the risk that the Company will encounter difficulty in meeting obligations associated with its financial liabilities. While the decrease in commodity prices as a result of the impacts of COVID-19 pandemic and the actions from OPEC+ on commodity pricing during 2020 will negatively impact the Company’s financial performance and position, the Company continues to retain available committed borrowing capacity that provides the Company with financial flexibility and the ability to meet ongoing obligations as they become due. After examining the economic factors that are causing the liquidity risk facing the Company, the judgment applied to these factors, and the various initiatives that the Company has and will undertake to strengthen its financial position, the Company believes it will have sufficient liquidity to support its ongoing operations and meet its financial obligations as they come due for at least the next twelve months. There can be no assurance that the next borrowing base redetermination will not result in a borrowing base shortfall, and that the necessary funds or additional security will be available to eliminate the short fall. Upon receipt of notice from the lenders, the shortfall would have to be remedied within 30 days or by such other means as acceptable to the lenders. Credit Risk
Credit risk is the risk that a contracting party will not complete its obligations under a financial instrument and cause the Company to incur a financial loss. The Company is exposed to credit risk on all financial assets included on the statement of financial position. To help mitigate this risk:
• The Company only enters into material agreements with credit worthy counterparties. These include major oil and gas companies or major Canadian chartered banks; and
• Agreements for product sales are primarily on 30-day renewal terms. Of the $12,891,000 accounts receivable
balance at December 31, 2020 (December 31, 2019 - $21,764,000) over 91 percent (2019 – 75 percent) relates to product sales or risk management contracts with national and international banks and oil and gas companies.
On a quarterly basis, the Company assesses if there has been any impairment of the financial assets of the Company. During the year ended December 31, 2020, there was no material impairment provision required on any of the financial assets of the Company. The Company does have a credit risk exposure as the majority of the Company’s accounts receivable are with counterparties having similar characteristics. However, payments from the Company’s largest accounts receivable counterparties have consistently been received within 30 days and the sales agreements with these parties are cancellable with 30 days’ notice if payments are not received. At December 31, 2020, approximately $709,000 or five and a half percent of the Company’s total accounts receivable are aged over 90 days and considered past due (December 31, 2019 - $276,000 or one percent). The majority of these accounts are due from various joint venture partners. The Company actively monitors past due accounts and takes the necessary actions to expedite collection, which can include withholding production or netting payables when the accounts are with joint venture partners. Should the Company determine that the ultimate collection of a receivable is in doubt, it will provide the necessary provision in its allowance for doubtful accounts with a corresponding charge to earnings. If the Company subsequently determines an account is uncollectable, the account is written off with a corresponding charge to the allowance account. The Company’s allowance for doubtful accounts balance at December 31, 2020 is $1,186,000 (December 31, 2019 - $1,232,000) with the expense being included in general and administrative expenses. There were no material accounts written off during the period. The maximum exposure to credit risk is represented by the carrying amounts of accounts receivable. There are no material financial assets that the Company considers past due.
Capital Risk Management
The Company’s objectives when managing capital, which the Company defines to include shareholders’ equity, debt and working capital balances, are to safeguard the Company’s ability to continue as a going concern, so that it can

50 | P a g e
continue to provide returns to its shareholders and benefits for other stakeholders and to maintain a capital structure that provides a low cost of capital. In order to maintain or adjust the capital structure, the Company may adjust the current debt structure and/or issue common shares. The Company monitors capital based on the ratio of net debt (total debt adjusted for working capital) to cash flow from operating activities. This ratio is calculated using each quarter end net debt divided by the preceding twelve months’ cash flow. Management believes that a net debt level as high as one and a half year’s cash flow is an optimal level to allow it to take advantage of future acquisition opportunities. During the current year the Company had a net debt to cash flow level of 9.8:1 compared to 3.6:1 as at December 31, 2019. The increase in net debt to cash flow ratio is primarily due to a $49,059,000 decrease in cash flow due to a decrease in commodity prices. To further reduce net debt or minimize the effects of decreased cash flows due to the COVID-19 pandemic, the Company suspended capital spending in Q2 2020 along with its monthly dividend of $0.01 per share starting with the April 2020 dividend. Bonterra has also optimized production costs primarily by voluntarily shutting-in its low economic wells during this period of repressed commodity prices and applying for government assistance programs where applicable. Section (a) of this note provides the Company’s debt to cash flow from operations. Section (b) addresses in more detail the key financial risk factors that arise from the Company’s activities including its policies for managing these risks. a) Net debt to cash flow ratio
The net debt and cash flow amounts are as follows:
($ 000s)
December 31,
2020
December 31,
2019
Bank debt(1) 252,255 273,065
Subordinated debt 28,161 -
Current liabilities 52,628 46,220
Current assets (17,471) (26,475)
Net debt 315,573 292,810
Cash flow from operations 32,073 81,132
Net debt to cash flow ratio 9.8 3.6 (1) Bank debt is classified as a current liability as at December 31, 2020.
b) Risks and mitigation
Market risk is the risk that the fair value or future cash flow of the Company’s financial instruments will fluctuate because of changes in market prices. Components of market risk to which the Company is exposed are discussed below. Commodity Price Risk
The Company’s principal operation is the production and sale of crude oil, natural gas and natural gas liquids. Fluctuations in prices of these commodities directly impact the Company’s performance and ability to continue with its dividends. The Company has used various risk management contracts to set price parameters for a portion of its production. The Company has assumed the risk in respect of commodity prices, except for a small portion of physical delivery sales and risk management contracts to manage commodity risk on the Company’s higher operating cost areas. The Company is exposed to credit risk, liquidity risk and market risk as part of its normal course of business. The Company’s overall risk management program seeks to mitigate these risks and reduce the volatility on the Company’s financial performance. Financial risk is managed by senior management under the direction of the Board of Directors.

51 | P a g e
Physical Delivery Sales Contracts Bonterra enters into physical delivery sales contracts to manage commodity price risk. These contracts are considered normal executory sales contracts and are not recorded at fair value in the financial statements. As of December 31, 2020, the Company has the following physical delivery sales contracts in place.
Product Type of contract Volume Term Contract price
Oil Costless physical collar - WTI (1) 500 BBL/day Jan 1, 2021 to Dec 31, 2021 $37.00 to $47.70 USD/BBL
Oil Fixed price - MSW differential (2)(3) 500 BBL/day Jan 1, 2021 to Dec 31, 2021 $(8.18)CAD/BBL
Gas Fixed Price -AECO(4) 3,000 GJ/day Nov 1, 2020 to Oct 31, 2021 $2.79 GJ/ day
Gas Fixed Price -AECO(4) 3,000 GJ/day Nov 1, 2021 to Dec 31, 2021 $2.47 GJ/ day
(1) WTI refers to West Texas Intermediate, a grade of light sweet crude oil used as benchmark pricing in the United States. (2) "MSW Stream index" or "Edmonton Par" refers to the mixed sweet blend that is the benchmark price for conventionally produced light
sweet crude oil in Western Canada. (3) MSW differential is the primary difference between WTI and MSW steam index benchmark pricing. (4) “AECO” refers to Alberta Energy Company; a grade or heating content of natural gas used as benchmark pricing in Alberta, Canada.
Subsequent to December 31, 2020, the Company entered into the following physical delivery sales contracts.
Product Type of contract Volume Term Contract price
Oil Fixed price - MSW Stream index 500 BBL/day Feb 1, 2021 to April 30, 2021 $56.55 CAD/BBL
Oil Fixed price - MSW Stream index 250 BBL/day Mar 1, 2021 to May 31, 2021 $65.40 CAD/BBL
Gas Fixed Price -AECO 2,500 GJ/day Jan 1, 2021 to Dec 31, 2021 $2.45 GJ/ day
Gas Fixed Price -AECO 3,000 GJ/day Jan 1, 2022 to Mar 31, 2022 $3.10 GJ/ day Risk Management Contracts
($ 000s)
December 31,
2020
December 31,
2019
Risk management contracts
Realized gain (loss) 401 (443)
Unrealized gain (loss) (3,464) (134)
(3,063) (577)
The Company also enters into financial derivative instruments or risk management contracts to manage commodity price risk. These contracts are not considered normal executory sales contracts and are recorded at fair value in the financial statements. The Company has entered into the following risk management contracts during the year ended December 31, 2020.

52 | P a g e
Product Type of contract Volume Term Contract price
Oil Costless financial collar -WTI 500 BBL/day Jan 1, 2021 to Dec 31, 2021 $37.00 to $48.00 USD/BBL
Oil Fixed price - MSW differential 500 BBL/day Jan 1, 2021 to Dec 31, 2021 $(7.26) CAD/BBL
Oil Costless financial collar -WTI 250 BBL/day Jan 1, 2021 to Dec 31, 2021 $36.00 to 50.05 USD/BBL
Oil Costless financial collar -WTI 250 BBL/day Jan 1, 2021 to Dec 31, 2021 $38.00 to 50.50 USD/BBL
Oil Costless financial collar -WTI 500 BBL/day Jan 1, 2021 to Dec 31, 2021 $36.00 to 48.75 USD/BBL
Oil Fixed price - MSW differential 500 BBL/day Jan 1, 2021 to Dec 31, 2021 $(7.15) CAD/BBL
Oil Costless financial collar -WTI 250 BBL/day Jan 1, 2021 to Dec 31, 2021 $36.00 to 48.90 USD/BBL
Oil Fixed price - MSW differential 250 BBL/day Mar 1, 2021 to Dec 31 2021 $(8.10) CAD/BBL Subsequent to year end, the Company entered into the following risk management contracts. Oil Costless financial collar -WTI 1,000 BBL/day Jan 1, 2022 to Mar 31, 2022 $48.00 to 64.60 USD/BBL
Oil Costless financial collar -WTI 500 BBL/day Jan 1, 2022 to Mar 31, 2022 $48.00 to 68.00 USD/BBL
Oil Fixed price - MSW differential 250 BBL/day Mar 1, 2021 to Dec 31 2021 $ (6.34) CAD/BBL
Gas Fixed Price -AECO 1,800 GJ/day Jan 1, 2021 to Dec 31, 2021 2.24 GJ/ day Interest Rate Risk
Interest rate risk refers to the risk that the value of a financial instrument or cash flows associated with the instrument will fluctuate due to changes in market interest rates. Interest rate risk arises from interest bearing financial assets and liabilities that the Company uses. The principal exposure of the Company is on its borrowings which have a variable interest rate which gives rise to a cash flow interest rate risk. The Company’s debt facilities consist of a $125,000,000 syndicated revolving operating line, $25,000,000 non-syndicated revolving operating line, $150,000,000 syndicated term loan, $45,000,000 subordinated debt, $12,366,000 due to a related party and a $7,604,000 subordinated promissory note. The borrowings under the total bank facilities are at bank prime plus or minus various percentages as well as by means of banker’s acceptances (BAs) within the Company’s credit facility. Due to related party and the subordinated promissory note are at a fixed interest rate of five and a half percent and the subordinated debt is at fixed interest rate of five percent in the first year. The Company manages its exposure to interest rate risk on its floating interest rate debt through entering into various term lengths on its BAs but in no circumstances do the terms exceed six months. Sensitivity Analysis Based on historic movements and volatilities in the interest rate markets and management’s current assessment of the financial markets, the Company believes that a one percent variation in the Canadian prime interest rate is reasonably possible over a 12 month period. A one percent increase (decrease) in the Canadian prime rate would decrease (increase) both annual net earnings and comprehensive income by $1,942,000.
Equity Price Risk Equity price risk refers to the risk that the fair value of the investments and investment in related party will fluctuate due to changes in equity markets. Equity price risk arises from the realizable value of the investments that the

53 | P a g e
Company holds which are subject to variable equity market prices which on disposition gives rise to a cash flow equity price risk. The Company will assume full risk in respect of equity price fluctuations.
Foreign Exchange Risk
The Company has no foreign operations and currently sells all of its product sales in Canadian currency. The Company however is exposed to currency risk in that crude oil is priced in US currency, then converted to Canadian currency. The Company currently has no outstanding risk management agreements. The Company will assume full risk in respect of foreign exchange fluctuations. 20. COMMITMENTS AND FINANCIAL LIABILTIES The Company has the following maturity schedule for its financial liabilities and commitments:
($ 000s)
Recognized on
Financial
Statements
Less than
1 year
Over 1 year
to 3 years
Over 3 years
to 5 years
Over 5 years
to 7 years
Accounts payable and
accrued liabilities Yes - Liability 28,229 - - -
Due to related parties Yes - Liability 12,366 - - -
Suboridinated promissory note Yes - Liability 7,604 - - -
Bank Debt Yes - Liability 252,255 - - -
Subordinated debt Yes - Liability - - 28,161 -
Firm service commitments No 60 120 117 25
Office lease commitments No 501 503 489 -
Total 301,015 623 28,767 25 The Company has entered into firm service gas transportation agreements in which the Company guarantees certain minimum volumes of natural gas will be shipped on various gas transportation systems. The terms of the various agreements expire in one to seven years. The future minimum payment amounts for the firm service gas transportation agreements are calculated using current tariff rates. The Company also has non-cancellable office lease commitments for building and office equipment. The building and office equipment leases have an average remaining life of 2.9 years. 21. GOVERNMENT GRANTS The Government of Alberta’s Site Rehabilitation Program (“SRP”) provides grant funding through service providers to abandon or remediate oil and gas sites. The Company derecognized approximately $1,689,000 of asset retirement obligations as an in-kind grant (2019 - $Nil). The benefit of the in-kind grant is recognized through other income. Canadian Emergency Wage Subsidy (“CEWS”) is a federal program that allows eligible companies to receive a subsidy of employee wages, subject to a maximum per employee. During the year, the Company received $895,000 (2019 - $Nil), which resulted in a reduction of employee compensation.

54 | P a g e
Corporate Information
Board of Directors George F. Fink - Chairman John J. Campbell Randy M. Jarock Jacqueline R. Ricci Rodger A. Tourigny
Officers George F. Fink, CEO and Chairman of the Board Robb D. Thompson, CFO and Corporate Secretary Adrian Neumann, Chief Operating Officer Brad A. Curtis, Senior VP, Business Development
Registrar and Transfer Agent Odyssey Trust Company
Auditors Deloitte LLP
Solicitors Borden Ladner Gervais LLP
Bankers CIBC National Bank of Canada The Toronto-Dominion Bank ATB Financial Business Development Bank of Canada Export Development Bank
Head Office 901, 1015 – 4th Street SW Calgary, Alberta T2R 1J4 Telephone: 403.262.5307 Fax: 403.265.7488 Email: [email protected]
Website www.bonterraenergy.com
![Untitled-5 [] · Retained earnings 132 4,313 7,570 Total shareholders' equity 6,510 10,691 29,556 Total liabilities and shareholders' equity 28,435 34,556 49,683 The accompanying](https://img.pdfslide.net/doc/110x75/5f2dee731c2d0a6dcd5ce7b8/untitled-5-retained-earnings-132-4313-7570-total-shareholders-equity-6510.jpg)


![KONICA MINOLTA - CONSOLIDATED FINANCIAL RESULTS ......2 (2) Financial Position [Millions of yen] Total assets Shareholders’ equity Shareholders’ equity ratio Shareholders’ equity](https://img.pdfslide.net/doc/110x75/60a10f3588115c5248479878/konica-minolta-consolidated-financial-results-2-2-financial-position.jpg)