Embed Size (px)
Citation preview
Rep. ITU-R M.2111 1
REPORT ITU-R M.2111
Sharing studies between IMT-Advanced and the radiolocation service in the 3 400-3 700 MHz bands
(2007)
1 Introduction The Radiocommunication Assembly 2003 adopted Recommendation ITU-R M.1645 on the Framework and overall objectives for the future development of IMT-2000 and IMT-Advanced systems.
WRC-07 Agenda item 1.4 has “to consider frequency-related matters for the future development of IMT-2000 and systems beyond IMT-2000 taking into account of the results of ITU-R studies in accordance with Resolution 228 (Rev.WRC-03)”.
Report ITU-R M.2078 provides the estimated spectrum bandwidth requirement for pre-IMT-2000, IMT-2000 and IMT-Advanced for the year 2020, and it was calculated for both low and high user demand scenarios to be 1 280 MHz and 1 720 MHz respectively.
The frequency band 3 400-4 200 MHz has been identified as a candidate band for IMT-Advanced systems, as indicated by Report ITU-R M.2079.
The allocations for this band are provided in Article 5 of the Radio Regulations (RR).
Several administrations have deployed mobile radar systems that operate in the 3 400-3 700 MHz frequency band. These systems have been operating in this band for over thirty years. These radar systems are expected to continue to operate within these allocations for many more years.
This Report provides sharing studies between radar systems and IMT-Advanced systems in the bands 3 400-3 700 MHz, and potential interference mitigation techniques. Sharing studies are shown in Annexes 1 and 2, and potential interference mitigation techniques which may be applied to both IMT-Advanced systems and radar systems are shown in Annex 3.
This Report contains multiple studies using different scenarios and assumptions, and consequently has different results. Despite these differences of assumptions, some similar results have been achieved.
2 Scope of the Report
This Report only deals with the sharing between IMT-Advanced and the radiolocation service in the bands 3 400-3 700 MHz, including potential interference mitigation techniques which may be applicable for IMT-Advanced and the radiolocation systems. The sharing between the fixed-satellite service and IMT-Advanced is addressed in a separate Report.
The allocated services in the bands 3 400-3 700 MHz specified in RR Article 5 are listed in the following table.
2 Rep. ITU-R M.2111
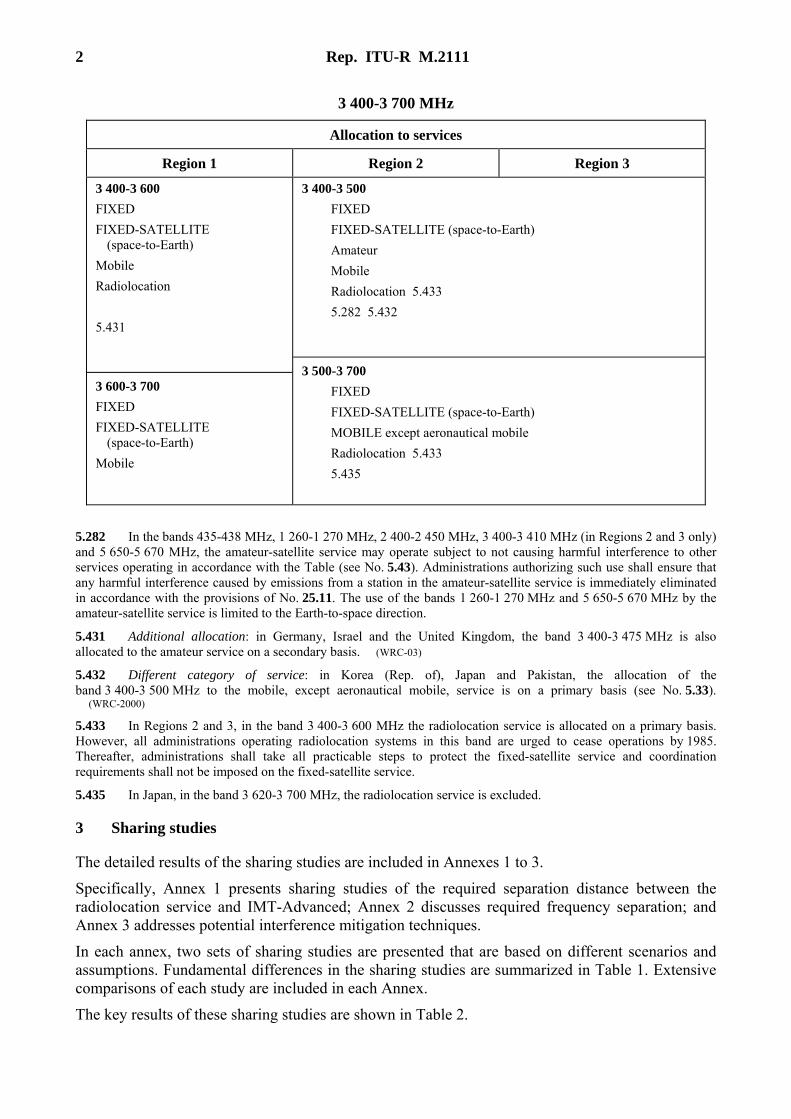
3 400-3 700 MHz
Allocation to services
Region 1 Region 2 Region 3
3 400-3 600 FIXED FIXED-SATELLITE
(space-to-Earth) Mobile Radiolocation 5.431
3 600-3 700 FIXED FIXED-SATELLITE
(space-to-Earth) Mobile
3 400-3 500 FIXED FIXED-SATELLITE (space-to-Earth) Amateur Mobile Radiolocation 5.433 5.282 5.432
3 500-3 700 FIXED FIXED-SATELLITE (space-to-Earth) MOBILE except aeronautical mobile Radiolocation 5.433 5.435
5.282 In the bands 435-438 MHz, 1 260-1 270 MHz, 2 400-2 450 MHz, 3 400-3 410 MHz (in Regions 2 and 3 only) and 5 650-5 670 MHz, the amateur-satellite service may operate subject to not causing harmful interference to other services operating in accordance with the Table (see No. 5.43). Administrations authorizing such use shall ensure that any harmful interference caused by emissions from a station in the amateur-satellite service is immediately eliminated in accordance with the provisions of No. 25.11. The use of the bands 1 260-1 270 MHz and 5 650-5 670 MHz by the amateur-satellite service is limited to the Earth-to-space direction.
5.431 Additional allocation: in Germany, Israel and the United Kingdom, the band 3 400-3 475 MHz is also allocated to the amateur service on a secondary basis. (WRC-03)
5.432 Different category of service: in Korea (Rep. of), Japan and Pakistan, the allocation of the band 3 400-3 500 MHz to the mobile, except aeronautical mobile, service is on a primary basis (see No. 5.33). (WRC-2000)
5.433 In Regions 2 and 3, in the band 3 400-3 600 MHz the radiolocation service is allocated on a primary basis. However, all administrations operating radiolocation systems in this band are urged to cease operations by 1985. Thereafter, administrations shall take all practicable steps to protect the fixed-satellite service and coordination requirements shall not be imposed on the fixed-satellite service.
5.435 In Japan, in the band 3 620-3 700 MHz, the radiolocation service is excluded.
3 Sharing studies
The detailed results of the sharing studies are included in Annexes 1 to 3.
Specifically, Annex 1 presents sharing studies of the required separation distance between the radiolocation service and IMT-Advanced; Annex 2 discusses required frequency separation; and Annex 3 addresses potential interference mitigation techniques.
In each annex, two sets of sharing studies are presented that are based on different scenarios and assumptions. Fundamental differences in the sharing studies are summarized in Table 1. Extensive comparisons of each study are included in each Annex.
The key results of these sharing studies are shown in Table 2.
Rep. ITU-R M.2111 3
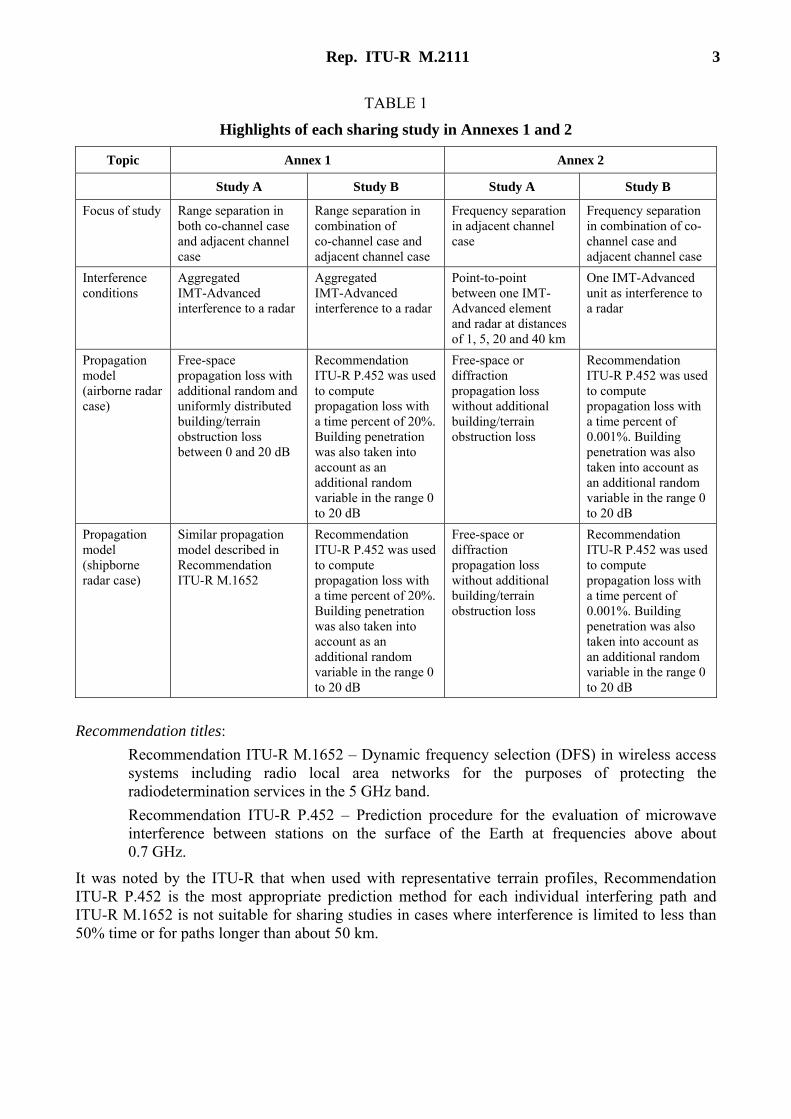
TABLE 1
Highlights of each sharing study in Annexes 1 and 2
Topic Annex 1 Annex 2
Study A Study B Study A Study B
Focus of study Range separation in both co-channel case and adjacent channel case
Range separation in combination of co-channel case and adjacent channel case
Frequency separation in adjacent channel case
Frequency separation in combination of co-channel case and adjacent channel case
Interference conditions
Aggregated IMT-Advanced interference to a radar
Aggregated IMT-Advanced interference to a radar
Point-to-point between one IMT-Advanced element and radar at distances of 1, 5, 20 and 40 km
One IMT-Advanced unit as interference to a radar
Propagation model (airborne radar case)
Free-space propagation loss with additional random and uniformly distributed building/terrain obstruction loss between 0 and 20 dB
Recommendation ITU-R P.452 was used to compute propagation loss with a time percent of 20%. Building penetration was also taken into account as an additional random variable in the range 0 to 20 dB
Free-space or diffraction propagation loss without additional building/terrain obstruction loss
Recommendation ITU-R P.452 was used to compute propagation loss with a time percent of 0.001%. Building penetration was also taken into account as an additional random variable in the range 0 to 20 dB
Propagation model (shipborne radar case)
Similar propagation model described in Recommendation ITU-R M.1652
Recommendation ITU-R P.452 was used to compute propagation loss with a time percent of 20%. Building penetration was also taken into account as an additional random variable in the range 0 to 20 dB
Free-space or diffraction propagation loss without additional building/terrain obstruction loss
Recommendation ITU-R P.452 was used to compute propagation loss with a time percent of 0.001%. Building penetration was also taken into account as an additional random variable in the range 0 to 20 dB
Recommendation titles: Recommendation ITU-R M.1652 – Dynamic frequency selection (DFS) in wireless access
systems including radio local area networks for the purposes of protecting the radiodetermination services in the 5 GHz band.
Recommendation ITU-R P.452 – Prediction procedure for the evaluation of microwave interference between stations on the surface of the Earth at frequencies above about 0.7 GHz.
It was noted by the ITU-R that when used with representative terrain profiles, Recommendation ITU-R P.452 is the most appropriate prediction method for each individual interfering path and ITU-R M.1652 is not suitable for sharing studies in cases where interference is limited to less than 50% time or for paths longer than about 50 km.
4 Rep. ITU-R M.2111
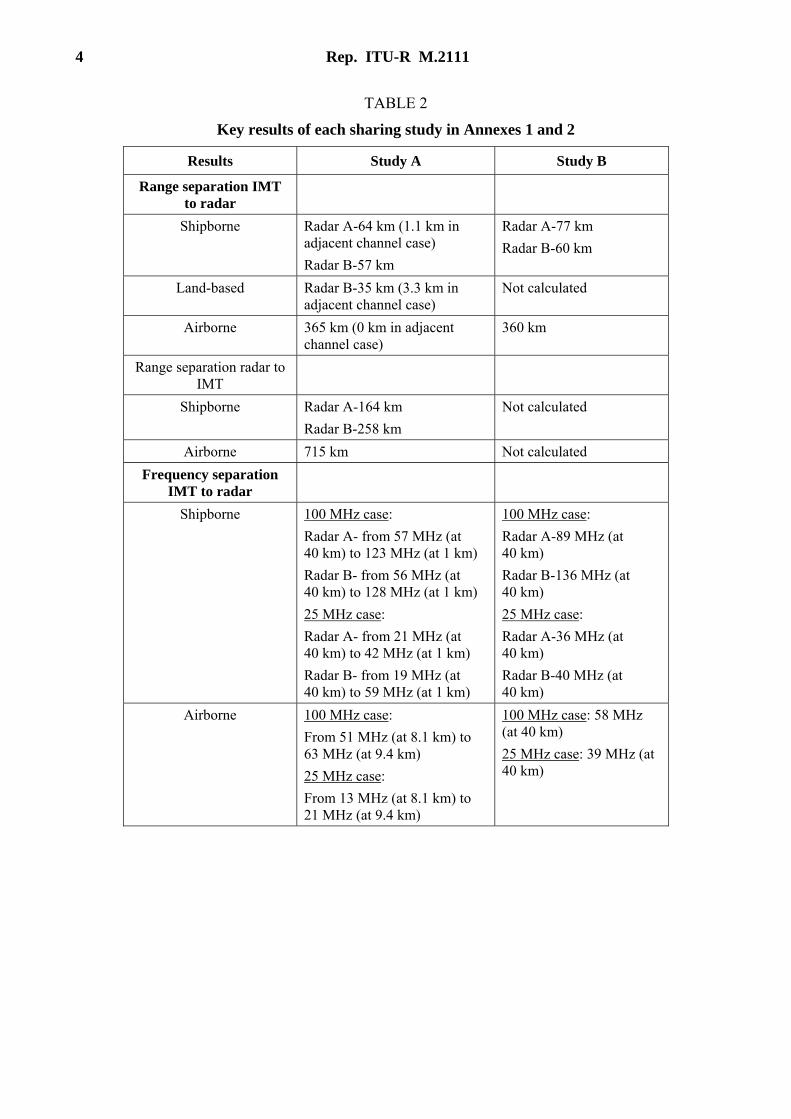
TABLE 2
Key results of each sharing study in Annexes 1 and 2
Results Study A Study B
Range separation IMT to radar
Shipborne Radar A-64 km (1.1 km in adjacent channel case) Radar B-57 km
Radar A-77 km Radar B-60 km
Land-based Radar B-35 km (3.3 km in adjacent channel case)
Not calculated
Airborne 365 km (0 km in adjacent channel case)
360 km
Range separation radar to IMT
Shipborne Radar A-164 km Radar B-258 km
Not calculated
Airborne 715 km Not calculated Frequency separation
IMT to radar
Shipborne 100 MHz case: Radar A- from 57 MHz (at 40 km) to 123 MHz (at 1 km) Radar B- from 56 MHz (at 40 km) to 128 MHz (at 1 km) 25 MHz case: Radar A- from 21 MHz (at 40 km) to 42 MHz (at 1 km) Radar B- from 19 MHz (at 40 km) to 59 MHz (at 1 km)
100 MHz case: Radar A-89 MHz (at 40 km) Radar B-136 MHz (at 40 km) 25 MHz case: Radar A-36 MHz (at 40 km) Radar B-40 MHz (at 40 km)
Airborne 100 MHz case: From 51 MHz (at 8.1 km) to 63 MHz (at 9.4 km) 25 MHz case: From 13 MHz (at 8.1 km) to 21 MHz (at 9.4 km)
100 MHz case: 58 MHz (at 40 km) 25 MHz case: 39 MHz (at 40 km)
Rep. ITU-R M.2111 5
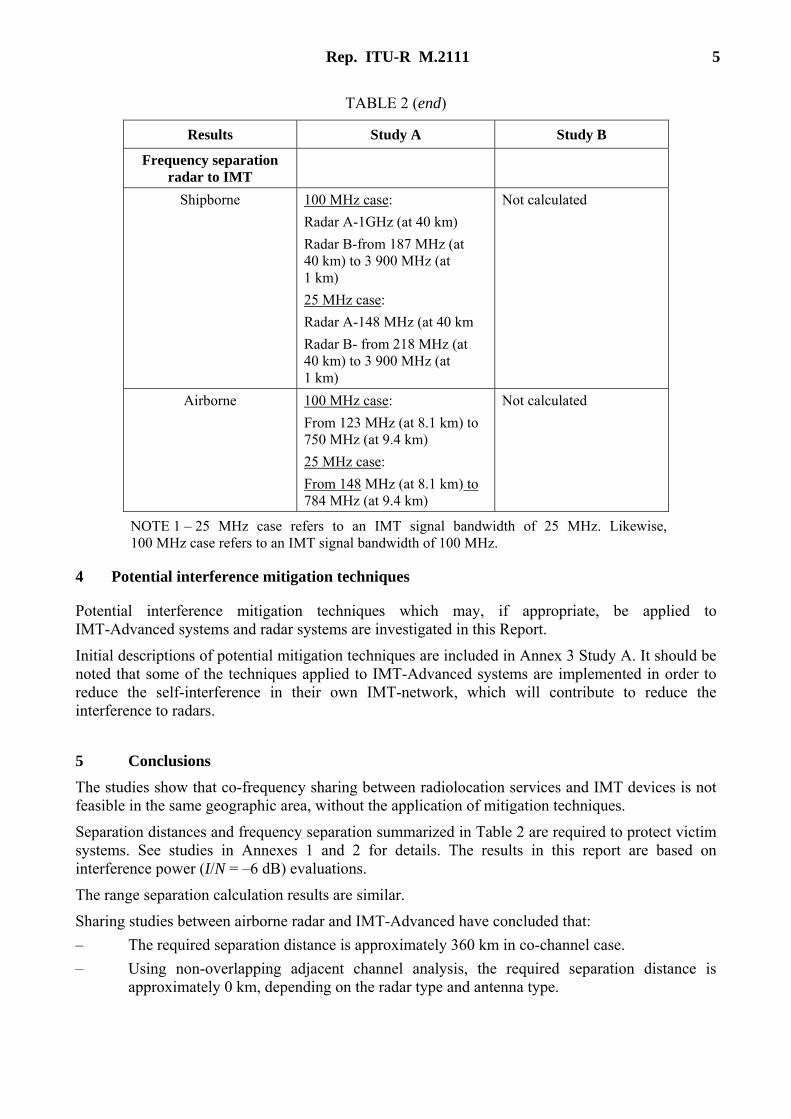
TABLE 2 (end)
Results Study A Study B
Frequency separation radar to IMT
Shipborne 100 MHz case: Radar A-1GHz (at 40 km) Radar B-from 187 MHz (at 40 km) to 3 900 MHz (at 1 km) 25 MHz case: Radar A-148 MHz (at 40 km Radar B- from 218 MHz (at 40 km) to 3 900 MHz (at 1 km)
Not calculated
Airborne 100 MHz case: From 123 MHz (at 8.1 km) to 750 MHz (at 9.4 km) 25 MHz case: From 148 MHz (at 8.1 km) to 784 MHz (at 9.4 km)
Not calculated
NOTE 1 – 25 MHz case refers to an IMT signal bandwidth of 25 MHz. Likewise, 100 MHz case refers to an IMT signal bandwidth of 100 MHz.
4 Potential interference mitigation techniques
Potential interference mitigation techniques which may, if appropriate, be applied to IMT-Advanced systems and radar systems are investigated in this Report.
Initial descriptions of potential mitigation techniques are included in Annex 3 Study A. It should be noted that some of the techniques applied to IMT-Advanced systems are implemented in order to reduce the self-interference in their own IMT-network, which will contribute to reduce the interference to radars.
5 Conclusions
The studies show that co-frequency sharing between radiolocation services and IMT devices is not feasible in the same geographic area, without the application of mitigation techniques.
Separation distances and frequency separation summarized in Table 2 are required to protect victim systems. See studies in Annexes 1 and 2 for details. The results in this report are based on interference power (I/N = –6 dB) evaluations.
The range separation calculation results are similar.
Sharing studies between airborne radar and IMT-Advanced have concluded that: – The required separation distance is approximately 360 km in co-channel case. – Using non-overlapping adjacent channel analysis, the required separation distance is
approximately 0 km, depending on the radar type and antenna type.
6 Rep. ITU-R M.2111
Sharing studies between land-based/shipborne radar and IMT-Advanced have concluded that: – The required separation distance is approximately 70 km in co-channel case. – Using non-overlapping adjacent channel analysis, the required separation distance is less
than 1 km, depending on the radar type and antenna type.
The frequency separation analyses concluded that: – The frequency separations vary between 13 and 136 MHz when interference is from
IMT-Advanced to radar. – Based on a worst-case analysis, the frequency separation is greater than 1GHz when
interference is from radar to IMT-Advanced.
Potential mitigation techniques shown in Annex 3 may reduce the interference, and may facilitate sharing between IMT-Advanced systems and radiolocation systems. For example, a calculation of a hypothetical scenario from radar to IMT-Advanced case resulted in an 80% reduction in frequency separation to approximately 560 MHz, and another calculation resulted in a 60% reduction in range separation to approximately 70 km, if such mitigation techniques could be applied.
Further studies are required to develop the actual specifications of mitigation techniques, such as procedures and performance in DFS functionality.
Administrations may consider geographical segregation and mitigation techniques to facilitate sharing between IMT-Advanced and radar systems.
Sharing studies between Land-based/Shipborne Radar and IMT-Advanced have concluded that: – The required separation distance is approximately 70 km in co-channel case. – Using non-overlapping adjacent channel analysis, the required separation distance is less
than 1 km, depending on the radar type and antenna type.
The frequency separation analyses concluded that: – The frequency separations vary between 13 and 136 MHz when interference is from
IMT-Advanced to radar. – Based on a worst case analyses frequency separation is greater than 1 GHz when
interference is from radar to IMT-Advanced.
These results show that co-frequency sharing between radiolocation services and IMT devices could be difficult in the same geographical area within the application of mitigation techniques.
Potential mitigation techniques shown in Annex 3 may reduce the interference, and may facilitate sharing between IMT-Advanced systems and radiolocation systems. For example, a calculation of a hypothetical scenario from radar to IMT-Advanced case resulted in an 80% reduction in frequency separation to approximately 560 MHz, and another calculation resulted in a 60% reduction in range separation to approximately 70 km, if such mitigation techniques could be applied.
Further studies are required on the development of the actual specifications of mitigation techniques, such as procedures and performance in functionality.
Administrations may consider geographical segregation and mitigation techniques to facilitate sharing between IMT-Advanced and radar systems.
6 Definitions and abbreviations
6.1 Definitions No new definitions were included.
Rep. ITU-R M.2111 7
6.2 Abbreviations ACLR Adjacent channel leakage power ratio
CDF Cumulative distribution function
CDMA Code division multiple access
DFS Dynamic frequency selection
FDR Frequency dependent rejection
FDRBB Frequency dependent rejection baseband
IPS Integrated propagation system (computer model)
LOS Line of sight
NLOS Non line of sight
NTIA National Telecommunications and Information Administration
OFDM Orthogonal frequency division multiplexing
OFR Off frequency rejection
OTR On tune rejection
OOB Out of band
SDMA Spatial division multiple access
Annex 1
Compatibility between the radiolocation service and IMT-Advanced systems operating in the mobile service in the 3 400-3 700 MHz band
Study A
1 Introduction This annex provides a sharing study addressing aggregate interference and adjacent channel interference. The result of the sharing study shows that co-channel interference is very severe and introduction of various mitigation techniques as well as geographical segregation could be considered. It also shows that adjacent channel interference from IMT-Advanced to the radar systems would be within the tolerable level if radar is not located within a service cell of IMT-Advanced systems.
Separation distances obtained in the simulation is necessary in principle. However, taking into account the number of radars, location of radars, and area where IMT-Advanced will be deployed, mitigation techniques, such as DFS function, could be considered as well as the geographical segregation.
8 Rep. ITU-R M.2111
2 Technical aspect and parameters
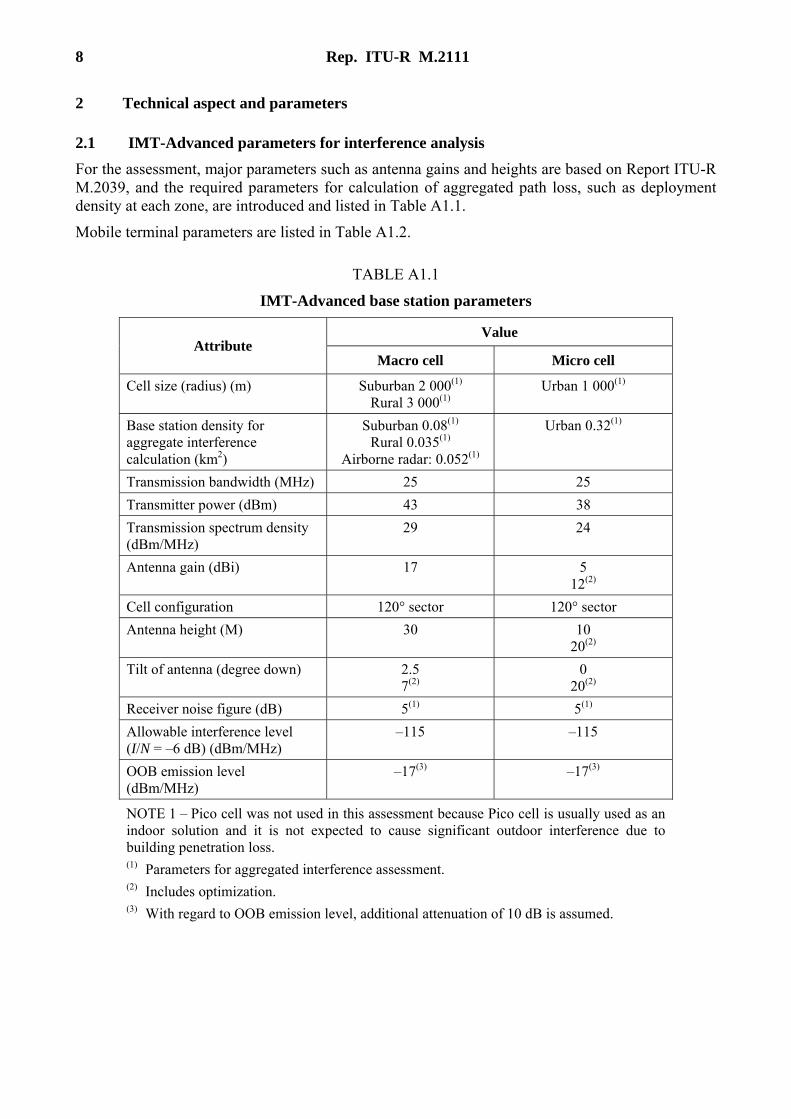
2.1 IMT-Advanced parameters for interference analysis For the assessment, major parameters such as antenna gains and heights are based on Report ITU-R M.2039, and the required parameters for calculation of aggregated path loss, such as deployment density at each zone, are introduced and listed in Table A1.1.
Mobile terminal parameters are listed in Table A1.2.
TABLE A1.1
IMT-Advanced base station parameters
Value Attribute
Macro cell Micro cell
Cell size (radius) (m) Suburban 2 000(1) Rural 3 000(1)
Urban 1 000(1)
Base station density for aggregate interference calculation (km2)
Suburban 0.08(1) Rural 0.035(1)
Airborne radar: 0.052(1)
Urban 0.32(1)
Transmission bandwidth (MHz) 25 25 Transmitter power (dBm) 43 38 Transmission spectrum density (dBm/MHz)
29 24
Antenna gain (dBi) 17 5 12(2)
Cell configuration 120° sector 120° sector Antenna height (M) 30 10
20(2) Tilt of antenna (degree down) 2.5
7(2) 0
20(2) Receiver noise figure (dB) 5(1) 5(1) Allowable interference level (I/N = –6 dB) (dBm/MHz)
–115 –115
OOB emission level (dBm/MHz)
–17(3) –17(3)
NOTE 1 – Pico cell was not used in this assessment because Pico cell is usually used as an indoor solution and it is not expected to cause significant outdoor interference due to building penetration loss. (1) Parameters for aggregated interference assessment. (2) Includes optimization. (3) With regard to OOB emission level, additional attenuation of 10 dB is assumed.
Rep. ITU-R M.2111 9
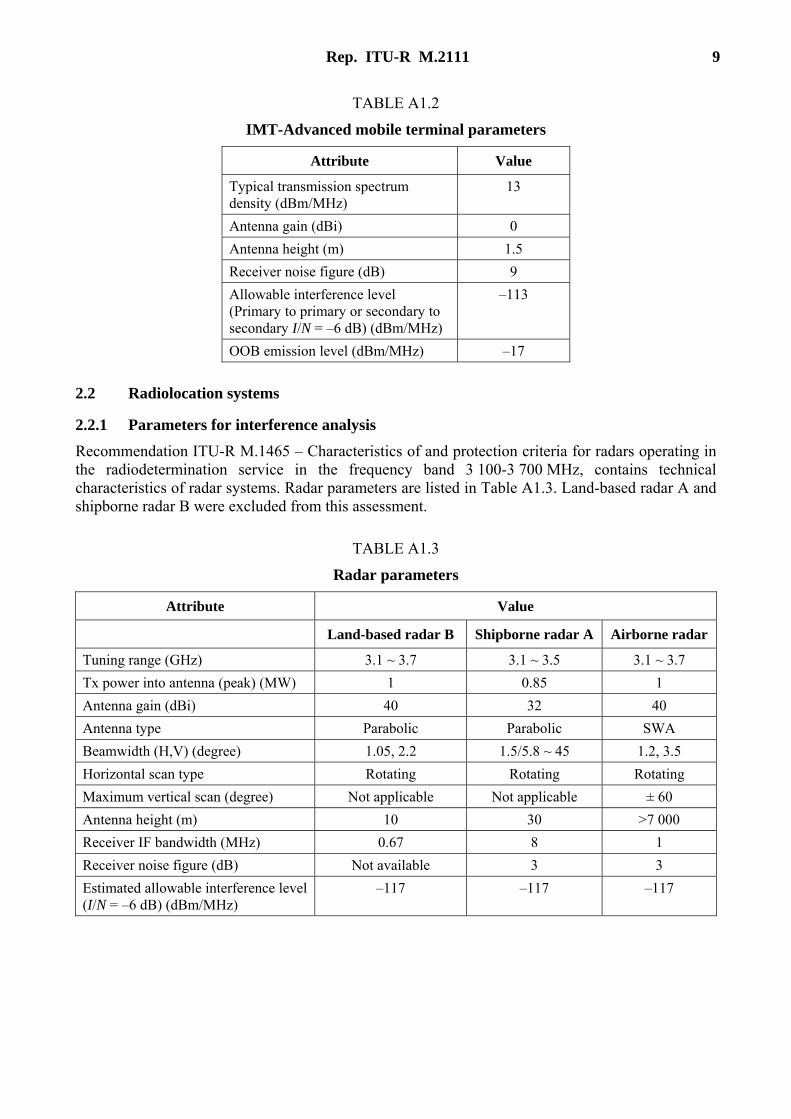
TABLE A1.2
IMT-Advanced mobile terminal parameters
Attribute Value
Typical transmission spectrum density (dBm/MHz)
13
Antenna gain (dBi) 0 Antenna height (m) 1.5 Receiver noise figure (dB) 9 Allowable interference level (Primary to primary or secondary to secondary I/N = –6 dB) (dBm/MHz)
–113
OOB emission level (dBm/MHz) –17
2.2 Radiolocation systems
2.2.1 Parameters for interference analysis Recommendation ITU-R M.1465 – Characteristics of and protection criteria for radars operating in the radiodetermination service in the frequency band 3 100-3 700 MHz, contains technical characteristics of radar systems. Radar parameters are listed in Table A1.3. Land-based radar A and shipborne radar B were excluded from this assessment.
TABLE A1.3
Radar parameters
Attribute Value
Land-based radar B Shipborne radar A Airborne radar
Tuning range (GHz) 3.1 ~ 3.7 3.1 ~ 3.5 3.1 ~ 3.7 Tx power into antenna (peak) (MW) 1 0.85 1 Antenna gain (dBi) 40 32 40 Antenna type Parabolic Parabolic SWA Beamwidth (H,V) (degree) 1.05, 2.2 1.5/5.8 ~ 45 1.2, 3.5 Horizontal scan type Rotating Rotating Rotating Maximum vertical scan (degree) Not applicable Not applicable ± 60 Antenna height (m) 10 30 >7 000 Receiver IF bandwidth (MHz) 0.67 8 1 Receiver noise figure (dB) Not available 3 3 Estimated allowable interference level (I/N = –6 dB) (dBm/MHz)
–117 –117 –117
10 Rep. ITU-R M.2111
TABLE A1.3 (end)
Attribute Value
Land-based radar B Shipborne radar A Airborne radar
Deployment area (1 000 km2) 1 468 188 Worldwide Number of systems per area (Integer) 6 1-2 36
NOTE 1 – Total deployment area of all radars excluding airborne radar is 2 199 000 km2. It takes only 0.4% of the total earth surface. This deployment density was based upon a previous version of Recommendation ITU-R M.1465 however the in force version does not provide the information to derive the conclusion of 0.4%. NOTE 2 – Line of sight distance between airborne radar and macro base station antenna is 365 km. Total deployment area including the interfering area to the airborne radar would be at most 3% of the total earth surface when all radars listed in Recommendation ITU-R M.1465 are activated simultaneously. This deployment density was based upon a previous version of Recommendation ITU-R M.1465 however the in force version does not provide the information to derive the conclusion of 3%.
2.2.2 Protection criteria Since both Recommendations ITU-R M.1461 and ITU-R M.1465 note that signal from other service resulting in an I/N ratio of –6 dB or below is acceptable to the radar systems, an I/N of –6 dB is used for the protection criteria for the radars analysed.
2.3 Antenna radiation pattern estimation ITU-R Recommendations which describe the antenna radiation patterns used in this assessment are listed in Table A1.4.
Because Recommendation ITU-R M.1465 defines only technical characteristics of radar systems, and there is no existing radar antenna reference pattern currently available in ITU-R, the pattern in Recommendation ITU-R M.1652, Annex 6, Appendix 1 is used in this analysis.
TABLE A1.4
ITU-R Recommendations for antenna pattern estimation
Antenna type RPE referenced Rec.
IMT-Advanced base station sector antenna F.1336-1, K = 0 Sector
IMT-Advanced mobile terminal antenna F.1336-1, K = 0 Omni Land-based radar B parabolic M.1652, Annex 6, Appendix 1
Shipborne radar A fan beam M.1652, Annex 6, Appendix 1 Airborne radar SWA antenna M.1652, Annex 6, Appendix 1
Rep. ITU-R M.2111 11
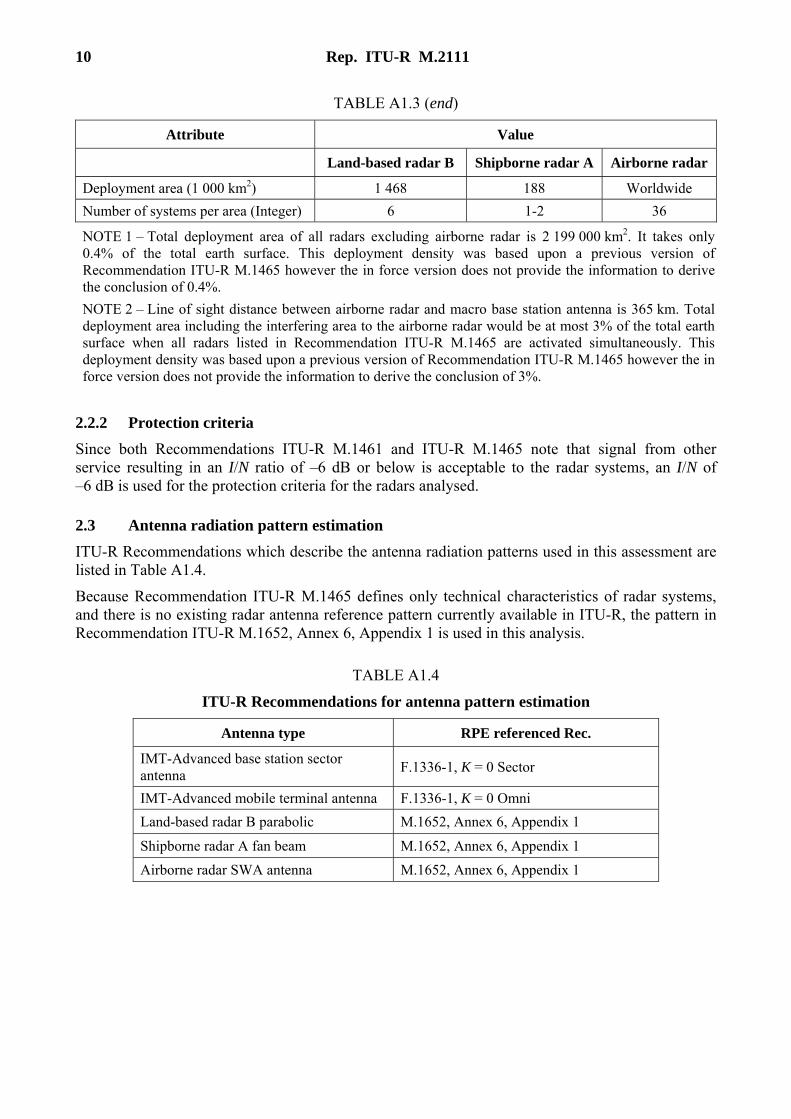
3 Scenarios for conducting aggregate interference studies
3.1 Radar and IMT-Advanced deployment scenario In the deployment scenario shown in Fig. A1-1, IMT-Advanced cells deploy surrounding the radar site. As the worst case assumption, one of three antennas at each base station located beneath the radar antenna mainbeam axis faces toward the radar antenna: a) As the aggregated interference, interferences from stations located in the ring-shaped area
between radiuses R0 and R1 are summed up, as indicated in Fig. A1-1. b) R1 is the maximum line of site distance between radar and interfering stations at effective
earth curvature of 4/3. c) The value of R0 at which the aggregated interference level becomes equal to the allowable
interference level is defined as the required separation distance between the radar and aggregate interfering stations.
d) IMT-Advanced deployment zone is categorized into urban, suburban and rural zones. It is assumed that micro cell is deployed at urban zone, and macro cell at suburban and rural zones.
e) Monte Carlo simulation is applied in the same manner as described in Recommendation ITU-R M.1652.
12 Rep. ITU-R M.2111
FIGURE A1-1 Radar and IMT-Advanced deployment model for aggregate interference consideration
3.2 Radar location The size of urban, suburban and rural zones has been determined in accordance with Recommendation ITU-R M.1652.
Rep. ITU-R M.2111 13
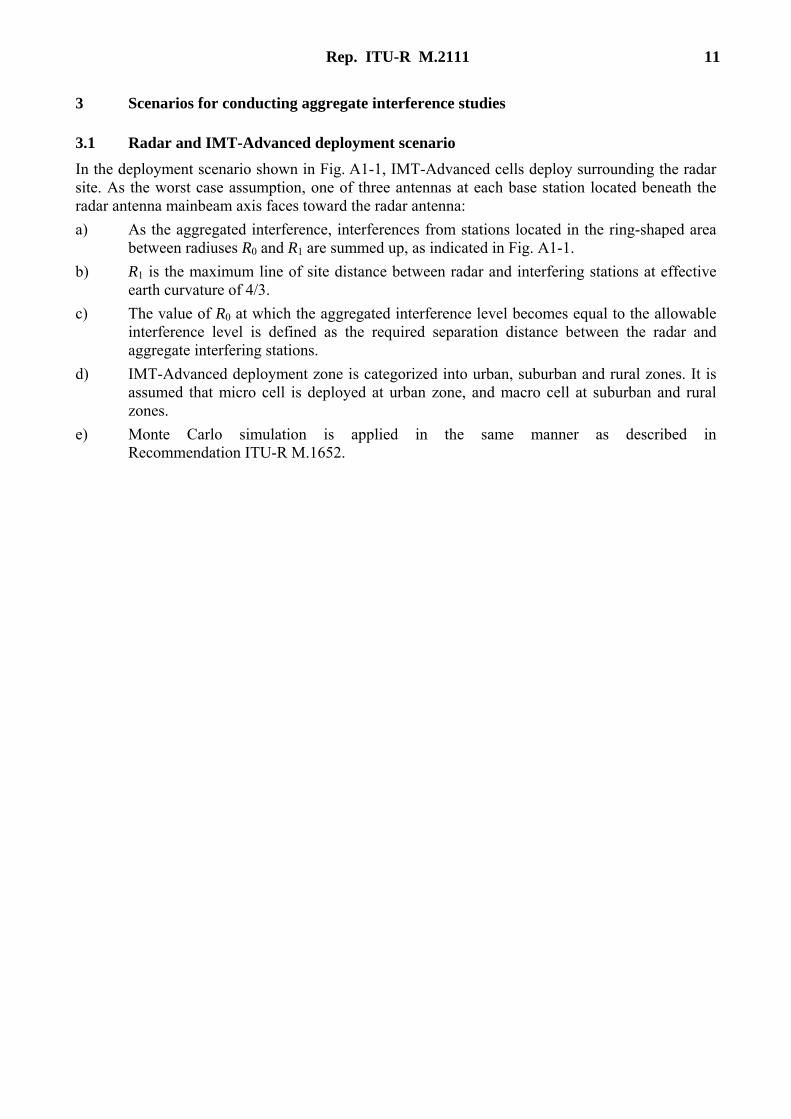
3.2.1 Land-based radar B Though land-based radars are transportable, it may not usually be facing toward urban area. It may usually be located in the rural area facing toward the boundary of country, ocean surface or high altitude targets. Fig. A1-2 shows the assumption of geographical surrounding of land-based radar B used in this assessment.
FIGURE A1-2 Assumed surrounding of land-based radar B
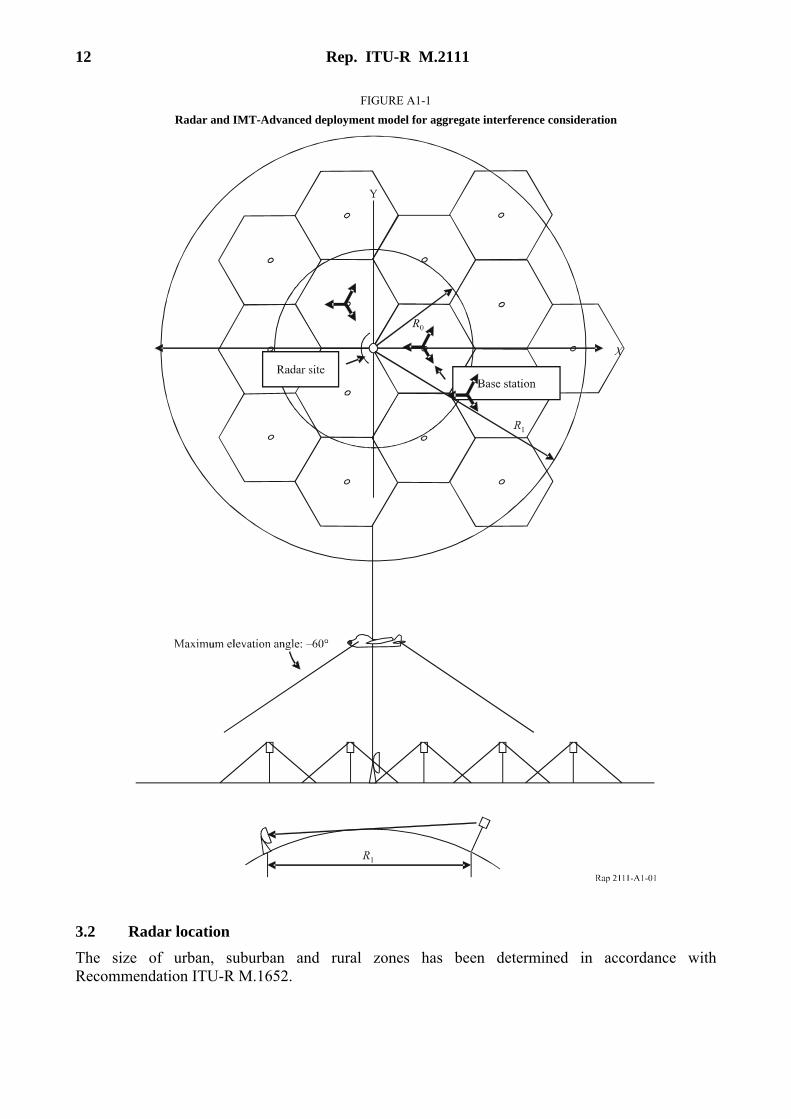
3.2.2 Shipborne radar A Though shipborne radars are usually used during open ocean transit, they may also be used in coastal areas. In this assessment, the ship is assumed to be at her home port which is the centre of urban zone as indicated in Fig. A1-3.
FIGURE A1-3 Assumed surrounding of shipborne radar A
14 Rep. ITU-R M.2111
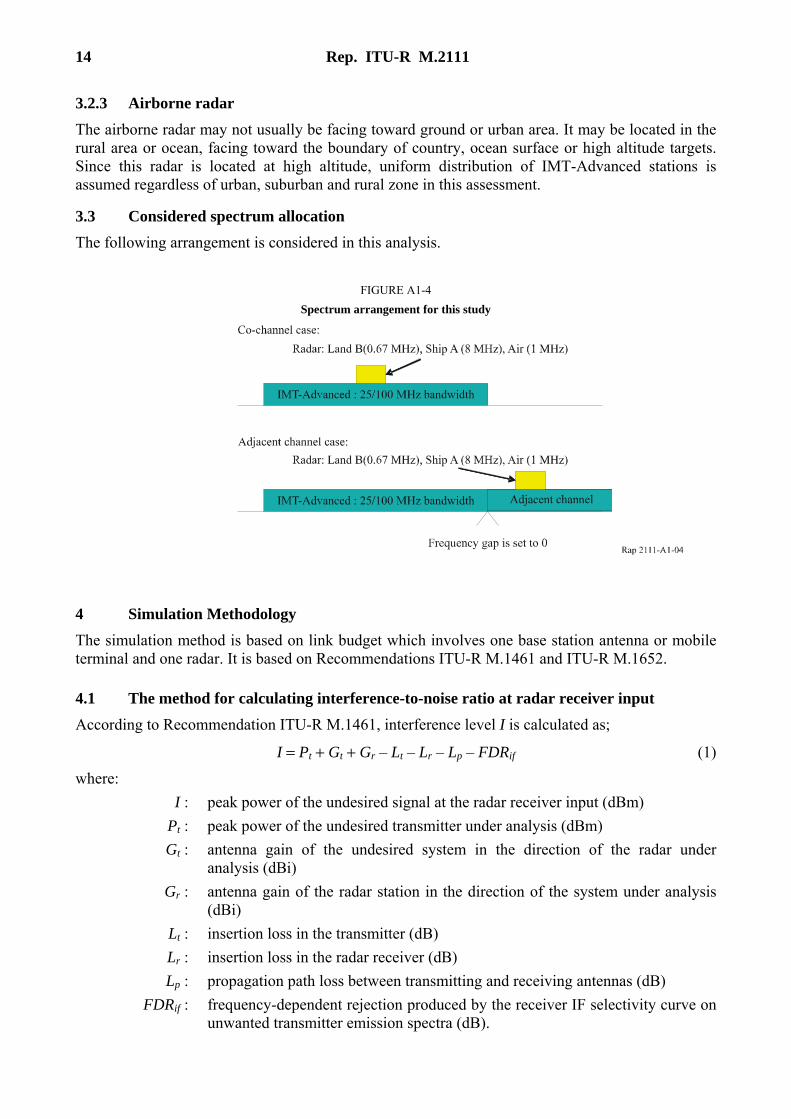
3.2.3 Airborne radar The airborne radar may not usually be facing toward ground or urban area. It may be located in the rural area or ocean, facing toward the boundary of country, ocean surface or high altitude targets. Since this radar is located at high altitude, uniform distribution of IMT-Advanced stations is assumed regardless of urban, suburban and rural zone in this assessment.
3.3 Considered spectrum allocation The following arrangement is considered in this analysis.
FIGURE A1-4 Spectrum arrangement for this study
4 Simulation Methodology The simulation method is based on link budget which involves one base station antenna or mobile terminal and one radar. It is based on Recommendations ITU-R M.1461 and ITU-R M.1652.
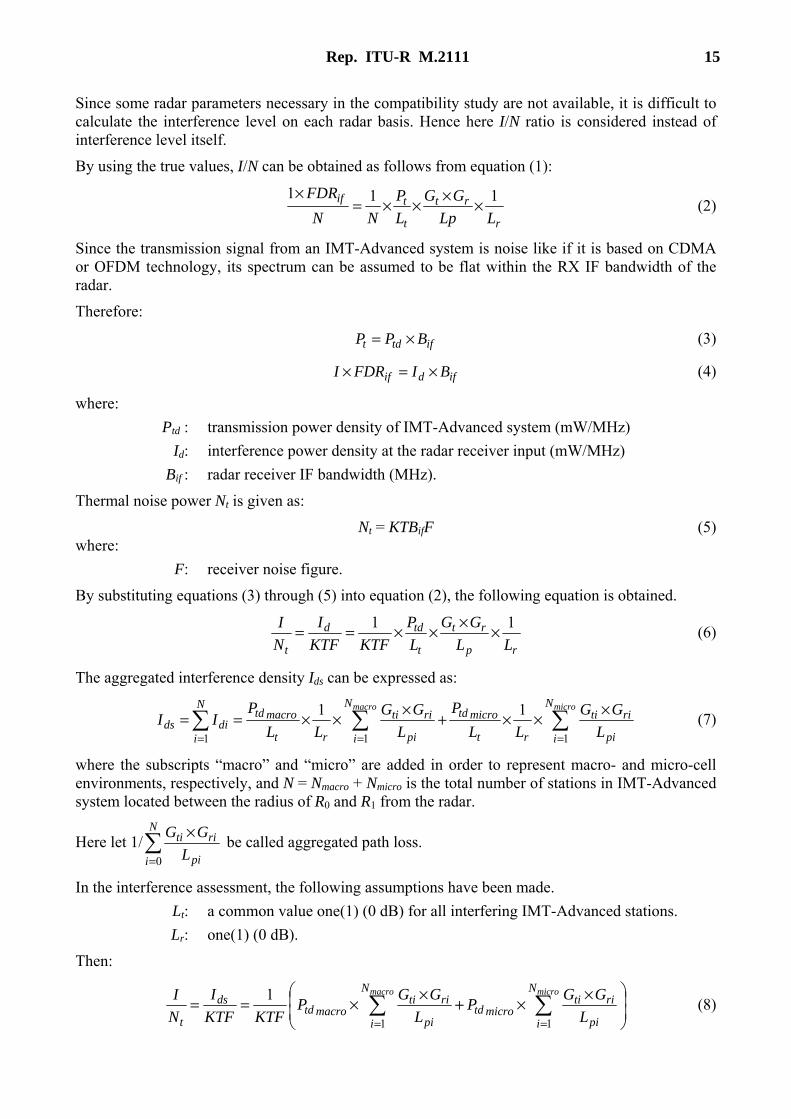
4.1 The method for calculating interference-to-noise ratio at radar receiver input According to Recommendation ITU-R M.1461, interference level I is calculated as;
I = Pt + Gt + Gr – Lt – Lr – Lp – FDRif (1)
where: I : peak power of the undesired signal at the radar receiver input (dBm) Pt : peak power of the undesired transmitter under analysis (dBm) Gt : antenna gain of the undesired system in the direction of the radar under
analysis (dBi) Gr : antenna gain of the radar station in the direction of the system under analysis
(dBi) Lt : insertion loss in the transmitter (dB) Lr : insertion loss in the radar receiver (dB) Lp : propagation path loss between transmitting and receiving antennas (dB) FDRif : frequency-dependent rejection produced by the receiver IF selectivity curve on
unwanted transmitter emission spectra (dB).
Rep. ITU-R M.2111 15
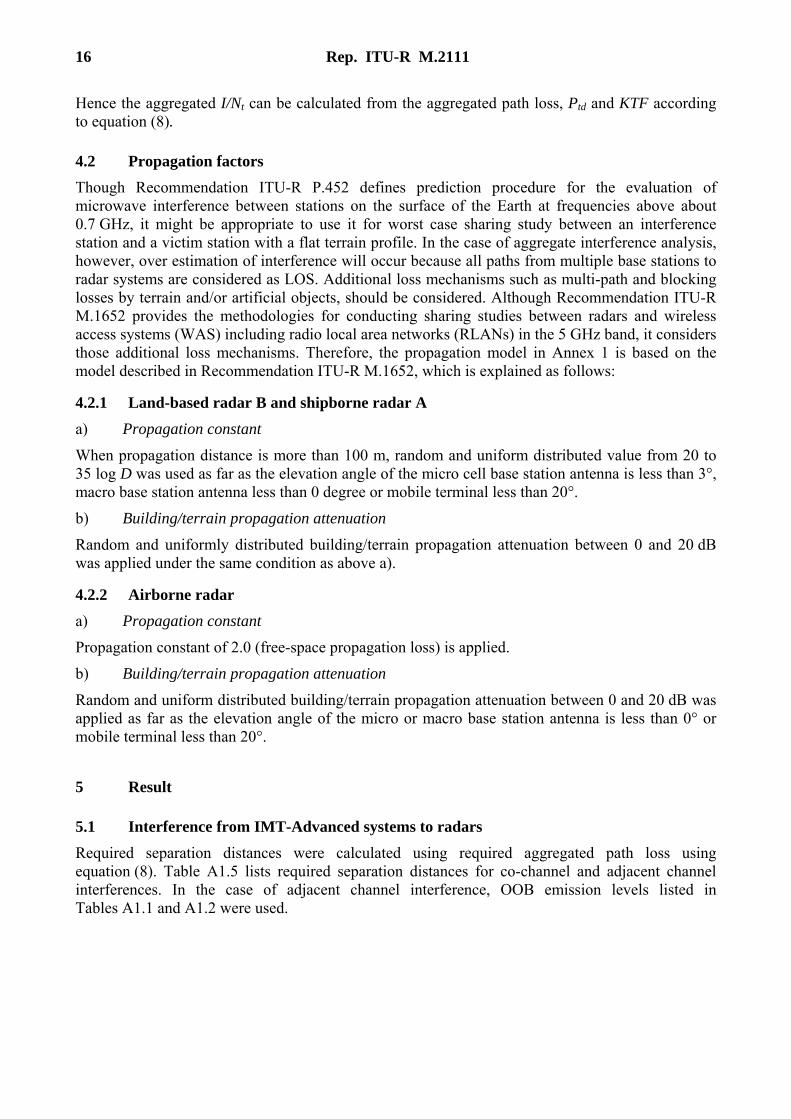
Since some radar parameters necessary in the compatibility study are not available, it is difficult to calculate the interference level on each radar basis. Hence here I/N ratio is considered instead of interference level itself.
By using the true values, I/N can be obtained as follows from equation (1):
r
rt
t
tif
LLpGG
LP
NNFDR 111
××××=×
(2)
Since the transmission signal from an IMT-Advanced system is noise like if it is based on CDMA or OFDM technology, its spectrum can be assumed to be flat within the RX IF bandwidth of the radar.
Therefore:
iftdt BPP ×= (3)
ifdif BIFDRI ×=× (4)
where: Ptd : transmission power density of IMT-Advanced system (mW/MHz) Id: interference power density at the radar receiver input (mW/MHz) Bif : radar receiver IF bandwidth (MHz).
Thermal noise power Nt is given as:
Nt = KTBifF (5) where: F: receiver noise figure.
By substituting equations (3) through (5) into equation (2), the following equation is obtained.
rp
rt
t
tdd
t LLGG
LP
KTFKTFI
NI 11 ××××== (6)
The aggregated interference density Ids can be expressed as:
∑∑∑===
×××+×××==micromacro N
i pi
riti
rt
microtdN
i pi
riti
rt
macrotdN
idids L
GGLL
PL
GGLL
PII
111
11 (7)
where the subscripts “macro” and “micro” are added in order to represent macro- and micro-cell environments, respectively, and N = Nmacro + Nmicro is the total number of stations in IMT-Advanced system located between the radius of R0 and R1 from the radar.
Here let 1/∑=
×N
i pi
ritiL
GG
0 be called aggregated path loss.
In the interference assessment, the following assumptions have been made. Lt: a common value one(1) (0 dB) for all interfering IMT-Advanced stations. Lr: one(1) (0 dB).
Then:
⎟⎟⎠
⎞⎜⎜⎝
⎛ ××+××== ∑∑==
micromacro N
i pi
ritimicrotd
N
i pi
ritimacrotd
ds
t LGGP
LGGP
KTFKTFI
NI
11
1 (8)
16 Rep. ITU-R M.2111
Hence the aggregated I/Nt can be calculated from the aggregated path loss, Ptd and KTF according to equation (8).
4.2 Propagation factors Though Recommendation ITU-R P.452 defines prediction procedure for the evaluation of microwave interference between stations on the surface of the Earth at frequencies above about 0.7 GHz, it might be appropriate to use it for worst case sharing study between an interference station and a victim station with a flat terrain profile. In the case of aggregate interference analysis, however, over estimation of interference will occur because all paths from multiple base stations to radar systems are considered as LOS. Additional loss mechanisms such as multi-path and blocking losses by terrain and/or artificial objects, should be considered. Although Recommendation ITU-R M.1652 provides the methodologies for conducting sharing studies between radars and wireless access systems (WAS) including radio local area networks (RLANs) in the 5 GHz band, it considers those additional loss mechanisms. Therefore, the propagation model in Annex 1 is based on the model described in Recommendation ITU-R M.1652, which is explained as follows:
4.2.1 Land-based radar B and shipborne radar A a) Propagation constant
When propagation distance is more than 100 m, random and uniform distributed value from 20 to 35 log D was used as far as the elevation angle of the micro cell base station antenna is less than 3°, macro base station antenna less than 0 degree or mobile terminal less than 20°.
b) Building/terrain propagation attenuation
Random and uniformly distributed building/terrain propagation attenuation between 0 and 20 dB was applied under the same condition as above a).
4.2.2 Airborne radar a) Propagation constant
Propagation constant of 2.0 (free-space propagation loss) is applied.
b) Building/terrain propagation attenuation
Random and uniform distributed building/terrain propagation attenuation between 0 and 20 dB was applied as far as the elevation angle of the micro or macro base station antenna is less than 0° or mobile terminal less than 20°.
5 Result
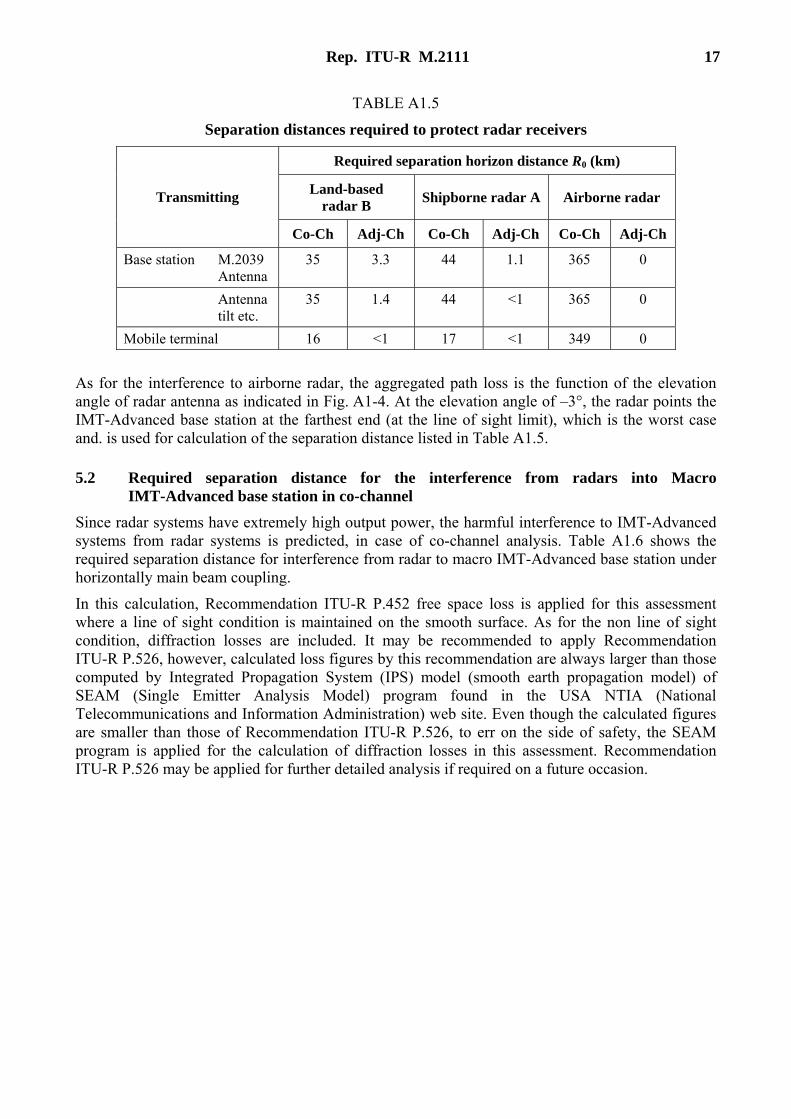
5.1 Interference from IMT-Advanced systems to radars Required separation distances were calculated using required aggregated path loss using equation (8). Table A1.5 lists required separation distances for co-channel and adjacent channel interferences. In the case of adjacent channel interference, OOB emission levels listed in Tables A1.1 and A1.2 were used.
Rep. ITU-R M.2111 17
TABLE A1.5
Separation distances required to protect radar receivers
Required separation horizon distance R0 (km)
Land-based radar B Shipborne radar A Airborne radar Transmitting
Co-Ch Adj-Ch Co-Ch Adj-Ch Co-Ch Adj-Ch
Base station M.2039 Antenna
35 3.3 44 1.1 365 0
Antenna tilt etc.
35 1.4 44 <1 365 0
Mobile terminal 16 <1 17 <1 349 0
As for the interference to airborne radar, the aggregated path loss is the function of the elevation angle of radar antenna as indicated in Fig. A1-4. At the elevation angle of –3°, the radar points the IMT-Advanced base station at the farthest end (at the line of sight limit), which is the worst case and. is used for calculation of the separation distance listed in Table A1.5.
5.2 Required separation distance for the interference from radars into Macro IMT-Advanced base station in co-channel
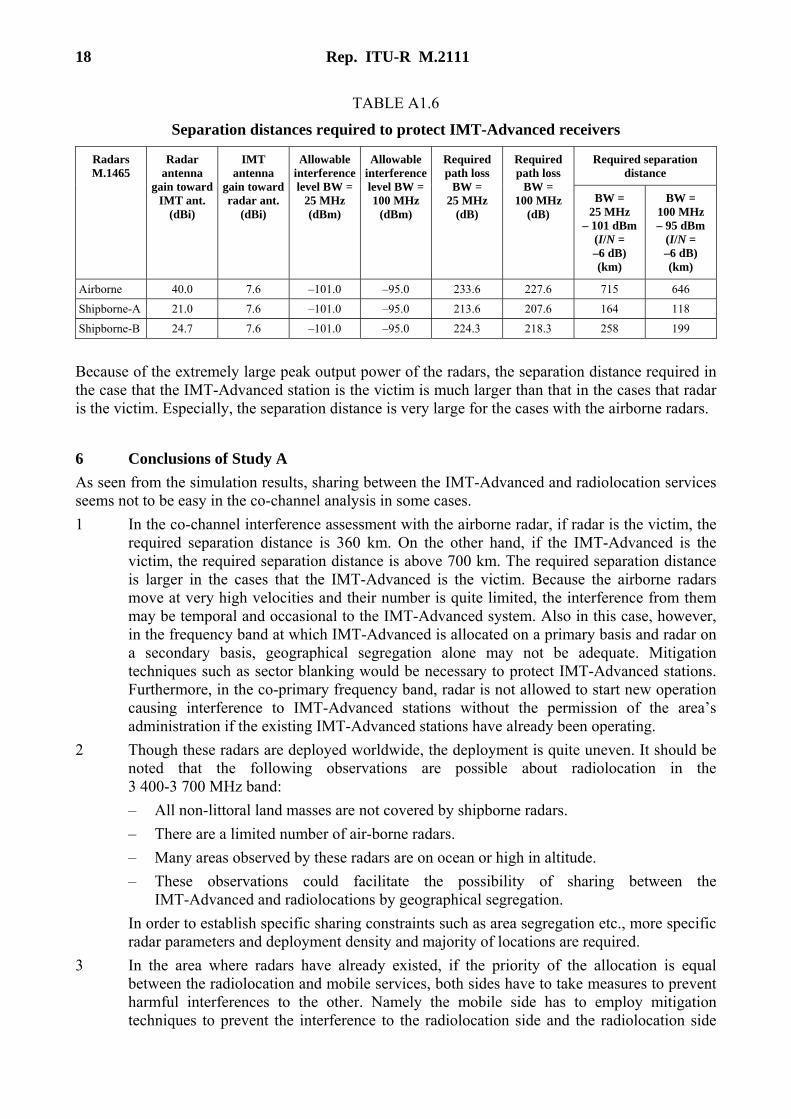
Since radar systems have extremely high output power, the harmful interference to IMT-Advanced systems from radar systems is predicted, in case of co-channel analysis. Table A1.6 shows the required separation distance for interference from radar to macro IMT-Advanced base station under horizontally main beam coupling.
In this calculation, Recommendation ITU-R P.452 free space loss is applied for this assessment where a line of sight condition is maintained on the smooth surface. As for the non line of sight condition, diffraction losses are included. It may be recommended to apply Recommendation ITU-R P.526, however, calculated loss figures by this recommendation are always larger than those computed by Integrated Propagation System (IPS) model (smooth earth propagation model) of SEAM (Single Emitter Analysis Model) program found in the USA NTIA (National Telecommunications and Information Administration) web site. Even though the calculated figures are smaller than those of Recommendation ITU-R P.526, to err on the side of safety, the SEAM program is applied for the calculation of diffraction losses in this assessment. Recommendation ITU-R P.526 may be applied for further detailed analysis if required on a future occasion.
18 Rep. ITU-R M.2111
TABLE A1.6
Separation distances required to protect IMT-Advanced receivers
Required separation distance
Radars M.1465
Radar antenna
gain toward IMT ant.
(dBi)
IMT antenna
gain toward radar ant.
(dBi)
Allowable interference level BW =
25 MHz (dBm)
Allowable interference level BW = 100 MHz
(dBm)
Required path loss
BW = 25 MHz
(dB)
Required path loss
BW = 100 MHz
(dB) BW =
25 MHz – 101 dBm
(I/N = –6 dB) (km)
BW = 100 MHz – 95 dBm
(I/N = –6 dB) (km)
Airborne 40.0 7.6 –101.0 –95.0 233.6 227.6 715 646
Shipborne-A 21.0 7.6 –101.0 –95.0 213.6 207.6 164 118
Shipborne-B 24.7 7.6 –101.0 –95.0 224.3 218.3 258 199
Because of the extremely large peak output power of the radars, the separation distance required in the case that the IMT-Advanced station is the victim is much larger than that in the cases that radar is the victim. Especially, the separation distance is very large for the cases with the airborne radars.
6 Conclusions of Study A As seen from the simulation results, sharing between the IMT-Advanced and radiolocation services seems not to be easy in the co-channel analysis in some cases. 1 In the co-channel interference assessment with the airborne radar, if radar is the victim, the
required separation distance is 360 km. On the other hand, if the IMT-Advanced is the victim, the required separation distance is above 700 km. The required separation distance is larger in the cases that the IMT-Advanced is the victim. Because the airborne radars move at very high velocities and their number is quite limited, the interference from them may be temporal and occasional to the IMT-Advanced system. Also in this case, however, in the frequency band at which IMT-Advanced is allocated on a primary basis and radar on a secondary basis, geographical segregation alone may not be adequate. Mitigation techniques such as sector blanking would be necessary to protect IMT-Advanced stations. Furthermore, in the co-primary frequency band, radar is not allowed to start new operation causing interference to IMT-Advanced stations without the permission of the area’s administration if the existing IMT-Advanced stations have already been operating.
2 Though these radars are deployed worldwide, the deployment is quite uneven. It should be noted that the following observations are possible about radiolocation in the 3 400-3 700 MHz band: – All non-littoral land masses are not covered by shipborne radars. – There are a limited number of air-borne radars. – Many areas observed by these radars are on ocean or high in altitude. – These observations could facilitate the possibility of sharing between the
IMT-Advanced and radiolocations by geographical segregation. In order to establish specific sharing constraints such as area segregation etc., more specific
radar parameters and deployment density and majority of locations are required. 3 In the area where radars have already existed, if the priority of the allocation is equal
between the radiolocation and mobile services, both sides have to take measures to prevent harmful interferences to the other. Namely the mobile side has to employ mitigation techniques to prevent the interference to the radiolocation side and the radiolocation side
Rep. ITU-R M.2111 19
has to take measures to prevent the interference. Various interference mitigation techniques as well as frequency separation could be considered to enable efficient spectrum sharing.
4 Since interference to IMT-Advanced from radar may be severe due to its high output power, some mitigation techniques are indispensable.
Study B
Range separation
1 Introduction This annex provides a study of sharing between existing radar systems and IMT-Advanced systems. It should be noted that some of the radio frequency parameters of IMT-Advanced are not fully defined within the ITU-R at the time of approval of this Report. Interested parties are urged to define these parameters to promote more complete and comprehensive sharing studies.
2 IMT-Advanced technical characteristics
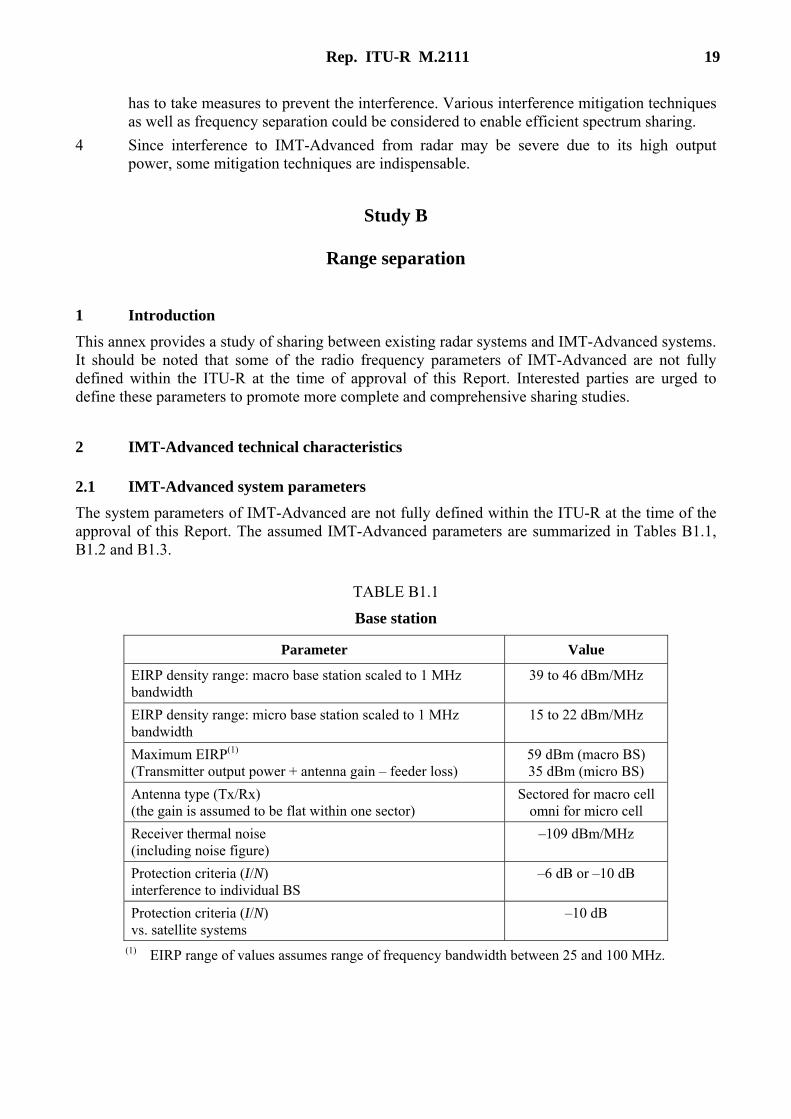
2.1 IMT-Advanced system parameters The system parameters of IMT-Advanced are not fully defined within the ITU-R at the time of the approval of this Report. The assumed IMT-Advanced parameters are summarized in Tables B1.1, B1.2 and B1.3.
TABLE B1.1
Base station
Parameter Value
EIRP density range: macro base station scaled to 1 MHz bandwidth
39 to 46 dBm/MHz
EIRP density range: micro base station scaled to 1 MHz bandwidth
15 to 22 dBm/MHz
Maximum EIRP(1) (Transmitter output power + antenna gain – feeder loss)
59 dBm (macro BS) 35 dBm (micro BS)
Antenna type (Tx/Rx) (the gain is assumed to be flat within one sector)
Sectored for macro cell omni for micro cell
Receiver thermal noise (including noise figure)
–109 dBm/MHz
Protection criteria (I/N) interference to individual BS
–6 dB or –10 dB
Protection criteria (I/N) vs. satellite systems
–10 dB
(1) EIRP range of values assumes range of frequency bandwidth between 25 and 100 MHz.
20 Rep. ITU-R M.2111
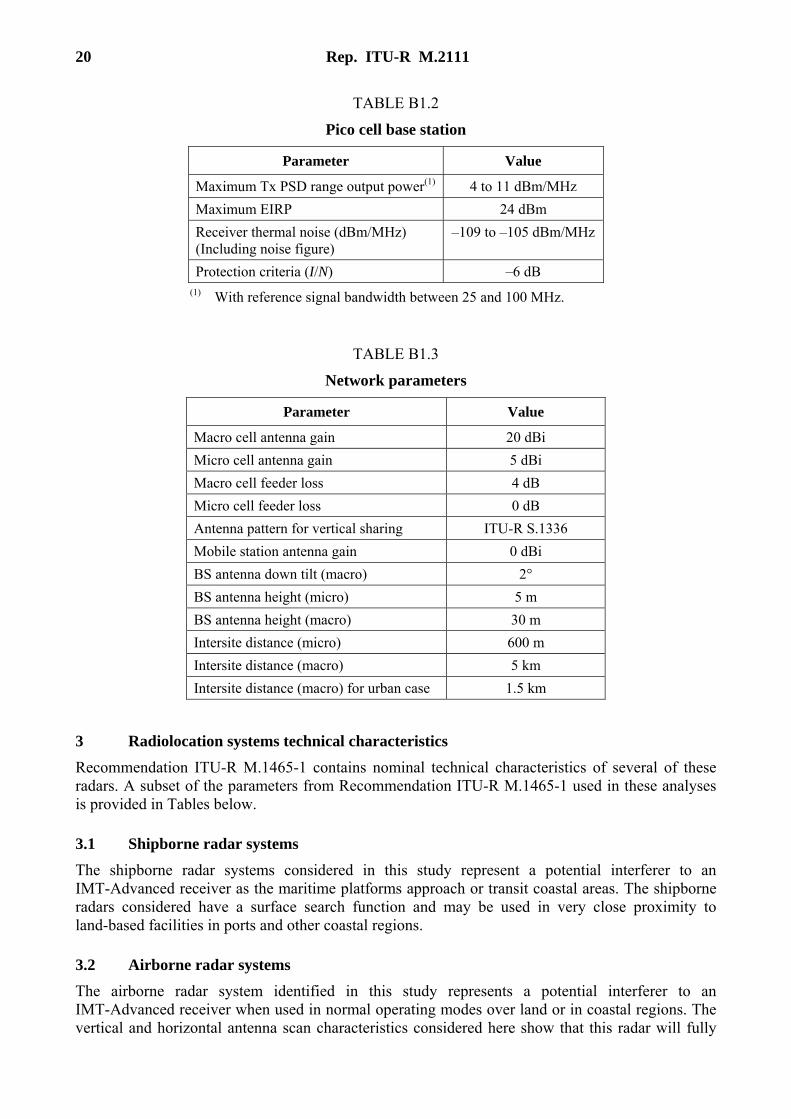
TABLE B1.2
Pico cell base station
Parameter Value
Maximum Tx PSD range output power(1) 4 to 11 dBm/MHz Maximum EIRP 24 dBm Receiver thermal noise (dBm/MHz) (Including noise figure)
–109 to –105 dBm/MHz
Protection criteria (I/N) –6 dB (1) With reference signal bandwidth between 25 and 100 MHz.
TABLE B1.3
Network parameters
Parameter Value
Macro cell antenna gain 20 dBi Micro cell antenna gain 5 dBi Macro cell feeder loss 4 dB Micro cell feeder loss 0 dB Antenna pattern for vertical sharing ITU-R S.1336 Mobile station antenna gain 0 dBi BS antenna down tilt (macro) 2° BS antenna height (micro) 5 m BS antenna height (macro) 30 m Intersite distance (micro) 600 m Intersite distance (macro) 5 km Intersite distance (macro) for urban case 1.5 km
3 Radiolocation systems technical characteristics Recommendation ITU-R M.1465-1 contains nominal technical characteristics of several of these radars. A subset of the parameters from Recommendation ITU-R M.1465-1 used in these analyses is provided in Tables below.
3.1 Shipborne radar systems The shipborne radar systems considered in this study represent a potential interferer to an IMT-Advanced receiver as the maritime platforms approach or transit coastal areas. The shipborne radars considered have a surface search function and may be used in very close proximity to land-based facilities in ports and other coastal regions.
3.2 Airborne radar systems The airborne radar system identified in this study represents a potential interferer to an IMT-Advanced receiver when used in normal operating modes over land or in coastal regions. The vertical and horizontal antenna scan characteristics considered here show that this radar will fully
Rep. ITU-R M.2111 21
illuminate ground-based systems on a regular basis and line-of-sight propagation is appropriate when modeling possible interference. An antenna height of 8 000 m is used in this dynamic simulation.
3.3 Land-based radar systems The land-based radar systems were not simulated.
3.4 Radiolocation service protection criteria The dynamic analysis in this study uses an I/N of –6 dB as the protection criteria for all the radars considered, as documented in Recommendation ITU-R M.1465.
4 Interference assessment of IMT-Advanced systems into radiolocation service Given that subscriber units in IMT-Advanced systems are generally mobile and that the radio environments defined include outdoor cells, it is assumed that each environment may have links that are noise-limited. The interference threshold, IT, to be considered in this sharing study is the interference-to-noise ratio threshold derived from Recommendation ITU-R M.1461 as:
IT = NRx + Protection criteria + bandwidth correction factor (1) where: IT: required threshold not to be exceeded (dB) Protection criteria = –6 dB for radar. There is no time percentage associated with
this value within ITU-R Recommendations Bandwidth correction factor, OTR value in equations (8) and (9) (dB) NRx: radar receiver inherent noise level (dBm)
The noise at the receiver input referred to the IF bandwidth is given by:
( ) ( ) NFBTkN IFRx ++⋅= log10log10 0 (2)
where: NRx: receiver noise power (dBm) k: Boltzmann’s constant = 1.38 × 10⁻²³ T0: absolute temperature (K) BIF: receiver’s intermediate frequency bandwidth (Hz) NF: receiver noise figure (dB)
The total interference power at the radar receiver IF passband is:
I = PT + GT + GR – LT – LR – LP – FDRIF dBm (3) where: I: peak power of each IMT-Advanced at the radar receiver (dBm) PT: peak power of the IMT-Advanced transmitter under analysis (dBm) GT: antenna gain of the IMT-Advanced transmitter under analysis in the direction
of the radar (dBi) GR: radar receiver antenna gain in the direction of the IMT-Advanced under
analysis (dBi) LT: insertion loss in the IMT-Advanced transmitter (dB), assumed zero
22 Rep. ITU-R M.2111
LR: insertion loss in the victim radar receiver (dB), assumed zero LP: propagation path loss between transmitting and receiving antennas (dB), free
space loss or ITU-R P.452 FDRIF: frequency-dependent rejection produced by the receiver IF selectivity curve on
unwanted transmitter emission spectra (dB).
The aggregate interference is the sum of all IMT-Advanced interferers at each time sample.
[ ]CBAI iSampleTimeTotal ++= log10___ dBm (4) where:
⎥⎥⎥
⎦
⎤
⎢⎢⎢
⎣
⎡= ∑
=
⎟⎟⎠
⎞⎜⎜⎝
⎛−MacroofNo
n
MacroA
__
1
110
110 (4-a)
⎥⎥⎥
⎦
⎤
⎢⎢⎢
⎣
⎡= ∑
=
⎟⎟⎠
⎞⎜⎜⎝
⎛−MicroofNo
n
MicroB
__
1
110
110 (4-b)
⎥⎥⎥
⎦
⎤
⎢⎢⎢
⎣
⎡= ∑
=
⎟⎟⎠
⎞⎜⎜⎝
⎛−PicoofNo
n
MobilePicoC
__
1
110
1)(10 (4-c)
The FDR value is determined from Recommendation ITU-R SM.337. FDR is the rejection provided by a receiver to a transmitted signal as a result of the limited bandwidth of the receiver with respect to the transmitted signal and the detuning between the receiver and the transmitter.
fffhfp
ffp=fFDR
d)()(
d)(log10)(
0
0
∆+⋅
∆
∫
∫∞
∞
dB (5)
where: p(f): power spectral density of the interfering signal (W/Hz) h(f): normalized frequency response of the receiver.
IMTTxRx fff _−=∆ (6) where: fRx: receiver tuned frequency fTx_IMT: IMT-Advanced interferer tuned frequency.
FDR can be divided into two terms, the on-tune rejection (OTR) and the off-frequency rejection (OFR). The OTR is the rejection provided by a receiver selectivity characteristic to a co-tuned transmitter as a result of a transmitted signal exceeding the receiver bandwidth. The OFR is an additional rejection that results from off-tuning between interferer and receiver. FDR, OTR and OFR are considered as losses and defined below in a manner to ensure positive values:
)()( fOFROTRfFDR ∆+=∆ dB (7)
Rep. ITU-R M.2111 23
where:
The on-tune rejection also called the bandwidth correction factor can often be approximated by:
⎟⎟⎠
⎞⎜⎜⎝
⎛≈
R
TBBKOTR log for BR ≤ BT (8)
0OTR = for BR > BT (9) where: BR: interfered receiver 3 dB bandwidth (Hz) BT: interferer transmitter 3 dB bandwidth (Hz) K = 10 for non-coherent signals (like IMT-Advanced signals) K = 20 for pulse signals.
The OFR is computed from the equation:
∫
∫∞
∞
∆+⋅
⋅
=∆
0
0
d)()(
d)()(log10)(
fffhfp
ffhfpfOFR dB (10)
In the simulations included in this annex, frequency dependent rejection (FDR) curves are computed for each of the radiolocation radar and IMT-Advanced. The detuning rejection due to frequency separation between IMT-Advanced transmitter and radar receiver is included in the interference calculation as shown in equation (3). Similar FDR analysis was repeated when assessing radar system interference into IMT-Advanced receivers. For IMT-Advanced systems 100 MHz channels were assumed for both transmitters and receivers.
4.1 Analysis scenario and input parameters
The initial step in assessing compatibility is the determination of the signal level at which the receiver performance starts to degrade, IT. A computer simulation model was developed which calculates the time-dependent interfering power levels at the radar from the aggregate IMT-Advanced Macro, Micro and Pico stations. Using this simulation model, interference power levels were collected to show how often the interference power exceeds the radar interference threshold as defined in equation (1).
Table B1.4 shows the geographical location parameters randomly selected for this simulation.
TABLE B1.4
Radar & IMT-Advanced location parameters
Parameter Value Units Simulation comment
RADAR AIRBORNE-A Latitude 30.67 degrees Fixed value Longitude 86.70 degrees Fixed value RADAR SHIPBORNE-A Latitude 30.40 degrees Fixed value Longitude 86.70 degrees Fixed value
24 Rep. ITU-R M.2111
TABLE B1.4 (end)
Parameter Value Units Simulation comment
RADAR SHIPBORNE-B Latitude 30.40 degrees Fixed value Longitude 86.70 degrees Fixed value IMT-ADVANCED (MACRO, MICRO & PICO) Minimum latitude 30.4167 degrees Values change between the minimum maximum
latitude and longitude limits Minimum longitude 86.45 degrees Values change between the minimum maximum
latitude and longitude limits Maximum latitude 30.9167 degrees Values change between the minimum maximum
latitude and longitude limits Maximum longitude 86.95 degrees Values change between the minimum maximum
latitude and longitude limits Area where IMT-Advanced systems are located
1 033 km2 Computed from the minimum and maximum latitude and longitude limits
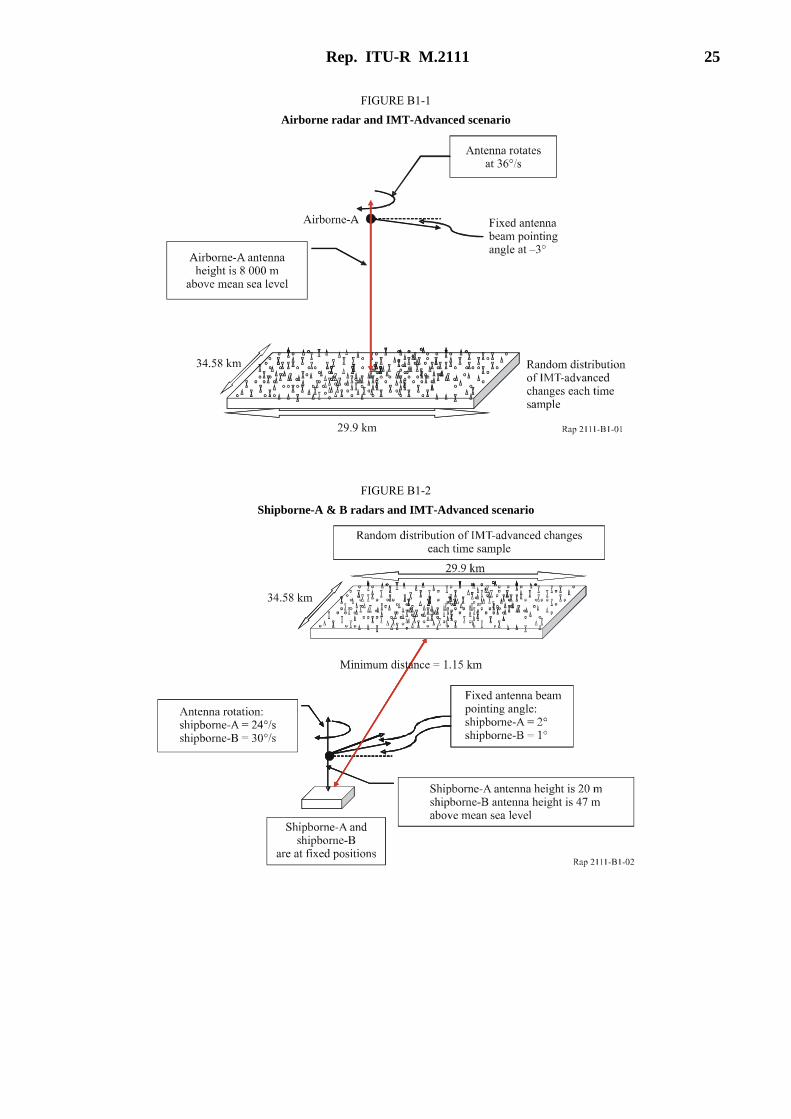
The scenario and dynamic IMT-Advanced distribution are as follows: 1 For the Airborne-A radar, the platform is centred above the IMT-Advanced systems at a
height of 8 000 m. The radar antenna points at a fixed –3 degree elevation and rotates at 36°/s. This position is maintained for the duration of the simulation. The scenario is shown in Fig. B1-1.
2 For both Shipborne A and B radars, the platforms are maintained at a fixed location bordering the IMT-Advanced area, as shown in Fig. B1-2.
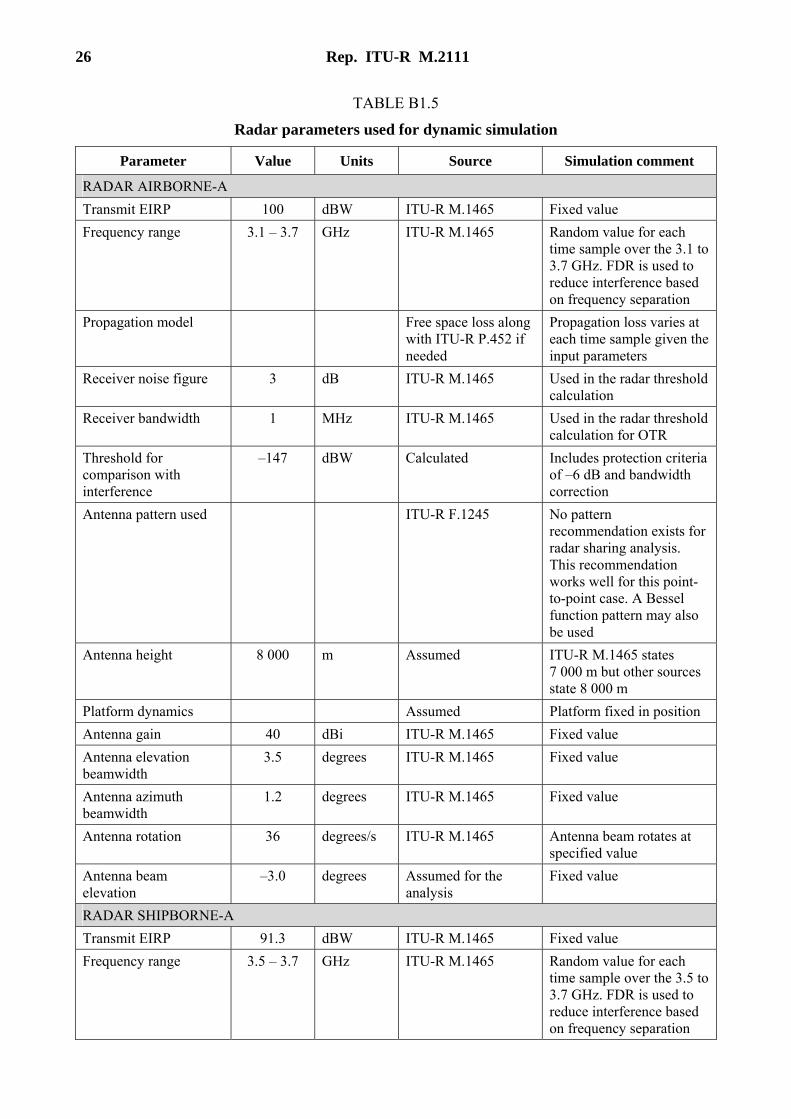
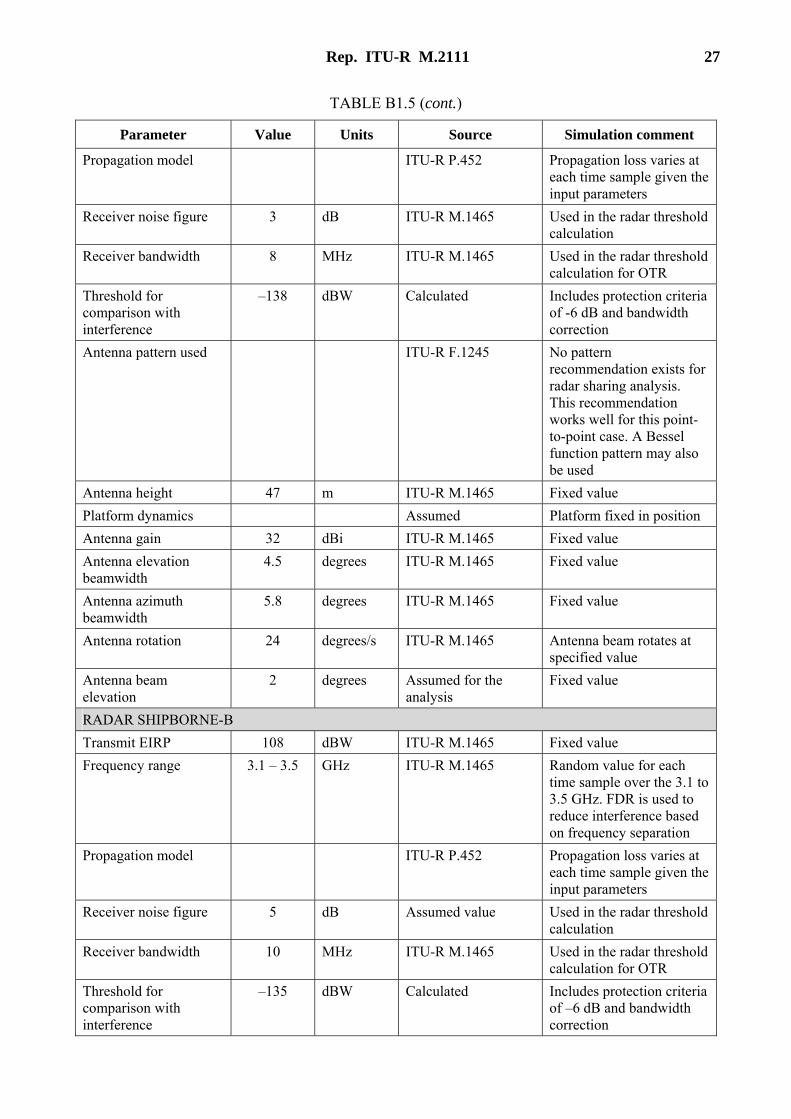
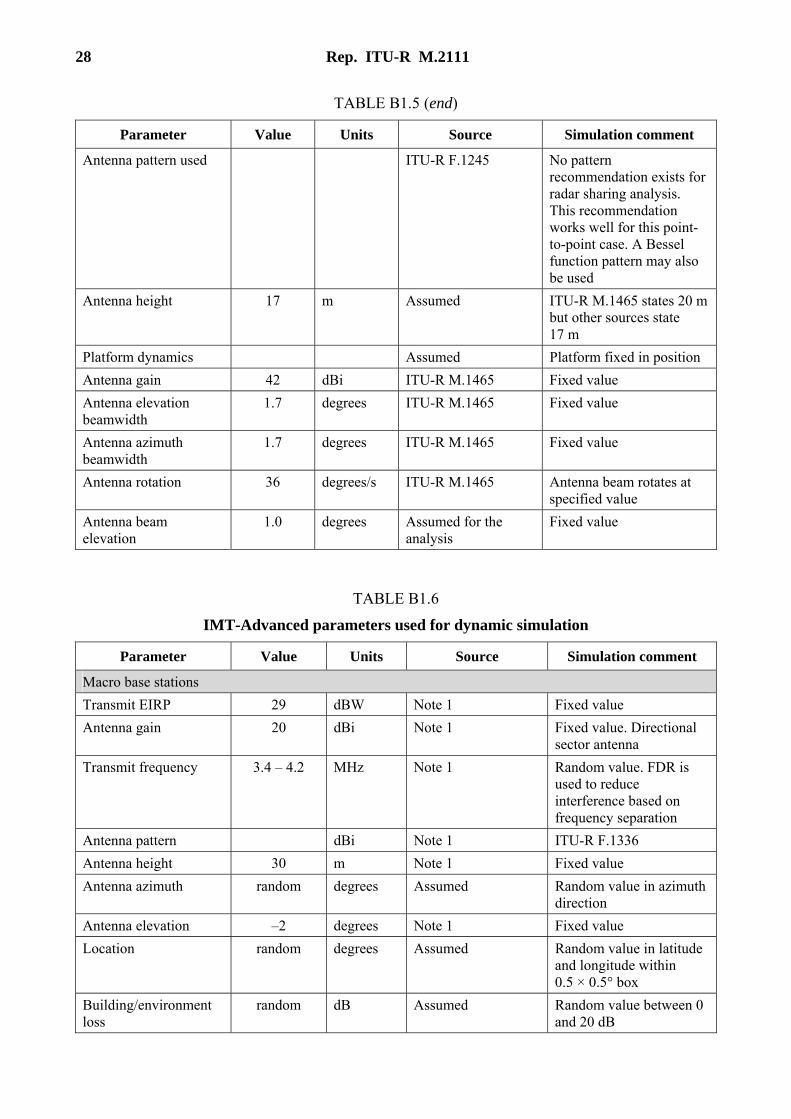
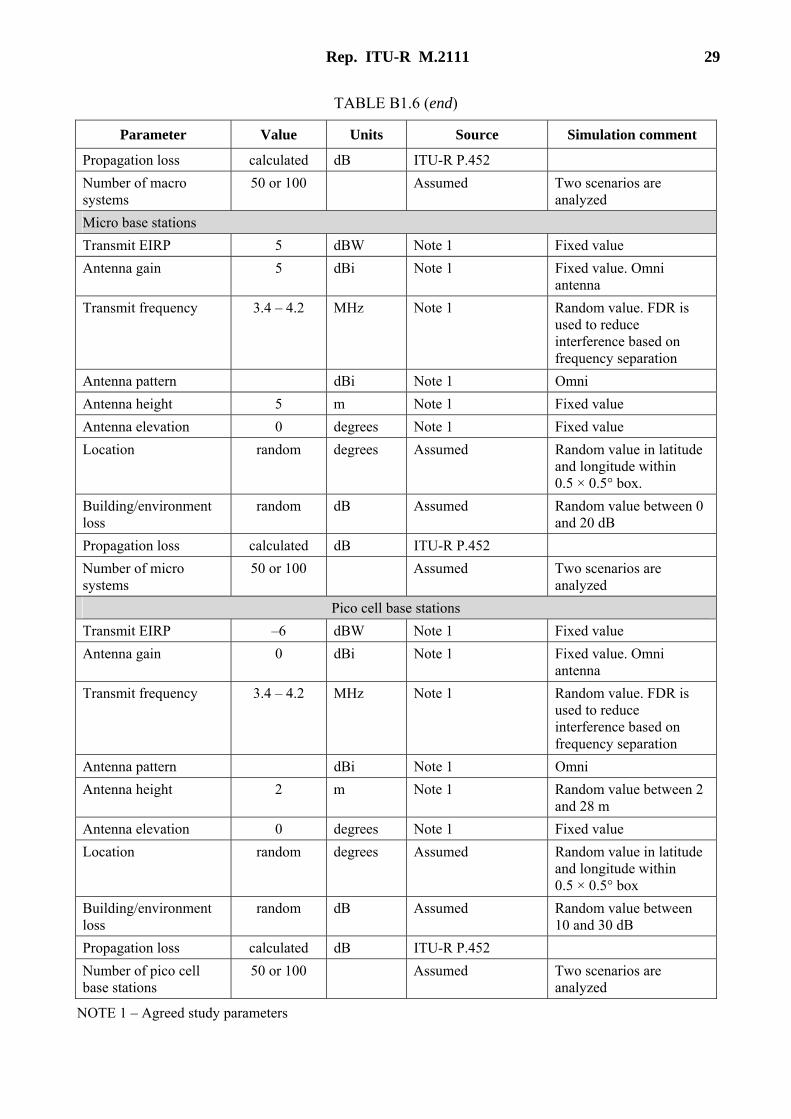
3 The parameters used in this analysis for the radars and the IMT-Advanced systems are given in Tables B1.5 and B1.6 respectively.
4 The inputs to the propagation model are provided in Table B1.7. Recommendation ITU-R P.452 is employed for calculating the propagation loss for all shipborne radar scenarios. Recommendation ITU-R P.452 is used for airborne radar scenarios.
5 IMT-Advanced Macro, Micro, and Pico stations are always actively transmitting for each time sample. In one case fifty units of each type of base station were assumed to be randomly distributed in 1 000 km2. In one case one hundred units of each type of base station were assumed to be randomly distributed in 1 000 km2.
6 The IMT-Advanced systems density is 0.15 or 0.3 cells per km2 for each macro, micro, and pico station. These arbitrary levels were used to produce simulation results in a reasonable period of time.
7 Radars are always in receiving mode for each time sample.
Rep. ITU-R M.2111 25
FIGURE B1-1 Airborne radar and IMT-Advanced scenario
FIGURE B1-2 Shipborne-A & B radars and IMT-Advanced scenario
26 Rep. ITU-R M.2111
TABLE B1.5
Radar parameters used for dynamic simulation
Parameter Value Units Source Simulation comment
RADAR AIRBORNE-A Transmit EIRP 100 dBW ITU-R M.1465 Fixed value Frequency range 3.1 – 3.7 GHz ITU-R M.1465 Random value for each
time sample over the 3.1 to 3.7 GHz. FDR is used to reduce interference based on frequency separation
Propagation model Free space loss along with ITU-R P.452 if needed
Propagation loss varies at each time sample given the input parameters
Receiver noise figure 3 dB ITU-R M.1465 Used in the radar threshold calculation
Receiver bandwidth 1 MHz ITU-R M.1465 Used in the radar threshold calculation for OTR
Threshold for comparison with interference
–147 dBW Calculated Includes protection criteria of –6 dB and bandwidth correction
Antenna pattern used ITU-R F.1245 No pattern recommendation exists for radar sharing analysis. This recommendation works well for this point-to-point case. A Bessel function pattern may also be used
Antenna height 8 000 m Assumed ITU-R M.1465 states 7 000 m but other sources state 8 000 m
Platform dynamics Assumed Platform fixed in position Antenna gain 40 dBi ITU-R M.1465 Fixed value Antenna elevation beamwidth
3.5 degrees ITU-R M.1465 Fixed value
Antenna azimuth beamwidth
1.2 degrees ITU-R M.1465 Fixed value
Antenna rotation 36 degrees/s ITU-R M.1465 Antenna beam rotates at specified value
Antenna beam elevation
–3.0 degrees Assumed for the analysis
Fixed value
RADAR SHIPBORNE-A Transmit EIRP 91.3 dBW ITU-R M.1465 Fixed value Frequency range 3.5 – 3.7 GHz ITU-R M.1465 Random value for each
time sample over the 3.5 to 3.7 GHz. FDR is used to reduce interference based on frequency separation
Rep. ITU-R M.2111 27
TABLE B1.5 (cont.)
Parameter Value Units Source Simulation comment
Propagation model ITU-R P.452 Propagation loss varies at each time sample given the input parameters
Receiver noise figure 3 dB ITU-R M.1465 Used in the radar threshold calculation
Receiver bandwidth 8 MHz ITU-R M.1465 Used in the radar threshold calculation for OTR
Threshold for comparison with interference
–138 dBW Calculated Includes protection criteria of -6 dB and bandwidth correction
Antenna pattern used ITU-R F.1245 No pattern recommendation exists for radar sharing analysis. This recommendation works well for this point-to-point case. A Bessel function pattern may also be used
Antenna height 47 m ITU-R M.1465 Fixed value Platform dynamics Assumed Platform fixed in position Antenna gain 32 dBi ITU-R M.1465 Fixed value Antenna elevation beamwidth
4.5 degrees ITU-R M.1465 Fixed value
Antenna azimuth beamwidth
5.8 degrees ITU-R M.1465 Fixed value
Antenna rotation 24 degrees/s ITU-R M.1465 Antenna beam rotates at specified value
Antenna beam elevation
2 degrees Assumed for the analysis
Fixed value
RADAR SHIPBORNE-B Transmit EIRP 108 dBW ITU-R M.1465 Fixed value Frequency range 3.1 – 3.5 GHz ITU-R M.1465 Random value for each
time sample over the 3.1 to 3.5 GHz. FDR is used to reduce interference based on frequency separation
Propagation model ITU-R P.452 Propagation loss varies at each time sample given the input parameters
Receiver noise figure 5 dB Assumed value Used in the radar threshold calculation
Receiver bandwidth 10 MHz ITU-R M.1465 Used in the radar threshold calculation for OTR
Threshold for comparison with interference
–135 dBW Calculated Includes protection criteria of –6 dB and bandwidth correction
28 Rep. ITU-R M.2111
TABLE B1.5 (end)
Parameter Value Units Source Simulation comment
Antenna pattern used ITU-R F.1245 No pattern recommendation exists for radar sharing analysis. This recommendation works well for this point-to-point case. A Bessel function pattern may also be used
Antenna height 17 m Assumed ITU-R M.1465 states 20 m but other sources state 17 m
Platform dynamics Assumed Platform fixed in position Antenna gain 42 dBi ITU-R M.1465 Fixed value Antenna elevation beamwidth
1.7 degrees ITU-R M.1465 Fixed value
Antenna azimuth beamwidth
1.7 degrees ITU-R M.1465 Fixed value
Antenna rotation 36 degrees/s ITU-R M.1465 Antenna beam rotates at specified value
Antenna beam elevation
1.0 degrees Assumed for the analysis
Fixed value
TABLE B1.6
IMT-Advanced parameters used for dynamic simulation
Parameter Value Units Source Simulation comment
Macro base stations Transmit EIRP 29 dBW Note 1 Fixed value Antenna gain 20 dBi Note 1 Fixed value. Directional
sector antenna Transmit frequency 3.4 – 4.2 MHz Note 1 Random value. FDR is
used to reduce interference based on frequency separation
Antenna pattern dBi Note 1 ITU-R F.1336 Antenna height 30 m Note 1 Fixed value Antenna azimuth random degrees Assumed Random value in azimuth
direction Antenna elevation –2 degrees Note 1 Fixed value Location random degrees Assumed Random value in latitude
and longitude within 0.5 × 0.5° box
Building/environment loss
random dB Assumed Random value between 0 and 20 dB
Rep. ITU-R M.2111 29
TABLE B1.6 (end)
Parameter Value Units Source Simulation comment
Propagation loss calculated dB ITU-R P.452 Number of macro systems
50 or 100 Assumed Two scenarios are analyzed
Micro base stations Transmit EIRP 5 dBW Note 1 Fixed value Antenna gain 5 dBi Note 1 Fixed value. Omni
antenna Transmit frequency 3.4 – 4.2 MHz Note 1 Random value. FDR is
used to reduce interference based on frequency separation
Antenna pattern dBi Note 1 Omni Antenna height 5 m Note 1 Fixed value Antenna elevation 0 degrees Note 1 Fixed value Location random degrees Assumed Random value in latitude
and longitude within 0.5 × 0.5° box.
Building/environment loss
random dB Assumed Random value between 0 and 20 dB
Propagation loss calculated dB ITU-R P.452 Number of micro systems
50 or 100 Assumed Two scenarios are analyzed
Pico cell base stations Transmit EIRP –6 dBW Note 1 Fixed value Antenna gain 0 dBi Note 1 Fixed value. Omni
antenna Transmit frequency 3.4 – 4.2 MHz Note 1 Random value. FDR is
used to reduce interference based on frequency separation
Antenna pattern dBi Note 1 Omni Antenna height 2 m Note 1 Random value between 2
and 28 m Antenna elevation 0 degrees Note 1 Fixed value Location random degrees Assumed Random value in latitude
and longitude within 0.5 × 0.5° box
Building/environment loss
random dB Assumed Random value between 10 and 30 dB
Propagation loss calculated dB ITU-R P.452 Number of pico cell base stations
50 or 100 Assumed Two scenarios are analyzed
NOTE 1 – Agreed study parameters
30 Rep. ITU-R M.2111
TABLE B1.7
Propagation model parameters used for dynamic simulation
Propagation parameter Value used
Model used ITU-R P.452
Effective earth radius (km) 8 549.12
Delta N (N-units/km) 40
Percentage of time p, for which particular values of basic transmission loss are not exceeded
20%
4.2 Aggregate IMT-Advanced Interference to Radiolocation Results To calculate the aggregate IMT-Advanced interference into radiolocation systems, two scenarios were used. The first scenario included 150 IMT-Advanced systems (50 macro base stations, 50 micro base stations, and 50 pico stations) and the second doubled the number of systems to 300 IMT-Advanced systems (100 macro base stations, 100 micro base stations, and 100 pico stations). The simulations were run for 60 s at 1 ms intervals for a total of 60 000 samples for each scenario. The results of the simulations are provided in the following sections.
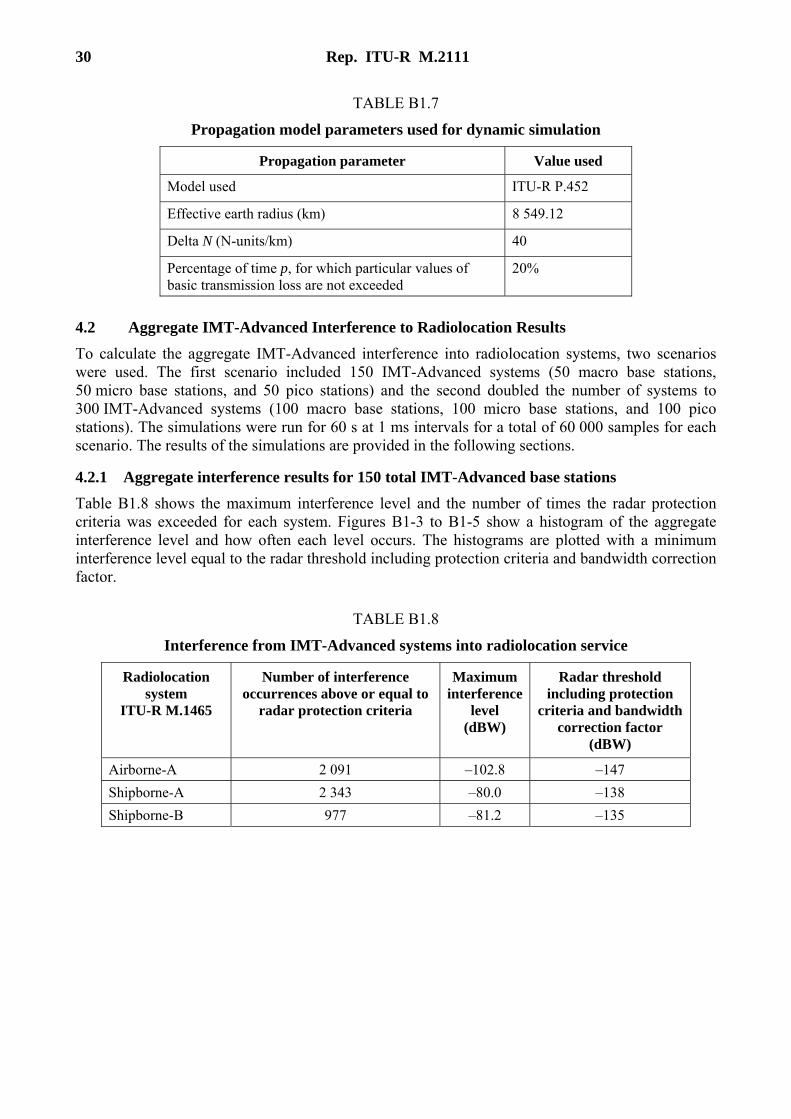
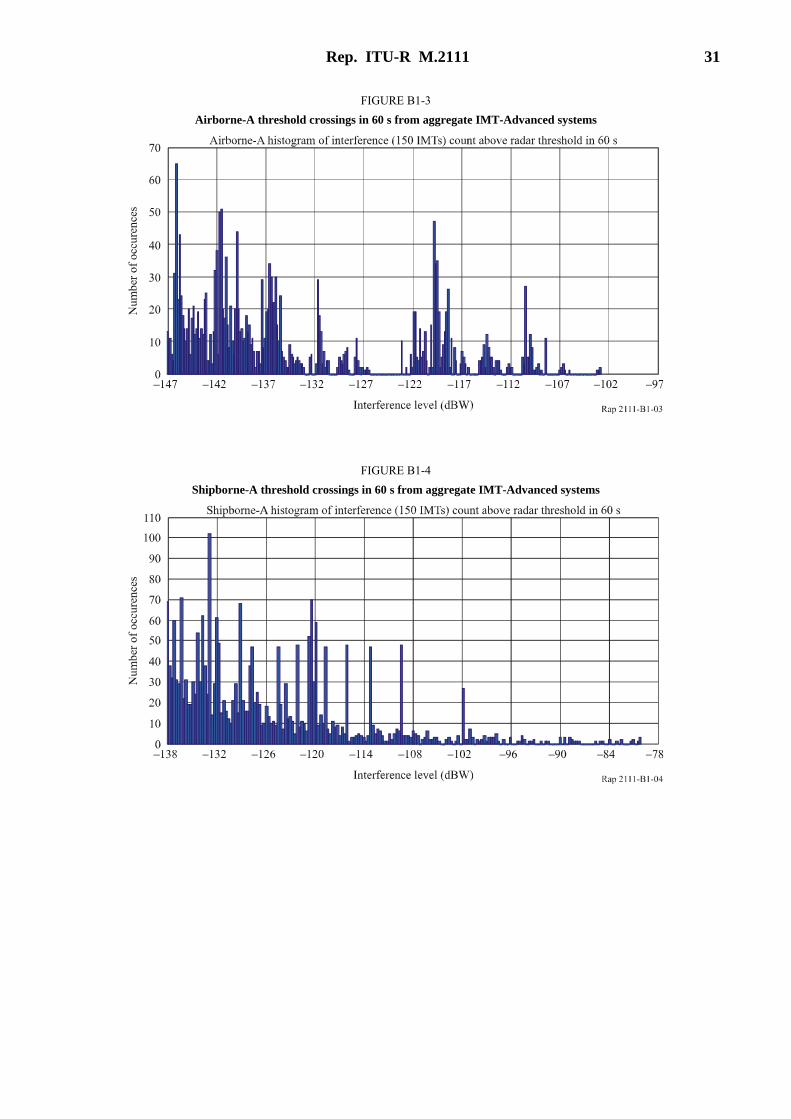
4.2.1 Aggregate interference results for 150 total IMT-Advanced base stations Table B1.8 shows the maximum interference level and the number of times the radar protection criteria was exceeded for each system. Figures B1-3 to B1-5 show a histogram of the aggregate interference level and how often each level occurs. The histograms are plotted with a minimum interference level equal to the radar threshold including protection criteria and bandwidth correction factor.
TABLE B1.8
Interference from IMT-Advanced systems into radiolocation service
Radiolocation system
ITU-R M.1465
Number of interference occurrences above or equal to
radar protection criteria
Maximum interference
level (dBW)
Radar threshold including protection
criteria and bandwidth correction factor
(dBW)
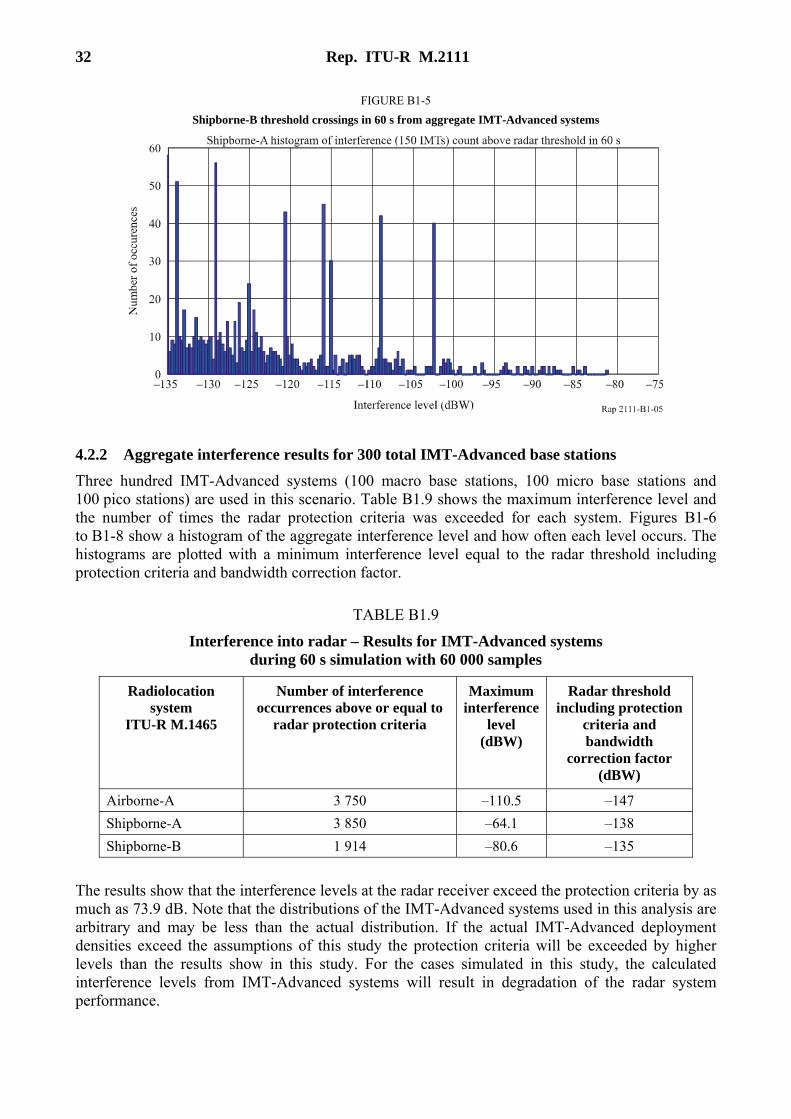
Airborne-A 2 091 –102.8 –147 Shipborne-A 2 343 –80.0 –138 Shipborne-B 977 –81.2 –135
Rep. ITU-R M.2111 31
FIGURE B1-3 Airborne-A threshold crossings in 60 s from aggregate IMT-Advanced systems
FIGURE B1-4 Shipborne-A threshold crossings in 60 s from aggregate IMT-Advanced systems
32 Rep. ITU-R M.2111
FIGURE B1-5 Shipborne-B threshold crossings in 60 s from aggregate IMT-Advanced systems
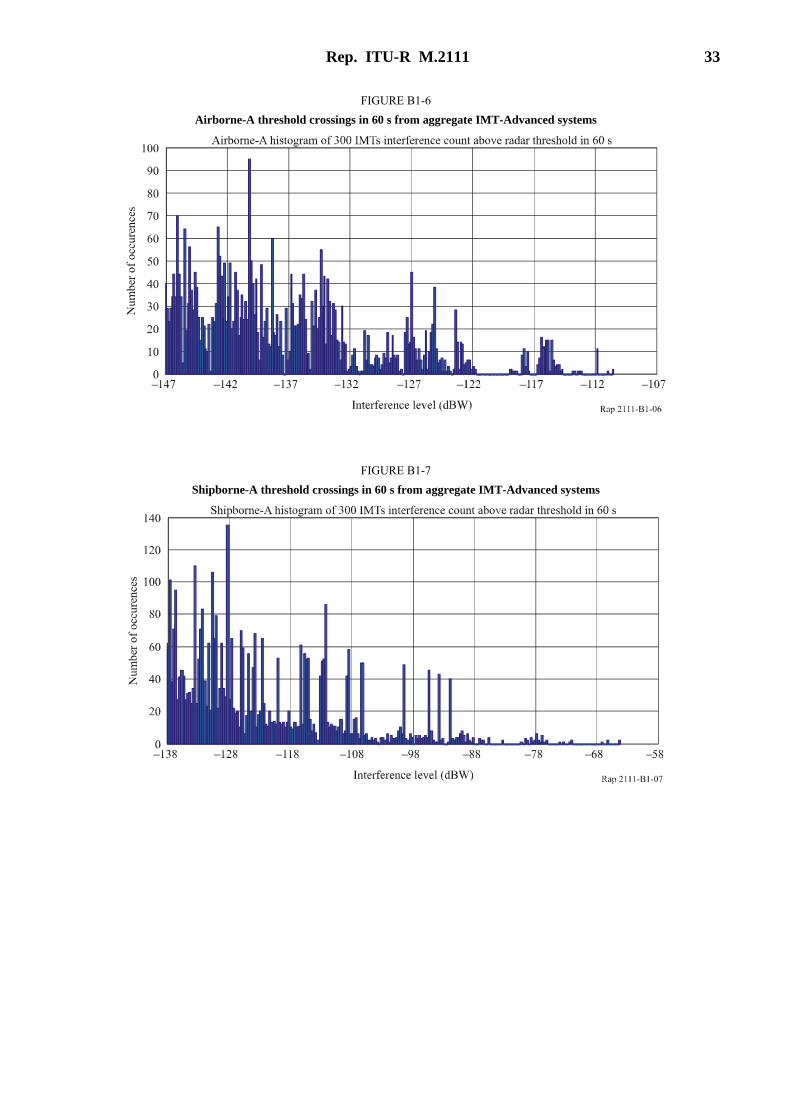
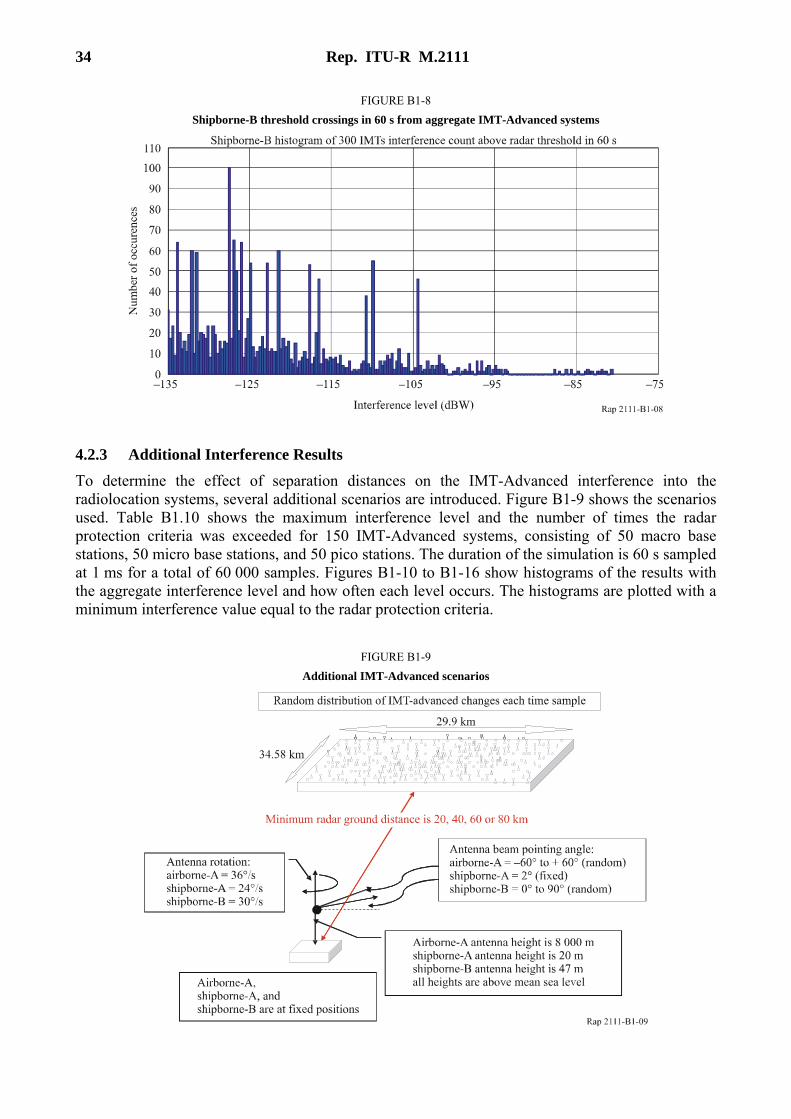
4.2.2 Aggregate interference results for 300 total IMT-Advanced base stations Three hundred IMT-Advanced systems (100 macro base stations, 100 micro base stations and 100 pico stations) are used in this scenario. Table B1.9 shows the maximum interference level and the number of times the radar protection criteria was exceeded for each system. Figures B1-6 to B1-8 show a histogram of the aggregate interference level and how often each level occurs. The histograms are plotted with a minimum interference level equal to the radar threshold including protection criteria and bandwidth correction factor.
TABLE B1.9
Interference into radar – Results for IMT-Advanced systems during 60 s simulation with 60 000 samples
Radiolocation system
ITU-R M.1465
Number of interference occurrences above or equal to
radar protection criteria
Maximum interference
level (dBW)
Radar threshold including protection
criteria and bandwidth
correction factor (dBW)
Airborne-A 3 750 –110.5 –147 Shipborne-A 3 850 –64.1 –138 Shipborne-B 1 914 –80.6 –135
The results show that the interference levels at the radar receiver exceed the protection criteria by as much as 73.9 dB. Note that the distributions of the IMT-Advanced systems used in this analysis are arbitrary and may be less than the actual distribution. If the actual IMT-Advanced deployment densities exceed the assumptions of this study the protection criteria will be exceeded by higher levels than the results show in this study. For the cases simulated in this study, the calculated interference levels from IMT-Advanced systems will result in degradation of the radar system performance.
Rep. ITU-R M.2111 33
FIGURE B1-6 Airborne-A threshold crossings in 60 s from aggregate IMT-Advanced systems
FIGURE B1-7 Shipborne-A threshold crossings in 60 s from aggregate IMT-Advanced systems
34 Rep. ITU-R M.2111
FIGURE B1-8 Shipborne-B threshold crossings in 60 s from aggregate IMT-Advanced systems
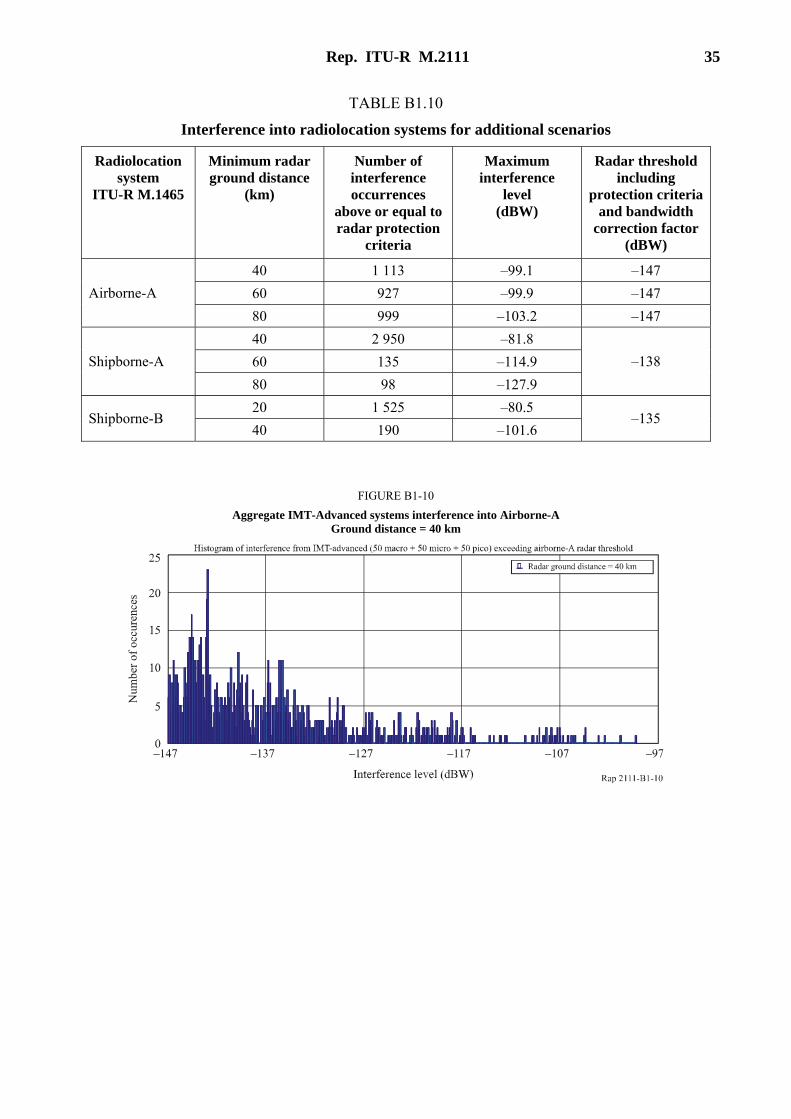
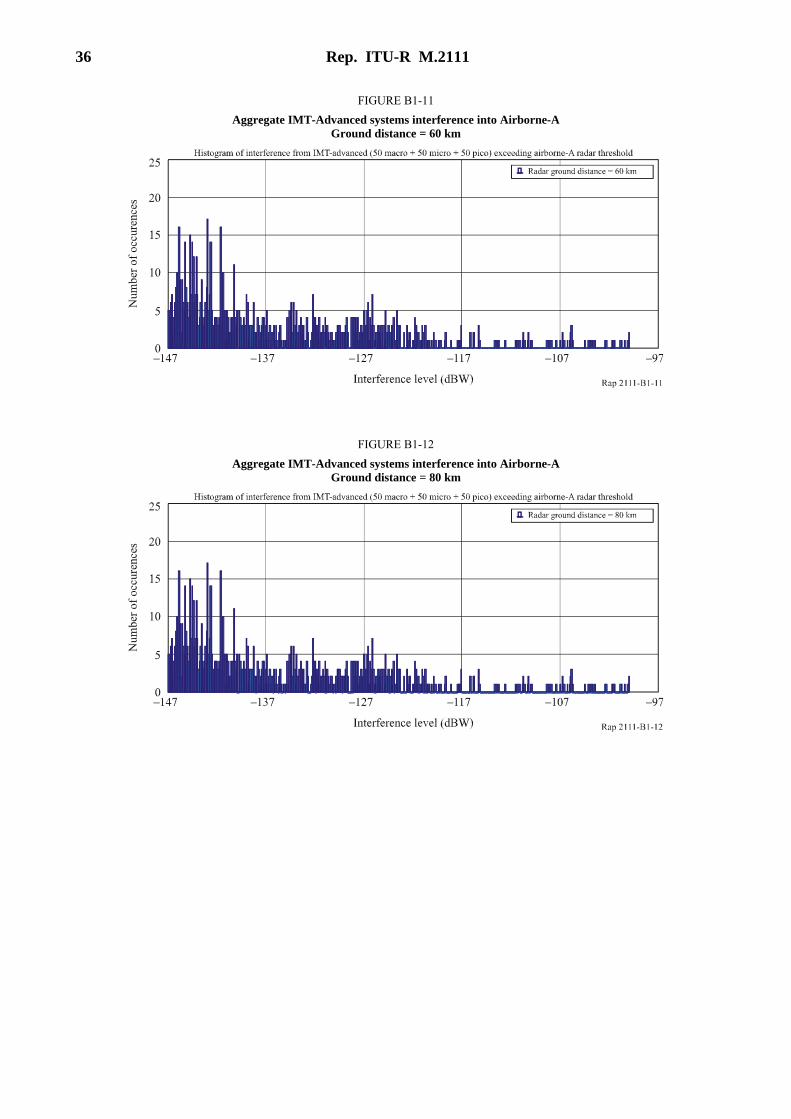
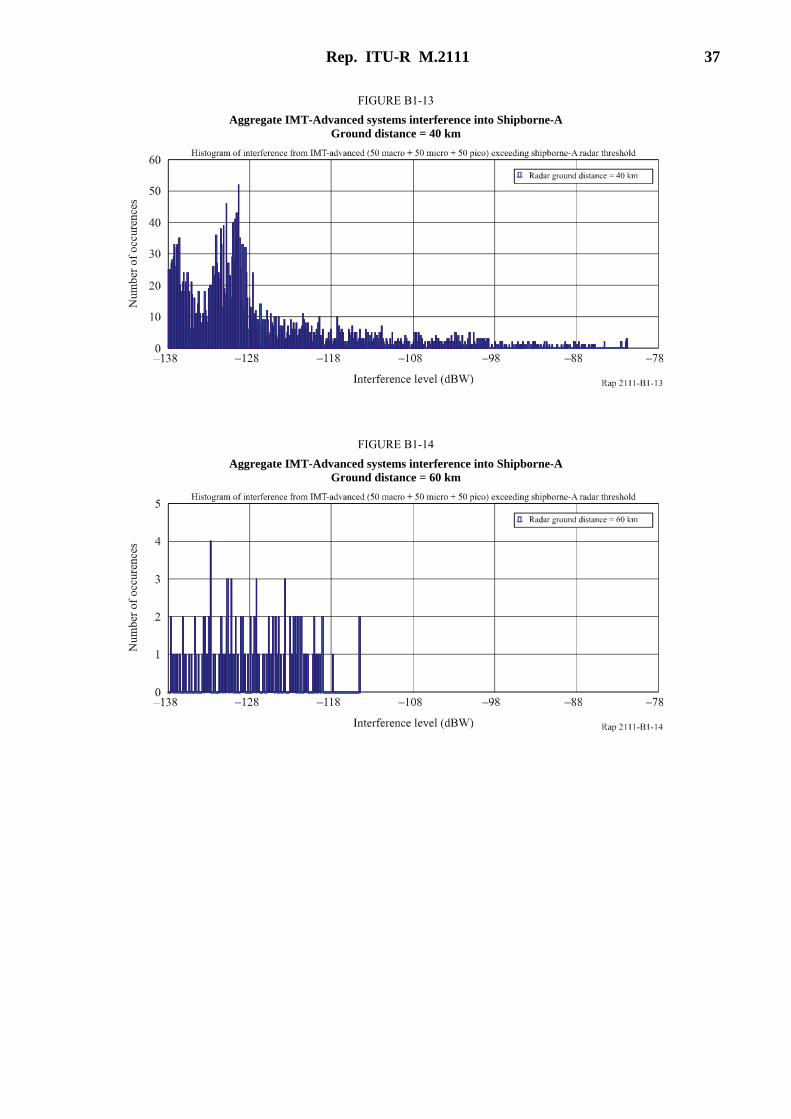
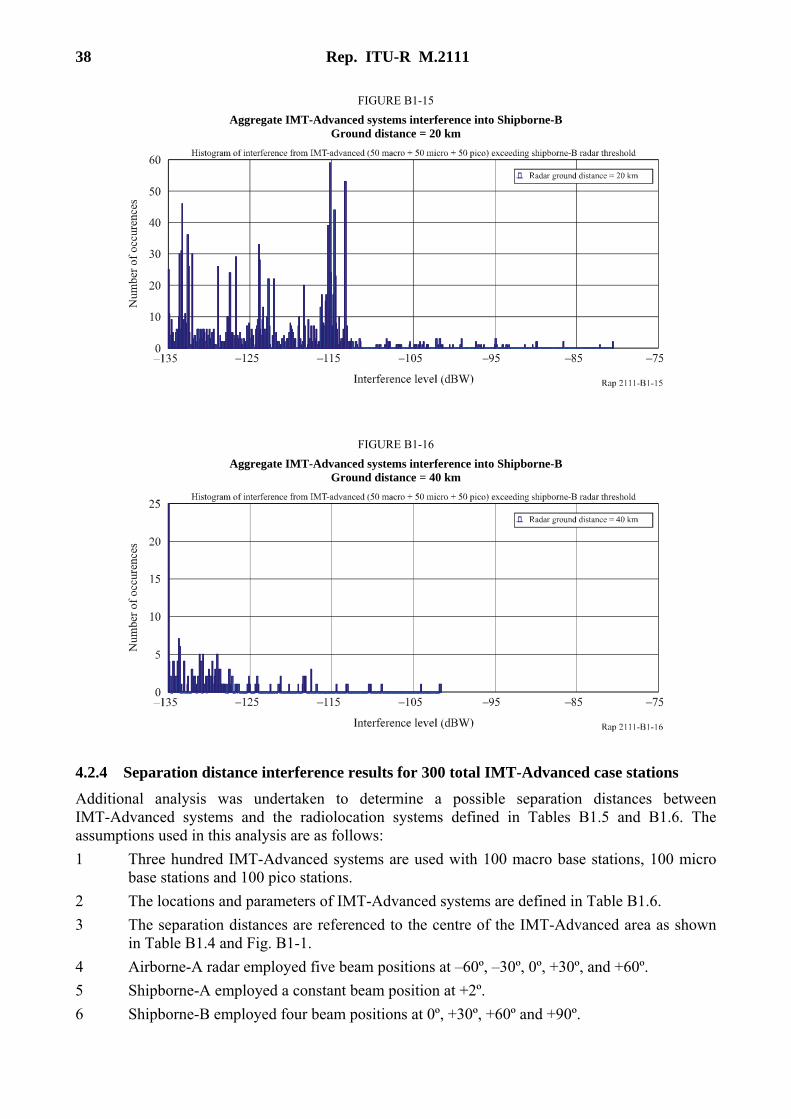
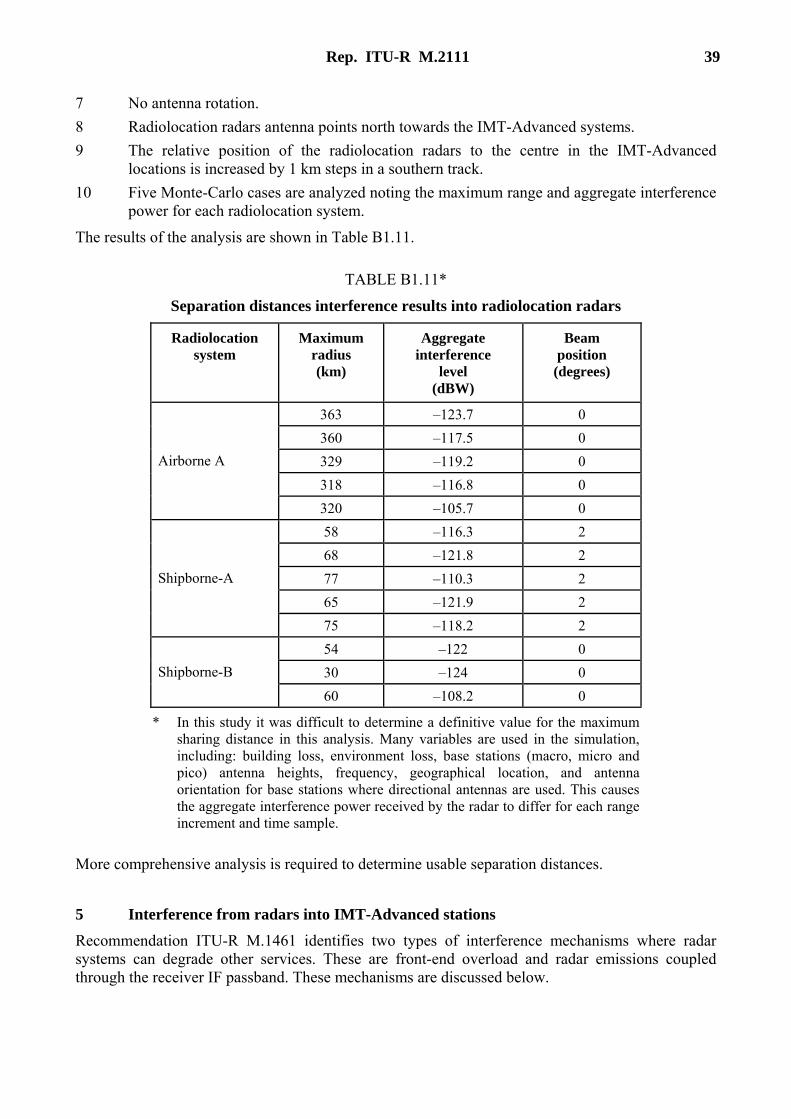
4.2.3 Additional Interference Results To determine the effect of separation distances on the IMT-Advanced interference into the radiolocation systems, several additional scenarios are introduced. Figure B1-9 shows the scenarios used. Table B1.10 shows the maximum interference level and the number of times the radar protection criteria was exceeded for 150 IMT-Advanced systems, consisting of 50 macro base stations, 50 micro base stations, and 50 pico stations. The duration of the simulation is 60 s sampled at 1 ms for a total of 60 000 samples. Figures B1-10 to B1-16 show histograms of the results with the aggregate interference level and how often each level occurs. The histograms are plotted with a minimum interference value equal to the radar protection criteria.
FIGURE B1-9 Additional IMT-Advanced scenarios
Rep. ITU-R M.2111 35
TABLE B1.10
Interference into radiolocation systems for additional scenarios
Radiolocation system
ITU-R M.1465
Minimum radar ground distance
(km)
Number of interference occurrences
above or equal to radar protection
criteria
Maximum interference
level (dBW)
Radar threshold including
protection criteria and bandwidth
correction factor (dBW)
40 1 113 –99.1 –147 60 927 –99.9 –147 Airborne-A 80 999 –103.2 –147 40 2 950 –81.8 60 135 –114.9 Shipborne-A 80 98 –127.9
–138
20 1 525 –80.5 Shipborne-B
40 190 –101.6 –135
FIGURE B1-10 Aggregate IMT-Advanced systems interference into Airborne-A
Ground distance = 40 km
36 Rep. ITU-R M.2111
FIGURE B1-11 Aggregate IMT-Advanced systems interference into Airborne-A
Ground distance = 60 km
FIGURE B1-12 Aggregate IMT-Advanced systems interference into Airborne-A
Ground distance = 80 km
Rep. ITU-R M.2111 37
FIGURE B1-13 Aggregate IMT-Advanced systems interference into Shipborne-A
Ground distance = 40 km
FIGURE B1-14 Aggregate IMT-Advanced systems interference into Shipborne-A
Ground distance = 60 km
38 Rep. ITU-R M.2111
FIGURE B1-15 Aggregate IMT-Advanced systems interference into Shipborne-B
Ground distance = 20 km
FIGURE B1-16 Aggregate IMT-Advanced systems interference into Shipborne-B
Ground distance = 40 km
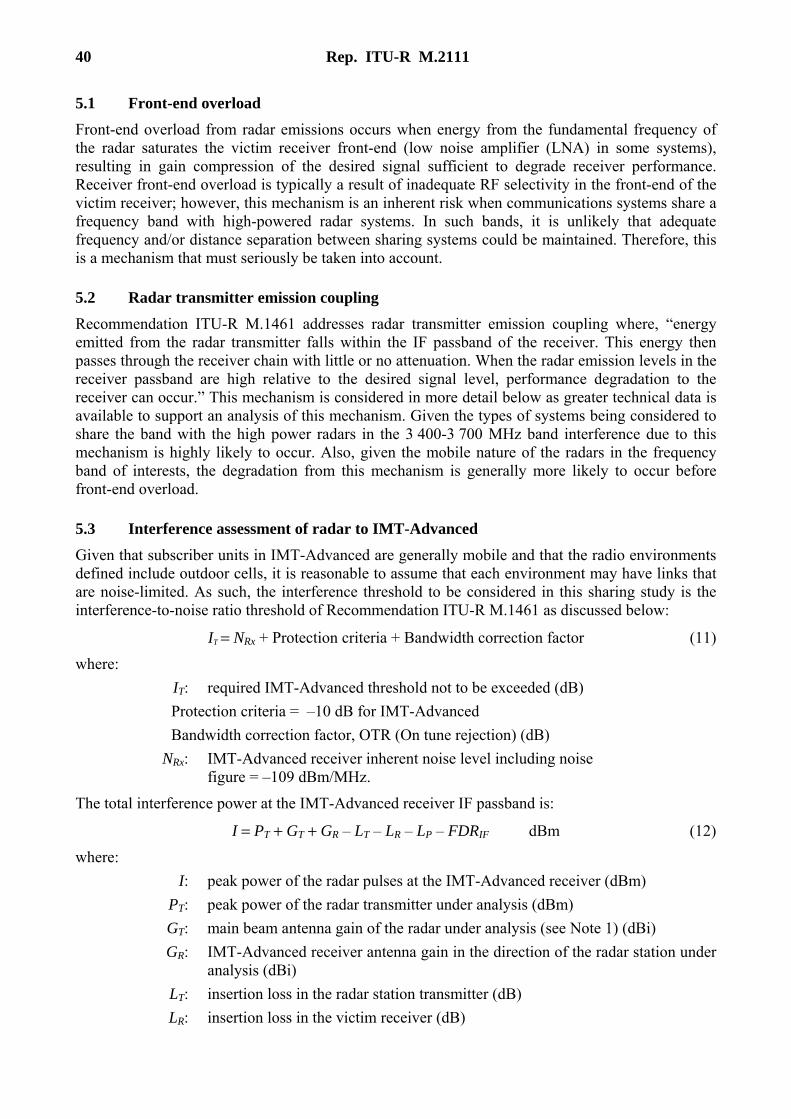
4.2.4 Separation distance interference results for 300 total IMT-Advanced case stations Additional analysis was undertaken to determine a possible separation distances between IMT-Advanced systems and the radiolocation systems defined in Tables B1.5 and B1.6. The assumptions used in this analysis are as follows: 1 Three hundred IMT-Advanced systems are used with 100 macro base stations, 100 micro
base stations and 100 pico stations. 2 The locations and parameters of IMT-Advanced systems are defined in Table B1.6. 3 The separation distances are referenced to the centre of the IMT-Advanced area as shown
in Table B1.4 and Fig. B1-1. 4 Airborne-A radar employed five beam positions at –60º, –30º, 0º, +30º, and +60º. 5 Shipborne-A employed a constant beam position at +2º. 6 Shipborne-B employed four beam positions at 0º, +30º, +60º and +90º.
Rep. ITU-R M.2111 39
7 No antenna rotation. 8 Radiolocation radars antenna points north towards the IMT-Advanced systems. 9 The relative position of the radiolocation radars to the centre in the IMT-Advanced
locations is increased by 1 km steps in a southern track. 10 Five Monte-Carlo cases are analyzed noting the maximum range and aggregate interference
power for each radiolocation system.
The results of the analysis are shown in Table B1.11.
TABLE B1.11*
Separation distances interference results into radiolocation radars
Radiolocation system
Maximum radius (km)
Aggregate interference
level (dBW)
Beam position (degrees)
363 –123.7 0 360 –117.5 0 329 –119.2 0 318 –116.8 0
Airborne A
320 –105.7 0 58 –116.3 2 68 –121.8 2 77 –110.3 2 65 –121.9 2
Shipborne-A
75 –118.2 2 54 –122 0 30 –124 0 Shipborne-B
60 –108.2 0
* In this study it was difficult to determine a definitive value for the maximum sharing distance in this analysis. Many variables are used in the simulation, including: building loss, environment loss, base stations (macro, micro and pico) antenna heights, frequency, geographical location, and antenna orientation for base stations where directional antennas are used. This causes the aggregate interference power received by the radar to differ for each range increment and time sample.
More comprehensive analysis is required to determine usable separation distances.
5 Interference from radars into IMT-Advanced stations
Recommendation ITU-R M.1461 identifies two types of interference mechanisms where radar systems can degrade other services. These are front-end overload and radar emissions coupled through the receiver IF passband. These mechanisms are discussed below.
40 Rep. ITU-R M.2111
5.1 Front-end overload Front-end overload from radar emissions occurs when energy from the fundamental frequency of the radar saturates the victim receiver front-end (low noise amplifier (LNA) in some systems), resulting in gain compression of the desired signal sufficient to degrade receiver performance. Receiver front-end overload is typically a result of inadequate RF selectivity in the front-end of the victim receiver; however, this mechanism is an inherent risk when communications systems share a frequency band with high-powered radar systems. In such bands, it is unlikely that adequate frequency and/or distance separation between sharing systems could be maintained. Therefore, this is a mechanism that must seriously be taken into account.
5.2 Radar transmitter emission coupling Recommendation ITU-R M.1461 addresses radar transmitter emission coupling where, “energy emitted from the radar transmitter falls within the IF passband of the receiver. This energy then passes through the receiver chain with little or no attenuation. When the radar emission levels in the receiver passband are high relative to the desired signal level, performance degradation to the receiver can occur.” This mechanism is considered in more detail below as greater technical data is available to support an analysis of this mechanism. Given the types of systems being considered to share the band with the high power radars in the 3 400-3 700 MHz band interference due to this mechanism is highly likely to occur. Also, given the mobile nature of the radars in the frequency band of interests, the degradation from this mechanism is generally more likely to occur before front-end overload.
5.3 Interference assessment of radar to IMT-Advanced Given that subscriber units in IMT-Advanced are generally mobile and that the radio environments defined include outdoor cells, it is reasonable to assume that each environment may have links that are noise-limited. As such, the interference threshold to be considered in this sharing study is the interference-to-noise ratio threshold of Recommendation ITU-R M.1461 as discussed below:
IT = NRx + Protection criteria + Bandwidth correction factor (11)
where: IT: required IMT-Advanced threshold not to be exceeded (dB) Protection criteria = –10 dB for IMT-Advanced Bandwidth correction factor, OTR (On tune rejection) (dB) NRx: IMT-Advanced receiver inherent noise level including noise
figure = –109 dBm/MHz.
The total interference power at the IMT-Advanced receiver IF passband is:
I = PT + GT + GR – LT – LR – LP – FDRIF dBm (12)
where: I: peak power of the radar pulses at the IMT-Advanced receiver (dBm) PT: peak power of the radar transmitter under analysis (dBm) GT: main beam antenna gain of the radar under analysis (see Note 1) (dBi) GR: IMT-Advanced receiver antenna gain in the direction of the radar station under
analysis (dBi) LT: insertion loss in the radar station transmitter (dB) LR: insertion loss in the victim receiver (dB)
Rep. ITU-R M.2111 41
LP: propagation path loss between transmitting and receiving antennas (dB) FDRIF: frequency-dependent rejection produced by the receiver IF selectivity curve on
an unwanted transmitter emission spectra (dB).
Since the IMT-Advanced receiver bandwidth is greater that the radar transmit bandwidth, OTR is assumed to be zero. FDR is calculated for each radiolocation/IMT-Advanced system.
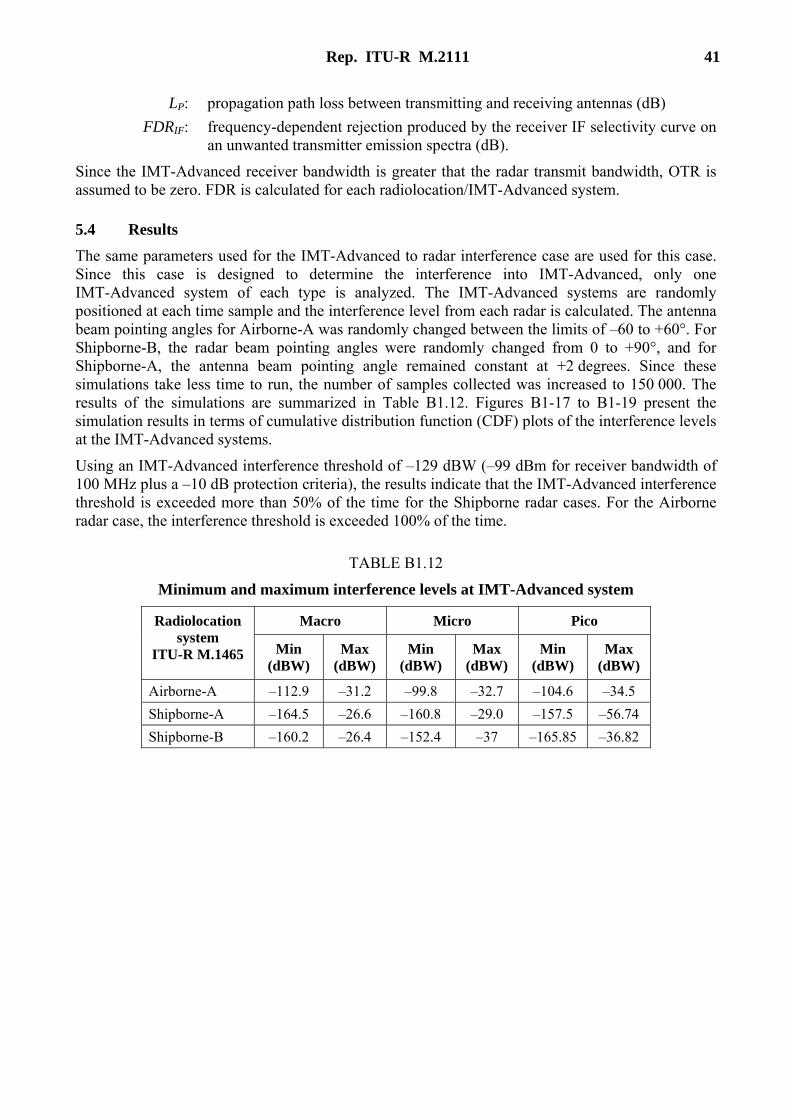
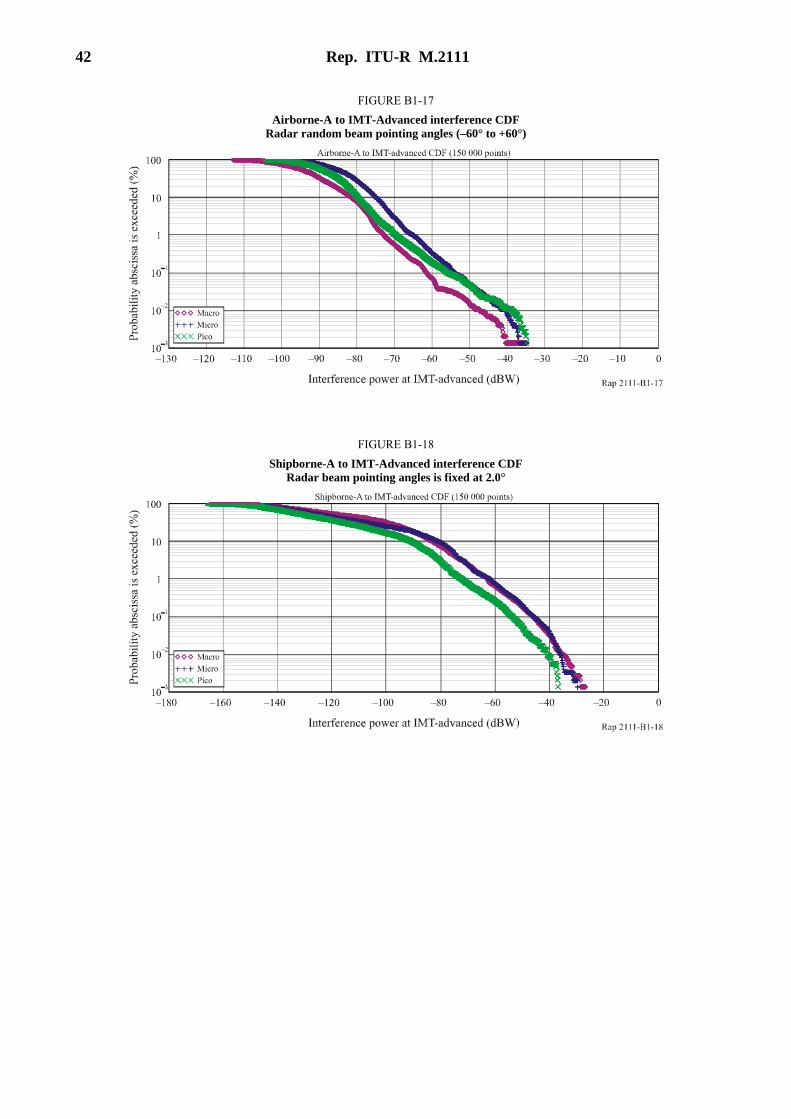
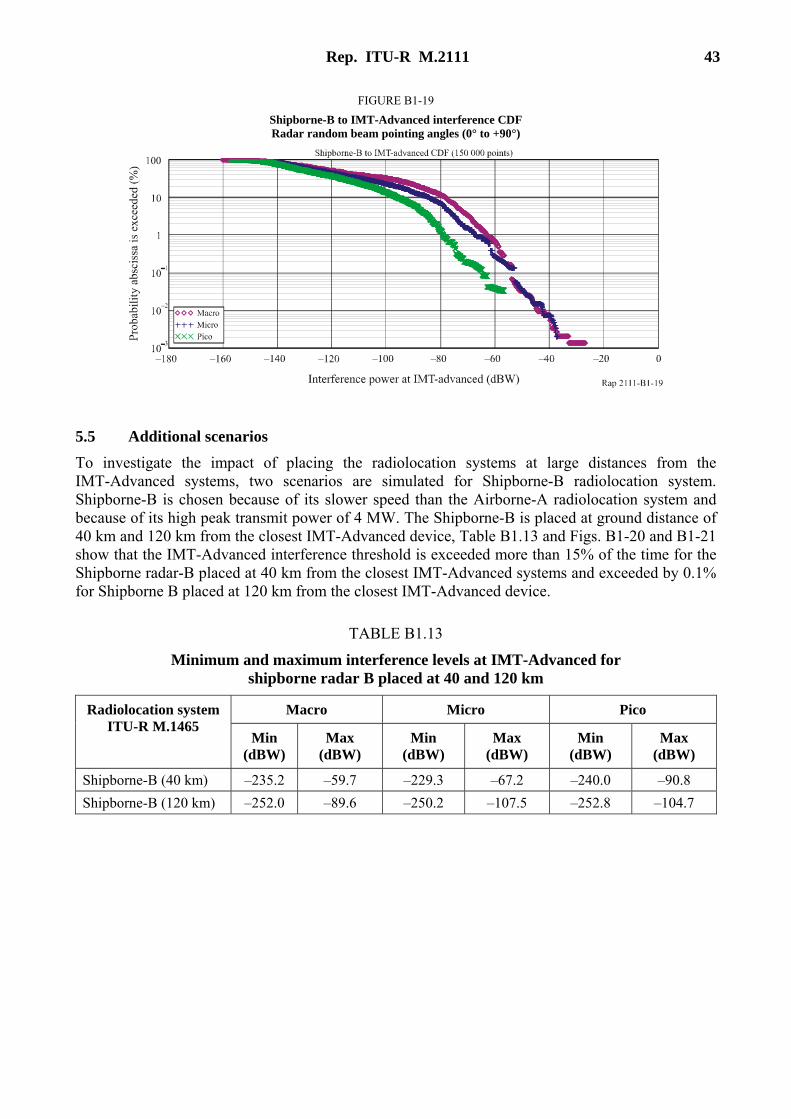
5.4 Results The same parameters used for the IMT-Advanced to radar interference case are used for this case. Since this case is designed to determine the interference into IMT-Advanced, only one IMT-Advanced system of each type is analyzed. The IMT-Advanced systems are randomly positioned at each time sample and the interference level from each radar is calculated. The antenna beam pointing angles for Airborne-A was randomly changed between the limits of –60 to +60°. For Shipborne-B, the radar beam pointing angles were randomly changed from 0 to +90°, and for Shipborne-A, the antenna beam pointing angle remained constant at +2 degrees. Since these simulations take less time to run, the number of samples collected was increased to 150 000. The results of the simulations are summarized in Table B1.12. Figures B1-17 to B1-19 present the simulation results in terms of cumulative distribution function (CDF) plots of the interference levels at the IMT-Advanced systems.
Using an IMT-Advanced interference threshold of –129 dBW (–99 dBm for receiver bandwidth of 100 MHz plus a –10 dB protection criteria), the results indicate that the IMT-Advanced interference threshold is exceeded more than 50% of the time for the Shipborne radar cases. For the Airborne radar case, the interference threshold is exceeded 100% of the time.
TABLE B1.12
Minimum and maximum interference levels at IMT-Advanced system
Macro Micro Pico Radiolocation system
ITU-R M.1465 Min (dBW)
Max (dBW)
Min (dBW)
Max (dBW)
Min (dBW)
Max (dBW)
Airborne-A –112.9 –31.2 –99.8 –32.7 –104.6 –34.5 Shipborne-A –164.5 –26.6 –160.8 –29.0 –157.5 –56.74 Shipborne-B –160.2 –26.4 –152.4 –37 –165.85 –36.82
42 Rep. ITU-R M.2111
FIGURE B1-17 Airborne-A to IMT-Advanced interference CDF
Radar random beam pointing angles (–60° to +60°)
FIGURE B1-18 Shipborne-A to IMT-Advanced interference CDF
Radar beam pointing angles is fixed at 2.0°
Rep. ITU-R M.2111 43
FIGURE B1-19 Shipborne-B to IMT-Advanced interference CDF Radar random beam pointing angles (0° to +90°)
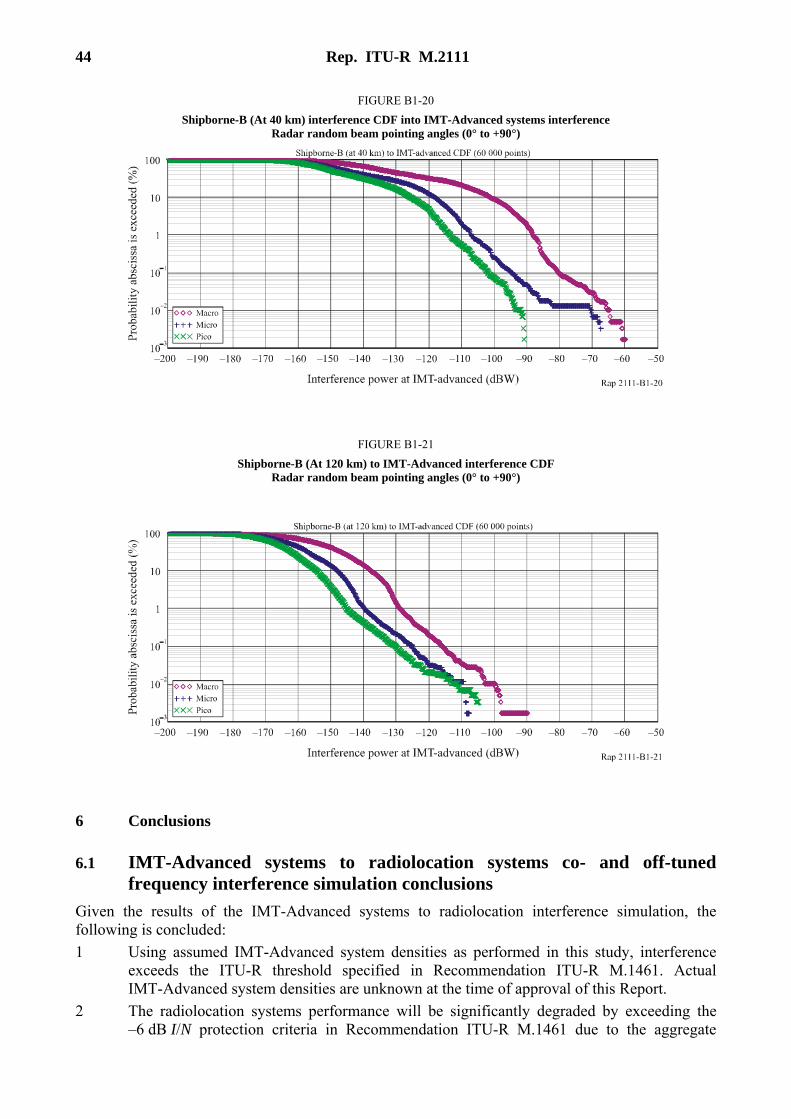
5.5 Additional scenarios To investigate the impact of placing the radiolocation systems at large distances from the IMT-Advanced systems, two scenarios are simulated for Shipborne-B radiolocation system. Shipborne-B is chosen because of its slower speed than the Airborne-A radiolocation system and because of its high peak transmit power of 4 MW. The Shipborne-B is placed at ground distance of 40 km and 120 km from the closest IMT-Advanced device, Table B1.13 and Figs. B1-20 and B1-21 show that the IMT-Advanced interference threshold is exceeded more than 15% of the time for the Shipborne radar-B placed at 40 km from the closest IMT-Advanced systems and exceeded by 0.1% for Shipborne B placed at 120 km from the closest IMT-Advanced device.
TABLE B1.13
Minimum and maximum interference levels at IMT-Advanced for shipborne radar B placed at 40 and 120 km
Macro Micro Pico Radiolocation system ITU-R M.1465
Min (dBW)
Max (dBW)
Min (dBW)
Max (dBW)
Min (dBW)
Max (dBW)
Shipborne-B (40 km) –235.2 –59.7 –229.3 –67.2 –240.0 –90.8 Shipborne-B (120 km) –252.0 –89.6 –250.2 –107.5 –252.8 –104.7
44 Rep. ITU-R M.2111
FIGURE B1-20 Shipborne-B (At 40 km) interference CDF into IMT-Advanced systems interference
Radar random beam pointing angles (0° to +90°)
FIGURE B1-21 Shipborne-B (At 120 km) to IMT-Advanced interference CDF
Radar random beam pointing angles (0° to +90°)
6 Conclusions
6.1 IMT-Advanced systems to radiolocation systems co- and off-tuned frequency interference simulation conclusions
Given the results of the IMT-Advanced systems to radiolocation interference simulation, the following is concluded: 1 Using assumed IMT-Advanced system densities as performed in this study, interference
exceeds the ITU-R threshold specified in Recommendation ITU-R M.1461. Actual IMT-Advanced system densities are unknown at the time of approval of this Report.
2 The radiolocation systems performance will be significantly degraded by exceeding the –6 dB I/N protection criteria in Recommendation ITU-R M.1461 due to the aggregate
Rep. ITU-R M.2111 45
IMT-Advanced interference. This interference will result in an increase in the false alarm rate, an increase in loss of targets and reduction of target range due to the aggregate IMT-Advanced interference. The interference level at the radar increases when the IMT-Advanced system densities are increased.
3 In some scenarios, the maximum aggregate IMT-Advanced interference level is very high and for the best case was calculated at 24 dB above the radar protection criteria, and for the worst case was calculated at 73.9 dB above the radar protection criteria. More than 10 occurrences per second were seen in some cases.
4 A single IMT-Advanced cell at close range will result in unacceptable interference that exceeds the radiolocation systems protection criteria.
5 Radiolocation shipborne systems that use fixed antenna beam pointing angles at low elevation angles and toward IMT-Advanced deployment areas, similar to Shipborne-A, are degraded much more than shipborne systems with agile or random elevation beam pointing angles.
6 Radiolocation systems that operate using a frequency range that fully overlap the IMT-Advanced systems, such as Shipborne-A, suffer more interference than other systems that partially overlap IMT-Advanced frequencies.
7 Airborne radiolocation systems are degraded by aggregate IMT-Advanced interference at large distances due to their radar height. Typically, an airborne radiolocation system will observe a large area and thus will be exposed to a large number of interferers. The radio horizon range for the airborne system flying at 8 000 m with an IMT-Advanced device at 30 m elevation is 391 km.
8 Based on the results of this study, sharing between radiolocation in the band 3 400 to 3 700 MHz and IMT-Advanced systems may not be practicable within the same geographical area. In addition to frequency separation, various interference mitigation techniques should be considered when determining specific sharing constraints
9 In order to determine specific sharing constraints, more specific IMT-Advanced parameters and deployment scenarios are required.
6.2 Radar to IMT-Advanced co- and off- tuned frequency interference simulation conclusions
Given the results of the radar to IMT-Advanced interference simulation, the following is concluded: 1 The quality of service for the IMT-Advanced systems will be degraded in the presence of
these radar even at frequencies above 3 700 MHz due to the high radar transmit power levels and wide out-of-band emission mask as calculated from ITU-R SM.1541, Annex-8 “OOB domain emission limits for primary radar systems.”
2 It is possible that IMT-Advanced systems will require mitigation in excess of 60 dB to reduce interference levels below the interference threshold.
3 Interference mitigation techniques that may be applied at the IMT-Advanced systems are not fully defined. More studies are required by ITU-R in this area to assess the types of techniques and the level of improvement obtained by each.
4 It is possible that multiple radar systems will be operational near IMT-Advanced systems at the same time. In that scenario, the interference to IMT-Advanced will be higher than the values shown in this study.
5 The Airborne-A radar affects the IMT-Advanced anytime it is in the vicinity of an IMT-Advanced deployment area due to its typical operation.
6 Radiolocation systems placed well outside the radio horizon range still cause interference to IMT-Advanced systems.
46 Rep. ITU-R M.2111
7 Based on the results of this study, sharing between IMT-Advanced systems and radiolocation systems operating in the band 3 400 to 3 700 MHz may not be practicable within the same geographical area. In addition to frequency separation, various interference mitigation techniques should be considered when determining specific sharing constraints.
8 In order to determine specific sharing constraints more specific IMT-Advanced parameters and deployment scenarios are required.
Annex 2
Adjacent channel compatibility between the radiolocation service and IMT-Advanced systems operating in 3 400-3 700 MHz band
Study A
Frequency separation
1 Introduction Study A assesses the adjacent channel compatibility between the radars and IMT-Advanced systems.
2 Parameters Critical parameters are based upon Recommendation ITU-R M.1465 similar to Annex 1 Study A. Interested parties are urged to further define these parameters to promote more complete and comprehensive sharing studies.
3 Interference assessment between IMT-Advanced systems and radiolocation service As described in Recommendation ITU-R M.1461, there are two primary interference coupling mechanisms to be studied. One of them is the receiver front-end saturation as discussed in Annex1 Study B.
3.1 Front-end saturation This interference mechanism occurs when energy from an undesired signal saturates the LNA of the victim receiver front-end resulting in gain compression of the desired signal which is sufficient to degrade receiver performance.
Given a victim receiver with front-end RF bandwidth, BRF, and 1 dB compression input power P1 dB (dBm), the total interference power inside BRF entering the victim receiver must not exceed:
PI, RF max = P1 dB + ksat = C – G + ksat dBm where: PI, RF max: maximum allowed total interference power inside the RF-bandwidth (dBm) ksat: saturation margin (dB), to be determined individually for each system and
interference type. It is assumed as 0 dB for both IMT-Advanced and radars in this assessment.
Rep. ITU-R M.2111 47
P1 dB: defined as the 1 dB-input power compression point (dBm), i.e., when the gain of the whole receiver chain has decreased by 1 dB
C: outut 1 dB gain compression (saturation) level of the receiver front-end or LNA (dBm)
G: gain of the receiver front-end at the fundamental frequency of the potential interference source (dB).
As an example stated in ITU-R M.1465, if the receivers use LNAs with a gain of 60 dB and they have an output 1 dB compression level of +10 dBm, the value for P1 dB is 10 − 60 = −50 dBm. As PI, RF max of radars is assumed as –50 dBm. As for IMT-Advanced, –30 dBm is assumed.
A potential of receiver front-end overload due to interference will exist whenever:
IT > PI , RF max − FDRRF
where: IT: interference signal level at the receiver input that causes receiver front-end
overload (dBm) FDRRF: frequency dependent rejection of the interference source by any RF selectivity
that is ahead of the receiver RF amplifier (LNA) or that may be inherent in the RF amplifier (LNA) itself.
Though filtering at RF stage is possible in chirp and pulse radars, neither Recommendation ITU-R M.1461 nor [Jones et al.] in Annex 2 Study A, give the value of the FDRRF. Here FDRRF of 0 dB is assumed for both radar and IMT-Advanced receivers.
3.2 Interference assessment The interference threshold, IT, to be considered in this sharing study is the interference-to-noise ratio threshold from ITU Recommended protection criteria as:
IT = NRx + Protection criteria (1)
where: IT: required threshold not to be exceeded (dB)
ITU Recommended protection criteria = –6 dB for radar, –6 dB for IMT-Advanced in co-primary basis
NRx: radar receiver inherent noise level (dBm).
The noise at the receiver input referred to the IF bandwidth is given by:
( ) ( ) NFBTkN IFRx ++⋅= log10log10 0 (2)
where: NRx: receiver noise power (dBm) k: Boltzmann’s constant = 1.38 × 10⁻²³ Joule/K T0: absolute temperature (K), assumed to be 290 K for this analysis kT0 ≈ –174 dBm BIF: receiver’s intermediate frequency bandwidth (Hz) NF: receiver noise figure (dB).
48 Rep. ITU-R M.2111
The following equation can be used to determine whether systems in other services can operate within particular distances of radars and with frequency separation of certain amounts. I = Pt + Gt + Gr – Lt – Lr – Lp – FDRif (3)
where: I: peak power of the undesired signal at the radar receiver input (dBm) Pt: peak power of the undesired transmitter under analysis (dBm) Gt: antenna gain of the undesired system in the direction of the victim receiver
under analysis (dBi) Gr: antenna gain of the victim receiver in the direction of the system under analysis
(dBi) Lt: insertion loss in the transmitter (dB) assumed as 5 dB for IMT-advanced macro base transmitter. assumed as 0 dB for radar transmitter. Lr: insertion loss in the radar receiver (dB) assumed as 0dB assumed as 5 dB for IMT-advanced macro base receiver. assumed as 0 dB for radar receiver. Lp: propagation path loss between transmitting and receiving antennas (dB) for point to point analysis, P452 free space loss is applied. FDRIF: frequency-dependent rejection produced by the receiver selectivity curve on an
unwanted transmitter emission spectra (dB). FDRIF is calculated by integral of transmitter power spectrum density and receiver selectivity as instructed by Recommendation ITU-R SM.337-4 as follows:
fffhfp
ffp=fFDR
d)()(
d)(log10)(
-
-
∆+⋅
∆
∫
∫∞
∞
∞
∞ dB (4)
where: p(f): power spectral density of the interfering signal (W/Hz) h(f): equivalent frequency response of the victim receiver.
TxRx fff −=∆ (5)
where: fRx: victim receiver tuned frequency; and fTx: interferer tuned frequency.
For the worst assumption, simple power summed OCR(f) (off channel rejection factor) given in Recommendation ITU-R SM.337-4 is applied as the FDRIF for this assessment. Therefore, improvement of on-tune rejection (OTR) due to non-coherency effect obtained at signal processing stage is not counted. h(f) should include not only selectivity at pre-detection filters equipped at RX RF, Down converter, and RX IF stages but also post detection filtering effect such as A to D conversion, pulse compression function, etc., whichever applicable. Since actual values of equivalent radar RX selectivity are not available to public, a selectivity fall-off of –80 dB per decade from 3 dB bandwidth is applied for all radars as instructed by Recommendation ITU-R
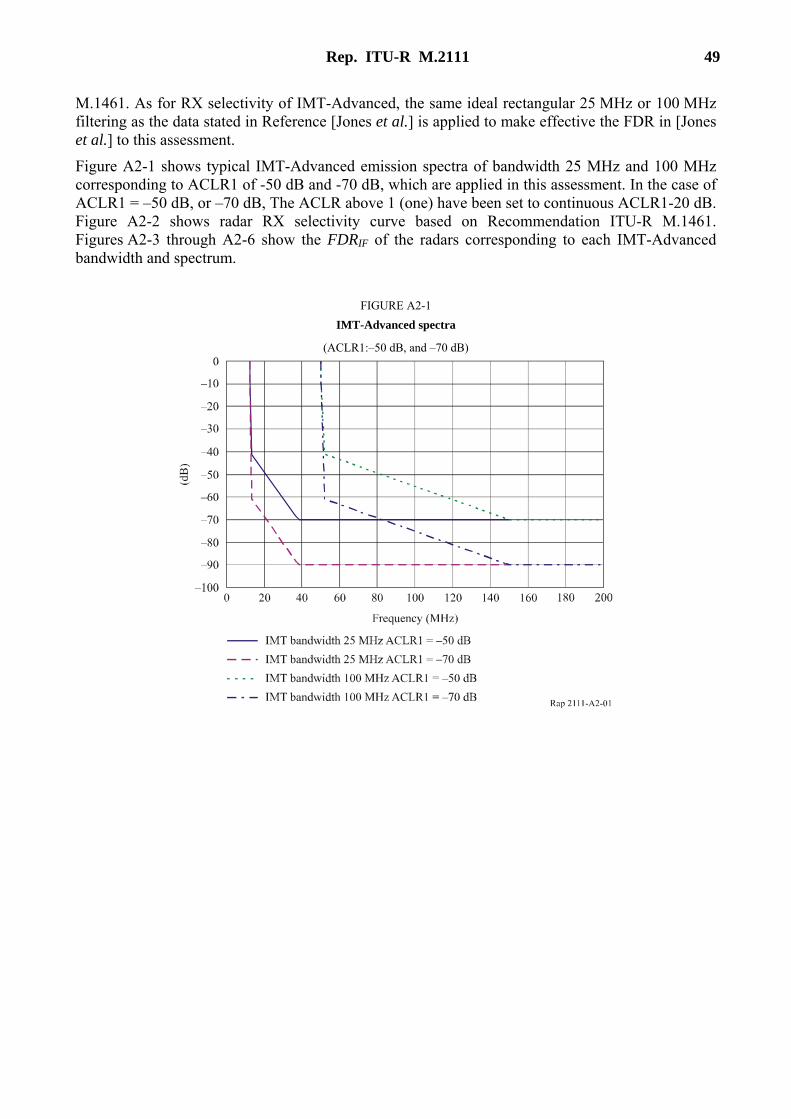
Rep. ITU-R M.2111 49
M.1461. As for RX selectivity of IMT-Advanced, the same ideal rectangular 25 MHz or 100 MHz filtering as the data stated in Reference [Jones et al.] is applied to make effective the FDR in [Jones et al.] to this assessment.
Figure A2-1 shows typical IMT-Advanced emission spectra of bandwidth 25 MHz and 100 MHz corresponding to ACLR1 of -50 dB and -70 dB, which are applied in this assessment. In the case of ACLR1 = –50 dB, or –70 dB, The ACLR above 1 (one) have been set to continuous ACLR1-20 dB. Figure A2-2 shows radar RX selectivity curve based on Recommendation ITU-R M.1461. Figures A2-3 through A2-6 show the FDRIF of the radars corresponding to each IMT-Advanced bandwidth and spectrum.
FIGURE A2-1 IMT-Advanced spectra
(ACLR1:–50 dB, and –70 dB)
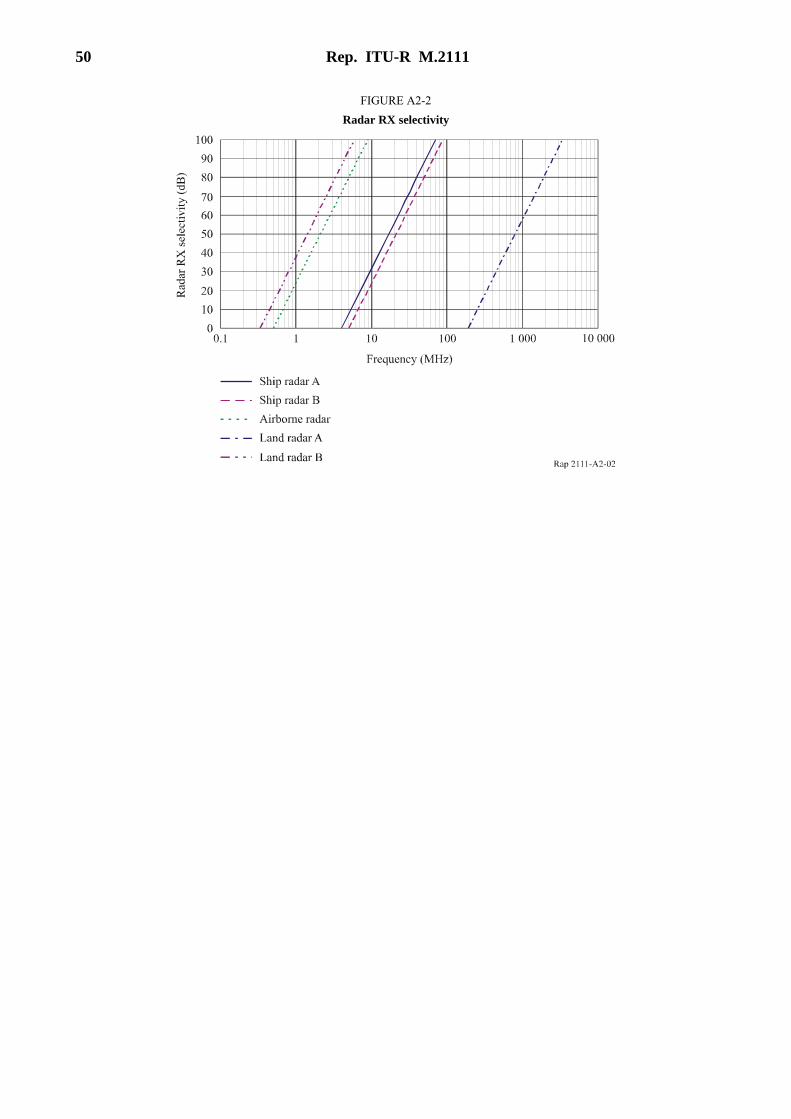
50 Rep. ITU-R M.2111
FIGURE A2-2 Radar RX selectivity
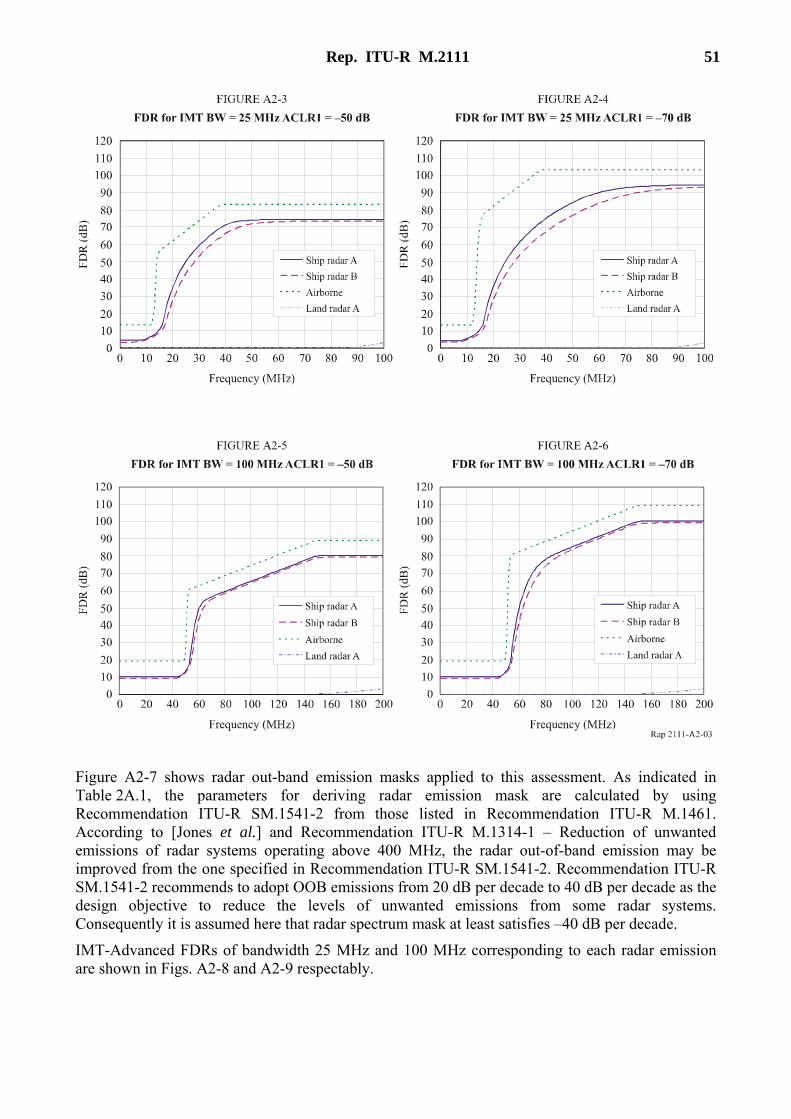
Rep. ITU-R M.2111 51
Figure A2-7 shows radar out-band emission masks applied to this assessment. As indicated in Table 2A.1, the parameters for deriving radar emission mask are calculated by using Recommendation ITU-R SM.1541-2 from those listed in Recommendation ITU-R M.1461. According to [Jones et al.] and Recommendation ITU-R M.1314-1 – Reduction of unwanted emissions of radar systems operating above 400 MHz, the radar out-of-band emission may be improved from the one specified in Recommendation ITU-R SM.1541-2. Recommendation ITU-R SM.1541-2 recommends to adopt OOB emissions from 20 dB per decade to 40 dB per decade as the design objective to reduce the levels of unwanted emissions from some radar systems. Consequently it is assumed here that radar spectrum mask at least satisfies –40 dB per decade.
IMT-Advanced FDRs of bandwidth 25 MHz and 100 MHz corresponding to each radar emission are shown in Figs. A2-8 and A2-9 respectably.
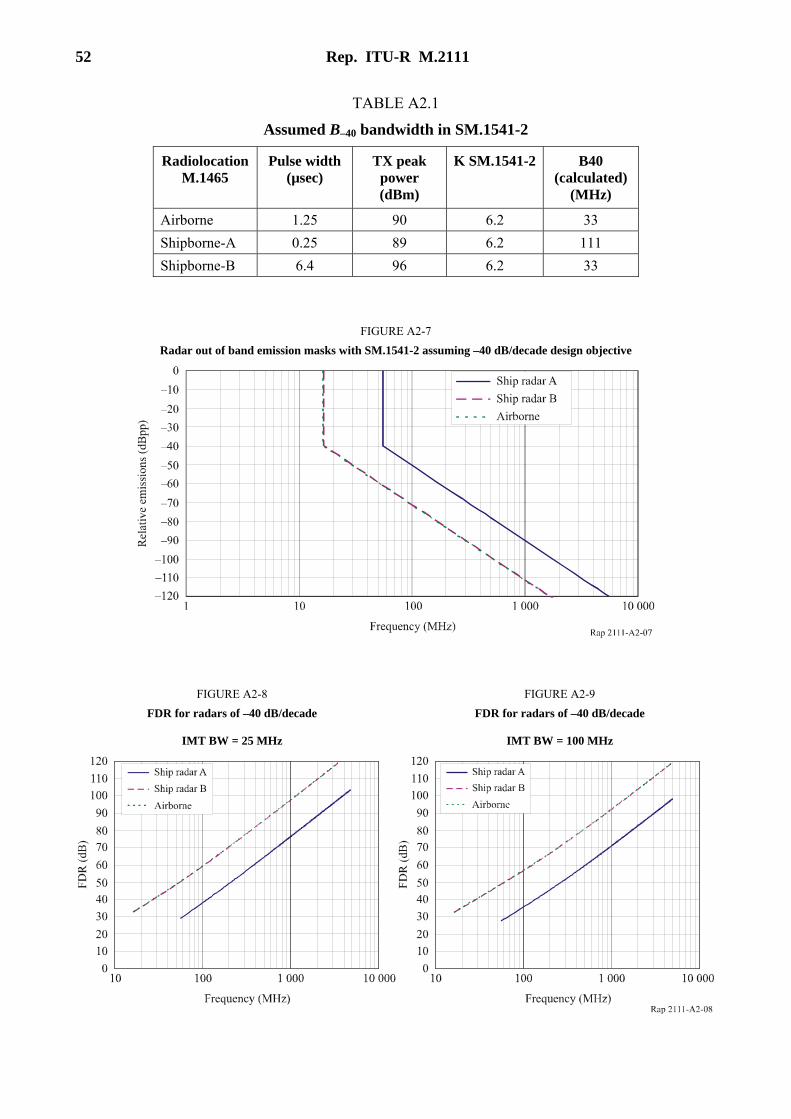
52 Rep. ITU-R M.2111
TABLE A2.1
Assumed B–40 bandwidth in SM.1541-2
Radiolocation M.1465
Pulse width(µsec)
TX peak power (dBm)
K SM.1541-2 B40 (calculated)
(MHz)
Airborne 1.25 90 6.2 33 Shipborne-A 0.25 89 6.2 111 Shipborne-B 6.4 96 6.2 33
FIGURE A2-7 Radar out of band emission masks with SM.1541-2 assuming –40 dB/decade design objective
FIGURE A2-8 FDR for radars of –40 dB/decade
IMT BW = 25 MHz
FIGURE A2-9 FDR for radars of –40 dB/decade
IMT BW = 100 MHz
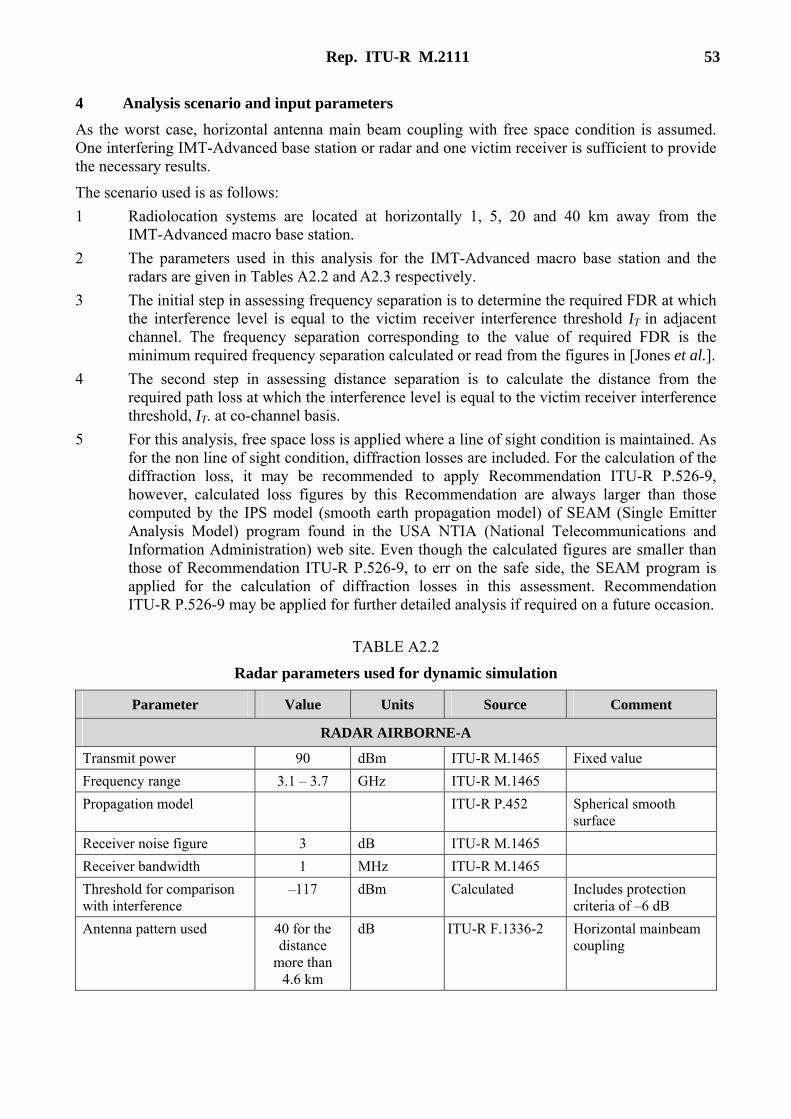
Rep. ITU-R M.2111 53
4 Analysis scenario and input parameters As the worst case, horizontal antenna main beam coupling with free space condition is assumed. One interfering IMT-Advanced base station or radar and one victim receiver is sufficient to provide the necessary results.
The scenario used is as follows: 1 Radiolocation systems are located at horizontally 1, 5, 20 and 40 km away from the
IMT-Advanced macro base station. 2 The parameters used in this analysis for the IMT-Advanced macro base station and the
radars are given in Tables A2.2 and A2.3 respectively. 3 The initial step in assessing frequency separation is to determine the required FDR at which
the interference level is equal to the victim receiver interference threshold IT in adjacent channel. The frequency separation corresponding to the value of required FDR is the minimum required frequency separation calculated or read from the figures in [Jones et al.].
4 The second step in assessing distance separation is to calculate the distance from the required path loss at which the interference level is equal to the victim receiver interference threshold, IT. at co-channel basis.
5 For this analysis, free space loss is applied where a line of sight condition is maintained. As for the non line of sight condition, diffraction losses are included. For the calculation of the diffraction loss, it may be recommended to apply Recommendation ITU-R P.526-9, however, calculated loss figures by this Recommendation are always larger than those computed by the IPS model (smooth earth propagation model) of SEAM (Single Emitter Analysis Model) program found in the USA NTIA (National Telecommunications and Information Administration) web site. Even though the calculated figures are smaller than those of Recommendation ITU-R P.526-9, to err on the safe side, the SEAM program is applied for the calculation of diffraction losses in this assessment. Recommendation ITU-R P.526-9 may be applied for further detailed analysis if required on a future occasion.
TABLE A2.2
Radar parameters used for dynamic simulation
Parameter Value Units Source Comment
RADAR AIRBORNE-A
Transmit power 90 dBm ITU-R M.1465 Fixed value Frequency range 3.1 – 3.7 GHz ITU-R M.1465 Propagation model ITU-R P.452 Spherical smooth
surface Receiver noise figure 3 dB ITU-R M.1465 Receiver bandwidth 1 MHz ITU-R M.1465 Threshold for comparison with interference
–117 dBm Calculated Includes protection criteria of –6 dB
Antenna pattern used 40 for the distance
more than 4.6 km
dB ITU-R F.1336-2 Horizontal mainbeam coupling
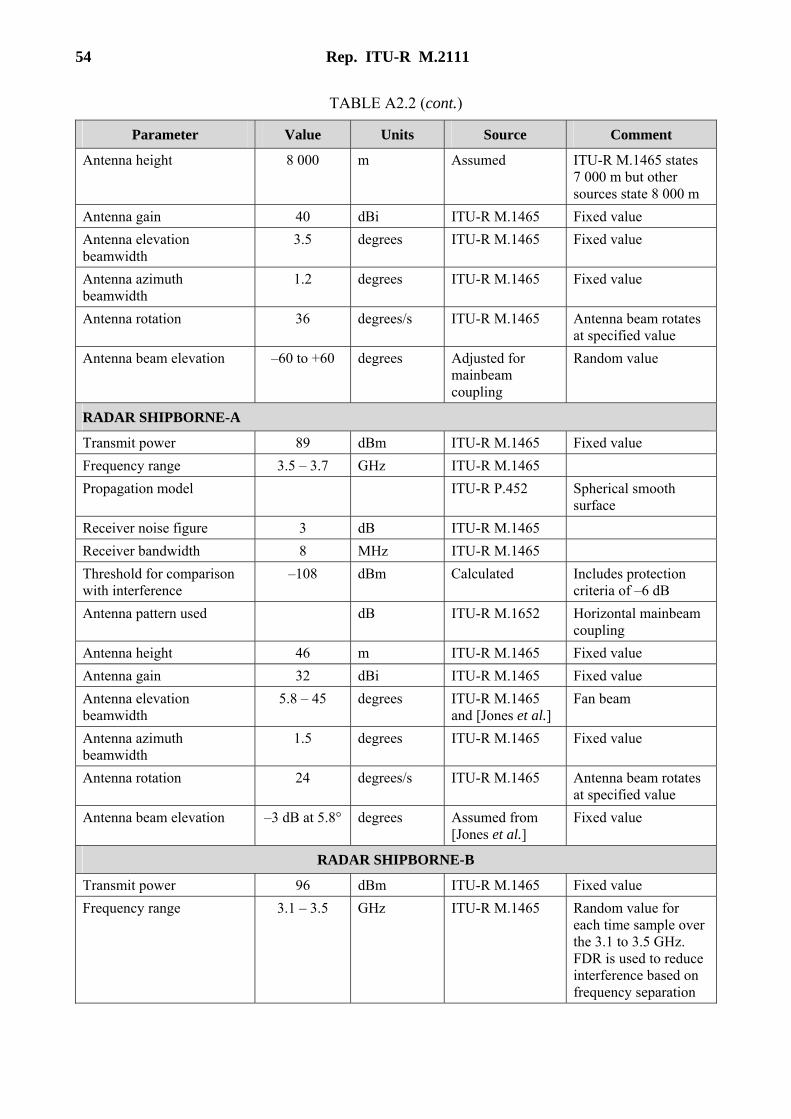
54 Rep. ITU-R M.2111
TABLE A2.2 (cont.)
Parameter Value Units Source Comment
Antenna height 8 000 m Assumed ITU-R M.1465 states 7 000 m but other sources state 8 000 m
Antenna gain 40 dBi ITU-R M.1465 Fixed value Antenna elevation beamwidth
3.5 degrees ITU-R M.1465 Fixed value
Antenna azimuth beamwidth
1.2 degrees ITU-R M.1465 Fixed value
Antenna rotation 36 degrees/s ITU-R M.1465 Antenna beam rotates at specified value
Antenna beam elevation –60 to +60 degrees Adjusted for mainbeam coupling
Random value
RADAR SHIPBORNE-A
Transmit power 89 dBm ITU-R M.1465 Fixed value Frequency range 3.5 – 3.7 GHz ITU-R M.1465 Propagation model ITU-R P.452 Spherical smooth
surface Receiver noise figure 3 dB ITU-R M.1465 Receiver bandwidth 8 MHz ITU-R M.1465 Threshold for comparison with interference
–108 dBm Calculated Includes protection criteria of –6 dB
Antenna pattern used dB ITU-R M.1652 Horizontal mainbeam coupling
Antenna height 46 m ITU-R M.1465 Fixed value Antenna gain 32 dBi ITU-R M.1465 Fixed value Antenna elevation beamwidth
5.8 – 45 degrees ITU-R M.1465 and [Jones et al.]
Fan beam
Antenna azimuth beamwidth
1.5 degrees ITU-R M.1465 Fixed value
Antenna rotation 24 degrees/s ITU-R M.1465 Antenna beam rotates at specified value
Antenna beam elevation –3 dB at 5.8° degrees Assumed from [Jones et al.]
Fixed value
RADAR SHIPBORNE-B
Transmit power 96 dBm ITU-R M.1465 Fixed value Frequency range 3.1 – 3.5 GHz ITU-R M.1465 Random value for
each time sample over the 3.1 to 3.5 GHz. FDR is used to reduce interference based on frequency separation
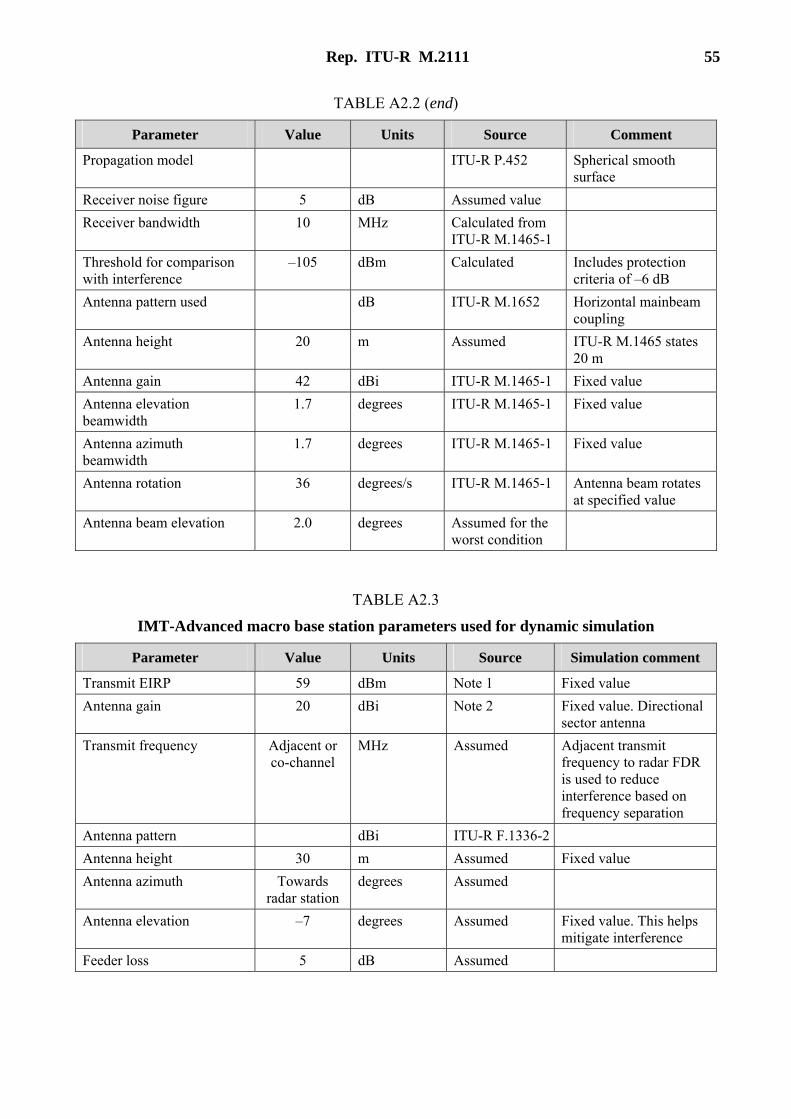
Rep. ITU-R M.2111 55
TABLE A2.2 (end)
Parameter Value Units Source Comment
Propagation model ITU-R P.452 Spherical smooth surface
Receiver noise figure 5 dB Assumed value Receiver bandwidth 10 MHz Calculated from
ITU-R M.1465-1
Threshold for comparison with interference
–105 dBm Calculated Includes protection criteria of –6 dB
Antenna pattern used dB ITU-R M.1652 Horizontal mainbeam coupling
Antenna height 20 m Assumed ITU-R M.1465 states 20 m
Antenna gain 42 dBi ITU-R M.1465-1 Fixed value Antenna elevation beamwidth
1.7 degrees ITU-R M.1465-1 Fixed value
Antenna azimuth beamwidth
1.7 degrees ITU-R M.1465-1 Fixed value
Antenna rotation 36 degrees/s ITU-R M.1465-1 Antenna beam rotates at specified value
Antenna beam elevation 2.0 degrees Assumed for the worst condition
TABLE A2.3
IMT-Advanced macro base station parameters used for dynamic simulation
Parameter Value Units Source Simulation comment
Transmit EIRP 59 dBm Note 1 Fixed value Antenna gain 20 dBi Note 2 Fixed value. Directional
sector antenna Transmit frequency Adjacent or
co-channel MHz Assumed Adjacent transmit
frequency to radar FDR is used to reduce interference based on frequency separation
Antenna pattern dBi ITU-R F.1336-2 Antenna height 30 m Assumed Fixed value Antenna azimuth Towards
radar station degrees Assumed
Antenna elevation –7 degrees Assumed Fixed value. This helps mitigate interference
Feeder loss 5 dB Assumed
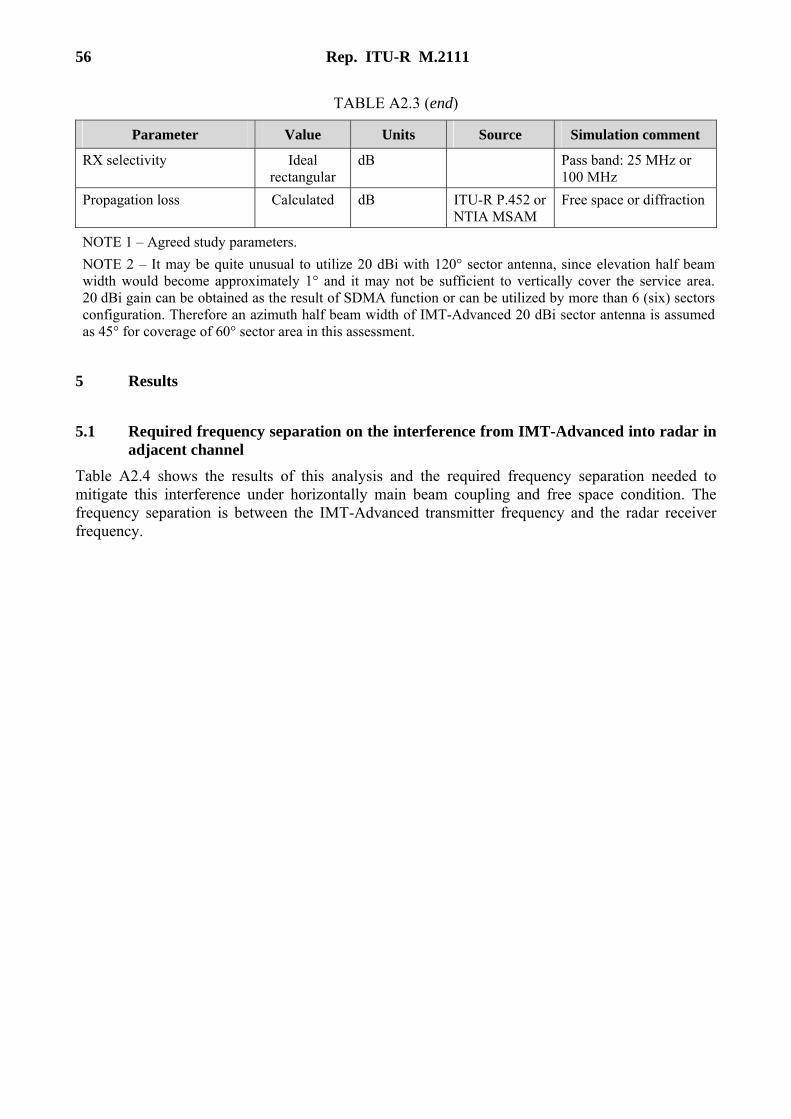
56 Rep. ITU-R M.2111
TABLE A2.3 (end)
Parameter Value Units Source Simulation comment
RX selectivity Ideal rectangular
dB Pass band: 25 MHz or 100 MHz
Propagation loss Calculated dB ITU-R P.452 or NTIA MSAM
Free space or diffraction
NOTE 1 – Agreed study parameters. NOTE 2 – It may be quite unusual to utilize 20 dBi with 120° sector antenna, since elevation half beam width would become approximately 1° and it may not be sufficient to vertically cover the service area. 20 dBi gain can be obtained as the result of SDMA function or can be utilized by more than 6 (six) sectors configuration. Therefore an azimuth half beam width of IMT-Advanced 20 dBi sector antenna is assumed as 45° for coverage of 60° sector area in this assessment.
5 Results
5.1 Required frequency separation on the interference from IMT-Advanced into radar in adjacent channel
Table A2.4 shows the results of this analysis and the required frequency separation needed to mitigate this interference under horizontally main beam coupling and free space condition. The frequency separation is between the IMT-Advanced transmitter frequency and the radar receiver frequency.
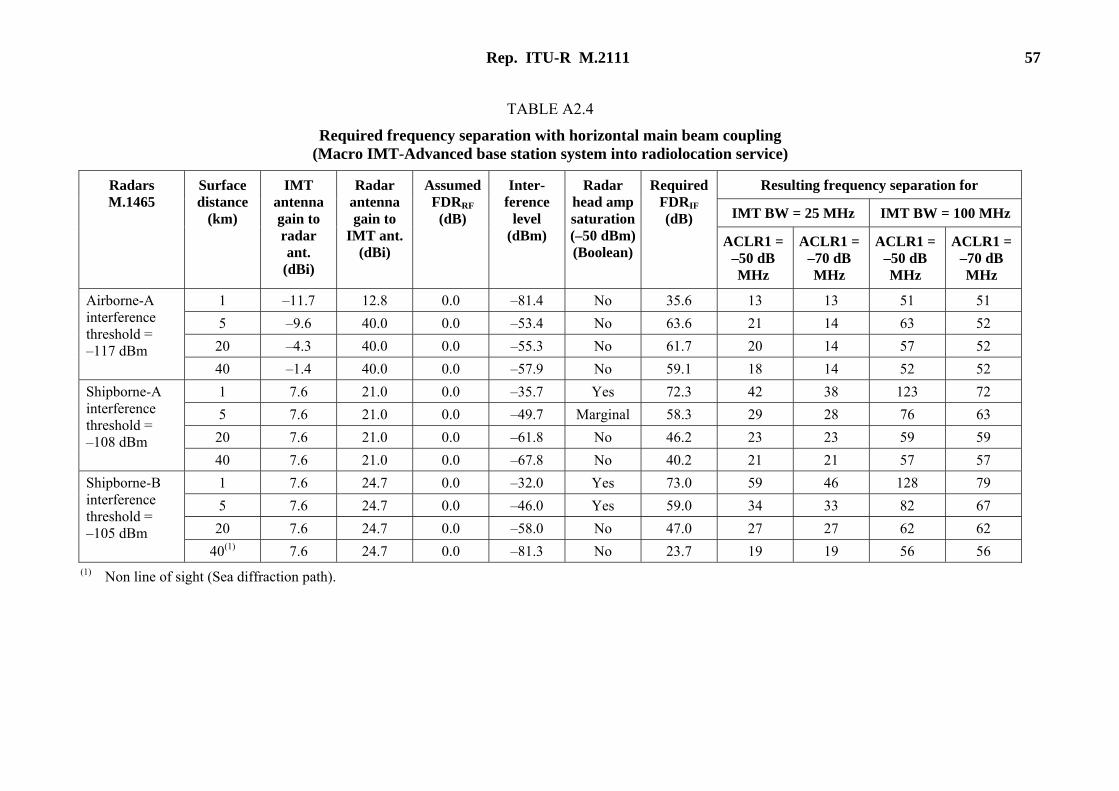
Rep. ITU-R M.2111 57
TABLE A2.4
Required frequency separation with horizontal main beam coupling (Macro IMT-Advanced base station system into radiolocation service)
Resulting frequency separation for
IMT BW = 25 MHz IMT BW = 100 MHz
Radars M.1465
Surface distance
(km)
IMT antenna gain to radar ant.
(dBi)
Radar antenna gain to
IMT ant.(dBi)
Assumed FDRRF
(dB)
Inter-ference
level (dBm)
Radar head amp saturation (–50 dBm) (Boolean)
Required FDRIF (dB)
ACLR1 = –50 dB MHz
ACLR1 = –70 dB MHz
ACLR1 = –50 dB MHz
ACLR1 = –70 dB MHz
1 –11.7 12.8 0.0 –81.4 No 35.6 13 13 51 51 5 –9.6 40.0 0.0 –53.4 No 63.6 21 14 63 52
20 –4.3 40.0 0.0 –55.3 No 61.7 20 14 57 52
Airborne-A interference threshold = –117 dBm
40 –1.4 40.0 0.0 –57.9 No 59.1 18 14 52 52 1 7.6 21.0 0.0 –35.7 Yes 72.3 42 38 123 72 5 7.6 21.0 0.0 –49.7 Marginal 58.3 29 28 76 63
20 7.6 21.0 0.0 –61.8 No 46.2 23 23 59 59
Shipborne-A interference threshold = –108 dBm
40 7.6 21.0 0.0 –67.8 No 40.2 21 21 57 57 1 7.6 24.7 0.0 –32.0 Yes 73.0 59 46 128 79 5 7.6 24.7 0.0 –46.0 Yes 59.0 34 33 82 67
20 7.6 24.7 0.0 –58.0 No 47.0 27 27 62 62
Shipborne-B interference threshold = –105 dBm
40(1) 7.6 24.7 0.0 –81.3 No 23.7 19 19 56 56 (1) Non line of sight (Sea diffraction path).
58 Rep. ITU-R M.2111
As seen in Table A2.4, the first adjacent channel interference from the IMT-Advanced to the radars is within the tolerable range for distance of more than 1 km, if ACLR1 is –70 dB or less. The first adjacent channel is more than 12.5 MHz and less than 37.5 MHz offset from the centre frequency in 25 MHz channel or more than 50 MHz and less than 150 MHz at 100 MHz channel.
In the case of airborne radar, it seems that the coexistence within the first adjacent channel, even if the frequency of airborne radar is located very near the band edge of IMT-advanced, is possible without any mitigation techniques. The shipborne radar-A requiring the largest frequency separation of 59 MHz for 25 MHz or 128 MHz for 100 MHz IMT-Advanced system, if the ACLR1 is –50 dB and the separation distance is 1 km.
Here, frequency separation has been evaluated for ACLR1 of –50 dB and –70 dB. Smaller ACLR value obviously leads to smaller frequency separation, if radar bandwidth is small enough to IMT-Advanced bandwidth. The evaluations shown in this Table are made for I/N = –6dB criterion based on the assumption that interference signals of different frequencies exist in radar in-band even after demodulation. Actually, out of baseband power elimination effects exerted, for example, by low pass function of A to D conversion further reduce the interference signals outside the baseband pass band. This can also be understood from the fact that the effective bandwidth of the receiver thermal noise is basically evaluated by the baseband bandwidth. Therefore though main interference signals are spurious components of IMT-Advanced signals in the radar in-band, it is expected that the required frequency separation can be reduced if the baseband processing gain is taken into consideration. However, the effect depends on the ratio of, factors such as the A to D sampling frequency, equivalent bandwidth reduced by averaging function, and pulse compression function etc. to RX bandwidth. The data of the above and should be defined as FDRBB, but is not currently available.
5.2 Required frequency separation for the interference from radars into IMT-Advanced in adjacent channel
Table A2.5 shows the required frequency separation for interference from radar to IMT-Advanced under horizontally main beam coupling and free space condition. The frequency separation is between the radar transmitter frequency and the IMT-Advanced receiver frequency.
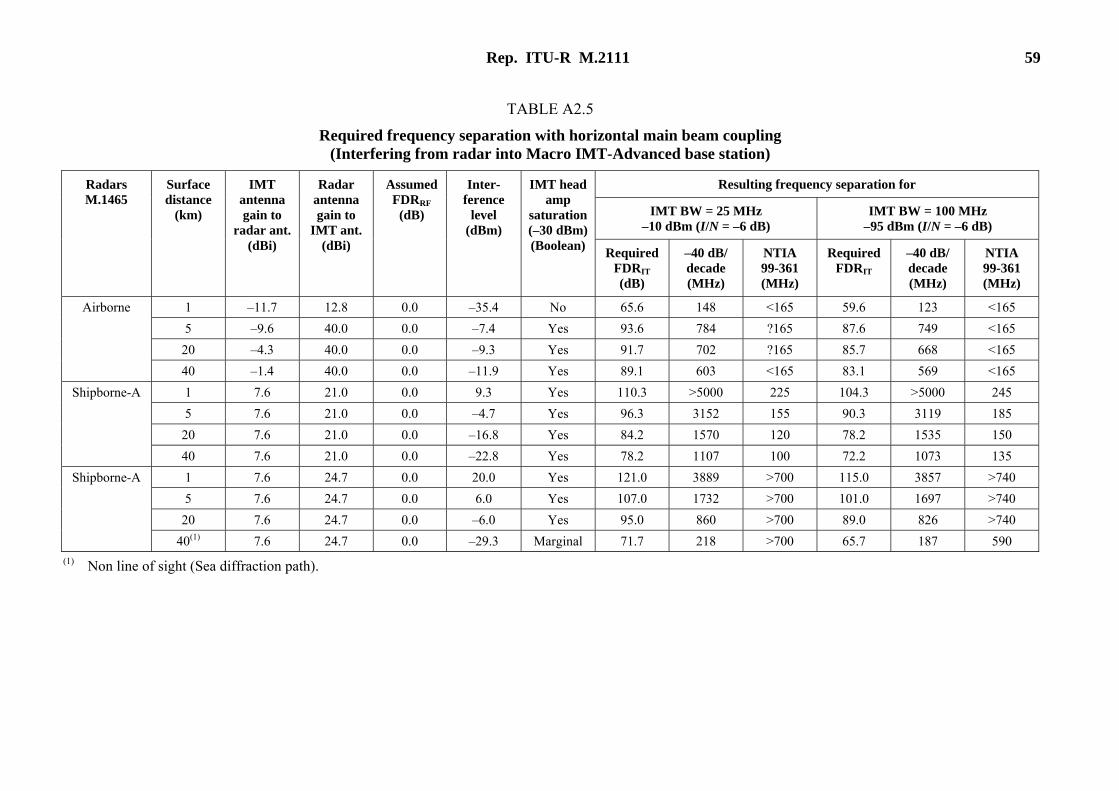
Rep. ITU-R M.2111 59
TABLE A2.5
Required frequency separation with horizontal main beam coupling (Interfering from radar into Macro IMT-Advanced base station)
Resulting frequency separation for
IMT BW = 25 MHz –10 dBm (I/N = –6 dB)
IMT BW = 100 MHz –95 dBm (I/N = –6 dB)
Radars M.1465
Surface distance
(km)
IMT antenna gain to
radar ant. (dBi)
Radar antenna gain to
IMT ant.(dBi)
Assumed FDRRF
(dB)
Inter-ference
level (dBm)
IMT head amp
saturation (–30 dBm)(Boolean) Required
FDRIT (dB)
–40 dB/ decade (MHz)
NTIA 99-361 (MHz)
Required FDRIT
–40 dB/ decade (MHz)
NTIA 99-361 (MHz)
1 –11.7 12.8 0.0 –35.4 No 65.6 148 <165 59.6 123 <165 5 –9.6 40.0 0.0 –7.4 Yes 93.6 784 ?165 87.6 749 <165
20 –4.3 40.0 0.0 –9.3 Yes 91.7 702 ?165 85.7 668 <165
Airborne
40 –1.4 40.0 0.0 –11.9 Yes 89.1 603 <165 83.1 569 <165 1 7.6 21.0 0.0 9.3 Yes 110.3 >5000 225 104.3 >5000 245 5 7.6 21.0 0.0 –4.7 Yes 96.3 3152 155 90.3 3119 185
20 7.6 21.0 0.0 –16.8 Yes 84.2 1570 120 78.2 1535 150
Shipborne-A
40 7.6 21.0 0.0 –22.8 Yes 78.2 1107 100 72.2 1073 135 1 7.6 24.7 0.0 20.0 Yes 121.0 3889 >700 115.0 3857 >740 5 7.6 24.7 0.0 6.0 Yes 107.0 1732 >700 101.0 1697 >740
20 7.6 24.7 0.0 –6.0 Yes 95.0 860 >700 89.0 826 >740
Shipborne-A
40(1) 7.6 24.7 0.0 –29.3 Marginal 71.7 218 >700 65.7 187 590 (1) Non line of sight (Sea diffraction path).
60 Rep. ITU-R M.2111
If FDRRF of IMT-Advanced cannot be expected, the strength of the interference may exceed the maximum allowable input level of the head amplifier of the IMT-Advanced receiver and cause the saturation of the head amplifier for the separation distance of 40 km or less.
Even when the radar spectrum mask is –40 dB per decade, the required frequency separation is approximately 1 GHz or over except for the special cases in which the vertical directivity characteristics of the airborne radar relieves the situation. Though not included in this Table, in the case of –20 dB per decade which is stipulated in Recommendation ITU-R SM.1541-2, the required frequency separation is 5 GHz or over for all of Airborne, Ship-A and Ship-B radars. However, with the application of [Jones et al.], the required frequency separation for Ship-A Radar is obtained as approximately 245 MHz for IMT-Advanced BW of 100 MHz. The required frequency separation for Ship-B Radar is, however, 740 MHz or more because the required FDR surpass the range illustrated in the figure of [Jones et al.]. The out of band emission level of Ship-B can be seen in [Jones et al.]. It is quite high and 24 dB per decade from 50 MHz to 500 MHz offset. This is the reason why large frequency separation is needed.
For example according to [Jones et al.] and Recommendation ITU-R M.1314-1, spurious level is –110 to –120 dBc per 1MHz and because the spurious band is estimated to be frequency offset by more than 5 × B–40, the required frequency separation becomes approximately 165 MHz.
The quite large frequency separation is needed between Ship-A, B radars and IMT-Advanced stations. Mitigation techniques applicable to these combinations are important and are discussed in Annex 3.
6 Conclusions of Study A Based on the results of the analysis in this study, the following conclusions are presented: 1 In the case that IMT-Advanced is using a transmit bandwidth of 25 MHz or 100 MHz and
maximum transmission EIRP with ACLR1 of –50dB, the required frequency separation between the shipborne-A and IMT-Advanced carrier frequencies would be greater than 59 MHz or 128 MHz.
2 In the case that IMT-Advanced is the victim receiver, the required frequency separation between the shipborne-A radar and IMT-Advanced carrier frequencies would be greater than 740 MHz even though [Jones et al.] is applied.
3 The required frequency separation is much larger in the cases that IMT-Advanced station is the victim. Consequently, in the frequency band at which IMT-Advanced is allocated on a primary basis and radar on a secondary basis, geographical segregation alone may not be adequate.
4 In the co-channel interference with the Airborne radar, if radar is the victim, the required separation distance is 360 km as shown in Annex 1 Study A and Study B. If the IMT-Advanced is the victim, the required separation distance is above 700 km. The required separation distance is larger in the cases that the IMT-Advanced is victim. If the airborne radars move at very high velocities and their number is limited, the interference from them may be temporal and occasional to the IMT-Advanced system.
5 In order to establish specific sharing constraints such as area segregation etc., more specific radar and IMT Advanced parameters and deployment density are required.
6 In the area where radars have already existed, if the priority of the allocation is equal between the radiolocation and mobile services, both sides have to take measures to prevent interferences to the other. Namely the mobile side has to employ mitigation techniques to prevent the interference to the radiolocation side and the radiolocation side has to take measures to prevent the interference to the mobile side.
Rep. ITU-R M.2111 61
References JONES, S.K., HINKLE, R.L., SANDERS, F.H. and RAMSEY, B.J. NTIA TR-99-361. Technical
characteristics of radiolocation systems operating in the 3.1-3.7 GHz band and procedures for assessing EMC with fixed earth station receivers.
Study B
Frequency separation
1 Introduction This study assesses the compatibility between existing radar systems operating in the radiolocation service and IMT-Advanced systems in adjacent channels.
2 Radiolocation systems technical characteristics
2.1 Radiolocation service protection criteria The dynamic analysis in this document uses the ITU recommended I/N radiolocation protection criteria value of –6 dB as documented in Recommendation ITU-R M.1465-1.
3 Interference assessment of IMT-Advanced systems into radiolocation service Given that subscriber units in IMT-Advanced systems are generally mobile and that the radio environments defined include outdoor cells, it is reasonable to assume that each environment may have links that are noise-limited. The interference threshold, IT, to be considered in this sharing study is the interference-to-noise ratio threshold derived from Recommendation ITU-R M.1461 as:
IT = NRx + Protection criteria (1)
where: IT: required threshold not to be exceeded (dB)
ITU Recommended protection criteria = –6 dB for radar NRx: radar receiver inherent noise level (dBm).
The noise at the receiver input referred to the IF bandwidth is given by:
( ) ( ) NFBTkN IFRx ++⋅= log10log10 0 (2)
where: NRx: receiver noise power (dBm) k: Boltzmann’s constant = 1.38 × 10⁻²³ Joule/K T0: absolute temperature (K), assumed to be 290 K for this analysis BIF: receiver’s intermediate frequency bandwidth (Hz) NF: receiver noise figure (dB).
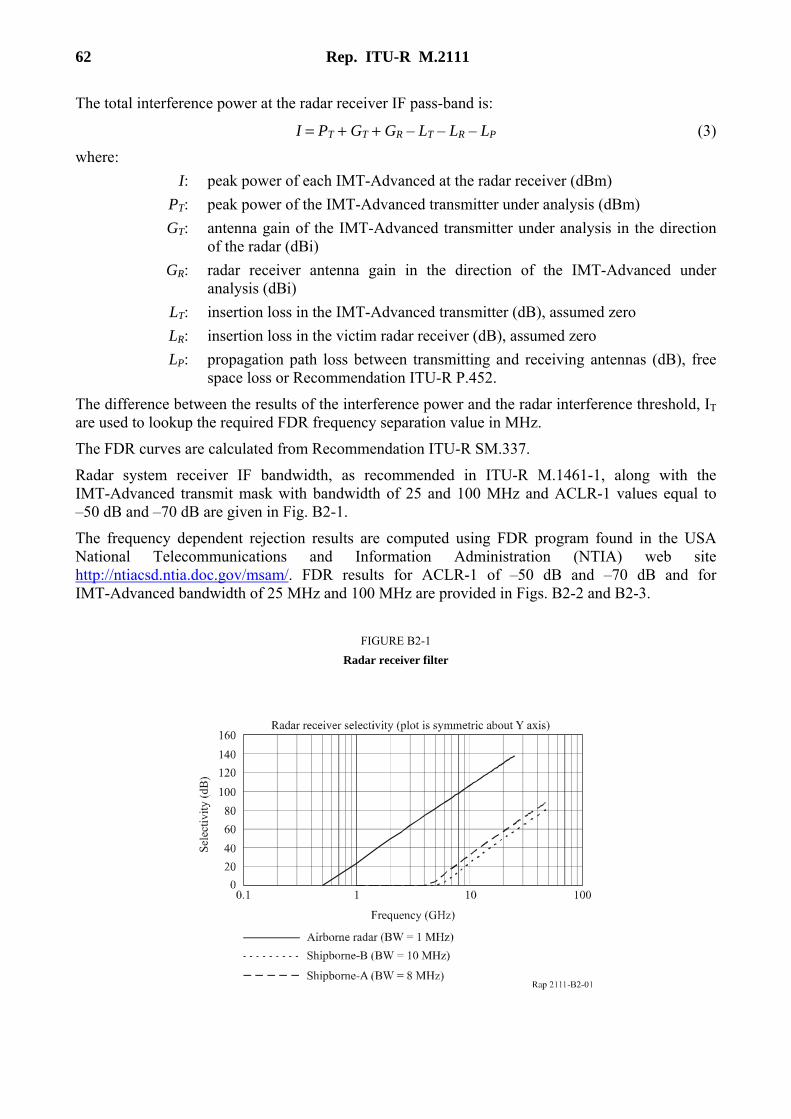
62 Rep. ITU-R M.2111
The total interference power at the radar receiver IF pass-band is:
I = PT + GT + GR – LT – LR – LP (3)
where: I: peak power of each IMT-Advanced at the radar receiver (dBm) PT: peak power of the IMT-Advanced transmitter under analysis (dBm) GT: antenna gain of the IMT-Advanced transmitter under analysis in the direction
of the radar (dBi) GR: radar receiver antenna gain in the direction of the IMT-Advanced under
analysis (dBi) LT: insertion loss in the IMT-Advanced transmitter (dB), assumed zero LR: insertion loss in the victim radar receiver (dB), assumed zero LP: propagation path loss between transmitting and receiving antennas (dB), free
space loss or Recommendation ITU-R P.452.
The difference between the results of the interference power and the radar interference threshold, IT are used to lookup the required FDR frequency separation value in MHz.
The FDR curves are calculated from Recommendation ITU-R SM.337.
Radar system receiver IF bandwidth, as recommended in ITU-R M.1461-1, along with the IMT-Advanced transmit mask with bandwidth of 25 and 100 MHz and ACLR-1 values equal to –50 dB and –70 dB are given in Fig. B2-1.
The frequency dependent rejection results are computed using FDR program found in the USA National Telecommunications and Information Administration (NTIA) web site http://ntiacsd.ntia.doc.gov/msam/. FDR results for ACLR-1 of –50 dB and –70 dB and for IMT-Advanced bandwidth of 25 MHz and 100 MHz are provided in Figs. B2-2 and B2-3.
FIGURE B2-1 Radar receiver filter
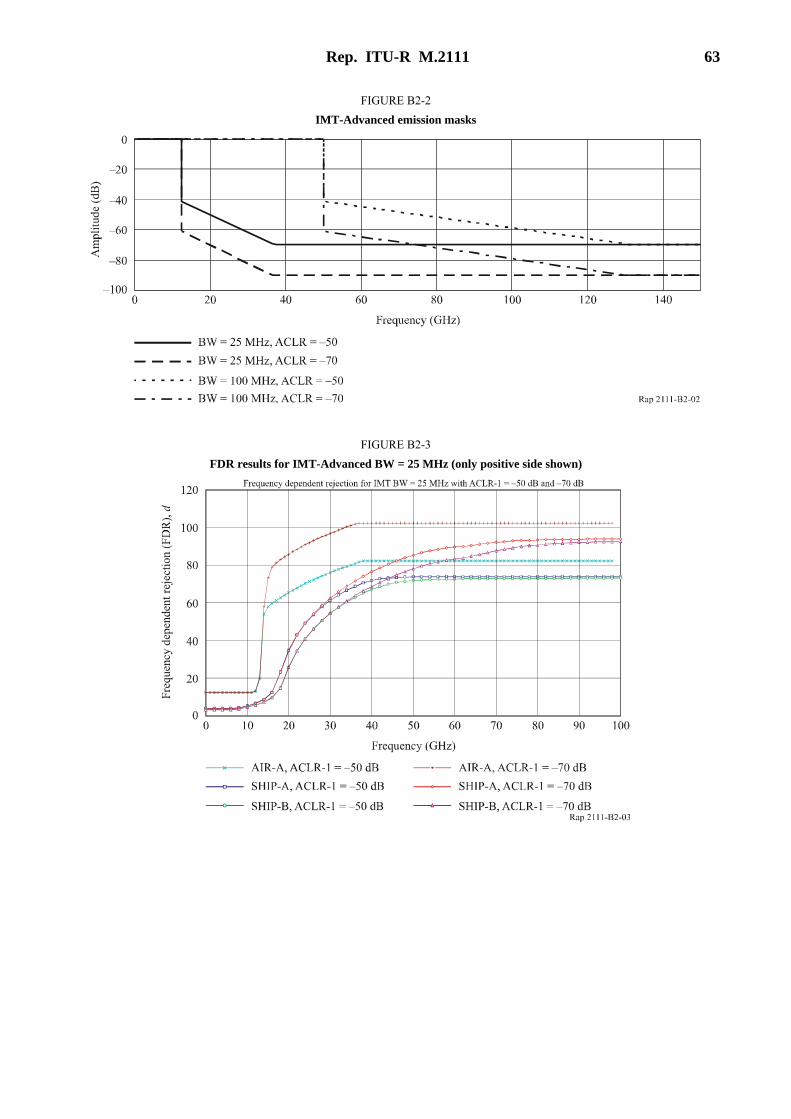
Rep. ITU-R M.2111 63
FIGURE B2-2 IMT-Advanced emission masks
FIGURE B2-3 FDR results for IMT-Advanced BW = 25 MHz (only positive side shown)
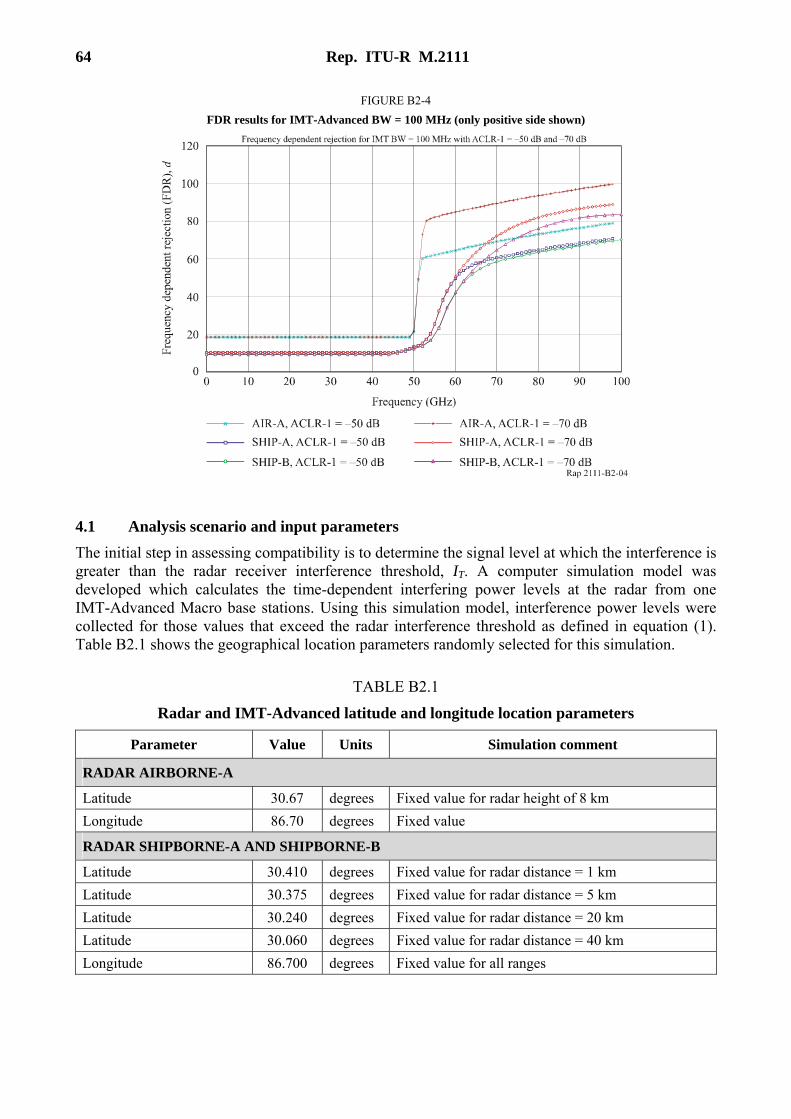
64 Rep. ITU-R M.2111
FIGURE B2-4 FDR results for IMT-Advanced BW = 100 MHz (only positive side shown)
4.1 Analysis scenario and input parameters The initial step in assessing compatibility is to determine the signal level at which the interference is greater than the radar receiver interference threshold, IT. A computer simulation model was developed which calculates the time-dependent interfering power levels at the radar from one IMT-Advanced Macro base stations. Using this simulation model, interference power levels were collected for those values that exceed the radar interference threshold as defined in equation (1). Table B2.1 shows the geographical location parameters randomly selected for this simulation.
TABLE B2.1
Radar and IMT-Advanced latitude and longitude location parameters
Parameter Value Units Simulation comment
RADAR AIRBORNE-A
Latitude 30.67 degrees Fixed value for radar height of 8 km Longitude 86.70 degrees Fixed value
RADAR SHIPBORNE-A AND SHIPBORNE-B
Latitude 30.410 degrees Fixed value for radar distance = 1 km Latitude 30.375 degrees Fixed value for radar distance = 5 km Latitude 30.240 degrees Fixed value for radar distance = 20 km Latitude 30.060 degrees Fixed value for radar distance = 40 km Longitude 86.700 degrees Fixed value for all ranges
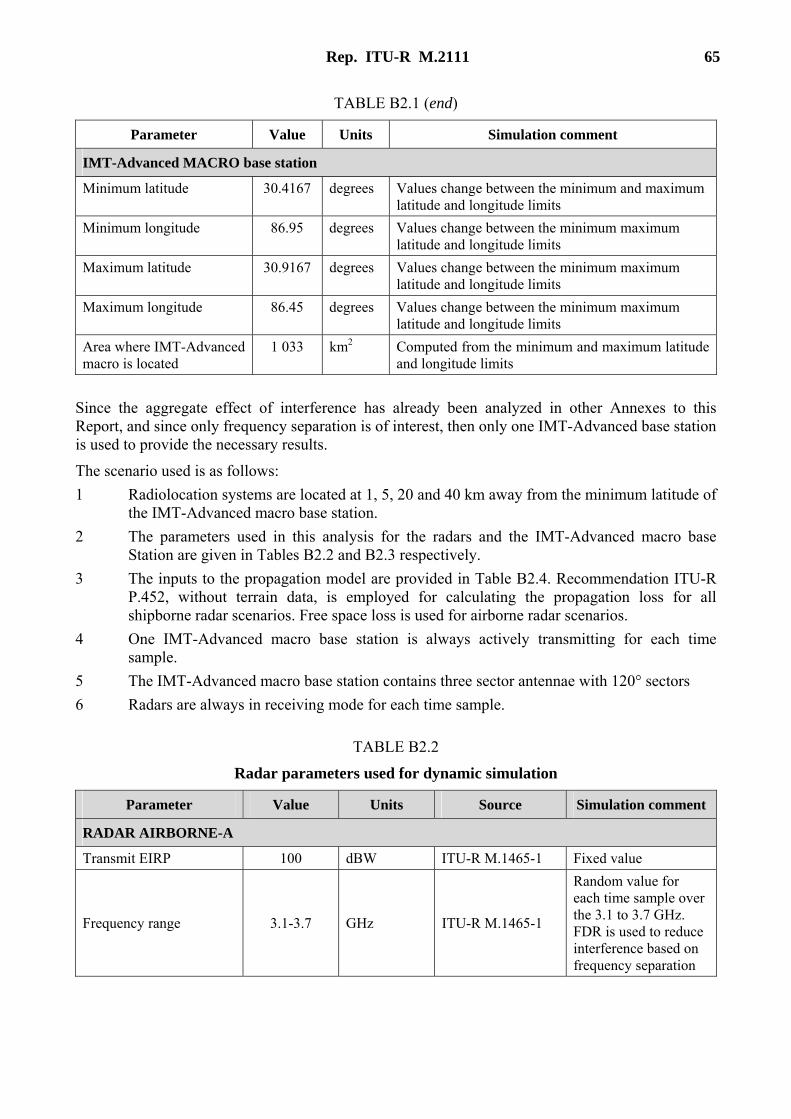
Rep. ITU-R M.2111 65
TABLE B2.1 (end)
Parameter Value Units Simulation comment
IMT-Advanced MACRO base station
Minimum latitude 30.4167 degrees Values change between the minimum and maximum latitude and longitude limits
Minimum longitude 86.95 degrees Values change between the minimum maximum latitude and longitude limits
Maximum latitude 30.9167 degrees Values change between the minimum maximum latitude and longitude limits
Maximum longitude 86.45 degrees Values change between the minimum maximum latitude and longitude limits
Area where IMT-Advanced macro is located
1 033 km2 Computed from the minimum and maximum latitude and longitude limits
Since the aggregate effect of interference has already been analyzed in other Annexes to this Report, and since only frequency separation is of interest, then only one IMT-Advanced base station is used to provide the necessary results.
The scenario used is as follows: 1 Radiolocation systems are located at 1, 5, 20 and 40 km away from the minimum latitude of
the IMT-Advanced macro base station. 2 The parameters used in this analysis for the radars and the IMT-Advanced macro base
Station are given in Tables B2.2 and B2.3 respectively. 3 The inputs to the propagation model are provided in Table B2.4. Recommendation ITU-R
P.452, without terrain data, is employed for calculating the propagation loss for all shipborne radar scenarios. Free space loss is used for airborne radar scenarios.
4 One IMT-Advanced macro base station is always actively transmitting for each time sample.
5 The IMT-Advanced macro base station contains three sector antennae with 120° sectors 6 Radars are always in receiving mode for each time sample.
TABLE B2.2
Radar parameters used for dynamic simulation
Parameter Value Units Source Simulation comment
RADAR AIRBORNE-A
Transmit EIRP 100 dBW ITU-R M.1465-1 Fixed value
Frequency range 3.1-3.7 GHz ITU-R M.1465-1
Random value for each time sample over the 3.1 to 3.7 GHz. FDR is used to reduce interference based on frequency separation
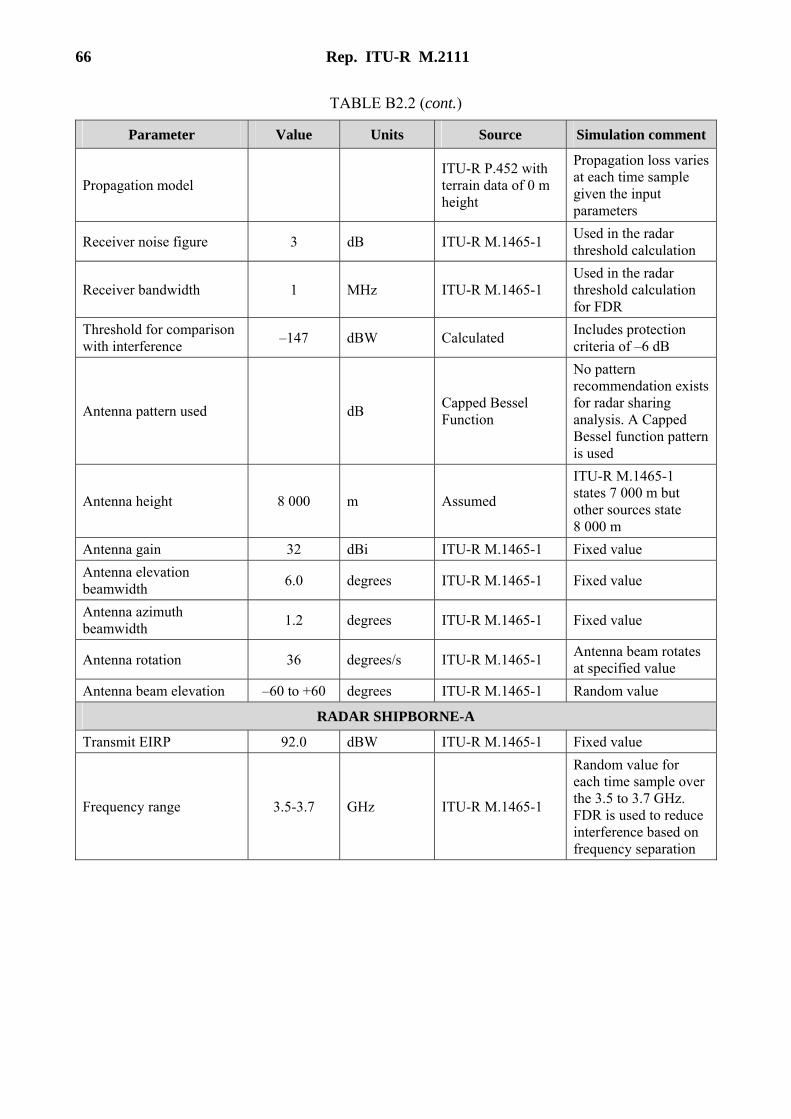
66 Rep. ITU-R M.2111
TABLE B2.2 (cont.)
Parameter Value Units Source Simulation comment
Propagation model ITU-R P.452 with terrain data of 0 m height
Propagation loss varies at each time sample given the input parameters
Receiver noise figure 3 dB ITU-R M.1465-1 Used in the radar threshold calculation
Receiver bandwidth 1 MHz ITU-R M.1465-1 Used in the radar threshold calculation for FDR
Threshold for comparison with interference –147 dBW Calculated Includes protection
criteria of –6 dB
Antenna pattern used dB Capped Bessel Function
No pattern recommendation exists for radar sharing analysis. A Capped Bessel function pattern is used
Antenna height 8 000 m Assumed
ITU-R M.1465-1 states 7 000 m but other sources state 8 000 m
Antenna gain 32 dBi ITU-R M.1465-1 Fixed value Antenna elevation beamwidth 6.0 degrees ITU-R M.1465-1 Fixed value
Antenna azimuth beamwidth 1.2 degrees ITU-R M.1465-1 Fixed value
Antenna rotation 36 degrees/s ITU-R M.1465-1 Antenna beam rotates at specified value
Antenna beam elevation –60 to +60 degrees ITU-R M.1465-1 Random value
RADAR SHIPBORNE-A
Transmit EIRP 92.0 dBW ITU-R M.1465-1 Fixed value
Frequency range 3.5-3.7 GHz ITU-R M.1465-1
Random value for each time sample over the 3.5 to 3.7 GHz. FDR is used to reduce interference based on frequency separation
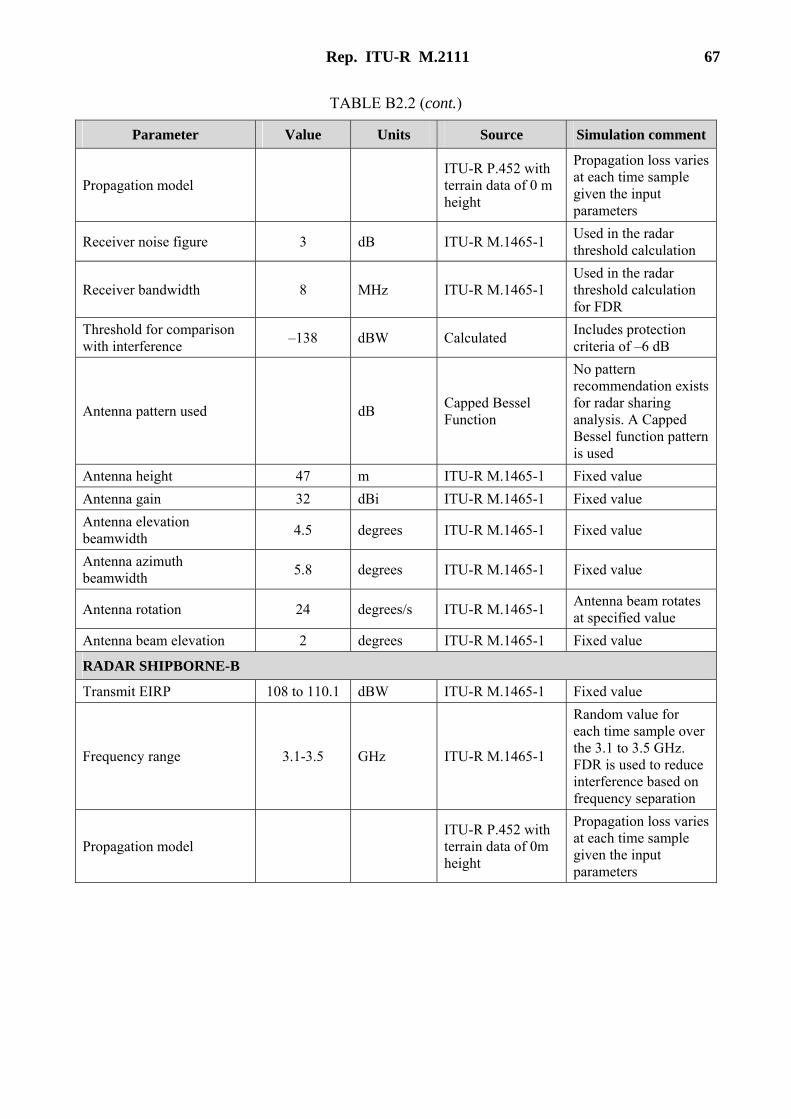
Rep. ITU-R M.2111 67
TABLE B2.2 (cont.)
Parameter Value Units Source Simulation comment
Propagation model ITU-R P.452 with terrain data of 0 m height
Propagation loss varies at each time sample given the input parameters
Receiver noise figure 3 dB ITU-R M.1465-1 Used in the radar threshold calculation
Receiver bandwidth 8 MHz ITU-R M.1465-1 Used in the radar threshold calculation for FDR
Threshold for comparison with interference –138 dBW Calculated Includes protection
criteria of –6 dB
Antenna pattern used dB Capped Bessel Function
No pattern recommendation exists for radar sharing analysis. A Capped Bessel function pattern is used
Antenna height 47 m ITU-R M.1465-1 Fixed value Antenna gain 32 dBi ITU-R M.1465-1 Fixed value Antenna elevation beamwidth 4.5 degrees ITU-R M.1465-1 Fixed value
Antenna azimuth beamwidth 5.8 degrees ITU-R M.1465-1 Fixed value
Antenna rotation 24 degrees/s ITU-R M.1465-1 Antenna beam rotates at specified value
Antenna beam elevation 2 degrees ITU-R M.1465-1 Fixed value
RADAR SHIPBORNE-B
Transmit EIRP 108 to 110.1 dBW ITU-R M.1465-1 Fixed value
Frequency range 3.1-3.5 GHz ITU-R M.1465-1
Random value for each time sample over the 3.1 to 3.5 GHz. FDR is used to reduce interference based on frequency separation
Propagation model ITU-R P.452 with terrain data of 0m height
Propagation loss varies at each time sample given the input parameters
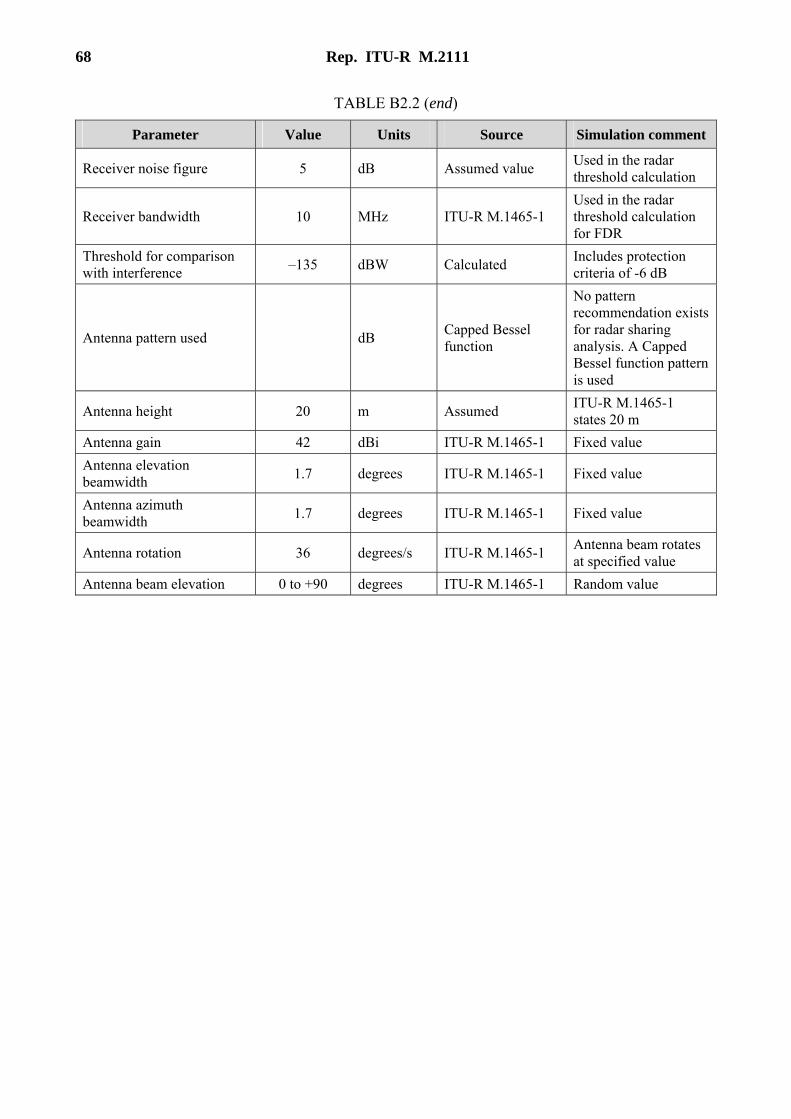
68 Rep. ITU-R M.2111
TABLE B2.2 (end)
Parameter Value Units Source Simulation comment
Receiver noise figure 5 dB Assumed value Used in the radar threshold calculation
Receiver bandwidth 10 MHz ITU-R M.1465-1 Used in the radar threshold calculation for FDR
Threshold for comparison with interference –135 dBW Calculated Includes protection
criteria of -6 dB
Antenna pattern used dB Capped Bessel function
No pattern recommendation exists for radar sharing analysis. A Capped Bessel function pattern is used
Antenna height 20 m Assumed ITU-R M.1465-1 states 20 m
Antenna gain 42 dBi ITU-R M.1465-1 Fixed value Antenna elevation beamwidth 1.7 degrees ITU-R M.1465-1 Fixed value
Antenna azimuth beamwidth 1.7 degrees ITU-R M.1465-1 Fixed value
Antenna rotation 36 degrees/s ITU-R M.1465-1 Antenna beam rotates at specified value
Antenna beam elevation 0 to +90 degrees ITU-R M.1465-1 Random value
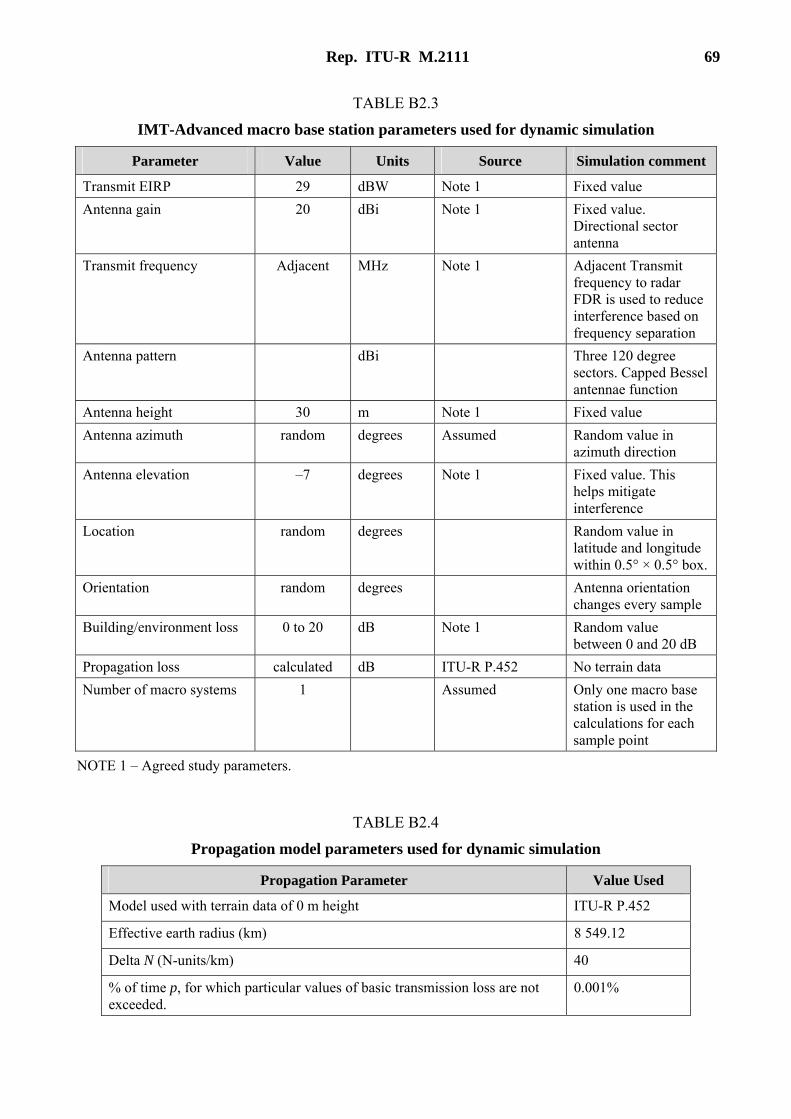
Rep. ITU-R M.2111 69
TABLE B2.3
IMT-Advanced macro base station parameters used for dynamic simulation
Parameter Value Units Source Simulation comment
Transmit EIRP 29 dBW Note 1 Fixed value Antenna gain 20 dBi Note 1 Fixed value.
Directional sector antenna
Transmit frequency Adjacent MHz Note 1 Adjacent Transmit frequency to radar FDR is used to reduce interference based on frequency separation
Antenna pattern dBi Three 120 degree sectors. Capped Bessel antennae function
Antenna height 30 m Note 1 Fixed value Antenna azimuth random degrees Assumed Random value in
azimuth direction Antenna elevation –7 degrees Note 1 Fixed value. This
helps mitigate interference
Location random degrees Random value in latitude and longitude within 0.5° × 0.5° box.
Orientation random degrees Antenna orientation changes every sample
Building/environment loss 0 to 20 dB Note 1 Random value between 0 and 20 dB
Propagation loss calculated dB ITU-R P.452 No terrain data Number of macro systems 1 Assumed Only one macro base
station is used in the calculations for each sample point
NOTE 1 – Agreed study parameters.
TABLE B2.4
Propagation model parameters used for dynamic simulation
Propagation Parameter Value Used
Model used with terrain data of 0 m height ITU-R P.452
Effective earth radius (km) 8 549.12
Delta N (N-units/km) 40
% of time p, for which particular values of basic transmission loss are not exceeded.
0.001%
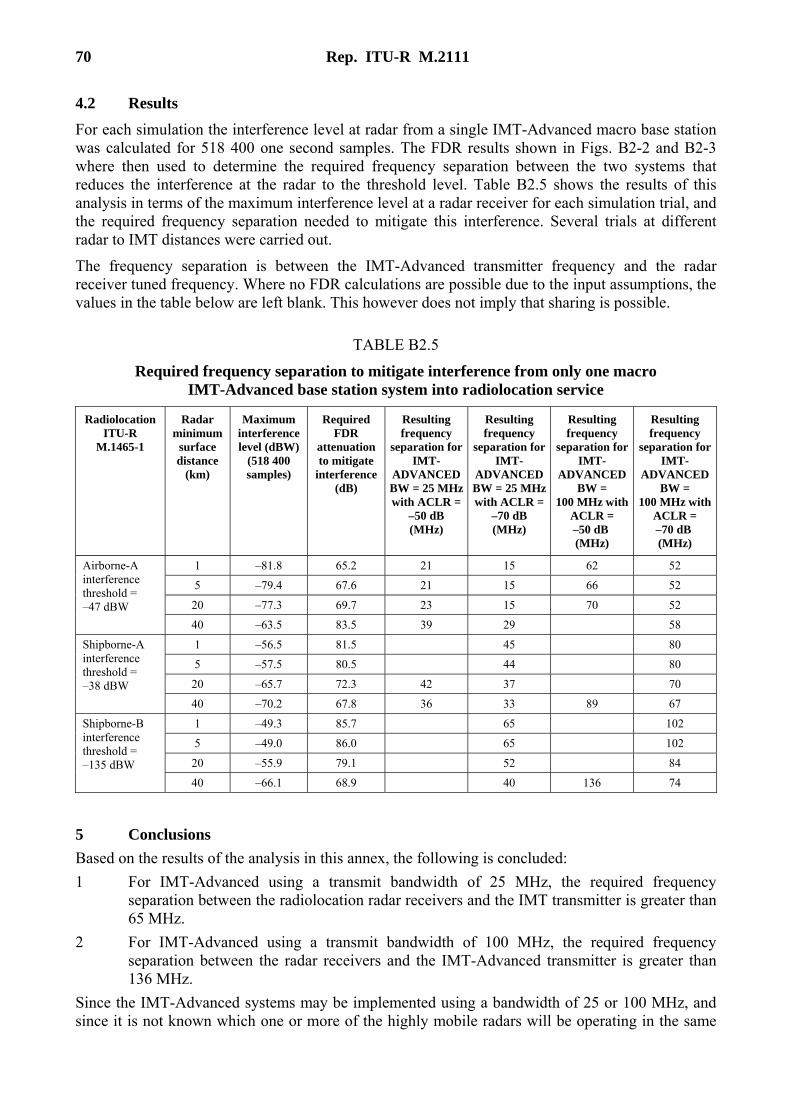
70 Rep. ITU-R M.2111
4.2 Results For each simulation the interference level at radar from a single IMT-Advanced macro base station was calculated for 518 400 one second samples. The FDR results shown in Figs. B2-2 and B2-3 where then used to determine the required frequency separation between the two systems that reduces the interference at the radar to the threshold level. Table B2.5 shows the results of this analysis in terms of the maximum interference level at a radar receiver for each simulation trial, and the required frequency separation needed to mitigate this interference. Several trials at different radar to IMT distances were carried out.
The frequency separation is between the IMT-Advanced transmitter frequency and the radar receiver tuned frequency. Where no FDR calculations are possible due to the input assumptions, the values in the table below are left blank. This however does not imply that sharing is possible.
TABLE B2.5
Required frequency separation to mitigate interference from only one macro IMT-Advanced base station system into radiolocation service
Radiolocation ITU-R
M.1465-1
Radar minimum
surface distance
(km)
Maximum interference level (dBW)
(518 400 samples)
Required FDR
attenuation to mitigate
interference (dB)
Resulting frequency
separation for IMT-
ADVANCED BW = 25 MHz with ACLR =
–50 dB (MHz)
Resulting frequency
separation for IMT-
ADVANCED BW = 25 MHz with ACLR =
–70 dB (MHz)
Resulting frequency
separation for IMT-
ADVANCED BW =
100 MHz with ACLR =–50 dB (MHz)
Resulting frequency
separation for IMT-
ADVANCED BW =
100 MHz with ACLR = –70 dB (MHz)
1 –81.8 65.2 21 15 62 52
5 –79.4 67.6 21 15 66 52
20 –77.3 69.7 23 15 70 52
Airborne-A interference threshold = –47 dBW
40 –63.5 83.5 39 29 58
1 –56.5 81.5 45 80
5 –57.5 80.5 44 80
20 –65.7 72.3 42 37 70
Shipborne-A interference threshold = –38 dBW
40 –70.2 67.8 36 33 89 67
1 –49.3 85.7 65 102
5 –49.0 86.0 65 102
20 –55.9 79.1 52 84
Shipborne-B interference threshold = –135 dBW
40 –66.1 68.9 40 136 74
5 Conclusions Based on the results of the analysis in this annex, the following is concluded: 1 For IMT-Advanced using a transmit bandwidth of 25 MHz, the required frequency
separation between the radiolocation radar receivers and the IMT transmitter is greater than 65 MHz.
2 For IMT-Advanced using a transmit bandwidth of 100 MHz, the required frequency separation between the radar receivers and the IMT-Advanced transmitter is greater than 136 MHz.
Since the IMT-Advanced systems may be implemented using a bandwidth of 25 or 100 MHz, and since it is not known which one or more of the highly mobile radars will be operating in the same
Rep. ITU-R M.2111 71
geographic area, then it is recommended that the operating frequency separation between IMT-Advanced transmitter and a radar receiver be greater than 136 MHz for all IMT-Advanced transmit bandwidth configurations and all radiolocation systems authorized to operate in the 3 400-3 700 MHz band. It should be noted that the results contained in this study are very conservative since only one IMT-Advanced Macro base station is simulated at each sample interval. If an additional IMT-Advanced base station has the same interference level at the radar, the resulting interference level could be increased by up to 3 dB further increasing the required frequency separation.
Annex 3
Potential interference mitigation techniques
This Annex summarizes the potential interference mitigation techniques which may be applied both IMT-Advanced system and Radar system. It should be noted that some of the mitigation techniques applied to IMT-Advanced systems are implemented in order to reduce the self-interference in their own IMT-Advanced network, which will contribute to reduce the interference to radars.
Study A
1 General consideration This study summarizes in Tables A3.1 and A3.2 the potential mitigation techniques with technical comments which can be applied to IMT-Advanced system and radiolocation system, respectively. If densely populated areas where IMT-Advanced traffic and demand for frequency spectrum are high and these areas are not the target of the observation by these radars, then sharing by geographical separation may be possible.
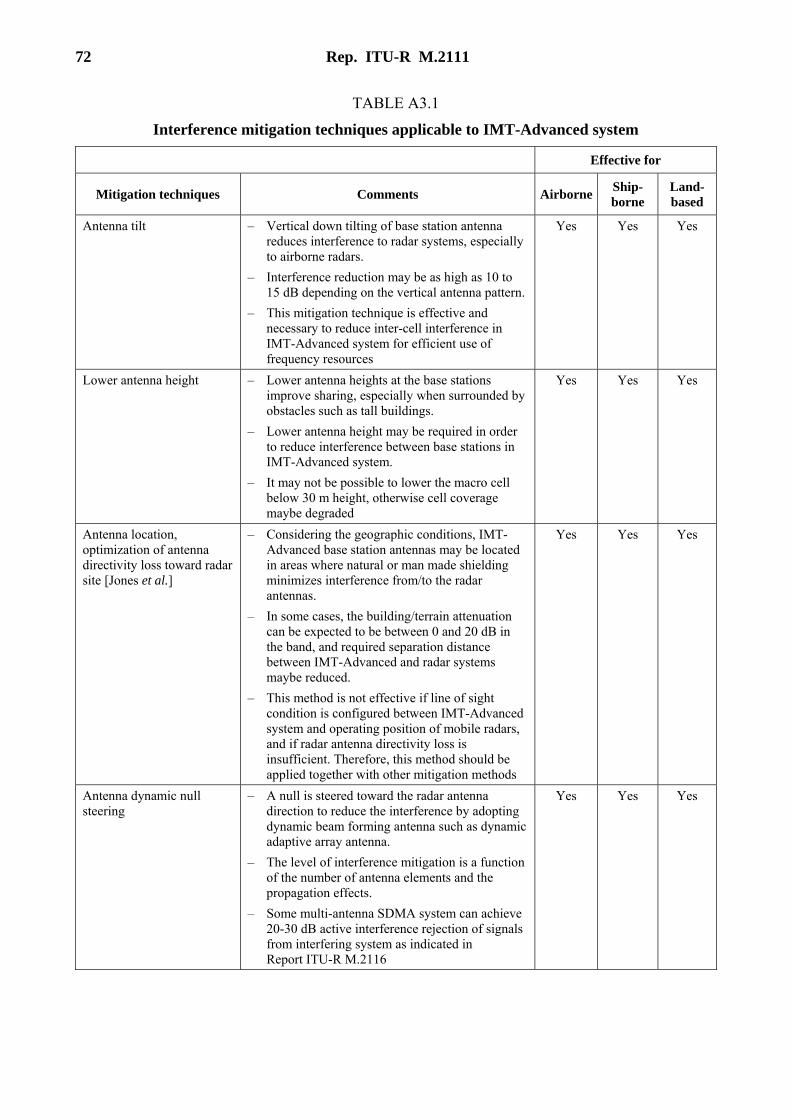
72 Rep. ITU-R M.2111
TABLE A3.1
Interference mitigation techniques applicable to IMT-Advanced system
Effective for
Mitigation techniques Comments Airborne Ship-borne
Land-based
Antenna tilt – Vertical down tilting of base station antenna reduces interference to radar systems, especially to airborne radars.
– Interference reduction may be as high as 10 to 15 dB depending on the vertical antenna pattern.
– This mitigation technique is effective and necessary to reduce inter-cell interference in IMT-Advanced system for efficient use of frequency resources
Yes Yes Yes
Lower antenna height – Lower antenna heights at the base stations improve sharing, especially when surrounded by obstacles such as tall buildings.
– Lower antenna height may be required in order to reduce interference between base stations in IMT-Advanced system.
– It may not be possible to lower the macro cell below 30 m height, otherwise cell coverage maybe degraded
Yes Yes Yes
Antenna location, optimization of antenna directivity loss toward radar site [Jones et al.]
– Considering the geographic conditions, IMT-Advanced base station antennas may be located in areas where natural or man made shielding minimizes interference from/to the radar antennas.
– In some cases, the building/terrain attenuation can be expected to be between 0 and 20 dB in the band, and required separation distance between IMT-Advanced and radar systems maybe reduced.
– This method is not effective if line of sight condition is configured between IMT-Advanced system and operating position of mobile radars, and if radar antenna directivity loss is insufficient. Therefore, this method should be applied together with other mitigation methods
Yes Yes Yes
Antenna dynamic null steering
– A null is steered toward the radar antenna direction to reduce the interference by adopting dynamic beam forming antenna such as dynamic adaptive array antenna.
– The level of interference mitigation is a function of the number of antenna elements and the propagation effects.
– Some multi-antenna SDMA system can achieve 20-30 dB active interference rejection of signals from interfering system as indicated in Report ITU-R M.2116
Yes Yes Yes
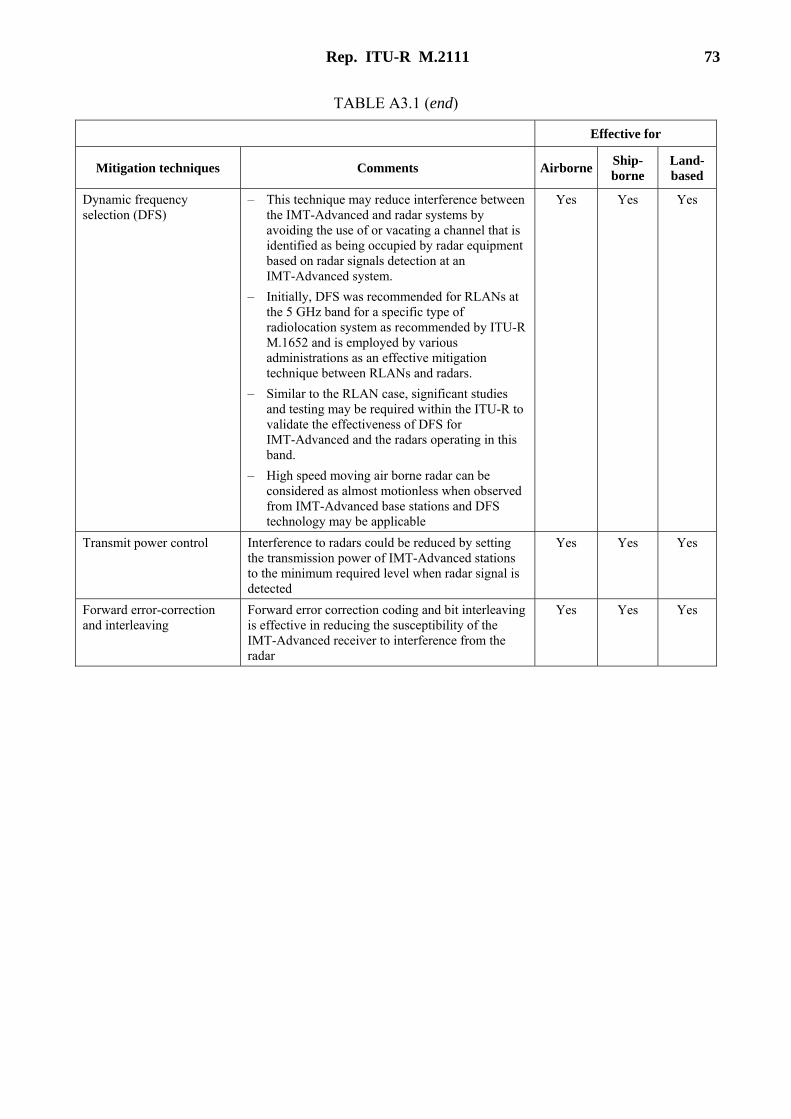
Rep. ITU-R M.2111 73
TABLE A3.1 (end)
Effective for
Mitigation techniques Comments Airborne Ship-borne
Land-based
Dynamic frequency selection (DFS)
– This technique may reduce interference between the IMT-Advanced and radar systems by avoiding the use of or vacating a channel that is identified as being occupied by radar equipment based on radar signals detection at an IMT-Advanced system.
– Initially, DFS was recommended for RLANs at the 5 GHz band for a specific type of radiolocation system as recommended by ITU-R M.1652 and is employed by various administrations as an effective mitigation technique between RLANs and radars.
– Similar to the RLAN case, significant studies and testing may be required within the ITU-R to validate the effectiveness of DFS for IMT-Advanced and the radars operating in this band.
– High speed moving air borne radar can be considered as almost motionless when observed from IMT-Advanced base stations and DFS technology may be applicable
Yes Yes Yes
Transmit power control Interference to radars could be reduced by setting the transmission power of IMT-Advanced stations to the minimum required level when radar signal is detected
Yes Yes Yes
Forward error-correction and interleaving
Forward error correction coding and bit interleaving is effective in reducing the susceptibility of the IMT-Advanced receiver to interference from the radar
Yes Yes Yes
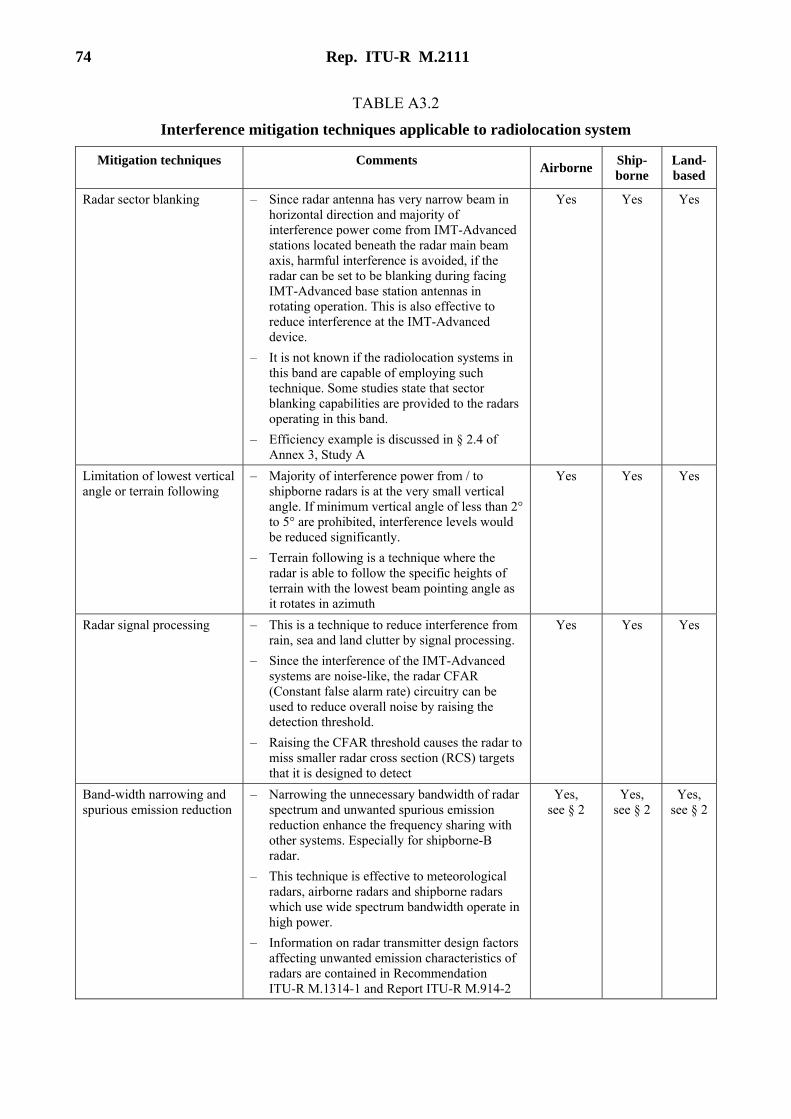
74 Rep. ITU-R M.2111
TABLE A3.2
Interference mitigation techniques applicable to radiolocation system
Mitigation techniques Comments Airborne Ship-borne
Land-based
Radar sector blanking – Since radar antenna has very narrow beam in horizontal direction and majority of interference power come from IMT-Advanced stations located beneath the radar main beam axis, harmful interference is avoided, if the radar can be set to be blanking during facing IMT-Advanced base station antennas in rotating operation. This is also effective to reduce interference at the IMT-Advanced device.
– It is not known if the radiolocation systems in this band are capable of employing such technique. Some studies state that sector blanking capabilities are provided to the radars operating in this band.
– Efficiency example is discussed in § 2.4 of Annex 3, Study A
Yes Yes Yes
Limitation of lowest vertical angle or terrain following
– Majority of interference power from / to shipborne radars is at the very small vertical angle. If minimum vertical angle of less than 2° to 5° are prohibited, interference levels would be reduced significantly.
– Terrain following is a technique where the radar is able to follow the specific heights of terrain with the lowest beam pointing angle as it rotates in azimuth
Yes Yes Yes
Radar signal processing – This is a technique to reduce interference from rain, sea and land clutter by signal processing.
– Since the interference of the IMT-Advanced systems are noise-like, the radar CFAR (Constant false alarm rate) circuitry can be used to reduce overall noise by raising the detection threshold.
– Raising the CFAR threshold causes the radar to miss smaller radar cross section (RCS) targets that it is designed to detect
Yes Yes Yes
Band-width narrowing and spurious emission reduction
– Narrowing the unnecessary bandwidth of radar spectrum and unwanted spurious emission reduction enhance the frequency sharing with other systems. Especially for shipborne-B radar.
– This technique is effective to meteorological radars, airborne radars and shipborne radars which use wide spectrum bandwidth operate in high power.
– Information on radar transmitter design factors affecting unwanted emission characteristics of radars are contained in Recommendation ITU-R M.1314-1 and Report ITU-R M.914-2
Yes, see § 2
Yes, see § 2
Yes, see § 2
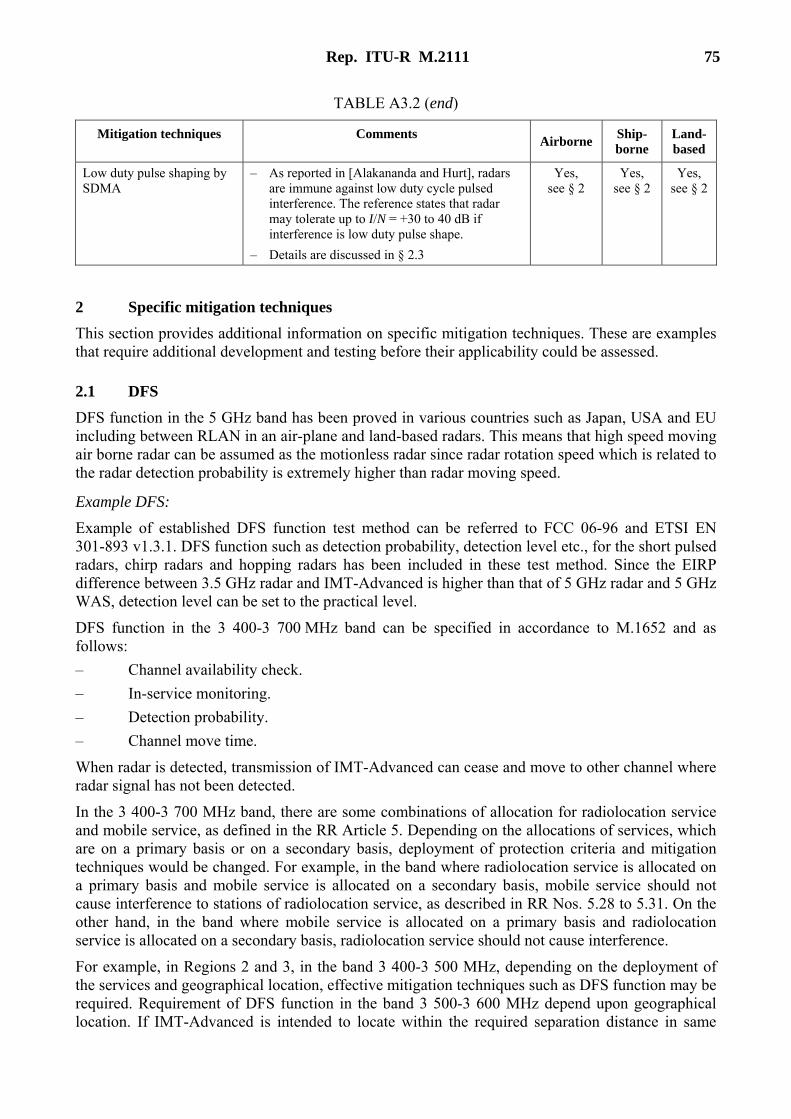
Rep. ITU-R M.2111 75
TABLE A3.2 (end)
Mitigation techniques Comments Airborne Ship-borne
Land-based
Low duty pulse shaping by SDMA
– As reported in [Alakananda and Hurt], radars are immune against low duty cycle pulsed interference. The reference states that radar may tolerate up to I/N = +30 to 40 dB if interference is low duty pulse shape.
– Details are discussed in § 2.3
Yes, see § 2
Yes, see § 2
Yes, see § 2
2 Specific mitigation techniques This section provides additional information on specific mitigation techniques. These are examples that require additional development and testing before their applicability could be assessed.
2.1 DFS DFS function in the 5 GHz band has been proved in various countries such as Japan, USA and EU including between RLAN in an air-plane and land-based radars. This means that high speed moving air borne radar can be assumed as the motionless radar since radar rotation speed which is related to the radar detection probability is extremely higher than radar moving speed.
Example DFS: Example of established DFS function test method can be referred to FCC 06-96 and ETSI EN 301-893 v1.3.1. DFS function such as detection probability, detection level etc., for the short pulsed radars, chirp radars and hopping radars has been included in these test method. Since the EIRP difference between 3.5 GHz radar and IMT-Advanced is higher than that of 5 GHz radar and 5 GHz WAS, detection level can be set to the practical level.
DFS function in the 3 400-3 700 MHz band can be specified in accordance to M.1652 and as follows: – Channel availability check. – In-service monitoring. – Detection probability. – Channel move time.
When radar is detected, transmission of IMT-Advanced can cease and move to other channel where radar signal has not been detected.
In the 3 400-3 700 MHz band, there are some combinations of allocation for radiolocation service and mobile service, as defined in the RR Article 5. Depending on the allocations of services, which are on a primary basis or on a secondary basis, deployment of protection criteria and mitigation techniques would be changed. For example, in the band where radiolocation service is allocated on a primary basis and mobile service is allocated on a secondary basis, mobile service should not cause interference to stations of radiolocation service, as described in RR Nos. 5.28 to 5.31. On the other hand, in the band where mobile service is allocated on a primary basis and radiolocation service is allocated on a secondary basis, radiolocation service should not cause interference.
For example, in Regions 2 and 3, in the band 3 400-3 500 MHz, depending on the deployment of the services and geographical location, effective mitigation techniques such as DFS function may be required. Requirement of DFS function in the band 3 500-3 600 MHz depend upon geographical location. If IMT-Advanced is intended to locate within the required separation distance in same
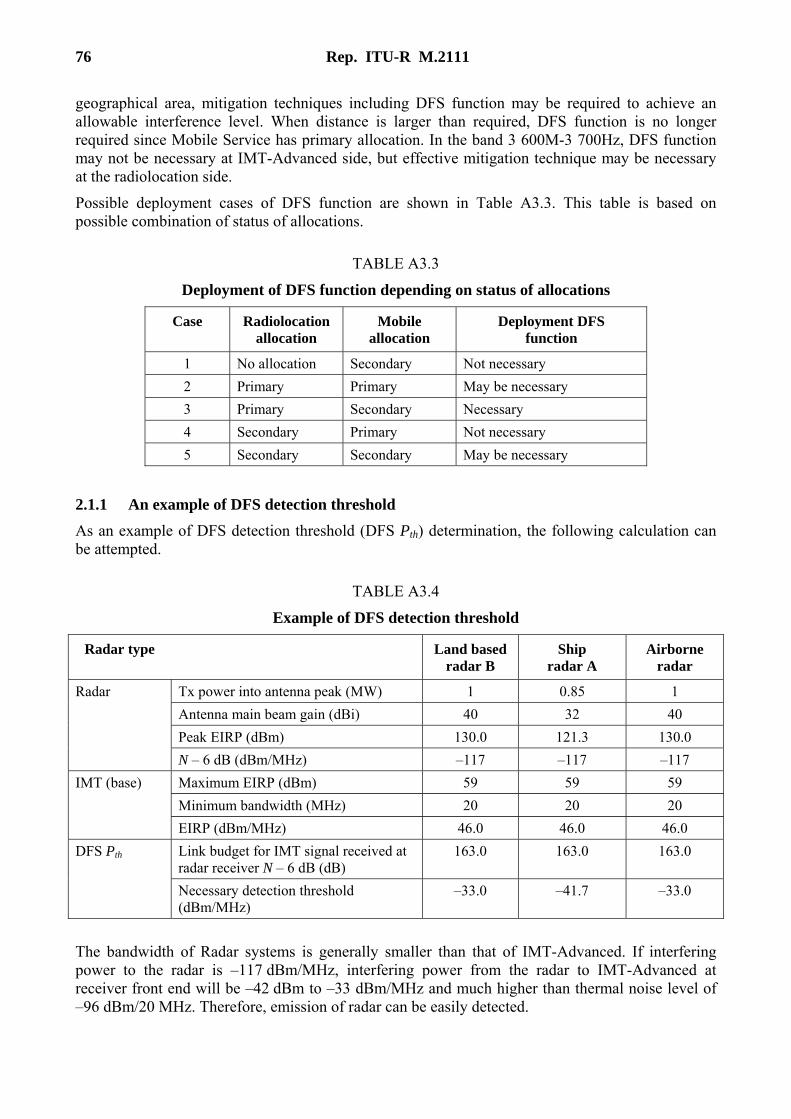
76 Rep. ITU-R M.2111
geographical area, mitigation techniques including DFS function may be required to achieve an allowable interference level. When distance is larger than required, DFS function is no longer required since Mobile Service has primary allocation. In the band 3 600M-3 700Hz, DFS function may not be necessary at IMT-Advanced side, but effective mitigation technique may be necessary at the radiolocation side.
Possible deployment cases of DFS function are shown in Table A3.3. This table is based on possible combination of status of allocations.
TABLE A3.3
Deployment of DFS function depending on status of allocations
Case Radiolocation allocation
Mobile allocation
Deployment DFS function
1 No allocation Secondary Not necessary 2 Primary Primary May be necessary 3 Primary Secondary Necessary 4 Secondary Primary Not necessary 5 Secondary Secondary May be necessary
2.1.1 An example of DFS detection threshold As an example of DFS detection threshold (DFS Pth) determination, the following calculation can be attempted.
TABLE A3.4
Example of DFS detection threshold
Radar type Land based radar B
Ship radar A
Airborne radar
Tx power into antenna peak (MW) 1 0.85 1 Antenna main beam gain (dBi) 40 32 40 Peak EIRP (dBm) 130.0 121.3 130.0
Radar
N – 6 dB (dBm/MHz) –117 –117 –117 Maximum EIRP (dBm) 59 59 59 Minimum bandwidth (MHz) 20 20 20
IMT (base)
EIRP (dBm/MHz) 46.0 46.0 46.0 Link budget for IMT signal received at radar receiver N – 6 dB (dB)
163.0 163.0 163.0 DFS Pth
Necessary detection threshold (dBm/MHz)
–33.0 –41.7 –33.0
The bandwidth of Radar systems is generally smaller than that of IMT-Advanced. If interfering power to the radar is –117 dBm/MHz, interfering power from the radar to IMT-Advanced at receiver front end will be –42 dBm to –33 dBm/MHz and much higher than thermal noise level of –96 dBm/20 MHz. Therefore, emission of radar can be easily detected.
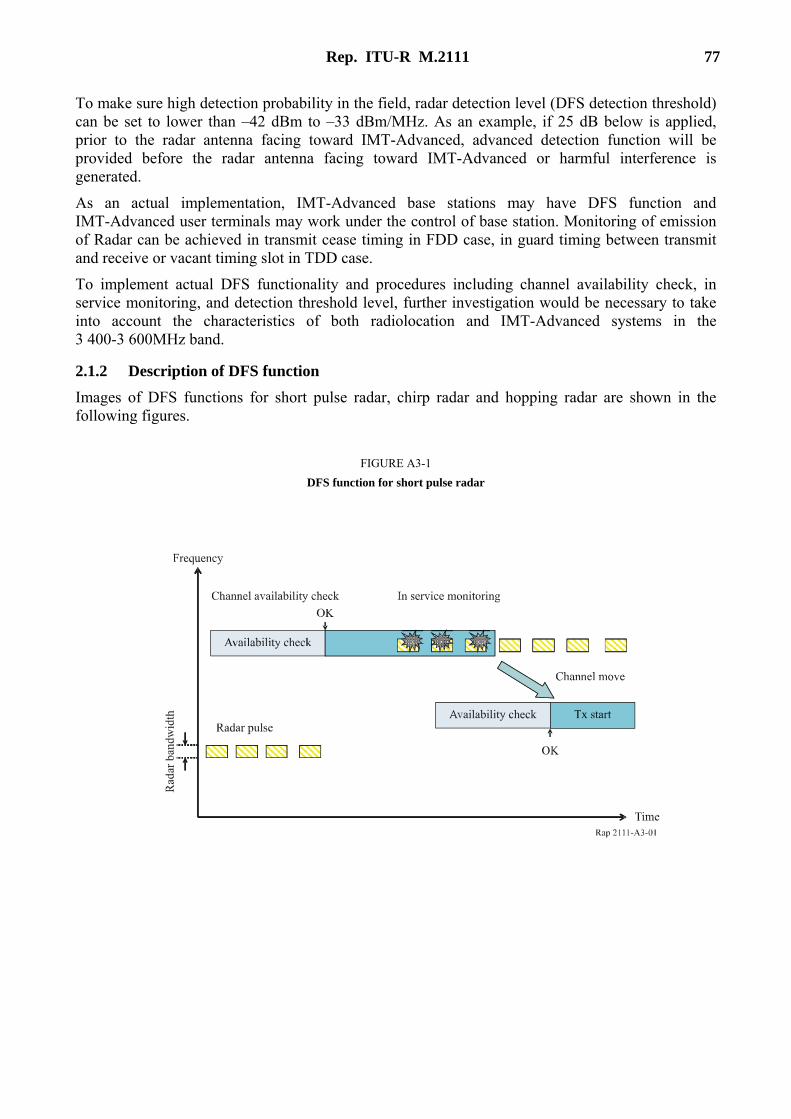
Rep. ITU-R M.2111 77
To make sure high detection probability in the field, radar detection level (DFS detection threshold) can be set to lower than –42 dBm to –33 dBm/MHz. As an example, if 25 dB below is applied, prior to the radar antenna facing toward IMT-Advanced, advanced detection function will be provided before the radar antenna facing toward IMT-Advanced or harmful interference is generated.
As an actual implementation, IMT-Advanced base stations may have DFS function and IMT-Advanced user terminals may work under the control of base station. Monitoring of emission of Radar can be achieved in transmit cease timing in FDD case, in guard timing between transmit and receive or vacant timing slot in TDD case.
To implement actual DFS functionality and procedures including channel availability check, in service monitoring, and detection threshold level, further investigation would be necessary to take into account the characteristics of both radiolocation and IMT-Advanced systems in the 3 400-3 600MHz band.
2.1.2 Description of DFS function Images of DFS functions for short pulse radar, chirp radar and hopping radar are shown in the following figures.
FIGURE A3-1 DFS function for short pulse radar
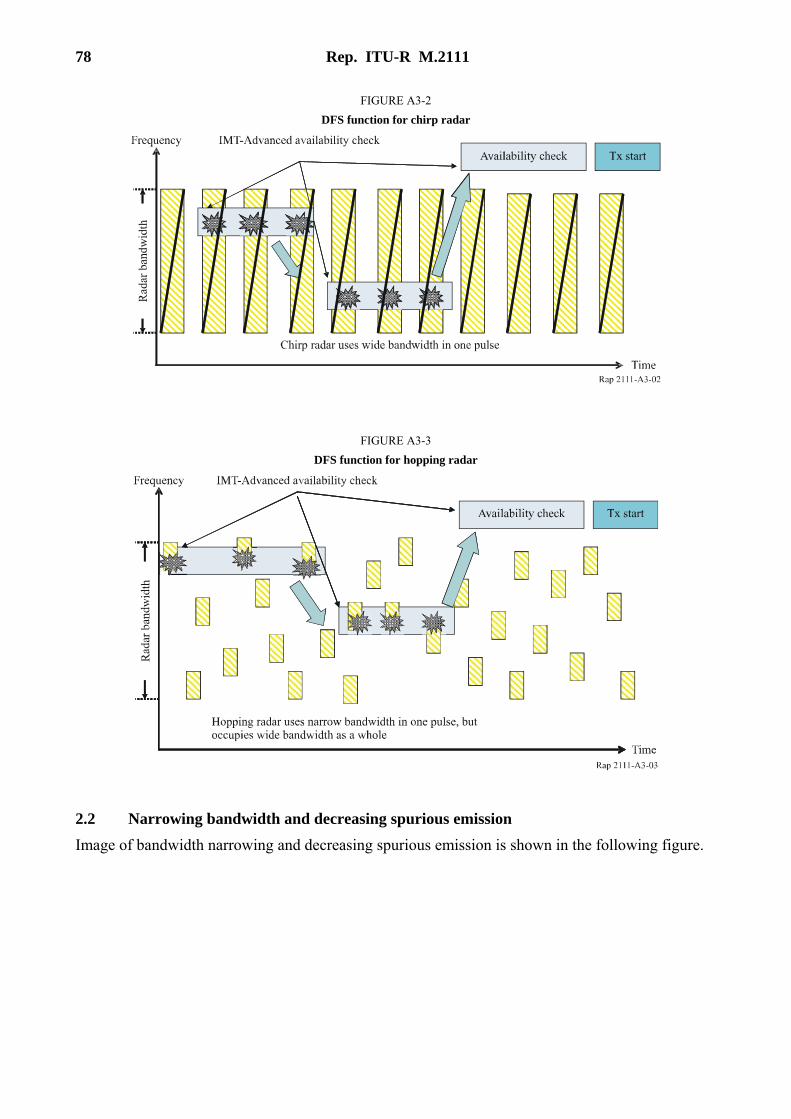
78 Rep. ITU-R M.2111
FIGURE A3-2 DFS function for chirp radar
FIGURE A3-3 DFS function for hopping radar
2.2 Narrowing bandwidth and decreasing spurious emission Image of bandwidth narrowing and decreasing spurious emission is shown in the following figure.
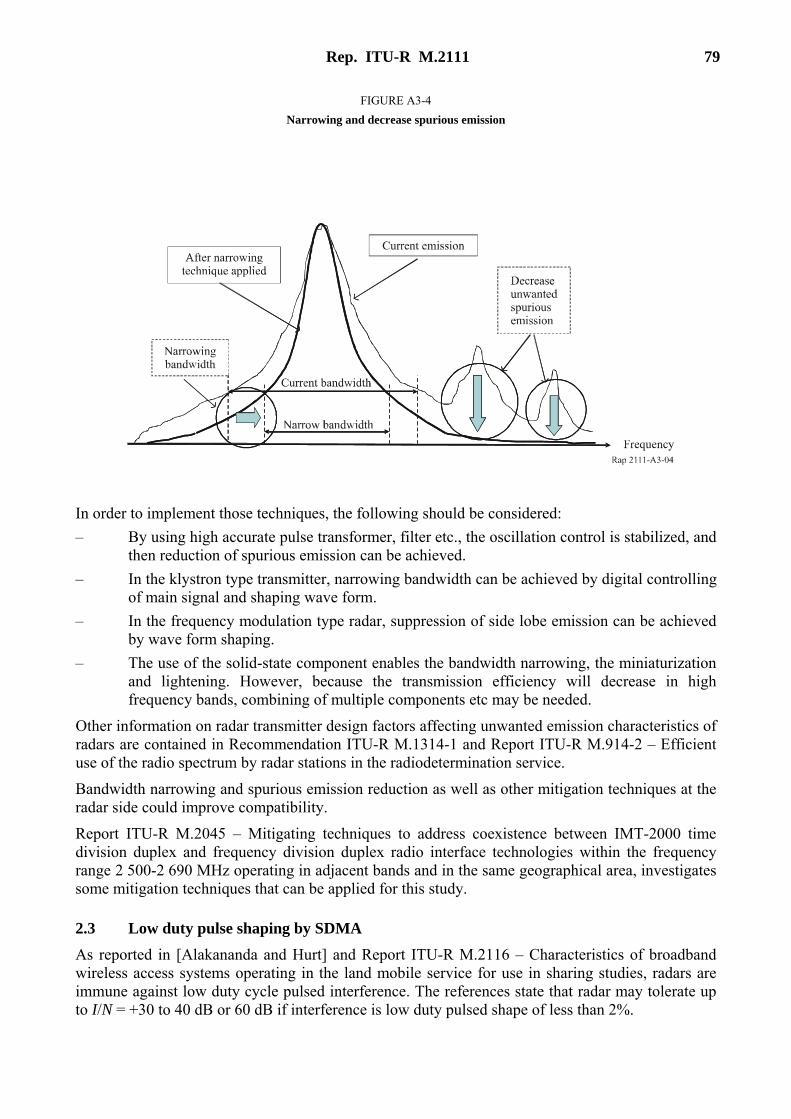
Rep. ITU-R M.2111 79
FIGURE A3-4 Narrowing and decrease spurious emission
In order to implement those techniques, the following should be considered: – By using high accurate pulse transformer, filter etc., the oscillation control is stabilized, and
then reduction of spurious emission can be achieved. – In the klystron type transmitter, narrowing bandwidth can be achieved by digital controlling
of main signal and shaping wave form. – In the frequency modulation type radar, suppression of side lobe emission can be achieved
by wave form shaping. – The use of the solid-state component enables the bandwidth narrowing, the miniaturization
and lightening. However, because the transmission efficiency will decrease in high frequency bands, combining of multiple components etc may be needed.
Other information on radar transmitter design factors affecting unwanted emission characteristics of radars are contained in Recommendation ITU-R M.1314-1 and Report ITU-R M.914-2 – Efficient use of the radio spectrum by radar stations in the radiodetermination service.
Bandwidth narrowing and spurious emission reduction as well as other mitigation techniques at the radar side could improve compatibility.
Report ITU-R M.2045 – Mitigating techniques to address coexistence between IMT-2000 time division duplex and frequency division duplex radio interface technologies within the frequency range 2 500-2 690 MHz operating in adjacent bands and in the same geographical area, investigates some mitigation techniques that can be applied for this study.
2.3 Low duty pulse shaping by SDMA
As reported in [Alakananda and Hurt] and Report ITU-R M.2116 – Characteristics of broadband wireless access systems operating in the land mobile service for use in sharing studies, radars are immune against low duty cycle pulsed interference. The references state that radar may tolerate up to I/N = +30 to 40 dB or 60 dB if interference is low duty pulsed shape of less than 2%.
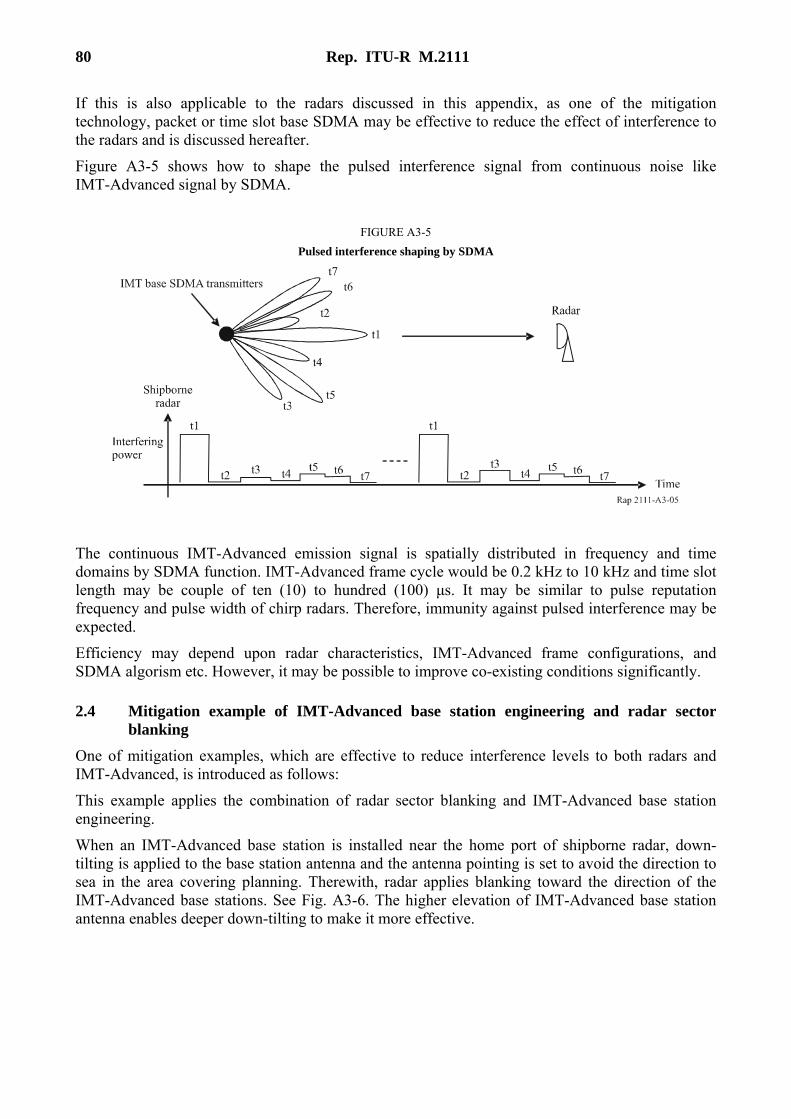
80 Rep. ITU-R M.2111
If this is also applicable to the radars discussed in this appendix, as one of the mitigation technology, packet or time slot base SDMA may be effective to reduce the effect of interference to the radars and is discussed hereafter.
Figure A3-5 shows how to shape the pulsed interference signal from continuous noise like IMT-Advanced signal by SDMA.
FIGURE A3-5 Pulsed interference shaping by SDMA
The continuous IMT-Advanced emission signal is spatially distributed in frequency and time domains by SDMA function. IMT-Advanced frame cycle would be 0.2 kHz to 10 kHz and time slot length may be couple of ten (10) to hundred (100) µs. It may be similar to pulse reputation frequency and pulse width of chirp radars. Therefore, immunity against pulsed interference may be expected.
Efficiency may depend upon radar characteristics, IMT-Advanced frame configurations, and SDMA algorism etc. However, it may be possible to improve co-existing conditions significantly.
2.4 Mitigation example of IMT-Advanced base station engineering and radar sector blanking
One of mitigation examples, which are effective to reduce interference levels to both radars and IMT-Advanced, is introduced as follows:
This example applies the combination of radar sector blanking and IMT-Advanced base station engineering.
When an IMT-Advanced base station is installed near the home port of shipborne radar, down-tilting is applied to the base station antenna and the antenna pointing is set to avoid the direction to sea in the area covering planning. Therewith, radar applies blanking toward the direction of the IMT-Advanced base stations. See Fig. A3-6. The higher elevation of IMT-Advanced base station antenna enables deeper down-tilting to make it more effective.
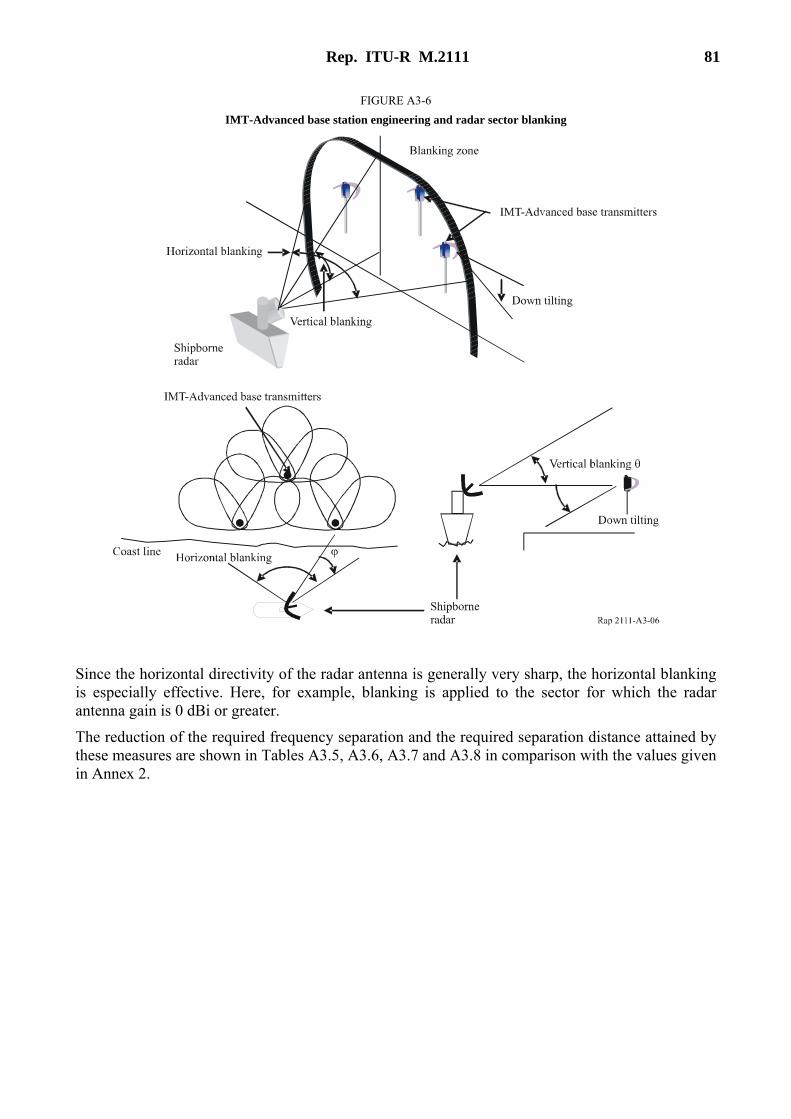
Rep. ITU-R M.2111 81
FIGURE A3-6 IMT-Advanced base station engineering and radar sector blanking
Since the horizontal directivity of the radar antenna is generally very sharp, the horizontal blanking is especially effective. Here, for example, blanking is applied to the sector for which the radar antenna gain is 0 dBi or greater.
The reduction of the required frequency separation and the required separation distance attained by these measures are shown in Tables A3.5, A3.6, A3.7 and A3.8 in comparison with the values given in Annex 2.
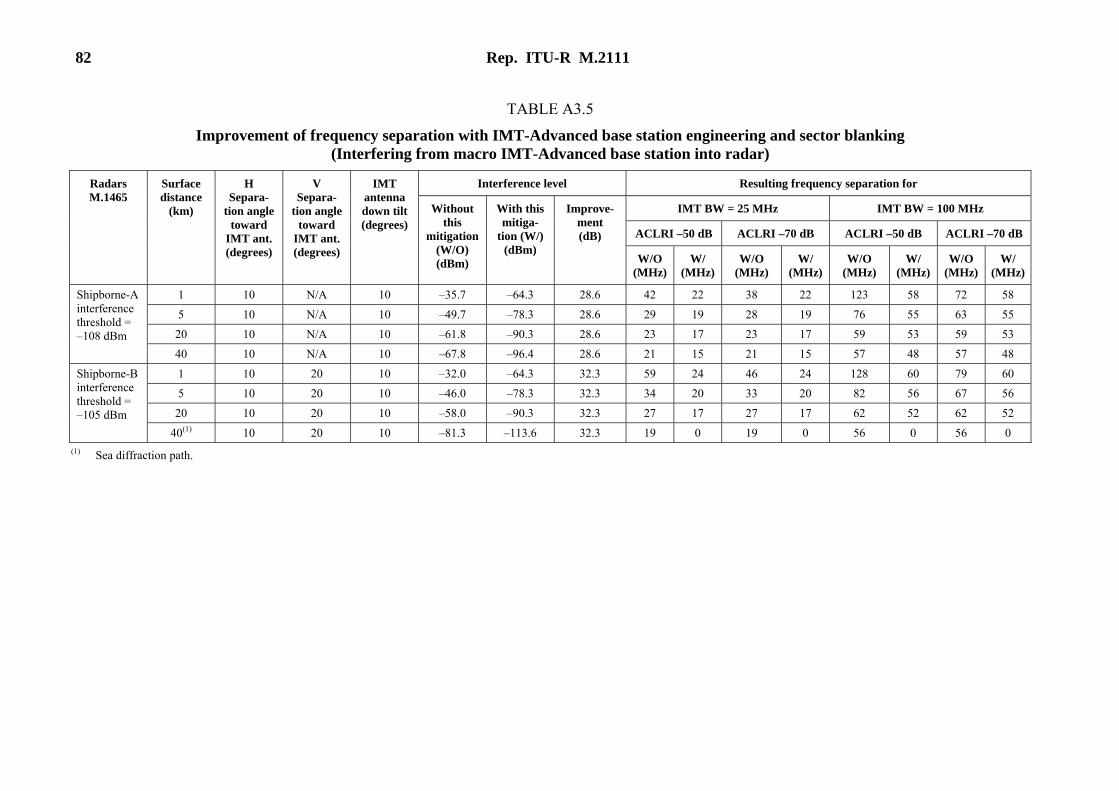
82 Rep. ITU-R M.2111
TABLE A3.5
Improvement of frequency separation with IMT-Advanced base station engineering and sector blanking (Interfering from macro IMT-Advanced base station into radar)
Interference level Resulting frequency separation for
IMT BW = 25 MHz IMT BW = 100 MHz
ACLRI –50 dB ACLRI –70 dB ACLRI –50 dB ACLRI –70 dB
Radars M.1465
Surface distance
(km)
H Separa-
tion angle toward
IMT ant. (degrees)
V Separa-
tion angle toward
IMT ant.(degrees)
IMT antenna down tilt(degrees)
Without this
mitigation (W/O) (dBm)
With this mitiga-
tion (W/)(dBm)
Improve-ment (dB)
W/O(MHz)
W/ (MHz)
W/O (MHz)
W/ (MHz)
W/O (MHz)
W/ (MHz)
W/O(MHz)
W/ (MHz)
1 10 N/A 10 –35.7 –64.3 28.6 42 22 38 22 123 58 72 58
5 10 N/A 10 –49.7 –78.3 28.6 29 19 28 19 76 55 63 55
20 10 N/A 10 –61.8 –90.3 28.6 23 17 23 17 59 53 59 53
Shipborne-A interference threshold = –108 dBm
40 10 N/A 10 –67.8 –96.4 28.6 21 15 21 15 57 48 57 48
1 10 20 10 –32.0 –64.3 32.3 59 24 46 24 128 60 79 60
5 10 20 10 –46.0 –78.3 32.3 34 20 33 20 82 56 67 56
20 10 20 10 –58.0 –90.3 32.3 27 17 27 17 62 52 62 52
Shipborne-B interference threshold = –105 dBm
40(1) 10 20 10 –81.3 –113.6 32.3 19 0 19 0 56 0 56 0 (1) Sea diffraction path.
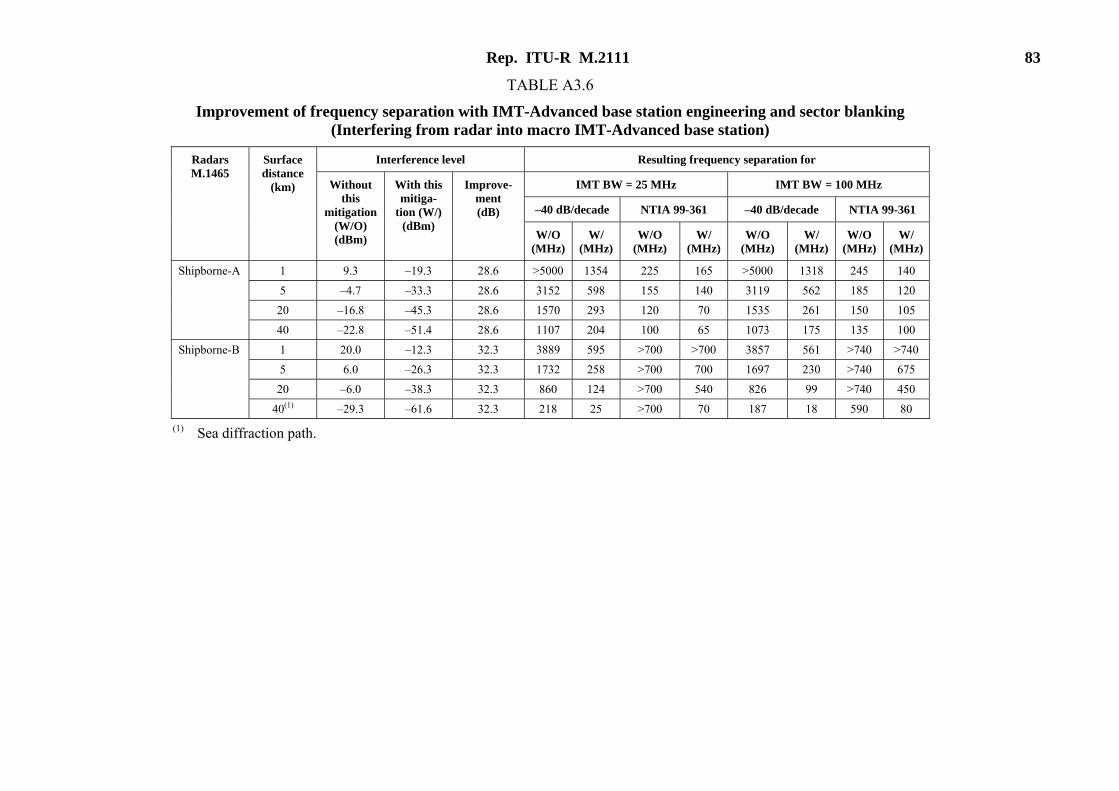
Rep. ITU-R M.2111 83
TABLE A3.6
Improvement of frequency separation with IMT-Advanced base station engineering and sector blanking (Interfering from radar into macro IMT-Advanced base station)
Interference level Resulting frequency separation for
IMT BW = 25 MHz IMT BW = 100 MHz
–40 dB/decade NTIA 99-361 –40 dB/decade NTIA 99-361
Radars M.1465
Surface distance
(km) Without this
mitigation (W/O) (dBm)
With this mitiga-
tion (W/)(dBm)
Improve-ment (dB)
W/O(MHz)
W/ (MHz)
W/O (MHz)
W/ (MHz)
W/O (MHz)
W/ (MHz)
W/O(MHz)
W/ (MHz)
1 9.3 –19.3 28.6 >5000 1354 225 165 >5000 1318 245 140
5 –4.7 –33.3 28.6 3152 598 155 140 3119 562 185 120
20 –16.8 –45.3 28.6 1570 293 120 70 1535 261 150 105
Shipborne-A
40 –22.8 –51.4 28.6 1107 204 100 65 1073 175 135 100
1 20.0 –12.3 32.3 3889 595 >700 >700 3857 561 >740 >740
5 6.0 –26.3 32.3 1732 258 >700 700 1697 230 >740 675
20 –6.0 –38.3 32.3 860 124 >700 540 826 99 >740 450
Shipborne-B
40(1) –29.3 –61.6 32.3 218 25 >700 70 187 18 590 80 (1) Sea diffraction path.
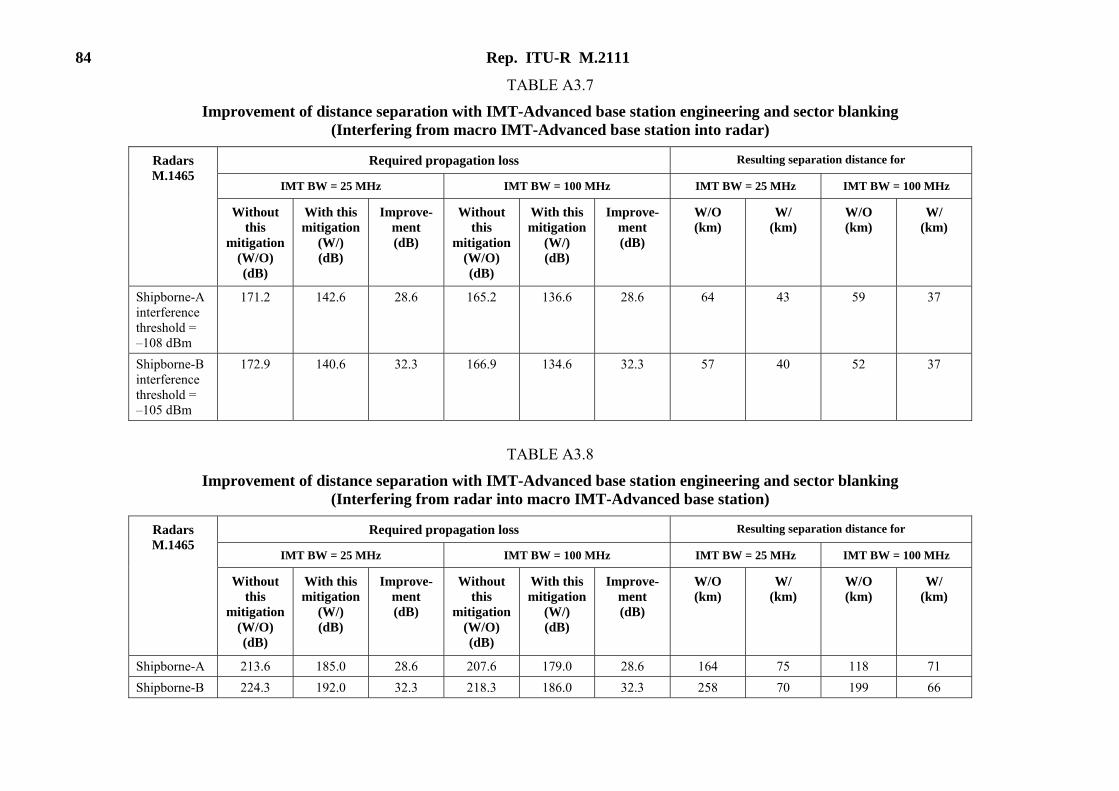
84 Rep. ITU-R M.2111
TABLE A3.7
Improvement of distance separation with IMT-Advanced base station engineering and sector blanking (Interfering from macro IMT-Advanced base station into radar)
Required propagation loss Resulting separation distance for
IMT BW = 25 MHz IMT BW = 100 MHz IMT BW = 25 MHz IMT BW = 100 MHz
Radars M.1465
Without this
mitigation (W/O) (dB)
With this mitigation
(W/) (dB)
Improve-ment (dB)
Without this
mitigation (W/O) (dB)
With this mitigation
(W/) (dB)
Improve-ment (dB)
W/O (km)
W/ (km)
W/O (km)
W/ (km)
Shipborne-A interference threshold = –108 dBm
171.2 142.6 28.6 165.2 136.6 28.6 64 43 59 37
Shipborne-B interference threshold = –105 dBm
172.9 140.6 32.3 166.9 134.6 32.3 57 40 52 37
TABLE A3.8
Improvement of distance separation with IMT-Advanced base station engineering and sector blanking (Interfering from radar into macro IMT-Advanced base station)
Required propagation loss Resulting separation distance for
IMT BW = 25 MHz IMT BW = 100 MHz IMT BW = 25 MHz IMT BW = 100 MHz
Radars M.1465
Without this
mitigation (W/O) (dB)
With this mitigation
(W/) (dB)
Improve-ment (dB)
Without this
mitigation (W/O) (dB)
With this mitigation
(W/) (dB)
Improve-ment (dB)
W/O (km)
W/ (km)
W/O (km)
W/ (km)
Shipborne-A 213.6 185.0 28.6 207.6 179.0 28.6 164 75 118 71 Shipborne-B 224.3 192.0 32.3 218.3 186.0 32.3 258 70 199 66
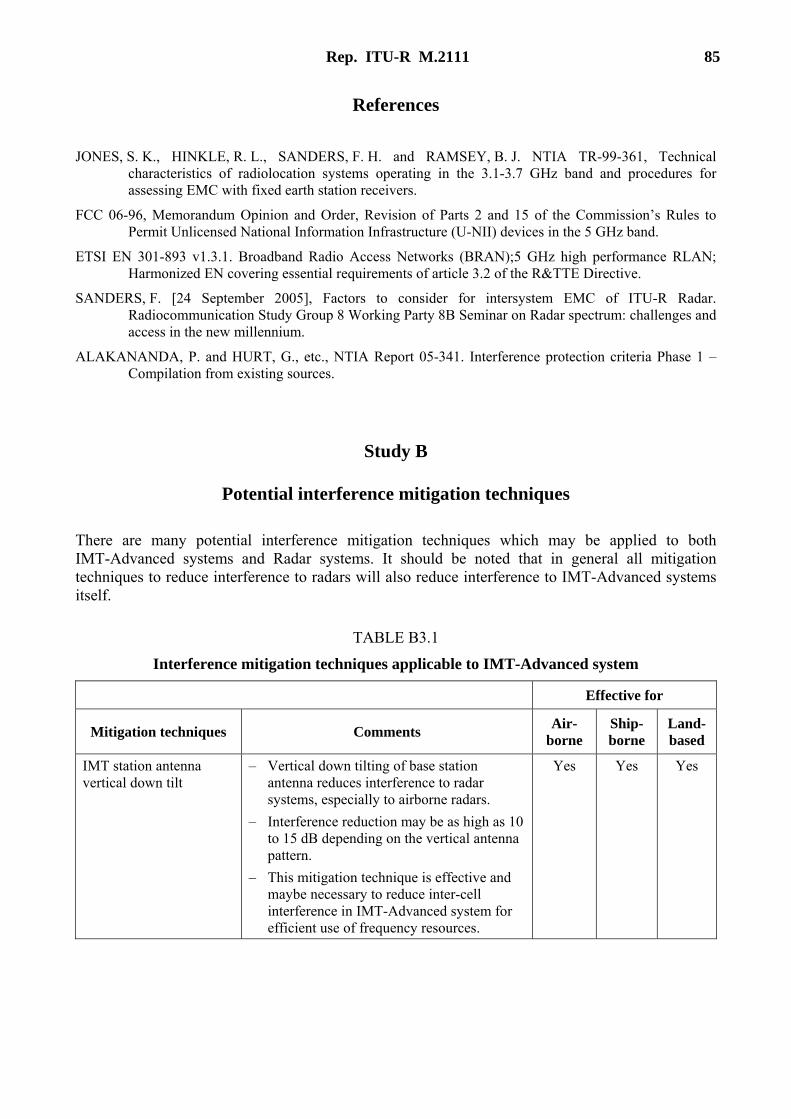
Rep. ITU-R M.2111 85
References
JONES, S. K., HINKLE, R. L., SANDERS, F. H. and RAMSEY, B. J. NTIA TR-99-361, Technical characteristics of radiolocation systems operating in the 3.1-3.7 GHz band and procedures for assessing EMC with fixed earth station receivers.
FCC 06-96, Memorandum Opinion and Order, Revision of Parts 2 and 15 of the Commission’s Rules to Permit Unlicensed National Information Infrastructure (U-NII) devices in the 5 GHz band.
ETSI EN 301-893 v1.3.1. Broadband Radio Access Networks (BRAN);5 GHz high performance RLAN; Harmonized EN covering essential requirements of article 3.2 of the R&TTE Directive.
SANDERS, F. [24 September 2005], Factors to consider for intersystem EMC of ITU-R Radar. Radiocommunication Study Group 8 Working Party 8B Seminar on Radar spectrum: challenges and access in the new millennium.
ALAKANANDA, P. and HURT, G., etc., NTIA Report 05-341. Interference protection criteria Phase 1 – Compilation from existing sources.
Study B
Potential interference mitigation techniques
There are many potential interference mitigation techniques which may be applied to both IMT-Advanced systems and Radar systems. It should be noted that in general all mitigation techniques to reduce interference to radars will also reduce interference to IMT-Advanced systems itself.
TABLE B3.1
Interference mitigation techniques applicable to IMT-Advanced system
Effective for
Mitigation techniques Comments Air-borne
Ship-borne
Land-based
IMT station antenna vertical down tilt
– Vertical down tilting of base station antenna reduces interference to radar systems, especially to airborne radars.
– Interference reduction may be as high as 10 to 15 dB depending on the vertical antenna pattern.
– This mitigation technique is effective and maybe necessary to reduce inter-cell interference in IMT-Advanced system for efficient use of frequency resources.
Yes Yes Yes
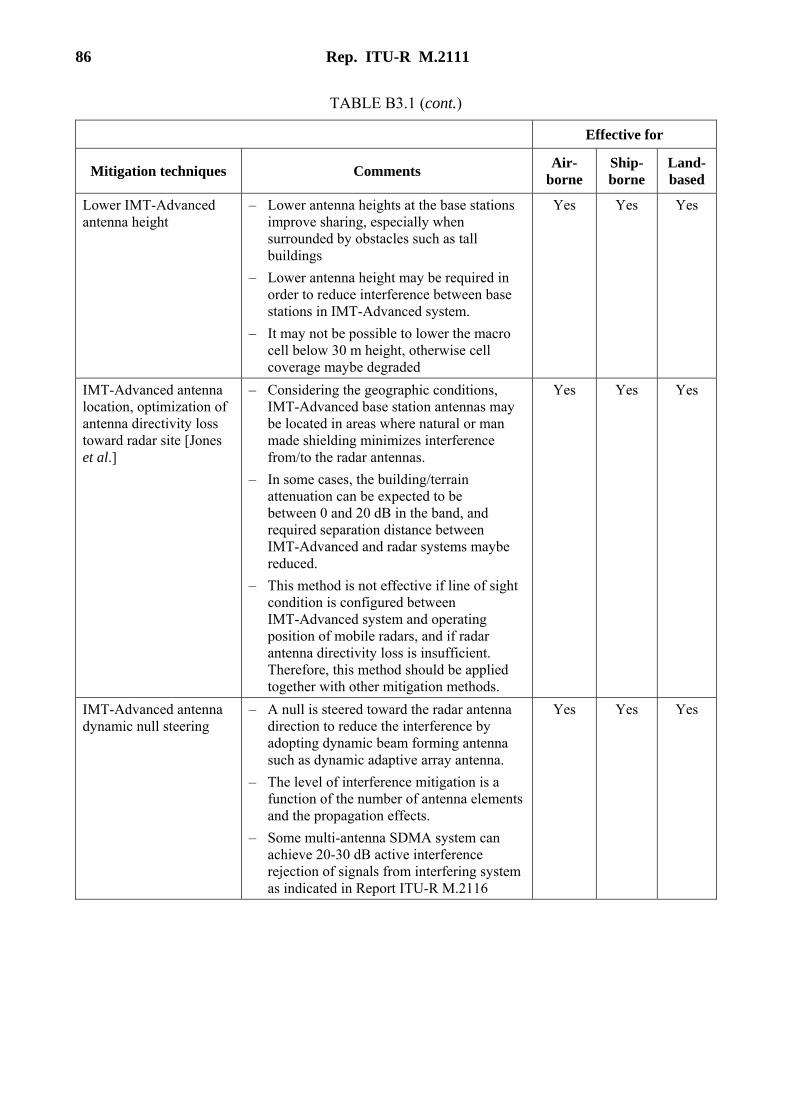
86 Rep. ITU-R M.2111
TABLE B3.1 (cont.)
Effective for
Mitigation techniques Comments Air-borne
Ship-borne
Land-based
Lower IMT-Advanced antenna height
– Lower antenna heights at the base stations improve sharing, especially when surrounded by obstacles such as tall buildings
– Lower antenna height may be required in order to reduce interference between base stations in IMT-Advanced system.
– It may not be possible to lower the macro cell below 30 m height, otherwise cell coverage maybe degraded
Yes Yes Yes
IMT-Advanced antenna location, optimization of antenna directivity loss toward radar site [Jones et al.]
– Considering the geographic conditions, IMT-Advanced base station antennas may be located in areas where natural or man made shielding minimizes interference from/to the radar antennas.
– In some cases, the building/terrain attenuation can be expected to be between 0 and 20 dB in the band, and required separation distance between IMT-Advanced and radar systems maybe reduced.
– This method is not effective if line of sight condition is configured between IMT-Advanced system and operating position of mobile radars, and if radar antenna directivity loss is insufficient. Therefore, this method should be applied together with other mitigation methods.
Yes Yes Yes
IMT-Advanced antenna dynamic null steering
– A null is steered toward the radar antenna direction to reduce the interference by adopting dynamic beam forming antenna such as dynamic adaptive array antenna.
– The level of interference mitigation is a function of the number of antenna elements and the propagation effects.
– Some multi-antenna SDMA system can achieve 20-30 dB active interference rejection of signals from interfering system as indicated in Report ITU-R M.2116
Yes Yes Yes
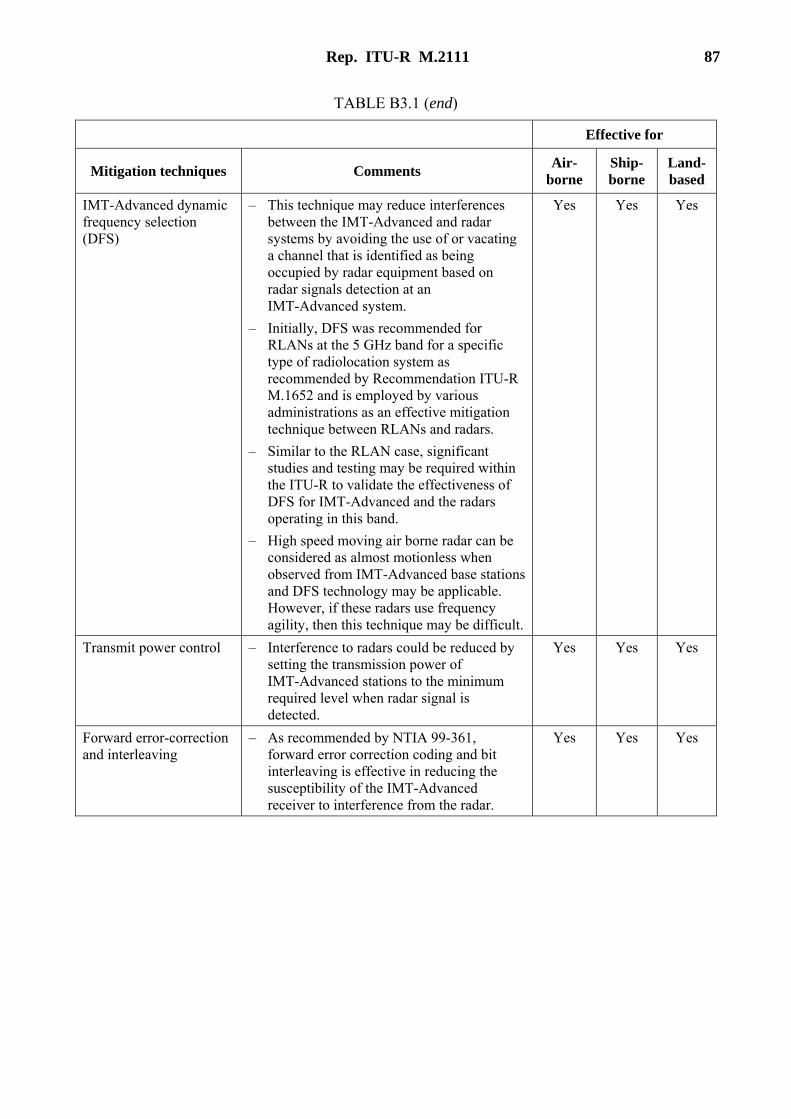
Rep. ITU-R M.2111 87
TABLE B3.1 (end)
Effective for
Mitigation techniques Comments Air-borne
Ship-borne
Land-based
IMT-Advanced dynamic frequency selection (DFS)
– This technique may reduce interferences between the IMT-Advanced and radar systems by avoiding the use of or vacating a channel that is identified as being occupied by radar equipment based on radar signals detection at an IMT-Advanced system.
– Initially, DFS was recommended for RLANs at the 5 GHz band for a specific type of radiolocation system as recommended by Recommendation ITU-R M.1652 and is employed by various administrations as an effective mitigation technique between RLANs and radars.
– Similar to the RLAN case, significant studies and testing may be required within the ITU-R to validate the effectiveness of DFS for IMT-Advanced and the radars operating in this band.
– High speed moving air borne radar can be considered as almost motionless when observed from IMT-Advanced base stations and DFS technology may be applicable. However, if these radars use frequency agility, then this technique may be difficult.
Yes Yes Yes
Transmit power control – Interference to radars could be reduced by setting the transmission power of IMT-Advanced stations to the minimum required level when radar signal is detected.
Yes Yes Yes
Forward error-correction and interleaving
– As recommended by NTIA 99-361, forward error correction coding and bit interleaving is effective in reducing the susceptibility of the IMT-Advanced receiver to interference from the radar.
Yes Yes Yes
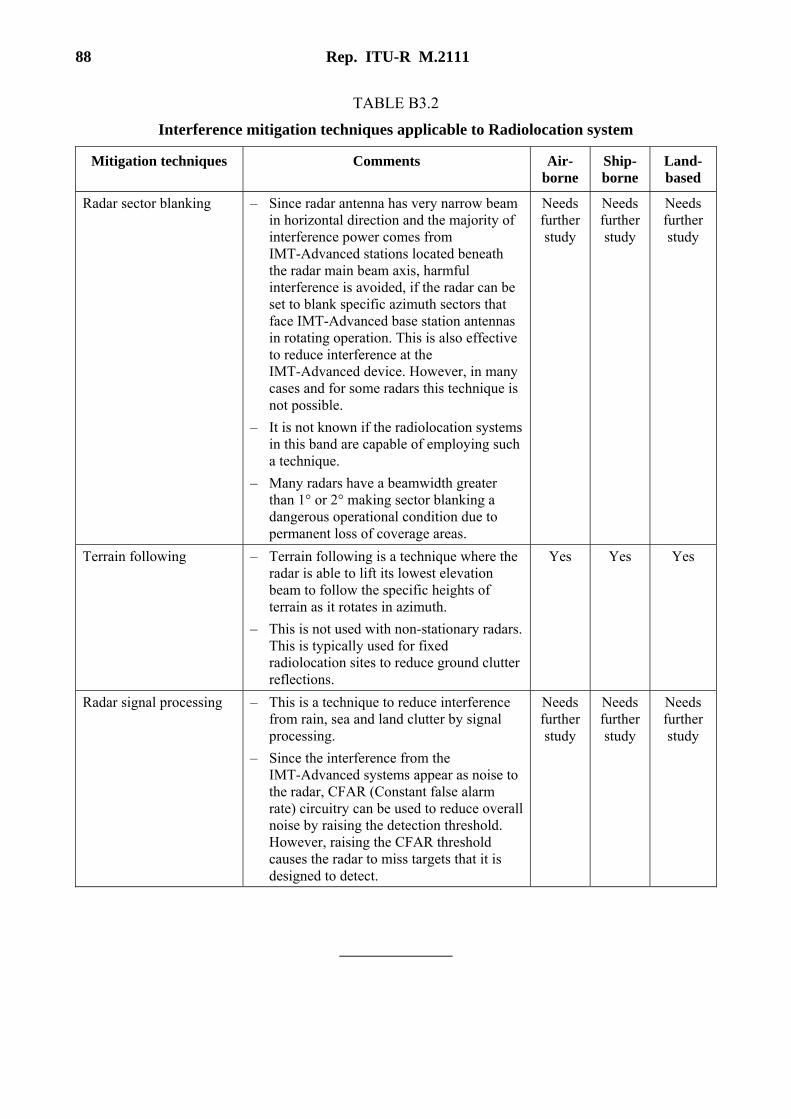
88 Rep. ITU-R M.2111
TABLE B3.2
Interference mitigation techniques applicable to Radiolocation system
Mitigation techniques Comments Air-borne
Ship-borne
Land-based
Radar sector blanking – Since radar antenna has very narrow beam in horizontal direction and the majority of interference power comes from IMT-Advanced stations located beneath the radar main beam axis, harmful interference is avoided, if the radar can be set to blank specific azimuth sectors that face IMT-Advanced base station antennas in rotating operation. This is also effective to reduce interference at the IMT-Advanced device. However, in many cases and for some radars this technique is not possible.
– It is not known if the radiolocation systems in this band are capable of employing such a technique.
– Many radars have a beamwidth greater than 1° or 2° making sector blanking a dangerous operational condition due to permanent loss of coverage areas.
Needs further study
Needs further study
Needs further study
Terrain following – Terrain following is a technique where the radar is able to lift its lowest elevation beam to follow the specific heights of terrain as it rotates in azimuth.
– This is not used with non-stationary radars. This is typically used for fixed radiolocation sites to reduce ground clutter reflections.
Yes Yes Yes
Radar signal processing – This is a technique to reduce interference from rain, sea and land clutter by signal processing.
– Since the interference from the IMT-Advanced systems appear as noise to the radar, CFAR (Constant false alarm rate) circuitry can be used to reduce overall noise by raising the detection threshold. However, raising the CFAR threshold causes the radar to miss targets that it is designed to detect.
Needs further study
Needs further study
Needs further study