Embed Size (px)
Citation preview
SHARING THE VISION™
Fair Value Under SFAS 157
Presented by:
Daniel Chavez, CPAAudit Manager
SHARING THE VISION™
Objectives
1. Understanding the logic and basics of SFAS 157• Background• Concepts• Disclosure requirements
2. Examples of application• Financial institutions• Financial statements
3. Regulatory requirements• Call report
SHARING THE VISION™
Reasons for Changes in the Focus of Accounting Standards to Fair Value
• It’s a new world! Economic and regulatory environments have changed
• Convergence! FASB and IASB Projects• The FASB’s Conceptual Framework Project
SHARING THE VISION™
The Changing Economic Environment
• The Information Revolution– Escalation and availability of information – Impact on decision-making process
• Global competition• Wall Street Demands
– More transparency in reporting (a timely telling of the how and the why)
• Increasing Complexity of financial transactions
SHARING THE VISION™
The FASB and IASB Convergence Project
• “One single set of high quality, understandable and enforceable global accounting standards
• The Norwalk Agreement in 2002– Best efforts to make existing financial reporting standards fully
compatible
• Projects:– Identification of individual differences between IFRS and US GAAP
• Conceptual framework project to serve as a foundation– Fair value is on the agenda
SHARING THE VISION™
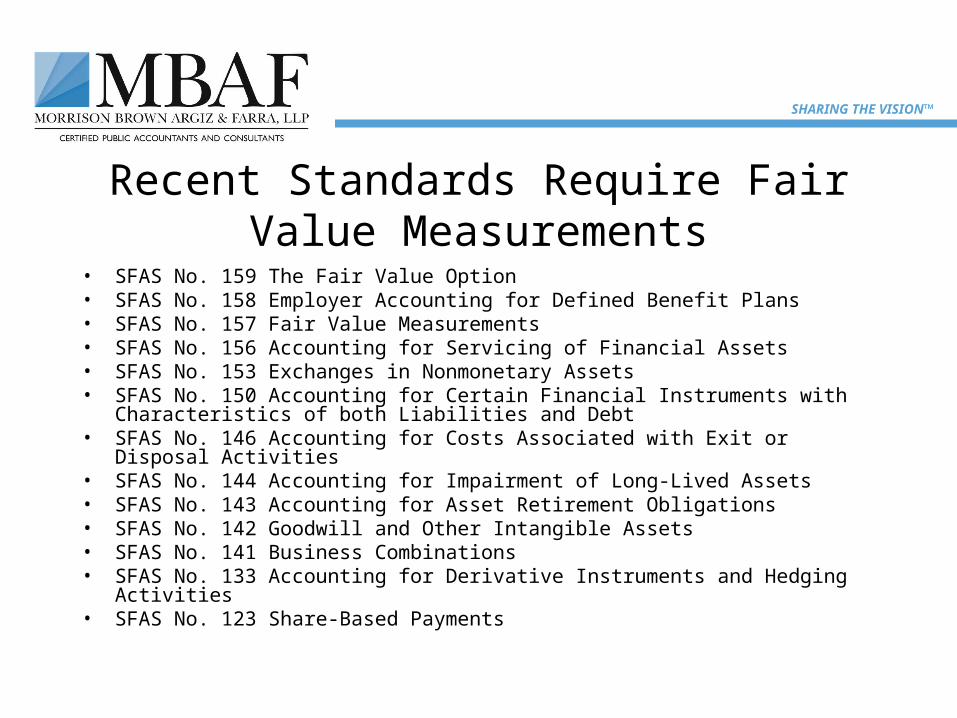
Recent Standards Require Fair Value Measurements
• SFAS No. 159 The Fair Value Option• SFAS No. 158 Employer Accounting for Defined Benefit Plans• SFAS No. 157 Fair Value Measurements• SFAS No. 156 Accounting for Servicing of Financial Assets• SFAS No. 153 Exchanges in Nonmonetary Assets• SFAS No. 150 Accounting for Certain Financial Instruments with Characteristics
of both Liabilities and Debt• SFAS No. 146 Accounting for Costs Associated with Exit or Disposal Activities• SFAS No. 144 Accounting for Impairment of Long-Lived Assets• SFAS No. 143 Accounting for Asset Retirement Obligations• SFAS No. 142 Goodwill and Other Intangible Assets• SFAS No. 141 Business Combinations• SFAS No. 133 Accounting for Derivative Instruments and Hedging Activities• SFAS No. 123 Share-Based Payments
SHARING THE VISION™
SFAS No. 157 Fair Value Measurements
What does it do?• Defines fair value for financial reporting purposes singular
definition• Establishes a framework/approach for measuring fair
value• Expands disclosures about the use of fair value – to allow
users to assess the relative reliability of FV measurements and the impact on earnings of Level 3 measurements
• Effective for financial statements issued for fiscal year beginning after November 15, 2007, with early adoption encouraged.
SHARING THE VISION™
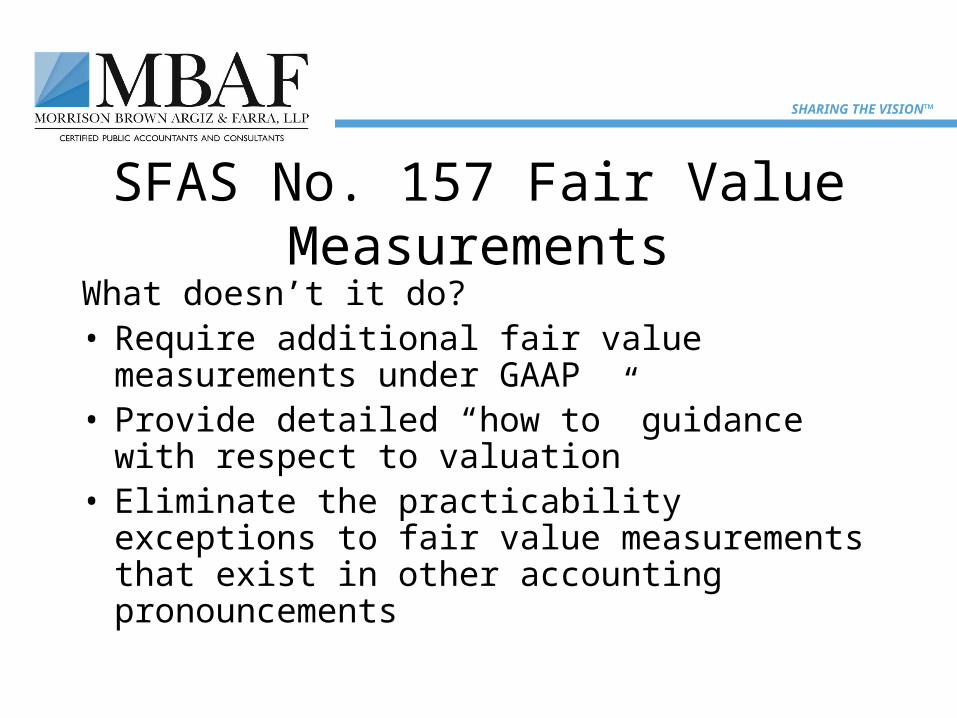
SFAS No. 157 Fair Value Measurements
What doesn’t it do?• Require additional fair value measurements
under GAAP• Provide detailed “how to” guidance with
respect to valuation• Eliminate the practicability exceptions to fair
value measurements that exist in other accounting pronouncements
SHARING THE VISION™
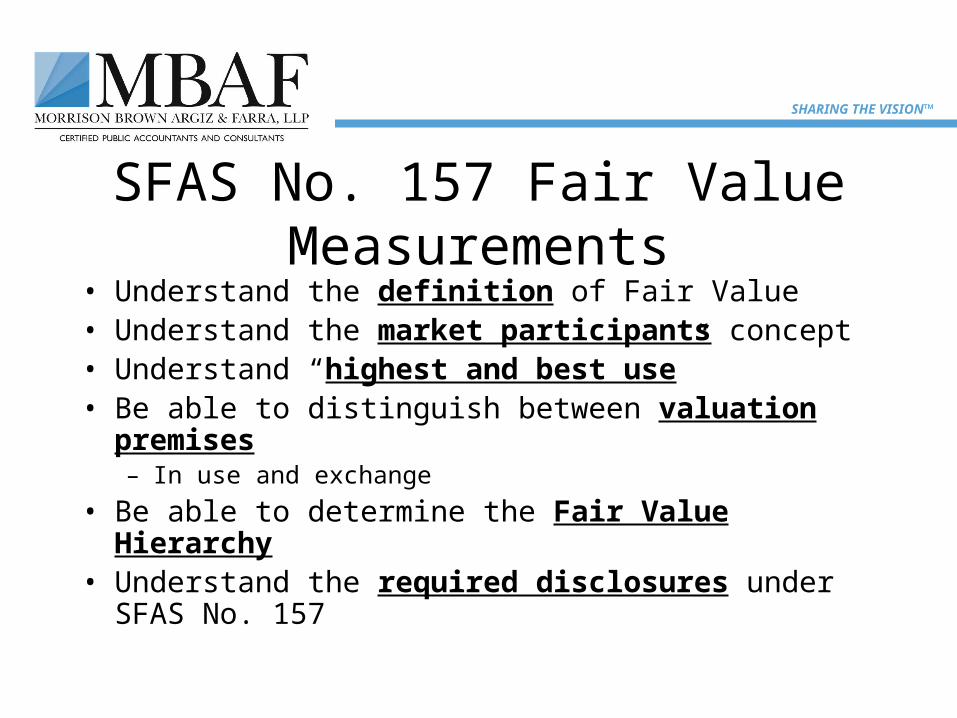
SFAS No. 157 Fair Value Measurements
• Understand the definition of Fair Value• Understand the market participants concept• Understand “highest and best use”• Be able to distinguish between valuation premises
– In use and exchange
• Be able to determine the Fair Value Hierarchy• Understand the required disclosures under SFAS
No. 157
SHARING THE VISION™
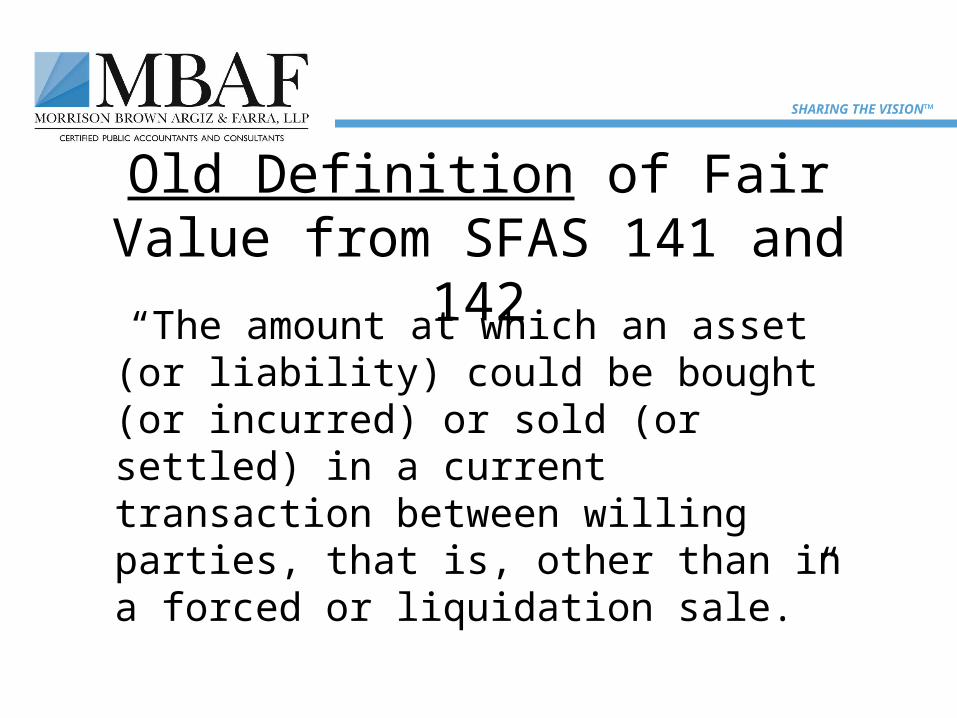
Old Definition of Fair Value from SFAS 141 and 142
“The amount at which an asset (or liability) could be bought (or incurred) or sold (or settled) in a current transaction between willing parties, that is, other than in a forced or liquidation sale.”
SHARING THE VISION™
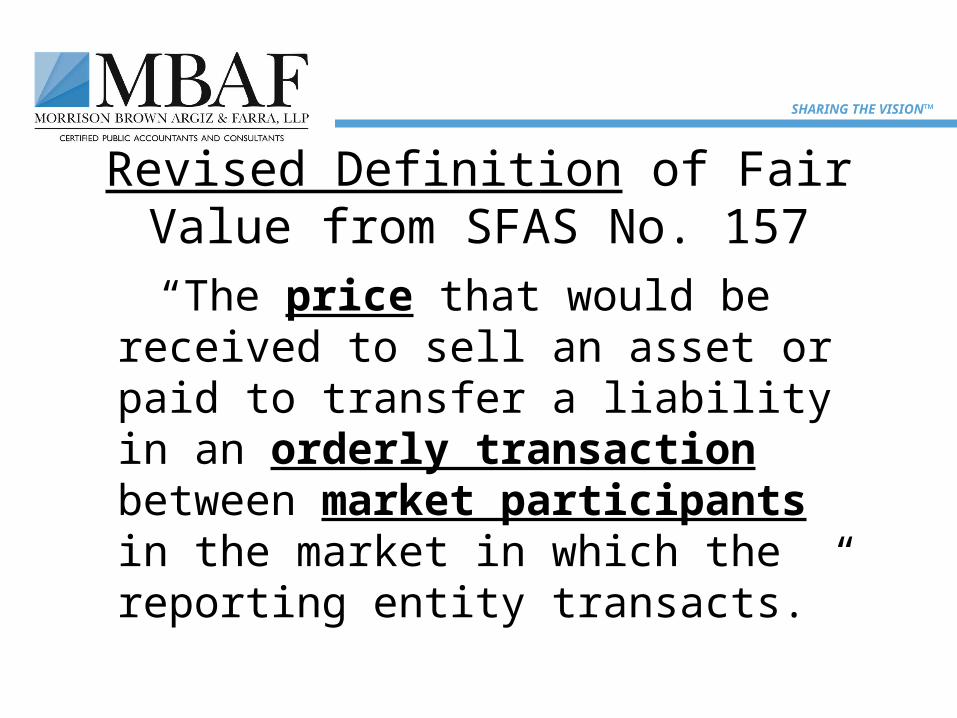
Revised Definition of Fair Value from SFAS No. 157
“The price that would be received to sell an asset or paid to transfer a liability in an orderly transaction between market participants in the market in which the reporting entity transacts.”
SHARING THE VISION™
Elements of the Definition of Fair Value
• Price
• Principal Market
• Market Participants
SHARING THE VISION™
The Price• The objective of the fair value measurement
is to determine the price that would be received to sell the asset (or paid to transfer the liability) at the measurement date
• Price in a hypothetical transaction to sell an asset or transfer a liability (exit price)
• Not the price in actual transaction to acquire an asset or assume a liability (an entry price)
SHARING THE VISION™
Define the Principal Market• The Principal Market – The market in which
the reporting entity would sell the asset or transfer the liability with the greatest volume and level of activity for the asset or liability.
• If no principal market exists, then choose– The most advantageous market is the market in
which the price obtained maximizes the amount received (not the price).
SHARING THE VISION™
Observation:
If a principal market exists, fair value is the price in that market, even if the price in a different market is potentially more advantageous.
SHARING THE VISION™
Multiple Markets for the same asset? Which is principal?
• An entity-specific determination (entity specific volume)? – the market where the entity has sold with the greatest frequency and volume, or
• A market-based determination? – the available market with the greatest frequency and volume
SHARING THE VISION™
Why not use the Most Advantageous Market all the time?
• The higher level of transactions in the principal market provides more reliable pricing (relevance and reliability)
• Focus on the principal market avoids a required continual assessment of process across all possible markets to find the highest
• Generally, principal and most advantageous markets
SHARING THE VISION™
Who Are the Market Participants?• Market Participants are the buyers and
sellers in the principal market that are:– Independent of the reporting entity– Knowledgeable of the asset or liability and the
transaction (including the results of usual diligence)
– Able to transact for the asset or liability (qualified)– Willing and motivated to transact for the asset or
liability (but not forced or otherwise compelled
SHARING THE VISION™
Who Are the Market Participants?• May be other entities in the same industry
and may not• Example:
– A manufacturing company holds land whose highest and best use is for residential development. A residential real estate developer may be a market participant.
• Specific individual market participants do not have to be identified.
SHARING THE VISION™
Who Are the Market Participants?• Reporting entity need not identify specific market
participants; instead, indentify characteristics that distinguish market participants generally, considering factors specific to:– The asset or liability– The principal or most advantageous market– Market participants with whom the reporting entity would
transact in that market
• Fair Value is determined based on the assumptions that market participants would use in pricing an asset or liability
SHARING THE VISION™
Definition – Highest and Best Use
Definition – The use of an asset by market participants that would maximize the value of the asset (or the group of assets within which the specific asset would be used).
SHARING THE VISION™
Highest and Best Use Criteria
• The use must be:– Physically possible– Legally permissible– Financially feasible
• Highest and best use is that of the market participants, even if that use differs from that of the Company
SHARING THE VISION™
Valuation Premise UsedHighest and best use establishes the valuation premise for the asset
• In-use – the asset would provide maximum value to the market participants principally through its use in combination with other assets as a group
• In-Exchange – the asset would provide maximum value to the market participants principally on a stand alone basis (example: a financial asset)
• Fair value measurements consider the assumptions that the market participants would use in pricing the asset, whether using an in-use or an in-exchange premise of value
SHARING THE VISION™
Three Approaches to Measuring Fair Value
• Market Approach
• Income Approach
• Cost Approach
SHARING THE VISION™
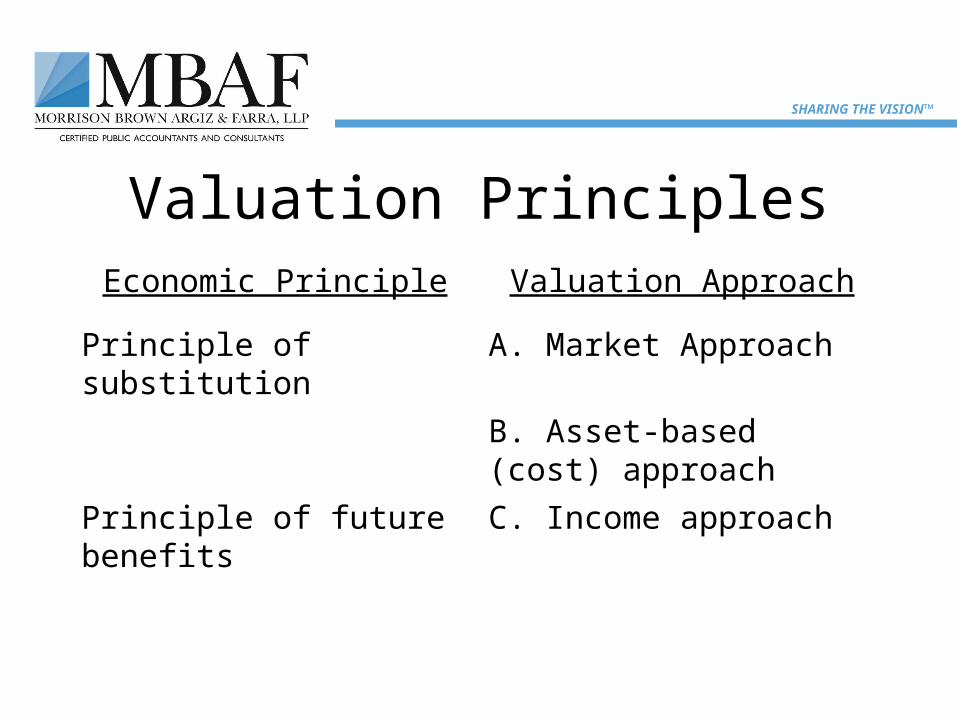
Valuation PrinciplesEconomic Principle Valuation Approach
Principle of substitution A. Market Approach
B. Asset-based (cost) approach
Principle of future benefits C. Income approach
SHARING THE VISION™
Economic Principles
• Principle of Substitution – One would not pay more for a particular asset than the cost to construct or purchase one with equivalent economic utility.
• Principle of Future Benefits – The value of an asset is the present value of the stream of future benefits available to the owner.
SHARING THE VISION™
Income Approach• Converts expected (predicted) future
amounts to a current price• Examples include:
– Option-pricing models (Black-Scholes; Merton formula)
– Binomial model (Lattice models)– Discounted future cash flows
SHARING THE VISION™
Cost Approach• The cost approach determines the amount
that currently would be required to replace the service capacity of an asset.
• The price that would be received for the asset is determined based on the cost to a market participant (the buyer) to acquire or construct a substitute asset of comparable utility, as adjusted for obsolescence.
SHARING THE VISION™
And the Answer IS??• IT DEPENDS!!!• In some cases, the fair value result will be from one
of the three approaches (only one will be appropriate).– Example: Unadjusted quoted price from an active market
can be used. (Quantitative conclusion)
• In other cases, multiple valuation approaches may be selected with the final conclusion being a point within the range that is most representative of fair value in the circumstances (Qualitative conclusion)
SHARING THE VISION™
Which of the Three Approaches to Choose?
• The availability of inputs relevant to the asset or liability being measured at fair value and the reliability of those inputs will affect the selection of the appropriate valuation techniques– Availability– Relevancy– Reliability
SHARING THE VISION™
Valuation Inputs• Inputs = Assumptions the market participants would use in
pricing the asset or liability• They consist of:
– Observable inputs (market data obtained from sources independent of the reporting entity – e.g. closing prices on NYSE)
– Unobservable inputs (inputs reflecting the reporting entity’s own assumptions about the assumptions used by market participants – e.g. growth rates, rates of return)
• Valuation techniques used to measure fair value should maximize the use of observable inputs and minimize the use of unobservable inputs)
SHARING THE VISION™
Fair Value Hierarchy for Inputs• Level 1 – Quoted prices in active
markets for identical assets or liabilities• Level 2 – Inputs other than the quoted
prices that are observable, either directly or indirectly.
• Level 3 – Utilizes unobservable inputs based on the best information available in the circumstances
SHARING THE VISION™
Fair Value Hierarchy for Inputs• Level 1examples:
– Financial Assets• Available for sale securities – publicly traded securities
(stocks and bonds)• Principal market
– Exchange market– Dealer market (OTC)– Brokered market– Principal to principal market
– Level 1 is best way to go when the data is available.
SHARING THE VISION™
Fair Value Hierarchy for Inputs• Level 2 – Inputs other than the quoted prices that are
observable, either directly or indirectly.– Quoted prices for similar assets or liabilities– Quoted prices for identical or similar assets or liabilities in
markets that are not active – Observable inputs other than quoted prices (interest rates,
yield curves, credit risks, default rates)
• Level 2 is the second best way to go (when data is available)
SHARING THE VISION™
Fair Value Hierarchy for Inputs• Level 2 examples:
– Interest rate swaps• Receive-fixed, pay-variable interest rate swap on the LIBOR
swap rate– Licensing arrangement
• Royalty rates at inception– Finished goods at a retail outlet
• Price to customers in a retail market (adjusted downward)• Wholesale price to retailers in a wholesale market (adjusted
upward)– Building held and used
• Price per square foot from comps– Reporting unit
• Earnings or revenue multiples from comparable businesses
SHARING THE VISION™
Fair Value Hierarchy for Inputs• Level 2 more examples:
– Restricted stock (using quoted price from active market)
– Corporate and municipal bonds that trade infrequently (using quoted prices for identical or similar assets or liabilities in non-active markets)
– Certain residential and commercial mortgage related assets (using pricing models whose inputs are derived principally from or corroborated by market data)
SHARING THE VISION™
Fair Value Hierarchy for Inputs• Level 3 – Utilizes unobservable inputs based
on the best information available in the circumstances– Example: A financial forecast (cash flow or
earnings) developed using the company’s own data, if no information shows market participants would make different assumptions.
• Level 3 is the third best way to go (when nothing else will work)
SHARING THE VISION™
Fair Value Hierarchy for Inputs
• Level 3 examples:– Financial forecast (cash flow of earnings)
developed using the company’s own data, if no information shows market participants would make different assumptions
– Venture capital investments
SHARING THE VISION™
Level Three Observations
• A Level 3 fair value measurement can include inputs that are observable (Level 1 and Level 2) and unobservable (Level 3)
• The level within which the fair value measurement falls for financial reporting purposes is the LOWEST level input that is significant to the fair value measurement in its entirety
• Assets can move between categories
SHARING THE VISION™
Example• OTC Option (long-dated) inputs on a traded
equity security (using Black-Scholes)– Risk free rate of interest (level 2)– Dividend yield (Level 2)– Volatility (Level 3)
• Because the volatility is a significant input, the entire measurement might fall within Level 3 for disclosure purposes
SHARING THE VISION™
Level Three Observations – 10Q Third Quarter 2007 – Merrill Lynch
“During the third quarter of 2007, a significant amount of assets and liabilities was reclassified from Level 2 to Level 3. This reclassification primarily relates to U.S. sub-prime residential mortgage related assets and liabilities, including ABS CDOs, due to a significant decrease in the observability of market pricing for these assets and liabilities in the third quarter.”
SHARING THE VISION™
Use of Third-Party Pricing Service
• Not necessarily Level 1 just because a price is obtained from such a service– Management will need to understand the
sources of information and inputs used in the price quotes
– Management is responsible for the fair value measurements and required disclosures
SHARING THE VISION™
Disclosures – Assets and Liabilities Measured on a Recurring Basis
• FMV at reporting date• Level used within the FV hierarchy (segregated by
Level 1, 2, and 3)• If Level 3 (unobservable) inputs were used, a
reconciliation is required between beginning and ending balances.– Amount of total gains and losses– Purchases, sales, issuances and settlements– Transfer in and out of Level 3 (transfers due to changes in
the observability of significant inputs)• The valuation technique(s) used and changes in such
technique(s) qualitative discussion.
SHARING THE VISION™
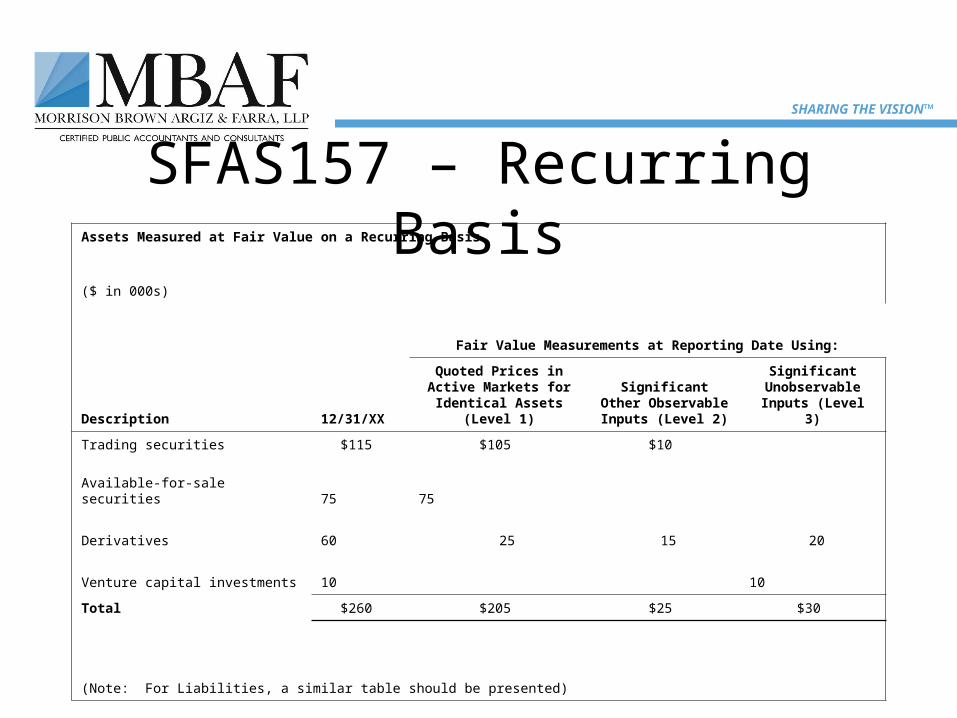
SFAS157 – Recurring BasisAssets Measured at Fair Value on a Recurring Basis
($ in 000s)
Fair Value Measurements at Reporting Date Using:
Description 12/31/XX
Quoted Prices in Active Markets for Identical
Assets (Level 1)
Significant Other Observable Inputs
(Level 2)
Significant Unobservable
Inputs (Level 3)
Trading securities $115 $105 $10
Available-for-sale securities 75 75
Derivatives 60 25 15 20
Venture capital investments 10 10
Total $260 $205 $25 $30
(Note: For Liabilities, a similar table should be presented)
SHARING THE VISION™
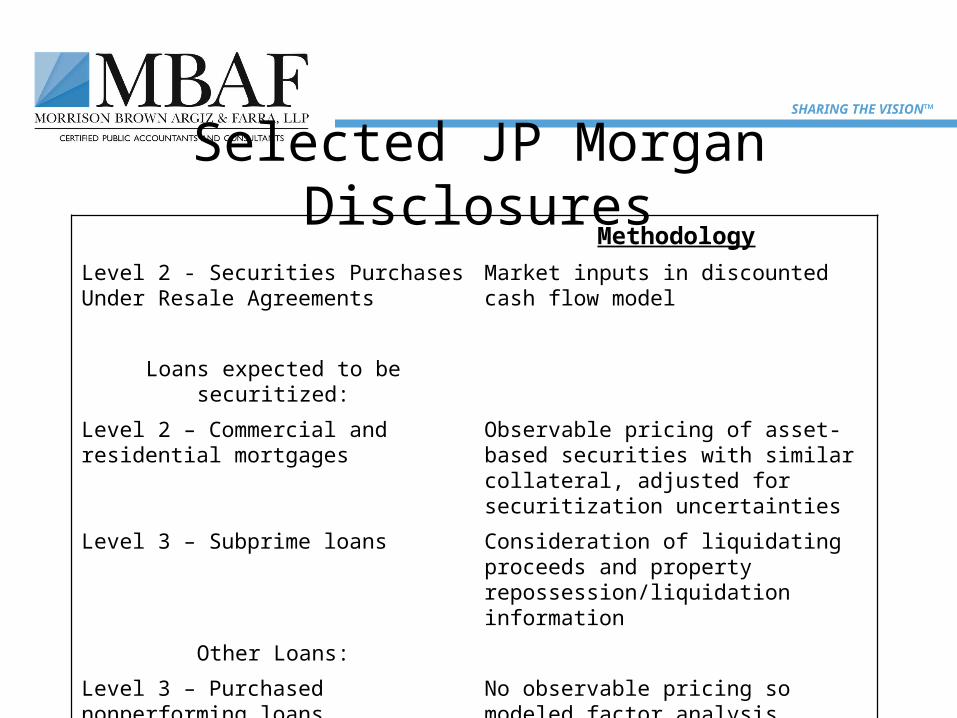
Selected JP Morgan DisclosuresMethodology
Level 2 - Securities Purchases Under Resale Agreements
Market inputs in discounted cash flow model
Loans expected to be securitized:
Level 2 – Commercial and residential mortgages
Observable pricing of asset-based securities with similar collateral, adjusted for securitization uncertainties
Level 3 – Subprime loans Consideration of liquidating proceeds and property repossession/liquidation information
Other Loans:
Level 3 – Purchased nonperforming loans
No observable pricing so modeled factor analysis
SHARING THE VISION™
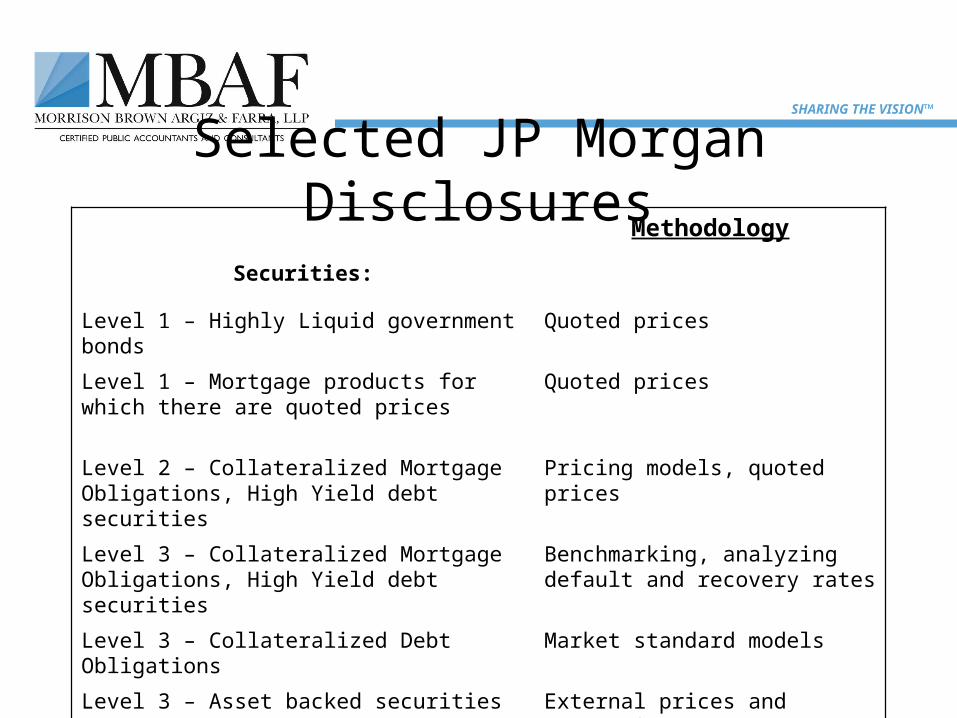
Selected JP Morgan DisclosuresMethodology
Securities:
Level 1 – Highly Liquid government bonds Quoted prices
Level 1 – Mortgage products for which there are quoted prices
Quoted prices
Level 2 – Collateralized Mortgage Obligations, High Yield debt securities
Pricing models, quoted prices
Level 3 – Collateralized Mortgage Obligations, High Yield debt securities
Benchmarking, analyzing default and recovery rates
Level 3 – Collateralized Debt Obligations Market standard models
Level 3 – Asset backed securities External prices and assumptions
SHARING THE VISION™
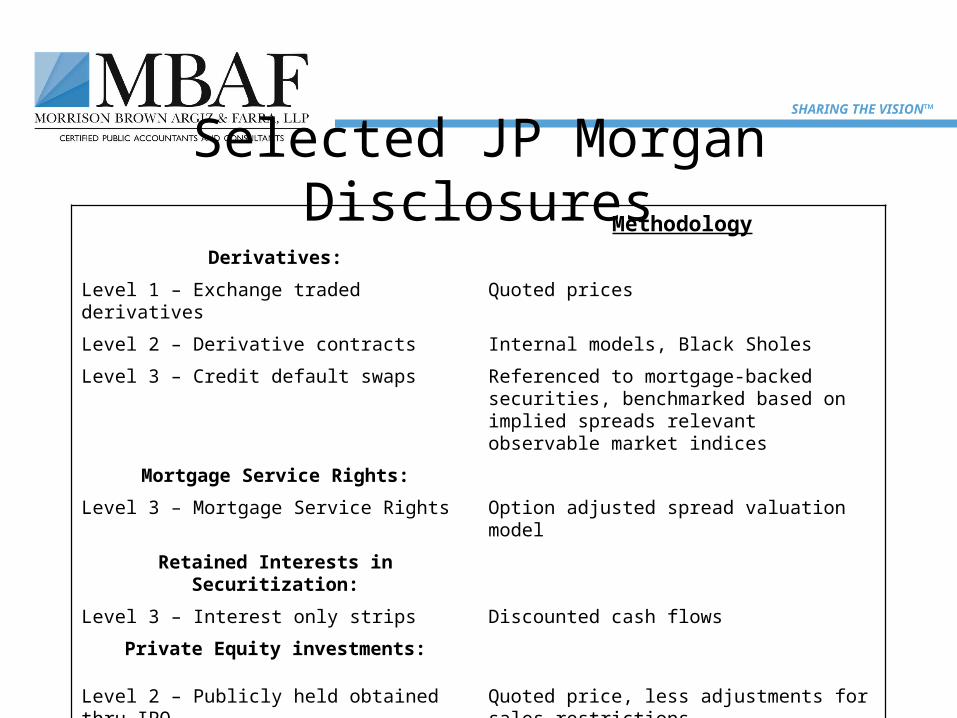
Selected JP Morgan DisclosuresMethodology
Derivatives:
Level 1 – Exchange traded derivatives Quoted prices
Level 2 – Derivative contracts Internal models, Black Sholes
Level 3 – Credit default swaps Referenced to mortgage-backed securities, benchmarked based on implied spreads relevant observable market indices
Mortgage Service Rights:
Level 3 – Mortgage Service Rights Option adjusted spread valuation model
Retained Interests in Securitization:
Level 3 – Interest only strips Discounted cash flows
Private Equity investments:
Level 2 – Publicly held obtained thru IPO Quoted price, less adjustments for sales restrictions
Level 3 – Nonpublic private equity investments Market comps, adjusted for company specific issues
SHARING THE VISION™
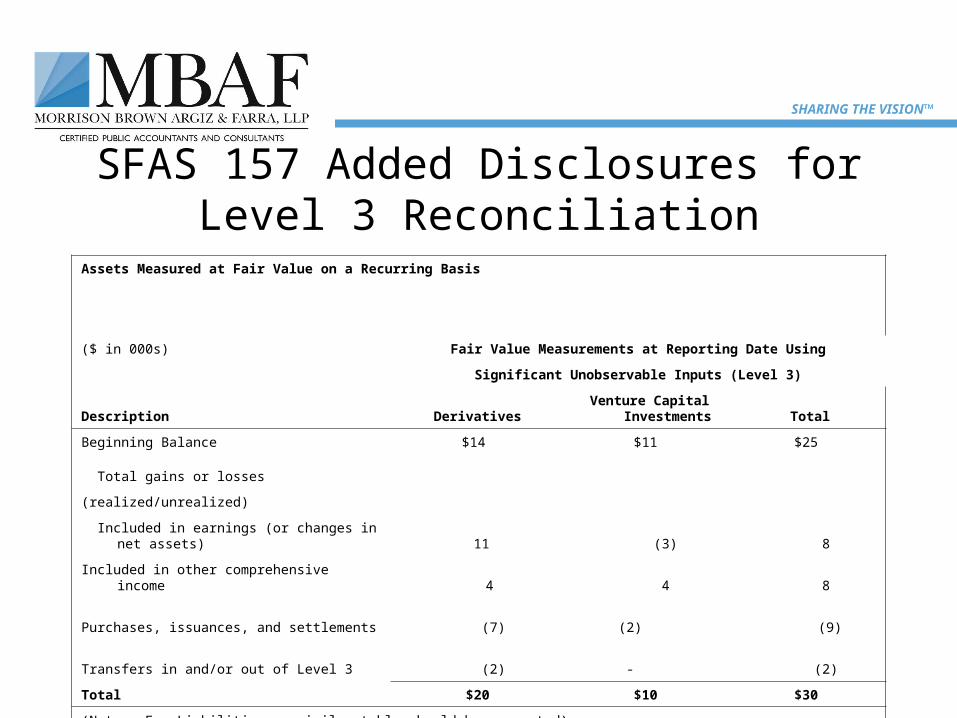
SFAS 157 Added Disclosures for Level 3 Reconciliation
Assets Measured at Fair Value on a Recurring Basis
($ in 000s) Fair Value Measurements at Reporting Date Using
Significant Unobservable Inputs (Level 3)
Description DerivativesVenture Capital
Investments Total
Beginning Balance $14 $11 $25
Total gains or losses
(realized/unrealized)
Included in earnings (or changes in net assets) 11 (3) 8
Included in other comprehensive income 4 4 8
Purchases, issuances, and settlements (7) (2) (9)
Transfers in and/or out of Level 3 (2) - (2)
Total $20 $10 $30
(Note: For Liabilities, a similar table should be presented)
SHARING THE VISION™
Disclosures – Assets and Liabilities Measured on a Nonrecurring Basis
• Example: Impaired Assets– FMV measurements recorded during the period
and the reasons for the measurements– Level used within the FV hierarchy– If Level 3 inputs were used, a description of the
inputs and the information used to develop the inputs.
– For annual periods only, the valuation techniques used and changes in techniques from prior periods.
SHARING THE VISION™
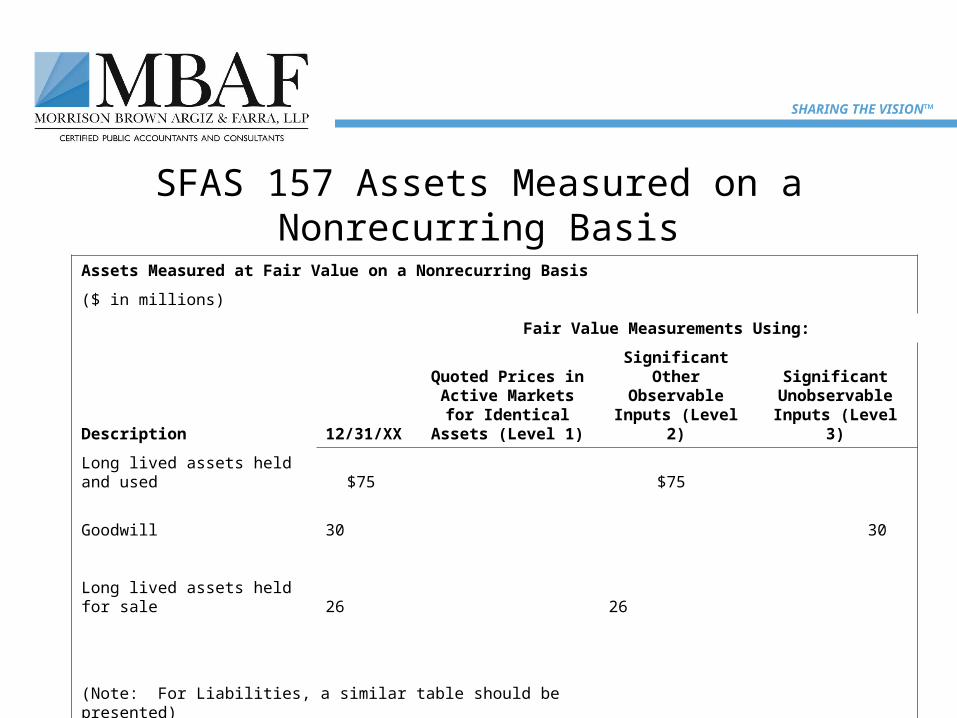
SFAS 157 Assets Measured on a Nonrecurring Basis
Assets Measured at Fair Value on a Nonrecurring Basis
($ in millions)
Fair Value Measurements Using:
Description 12/31/XX
Quoted Prices in Active Markets for Identical Assets
(Level 1)
Significant Other Observable
Inputs (Level 2)
Significant Unobservable
Inputs (Level 3)
Long lived assets held and used $75 $75
Goodwill 30 30
Long lived assets held for sale 26 26
(Note: For Liabilities, a similar table should be presented)
SHARING THE VISION™
Regulatory Issues
• Call report– FFIEC 031 and 041 effective June 30, 2008, fair
value amounts to be disclosed.– FFIEC 002 effective for September 30, 2008.– To be completed by banks that have adopted FAS
157 and have elected to account for financial instruments or servicing assets and liabilities at FV option or are required to complete Schedule RC-D – Trading Assets and Liabilities
SHARING THE VISION™
Questions