Embed Size (px)
Citation preview
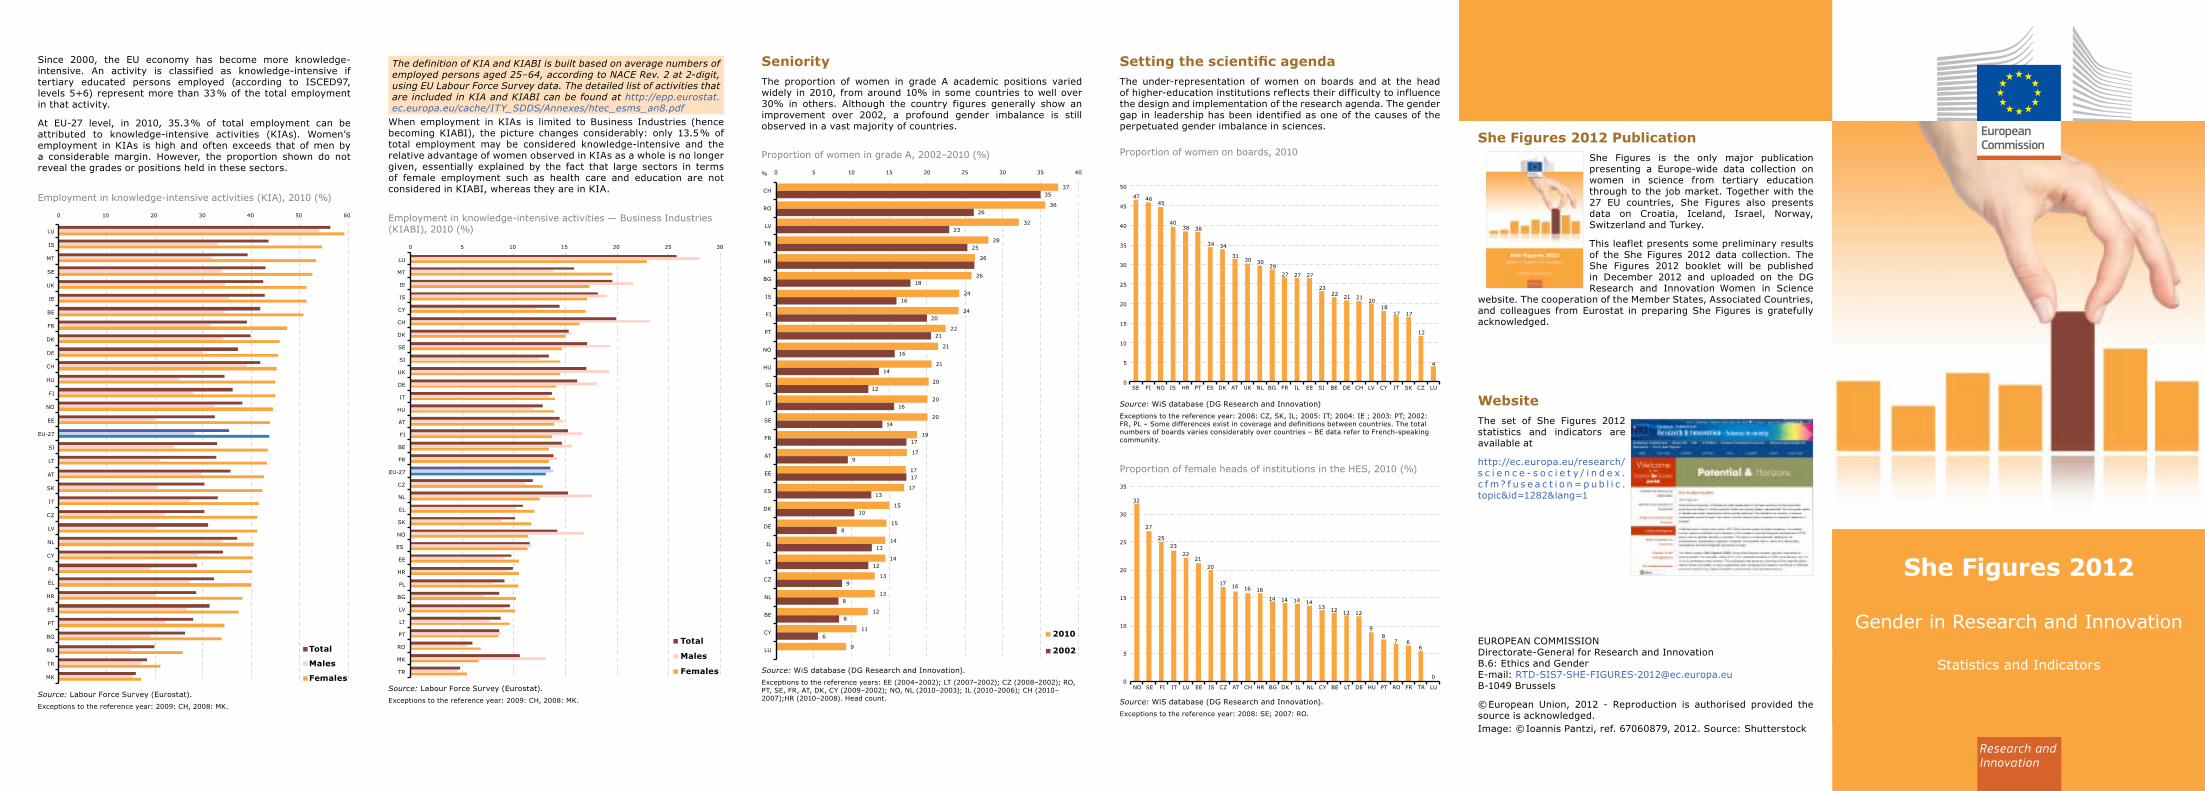
WebsiteThe set of She Figures 2012 statistics and indicators are available at
http://ec.europa.eu/research/s c i e n c e - s o c i e t y / i n d e x .c f m? f u s e a c t i o n = p u b l i c .topic&id=1282&lang=1
She Figures 2012 PublicationShe Figures is the only major publication presenting a Europe-wide data collection on women in science from tertiary education through to the job market. Together with the 27 EU countries, She Figures also presents data on Croatia, Iceland, Israel, Norway, Switzerland and Turkey.
This leaflet presents some preliminary results of the She Figures 2012 data collection. The She Figures 2012 booklet will be published in December 2012 and uploaded on the DG Research and Innovation Women in Science
website. The cooperation of the Member States, Associated Countries, and colleagues from Eurostat in preparing She Figures is gratefully acknowledged.
She Figures 2012
Gender in Research and Innovation
Statistics and Indicators
Employment in knowledge-intensive activities (KIA), 2010 (%)
Source: Labour Force Survey (Eurostat).Exceptions to the reference year: 2009: CH, 2008: MK.
Employment in knowledge-intensive activities — Business Industries (KIABI), 2010 (%)
Source: Labour Force Survey (Eurostat).Exceptions to the reference year: 2009: CH, 2008: MK.
Since 2000, the EU economy has become more knowledge-intensive. An activity is classified as knowledge-intensive if tertiary educated persons employed (according to ISCED97, levels 5+6) represent more than 33 % of the total employment in that activity.
At EU-27 level, in 2010, 35.3 % of total employment can be attributed to knowledge-intensive activities (KIAs). Women’s employment in KIAs is high and often exceeds that of men by a considerable margin. However, the proportion shown do not reveal the grades or positions held in these sectors.
The definition of KIA and KIABI is built based on average numbers of employed persons aged 25–64, according to NACE Rev. 2 at 2-digit, using EU Labour Force Survey data. The detailed list of activities that are included in KIA and KIABI can be found at http://epp.eurostat.ec.europa.eu/cache/ITY_SDDS/Annexes/htec_esms_an8.pdf
SeniorityThe proportion of women in grade A academic positions varied widely in 2010, from around 10% in some countries to well over 30% in others. Although the country figures generally show an improvement over 2002, a profound gender imbalance is still observed in a vast majority of countries.
Proportion of women in grade A, 2002–2010 (%)
Source: WiS database (DG Research and Innovation).Exceptions to the reference years: EE (2004–2002); LT (2007–2002); CZ (2008–2002); RO, PT, SE, FR, AT, DK, CY (2009–2002); NO, NL (2010–2003); IL (2010–2006); CH (2010–2007);HR (2010–2008). Head count.
Setting the scientific agendaThe under-representation of women on boards and at the head of higher-education institutions reflects their difficulty to influence the design and implementation of the research agenda. The gender gap in leadership has been identified as one of the causes of the perpetuated gender imbalance in sciences.
Proportion of women on boards, 2010
Proportion of female heads of institutions in the HES, 2010 (%)
Source: WiS database (DG Research and Innovation) Exceptions to the reference year: 2008: CZ, SK, IL; 2005: IT; 2004: IE ; 2003: PT; 2002: FR, PL – Some differences exist in coverage and definitions between countries. The total numbers of boards varies considerably over countries – BE data refer to French-speaking community.
Source: WiS database (DG Research and Innovation).Exceptions to the reference year: 2008: SE; 2007: RO.
EUROPEAN COMMISSION Directorate-General for Research and Innovation B.6: Ethics and Gender E-mail: [email protected] B-1049 Brussels
© European Union, 2012 - Reproduction is authorised provided the source is acknowledged.Image: © Ioannis Pantzi, ref. 67060879, 2012. Source: Shutterstock
When employment in KIAs is limited to Business Industries (hence becoming KIABI), the picture changes considerably: only 13.5 % of total employment may be considered knowledge-intensive and the relative advantage of women observed in KIAs as a whole is no longer given, essentially explained by the fact that large sectors in terms of female employment such as health care and education are not considered in KIABI, whereas they are in KIA.

IntroductionWhat is the proportion of female and male researchers in Europe, and how is this balance evolving over time? Are there scientific fields in which women are better represented? Do the career paths of female and male researchers follow similar patterns? Are men and women equally represented in science across Europe? Are women less represented in knowledge-intensive activities? How many women hold senior positions in scientific research in Europe? The forthcoming edition of She Figures, to be published at the end of 2012, aims to provide answers to these questions and many others.
Despite a number of positive trends, women in scientific research remain a minority, segregation across scientific fields is strong and the glass ceiling continues to hold back women from top academic positions.
What can explain this under-representation of women in science? How can this trend be curbed? And how can the specific obstacles encountered by female academics on their career paths be tackled? These are the questions that should be addressed by teachers, policy-makers, researchers, economists and citizens in Europe.
Critical massShe Figures 2012 reveals a number of positive trends; for example, the share of women among scientists and engineers has grown significantly (+ 5.4 % on average per year between 2002 and 2010, compared to + 3.1 % for men). In 2010, tertiary-educated women employed as professionals or technicians now outnumber their male counterparts by 3 percentage points.
Source: Labour Force Survey, HRST statistics (Eurostat).
Proportion of women in the EU-27 for total employment, tertiary educated and employed (HRSTC) and scientists and engineers in 2010, compound annual growth rate for women and men 2002–2010
Proportion and compound annual growth rate
Source: Education Statistics (Eurostat).Exceptions to the reference year: EL, IT: 2008. Data estimated: EU-27 (by Eurostat).
Proportion of female PhD (ISCED 6) graduates, 2009 (%)
Source: Education Statistics (Eurostat).Exceptions to the reference years: IT, BG, EL: 2004–2008; FR, PT: 2005–2009. Compound annual growth rates have not been calculated for countries with less than 30 graduates: CY, MT, IS.
Compound annual growth rate of PhD (ISCED 6) graduates by sex, 2004–2009 (%)
Source: Education statistics (Eurostat).Exceptions to the reference year: JP, CH, RU: 2008; EL: 2005. Data estimated: EU-27 (by Eurostat), UK, IE. Head count.
Proportion of female researchers, 2009 (%)
Source: Science & Technology statistics (Eurostat).Exceptions to the reference years: JP: 2002–2008;EL: 2003–2005; LU, DE , NO, NL, IS, PL: 2003–2009; CH: 2004–2008; MT, FI: 2004–2009; UK, SE: 2005–2009. Break in series: DK (2007); FR(2002); HU, MT (2004); NL (2003); SE (2005 and 2007); SI (2008). Provisional data: NL (2005). Data estimated: EU-27 (by Eurostat), PT (2002); UK. Head count.
Compound annual growth rate for researchers by sex, 2002–2009 (%)
Evolution of the proportion of female researchers in the Higher Education Sector (HES) and government sector (GOV) by field of science, 2002-2009 (%)
Source: Science & Technology statistics (Eurostat).Exceptions to the reference years: NL: (2002–2009 only GOV); SE: (2003–2007); DE, DK, LT, LV, NO, TR: (2003–2009); PL: (2004–2008); BE, MT: (2004–2009); IT, LU: (2005–2009); FI, UK: (2007). Break in series: SE (2007). Data estimated: PT (2002), BE, IE (2009).
Natural sciences
Engineering &
technology
Medical sciences
Agricultural Sciences
Social sciences Humanities
2002 2009 2002 2009 2002 2009 2002 2009 2002 2009 2002 2009
AT 22 28 14 22 36 44 35 49 37 48 43 50
BE 29 31 20 22 46 51 38 43 42 47 41 44
BG 50 50 27 34 53 55 47 53 49 52 65 61
CY 31 39 16 26 25 56 14 14 37 42 44 49
CZ 32 31 22 24 49 48 47 39 43 41 44 42
DE 20 28 13 20 35 46 33 46 32 35 32 47
DK 24 29 16 22 37 46 44 52 31 46 39 47
EE 35 37 26 29 64 66 45 46 54 58 65 64
ES 39 41 32 37 41 47 39 43 39 41 39 41
FI : 35 : 30 : 57 : 54 : 53 : 55
HU 27 27 18 21 47 46 33 40 34 42 47 46
IE 31 30 18 18 73 58 30 41 43 47 41 48
IT 36 38 21 26 34 40 35 37 38 40 49 54
LT 46 43 27 33 70 60 52 58 55 67 55 61
LU 30 34 21 27 54 50 30 25 36 44 37 44
LV 47 44 29 31 62 61 44 51 60 63 85 68
MT 16 30 10 16 28 45 13 20 32 40 21 19
NL 24 30 19 24 37 41 32 41 35 43 39 45
PL 39 39 20 70 54 12 49 37 46 38 46 42
PT 51 51 30 29 56 57 50 53 51 58 51 51
RO 45 49 36 40 58 57 40 51 52 52 40 47
SE 43 35 42 22 43 61 44 47 43 : 43 :
SI 33 35 19 32 50 53 39 44 46 48 42 51
SK 39 44 31 32 51 55 42 44 50 51 51 50
UK : 31 : 19 : 51 : 35 : 41 : 48
HR 44 48 27 32 51 54 38 45 48 55 48 53
TR 38 39 29 32 43 46 27 30 36 40 41 42
NO 27 31 17 24 47 55 37 44 41 46 43 47
In the EU the share of women graduating at PhD level stood at 45 % in 2009, a proportion unchanged compared with 2006 (2002: 42 %). In twelve of the 26 EU Member States displayed in the graph, the percentage of female PhD graduates stood at 50 % or above.
Moreover, the share of women graduating at PhD level in sciences grew by an average of 4.9 % per year between 2004 and 2009, compared with a 3.2 % yearly increase for men.
However, it should be noted that these figures include all disciplines and consequently hide significant gender variations across scientific fields.
Although women thus seem to be rapidly catching up with men at the PhD level, they remain a minority in scientific research, accounting for 33 % of researchers in the EU in 2009 (2006: 30 %). Although the proportion of female researchers varies considerably between countries, there is a clear pattern of female under-representation everywhere.
As for PhDs, the number of female researchers is growing faster than that of men (up by an average 5.1 % per year between 2002 and 2009, compared with 3.3 % for men); but not enough to indicate that the gender imbalance in science is self-correcting. It could take a very long time to achieve a significantly improved gender balance.
Scientific fieldsHorizontal segregation of male and female researchers across different fields of science can be observed in the higher education (HES) and government sector (GOV). The following table looks at horizontal segregation in both of these sectors combined. Data for the business enterprise sector (BES) are not equally comparable. The reader should keep in mind that figures do not distinguish between jobs and seniority level within the single fields of science (vertical segregation). Women were most poorly represented in the field of engineering and technology. The situation is only a little better in natural sciences. Female participation was higher in social sciences, agricultural sciences, medical sciences and humanities.