Embed Size (px)
Citation preview
Running Head: SHE SAVED THE WORLD A LOT
SHE SAVED THE WORLD A LOT:
ON THE EFFECT AND EFFECTIVITY OF GENERAL COUNTERSTEREOTYPES IN
STEREOTYPE THREAT SITUATIONS
by
HANNAH MARIE GRINGARD
Inaugural dissertation submitted in partial fulfillment of the requirements for the degree
Doctor of Social Sciences in the Graduate School of Economic and Social Sciences at the
University of Mannheim
Running Head: SHE SAVED THE WORLD A LOT
Date of defense: March 22, 2017
Dean of the School of Social Sciences Prof. Dr. Michael Diehl
Supervisors Prof. Dr. Oliver Dickhäuser
Prof. Dr. Herbert Bless
Evaluators Prof. Dr. Oliver Dickhäuser
Prof. Dr. Herbert Bless
Prof. Dr. Stefan Münzer
SHE SAVED THE WORLD A LOT 2
Abstract
By Hannah Marie Gringard
The theory of stereotype threat describes situations in which members of
stereotyped groups often confirm the negative stereotype through their performance or
behavior, for example when heightened anxiety is reflected in poorer performance. This
threat effect is moderated by individual and situational factors, which are often
translated into interventions. One of these factors is the exposure to counterstereotypes.
Prior research for example shows that domain specific role models buffer against threat
effects. The focus of this dissertation is the use of general counterstereotypes in
stereotype threat situations. Kawakami, Dovidio and van Kamp (2005) developed a
training to reduce gender stereotypes. This training, called the Counterstereotypic
Association Training, asks participants to match stereotypically male and female words
to images of men and women in such a way that word and image do not stereotypically
match. To test the effectivity and the effect of the training, three studies were conducted.
Study 1 tests the effectivity of the training in a stereotype threat situation (mathematics).
104 girls between the ages of 16 and 20 were asked to complete the Counterstereotypic
Association Training or a Control Training before completing an arithmetic test.
Additionally, half of the participants were induced with stereotype threat resulting in a
2x2 (Counterstereotypic Association Training vs. Control Training x Threat vs. No
Threat). Results show the Counterstereotypic Association Training to effectively
moderate stereotype threat: participants who did not receive the training performed
significantly worse than participants in the three remaining groups. Study 2 put the
focus on the mechanism behind the effect of the Counterstereotypic Association
SHE SAVED THE WORLD A LOT 3
Training. We proposed three mechanisms through which the training potentially
buffered threat effects. These three mechanisms were tested in a sample of 60 students
of the University of Mannheim who either completed the Counterstereotypic
Association Training or the Control Training. Subsequently reaction latencies were
taken for self-describing masculine of feminine trait words. Participants of the
Counterstereotypic Association Training reacted more slowly to gendered trait words
than participants in the Control Training group. Additionally, participants in the
Counterstereotypic Association Training group did not react more quickly to either
gender while participants in the Control Training group reacted faster to feminine trait
words than masculine ones. The goal of study 3 was to test the endurance of the
mechanisms in stereotype threat situations. 203 students from the University of
Mannheim were asked to complete a reaction time task (same as study 2) at three time
points during the course of the experiment. Additionally half completed the
Counterstereotypic Association Training while the other half finished the Control
Training. Participants were also either induced with stereotype threat or not, overall
leading to a 2x2 design (Counterstereotypic Association Training vs. Control Training x
Threat vs. No Threat). Results from study 1 were replicated. The longitudinal data of
the reaction time measure show differences to study 2. Participants who finished the
Counterstereotypic Association Training reacted more slowly to gendered trait words
than participants in the Control Training condition both after the training and the
arithmetic task. Participants in both groups however reacted more quickly to feminine
trait words than masculine trait words after having finished either training. Implications
of the results and recommendations for further research will be discussed.
SHE SAVED THE WORLD A LOT
4
Eidesstattliche Versicherung gemäß § 9 Absatz 1 Buchstabe e) der Promotionsordnung
der Universität Mannheim zur Erlangung des Doktorgrades der Sozialwissenschaften:
1. Bei der eingereichten Dissertation mit dem Titel “She saved the world a lot: On the
effect and effectivity of general counterstereotypes in stereotype threat situations”
handelt es sich um mein eigenständig erstelltes eigenes Werk.
2. Ich habe nur die angegebenen Quellen und Hilfsmittel benutzt und mich keiner
unzulässigen Hilfe Dritter bedient. Insbesondere habe ich wörtliche Zitate aus anderen
Werken als solche kenntlich gemacht.
3. Die Arbeit oder Teile davon habe ich bisher nicht an einer Hochschule des In- oder
Auslands als Bestandteil einer Prüfungs- oder Qualifikationsleistung vorgelegt.
4. Die Richtigkeit der vorstehenden Erklärung bestätige ich.
5. Die Bedeutung der eidesstattlichen Versicherung und die strafrechtlichen Folgen
einer unrichtigen oder unvollständigen eidesstattlichen Versicherung sind mir bekannt.
Ich versichere an Eides statt, dass ich nach bestem Wissen die reine Wahrheit erklärt
und nichts verschwiegen habe.
__________________________________________
Hannah Marie Gringard; Mannheim, den

SHE SAVED THE WORLD A LOT
5
Acknowledgements
ForthecompletionofthisdoctoraldissertationIwouldliketothank…
…mysupervisorOliverDickhauser,forhiswordsofwisdomandencouragementto
keeplooking;
…myfamily,forbelievingthatIcoulddothis;
…mymom,foreverything;
…mycolleagues,fortheircheerfulwordsanddistractionwhenneeded;
…MeikeandStefan,forfrequentlyremindingmewhatthisreallyisallabout(Isee
you,diamond);
…Dominic,forthemanyfruitfuldiscussionsthatforcedmetoreconsidermy
viewpoint;
…Gabi,whotookeverypossibleburdenaway;
…myfriends,wholistenedtomerantwhenthingsdidnotgomyway;
...DavidMarx,forwelcomingandintegratingmeintohisresearchteam;
…JossWhedon,fortellingBuffy’sstory;
…SarahMichelleGellar,forbringingBuffytolife.
SHE SAVED THE WORLD A LOT
6
Table of Content
Abstract
Eidesstattliche Erklärung
Acknowledgments
1 Introduction........................................................................................................... 13
2 Stereotypes............................................................................................................ 15
2.1 Why do stereotypes exist? ............................................................................. 16
2.2 How do stereotypes form? ............................................................................. 17
2.3 Conclusion...................................................................................................... 20
3 Females in mathematics........................................................................................ 21
3.1 Introduction..................................................................................................... 21
3.2 Historical beginnings of women in mathematics............................................ 21
3.3 Women in mathematics today......................................................................... 22
3.4 Gender differences in mathematics performance........................................... 24
3.5 Conclusion...................................................................................................... 27
4 The theory of stereotype threat............................................................................. 28
4.1 Introduction..................................................................................................... 28
4.2 Definition and components............................................................................. 28
4.3 Mechanisms.................................................................................................... 33
4.3.1 Cognitive mechanisms..................................................................... 33
4.3.2 Affective mechanisms...................................................................... 34
4.3.3 Motivational mechanisms................................................................ 35
4.4 Moderators...................................................................................................... 36
4.4.1 Individual factors............................................................................. 36
SHE SAVED THE WORLD A LOT
7
4.4.2 Situational factors............................................................................ 37
4.5 Consequences................................................................................................. 38
4.6 Interventions................................................................................................... 41
41
44
4.6.1 Psychological interventions.............................................................
4.6.2 Structural interventions....................................................................
4.7 Conclusion...................................................................................................... 45
5 Counterstereotypes as an intervention to stereotype threat.................................. 47
5.1 Introduction.................................................................................................... 47
5.2 Why counterstereotypes? .............................................................................. 47
5.3 Counterstereotypes and stereotype threat...................................................... 48
5.3.1 Definition........................................................................................ 48
5.4 Research......................................................................................................... 49
5.4.1 Introduction..................................................................................... 49
5.4.2 Counterstereotypic depictions on stereotype threat......................... 50
5.4.3 Role models on stereotype threat..................................................... 53
5.4.4 Mechanisms behind counterstereotypes.......................................... 55
5.5 Conclusion...................................................................................................... 57
6 Counterstereotypic Association Training............................................................. 59
6.1 Introduction.................................................................................................... 59
6.2 The Counterstereotypic Association Training................................................ 59
6.2.1 Effectivity of the Counterstereotypic Association Training............. 61
6.2.2 Mechanisms behind the Counterstereotypic Association
Training.....................................................................................................
64
6.3 The Counterstereotypic Association Training and stereotype threat.............. 66
SHE SAVED THE WORLD A LOT
8
6.3.1 Automatic stereotype activation and stereotype threat.................... 66
6.3.2 The working self and stereotype threat............................................ 68
6.3.2.1 Usefulness of gender category to the self......................... 72
6.3.2.2 Reversal of the working self............................................. 74
6.4 Conclusion...................................................................................................... 77
7 Research question and research plan.................................................................... 79
8 Stereotype threat inductions................................................................................. 80
8.1 Introduction.................................................................................................... 80
8.2 Inductions....................................................................................................... 80
8.2.1 Stereotype salience.......................................................................... 80
8.2.2 Salient group membership.............................................................. 82
8.2.3 Combining stereotype salience and salient group membership...... 83
8.3 Conclusion...................................................................................................... 84
9 Pre-test 1: Threat vs. No Threat............................................................................ 85
9.1 Introduction..................................................................................................... 85
9.2 Methodology................................................................................................... 86
9.2.1 Sample and overview....................................................................... 86
9.2.2 Instruments....................................................................................... 86
9.2.2.1 Mathematics tests.............................................................. 86
9.2.2.2 Filler task.......................................................................... 87
9.2.3 Procedure......................................................................................... 88
9.3 Results............................................................................................................ 90
9.3.1 Assumptions..................................................................................... 90
9.3.2 Mathematic performance................................................................. 91
SHE SAVED THE WORLD A LOT
9
9.4 Discussion...................................................................................................... 92
10 Pre-test 2: Blatant threat induction...................................................................... 95
10.1 Introduction.................................................................................................. 95
10.2 Methodology................................................................................................ 97
10.2.1 Sample and overview.................................................................... 97
10.2.2 Instruments.................................................................................... 97
10.2.2.1 Mathematics test............................................................. 97
10.2.2.2 Filler task........................................................................ 98
10.2.2.3 Worry scale..................................................................... 98
10.2.3 Procedure....................................................................................... 98
10.3 Results.......................................................................................................... 100
10.3.1 Assumptions.................................................................................. 100
10.3.2 Mathematics performance............................................................. 100
10.3.3 Worry scale.................................................................................... 102
10.4 Discussion.................................................................................................... 103
11 Study 1: The Counterstereotypic Association Training and stereotype threat..... 106
11.1 Introduction.................................................................................................. 106
11.2 Methodology................................................................................................ 108
11.2.1 Sample and overview..................................................................... 108
11.2.2 Material.......................................................................................... 108
11.2.2.1 Counterstereotypic Association Training........................ 108
11.2.2.2 Control Training.............................................................. 109
11.2.3 Instruments.................................................................................... 111
11.2.3.1 Mathematics task............................................................ 111
SHE SAVED THE WORLD A LOT
10
11.2.3.2 Worry scale..................................................................... 111
11.2.4 Procedure....................................................................................... 112
11.3 Results.......................................................................................................... 114
11.3.1 Assumptions................................................................................... 114
11.3.2 Mathematics performance.............................................................. 115
11.3.3 Intrusive worry thought.................................................................. 117
11.4 Discussion..................................................................................................... 118
12 Study 2: The cognitive impact of the Counterstereotypic Association
Training.................................................................................................................
122
12.1 Introduction................................................................................................... 122
12.2 Methodology ................................................................................................ 126
12.2.1 Sample and overview..................................................................... 126
12.2.2 Material.......................................................................................... 126
12.2.2.1 Counterstereotypic Association Training........................ 126
12.2.2.2 Control Training.............................................................. 127
12.2.3 Instruments.................................................................................... 127
12.2.3.1 Cognitive measures......................................................... 127
12.2.4 Procedure....................................................................................... 128
12.3 Results........................................................................................................... 129
12.3.1 Data preparation............................................................................. 129
12.3.2 Latencies of self-descriptions........................................................ 131
12.3.3 Content of self-descriptions........................................................... 132
12.4 Discussion..................................................................................................... 135
13 Study 3: The impact of threat............................................................................... 140
SHE SAVED THE WORLD A LOT
11
13.1 Introduction................................................................................................... 140
13.2 Methodology................................................................................................. 144
13.2.1 Sample and overview..................................................................... 144
13.2.2 Material.......................................................................................... 144
13.2.2.1 Counterstereotypic Association Training........................ 144
13.2.2.2 Control Training.............................................................. 145
13.2.3 Instruments..................................................................................... 145
13.2.3.1 Cognitive measures......................................................... 145
13.2.3.2 Mathematics task............................................................. 146
13.2.4 Procedure....................................................................................... 146
13.3 Results........................................................................................................... 149
13.3.1 Data preparation............................................................................. 149
13.3.2 Assumptions................................................................................... 150
13.3.3 Mathematics score......................................................................... 151
13.3.4 Latencies of self-descriptions........................................................ 153
13.3.4.1 Hypothesis about automatic activation........................... 153
13.3.4.2 Further analyses of automatic activation........................ 153
13.3.4.3 Hypotheses about the working self................................. 155
13.3.4.4 Further analyses of the working self............................... 157
13.3.5 Content of self-descriptions........................................................... 157
13.3.5.1 Hypothesis about the content of self-descriptions........... 157
13.3.5.2 Further analyses of the content of self-descriptions........ 159
13.4 Discussion.................................................................................................... 160
14 General summary and final conclusion................................................................ 170

SHE SAVED THE WORLD A LOT
12
14.1 Summary of studies...................................................................................... 170
14.2 Conclusion and outlook................................................................................ 174
15 Appendix.............................................................................................................. 178
16 Bibliography......................................................................................................... 198
SHE SAVED THE WORLD A LOT
13
1 Introduction
On September 18th, 2002, the first episode of season 6 of Buffy the Vampire
Slayer was aired for American audiences. One of the most memorable images from the
episode is a picture of Buffy’s tombstone inscription She saved the world a lot. It is
estimated that throughout the run of the television series, Buffy killed up to 200
vampires, demons and other evil creatures; many of them on the verge of bringing about
the apocalypse. So indeed, she saved the world a lot; at least in fiction. More interesting
than the number of monsters Buffy killed is the impact the television series has had on
popular culture. This impact can, for example, be seen in the cornucopia of books
written about and analyzing the series (e.g. Billson, 2005; Wilcox, 2005; Wilcox &
Lavery, 2002). Themes usually touched upon deal with the almost revolutionary
approach on how to portray women in television. Buffy was not only one of the few
female protagonists but also a female protagonist who did not conform to the common
stereotypes about women (Kellner; 2003). Buffy taught young girls and teenagers how
to deal with love, angst, and friendship. Most importantly however, she showed them
that it can be good to defy stereotypes. Through all of this, Buffy developed into a cult
figure (Kellner, 2003). The role Buffy took on, not only as a slayer in her fictional world
but as a teacher to young girls and teenagers in the real world, earned her the epitaph
she saved the world a lot for both worlds. The question how she came to earn it for the
real world is the question we want to address with this doctoral thesis. We will approach
the topic by looking at stereotypes and stereotype formation before applying that
knowledge to a real life stereotype example. This will be followed by a discussion of
consequences of stereotypes and ways to counteract the effects. We will specifically
look at the theory of stereotype threat, which explains how members of negatively
SHE SAVED THE WORLD A LOT
14
stereotyped groups are impacted by the knowledge of the stereotype alone. As already
mentioned above, Buffy the Vampire Slayer defies stereotypes and we posited that it
positively impacted the viewers. Using general counterstereotypes that are not tied to a
certain domain, such as mathematics or reading, we will then explore how
counterstereotypes can protect against stereotype threat effects in academics. This will
firstly be done theoretically and then tested empirically in three studies.
Counterstereotypes will be operationalized by the Counterstereotypic Association
Training by Kawakami, Dovidio and van Kamp (2005). All this together will hopefully
allow us to better understand how general counterstereotypes such as Buffy the Vampire
Slayer can save the world a lot.
SHE SAVED THE WORLD A LOT
15
2 Stereotypes
Most people seem to have a moderate layperson’s understanding of what
stereotypes are as we frequently employ them in our everyday life. This chapter will
give a summary of the psychological definition of stereotypes and their use and
formation before examining the process on a real life example in the following chapter.
Formal research on stereotypes commenced with the publication of Walter
Lippmann’s book “The Public Opinion“ in 1922. Here, Lippmann describes stereotypes
as “pictures in our heads“ (p. 3). The pictures described represent ideas about people
and events of our world (Hinton, 2000; McGarty, Yzerbyt & Spears, 2002) and thus can
also be thought of as a set of beliefs about people. In other words, for Lippmann, the
term stereotype means a representation of a specific group. Ashmore and Del Boca
(1981) summarized it similarly stating “a stereotype is a set of beliefs about the personal
attributes of a social group“ (p. 21). For both Lippmann’s (1922) and Ashmore and Del
Boca’s (1981) definitions we can say that they believe individuals belonging to the
same group to share an underlying essence, meaning they behave similarly and thus can
be represented and understood together as a group (McGarty, Yzerbyt, & Spears, 2002).
Applying these stereotypes to people would then mean ascribing characteristics to a
person based on their group affiliation without knowing the individual himself
(McGarty, Yzerbyt, & Spears, 2002). An example of this stereotype application would
be expecting an individual to wear a striped shirt and beret upon hearing that he or she
is French without actually having seen the individual (Normand, 2012). One aspect that
was not explicitly mentioned by Lippmann’s (1922) and Ashmore and Del Boca’s
(1981) definitions is the idea that stereotypes are shared beliefs. Katz and Braly (1933)
SHE SAVED THE WORLD A LOT
16
did research on the spread of certain stereotypes. In 1933, Katz and Braly asked
students of the University of Princeton to assign adjectives, usually depicting
personality or physical characteristics, to different ethnic groups of people. The authors
noticed a high degree of consensus between the participants on which characteristics
matched which group. Here, it is important to note that, contradictory to popular belief
today, not all stereotypes have a negative content. In fact, many stereotypes reflect
positively on a group. Katz and Braly (1933) showed that Americans were seen as
industrious and Germans as science oriented. 20 years later, in 1951, Gilbert set out to
test the persistence of the stereotypes and found that a large proportion of the
stereotypes described by Katz and Braly still held true in the eyes of the new sample.
Both results reinforce the idea that when we talk about stereotypes, we generally talk
about shared stereotypes. Nonetheless, stereotypes only held by a few individuals or
even a single person exist and are generally referred to as individual stereotypes (Zanna
& Olson, 1994). But as most research focuses on the effect of shared stereotypes, we
now ask how stereotypes form and come to be shared by a society. This will be the
focus of the following paragraph.
2.1 Why do stereotypes exist?
We now understand what a stereotype is. The question following this
understanding is why do stereotypes exist. The easiest answer to the above question is
that stereotypes are solely a byproduct of the categorization process, humans’ need to
distinguish (McGarty, Yzerbyt, & Spears, 2002). Categories are used in order to make
sense of the world, meaning that stereotypes are a way of making sense of the world.
During categorization, people learn to see the differences and similarities between and
amongst others. By grouping other individuals together and structuring the world
SHE SAVED THE WORLD A LOT
17
through these categories, people make the world around themselves easier to understand
and thus are able to make sense of it.
A second answer to the question why stereotypes exist is that stereotypes are a
result of our own human incapacities. It is simply impossible to process all stimuli
around oneself. Thus filtering out the information that is useful is of utmost importance
as well as the most adaptive response (McGarty, Yzerbyt, & Spears, 2002). However,
this process is not without its consequences. Not processing all information available
automatically forces us to take on biases that can turn into stereotypes (Allport, 1954). It
is because of these biases that stereotypes often have a bad reputation of being incorrect
and unfair (Schneider, 2005).
To summarize, we can say that stereotypes have two important functions in our
life. Firstly, “stereotypes are aids to explanation“ (McGarty, Yzerbyt, & Spears, 2002,
p. 2) as pointed out by the formation of stereotypes through the categorization process.
Secondly, “stereotypes are energy saving devices“ (McGarty, Yzerbyt, & Spears, 2002,
p. 3) as can be seen by the limited capacity explanation of stereotype formation. Taking
both functions together, we can say that people need stereotypes to guide them in
situations where they are unable to react to the complexity of their surroundings.
Stereotypes help us understand and predict other people’s behavior and thus facilitate
choosing the right reaction to any given situation (McGarty, Yzerbyt, & Spears, 2002).
2.2 How do stereotypes form?
We have already mentioned one important aspect in understanding how
stereotypes form when we talked about why stereotypes exist; the categorization
process. Being able to perceive differences between groups is also an important aspect
when looking at how stereotypes form. The formation of stereotypes is based on the
SHE SAVED THE WORLD A LOT
18
perception of these differences between groups (Brown & Turner, 2002). The
perception of differences between groups in return is based on the belief that these
differences exist and are part of an underlying essence of the group (McGarty, Yzerbyt,
& Spears, 2002).
One way to think of how stereotypes take shape can be summarized in the kernel-
of-truth hypothesis. It is possible that some stereotypes stem from actual differences
between groups that can be detected by other individuals. However, these differences
between groups are subsequently magnified and exaggerated and turned into stereotypes
about the group (Schneider, 2005). An example of a group disproportionally possessing
a certain trait would be the blond hair of Scandinavians. In fact, in some Scandinavian
regions, up to 80% of the population is blond. So while there is some truth to the
statement that all Scandinavians are blond, empirical data show that the stereotype is an
exaggeration of the actual truth and the actual dispersion of the stereotyped trait within
the targeted group. Nonetheless, we see that the content of the stereotype is based on
actual observable differences.
The most discussed theory about how stereotypes form however was formulated
by Hamilton and Gifford in 1976. They argue that for minorities stereotypes form due to
distinctiveness-based illusionary correlations. The theory on distinctiveness-based
illusionary correlations describes the effect the co-occurrence of two relatively
infrequent events has on the perceiver. A minority group member with a distinctive
feature (usually an undesirable feature) is more likely to catch an observer’s attention,
be encoded and thus be more accessible in the future. Hamilton and Gifford (1976) base
their argumentation on how stereotypes form on Tversky and Kahneman’s (1973)
availability heuristic. Something that is more accessible is often falsely perceived as
plentiful and thus the occurrence of a certain characteristic (usually negative) in a
SHE SAVED THE WORLD A LOT
19
minority group is likely to be overestimated (McGarty, Yzerbyt, & Spears, 2002). It is
through this mechanism of overestimation that the distinctiveness-based illusory
correlation is often named as a cause for the negative content of stereotypes as
McGarty, Yzerbyt, and Spears (2002) explain. Negative events are more distinct and
thus often more accessible to individuals who in return overestimate the event’s
occurrence. In a situation where a minority group member behaves negatively, both the
minority group member and the behavior can be seen as relatively infrequent, and thus
catch the perceiver’s attention who will then encode the two events together. At a later
point, due to the accessibility of the encoded events, the perceiver firstly has the false
belief that these two rare events co-occur and secondly overestimate their co-
occurrence. A negative belief about a group is formed.
Before coming to our conclusion, one more mechanism involved with stereotypes
needs to be mentioned. Self-fulfilling prophecies reinforce already existing stereotypes
and thus keep them alive. This is due to the way individuals, often subconsciously,
behave towards members of groups they know stereotypes about (Wheeler & Petty,
2001). If people make assumptions about other outgroups and act according to these
assumptions, it is possible that the outgroup reacts according to the assumption over
time (McGarty, Yzerbyt, & Spears, 2002). In an example, if we expect a group to
behave in a friendly way, we probably act in a more friendly way towards this group
than towards a second group we believe to act aggressively. Our own friendly behavior
towards the first group in return elicits friendly behavior from this group towards us.
Through this cyclic mechanism, stereotypes are strengthened.
SHE SAVED THE WORLD A LOT
20
2.3 Conclusion
We have learned that stereotypes are beliefs about which groups possess which
kind of characteristics. These characteristics can describe the appearance of the people
of a group or the way they behave. We also looked at the reason humans need
stereotypes in order to function, as we as humans are unable to process all information
present in a given situation. Stereotypes are thus also a simplification of the situation
that help us understand and predict other people. Being able to predict other people’s
behavior in return helps us to react appropriately in a given situation. Finally, we looked
at how stereotypes form and concluded that while some stereotypes are based on actual
truths, many are born due to the way humans process information as can be seen in the
distinctiveness-based illusory correlation argument. In the following chapter, we will
use what we have learned about stereotype formation and apply it to a specific
stereotype: women’s inadequacy in the mathematical domain. To do so, we will start by
looking at the historic role of women in the domain of mathematics.
SHE SAVED THE WORLD A LOT
21
3 Females in mathematics
3.1 Introduction
In the last chapter we presented a short overview on how and why stereotypes are
thought to form. We will now apply this knowledge to a specific stereotype, namely
women’s inadequacy in the mathematical domain. The question we ask ourselves is
where this stereotype came from and whether it is based on truth or on illusionary
correlations like we presented in the last chapter on stereotype formation. To answer
these questions, let us first take a look at the historical development of females and
mathematics. We finish by looking at potential consequences this stereotype can cause
as well as the validity of the stereotype itself by considering actual mathematics test
results of men and women.
3.2 Historical beginnings of women in mathematics
It was not until very late in human history that women were allowed into the
academic domain at all as some scholars believed that women using their intellect
would damage their reproductive systems (Campbell & Storo, 1994). In line with that
train of thought, mathematics was depicted as a discipline of the mind. However, as
women were associated with the body, hearth and home (Henrion, 1997), they did not
belong nor had access to the mathematics domain. Because of this belief that women
did not belong to the mathematics domain, women who have made it into the domain
had to overcome more obstacles in academia, as well as face more mistrust towards
their work in general than men did. This slowly started to change in the 19th century.
This time period is marked by the development that women were gradually allowed to
attend university courses and get a higher education (Tokarz, 2001). While at the time
SHE SAVED THE WORLD A LOT
22
women were already allowed to attend a high school, they were not taught in the natural
sciences and only learned basic mathematics. It was believed and openly publicized that
women were less able to understand and perform mathematical logic and thus
expectations for females in the field were low to begin with (Radbruch, 2008). Towards
the end of the century, Sofia Kovelskaja was the first women to be appointed a full
professor for mathematics at the University of Stockholm (Bölling, 2000). Just two
years later, in 1886, Winifred Edgerton Merrill was also awarded a PhD in Mathematics
from the Columbia University in New York City (Kelly & Rozner, 2012). At the turn of
the century, with universities becoming more open to accepting female students, Emmy
Noether studied mathematics at the University of Erlangen in Germany. It is notable
that while there were not many female role models for young girls in the field back
then, today Emmy Noether is regarded as, excuse the irony of language, one of the
forefathers of modern algebra (Radbruch, 2008). However, even with women slowly
gaining ground in mathematics, their largely male environment did not always welcome
them. For instance, their colleague, mathematician Hermann Weyl can be quoted “There
are only two female mathematicians in history: Sofia Kovaleskaja and Emmy Noether.
The first was not a mathematician, the second was not a woman“ (as cited in Cadinu,
Maass, Rosabianca, & Kiesner, 2005, p. 572). Nonetheless, women following Emmy
Noether and others into the field of mathematics eventually led to the founding of the
Association of Women in Mathematical Sciences in 1971.
3.3 Women in mathematics today
Despite these developments of women gaining access to the mathematical
domain, the zeitgeist of the 19th and early 20th century can still be found today in
differential parental and teacher expectations for boys and girls in mathematics (Raley
SHE SAVED THE WORLD A LOT
23
& Bianchi, 2006; Tiedemann, 2000), as well as children’s books (McCabe, Fairchild,
Grauerholz, Pescosolido, & Tope, 2011) and children’s toys (Cherney, Kelly-Vance,
Glover, Ruane, & Ryalls, 2003). In 1990 Mattel introduced a Barbie doll that was able
to talk, saying „Math is hard“ to its main customers, little girls. Similarly, prominent
figures such as former Harvard University President Lawrence Summers openly
admitted to believing the stereotype to be true (Kane & Mertz, 2012). It is therefore not
surprising that girls also show fewer positive attitudes towards mathematics than boys,
are less interested in the subject and place less importance on performing well (Kaiser-
Meßmer, 1993) even up to the present day. Even though there has been a development
from Emmy Noether’s time, there is still a difference in the fields of study chosen by
men and women and the careers following them. In the United States, 43.1% degrees
awarded in mathematics and statistics are awarded to women (National Girls
Collaborative Project, 2016) while 51% of the entire population is female (Kaiser
Family Foundation, 2016). The percentage of degrees awarded to women is put even
more into perspective when looking at the gender ratio at public universities in the
United States of America. In 2012, Forbes Magazine reported that 56.4% of public
university students are female (Borzelleca, 2012). Correspondingly, according to
statistics published by the European Commission in 2012, 40% of mathematics PhD
students are female (38% in Germany). This number drops dramatically moving up the
academic career ladder. The American Mathematical Society reported that around 23%
of postdoctoral fellows and only about 18% of tenured faculty in any kind of
mathematics department in the United States were female in 2005. The picture in
Germany is similar. Around 9% in engineering and almost 10% in the natural sciences
of the tenured faculty were female in 2010 (European Commission, 2012). While more
SHE SAVED THE WORLD A LOT
24
girls are entering university to study mathematics, the field drastically thins out towards
the top.
Nonetheless, the numbers show that there has been a development towards more
women within the mathematical world. But they also show that there is still a potential
bias against women as few women reach the top of the field. This development of more
women entering the mathematics field and succeeding leads us to question the validity
of the stereotype that women are less capable in mathematics. Are there just fewer
women in mathematics at the top because they truly are less able or because they feel
less able? To put it in the words of the previous chapter, is there a kernel of truth to the
belief that women are less adequate in mathematics? To get to the bottom of this, we
will look at two different indicators of female mathematics performance, school marks
and the results of an international standardized test.
3.4 Gender differences in mathematics performance
The reason we need to look at two different indicators of boys’ and girls’
mathematics performance is because of the different aspects of performance they assess.
While school marks are taken in a social context and require endurance and constant
effort by the students, standardized tests are taken without any direct social influence
measuring specialized academic abilities (Voyer & Voyer, 2014). One can argue that
school marks favor girls in a way that qualities needed to obtain higher grades are
typically ascribed to females. It also seems like many boys think of masculinity as
apathy towards authority and academic achievement and thus put less effort into
schoolwork than girls (Organisation for Economic Cooperation and Development,
2015).
SHE SAVED THE WORLD A LOT
25
Nonetheless, looking at the gender difference in school marks can be of interest to
us when investigating the validity of the stereotype against women in mathematics. In
2014, Voyer and Voyer published a meta-analysis of school marks; the first of its kind.
The results were surprising in the way that they did not confirm the stereotype that
women are less capable in mathematics than boys. In fact, girls outperformed boys in
both mathematics and language classes. However, it remains to be seen how much these
results can be attributed to actual ability and how much is due to the social nature of
school marks as explained above. Thus we decided to also look at the results of some
standardized tests.
The Programme for International Student Assessment’s (PISA) results are in line
with the stereotype about boys’ and girls’ mathematics abilities. The PISA evaluation,
done by the Organisation for Economic Cooperation and Development (OECD), tests
the skills and knowledge of 15-year-old students in over 70 countries. In the OECD
report from 2015 on the 2012 PISA results, it was stated that boys outperformed girls in
mathematics in 38 participating countries. On average boys scored 11 points higher than
girls, which equals a higher mathematics standard for boys of about a third of a school
year.
There are a few theories which try to explain these gender differences in
standardized tests. First and foremost, the difference in girls’ and boys’ scores might be
due to innate biological factors enabling boys to perform better when it comes to
mathematics free of social influences like the classroom (Benbow & Stanley, 1980).
This would support the kernel-of-truth hypothesis style of stereotype formation as the
stereotype is based on real life differences. Secondly, researchers suggest a difference in
the scores due to sociocultural factors such as gender stratification within society, often
called the “gender-stratification hypothesis”, or the resulting unequal access to
SHE SAVED THE WORLD A LOT
26
opportunities, which is also called the “gap due to inequality hypothesis” (Kane &
Mertz, 2012; Eccles, 1987). The idea that women cannot perform as well as men due to
unequal access to opportunity in the field would support a formation due to
distinctiveness-based illusory correlations as fewer women were in the field and thus
both being a woman and being a mathematician were distinct events.
Guiso, Monte, Sapienza, and Zingales investigated these two ideas about why
there are gender differences in standardized tests in 2008, using the PISA results to
examine the impact of cultural factors on the gender mathematics gap. Among other
things, they used the Gender Gap Index by the World Economic Forum and a specially
constructed index of cultural attitudes towards women from the World Value Surveys.
Guiso et al. (2008) were able to show a strong correlation between the cultural gender
gap and the mathematics gender gap, where a more equal society had smaller
differences in mathematics scores to the point where girls outperformed boys. It was
also shown that a higher gender equality index was correlated with higher reading
scores of girls relative to boys’ scores, suggesting a general improvement of girls in
more equal societies. Kane and Mertz (2012) support this finding with their study. In
addition to the PISA results, they analyzed the Trends in International Mathematics and
Science Study (TIMSS) results from 2003 and 2007. The TIMSS looks at mathematics
and science achievement. The sample population of the TIMSS includes students of the
4th and 8th grade and data are collected every 4 years in 52 (2007) countries. In their
study, Kane and Mertz (2012) tested the different approaches explaining the gender
difference against each other. Using similar proxies for gender equality as Guiso et al.
(2008), their results also showed that the biological factor cannot explain the data.
Instead, sociocultural factors, such as access to resources and expectations, largely
determined the mathematics performance of boys and girls.
SHE SAVED THE WORLD A LOT
27
3.5 Conclusion
In this chapter we looked at the difficulty women had getting their foot into the
mathematics domain and the mostly positive development that has occurred since then.
Nonetheless there are still gender differences when it comes to the expectations parents
have of their children (Raley & Bianchi, 2006; Tiedemann, 2000), children’s attitudes
towards mathematics (Kaiser-Meßmer, 1993), and their chosen career paths (European
Commission, 2012). We looked at performance data to investigate whether the
underrepresentation of women in the mathematics domain is due to biological factors or
whether it can be explained by other factors such as women’s opportunities in the
mathematical domain. The results led us to conclude that the underrepresentation does
most likely not rest upon biological factors but rather people’s opinions and the
connected structural obstacles. These opinions and obstacles, as presented at the
beginning of the chapter, include the idea that “real women don’t do math“ (Campbell
& Storo, 1994, p. 4). This stereotype is obviously reinforced by the lack of women in
the domain and by girls’ negative attitudes towards mathematics as well as women’s
perceived distinctive role in mathematics. As we pointed out in the last chapter on
stereotypes, however, stereotypes are also a guideline on how to think and act which
means not only is this stereotype reinforced by these actions, it also reinforces the
actions in a vicious circle. The question now is how this occurs. This will be the topic of
the following chapter.
SHE SAVED THE WORLD A LOT
28
4 The theory of stereotype threat
4.1 Introduction
In the last chapter we concluded that the stereotype that women are poor at
mathematics is largely self-reinforced. Steele and Aronson formulated one of the
theories explaining how the self-reinforcement works, in 1995. To date, their theory of
stereotype threat has become a widely cited theory in recent psychology with over 5000
references just to its first publication. In this chapter we will get a deeper understanding
of the stereotype threat theory by looking at its different components, the supposed
mechanisms behind it and the consequences. We will close by looking at the different
moderators of stereotype threat and how we can use these moderators to reduce the
effects of stereotype threat.
4.2 Definition and components
In the last chapter we looked at the lack of women in mathematical careers and
came to the conclusion that external forces, such as negative stereotypes about women’s
ability in mathematics, play an important role in the phenomenon why there are fewer
women than men in the domain. The theory of stereotype threat takes a step back and
describes how such a stereotype can impact performance and attitudes and in turn lead
to female disengagement within the domain. The disengagement from the domain and
the resulting lack of women in return reinforces the stereotypes; firstly, because the
reason for the unequal distribution of genders within the mathematics domain is unclear
to the outside world and secondly, because being a female mathematician is seen as two
distinct events.
SHE SAVED THE WORLD A LOT
29
Let us introduce the theory of stereotype threat with an example of a group other
than women. Traditionally there have been a lot of negative stereotypes about African
Americans, many of them revolving around their intellectual abilities (Steele, Spencer
& Aronson, 2002). Along those lines, Steele (1992) showed significant gaps in school
achievement between European and African Americans at all levels of schooling.
However, this gap, similar to the ones females experience in mathematics in comparison
to males, is not due to differences in intellect as Jensen (1980) was able to demonstrate.
Jensen (1980) showed that European and African Americans with identical Scholastic
Aptitude Test (SAT) scores at the beginning of university showed differences in
subsequent achievement. This difference went in favor of European Americans who
outperformed African Americans (Jensen, 1980). In 1995 Steele and Aronson explained
this phenomenon of the emerging gap by taking social psychological factors into
account. They blame threats arising in situations where a negative stereotype about
one’s group can be confirmed or disconfirmed as the cause of the performance gap.
Their resulting theory of stereotype threat can be defined as follows:
“When a negative stereotype about a group that one is part of becomes personally
relevant, usually as an interpretation of one’s behavior or an experience one is having,
stereotype threat is the resulting sense that one can be judged or treated in terms of the
stereotype or that one might do something that would inadvertently confirm it.“ (Steele,
Spencer, & Aronson, 2002, p. 389)
The theory explains why people belonging to negatively stereotyped groups
underperform in specific situations, such as academic tests for African Americans or
mathematics tests for women. Aronson and Steele (1995) clarify that the extra burden
SHE SAVED THE WORLD A LOT
30
added by the threat interferes with performance, predicting lower performance in
comparison to what the individual could have achieved and students who do not have to
deal with threat.
Before coming to explain the mechanism behind the threat effects, we need to
look at three conditions necessary for people to experience stereotype threat. Firstly,
people need to be aware of different social categories and have developed the ability to
differentiate between these. This point ties in nicely with the second, as it is not solely
the awareness of different social categories that is necessary for stereotype threat
situations to occur but one also needs to be able to categorize oneself as part of one of
the categories. As Martin and Ruble (2010) point out, these conditions help us
understand why we usually do not find threat effects in children younger than 4. The
last condition, stereotype awareness, develops even later between the ages of 5 and 7
(Galdi, Cadinu, & Tomasetto, 2014). Stereotype awareness is the knowledge that one’s
own group is negatively viewed in relation to a certain ability. Personal beliefs about the
association of social categories and certain abilities and behaviors do not play a role
here. So stereotype awareness stands for knowing that others hold these beliefs. This
differentiation makes sense when we reflect on the original definition of stereotype
threat where threat denotes the fear of being judged by others.
The sole presence of these three conditions does not automatically elicit
stereotype threat effects either. Therefore we will now look at what factors need to be
present in the situation in order for threat effects to occur. Taken from the definition, the
most important factor is the stereotype salience. One does not simply need to know the
stereotype but one needs to be aware that it is applicable to the current situation. In
short, the stereotype is a possible interpretation of one’s behavior. However, again it is
not necessary for the individual to believe or even endorse the stereotype him or herself
SHE SAVED THE WORLD A LOT
31
(Steele, 2002). This awareness of the applicability of the negative stereotype is often
introduced into the situation in an unconscious, subtle manner. It can be done, for
example, by solely stating the nature of the task (Steele & Aronson, 1995). Females
knowing they are going to do a mathematics task or African Americans taking a test
diagnostic of their abilities may be affected by stereotype threat if they do not possess
any characteristics to buffer the effect.
Knowing the stereotype is one factor that can elicit stereotype threat. Situations
that render one’s own group identity salient can also cause threat effects to occur. The
activation of one’s group membership could in turn then activate stereotypes about
one’s group and thus hinder performance. Making group membership salient is actually
a frequent occurrence in test situations as it is done by solely asking individuals to
indicate their race or gender.
These two factors, salience of stereotype applicability and salience of group
membership, are the basis for manipulations generally used to induce stereotype threat
effects which we dedicate a chapter to later on. But it is important to note that most
studies about stereotype threat make comparisons between participants and not within
participants, meaning that part of the sample is put in a threat situation while the other
half of the sample does not experience threat effects.
There are two more factors we need to talk about that do not elicit stereotype
threat but are important once the negative stereotype has been made salient.
Identification with the stereotyped domain and thus being motivated to eliminate the
stereotype (Smith, 2004) is one of those factors. Individuals who value the domain and
use it to measure their own self-worth are susceptible while individuals who do not care
about the domain are not, as they do not need to perform well to feel positively about
themselves. Lastly, group identification is often named as an important factor for threat
SHE SAVED THE WORLD A LOT
32
effects to occur (Shapiro & Neuberg, 2007). However, the necessity of this condition
seems to not always hold true as people belonging to groups they are unlikely to
identify with have also exhibited stereotype threat effects. It is for this reason that
Shapiro and Neuberg (2007) proposed to distinguish between different kinds of threats
to solve the conundrum. They differentiate between six different types of threat
dependent on the source and target of the threat. The source of the threat can come from
oneself, one’s own ingroup or the outgroup. The target of the threat can also be the self
or one’s own ingroup. To return to the question of the necessity of group identification,
according to Shapiro and Neuberg, identification with the group is only important if the
group is the target of the threat, not if it is the self. Thus in comparison to Steele and
Aronson (1995) who describe stereotype threat as the fear of being judged by others,
Shapiro and Neuberg (2007) say threat can also come from within the individuals
themselves.
Until now we have only spoken of threat effects on academic performance.
However, the scope of the theory goes much further and predicts performance
decrements for all individuals who find themselves in a threatening situation, such as
athletes. Stone, Lynch, Sjomeling and Darley (1999) for example showed that African
and European Americans differed in their golf ability when the task was framed as
showing natural athletic ability, a feature African Americans are stereotyped to possess.
We now know the conditions that produce stereotype threat. Let us now look at
the mechanisms behind it before looking at the research on moderators of stereotype
threat that can alleviate the effect.
SHE SAVED THE WORLD A LOT
33
4.3 Mechanisms
As we will see, while the necessary conditions as well as the consequences of
stereotype threat effects are quite well understood, the mechanisms behind them leave
more room for interpretation. There is nonetheless a cornucopia of ideas and potential
underlying mechanisms. As Aronson and Steele (1995) said, stereotype threat produces
extra pressure which targeted individuals have to deal with. Below we see a list of
mechanisms that explain how this pressure affects performance. Pennington, Heim,
Levy, and Larkin (2016) organized and reviewed the stereotype threat mechanism
literature for better understanding. In their review, they differentiate between three
categories of mediators; cognitive, affective and motivational mediators. In this
subchapter we will give a brief introduction to the most important mediators.
4.3.1 Cognitive mechanism
The most comprehensive explanation of stereotype threat effects, and potentially
also the most researched of all, was given by Schmader and Johns in 2003. They argue
that stereotype threat especially affects people on tasks that rely on the working
memory. The working memory is needed in situations that require effortful processing
and concentration. However, stereotype threat situations lead individuals’ working
memory to be depleted by having to control and suppress emotions or through
heightened monitoring caused by the threat. Heightened monitoring is often the result of
a prevention focus which can be induced by threat situations (Seibt & Förster, 2004).
Due to the depletion of cognitive resources through such processes as monitoring, the
individual no longer is able to use the cognitive resources to solve the actual task at
hand. Schmader and Johns’ (2003) model finds much support in research, especially
SHE SAVED THE WORLD A LOT
34
because threat effects usually occur in tasks at the limit of an individual’s capabilities
(Spencer, Logel, & Davies, 2016).
4.3.2 Affective mechanisms
Affective mechanisms include, among other things, variables such as anxiety and
arousal. We will now shortly explain the line of thought behind each variable as well as
look at their effectiveness in explaining the stereotype threat effect.
Physiological arousal, defined as heightened activity in the sympathetic nervous
system, leads to a number of reactions, for example, an increased heart rate or sweating.
O’Brien and Crandall (2003) connected arousal and stereotype threat effects and
explained it in the following way: in general it can be said that arousal energizes a
person. However, this energization occurs in a non-directive way. This non-directed
energy favors dominant responses to a situation. Unfortunately, in a stereotype threat
situation, where the task is difficult, failure is the dominant response which causes
people to perform worse than their own potential.
Anxiety is another one of the variables that could answer how stereotype threat
effects reduce performance. The threat in the air elicits higher levels of anxiety within a
person. In return, anxiety hinders individuals from performing to the best of their
abilities as worrying thoughts distract and inhibit performance (Osborne, 2001; Steele &
Aronson, 1995; Spencer, Steele, Quinn, 1999). Additionally, anxiety has also been
shown to act as a moderator in combination with a low academic self-concept, as those
individuals with a low academic self-concept tend to worry more about their
performance (Pennington et al., 2016).
SHE SAVED THE WORLD A LOT
35
4.3.3 Motivational mechanisms
Motivational mediators include variables such as self-handicapping, reduced and
increased effort and lowered performance expectations. In the following paragraph we
will look at the role these variables play in understanding stereotype threat effects.
Self-handicapping can be understood as active strategies to create alternative
explanations of lower performance. In stereotype threat situations these strategies can
be reduced effort or less attention to the task. The more self-handicapping strategies are
used as a result of the threat, the greater the negative effect on performance (Keller,
2002).
When looking at the role of effort one needs to differentiate between two possible
effects stereotype threat can have on it. The first, reduced effort, can be understood as a
measure of self-handicapping as explained above. However, stereotype threat might also
cause an individual to increase his efforts in order to disprove the stereotype.
Unfortunately, increased effort does not directly result in a better outcome in this
specific situation. The effect is dependent on task demands. Tasks that are highly
proceduralized are harmed by an increased focus on the task (Beilock, Jellison, Rydell,
McConnell, & Carr, 2006) as was for example shown with golf players whose skills are
highly proceduralized (Stone et al., 1999). In this study, the negative effect of more
effort can also be explained by Zajonc’s (1965) drive theory which posits that the
motivation to disconfirm the stereotype often leads individuals to choose the dominant
response. However, as already mentioned in the paragraph on arousal, the dominant
response is often failure with regard to difficult tasks that also elicit stereotype threat
effects (Spencer, Logel, & Davies, 2016).
Lowered performance expectations as a result of the threat can lead people to
underperform as confidence is low and thus performance quality is undermined as
SHE SAVED THE WORLD A LOT
36
people try less (Cadinu, Maass, Frigerio, Impagliazzo, & Latinotti, 2003). Studies have
supported this hypothesis and shown that the strongest mediation among people
strongly identified with the domain. It is important to note that the mediation of low
performance expectations is especially linked to the group-as-target threats as outlined
by Shapiro and Neuberg (2007).
4.4 Moderators
Next to understanding how stereotype threat effects occur, it is also interesting to
look at who is especially susceptible to the effects. Stereotype threat moderators can be
divided into individual and situational factors. Thus the individuals themselves might
possess traits causing them to be more affected but there are also situational factors that
make stereotype threat effects more likely to occur. In this subchapter we will discuss
different individual and situational factors.
4.4.1 Individual factors
When talking about individual factors that moderate stereotype threat effects, one
needs to once again distinguish between two types of factors. Firstly, individual factors
that moderate the extent to which people are motivated to perform well and secondly,
their ability to cope with the added pressure (Spencer, Logel, & Davies, 2016).
Looking at factors that influence people’s motivation to do well, domain and
group identification are on top of the list. Therefore it is not surprising that the strength
of the identification is a moderator of threat effects. Individuals that value high
achievement in a given domain are more likely to be affected than individuals who put
less importance on the given domain (Aronson, Lustina, Good, Keough, Steele, &
Brown, 1999; Cadinu et al., 2003). Similarly, people who identify highly with their
SHE SAVED THE WORLD A LOT
37
group are more affected by threat effects. Their motivation to disconfirm the stereotype
is higher as the stigmatized identity is important to their self-concept and thus a good
performance feeds into a positive self-view (Marx, Stapel, & Muller, 2005; Schmader,
2002). Individuals who score high in stigma consciousness, chronically being aware of
one’s stigmatized status, are also more likely to fall prey to stereotype threat situations
as even subtle cues can activate the negative stereotype and the corresponding
stigmatized status (Brown & Pinel, 2003).
Factors that influence people’s ability to cope in threat situations include an
internal locus of control or low coping sense of humor. People with an internal locus of
control are more likely to attribute performance outcomes to themselves than external
factors. Thus repeated stereotype threat situations can increase their susceptibility to the
effect through lower performance expectations or more self-handicapping as a response
(Cadinu, Maass, Lombardo, & Frigerio, 2006). Humor is a buffer against stressful
situations by creating more positive appraisals of it. Correlational work has shown a
relationship between sense of humor and less underperformance in threat situations
(Ford, Ferguson, Brooks, & Hagadone, 2004).
4.4.2 Situational factors
Whether people are more susceptible to stereotype threat or not can also be
influenced by the situation they find themselves in. Subtle social cues can be enough to
render a negative stereotype salient. Social cues for example can include the room
decoration. Whether a room is inviting to all groups or favors one over the other can
elicit feelings of threat in stigmatized group members. A gendered example would
include a room decorated with typical male memorabilia, such as pictures of cars,
soccer or Star Trek (Cheyran, Plaut, Davies, & Steele, 2009; Oswald & Harvey, 2000).
SHE SAVED THE WORLD A LOT
38
Not feeling welcome in a certain environment might increase the pressure the
knowledge of a negative stereotype elicits already and make those individuals even
more susceptible to threat effects. Additionally, the group an individual finds him or
herself in plays an important role whether the situation elicits threat effects (Inzlicht &
Ben-Zeev, 2000). For instance, being a token can leave one’s own group membership
very salient whereas an equally mixed group does less so (Kessels & Hannover, 2008).
Being aware of one’s own group membership also heightens the awareness of the
possible applicability of negative stereotypes to oneself as well as the possibility of
being judged according to the stereotypes. Lastly, stereotype threat effect are moderated
by task difficulty. Spencer, Steele, and Quinn (1999) were able to show that women
only underperformed on mathematics tests that were sufficiently difficult and required
effort and concentration.
4.5 Consequences
The most straightforward consequence of stereotype threat effects is the
underperformance in the given domain. This ties in nicely with our starting point of
stereotype formation. We started the discussion about stereotype threat as a result of
looking at the difference between male and female mathematics performance on
standardized tests. Stereotype threat is one theory that can explain why this gap exists
and under what circumstances it appears and could disappear. The SAT mathematics
scores showed a significant difference in female and male scores that could partially be
explained by external factors such as gender equality in society. Now that we know of
threat effects, let us look at how much these effects explain. Walton, Spencer, and
Erman (2013) estimated how many percent of the gender gap on SAT scores could be
explained by threat effects, comparing groups that either were put in a threat condition
SHE SAVED THE WORLD A LOT
39
or in a neutral condition. They concluded, depending on the assumed effect size of
threat, between 57% (with a smaller effect size of d = .15) and 94% (with a slightly
larger effect size of d = .25) of the gender gap could be explained by threat. Stereotype
threat cannot solely be used to explain the performance gap between men and women in
mathematics. In fact, underperformance is reported across many different negatively
targeted groups like African Americans, Turkish Germans, or Latino Americans to name
a few (Walton & Cohen, 2003). In this subchapter we want to discuss the consequences
the underperformance brings for the individual and society itself apart from
underperformance on a single test.
One consequence of underperformance is disengagement from one’s own identity
as well as the domain. Disengagement from the group, no longer seeing the group as a
valuable addition to the self-concept, can hurt one’s sense of belonging. Uncertainty of
belonging has further been demonstrated to be associated with health concerns as social
ties are important for human well-being (Baumeister & Leary, 1995; Walton & Cohen,
2011)
Disengagement from the domain can be understood as no longer seeing the
domain as important when evaluating oneself, meaning individuals are no longer
motivated to perform well in the given domain. Disengagement from the domain occurs
through several channels. Firstly, internal attribution of failure leads people to believe
that underperformance is solely due to their lack of capabilities and not external
influences (Koch, Müller, & Sieverding, 2008). Secondly, an individual who has
experienced threat and resulting underperformance often uses a mechanism which in
return reinforces threat effects again, such as self-handicapping. One means of self-
handicapping is discounting the validity of the task (Lesko & Corpus, 2006) as well as
the importance of the domain (von Hippel, von Hippel, Conway, Preacher, Schooler, &
SHE SAVED THE WORLD A LOT
40
Radvansky, 2005) and thus not needing to put effort into performing well. People that
are used to being stigmatized in a certain domain are also more sensitive to any clue
signaling they are not welcome. A reduced sense of belonging goes hand in hand with
less motivation and more importantly reduced commitment to the field (Murphy, Steele,
& Gross, 2007).
Disengagement from a given domain in return brings about new consequences.
First and foremost, it is associated with changed professional identities and career
aspirations (Gupta & Bhawe, 2007; Steele, James, & Barnett, 2002). Individuals who
disengage from a domain are unlikely to ever reach their full potential and are filtered
out of the system early on. Additionally, individuals who stay motivated but believe
they do not perform well in a given domain are unlikely to choose a corresponding
career, even if their underperformance can be explained by looking at external factors.
Looking back at the previous chapter, we can now point out stereotype threat as one
potential explanation why fewer women work in mathematical careers. Besides the
negative effect for society which needs qualified individuals, having few members of
one’s own group in a certain profession can also leave a negative and uninviting
impression for young people deciding on their career path. They cannot identify
whether the lack of their ingroup in the profession is due to external factors or due to
lack of abilities of their group in the domain. Both factors in return reinforce stereotypes
about abilities and thus threat effects as explained in the chapter on stereotype
formation.
The troubling aspect of the stereotype threat effects is the fact that many of the
consequences in return reinforce the stereotype that has caused the issues to begin with.
Targeted groups assumed to underperform, underperforming due to being targeted is
similar to a perpetual motion machine. A second complication is the fact that individuals
SHE SAVED THE WORLD A LOT
41
do not need to agree themselves with the stereotype in order for it to have negative
consequences. Both these circumstances make it very difficult to break the vicious
circle. How to go about reducing the impact of stereotype threat is a vital question we
will address in the next subchapter.
4.6 Interventions
The consequences of stereotype threat, such as disengagement from the domain,
have a negative impact on the individual as well as on society as discussed above.
Additionally, we argued that the consequences of stereotype threat are self-reinforcing.
Therefore it is important to now examine what can be done against threat effects. Much
research has gone into answering this question and its results can be divided into
different approaches that are the topic of this subchapter.
In the subchapter on moderators we distinguished between individual factors and
situational factors that promote the perception of stereotype threat effects. A similar
distinction can be made here for interventions. There are two types of interventions;
interventions that address the way individuals think and feel, called psychological
interventions, and secondly interventions that address the environment individuals find
themselves in, called structural interventions (Cohen, Purdie-Vaughns, & Garcia, 2012).
We will therefore present interventions along the lines of these two categories.
4.6.1 Psychological Interventions
Interventions aiming to reduce the psychological threats include de-emphasizing
the targeted identity, self-affirming one’s identity, attributional retraining and shaping
theories of intelligence. Let us now look how these interventions work.
SHE SAVED THE WORLD A LOT
42
Stereotype threat effects occur when one is aware of one’s targeted identity. By
de-emphasizing the threatened identity these effects can be reduced. Individuals never
define themselves by one single identity, thus making them less aware of the threatened
identity and instead getting them to see themselves in the light of other identities they
possess lessens threat effects. Examples are given by Rosenthal and Crisp (2006) who
emphasized participants’ identity as college students instead of their identity as women,
or Ambady, Paik, Steele, Owen-Smith, & Mitchell (2004) who asked participants to
think about their other valued and unique characteristics. Finally, a simple act such as
measuring demographic data at the end of standardized tests can decrease the gap
between different groups’ test scores, as asking before the test renders group
membership and associated stereotypes salient (Stricker & Ward, 2004).
Self-affirming one’s own identity also helps to guard individuals against stereotype
threat. Individuals who think about their other characteristics and skills outside of test
performance are less affected (Schimel, Arndt, Banko, & Cook, 2004). Knowing one’s
worth outside of the test performance domain reduces the fear associated with it.
African Americans that self-affirmed performed better throughout a college class in
comparison to those that did not. Additionally, they also showed less automatic
accessibility of racial stereotypes (Cohen, Garcia, Apfel, & Master, 2006).
Threat effects are amplified if over time people attribute failures to themselves
instead of external factors. Giving individuals an external factor to attribute possible
failure to reduced threat effects as they no longer had to fear confirming the stereotype
based on their individual performance. Ben-Zeev, Fein and Inzlicht (2005) told half of
their participants that they were going to be exposed to a subliminal noise generator
potentially increasing arousal and anxiety. Thus anxiety experienced due to threat could
be attributed externally instead of to nervousness about the test. Test performance was
SHE SAVED THE WORLD A LOT
43
no longer a measure of confirming or disconfirming a stereotype but a measure of
anxiety due to the subliminal noise generator. Another easy way to reduce threat effects
is by educating people about these potential effects (Johns, Schmader, & Martens,
2005). Knowing there is a reason for underperformance gives individuals the chance to
not attribute it internally but to the stereotype. This can also reduce self-reinforcing
consequences of stereotype threat as mentioned previously.
Research has also focused on the effect of intelligence theories in stereotype
threat situations. One can differentiate between people who believe their intelligence to
be a fixed object that cannot grow over time and people who believe intelligence to be
malleable. The consequence of believing intelligence to be fixed, also called an entity
theory about intelligence, is that for these individuals performance is a direct measure of
their real abilities (Dweck & Leggett, 1988). Being in a stereotype threat situation and
believing intelligence to be fixed might amplify the threat experienced as it is more
important to perform well for one’s own self-worth. People with an incremental view of
intelligence, meaning they see intelligence as malleable and believe one can improve
over time, on the other hand might be protected against these effects. Sawyer and
Hollis-Sawyer (2005) tested this by tapping into individuals’ chronic belief about the
malleability of intelligence. They found that participants who believed in the
malleability of intelligence experienced less stereotype threat effects. Other research has
shown that solely educating people on the malleability of intelligence can already buffer
against threat effects (Aronson, Fried, & Good, 2002).
One more way of reducing the chance of individuals disengaging from the domain
due to threat effects is by affirming their belonging within the domain. Letting targeted
group members know that although the task is difficult they have the capabilities to do
SHE SAVED THE WORLD A LOT
44
well increases motivation and domain identification in participants as they do not fear
being judged based on the stereotype (Cohen, Steele, & Ross, 1999).
4.6.2 Structural Interventions
Affirming domain belonging can be seen as one interface between psychological
and structural interventions against stereotype threat. As mentioned above,
psychologically, we can let people know they are capable of succeeding within a given
domain. Structurally, we can make people feel like they belong within a certain domain
by representing groups equally (Inzlicht & Ben-Zeev, 2000). Inzlicht and Ben-Zeev
(2000) investigated whether threat for women was higher in dominantly male groups in
comparison to all female groups. The authors found that threat grew proportionally to
the number of males present. Thus, ensuring a balanced group composition is something
that can be done to change the structure of people’s environment.
A second strategy falling under the category of structural interventions is the
creation of equal opportunities in the environment for members of all groups by
reframing the task as not threatening or indifferent to identity. In their original study of
stereotype threat effects Steele and Aronson (1995) manipulated the diagnosticity of the
test for African Americans. Those participants who were told the test was diagnostic of
their abilities and thus threatening to their targeted identity experienced threat effects,
while those participants who were not told that the test they were taking was diagnostic
did not experience threat effects. Similarly there was no difference between males and
females on a mathematics test if participants were told the test was gender fair (Quinn &
Spencer, 2001).
To sum up, it needs to be mentioned that there are two problems with the
interventions referred to above. Firstly, we can see that there are far more psychological
SHE SAVED THE WORLD A LOT
45
interventions than structural ones. And secondly, interventions can usually be labeled
exclusively as psychological or structural. However, Cohen, Purdie-Vaughns and Garcia
(2012) rightly say that while many psychological interventions improve performance
under the right conditions, the interventions can fail if they are not linked to structural
changes as well.
4.7 Conclusion
At the end of this chapter, we can summarize that stereotype threat effects occur
when people are exposed to situations in which they can either confirm or disconfirm a
negative stereotype about their own group. The consequence of this situation is
underperformance of the individual in the given domain. Underperformance is caused
by threat effects that can be elicited from mere social cues up to direct instruction. There
are several channels through which the threat works. These mechanisms are either of
cognitive, affective or motivational nature, depending on the task to be accomplished.
Some people are more adept and less susceptible to stereotype threat situations which
can be seen in the different moderators. The knowledge of these moderators has often
been used to create psychological or structural interventions against stereotype threat
and the connected large-scale consequences. In the end, we agree with Cohen, Purdie-
Vaughns and Garcia (2012) on the need to blend psychological and structural
interventions to best combat stereotype threat effects.
In the previous chapter, we talked about the lack of female representation in the
mathematics domain. In this chapter, we pointed out that one of the consequences of
stereotype threat is disengagement from the domain and therefore unbalanced
representation of groups within a domain. We made the connection between stereotype
threat and female representation in the introduction of the chapter and would like to

SHE SAVED THE WORLD A LOT
46
strengthen this link at the end of the chapter. With the consequences and the status quo
of women in mathematics in mind, we set out to explore a new kind of intervention for
stereotype threat effects that includes aspects of both, psychological and structural,
interventions. The path to this intervention is the topic of the following chapter.
SHE SAVED THE WORLD A LOT
47
5 Counterstereotypes as an intervention to stereotype threat
5.1 Introduction
As was shown by the review in the previous chapter, there is already an
abundance of research on stereotype threat and its interventions. In this chapter we will
discuss one more area of interventions in greater detail: counterstereotypes. We start by
explaining why we chose counterstereotypes, the hopes attached to the field, their
definition as well as reviewing research already conducted on them. At the end of the
chapter we will better understand susceptibility to stereotype threat effects as well as
open questions the research leaves for us to answer.
5.2 Why counterstereotypes?
Stereotype threat has been greatly researched since the first publication appearing
in 1995 introduced and addressed the theory. In order to contribute something new to
the field, it is therefore important to look for inspiration in one’s surroundings. The idea
for this work came from my adolescence; more specifically from Joss Whedon’s (1997)
television series “Buffy - the Vampire Slayer”. The show centers on Buffy Anne
Summers, a young women who is destined to fight the evils of the world, namely
vampires and demons, as well as the occasional insane and evil human being. What
struck me as a teenager though was the fact that Buffy was a strong woman, physically
and mentally. She was different from other female characters and different from what
women were expected to be, especially in television shows. I always felt like the
character of Buffy played an important role in how I lived my life which later made me
contemplate the role of counterstereotypes in general. It was not seldom that I heard my
friends wonder about the person I would have become without the influence of Buffy. In
SHE SAVED THE WORLD A LOT
48
a similar way to how I reacted to and learned from Buffy the Vampire Slayer, children
nowadays use television to learn and form opinions as proposed by the cultivation
theory (Gerbner, Gross, Morgan, & Signorielli, 1980) or Bandura’s Social Learning
Theory (1977). The effect television shows can have on children is even augmented
when they specifically choose to watch a program (Greenberg, 1988). This train of
thought about the effect counterstereotypes had on me developed into my research
interest in counterstereotypes and the benefits we can gain from them.
Counterstereotypes are especially interesting as we can investigate their psychological
effects on people, but as we see with television shows such as Buffy - the Vampire
Slayer, they also affect the representation of groups in society, hence, they have a
structural impact. Thus, counterstereotypes are a promising area of interventions using
the psychological and structural pathways to ameliorate the situation for negatively
stereotyped groups. Before looking at other examples of counterstereotypic television
characters, we need to define what counts as a counterstereotype.
5.3 Counterstereotypes and stereotype threat
5.3.1 Definition
Aubrey and Harrison (2004) say that when talking about counterstereotypes we
“mean the opposite, behaviors and personality traits that buck contemporary norms“
(p. 116). In an earlier chapter we talked about what stereotypes are: beliefs about
another group’s characteristics. Counterstereotypes reverse these beliefs. Stereotypically
we portray men as leaders and women as followers. A counterstereotypic portrayal, as in
the case of Buffy the Vampire Slayer, depicts the woman as the leader and the man as
the follower (Aubrey & Harrison, 2004). A second example can play on the stereotyped
SHE SAVED THE WORLD A LOT
49
Asian superiority in mathematics (D’Ailly, 1992). A counterstereotype would be an
Asian failing a mathematics test.
There are two aspects that need to be noted. Firstly, in comparison to stereotypes,
counterstereotypes do not need to be shared as they are simply the reversal of the
usually shared belief. Secondly, whereas stereotypes are beliefs about all members of a
group, counterstereotypes describe individuals who possess the opposite trait from what
is usually associated with their group as can be seen in the examples. A subcategory of
counterstereotypes is a counterstereotypic role model. Role models serve as idols to
others by being exceptional in a certain domain. Counterstereotypic role models are
exemplars in domains that are stereotypically not associated with their group. This
includes female mathematics professors or very talented male nurses.
5.4 Research
5.4.1 Introduction
The following subchapters will summarize and review the research on
counterstereotypes in general and counterstereotypes and stereotype threat. In addition
to Buffy the Vampire Slayer, there are a couple of other television programs with
counterstereotypic depictions, such as the Cosby Show (Weinberger, Cosby, & Zagor,
1964) or Ellen (Marlens, Black, & Rosenthal, 1994). Naturally, there are far fewer
counterstereotypic depictions than stereotypic portrayals in television shows
(Nathanson, Wilson, McGee, & Sebastian, 2002), so to have a larger pool of
counterstereotypic depictions to choose from, we decided to also look at research on
television commercials. Geis, Brown, Jennings and Porter (1984) found that
commercials that broke female stereotypes raised achievement aspirations in girls
whereas sexist advertisements dampened women’s aspirations. 24 years later, Yoder,
SHE SAVED THE WORLD A LOT
50
Christopher, and Holmes (2008) were not able to replicate this effect. At first glance,
their results showed a positive development as women were no longer negatively
influenced by sexist commercials. However, Yoder, Christopher, and Holmes (2008)
assume sexist advertisements had become so customary that they no longer had neither
negative nor positive effects on the participants immediately after exposure.
Geis et al. (1984) showed that commercials, which are a medium to change the
representation of individuals of negatively stereotyped groups and thus change the
structure of the environment the individuals find themselves in, can have a positive
impact. To see whether this positive impact also translates into stereotype threat
situations, we will give two examples of structural interventions for stereotype threat
focusing on counterstereotypes in the following subchapter.
5.4.2 Counterstereotypic depictions on stereotype threat
The aspect that interests us the most is the impact of counterstereotypes on
stereotype threat situations. We will start by looking at the studies using more general
counterstereotypes that change the representation of women, or in other words the
structure around individuals, instead of at specific role models. One first structural
intervention was presented by Davies, Spencer, Quinn and Gehardstein. (2002) using
counterstereotypes and stereotype threat in the realm of television commercials. The
authors examined the effect of television commercials on stereotype threat. In their
study, they exposed participants to either gender-stereotypic or counterstereotypic
television commercials before asking them to perform on a mathematics task. The
commercials did not include the mathematical domain or allude to career aspirations.
Instead the commercials either depicted women in stereotypic or counterstereotypic
everyday situations. Davies et al.’s (2002) results show that only women who were
SHE SAVED THE WORLD A LOT
51
previously exposed to gender-stereotypic commercials underperformed relative to the
male sample on a mathematics test. Those women who watched counterstereotypic
commercials performed equally well as male participants. Furthermore, Davies et al.
(2002) were able to replicate Geis et al.’s (1984) study by showing that the women in
the genderstereotypic commercial condition had fewer achievement aspirations than
women in the counterstereotypic commercial condition. The authors also showed that
the effect was driven by the genderstereotypic commercials. Through heightened
stereotype activation, the genderstereotypic commercials induced threat in the
participants while counterstereotypic commercials did not induce threat.
Good, Woodzicka and Wingfield (2010) also used a structural intervention using
counterstereotypic textbook images for school children. To begin with, the authors
examined American science textbooks and firstly found that for every woman there
were four men mentioned. In fact, males embodied 85% of the occupations portrayed in
science books. Similar to Davies et al. (2002), Good, Woodzicka and Wingfield (2010)
randomly exposed students to textbooks with images of either stereotypic, namely male
scientists, or counterstereotypic images, namely female scientists. In the end, female
students in the counterstereotypic image condition showed greater comprehension of the
science lessons in the textbook than those female students in the stereotypic image
condition. However, the authors did not look at the mediator of this effect.
To summarize, in the study performed by Davies et al. (2002) the
genderstereotypic condition was the driving force behind the threat effect due to
heightened stereotype activation but nothing was said about the effect of the
counterstereotypic condition. The study performed by Good, Woodzicka and Wingfield
(2010) points in a similar direction as they also compared a stereotypic with a
counterstereotypic condition without the use of a control group as a baseline. The
SHE SAVED THE WORLD A LOT
52
authors only show counterstereotypic depictions to be better than stereotypic ones.
Additionally, in the second study presented by Good, Woodzicka and Wingfield (2010),
the mediation of the condition to threatening effects was not measured. Despite these
problems, these two studies are a good example of how structural changes can be made
using counterstereotypes. Changing the representation of women in science textbooks or
in television commercials had a positive effect on the female study participants and can
more easily be implemented at a larger scale. What the two studies do not tell us is how
these kind of counterstereotypes work. Another question that was left unanswered is
whether there are certain conditions needed for counterstereotypes to work. Huguet and
Regner (2009) show why this is important to know. Their results point in a different
direction than Davies et al. (2002) and Good, Woodzicka and Wingfield (2010). The
authors found that counterstereotypic mathematics beliefs do not protect girls under
threat. In the experiment participants were asked about their beliefs about the two
genders’ mathematics abilities before performing on a mathematical test. They found
that even participants who held counterstereotypic beliefs about girls’ mathematics
abilities were affected by the stereotype threat induction. They explain their finding by
stating that general stereotypes often prevail over personal beliefs and thus
counterstereotypic beliefs cannot protect from threat effects. Their explanation once
again points to the importance of structural interventions as we also need to change the
general perception of a group. The study also shows that not all types of
counterstereotypes are useful in reducing threat. Therefore we will now look at research
that focuses on the questions of what kind of counterstereotypes are useful and the
mechanisms behind their effect by reflecting on psychological interventions against
stereotype threat.
SHE SAVED THE WORLD A LOT
53
5.4.3 Role models on stereotype threat
The first question we want to answer is what counterstereotypes need to look like.
One way to understand how counterstereotypes need to be portrayed is to look at
research on role models. As it was said earlier, a special kind of counterstereotypes are
role models that excel in a domain not associated with their group. An example for a
counterstereotypic role model is Marie Curie who was awarded two Nobel Prizes for
her work in physics and chemistry (Nobelprize.org, 2016). She represents a
counterstereotypic role model as she is a female shining in male dominated domains.
Nonetheless, using such counterstereotypic role models is not the end to all problems as
there are certain rules that need to be followed (McIntyre et al., 2005; Marx & Roman,
2002; Marx & Ko, 2011; Lockwood & Kunda, 1997). When using such
counterstereotypic examples, Marx and Roman (2002) as well as Dasgupta (2011),
showed how these role models need to be presented. Through their research, they found
two conditions that need to be fulfilled:
1. Role models need to have attainable success. For most science students reaching
Marie Curie’s level of success does not seem attainable and therefore deters
students from the domain rather than motivating them. Role models should provide
an example of where an individual can go and what success they might have instead
of showing them example of places they cannot reach. Therefore it is not surprising
that negative effects of role models were found if the role model intimidated people
(Marx & Ko, 2012).
2. Role models need a certain degree of similarity to the individuals they are asked to
inspire. Similarity can be derived from two sources: shared identity and shared
attributes (Marx & Ko, 2012). Shared identity would mean identifying with the
SHE SAVED THE WORLD A LOT
54
same group, while shared attributes can be understood as simple things like sharing
a birthday. Lockwood and Kunda (1997) said that similarity was important in order
for students to want to compare themselves to the role models and have their self-
views impacted.
Studies using counterstereotypic role models look at the psychological effect these
role models have on the individual. We therefore speak of psychological interventions
in this subchapter. One intervention against stereotype threat using role models was
conducted by Marx and Roman (2002) who presented their participants with a role
model that fulfilled the abovementioned criteria. Participants, male and female, were
either exposed to a male or female experimenter who was portrayed as highly
competent or not. The experimenter handed out a challenging mathematical test.
Females exposed to competent female experimenters performed equally well as male
participants but females exposed to low competence female experimenters performed
worse than their male counterparts. Marx and Roman’s (2002) results support the idea
that in order to inspire, female role models need to be seen as excelling in a certain
domain instead of solely being involved in a counterstereotypic domain. Marx, Ko and
Friedman (2009) were also able to show the positive impact of counterstereotypic role
models in a field experiment. Dubbed the “Obama Effect“, they showed the positive
academic impact Barack Obama’s rise to power had on young African Americans. In
their study, Marx, Ko and Friedman (2009) asked African Americans and European
Americans to complete verbal tasks throughout a three month period that included
Obama’s famous Convention speech as well as the time right after his election to
presidency in 2008. The authors showed the reduced impact of stereotype threat effects
on African Americans in comparison to European Americans right after Obama’s
SHE SAVED THE WORLD A LOT
55
unexpected stereotype-inconsistent accomplishments. In comparison to prior studies,
participants were not directly exposed to Barack Obama and media exposure was not
controlled for. A further difference is the fact that while becoming President of the
United States of America is a great feat, it does not directly reflect on excellence in
verbal skills. He can therefore be described as a foreign to task domain role model.
Also using foreign domain counterstereotypic role models similar to the study on
the Obama effect, McIntyre et al. (2005) had participants read about 0 to 4 successful
women in various domains before taking a mathematics test. The successful women’s
résumés included that of a lawyer, an architect, a doctor, and an inventor. With only one
résumé read, stereotype threat effects were already attenuated for female participants in
comparison to those who did not read any essay. Performance further improved with the
number of essays read, however improvement was not as dramatic. Dasgupta and
Asgari (2004) performed a similar experiment to McIntyre et al. (2005) where they
exposed participants to counterstereotypic female role models, here women in
leadership roles, and measured their automatic stereotype activation. Their results show
that those women exposed to the counterstereotypical role models do not only show
reduced automatic stereotype activation but an increased automatic activation of
counterstereotypes, such as an automatic association of women with leadership.
5.4.4 Mechanisms behind counterstereotypes
A second questions we posed earlier was how counterstereotypes work. Marx and
Roman (2002) hypothesized that individuals bask in the role model’s reflected glory, as
described in Cialdini et al.’s (1976) theory. By doing so they momentarily see
themselves as more capable in the given domain. Another idea was proposed by
Dasgupta’s (2011) stereotype inoculation model. She stated that counterstereotypic role
SHE SAVED THE WORLD A LOT
56
models serve as “social vaccines” for individuals exposed to them. Seeing individuals of
one’s group belonging to a domain increases the individual’s sense of belonging in the
domain, “vaccinating” them against threats claiming otherwise, and thus raising the
self-efficacy of the individual. Marx and Ko (2011) also support this theoretical link
between counterstereotypes, sense of belonging and self-efficacy in their review on
Dasgupta’s (2011) stereotype inoculation model. Thirdly, increased automatic activation
of counterstereotypes and a decreased automatic activation of stereotypes were reported
by Dasgupta and Asgari (2004) when exposing their participants to women leaders
excelling in their domain. The authors propose that without stereotypes being activated
and made salient, individuals are not aware of the stereotypes’s applicability to the
situation and in return individuals are less susceptible to stereotype threat.
Another question we asked ourselves is why counterstereotypes overpower
stereotypic depictions in these situations as counterstereotypes do not always protect
against stereotype threat as Huguet and Regner (2009) showed. Plaks, Sroessner, Dweck
and Sherman (2001) postulated that counterstereotypes increase people’s cognitive
engagement as they potentially provide greater informational value than stereotypic
portrayals, similar to the idea that inconsistent and more novel ideas place the focus on
themselves (McGarty, Yzerbyt, & Spears, 2002). One problem for the reduction of
stereotype threat effects that goes in line with this argument is the potentially higher
cognitive load presented by counterstereotypes (Good, Woodzicka, & Wingfield, 2010).
However, in the studies using role models, a higher cognitive load was not found as the
individuals in the counterstereotypic condition achieved higher performance scores than
those individuals in the neutral condition (e.g. Marx & Roman, 2002; McIntyre et al.
2005).
SHE SAVED THE WORLD A LOT
57
5.5 Conclusion
In this chapter, we have seen some structural and some psychological
interventions for stereotype threat effects. For structural interventions, the focus was put
on the negative effects of stereotypic depictions (Davies et al., 2002). It was concluded
that the stereotypic depictions heighten stereotype activation in comparison to a
counterstereotype condition. Additionally, the type of counterstereotypes used here are
general, non-domain specific counterstereotypes that aim to change the grander
representation of a certain group. Thus for these kind of counterstereotypes it is not
important to excell in a certain domain. For the psychological interventions on the other
hand, a great focus has been put on the use of, usually domain specific, role models that
portray a certain level of excellence in an area that general counterstereotypes do not.
There is also a set of rules rules attached to how to choose these role models (Marx &
Ko, 2012; Marx & Ko, 2011; Marx & Roman, 2002). While the studies looking at role
models have looked at the psychological impact of role models, studies changing the
representation of women in general domains have not done so explicitly. Some of the
mechanisms explaining the effect of counterstereotypic role models can be transfered in
a modified way to general counterstereotypes. These mechanisms for example include
the idea of automatic stereotype activation which has already been partially investigated
by Davies et al. (2002) in connection to stereotypic depictions. Other mechanisms,
especially those using the excellence of counterstereotypic role models, cannot be
transferred. With Cohen, Purdie-Vaughns, and Garcia (2012) in mind, we therefore
argue that it is important to bring the research on psychological and structural
interventions together to understand and measure the psychology behind the use of
general counterstereotypes as used in structural interventions. In an attempt to measure
the psychology behind general counterstereotypes, we now suggest looking at the
SHE SAVED THE WORLD A LOT
58
cognitive effects, such as automatic stereotype activation, of general counterstereotypes
that are not linked to a certain domain or show high levels of excellence in a specific
domain. Understanding the effect of these kind of counterstereotypes can help us
understand what structural changes, changing the representation of group, need to look
like so we can better link psychological interventions to structural ones. By doing so,
hopefully a more holistic approach to combatting stereotype threat can be formed, using
the knowledge from psychological interventions in structural interventions as suggested
by Cohen, Purdie-Vaughns and Garcia (2012).
Having said that, the contribution of this work is thus a more in-depth look at how
generic counterstereotypes buffer against threat effects. One way to do this is by looking
at a training developed by Kawakami, Dovidio, Moll, Hermsen & Russin (2000) called
the Counterstereotypic Association Training which will be presented, examined, and
related to stereotype threat in the following chapter.
SHE SAVED THE WORLD A LOT
59
6 Counterstereotypic Association Training
6.1 Introduction
In the last chapter, we talked about different interventions aiming to reduce
stereotype threat effects using counterstereotypes. At the end of the chapter we
concluded that no research had focused on the cognitive processes underlying such
interventions that used general counterstereotypes. Luckily, a method already exists
using these kind of counterstereotypes that allows us to measure cognitive processes.
However, it has never been used in connection with stereotype threat effects. This
chapter will first present the Counterstereotypic Association Training before presenting
three imaginable modes of action it has against stereotype threat effects.
6.2 The Counterstereotypic Association Training
The Counterstereotypic Association Training by Kawakami et al. (2000) is based
on two ideas. Firstly, it assumes that stereotype activation is learned and thus can also
be unlearned. Secondly, it follows Devine’s (1989) idea that stereotype activation can be
automatic. The authors combined these two concepts to create a training that works at
reducing the automaticity of stereotype activation by replacing the stereotypic
associations with counterstereotypic ones through practice. For someone to develop
automaticity in a certain field, the individual needs to practice and repeat frequently
(Devine, 1989). Stereotype activation can be such an automatic reaction. Therefore
activation of a stereotype as a response to, for example, an image of a member of a
stereotyped group can also be such an automatic process that can be learned over time
through frequent repetition. This means that triggers in our environment can
automatically activate stereotypes within us without our conscious effort to do so.
SHE SAVED THE WORLD A LOT
60
Stereotype activation is far-reaching in a sense that it can affect us from the way we
think to the way we behave (Wheeler & Petty, 2001). The Counterstereotypic
Association Training aims to break down these automatic processes by having people
negate already learned associations while at the same time introducing new associations
to be paired with one of the original stimuli. In more detail, in a gender stereotype
example, individuals are asked to say no to stereotypic associations between the male
sex and stereotypically masculine attributes, such as male and strong. On top of that
they are asked to say yes to counterstereotypic associations between the female sex and
stereotypically masculine characteristics, such as female and strong. The process is
reversed by saying no to female sex and stereotypically feminine attributes and saying
yes to male sex mixed with feminine attributes. By repeatedly asking participants to say
no to known associations and saying yes to counterstereotypic association, the training
sets out to break down automatic processes and replace them by new ones.
To conclude the introduction to the Counterstereotypic Association Training, we
can say that the reasons we chose this training is twofold. Firstly, as mentioned in the
introduction to the chapter, the Counterstereotypic Association Training allows us to
look at more general counterstereotypes that are not tied down to any specific domain or
build on excellence in a specific area. Secondly, due to the nature of the
Counterstereotypic Association Training, it also lets us look at what happens at the
cognitive level when breaking down old associations and learning new
counterstereotypic ones to better understand how perceptions and feelings of threat are
affected.
SHE SAVED THE WORLD A LOT
61
6.2.1 Effectivity of the Counterstereotypic Association Training
As the training was developed in order to reduce automatic stereotype activation,
it was first tested in such a setting, examining the training’s impact on automatic
stereotype activation. Kawakami et al. (2000) tested automatic activation in a pre-post-
test design. Participants completed a primed stroop task that measured the activation of
the elderly and skinhead stereotypes before and after completing the Counterstereotypic
Association Training. The authors expected those participants who received the
Counterstereotypic Association Training to show less automatic stereotype activation on
the stroop task than those who did not receive the training. The results confirm this
pattern for the skinhead stereotype where the participants were less affected by the
prime after the training. Analysis for the elderly stereotype did not result in significant
differences. Here Kawakami et al. (2000) assume that the stereotype induction did not
function due to inherent traits of the elderly stereotype itself, such as slower reaction
time. In a second experiment results were replicated using the African American
stereotype and once again the skinhead stereotype. The same results were reported. The
results of the two studies let us conclude that the training is applicable to various, but
not all, stereotyped groups.
Next to the training’s effectivity, Kawkami et al. (2000) tested the endurance of
the training effects. They asked people to complete the primed stroop task right after the
training, 2 hours after the training, 6 hours after the training and 24 hours after the
training. The participants who received the training showed reduced automatic skinhead
stereotype activation up to 24 hours after the training completion in comparison to those
participants who did not receive the training. For now we can conclude that the training
is effective for at least 24 hours.
SHE SAVED THE WORLD A LOT
62
One more point that needs to be addressed is the extensity of the training.
Participants go through 480 trials throughout the training to ensure its effectivity. These
480 trials are needed according to Kawakami et al. (2000) as repeated practice is crucial
for new associations to form and results were only seen after the completion of all trials.
Therefore the extensity of the training is very important. The authors also believe the
extensity to be one mechanism working against possible contrast effects. The way the
training is conceptualized, Kawakami et al. (2000) believe participants are able to
understand the goal of the training, to learn new associations, easily. They fear
participants will react in opposition to what is expected of them when later given a task
that tests stereotype application, meaning the participants would purposefully act in a
stereotypical manner (Kawakami, Dovidio, & van Kamp, 2005). This reaction can occur
in two ways. Firstly, according to the reactance theory (Brehm & Brehm, 1981),
participants may go directly against what they assume the training wants them to do.
Secondly, correction theory (e.g. Wegener & Petty, 1997) proposes that participants will
assess the strength of the influence of the training and adjust their future reaction
accordingly. Kawakami, Dovidio and van Kamp (2005) tested the effect the
Counterstereotypic Association Training had on hiring decisions and whether contrast
effects could be observed and if so under what circumstances they disappeared. The
experiment had four conditions. From 70 participants, a quarter of the participants did
not receive any training and solely finished the hiring decision task. A second quarter
completed the training before working on the hiring decision task. A third quarter
finished the training and a filler task before working on the hiring decision task. The last
quarter received the training and a probe reaction task. This task consisted of a light
bulb that needed to be switched off occasionally during the hiring decision task. The
dependent variable was the participant’s hiring decision for a managerial position. The
SHE SAVED THE WORLD A LOT
63
in-between options included two male and two female candidates who were all equally
qualified to do the job. Kawakami, Dovidio and van Kamp (2005) expected participants
in the first two conditions to react in a stereotypical manner by choosing more male
candidates than female ones, also as a function of the position advertised. This
expectation can be explained as the first condition did not receive any training to reduce
automatic stereotypic activation. In the second condition, participants reacted against
what the Counterstereotypic Association Training set out to do, reducing stereotyping.
Participants in the third condition were expected to choose more female candidates as
the training and the task were separated temporally and were seemingly unrelated. Thus
participants should not try to correct the influence the training had on them. The same
pattern was expected for participants in the Probe Reaction Task condition in which the
individual was put under a higher cognitive load and thus did not possess the capacity to
react in opposition to the training. The results almost completely show this pattern.
Male candidates were preferred by the participants in the first two conditions, while
female candidates were preferred by the individuals in the training plus Probe
Reactance Task condition. No difference between the number of male and female
candidates chosen was found for the participants who completed a filler task in-between
the training and the hiring decision. As a conclusion it can be said that in contrast to the
belief that stereotyping is exacerbated under a high cognitive load, receiving the training
and being under a high cognitive load actually decreased the amount of stereotyping.
The study also shows that under the right conditions, by putting participants under a
high cognitive load, the training does not solely have an effect on automatic stereotype
activation but also on the application of these stereotypes.
SHE SAVED THE WORLD A LOT
64
6.2.2 Mechanisms behind the Counterstereotypic Association Training
These studies showed us that firstly, the training was effective for reducing the
automatic activation of different stereotypes and secondly, that it had an effect on
stereotype application if participants were put under a high cognitive load and thus
unable to react against the goal of the training. A question that remains is through which
mechanism the automatic activation is reduced. Based on the assumptions of the
training, Kawakami et al. (2000) give three mechanisms through which automatic
stereotype activation can be reduced. Firstly, they propose that the training leads to the
goal of responding in an unbiased fashion and thus reduces automatic activation of
stereotypes. Secondly, they believe that the training could weaken the stereotypic
association in the memory of the participant and thus reduce automatic activation. This
idea goes hand in hand with the idea of unlearning stereotypes. With a weakened
association of a category and traits, automatic activation of the corresponding stereotype
is also be reduced. Lastly, their third idea lies within the replacement of the old
association with new ones. Changing the association also leads to a reduced automatic
activation of the old associations. One study that set out to answer this question how
automatic stereotype activation was reduced was performed by Gawronski, Deutsch,
Mbirkou, Seibt, and Strack (2008). The authors analyzed the training in the light of the
possible mechanisms proposed by Kawakami et al. (2000). Their results led the authors
to emphasize that it is not enough to solely say no to a stereotype but that there is a need
to change the underlying representation of these stimuli, to expatiate, replacing old
associations with new ones. Their experiment had a similar design to Kawakami et al.
(2000) as it used a pre-post-test design. However, their training put a stronger emphasis
on the affirmation of counterstereotypes, saying yes to stereotype-incongruent
combinations and was tested against a training where participants were asked to solely
SHE SAVED THE WORLD A LOT
65
say no to stereotype-congruent combinations. Additionally, they looked at gender and
race stereotypes and used names instead of images to signify the category. Their
automatic activation task included the same names and traits that were classified as
either weakness or strength-related. Gawronski et al. (2008) show that automatic
activation was only reduced for those individuals who were in the affirmation condition.
Thus it seems like Kawakami et al.’s (2000) third hypothesized mechanism about the
need to learn new associations is the important factor that drives the effect of the
training.
We looked at the research on the Counterstereotypic Association Training and its
effectivity in automatic stereotype activation to eventually bring it into contact with
stereotype threat effects. The reasons the Counterstereotypic Association Training was
chosen are that firstly, it takes a more cognitive approach to measuring effects of
counterstereotypes. Secondly, it uses counterstereotypes that are not linked to a certain
domain as we discussed in the chapter on counterstereotypes. Now that we understand
how the Counterstereotypic Association Training works, we must ask ourselves how it
could help against stereotype threat effects. Different mechanisms can be imagined how
this might happen; firstly through the reduction of automatic stereotype activation and
secondly through a change in the individual’s working self. In this part of the chapter
we will look at these mechanisms and how they theoretically tie in with the
Counterstereotypic Association Training as well as stereotype threat.
SHE SAVED THE WORLD A LOT
66
6.3 The Counterstereotypic Association Training and stereotype threat
6.3.1 Automatic stereotype activation and stereotype threat
We have already mentioned automatic stereotype activation in relation to the
Counterstereotypic Association Training earlier this chapter. Let us now take a step back
and define automatic stereotype activation more clearly. In her paper, Devine (1989)
differentiates between controllable and uncontrollable responses to members of
stereotyped groups. Automatic stereotype activation lies outside of the control of the
individual and is an involuntary reaction to stereotyped stimuli. The automatic
activation occurs as the activated stereotypes have been well learned and activated
many times before and are thus inevitable even when individuals try to control them. It
is important to understand as activating stereotypes can also change individuals’
behaviors, for example through ideomotor processes (Wheeler & Petty, 2001) or by
assimilating the behavior to the stereotype (Dijksterhuis, Aarts, Bargh, and van
Knippenberg, 2000). In order for a change in behavior to occur, the stereotype content
has to be known, the stereotype has to be activated and be applicable to the situation
(Major & O’Brien, 2005).
As was said above, the Counterstereotypic Association Training breaks down old
associations and replaces them with new ones (Gawronski et al., 2008) and thus reduces
the automatic activation of the old stereotyped associations. The question now is how
can we use this against stereotype threat effects? If we think back to the chapter
introducing stereotype threat, the factor eliciting threat in a given situation was the
salience of the stereotype, in other words, the awareness that a given stereotype was an
applicable interpretation of one’s behavior. This awareness is often a result of subtle
social cues that automatically activate certain stereotypes without our control and
intention to do so. As self-relevant stereotypes, such as gender stereotypes, are also
SHE SAVED THE WORLD A LOT
67
often the most chronically accessible ones (Major & O’Brien, 2005), they are likely to
be easily activated in threat situations. Thus breaking down the automatic activation of
certain stereotypes will inhibit the main factor evoking threat effects and hence, threat
effects should no longer impact these individuals. In short, automatic stereotype
activation is an inherent aspect of stereotype threat. By hindering activation, threat
effects could be reduced and individuals should no longer worry about being judged
based on the stereotype.
Davies et al. (2002) already showed the power of stereotype activation in
connection to stereotype threat. The authors measured levels of stereotype activation in
participants with a lexical-decision task. To recap, half of the participants had watched
sexist commercials while the other half watched counterstereotypic commercials. They
found higher levels of stereotype activation and more underperformance in those
participants who had seen the sexist commercials. Davies et al. (2002) additionally
showed that the level of stereotype activation mediated the effect between the
commercials and underperformance. We can thus see that if we inhibited the
automaticity of the stereotype activation and in return reduced stereotype activation,
stereotypes threat effects would be lowered.
To summarize, on the basis of Kawakami et al.’s (2005) research we propose that
the Counterstereotypic Association Training breaks old stereotypic links down while
replacing them with new associations that then become more accessible. With, for
example, gender stereotypes not accessible and activated, the individual does not feel
threat effects. Following Shapiro and Neuberg’s (2007) work on multiple stereotype
threats, reducing automatic activation of stereotypes reduces the threat coming from
others as well as the self as the individual does not acknowledge the stereotype to be an
applicable interpretation of one’s behavior.
SHE SAVED THE WORLD A LOT
68
On an operational level we use the idea that many self-relevant stereotypes are
chronically accessible (Major & O’Brien, 2005) meaning that our reaction to cues
triggering these stereotypes is almost immediate. In other words if the link between a
category and a trait is close, we react more quickly (Cohen, Servan-Schreiber, &
McClelland, 1992). If the link is less automatic and further away, reaction time is
slower. Thus automatic stereotype accessibility can be operationalized using reaction
time. Similar to the lexical decision task used by Davies et al. (2002), this would for
example mean that participants would react faster to feminine stereotyped trait words
than neutral trait words if there was a close link between the category woman and the
shown feminine trait words. For a reduction of the automatic stereotype activation as we
propose occurs through the Counterstereotypic Association Training, we would expect
participants to react more slowly to gendered words than to neutral words as the
reaction was not as automatic.
6.3.2 The working self and stereotype threat
A second possible mechanism behind the effect of the Counterstereotypic
Association Training and stereotype threat effects is the idea of a reaction of the
working self to the training. Before elaborating upon this reaction, let us first define the
working self. The idea of the working self is based on the self-concept. In Baumeister’s
(1999) words, the self-concept is “the individual’s belief about himself or herself,
including the person’s attributes and who and what the self is“ (p. 247). There are two
aspects we want to stress about Baumeister’s (1999) definition. Firstly, this definition
states that the self-concept, as the term foreshadows, deals with how people think about
themselves and what attributes are important to their selves. Secondly, Baumeister’s
(1999) definition leads us to believe that the self-concept is stable across time and
SHE SAVED THE WORLD A LOT
69
situations. The claim of stability of the self-concept led to a discussion in the literature
that we would shortly like to address here. While Aries, Oliver, Blount and Christaldi
(1998) agree with parts of Baumeister’s (1999) definition, namely that the self-concept
includes ideas about the self, they argue that the self-concept is made up of “relatively
stable self-conceptions“ (p. 246). The idea we want to focus on in Aries et al.’s (1998)
definition are the two words relatively stable. This means that while these self-
conceptions as a whole are stable, not all of them are salient at every given moment. In
short, self-conceptions that are more important to the individual are most likely
chronically accessible and thus salient in more situations (Aries et al., 1998) whereas
self-conceptions less central to the individual are brought forth by changes in the
individual’s social environment and are reactions to it (Markus & Kunda, 1986).
Markus and Kunda (1986) support the idea that there are local variations in the
otherwise stable self-concept and stress the importance of taking these into account to
truly understand people’s feelings and potentially their behaviors. For example,
Hannover & Kühnen (2008) found that depending on the self-conceptions activated, a
person’s processing of self-relevant information is influenced and in return the
individual’s feelings, emotions and behavior change. In order to distinguish the broader
more stable self-concept from these situationally accessible self-conceptions, we call the
latter the working self. We define the working self as those self-conceptions, or that
self-knowledge, that are salient at a specific time. The working self at such a specific
time therefore might be made up of chronically accessible self-conceptions, self-
conceptions induced by the individual’s social environment or a combination of the two.
The most important definition of the working self in comparison to the self-concept,
however, is its temporal limit. Lastly, in order to differentiate the working self from
automatic stereotype activation, we need to point out that the focus with the working
SHE SAVED THE WORLD A LOT
70
self is on the self and how certain attributes relate to the self and not how accessible
general associations between characteristics and groups are.
Earlier, we also mentioned that the working self can impact an individual’s
processing of self-relevant thoughts and that the way we process influences our feelings,
emotions and behavior (e.g. Hannover & Kühnen, 2008). Let us now look at how the
working self influences the individual in a specific context, the academic context.
Kessels and Hannover (2008) state that the working self can impact a person’s
involvement and confidence with a given task by matching the working self with the
domain. To understand how this is done, let us look at an example. As we pointed out in
the chapter reviewing the female representation in the mathematical domain, we saw
that mathematics is still largely thought to be a masculine domain. If in a given
situation, a girl’s working self included attributes that are generally considered to be
masculine, this girl’s working self would match the stereotype of the domain. By
matching domain and working self, the individuals’ confidence to solve a given task
within the domain rises. This mechanism of increasing an individual’s confidence
through matching the working self and the domain was shown by explicit measures
already taken by Baker in 1987. In his study he showed that girls scoring high on
masculinity and/or low on femininity were firstly more interested in mathematics and
also performed better on mathematics tasks than girls scoring highly on femininity.
Similar to the working self, Baker used self-descriptions to measure individual’s
masculinity and femininity. Kessels and Hannover (2008) studied this mechanism using
implicit measures of the working self by looking at participants’ reaction time to
gendered words instead of asking participants explicitly as was done by Baker (1987).
Reaction time was used as an indicator for accessibility similar to how automatic
stereotype activation is measured. Kessels and Hannover (2008) examined students’
SHE SAVED THE WORLD A LOT
71
interest in a task and confidence to solve it dependent on whether the students took
physics classes in a single sex or mixed sex classroom. The authors argue that the
working self of the students is manipulated by either solely being exposed to the same
sex in single sex classrooms or being exposed to both sexes in a mixed classroom. This
assumption is based on the idea of the distinctiveness theory formulated by McGuire,
McGuire, Child, and Fujioka (1978). This theory points out that individuals have those
characteristics more salient that make them different and distinguish them from the
other individuals in their environment. In our single sex and mixed sex classes this
would mean that individuals have their gender-related self-conceptions more salient in
mixed sex classes as it is something that distinguishes them partially from the other
individuals in the situation. In single sex classes however, gender-related self-
knowledge is irrelevant when wanting to distinguish oneself from the other individuals
and thus is not activated in the individual’s working self. In their study, Kessels and
Hannover (2008) measure students’ self-concept of ability in physics and argue that
girls in single sex classes are more confident in their physics ability due to the lack of
gender-related self-conceptions in their working self. Results showed that girls in single
sex classes had gender-related self-conceptions less accessible than girls in mixed sex
classes confirming the argument of the distinctiveness theory mentioned above. Results
also showed that girls in single-sex classes had a higher ability self-concept than girls in
mixed sex classes. As expected, as physics is a stereotypically male domain (Kessels,
Rau, & Hannover, 2006), no differences were found for boys in their ability self-
concept. This idea of matching the working self and the domain also goes hand in hand
with the stereotype inoculation model proposed by Dasgupta (2011) which we presented
in the chapter on counterstereotypic role models. In Dasgupta’s (2011) model,
increasing the sense of belonging to the domain through a counterstereotypic role model
SHE SAVED THE WORLD A LOT
72
is postulated to increase an individual’s self-efficacy. In other words, we can compare
matching the working self and the domain to a heightened sense of belonging to the
domain.
To conclude, the working self can increase confidence and involvement in a given
task if the working self matches the stereotype of the domain. It is through this
mechanism that we see two potential links of the Counterstereotypic Association
Training with stereotype threat that we will now present.
6.3.2.1 Usefulness of gender category to the self
Kessels and Hannover (2008) showed that if gender is an irrelevant category, for
example in single sex classrooms, girls are more confident in their ability even in a
domain that is typically associated with boys. We firstly suggest an analogous
mechanism between the Counterstereotypic Association Training and stereotype threat
effects through a similar reaction of the working self as in single sex classrooms.
Completing the Counterstereotypic Association Training could take away the usefulness
of the gender category by blending stereotypes of male and females together. In
comparison to the single sex classroom setting, the training could teach individuals that
all combinations of the male and female category with masculine and feminine trait
words are possible by repeatedly asking them to pair the male category with feminine
trait words and the female category with masculine trait words. If individuals do not
fully unlearn old associations about the gender categories, as suggested by the training,
but form additional associations, the gender categories are no longer distinct. If these
categories are no longer distinct, they are no longer useful in explaining the world.
Therefore, in relation to the working self, individuals do not make a difference between
the categories when judging the self. Taking this together, we expect gender to not be a
SHE SAVED THE WORLD A LOT
73
salient or useful category for the individual’s working self. A reduced usefulness of the
gender category, as we saw in single-sex classrooms, can create a better match between
the task domain and the individual as the working self does not include a differentiated,
typically male or female gender. In other words, gender is not consulted when
evaluating whether one fits into the domain or not. In return, gender-related self-
knowledge is not activated when evaluating whether one can solve a task or not. As a
consequence, individuals feel more confident in their own domain abilities as
expectations of how well they can perform do not rely on stereotypes. Additionally, a
reduced usefulness of the gender category for the self does not render the negative
identity salient in the given situation. As said in the chapter on stereotype threat, in
order to fear being judged based on one’s group membership, one needs to be aware of
this group membership. Therefore, without gender as a consulted category when
judging the self, the negative identity is not salient and thus individuals also do not fear
being judged. Following Shapiro and Neuberg’s (2007) distinction here, individuals
firstly do not feel a threat from within due to the match of task domain and the self.
Secondly, without group membership salient, individuals do not feel a threat from the
outside either.
To operationalize this reaction of the working self, we employ the same measures
as Kessels and Hannover (2008). In order to measure accessibility of the gender
category in the working self, they looked at relative reaction time to masculine and
feminine trait words. We expect individuals who no longer judge themselves along the
lines of the gender category to react equally fast to masculine or feminine trait words.
Equal reaction time means that these individuals neither have feminine nor masculine
traits words more accessible and thus the relative reaction time should regress towards
zero. For individuals who have not participated in the Counterstereotypic Association
SHE SAVED THE WORLD A LOT
74
Training and thus gender is still a salient and useful category to them when judging the
self, we would expect them to react faster to either masculine or feminine trait words.
6.3.2.2 Reversal of the working self
The first mechanism using the working self we suggested makes the gender
category useless for judging the self by rendering gender stereotypes less accessible to
the self. We pointed out that on an operational level this means that individuals do not
react faster to either masculine or feminine trait words. Subtracting the feminine
reaction time from the masculine reaction time should thus result in a score of zero. It is
however also imaginable that masculine and feminine reaction times diverge from zero
if the training is extensive enough. Let us explain this idea more clearly. For females,
for example, we would normally expect faster reaction times to feminine trait words
than to masculine trait words in a mixed gender situation (Kessels & Hannover, 2008).
If we now subtract the reaction time to feminine trait words from the reaction time to
masculine trait words, we would receive a positive score. It is, however, conceivable
that the Counterstereotypic Association Training, through a mechanism we will describe
below, decreases the reaction time to masculine trait words while increasing the reaction
time to feminine trait words. When now subtracting the reaction time to feminine trait
words from the reaction time to masculine trait words, the relative reaction time would
be negative or as we call it flipped in comparison to the status quo. We argue that
having masculine trait words more accessible is beneficial for females in situations
involving mathematics. This argument goes in line with a study performed by Baker
(1987) on gender identification and mathematics skills which found that girls who
identified as more masculine were also more confident in their mathematics abilities
while girls identifying as more feminine felt less confident. Parallel, in this work, we
SHE SAVED THE WORLD A LOT
75
suggest that the Counterstereotypic Association Training could change an individual’s
working self in a sense to also have masculine trait words more accessible than
feminine trait words. We call this mechanism the reversal of the working self. We would
argue that through the extensivity the training replaces old associations with new ones
and therefore one’s network of knowledge about what it means to be masculine or
feminine changes over the course of the training. In comparison to making the gender
category useless approach, here we would expect old associations to be completely
broken down. The reversed working self approach would thus predict that female
participants see themselves as more masculine as they learned to associate male
characteristics with the female category they themselves belong to. For the reaction time
this would mean that females react faster to masculine trait words, as the link between
themselves and the male category is closer. At the same time they would react more
slowly to feminine trait words, as the Counterstereotypic Association Training alienated
the link between themselves and the female category. Male participants on the other
hand see themselves as more feminine as they learned to associate female
characteristics with their own category. The reaction time of males would be reversed to
what was described above for the females. Similar to the reduced usefulness of the
gender category, a reversal of the working self would match the domain and the
individual as their working self matches the stereotype surrounding the domain.
However, in comparison here, gender is used as an indicator to estimate one’s own
performance. Thus individuals who have received the training should be less affected by
threat inductions as they experience less anxiety and worry over having to perform well
and are more confident in their abilities. As the task domain does not only better match
the self but matches the activated self-knowledge, individuals should feel more capable
of solving the task as also proposed by Marx and Ko (2011) and Dasgupta (2011), who
SHE SAVED THE WORLD A LOT
76
linked role models to the individuals feeling more capable in the role model’s domain if
their sense of belonging increased. Additionally, as individuals have the opposite
gender’s attributes more accessible, the negative identity in the domain should also be
less salient. Therefore as before, individuals should not fear being judged by others.
On an operational level, this would mean that when we look at reaction times to
gendered trait words, we would expect women who received the Counterstereotypic
Association Training to have masculine trait words more accessible, meaning they react
faster to masculine trait words than feminine trait words. For men who received the
Counterstereotypic Association Training we would expect them to have feminine trait
words more accessible, meaning they react faster to feminine trait words than masculine
trait words. For participants who have not received the Counterstereotypic Association
Training we would expect them to react faster to those trait words corresponding to their
own sex than to those trait words corresponding to the opposite sex.
Before closing, we now want to compare the reversal of working self mechanism
with the gender as useless mechanism on an operational level. At the beginning of the
study, we would expect girls to react faster to feminine trait words than masculine trait
words and boys to react faster to masculine trait words than feminine trait words
(Kessels & Hannover, 2008). For the gender as useless category mechanism we would
expect both reaction times to be equal and result in a score of zero when subtracting one
from the other after completion of the Counterstereotypic Association Training. For the
reversal of the working self mechanism we would expect the Counterstereotypic
Association Training to teach participants to associate masculinity with the female
category and vice versa. In that case, we would expect females to react more quickly to
masculine trait words than feminine trait words and males to react more quickly to
feminine trait words than masculine ones. When then subtracting the reaction time to
SHE SAVED THE WORLD A LOT
77
feminine trait words from masculine ones, we would thus expect a negative score for
females and a positive score for males.
6.4 Conclusion
The crux of this work is to test the effects of the Counterstereotypic Association
Training on stereotype threat effects and to understand the cognitive mechanisms behind
the effect. The Counterstereotypic Association Training was chosen because it does not
only use general counterstereotypic depictions in comparison to domain specific single
role models, but it most importantly allows us to look at the cognitive effect learning
new counterstereotypic associations have which has not been done before and is
important to understand as laid out in the chapter on counterstereotypes. Through any of
the presented mechanisms, we expect participants who received the Counterstereotypic
Association Training to be less affected by a threat induction than participants who did
not receive the training.
We explain this buffering effect against threat effects by the Counterstereotypic
Association Training through three possible mechanisms. Firstly, through reduced
automatic stereotype activation. Here it is important to note that the training has already
shown to reduce automatic activation. However, the full link between the training,
automatic activation and reduced stereotype threat effects remains to be seen. Secondly,
the buffering effect of the Counterstereotypic Association Training against stereotype
threat effects may occur by diminishing the usefulness of the gender category for the
self by inhibiting the accessibility of gender related self-knowledge. And lastly a
reduction of threat through the Counterstereotypic Association Training may be
achieved by reversing the gender related self-knowledge within individuals, in a way
that females have masculinity more accessible than femininity and males have
SHE SAVED THE WORLD A LOT
78
femininity more accessible than masculinity. Lastly, through the reversal of the gender-
related self-knowledge the fear of being judged is reduced.
To conclude, the contribution of this work is firstly the use of a different
counterstereotype intervention in relation to stereotype threat from the ones presented in
the previous chapter in order to secondly formulate, test and understand the cognitive
mechanisms behind the counterstereotypes used in more structural interventions. To
understand these mechanisms, we proposed to use the Counterstereotypic Association
Training as it uses general counterstereotypes and allows us to look at cognitive
mechanisms behind these counterstereotypes. Bringing all these factors together will be
the content of the following chapters. In the next chapter, we will start this process by
outlining our research plan.
SHE SAVED THE WORLD A LOT
79
7 Research questions and research plan
There are two larger research questions we aim to answer with this work. Firstly,
to see whether the Counterstereotypic Association Training protects against stereotype
threat effects and secondly, if so, through which cognitive mechanism the training
protects. To answer these questions, we have developed a four-step plan. The first task
will be to find an appropriate stereotype threat manipulation that is believable and
allows us to truly measure threat effects. We will do this by reviewing different types of
stereotype threat inductions in the literature and then testing them ourselves with our
target population. The second step will include a first study testing the
Countersterotypic Association Training’s effectivity if participants are put in a threat
situation. Based on the results of this study, research will continue looking more closely
at the Counterstereotypic Association Training itself. In a second study, we will look at
how the training affects different cognitive measures in order to get a first impression of
our proposed mechanisms. The fourth and last step will bring the Counterstereotypic
Association Training, the cognitive measures and stereotype threat effects together into
one study. By doing so, we hope to further disentangle the role of the three different
cognitive mechanisms in relation to stereotype threat effects. Studies and design will be
based upon each other and learn from mistakes. Following these steps, we hope to
answer our two general research questions of whether the Counterstereotypic
Association Training is a useful intervention against stereotype threat and if so secondly
through which mechanism the training manages to reduce stereotype threat effects. We
will now continue with step 1 of the plan laid out; finding an appropriate stereotype
threat induction.
SHE SAVED THE WORLD A LOT
80
8 Stereotype threat inductions
8.1 Introduction
In the chapter about stereotype threat, we talked about factors that elicit stereotype
threat effects. The two factors named were the stereotype salience, in other words,
knowledge of the applicability of the stereotype to the situation and secondly, the
salience of one’s own group membership and the knowledge of attached stereotypes to
the group. In this chapter, we want to create a basis for choosing our own stereotype
threat induction by reviewing the literature. Translating the literature into our own
research design and testing our inductions will follow in the adjacent chapter.
8.2 Inductions
There are different ways to induce stereotype threat in an experimental setting.
However, they all revolve around stereotype salience or group membership salience. In
the original paper on stereotype threat Steele and Aronson (1995) also presented both
options to induce stereotype threat effects. Steele and Aronson’s (1995) paper and the
manipulations they used will be the starting point for our review.
8.2.1 Stereotype salience
In order to induce stereotype threat through stereotype salience, Steele and
Aronson (1995) labeled the performance measure diagnostic of intelligence. In their
sample, African Americans were tested against European Americans. The stereotype the
authors sought to induce was the idea that African Americans are less intelligent than
European Americans. With this type of induction, Steele and Aronson (1995) hoped that
by making clear that the test measured intelligence, African Americans were reminded
SHE SAVED THE WORLD A LOT
81
of the stereotype that their group was considered as less intelligent by other groups and
thus experienced stereotype threat. A similar procedure was used by Seibt and Förster
(2004) who tested German university students. Their test was labeled as diagnostic for
verbal intelligence. However, in comparison to Steele and Aronson (1995), Seibt and
Förster (2004) also informed their participants of the exact stereotype they deemed
applicable to the situation and did not leave it up to the participants own interpretation.
In their study, Seibt and Förster (2004) tested psychology students against students of
other majors and claimed that psychology students generally performed better on the
given task. In summary, not only did they induce threat through labeling their task as
diagnostic of verbal intelligence, but they also informed participants of the exact
stereotype applicable to the situation. A third option to induce stereotype threat in an
experimental setting with an induction using stereotype salience is shown by Brown and
Pinel (2003) as well as Spencer, Steele, Quinn (1999) who both told half of their
participants that the performance test was free of gender bias. The other half was told
that the test was not free of gender bias alluding to expected differences between men
and woman on the test. In contrast to Seibt and Förster (2004), this instruction was not
directional in putting either males or females on top and left the exact stereotype up to
personal interpretation by the participants. It was assumed that most participants were
familiar with the stereotype in question. We can summarize that stereotype threat
inductions using stereotype salience use subtle cues to let the participants know they are
expected to perform according to what is predicted for their group. While some
inductions let participants make up their own mind about how their group is viewed,
other inductions clearly state the stereotype expected to be reflected in the results.
SHE SAVED THE WORLD A LOT
82
8.2.2 Salient group membership
The second factor often used to induce stereotype threat effects is rendering the
participants’ group membership salient. With a salient group membership, people are
also more aware of the negative stereotypes attached to their group. Additionally, being
made aware of one’s group membership in a given situation can lead individuals to the
belief that group membership is an important factor for the situation and will be used as
an interpretation of one’s behavior. Therefore, firstly the knowledge attached to one’s
group membership and secondly, the knowledge that one will be evaluated based on
one’s group membership, can lead individuals to experience stereotype threat. Cheyran
and Bodenhausen (2000) primed gender identity with an adapted version of the
collective self-esteem scale by Luhtanen and Crocker (1992) to make participants aware
of their own group membership as well as of group-based performance expectations.
Cheyran and Bodenhausen (2000) showed that those individuals whose gender was
made salient by the scale underperformed in comparison to those individuals whose
gender was not rendered salient. Steele and Aronson (1995) presented a similar
approach to Cheyran and Bodenhausen (2000). However, Steele and Aronson’s
manipulation was less elaborate. The authors asked participants to indicate their group
membership before taking a test in the fourth study of their 1995 paper. Here,
participants were not told about diagnosticity or any particular stereotype but were
solely asked to indicate their race before taking a test. Steele and Aronson’s (1995)
results showed that solely being made aware of their own race led to performance
decrements for African Americans but not for European Americans. They explained this
finding by stating that there are no negative stereotypes attached to the European
American group in an academic setting and therefore European American participants
had no reason to feel threatened. For the African Americans however, negative
SHE SAVED THE WORLD A LOT
83
stereotypes exist about their academic achievement and can thus induce threat. It is
important to note that Steele and Aronson’s way of inducing stereotype threat by asking
participants to indicate their race has not always proven sufficient to induce threat.
Almost 10 years after Steele and Aronson (1995) published their paper, Stricker and
Ward (2004) were not able to replicate these findings with an identical induction. In
their studies they asked participants to indicate their race or gender. Results showed that
this indication was not sufficient to induce stereotype threat effects. That being said,
indicating race or gender is still used in manipulations that also make the stereotype
applicable to the situation salient. This kind of induction will be introduced in the
following subchapter.
8.2.3 Combining stereotype salience and salient group membership
Lastly, it is possible to combine both factors, stereotype salience and group
salience, in order to induce stereotype threat effects as Nguyen, O’Neal and Ryan
(2003) show. The threat induction here combined both of Steele and Aronson’s
approaches to stereotype threat induction. In their study, the authors firstly told
participants about the diagnosticity of the test similar to Steele and Aronson’s (1995)
study 1-3 instruction, and secondly asked them to indicate their race as in study 4.
Nguyen, O’Neal and Ryan’s (2003) result show lower performance for those individuals
who were put in the threat condition which meant having read about the diagnosticity of
the test as well as having to indicate one’s group membership. A combination of the two
approaches is still believable to the participants and produces threat effects. This last
form of stereotype induction is also the closest to reality in standardized test taking
situations from all approaches presented. Standardized tests are often framed to be
SHE SAVED THE WORLD A LOT
84
diagnostic of individual’s competencies (e.g. Popham, 1999) and individuals are often
asked to indicate their gender as well as race before completing such a standardized test.
8.3 Conclusion
This chapter was just a brief overview of different ways to induce stereotype
threat and is nowhere near complete. However, we take it as a starting point to choose
and test our own threat induction. Making an informed decision about threat
manipulations is important as some inductions have been shown to be more consistent
than others. For example Sticker and Ward’s (2004) were unable to replicate Steele and
Aronson’s (1995) results when stereotype threat was induced by indicating race. We can
also see that some inductions are less elaborate than others. Cheyran and Bodenhausen’s
(2000) method of inducing stereotype threat is more time consuming than adding a
sentence about diagnosticity as practiced by Steele and Aronson (1995). A third aspect
one needs to think about when choosing an induction is the component of directionality.
The question here is the need for the explicity of the stereotype. We need to ask whether
there is a need for an explicit stereotype or whether it is enough for the participants to
know differences are expected. If we believe explicity not to be key we also need to ask
ourselves whether non-directional inductions elicit the pursued stereotype. With that
being said, we now come to test different inductions ourselves for our further studies of
stereotype threat effects and the Counterstereotypic Association Training.
SHE SAVED THE WORLD A LOT
85
9 Pre-test 1: Threat vs. No Threat
9.1 Introduction
In the last chapter we reviewed some of the manipulations used to induce
stereotype threat effects in order to decide on an appropriate induction for our own
research designs. In this chapter we want to put this knowledge to use and pre-test a first
induction. Pre-testing and finding an appropriate stereotype threat induction is
important, so we can interpret our results correctly and understand the differences as a
function of the threat induction. The goal of our first experiment was therefore to test a
first threat induction against a no threat group and to see whether threat was induced in
the participants. Due to the relevance of the topic of women in the mathematics domain
as described in earlier chapters, the stereotype we wanted to further examine and whose
effect we wanted to reduce is the incapability ascribed to women in the domain of
mathematics. With that in mind, female participants performed on two mathematics
tests, the second of which was induced with threat for half of the participants. No men
were used in the pre-test as threat using this particular stereotype is supposed to only
affect females.
Stereotype threat theory predicts girls exposed to threat to underperform in
comparison to girls not exposed to threat. We therefore formulated the following
hypotheses:
Hypothesis about score 2:
H1: Female participants in the Threat condition perform worse on the arithmetic
mathematics test (score 2) than the female participants in the No Threat group.
SHE SAVED THE WORLD A LOT
86
As threat was induced before the arithmetic test, it should only affect performance
on this test. Therefore in comparison to the number sequence test, we expected:
Hypothesis about the difference between score 1 and score 2:
H2: The difference score between the arithmetic test (score 2) and the number
sequence test (score 1) is larger for participants in the Threat group than for participants
in the No Threat group.
9.2 Methodology
9.2.1 Sample and overview
61 students of the University of Mannheim participated in the study. Their mean
age was M = 22.67, SD = 3.45. They were recruited while passing the laboratory and
participation was voluntary. Participants were told the study analyzed the relationship
between decision-making and performance. If participants agreed to complete the study,
they were led into the laboratory room where the laboratory assistant seated them. No
interaction was needed between the laboratory assistant and the participants themselves.
However, the gender of the assistant was held constant to be female. The study was
filled out at a PC and lasted around 25 minutes. At the end of the study, the participants
were thanked and given 2€ compensation and chocolate.
9.2.2 Instruments
9.2.2.1 Mathematics tests
As the stereotype we used to induce threat deals with the mathematics capabilities
of females, we decided to use two types of mathematics problems from a German
intelligence test; the Intelligenz-Struktur-Test 2000 R (IST 2000R) developed by
SHE SAVED THE WORLD A LOT
87
Liepmann, Beauducel, Brocke, and Amthauer (2007). The first type of task used was an
exercise to complete 20 number sequences and it was used as a baseline test of
mathematical ability. For the age range of our students, the mean test score is
M = 14.05, SD = 4.89. The second type of test used consisted of 20 arithmetic
problems. This test was used to measure the stereotype threat effect. Here the mean
score for the student aged population is M = 14.17, SD = 3.85. Both tests correlated
moderately highly in the original standardization of the intelligence test with r = .628.
Both type of tests started with easy problems and got more difficult until all 20
problems had been reached. The full tests and their German instructions can be found in
the Appendix A, B, C and D. The reason two different types of tests were used is for
credibility of the threat induction which will be described in detail below. As the first
test served as a baseline and the second test as the dependent variable to which the
threat applied, they had to be different for it to be believable that only one of the tests
was affected by the gender differences. It was also important that the tests were
sufficiently difficult as stereotype threat effects only occur for participants who feel
challenged by the task (Spencer, Steele, & Quinn, 1999). Performance on the arithmetic
test as well as the score difference between the number sequence and arithmetic test
served as our dependent variables.
9.2.2.2 Filler task
A filler task was given between the two mathematical tasks for the sake of the
cover story of linking decision-making and performance. The task encompassed
choosing between different cities that were presented across different dimensions such
as population, population density and square meters of green space. The German
Instruction can be found in Appendix E followed by an example item in Appendix F.
SHE SAVED THE WORLD A LOT
88
Participants were asked to indicate which city they would like to live in in the future
and rank the importance they ascribed to the different dimensions we presented.
9.2.3 Procedure
Participants were either put under Threat or in the No Threat condition. We did
not include male participants in the sample but this was not advertised. Participants
were compared across conditions, as well as within subjects as they were asked to
perform on two mathematics tests with a distractor task in between.
After having been seated, participants gave their consent and started the study.
They were told the study examined the relation between decision-making and
performance but were not told anything else in advance.
The first task was the completion of number sequences. The results of this task
will labeled as score 1 and serve as the baseline task. It was introduced exactly as in the
original IST 2000R handbook, and the translation reads as follow:
You will see number sequences that were constructed with specific rules in mind. Every
row can be extended by following the row’s rule. Your task is to find the next missing
number for each row. Please solve the task with the help of the following examples:
Example 1: 2 4 6 8 10 12 14 ?
In this row, every succeeding number is bigger by 2 than the preceding one.
The solution therefore is 16.
SHE SAVED THE WORLD A LOT
89
Example 2: 9 7 10 8 11 9 12 ?
In this row, the rule alternates between subtracting 2 and adding 3.
The solution therefore is 10.
All problems are solved in the same way. You have 10 minutes to solve all problems.
After the time is up, the page will automatically forward. No calculators are allowed.
After having finished the filler task, which consisted of the decision making
exercise and lasted on average 5 minutes, participants were randomly allocated to one
of two conditions that both had to finish an arithmetic test. The results of this test will
be labeled score 2. Half of the participants were put into the No Threat condition.
Participants in this condition were given the following instructions:
The following arithmetic exercises are to be solved with the help of the following
example:
Example 1: 60 - 10 = A
A = ?
The solution to this problem is A = 50.
Note that multiplication is signified by “*“ and division by “/“.
All problems are solved in the same way. You have 10 minutes to solve all the problems.
After the time is up, the page will automatically forward. No calculators are allowed.
SHE SAVED THE WORLD A LOT
90
The participants in the second condition received a threat induction. They received the
same instructions as the participants in the No Threat group with additional information
as noted below.
Prior studies of this material have shown differences between middle aged male and
female participants, where male participants scored higher than female participants. We
would like to test whether these differences can also be found in students of the
University of Mannheim.
Participants finished by reporting their demographics and were given the option to
comment. Afterwards they were thanked, debriefed and given their reward.
9.3 Results
9.3.1 Assumptions
Before presenting the results for our hypotheses, we checked whether the data
were suitable for our analyses. Firstly, we expected score 1 and score 2 to be correlated.
The correlation between the two scores was important as we wanted to use score 1 as a
baseline control variable for our dependent variable score 2. The correlation was
moderately high at r = .513, p < .001, similar to the correlation given in the test booklet
(Liepmann et al., 2007). Additionally, we can report that there were no significant
differences between the two groups based on their score 1 performance. In a next step,
we tested the assumptions of an analysis of variance. The second mathematics score
was normally distributed and equal variance could be assumed. Outlier analysis
revealed a couple of cases that needed further inspection. With the use of Cook’s
distance score, indicating outliers by influence, we identified and excluded three outliers
SHE SAVED THE WORLD A LOT
91
from further analysis. We did this by following Bollen and Jackman’s (1990) advice,
determining the cut-off by using the formula 4/n.
9.3.2 Mathematic performance
We continued by looking at our dependent variable, the performance on the
second mathematics test. Females in the Threat condition scored an average M = 8.4,
SD = 3.05. Females in the No Threat condition scored an average M = 7.96, SD = 3.41.
Our first hypothesis predicts a main effect of threat in a way that participants in
the Threat condition perform worse than participants in the No Threat condition,
controlling for score 1 as a baseline of mathematic competence (H1). The model
became significant F (2, 58) = 9.85, p <.001. The predicted main effect however was
not significant. There was no significant difference between the Threat and the No
Threat condition. It is rather the control variable of score 1 that made the model reach
significance. Descriptively, it could even be seen that participants in the Threat
condition performed better than participants in the No Threat condition.
Our second hypothesis dealt with the difference between score 1 and score 2
performance (H2). We expected participants in the Threat condition to have a larger
score difference than participants in the No Threat condition As a direct comparison
between the two mathematics tests was impossible, we standardized the results with
respect to the standardized values given by the handbook of the IST 2000R (Liepmann
et al., 2007). Participants in the Threat condition scored a standardized average of
M = -.34, SD = 1.17 on the number sequence task and a standardized average of
M = -1.25, SD = 1.03 on the arithmetic test. Participants in the No Threat group scored
a standardized average of M = -.74, SD = 1.22 on the number sequence task and a
standardized average of M = -1.46, SD = .94 on the arithmetic test. We predicted the
SHE SAVED THE WORLD A LOT
92
difference between score 1 and score 2 for the female participants in the Threat
condition to be larger than the difference between score 1 and Score 2 for the No Threat
group. Both groups, the Threat condition (t (28) = 5.08, p < .001) and the No Threat
group (t (28) = 3.81, p = .001) experienced a significant reduction in performance.
Concerning our hypothesis, while descriptively the difference in scores was larger for
the Threat condition (M = .99, SD = 1.05) than for the No Threat group (M = .76,
SD = 1.07), this difference was not significant.
9.4 Discussion
The goal of the study was to find an appropriate threat manipulation for future
studies. However, to sum up, neither of our two hypotheses was confirmed by the data.
If threat was induced through our manipulation, we expected a lower score on the
second mathematics test for the females in the Threat condition than for the females in
the No Threat condition. However, in absolute terms, the participants in the Threat
condition performed better than the females in the No Threat condition. This difference
was insignificant. Our results can be explained by several factors. Firstly, there might
have been a problem with the randomization of the sample. This would mean that either
the No Threat group was subpar in the mathematics domain to begin with, or the Threat
group exceptionally good. We can dismiss this idea to some degree, as there were no
significant differences between the two groups on their score 1 performance.
Additionally, as the two mathematics test correlate moderately highly, we would not
expect participants to be good at one or the other type of task given. A second
explanation why the induction did not work could be that solely having to perform on a
mathematics test induced stereotype threat also for the No Threat group. This would
mean that threat was induced for participants of both conditions. The question here is
SHE SAVED THE WORLD A LOT
93
why this underperformance seems to occur more strongly for the second test than the
first one as can be seen by the participants’ standardized test scores. The answer could
be that while both tests measure numerical intelligence, arithmetic tests are more typical
of what is understood under the term of mathematics and therefore it is possible that
participants felt more threatened by having to perform on an arithmetic test than a
number sequence test. This idea of a threat induction through the exposure to a
mathematical task also goes in line with a second involuntary threat induction. As we
explained in the chapter on inductions, making individuals aware of their own group
membership can be used as a stereotype threat induction. If participants were aware
they were asked to participate because of their gender, they might have felt threatened
regardless of condition. However, with the information given about the experiment, as it
was not advertised as solely being for females, we would not necessarily expect this
effect to have occurred.
A third explanation for our results might be that the manipulation simply did not
work. This could be due to a lack of credibility of the story itself or because the
manipulation was not strong enough. Concerning the credibility, participants firstly
might not have believed that women tend to perform worse on this kind of task or
secondly, felt that the claim was too extreme to be believable by potential outsiders to
induce a fear of being judged by these outsiders in our participants. Additionally
stereotype threat effects are generally found for people who are engaged in the domain.
It is also possible that our student sample did not value mathematics very highly and
therefore the manipulation might not have been strong enough for this particular
sample. Anticipating this effect however, we had hoped to counteract it by motivating
participants to perform well by being told they would be able to see their results in
comparison to other participants at the end of the experiment.
SHE SAVED THE WORLD A LOT
94
Besides looking at the performance on the arithmetic task, we also used a second
way to capture threat effects. We looked at the performance reduction from the number
sequence task to the arithmetic task. Here, we predicted the difference between the two
mathematics tests to be larger for the Threat group in comparison to the No Threat
group. Both the No Threat and the Threat group scored significantly lower on the
second mathematics test. This difference was larger for individuals in the Threat group,
however not significantly larger than for those in the No Threat condition. The same
problems we faced when understanding the results for performance on the arithmetic
test apply here. The fact that both groups performed worse on the second mathematics
test in comparison to the first one might be an indicator that we are in fact dealing with
a subtle stereotype threat effect by exposure to mathematics here.
On a last note, the mathematics tests used seemed to be sufficiently difficult as
only one individual answered all the questions correctly and our participants’ averages
were below the guidelines given by the IST 2000R handbook (Liepmann et al., 2007).
SHE SAVED THE WORLD A LOT
95
10 Pre-Test 2: Blatant Threat Induction
10.1 Introduction
The results of our first pre-test showed a threat effect for women in general in the
mathematics domain, independent of whether this threat was made explicit or not by our
induction. Therefore the goal of the second pre-test was to fix some of the problems that
became evident during the first pre-test. One problem we addressed in the discussion
was the potential of the salience of group membership for all participants as only female
students participated in the study. Therefore male and female participants were recruited
for this experiment. This was done as to not unnecessarily render sex more salient. A
second discussed problem was the strength of the induction itself. We therefore decided
to add a second, more blatant, threat induction by deliberately making group
membership salient for the participants in the second Threat condition. By doing so, we
hoped to further manipulate the strength of the salience of the negative stereotype and
with it, the stereotype’s applicability as an interpretation of one’s performance.
As the material seemed to be sufficiently difficult to elicit threat effects, we once
again used the two mathematics tests from the IST 2000R (Liepmann et al., 2007).
Additionally a scale to measure intrusive worry thoughts, described later in this chapter,
was used. As explained in the chapter on stereotype threat, distracting worry thoughts
are one of the possible mechanisms to explain stereotype threat effect. By doing so, we
hoped to have a further measure to capture the threat effect. Participants were compared
across groups, across the three conditions, as well as within subjects.
Stereotype threat theory predicts girls exposed to threat to underperform in
comparison to girls not exposed to threat. We therefore formulated the following
hypotheses:
SHE SAVED THE WORLD A LOT
96
Hypotheses about score 2:
H1: Female participants in the Threat conditions perform worse on the arithmetic
test (score 2) test than the female participants in the No Threat group.
As threat was induced before the arithmetic test, it was only supposed to affect
performance on this test. Therefore in comparison to the number sequence test, we
expected:
Hypothesis about the difference between score 1 and score 2:
H2: The difference score between the arithmetic test (score 2) and the number
sequence test (score 1) is larger for female participants in the Threat groups than for
female participants in the No Threat group.
Stereotype threat effects are hypothesized to be mediated by higher levels of
worry in the individual (e.g. Osborne, 2001). For participants in a stereotype threat
situation we would therefore expect higher levels of worry. Based on this, we
formulated the following hypothesis.
Hypotheses about worry thoughts:
H3: Female participants in the Threat conditions report higher levels of intrusive worry
thought than females in the No Threat group.
No differences between or within groups were expected for male participants on
any of the dependent variables, score 2, score difference and worry thoughts.
Additionally, as the goal of the study was to explore and test two stereotype threat
SHE SAVED THE WORLD A LOT
97
inductions against each other, no specific expectations were made for differences
between these two groups.
10.2 Methodology
10.2.1 Sample and overview
69 students of the University of Mannheim participated in the study. 38
participants of the sample were female. The mean age was M = 24.57 years, SD = 5.35.
Participants were recruited while passing the laboratory and if they agreed to participate
were led into the laboratory room where the laboratory assistant seated them. They were
told the study looked at the relationship between decision-making and performance. No
interaction was needed between the laboratory assistant and the participants themselves.
However, the gender of the assistant was held constant to be female. The study was
filled out at a PC and lasted around 25 minutes. By the end of the study, participants
were thanked and given 2€ and chocolate.
10.2.2 Instruments
10.2.2.1 Mathematics test
The same mathematics tests from the IST 2000R test booklet (Liepmann et al.,
2007) were chosen, used and introduced as in the pre-test 1 description in the prior
chapter. Participants’ performance on score 2 as well as their score difference between
score 1 and score 2 served as our dependent variables for H1, the performance
difference on score 2, and H2, the difference score between score 1 and score 2.
SHE SAVED THE WORLD A LOT
98
10.2.2.2 Filler task
A filler task was given between the two mathematical tasks for the sake of the
cover story, the relationship between decision-making and performance. The task
encompassed choosing between different types of ice-cream that were presented across
different dimensions. Participants were asked to indicate which ice-cream they would
like to consume in the future and rank the importance they attributed to the dimensions
in making this decision. The German instructions can be found in Appendix G followed
by a sample item in Appendix H.
10.2.2.3 Worry scale
The worry scale was constructed based on Kanfer and Ackerman (1989) and consisted
of a total of five items. Participants were asked to indicate, on a 7-point Likert scale,
how much a certain worry distracted them while working on the arithmetic task. Sample
items include the worry about finishing the task and the worry about my performance.
For a full list of items and the German instructions given please refer to Appendix I and
Appendix J. The calculated worry score served as one of our dependent variables. The
maximum worry score was denoted by a score of 35. A minimum worry score was
denoted by a score of 7.
10.2.3 Procedure
The procedure did not change greatly from the procedure presented in the prior
chapter on pre-test 1. A second threat condition was added resulting in a 3x2 design
with the three different experimental conditions, Threat, Blatant Threat and No Threat,
and gender as the two factors.
SHE SAVED THE WORLD A LOT
99
Participants were led into the laboratory where they gave their consent to
participate in the study. According to the cover story, the research focused on decision-
making and performance. All participants were given the same instructions to answer
the first mathematics test, the numerical sequence task. This instruction can be found in
the chapter summarizing the first pre-test. After completing the first mathematical test,
participants performed on the filler task including ice-cream described above.
After the filler task, participants were randomly assigned to one of three
conditions. One third of participants was in the No Threat condition and followed the
instruction for the arithmetic test as described in the handbook of the IST 2000R and
can also be taken from the report on the prior experiment. A second third of the sample,
a group we call the Threat condition, was put under threat in the same manner as done
before. This means they were given the same instructions for the arithmetic test as the
No Threat condition with the following additional statement:
Prior studies of this material have shown differences between middle aged male and
female participants, where male participants scored higher than female participants. We
would like to test whether these differences can also be found in students of the
University of Mannheim.
The last third of the participants was also put under threat. However, in addition to
the Threat condition, these participants were asked to indicate whether they were male
or female before starting to work on the arithmetic test. This was done in order to not
only render the stereotype itself salient but also one’s own group membership and thus
the idea that gender was an important factor for performing well. We called this the
Blatant Threat condition.
SHE SAVED THE WORLD A LOT
100
After finishing the second mathematics test, participants filled out the worry scale
as well as their demographics for those individuals who have not yet done so.
Afterwards they were thanked, debriefed and rewarded.
10.3 Results
10.3.1 Assumptions
We started off by looking at the correlation between the two mathematics tests
which was slightly lower in our sample than in the test booklet (Liepmann et al., 2007)
at r = .423, p <.001. Analysis also showed a gender effect (p = .05) on the baseline
score 1 where males outperformed females. Additionally, group was an almost
significant main effect for female participants with score 1 as a dependent variable
(F (2,35) = 2.77, p = .077). We then continued by testing the assumptions for the
analysis of variance. There were no outliers in the data. Additionally, normality and
homogeneity of variance could be assumed.
10.3.2 Mathematics performance
Our main focus was the performance on the second mathematics test (score 2). We
expected a null effect for male participants and a main effect of group for females. We
continued by splitting the sample for further analyses. We did not expect either of the
threat inductions to have an effect on the male participants. This was confirmed in the
data. The model did not become significant (F (3,27) = 1.69, p = .192). Males scored
equally well in the No Threat group (M = 12.5, SD = 4.78), the Threat group
(M = 11.63, SD = 6.45) and the Blatant Threat group (M = 10.00, SD = 5.62.). For
female participants, we expected a lower performance score for participants in the
Threat and the Blatant Threat condition (H1) than for participants in the No Threat
SHE SAVED THE WORLD A LOT
101
group. The model (F (3,34) = 5.09, p = .005) showed significant differences between the
three groups F (3,34) = 3.34, p = .047). Post-hoc analyses then revealed that the effect
of group differences was driven by the score difference of the participants in the Threat
condition (M = 5.92, SD = 4.5) to both the Blatant Threat (M = 10.00, SD = 3.6) and the
No Threat group (M = 10.27, SD = 4.32). The Threat condition performed significantly
worse than the No Threat group (t (25) = 2.55, p = .017) and the Blatant Threat
condition (t (21) = 2.38, p = .027).
Prior analysis had also shown groups to already differ slightly on score 1 This is
why it is important to also look at the participants’ score development from the number
sequences task to the arithmetic problems task as this method includes less error
variance. This was the basic idea behind hypothesis 2 which predicted the differences
between score 1 and score 2. To calculate these differences, we standardized the results
according to the IST 2000R test booklet (Liepmann et al., 2007). Parallel to the first
hypothesis, no differences were expected for any of the male participants between
score 1 and score 2. The difference scores were not significantly different between
groups, F (2,27) = .44, p = .65. Further results however showed males in the No Threat
condition to perform significantly worse on the second mathematics test (t (7) = 2.36,
p = .05). Males in the two threat conditions did not reduce their performance
significantly. Looking at the standardized averages of all three male groups of their
score 1 performance, one can see that the No Threat group (M = .43, SD = .65) was the
only group that performed above average of their age group and the Threat group
(M = - .38, SD = 1.22) and the Blatant Threat group (M = -.32, SD = 1.28) performed
below average.
For the female participants we expected the performance decrements to be larger
for participants in the Threat and the Blatant Threat condition than for those participants
SHE SAVED THE WORLD A LOT
102
in the No Threat group (H2). The analysis of variance analysis did not become
significant F (2,35) = 2.12, p = .135. Nonetheless, we found that there was a significant
reduction from score 1 to score 2 for the females in the Threat group (t (11) = 3.98,
p = .002), and the Blatant Threat group (t (10) = 2.36, p = .04). The difference was not
significant for the No Threat group (t (10) = .497, p = .63).
10.3.3 Worry scale
Our last hypothesis concerned the worry scale. In order to analyze it, we first
checked consistency within the scale by looking at Cronbach’s alpha. The results
showed an alpha of ⍺ = .89 across all 5 items and all participants. This means the
internal consistency of our worry scale is moderate to high and therefore can be turned
into a single score to be used for analysis (George & Mallery, 2002). Descriptively,
women (M = 15.79, SD = 8.14) had more intrusive worry thoughts than men
(M = 13.23, SD = 7.11). This difference however was not significant. We expected no
significant differences between the conditions for the male participants. The analysis of
variance revealed that this is the case. Descriptively males in the Threat condition
(M = 10.36, SD = 4.67) reported the lowest amount of intrusive worry thought in
comparison to the Blatant Threat condition (M = 14.33, SD = 7.89) and the No Threat
condition (M = 15.5, SD = 8.18). For the female participants, we predicted higher levels
of worry for the participants in the two threat conditions (H3) but the analysis of
variance did not show a significant difference between female groups either. Females in
the No Threat group scored an average M = 15.2, SD = 7.31, women in the Threat
group scored M = 14.25, SD = 7.4 and women in the Blatant Threat group scored
M = 18.27, SD = 10.01.
SHE SAVED THE WORLD A LOT
103
10.4 Discussion
The first goal of this experiment was to fix some of the problems that occurred
during the first pre-test. The second goal was to continue the search for an appropriate
stereotype threat induction. We addressed one concern of the first experiment by adding
male participants to the data collection process and thus hopefully reducing unwanted
group membership salience. We also added a second stereotype threat induction to
control for credibility and strength of salience of the negative stereotype.
Our first hypothesis dealt with the performance on score 2 while controlling for
the performance on the number sequence task. As expected males performed equally
well across all three conditions and were not affected negatively by either of the threat
inductions. For the female sample we found that those participants that were in the
Threat condition performed significantly worse than participants in the other two
conditions. However, we also expected participants in the Blatant Threat condition to
perform worse than the No Threat group. Therefore our hypothesis was not completely
confirmed. This finding however might partially be due to an imperfect randomization.
This was seen in the marginally significant differences between groups already on their
score 1 performance. Therefore we also looked at the score differences between the two
mathematics tests. Here we see a nice pattern of stereotype threat in the female sample.
Only those participants who had either of the threat inductions performed significantly
worse on the second test in comparison to their score 1 performance. Females who were
solely given the task instruction did not perform worse. Even though this pattern was
not clearly seen solely by looking at the score 2 results, we can assume that both
stereotype threat inductions worked. Contrary to what we expected, males in the No
Threat condition performed significantly worse on the second mathematics test. One
way to look at it is to consider where participants started. While the three male groups
SHE SAVED THE WORLD A LOT
104
did not differ significantly on score 1, in their standardized form it is easy to see that the
males in the No Threat group performed exceptionally well while the two Threat
conditions performed below average. It is therefore possible that due to a problem with
the randomization, the male participants in the No Threat group were especially savvy
when it comes to number sequences, but had a harder time solving arithmetic problems.
Nonetheless, descriptively, even on score 2, male participants in the No Threat
condition still scored the highest.
We also used an intrusive worry thought scale as a third indicator for stereotype
threat effects. Worry is often cited as a mediator between stereotype threat and
performance due to intrusive thoughts that distract (e.g. Osborne, 2001). We thus
expected females in the two threat conditions to report higher intrusive thoughts than
females in the No Threat condition. The analysis showed that the difference between
groups was not significant. Descriptively females in the Blatant Threat condition
reported the highest number of intrusive worry thoughts. For male participants we did
not expect any differences between groups, which was confirmed in the analysis of
variance. Nonetheless, descriptively males in the Threat condition seemed to have the
least amount of intrusive thoughts. This finding can easily be explained. Male
participants who were told their group was expected to perform well on the given task
had to worry less about their task performance. Overall it needs to be noted that levels
of intrusive worry thoughts were relatively low for all participants. It is therefore
debatable whether this measure is a reliable way to capture threat effects as originally
planned.
Before coming to a conclusion, there are a couple of general things that need to be
addressed about this experiment. Firstly, one problem we need to address is
randomization which seems to partially not have worked in our sample. One way we
SHE SAVED THE WORLD A LOT
105
already tried to counteract this is by using the first mathematic scores as a baseline and
control variable. It is thanks to this that we were able to detect the stereotype threat
effect through the differences in scores.
The main goal of this experiment was to decide on a stereotype threat induction to
use in later research. To do so, let us review our results one more time. While only the
female Threat condition showed a lower score 2 performance in comparison to the
Control group, difference scores between score 1 and score 2 show that also the Blatant
Threat group performed significantly worse in comparison to their score 1 performance.
As the score comparison tests within subjects and thus error variance is reduced (Field,
2013), we take that as a good indicator for both our stereotype threat inductions. We
conclude that both threat inductions worked while the expected null effect occurred for
our Control group. In a next step, we need to decide which one of the threat inductions
should be used for future experiments. Both hypotheses, the hypothesis about
performance on score 2 and the hypothesis about the score difference between the
number sequence test and the arithmetic test were confirmed. However, the hypothesis
about worry thoughts was not. In fact, descriptively, participants in this condition
reported the lowest levels of worry. The blatant threat induction on the other hand did
not show threat effects solely looking at the results of the second mathematics test. But
once we looked at the performance of the first mathematics test, it became clear that
complete randomization had failed in our sample. Thus, in this case, looking at the
within subject development is more important where the Blatant Threat group, same as
the Threat group, also shows a significant reduction in performance. Additionally, the
Blatant Threat group also reported the highest levels of intrusive worry thoughts. In
conclusion, we chose to use the blatant threat induction for future studies as we saw
indicators of stereotype threat not only on the level of performance but also worry.
SHE SAVED THE WORLD A LOT
106
11 Study 1: The Counterstereotypic Association Training and stereotype threat
11.1 Introduction
Now that we have tested different threat inductions against one another, we can
finally start pursuing our real intent; to examine the influence of the Counterstereotypic
Association Training on stereotype threat effects. As we are exploring the effectivity of
the Counterstereotypic Association Training in stereotype threat situations and the
potential mediators of this effect in a stepwise approach, the leading research question
of this first study was whether the Counterstereotypic Association Training had an
attenuating effect on the participants in the stereotype threat condition. To answer this
question, we compared a Counterstereotypic Association Training group with a Control
Training group. We also compared a Threat condition against a No Threat condition.
Additionally we also asked participants about their intrusive worry thoughts while
completing the arithmetic test.
Stereotype threat theory predicts girls exposed to threat to underperform in
comparison to girls not exposed to threat. However, with the Counterstereotypic
Association Training as a useful buffer against stereotype threat effect we predicted the
following results:
Hypothesis about score 2:
H1: The Control Training Threat group performs significantly worse on the
arithmetic test than the Control Training No Threat group, the Countersterotypic
Association Training Threat group and the Countersterotypic Association Training No
Threat group.
SHE SAVED THE WORLD A LOT
107
As threat was induced before the arithmetic test, it should only affect performance
on this test and not the number sequence task. With the Counterstereotypic Association
Training as an effective buffer against threat effects, we expected the following results
when comparing the two tests:
Hypothesis about the difference between score 1 and score 2:
H2: The difference score between the arithmetic test (score 2) and the number
sequence test (score 1) is larger for female participants in the Control Training condition
than for participants in the Control Training No Threat group, the Countersterotypic
Association Training Threat group and the Countersterotypic Association Training No
Threat group.
Heightened levels of worry are thought to mediate stereotype threat effects in a
way that threat causes higher levels of worry that then hinders individuals to perform to
their full potential (Osborne, 2001). As the Counterstereotypic Association Training
should buffer against threat effects, we expected the following results on the worry
scale:
Hypothesis about worry thoughts:
H3: Participants in the Control Training Threat group have higher levels of
intrusive worry thought than participants in the Control Training No Threat group, the
Countersterotypic Association Training Threat group and the Countersterotypic
Association Training No Threat group.
SHE SAVED THE WORLD A LOT
108
11.2 Methodology
11.2.1 Sample and overview
Participants were recruited from a senior year of an all girls high school in
Germany. As the threat was only supposed to affect girls, we decided to begin our
investigation by only sampling girls. In comparison to the first pre-test, the study was
conducted at an all girls school. We did not expect gender to be salient or to be made
salient by sitting in the laboratory surrounded by only females as explained by the
distinctiveness theory (McGuire et al., 1978) in the chapter on the Counterstereotypic
Association Training. 104 girls between the ages of 16 and 20 participated. On average
participants were M = 17.72 years old, SD = .66. Underage participants brought in a
permission slip to participate in the study signed by one of their parents. Data were
collected in sessions lasting 60 minutes each that participants signed up for in advance.
They were told the study was investigating image processing and performance. During
the study, participants alternated between a laptop and a PC. A female laboratory
assistant seated participants but no further interaction was needed between them.
Instruction was solely given through the PC and laptop. At the end of the study,
participants were thanked. Participants were not compensated individually, instead for
each participating student money was donated to the class fund.
11.2.2 Material
11.2.2.1 Counterstereotypic Association Training
The Counterstereotypic Association Training was first developed by Kawakami et
al. (2000) as a training to reduce automatic stereotype activation. It consists of two
different elements, pictures of male and female high school students and a list of traits
that are typically perceived as either male or female. A full list of the adjectives can be
SHE SAVED THE WORLD A LOT
109
found in Appendix K. It is the same list Kawakami, Dovidio and van Kamp (2005) used
for their Dutch sample. It is therefore to be expected that the traits will be similarly
understood in our German sample. In total there were 40 images taken from old high
school yearbooks, showing 20 males and 20 females. There were also 40 trait words. Of
these 40 trait words, 20 were associated with the female gender and 20 with the male
gender. It is also important to note that half of the traits were positive traits, whereas the
other half was perceived as negative.
During the training, participants were presented with one of the pictures as well as
one female and one male trait word. They were instructed to choose the word that is not
typically associated with the image shown. For example, if participants were presented
with an image of a young male with the trait words “gentle“ and “powerful“, the correct
response was “gentle“, because it is a trait not typically associated with men. Words on
the left side of the image were chosen by pushing the “Y“ key, while words chosen from
the right side of the image were selected by pressing the “N“ key. The screen remained
the same until participants responded. A sample screen can be seen in figure 1.
Additionally, within one trial, positive female traits were only mixed with positive male
traits and vice versa for negative traits. The side of the correct answer was also
counterbalanced. Participants had to answer on 480 trials in total, separated into six
blocks. After each block participants were given the opportunity to take a break and
continue at their own speed by pushing the space bar.
11.2.2.2 Control Training
In contrast to Kawakami et al. (2000) and Kawakami, Dovido and van Kamp
(2005), in order to control for effects like ego depletion, we decided to give the Control
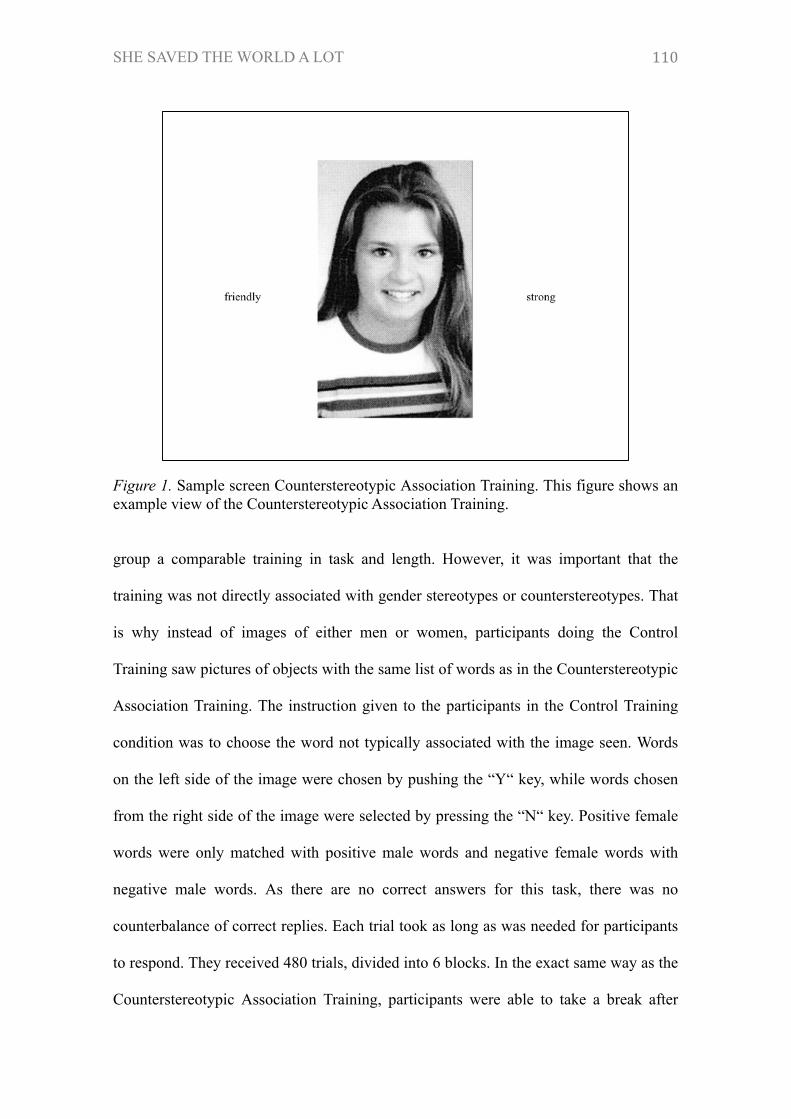
SHE SAVED THE WORLD A LOT
110
Figure 1. Sample screen Counterstereotypic Association Training. This figure shows an example view of the Counterstereotypic Association Training.
group a comparable training in task and length. However, it was important that the
training was not directly associated with gender stereotypes or counterstereotypes. That
is why instead of images of either men or women, participants doing the Control
Training saw pictures of objects with the same list of words as in the Counterstereotypic
Association Training. The instruction given to the participants in the Control Training
condition was to choose the word not typically associated with the image seen. Words
on the left side of the image were chosen by pushing the “Y“ key, while words chosen
from the right side of the image were selected by pressing the “N“ key. Positive female
words were only matched with positive male words and negative female words with
negative male words. As there are no correct answers for this task, there was no
counterbalance of correct replies. Each trial took as long as was needed for participants
to respond. They received 480 trials, divided into 6 blocks. In the exact same way as the
Counterstereotypic Association Training, participants were able to take a break after
SHE SAVED THE WORLD A LOT
111
each block and were able to decide themselves when to continue by pushing the space
bar.
11.2.3 Instruments
11.2.3.1 Mathematics test
After the pre-test, using the IST 2000R, did not show any floor or ceiling effects
for the mathematics performance and we were able to show threat effects, we decided to
continue using these problems in our first study investigating the effectiveness of the
Counterstereotypic Association Training. Please refer to the prior chapters on the pre-
tests for a full description. For this age group, the average performance score for the
number sequence task was M = 12.54, SD = 5.12. For the arithmetic task, the average
performance score was M = 13.08 = 4.03. The results of the two mathematics tests
served as our dependent variables for H1, the performance difference on score 2 where
participants in the Control Training Threat group scored the lowest, and for H2, the
difference score between score 1 and score 2 where participants in the Control Training
Threat group showed the largest difference.
11.2.3.2 Worry scale
We also used the same worry scale as presented before in the style of Kanfer and
Ackerman (1989). As with the IST 2000R mathematics problems, please refer to the
prior chapters on the pre-tests for a full description. Participants’ answers to the worry
scale served as our dependent variable for H3. Here we expected participants in the
Control Training Threat group to have the highest levels of worry in comparison to the
three remaining groups.
SHE SAVED THE WORLD A LOT
112
11.2.4 Procedure
The study was a 2x2 design. The first factor, threat, meant that participants were
either put in a stereotype threat eliciting situation or not. The second factor was the
Counterstereotypic Association Training vs Control Training. Analyses were done
across groups as well as within participants as they performed on the two mathematics
test.
The participants were welcomed and seated at the beginning of the time slot they
signed up for. There were never more than 10 participants at any given point in time and
participants started and finished together.
Participants started by giving consent themselves or handing in their signed
consent forms. At the PC they received a brief walk-thru of the study and were told that
the goal of the study was to relate image processing and performance. The first task was
the completion of number sequences from the IST 2000R as a baseline measure of their
mathematics skills and was filled out at the PC. The instructions remained the same as
for the pre-tests as well as the original instructions given in the handbook. Participants
were also told to make an effort as they would be able to compare their results with all
participants at the end. Here it was left vague that participants were only from an all
girls school in order to also include potential male participants to compare themselves
to. Participants then had 10 minutes to finish all problems. The page automatically
reloaded after the 10 minutes were up. Next, participants either received the
Counterstereotypic Association Training or the Control Training which was
programmed in Open Sesame and was completed on the laptops by the participants.
This was randomly assigned. Instructions read as follows1:
1For the original German instructions, please refer to the Appendix L.
SHE SAVED THE WORLD A LOT
113
For the following part of the experiment, we would like you to look at a number of
pictures and words. Each time, an image will appear at the center of the screen as well
as two words, one left and one right of the image. Your task is to choose the word NOT
culturally associated with the image in the center.
If this word is located on the left side of the image, please press Y. If this word is located
on the right side of the image, please press N.
You will see 480 different combinations of images and words. These are broken down
into six blocks. At the end of each block you will see a white page. Here you have the
opportunity to take a break. Press the space bar to continue.
On average participants needed around 30 minutes to finish all 480 trials.
In a next step, participants were also randomly split into the Threat or No Threat
condition. Instructions remained the same as presented in the prior chapters concerning
the pre-tests. As mentioned before, we chose the option including making the stereotype
salient as well as the group membership, meaning also asking participants to mark their
gender in the stereotype threat condition. Participants once again had 10 minutes to
finish the arithmetic problems. Afterwards, participants completed the worry scale,
reported their demographics if they had not done so before and were given the
opportunity to comment on the study. At the end, they were asked not to divulge the
exact content of the study to their classmates in order to inhibit spillover effects. Then
participants were thanked for their participation and dismissed.
SHE SAVED THE WORLD A LOT
114
11.3 Results
11.3.1 Assumptions
Before looking at our hypotheses, we first checked the data. In a first step we
checked whether there was a difference between the four groups based on their
performance on the number sequence task that was introduced in the same way for
everyone. The analysis of variance was not significant F (3,100) = 1.46, p = .229.
However looking at post hoc comparisons, there seemed to be a difference between the
Threat and the No Threat condition as t (102) = 2.06, p = .041. Participants later put in
the Threat condition (M = 8.42, SD = 5.12) already scored lower on the number
sequence task than participants later not put in the stereotype threat condition
(M = 10.47, SD = 5.01). Therefore the number sequence score was used as a control
variable for further analyses. In a next step, we looked at the correlation between score
1 and score 2 to further justify its use as a baseline measure. Overall the correlation was
in an acceptable range r = .534, p < .001. Splitting the file into the four different groups,
the correlation was highest for participants in the Control Training No Threat condition
with r = .686, p < .001 and lowest for participants in the Control Training Threat group
r = .373, p = .055. Lastly, we checked whether the assumptions for the analysis of
variance were fulfilled. The data were normally distributed and variance homogenous.
Outlier analysis revealed five outliers by influence using Cook’s distance score that
were later excluded from analysis following Bollen and Jackman’s (1990) cut-off
formula 4/n.
After checking the assumptions for our dependent variable, we checked the
Counterstereotypic Association Training data. The reaction time data was
logarithmically transformed as suggested by Fazio (1990) and the transformed data
were used for analysis. Participants who on average responded faster than 300ms were
SHE SAVED THE WORLD A LOT
115
excluded from analysis similar to Gawronski and et al. (2008). The reaction time also
showed a learning effect in the course of the Counterstereotypic Association Training.
Participants not only got continuously faster in reacting to trait words from Block 1
M = 3769,9, SD = 1093.9 to Block 6 = 1975.9, SD = 946.8 (reaction time here reported
untransformed), but also remained stable in the number of correct answers given. Based
on these results, we continued testing our hypotheses.
11.3.2 Mathematics performance
Our first hypothesis predicted a specific interaction of one group against three
others. We predicted the participants in the Control Training Threat group to perform
significantly worse than the participants of the remaining three groups (H1). We
therefore decided to not test this interaction with a normal analysis of variance
interaction, but because our hypothesis was specific to use planned contrasts as
suggested by Field (2013). Three orthogonal contrasts were calculated. The first
contrast compared the Control Training Threat group against all other groups referring
to hypothesis 1. Thus the first contrast was coded with the weights [ -3 1 1 1 ]. The
second contrast compared the Counterstereotypic Association Training Threat group
with the two No Threat groups while ignoring the Control Training Threat group. The
weights attributed to this contrast read [ 0 -2 1 1 ]. Lastly, the third contrast compared
the two No Threat groups while ignoring the two Threat groups. The weights for this
contrast were [ 0 0 -1 1]. The results showed the model to be significant F (4,94) = 9.4,
p < .001. Controlling for score 1, the predicted contrast of the Control Training Threat
group performing below all other groups became significant F (4,94) = 5.44, p = .022,
d = .58. The interaction showed that participants in the Control Training Threat group
performed worse than participants in the other three conditions. Descriptively, as can be
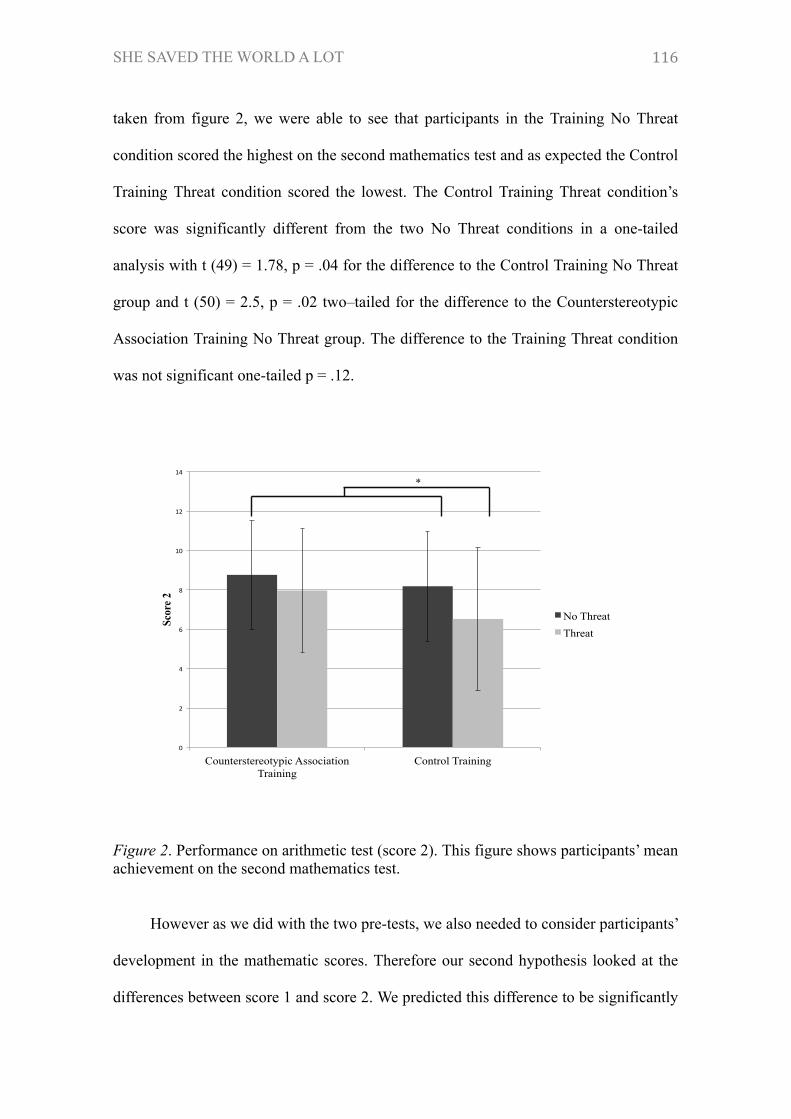
SHE SAVED THE WORLD A LOT
116
taken from figure 2, we were able to see that participants in the Training No Threat
condition scored the highest on the second mathematics test and as expected the Control
Training Threat condition scored the lowest. The Control Training Threat condition’s
score was significantly different from the two No Threat conditions in a one-tailed
analysis with t (49) = 1.78, p = .04 for the difference to the Control Training No Threat
group and t (50) = 2.5, p = .02 two–tailed for the difference to the Counterstereotypic
Association Training No Threat group. The difference to the Training Threat condition
was not significant one-tailed p = .12.
Figure 2. Performance on arithmetic test (score 2). This figure shows participants’ mean achievement on the second mathematics test.
However as we did with the two pre-tests, we also needed to consider participants’
development in the mathematic scores. Therefore our second hypothesis looked at the
differences between score 1 and score 2. We predicted this difference to be significantly
0
2
4
6
8
10
12
14
Counterstereotypic Association Training
Control Training
Scor
e 2
No Threat
Threat
*
SHE SAVED THE WORLD A LOT
117
larger for the Control Training Threat group (H2) than for the Counterstereotypic
Association Training group. To analyze this, we once again standardized the
performance scores according to the correct age range in the test booklet (Liepmann et
al., 2007). Moving on, participants across all groups performed worse on the arithmetic
test than the number sequences with all t > 2.8. These differences were also all
significant. The interaction that the Control Training Threat group showed the largest
performance drop from score 1 to score 2 did not become significant. What could be
seen by looking at the mean difference scores, however, is a descriptive main effect of
training condition. The Control Training Threat condition scored a mean difference of
M = -.85, SD = 1.11 and the Control Training No Threat condition scored a mean
difference of M = -.89, SD = .76. In comparison to the Counterstereotypic Association
Training Threat condition who scored M = -.39, SD = .88 and the Counterstereotypic
Association Training No Threat condition with a M = -.59, SD = .79. None of these
differences between groups are statistically significant. On a last note, all participants
underperformed in terms of what is expected of their age range according to the
handbook (Liepmann et al., 2007).
11.3.3 Intrusive worry thoughts
The third hypothesis addressed intrusive worry thoughts as another indicator of
threat effects. Here we predicted a higher level of worry for participants in the Control
Training Threat condition in comparison to the three other groups (H3). To analyze this
hypothesis, we firstchecked the internal consistency of the worry scale. With a
Cronbach’s Alpha of ⍺ = .84 we had a good internal consistency according to George
and Mallery (2002). As we once again had a specific hypothesis, a planned contrast
analysis was the appropriate tool. The model did not reach conventional levels of
SHE SAVED THE WORLD A LOT
118
significance. However, descriptively once again the Counterstereotypic Association
Training No Threat group showed the lowest levels of worry M = 14.63, SD = 7.24
while the Control Training Threat condition M = 17.59, SD = 5.8 showed the highest
level of intrusive worry thoughts. The Counterstereotypic Association Training Threat
group (M = 15.84, SD = 8.01) and the Control Training No Threat group (M = 16.72,
SD = 7.05) were situated in between.
11.4 Discussion
The goal of the study was to test whether the Counterstereotypic Association
Training is a suitable tool to reduce stereotype threat effects. Overall we can say that
this seems to be the case. Our first hypothesis predicted a lower score for those
participants put under threat who did not receive the training. This was confirmed by the
data pattern. Participants in the Control Training Threat condition scored the lowest on
the arithmetic test, controlling for their performance on the number sequence task.
Additionally, the medium sized effect shows that it is a worthwhile reduction of threat
effects. Descriptively, it is also interesting to note that the participants in the
Counterstereotypic Association Training condition who did not receive the threat
induction performed the best out of all the four groups. Even though this difference is
not significant to the other No Threat group, it is nonetheless an important aspect to
look at in the future. While discussing the stereotype threat induction in the previous
chapters, we mentioned that solely having to solve mathematics problems can be a
milder stereotype threat induction already. If this occurred in our sample, and in fact we
are not testing a stereotype threat induction against a completely neutral but a milder
stereotype threat induction, the fact that the Counterstereotypic Association Training No
SHE SAVED THE WORLD A LOT
119
Threat group performed the best would be another indicator for the effectiveness of the
Counterstereotypic Association Training.
While preparing the data, we also observed a seemingly non-random pattern.
Already on their score 1 performance, there was a difference between participants in the
Threat and No Threat condition. This difference cannot be explained by the study itself
as randomization was not performed by UNIPARK until after participants had
completed the number sequence task. It is therefore impossible for the laboratory
assistant to have known group membership while interacting with the participants.
However, this problem with randomization once again proved the necessity to look at
the relative differences between score 1 and score 2. For the score differences we
predicted a significantly larger performance decrease for the Control Training Threat
condition in comparison to the remaining three groups. All participants performed
significantly worse on the second test in comparison to the first one and there were no
significant differences between group for the size of the score differece. Descriptively,
this difference was largest for the Control Training Threat condition which shows that
our assumptions went in the right direction, even though these differences were not
significant. We also saw that training potentially plays an important role in the score
difference as the smallest differences were detected for the two Counterstereotypic
Association Training groups. As already discussed, the No Threat group might have also
experienced a mild threat induction which would cause them to underperform on the
arithmetic task as well. If this is the case, the fact that the score difference is the
smallest for the two Counterstereotypic Association Training groups is a positive
indicator for the usefulness of the training.
As for the intrusive worry thoughts, we found a similar pattern as before, meaning
that the descriptives all pointed in the expected direction where the Counterstereotypic
SHE SAVED THE WORLD A LOT
120
Association Training groups showed the lowest level of worry. None of these
differences were significant however. All in all, level of intrusive worry thought were
low.
The fitting descriptives and the lack of significance for some parts of our
hypotheses are an indicator for the need of more power for future studies involving both
the Training and the threat manipulation. Randomization seems to be another problem
to now have occurred twice. However as described above, there does not seem to be any
reason to believe that this problem is systematically caused by the experiment itself. As
we did find a clear threat effect, it is gratifying to report that solely having females in
the sample did not affect the perception of the participants. This was probably due to the
fact that gender is not a very salient category at an all girls schools to begin with
(Kessels & Hannover, 2008). Additionally participants were kept ignorant of whether
students from other schools, and thus male students, also participated in the study. This
vagueness about the scope of the study was to lead students to believe they were not
solely chosen because of their sex. Therefore using an all girls school as a population
was beneficial in this case. However, the data also showed that generally participants
performed rather poorly and below the average of what is expected of their age group.
Whether this is due to this school’s population or the fact that it was only females in the
sample cannot be established at this point.
Despite these problems and limitations, the Counterstereotypic Association
Training has shown beneficial effects in stereotype threat situations through various
indicators. We thus believe it to be a worthwhile training to further look into and to
better understand. Earlier we outlined three potential mechanisms that could explain
how the Counterstereotypic Association Training reduces stereotype threat effects. We
thus need to investigate the link between the training and the outlined mechanisms as

SHE SAVED THE WORLD A LOT
121
well as the link between the mechanisms and stereotype threat. To do so, we are firstly
going to look at how the Training itself changes measures of automatic stereotype
activation and the working self before relating the mechanisms back to stereotype
threat.
SHE SAVED THE WORLD A LOT
122
12 Study 2: The cognitive impact of the Counterstereotypic Association Training
12.1 Introduction
The previous study established a buffer effect of the Counterstereotypic
Association Training in stereotype threat situations. Participants who received the
Counterstereotypic Association Training were less affected by the stereotype threat
manipulation and performed better than those participants who did not receive the
training. We therefore concluded that it was a worthwhile training to further investigate
in relation to stereotype threat. Our next step was to further examine the how and what
the Counterstereotypic Association Training changes. Thus the leading research
question of the following study concerned itself with the cognitive processes the
Counterstereotypic Association Training influences. This study included the
Counterstereotypic Association Training vs Control Training as well as a measure of
these cognitive processes.
As a recap, in the chapter introducing the Counterstereotypic Association Training
we talked about mechanisms that could explain the link between the training and
stereotype threat. Kawakami et al. (2000) and Kawakami, Dovidio and van Kamp
(2005) proposed that the training reduces automatic stereotype activation. For
stereotype threat to have a negative impact on one’s performance, the stereotype needs
to be salient. With stereotypes not automatically activated by cues, this is one
mechanism to reduce threat effects. It is also imaginable that the Counterstereotypic
Association Training leaves gender categories useless in judging one’s own abilities and
therefore individuals do not refer to gender stereotypes when estimating their
performance ability. Lastly, the Counterstereotypic Association Training may reverse
the working self of an individual and thus align the stereotyped domain with one’s self-
SHE SAVED THE WORLD A LOT
123
perception, inhibiting pressure individuals put on themselves. As this research is
exploratory and it is unclear which of these mechanisms is the most fruitful one, we will
conduct a study investigating if and how the Counterstereotypic Association Training
changes indicators of these processes. The measures used recorded the accessibility of
masculine and feminine traits after the training was finished by looking at reaction
times. Faster reaction times are understood as a higher accessibility of the concept for
the participant. Additionally, gender self-descriptions of the participants were recorded.
Automatic stereotype activation was operationalized through the reaction time to
gendered words. Faster reaction times denote higher levels of automatic activation (e.g
Cohen, Servan-Schreiber, & McClelland, 1992). Believing the Counterstereotypic
Association Training to reduce automatic stereotype activation, we expected the
following results for the latencies:
Hypothesis concerning automatic stereotypic activation:
H1: Participants in the Counterstereotypic Association Training condition react
more slowly to gendered trait words than participants in the Control Training condition.
We measured the gender-related self-knowledge, or the gender-related working
self, by looking at the reaction time to masculine and feminine trait words. Generally
we would expect participants to react faster to trait words of their own gender in a
mixed gender situation (Kessels & Hannover, 2008). If gender is not part of the
activated self-knowledge, we expect participants to react equally fast to masculine and
feminine trait words. Believing that the Counterstereotypic Association Training can
SHE SAVED THE WORLD A LOT
124
leave the gender category useless when judging the self, we expected the following
results for the latencies for this mechanism to hold true:
Hypotheses concerning usefulness of gender category:
Hypotheses concerning latencies:
H2: The difference in reaction time between masculine and feminine trait words is
smaller for the participants in the Counterstereotypic Association Training group than
for the participants in the Control Training group.
H3a: Participants in the Counterstereotypic Association Training group react
equally fast to masculine and feminine trait words.
H3b: Participants in the Control Training group react faster to either masculine or
feminine trait words.
If the Counterstereotypic Association Training caused the working self to be
reversed and participants to have gender-related self-knowledge opposite to their own
sex more accessible, females should have masculine self-knowledge more accessible
and males should have feminine self-knowledge more accessible. Believing the
Counterstereotypic Association Training can reverse the working self, we expected the
following results for the latencies for this mechanism to hold true:
SHE SAVED THE WORLD A LOT
125
Hypotheses concerning the reversal of the working self
Hypotheses concerning latencies:
H4: Participants in the Counterstereotypic Association Training group react faster
to trait words opposite of their own sex while participants in the Control Training group
react faster to trait words associated with their own sex.
It is important to note that hypotheses about the usefulness of gender category and
the reversal of the working self cannot both be true at the same time and thus were
tested simultaneously.
A reversal of the working self can also be seen in the number of words
stereotypically belonging to a certain gender which are chosen. This measure, in
comparison to the latencies, is a more explicit measure of the working self. Generally,
on this measure, we would expect females to also choose more feminine trait words
than males and males to choose more masculine trait words than females in a mixed
gender situation (Kessels & Hannover, 2008). Believing the Counterstereotypic
Association Training can reverse the working self, we expected the following results for
the content of the self-descriptions for this mechanism to hold true:
Hypothesis about content of self-descriptions:
H5: Female participants in the Counterstereotypic Association Training condition
choose fewer feminine trait words and more masculine trait words than female
participants in the Control Training group.
SHE SAVED THE WORLD A LOT
126
H6: Male participants in the Counterstereotypic Association Training condition
choose more feminine trait words and fewer masculine trait words than male
participants in the Control Training group.
12.2 Methodology
12.2.1 Sample and overview
60 students from the University of Mannheim participated in the study. 25 of these
participants were female and on average participants were M = 22.28 years old,
SD = 3.59. 72% of the participants in the sample were studying a subject in the social
science field. The remaining 28% of students came from the field of mathematical
economics and computer science respectively. For the male subsample, 60% of students
stemmed from the social sciences, while 80% of female participants came from the field
of social sciences. Participants were approached while passing the laboratory and if
interested led into the room where they were welcomed by a female laboratory assistant.
They were told the study looked at how well individuals were able to think “outside the
box”. All instruction was given through a laptop. Therefore little interaction was needed
between the participants and laboratory assistant. On average participants needed 25
minutes to finish the study and were compensated with 2€ and chocolate or class credit
if applicable.
12.2.2. Material
12.2.2.1 Counterstereotypic Association Training
30 participants completed the Counterstereotypic Association Training. It was
prepared and used as described in the previously presented study.
SHE SAVED THE WORLD A LOT
127
12.2.2.2 Control Training
30 participants finished the Control Training which was prepared and used as
presented in the last chapter on the first experiment in this series.
12.2.3 Instruments
12.2.3.1 Cognitive measures
In order to measure the cognitive changes caused by the Counterstereotypic
Association Training, we decided to use a measure developed by Kessels and Hannover
(2008) to measure accessibility of gender-related self-knowledge. This measure
considers reaction times to gendered words in general but also reaction times to
masculine and feminine trait words separately. It thus was able to capture any of our
three potential mechanisms, as reaction time to gendered words was important for all of
them to measure strength of accessibility. 57 trait words were used and differed in part
from the list of trait words used by the Counterstereotypic Association Training. For a
full list please check Appendix M. Of these 57 words, 39 were feminine. The trait words
used were deduced from the Bem Sex Role Inventory (Bem, 1974) and pre-tested by
Kessels and Hannover (2008) on 782 8th-graders in Germany to be easily identifiable as
either masculine or feminine. We therefore expected the traits to be similarly understood
by our German university sample.
Participants were instructed to decide whether these trait words, presented to them
sequentially, applied to them or not in the given moment. If they believed the word to be
applicable to them, they were asked to press the “Y“ button. If it did not apply, the “N“
key needed to be pressed. Below each trait word, the words “Yes“ and “No“ appeared,
corresponding to the side of the key to be pressed, left for “Yes“ and “Y“, right for “No“
and “N“ which can also be seen in figure 3. Participants were instructed to decide this as
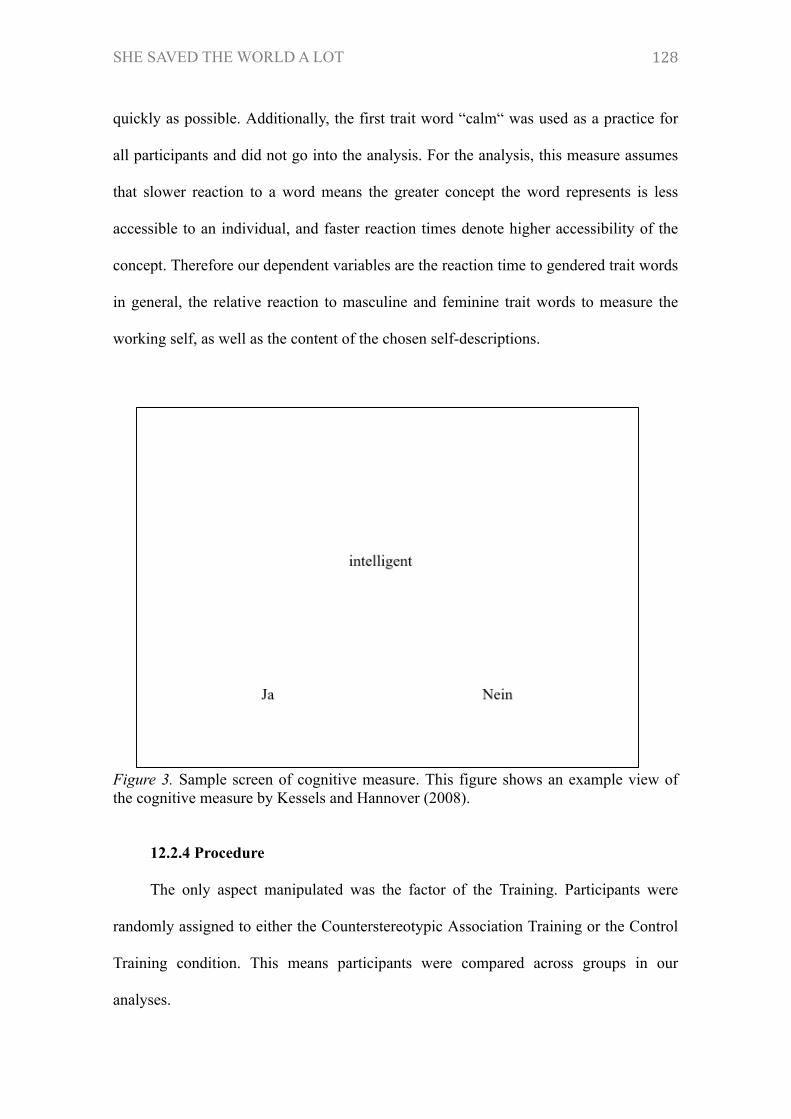
SHE SAVED THE WORLD A LOT
128
quickly as possible. Additionally, the first trait word “calm“ was used as a practice for
all participants and did not go into the analysis. For the analysis, this measure assumes
that slower reaction to a word means the greater concept the word represents is less
accessible to an individual, and faster reaction times denote higher accessibility of the
concept. Therefore our dependent variables are the reaction time to gendered trait words
in general, the relative reaction to masculine and feminine trait words to measure the
working self, as well as the content of the chosen self-descriptions.
Figure 3. Sample screen of cognitive measure. This figure shows an example view of the cognitive measure by Kessels and Hannover (2008).
12.2.4 Procedure
The only aspect manipulated was the factor of the Training. Participants were
randomly assigned to either the Counterstereotypic Association Training or the Control
Training condition. This means participants were compared across groups in our
analyses.
SHE SAVED THE WORLD A LOT
129
Participants were welcomed and seated when led into the laboratory. Once they
consented to participating in the research, all instructions were given at a laptop. The
supposed goal of the study was to test how well people were able to think outside the
box, alluding to the fact that we expected them to learn counterstereotypes. In total the
experiment only consisted of two tasks as well as demographic information. Participants
first received either of the trainings which were instructed the same way as in Study 1.
On average, participants needed around 20 minutes to finish all 6 blocks. In a next step,
all participants were asked to respond to Kessels and Hannover’s measure of
accessibility of gender-related self-knowledge. The instructions read2:
This part of the experiment focuses on yourself. Here you always have to decide
whether a description applies to yourself. This description will appear in the center of
the screen. If it applies to you, please press Y. If the description does not apply to you,
please press N. You will be able to see this distinction on the screen as well. As soon as
you have pressed the respective key, a new word will appear. Answer quickly, following
your instinct without thinking too much.
After finishing this part of the study, participants reported their demographic
information, were thanked, debriefed and compensated.
12.3 Results
12.3.1 Data preparation
Before being able to analyze the data, we had to transform the output of the
trainings as well as the cognitive measure into workable numbers. Open Sesame 2For the original German instruction, please refer to the Appendix N.
SHE SAVED THE WORLD A LOT
130
prepared an output file for each individual participant that then needed to be prepared
and combined with the results of all other participants.
Starting with the training results, mean reaction times for all 6 blocks were
calculated as well as the mean correct response for the Counterstereotypic Association
Training. No mean correct response was calculated for the Control Training as no
correct answer exists. Reaction time means were then logarithmically transformed as
recommended by Fazio (1990) and used in this state for analysis. However, for
illustrative purposes, we report the untransformed means in milliseconds here. For
participants in the Counterstereotypic Association Training, participants continuously
reacted more quickly the more blocks they had finished (Ms = 3333.2, 2367.5, 2441.7,
2302.0, 2266.8, 1980.2). For participants in the Control Training conditions the means
were similar (Ms = 3539.8, 2380.9, 2650.8, 2290.1, 2155.2, 2075.1). A repeated
measure ANOVA showed a significant linear effect of block F (1, 58) = 46.1, p < .001
but no significant effect between groups. We can also report that the number of correct
answers remained stable across all six blocks as the variable does not become
significant. We also checked mean reaction times per blocked and excluded participants
who on average reacted faster than 300ms to image word combinations as was
performed by Gawronski et al. (2008).
Next we logarithmized the raw data of the gender-related self-knowledge
measure. Mean scores were calculated for reaction time in general, reaction time to
masculine trait words as well as reaction time to feminine trait words. Larger mean
scores depict slower reaction (low accessibility) and smaller mean scores mean faster
reaction and thus higher accessibility.
SHE SAVED THE WORLD A LOT
131
12.3.2 Latencies of self-descriptions
We first tested the assumption that if the Counterstereotypic Association Training
changed the automatic activation of gender stereotypes, participants in this condition
would react more slowly to any type of gendered words, masculine or feminine. To test
this hypothesis, we conducted a univariate analysis of variance with type of training as a
factor. A main effect for type of training F (1,58) = 266.94, p < .001, d = 4.16 indicates a
clear difference in reaction times between the Counterstereotypic Association Training
condition (M = 3.18, SD = .06) and the Control Training condition (M = 2.65,
SD = .17). The difference in means can also be taken from figure 4. The means indicate
that individuals in the Counterstereotypic Association Training condition reacted more
slowly towards gendered words than participants in the Control Training condition.
We tested the hypotheses about the second and third mechanism simultaneously as
they are mutually exclusive as mentioned before. As our hypotheses refer to the relative
reaction time to masculine and feminine trait words, and thus the relative accessibility
of masculine and feminine trait words, we needed to calculate a difference score. This
calculation was done by subtracting the latencies for feminine trait words from the
latencies of masculine trait words. Thus, positive scores mean that participants react
more quickly to feminine trait words than to masculine trait words. In other words, a
positive score indicates that feminine trait words are more accessible than masculine
trait words. Following that logic, a score of zero means that masculine and feminine
trait words were equally accessible. To test the proposed hypotheses, we conducted a
2x2 analysis of variance with sex and training as the between subject factors and the
latency difference score as our dependent variable. For mechanism 2 to hold true, we
predicted a main effect expecting the difference in reaction time to be smaller for those
participants in the Counterstereotypic Association Training group than in the Control
SHE SAVED THE WORLD A LOT
132
Training group (H2). An additional hypothesis (H3) needed for mechanism 2 was the
idea that the difference in reaction was not only smaller for the participants in the
Counterstereotypic Association but that it also did not differ significantly from zero. For
the Control Training group we predicted a difference score significantly different from
zero. No interaction was predicted for mechanism 2. For mechanism 3 to hold true, we
predicted an interaction of sex and training (H4) where training changes the direction of
differences with respect to the sex of the participant. No main effect is necessary for
mechanism 3 to hold true.
The results showed a significant main effect of training F (1,56) = 8.35, p = .005
but no significant interaction or main effect of sex as can be seen in figure 5. Looking
more closely at the results, we see that overall all participants, independent of sex and
training, reacted more quickly to feminine trait words than masculine ones.
As mentioned above, a second additional hypothesis about mechanisms 2
predicted the differences to be insignificantly different from zero only for the
Counterstereotypic Association Training group (H3). This was investigated in a post-
hoc analysis which showed that only the Control Training condition male participants
t (10) = 2.92, p = .015 and female participants t (18) = 3.9, p = .001 significantly
differed from zero while all t < 2.04 for the Counterstereotypic Association Training
participants.
12.3.3 Content of self-descriptions
Another measure to disentangle the results for mechanism 2 and 3 is to look at the
choice of words. Participants were asked to say yes to those words that described them
in at that moment. Scores were caluclated by adding the recording the number of
feminine trait words chosen and the number of masculine trait words chosen. To get a
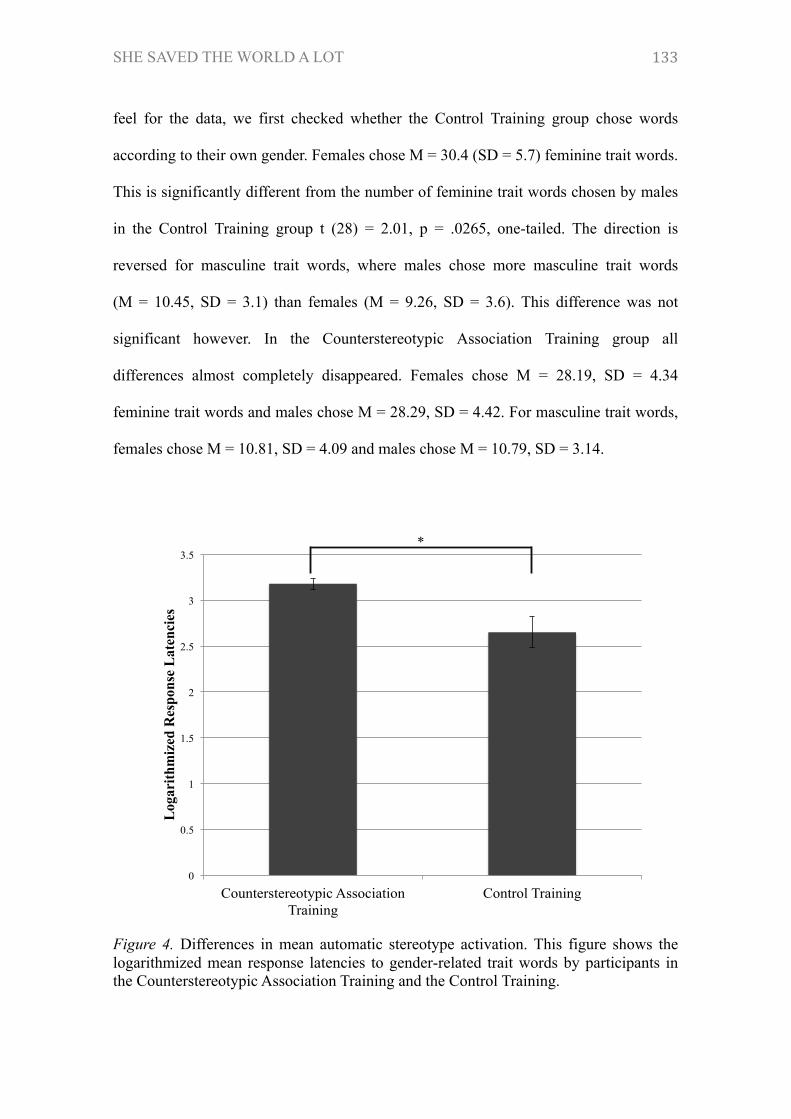
SHE SAVED THE WORLD A LOT
133
feel for the data, we first checked whether the Control Training group chose words
according to their own gender. Females chose M = 30.4 (SD = 5.7) feminine trait words.
This is significantly different from the number of feminine trait words chosen by males
in the Control Training group t (28) = 2.01, p = .0265, one-tailed. The direction is
reversed for masculine trait words, where males chose more masculine trait words
(M = 10.45, SD = 3.1) than females (M = 9.26, SD = 3.6). This difference was not
significant however. In the Counterstereotypic Association Training group all
differences almost completely disappeared. Females chose M = 28.19, SD = 4.34
feminine trait words and males chose M = 28.29, SD = 4.42. For masculine trait words,
females chose M = 10.81, SD = 4.09 and males chose M = 10.79, SD = 3.14.
Figure 4. Differences in mean automatic stereotype activation. This figure shows the logarithmized mean response latencies to gender-related trait words by participants in the Counterstereotypic Association Training and the Control Training.
0
0.5
1
1.5
2
2.5
3
3.5
Counterstereotypic Association Training
Control Training
Log
arith
miz
ed R
espo
nse
Lat
enci
es
*
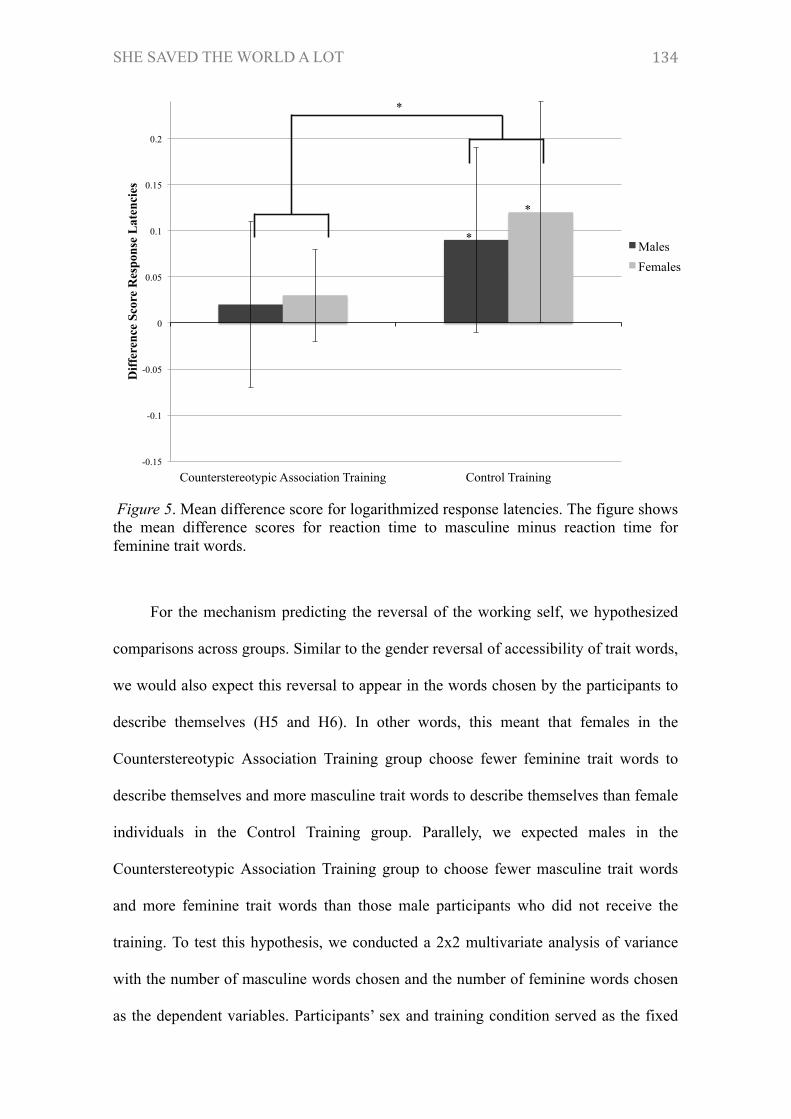
SHE SAVED THE WORLD A LOT
134
Figure 5. Mean difference score for logarithmized response latencies. The figure shows the mean difference scores for reaction time to masculine minus reaction time for feminine trait words.
For the mechanism predicting the reversal of the working self, we hypothesized
comparisons across groups. Similar to the gender reversal of accessibility of trait words,
we would also expect this reversal to appear in the words chosen by the participants to
describe themselves (H5 and H6). In other words, this meant that females in the
Counterstereotypic Association Training group choose fewer feminine trait words to
describe themselves and more masculine trait words to describe themselves than female
individuals in the Control Training group. Parallely, we expected males in the
Counterstereotypic Association Training group to choose fewer masculine trait words
and more feminine trait words than those male participants who did not receive the
training. To test this hypothesis, we conducted a 2x2 multivariate analysis of variance
with the number of masculine words chosen and the number of feminine words chosen
as the dependent variables. Participants’ sex and training condition served as the fixed
-0.15
-0.1
-0.05
0
0.05
0.1
0.15
0.2
Counterstereotypic Association Training Control Training
Diff
eren
ce S
core
Res
pons
e L
aten
cies
Males
Females
*
*
*
SHE SAVED THE WORLD A LOT
135
factors. The hypothesis predicted an interaction between these two factors. The
MANOVA model did not reach significance with F (3,56) = .74, p = .53 and neither did
the interaction effect with F (1,56) = .42, p = .52. However, in post hoc analyses, we
descriptively looked at the differences. All but one comparison pointed in the expected
direction but none were significant. The one comparison that was reversed is that males
in the Counterstereotypic Association Training condition (M = 10.8, SD = 3.2)
descriptively chose more masculine words than the males in the Control Training
condition (M = 10.5, SD = 3.1).
12.4 Discussion
We suggested three different mechanisms through which the Counterstereotypic
Association Training could reduce stereotype threat effects. In this study, we checked
the first part of that link between the Counterstereotypic Association Training and
stereotype threat. We investigated the effect of the Training on cognitive measures that
represent the mechanisms. The goal was to see which mechanism or mechanisms were
represented in the data.
The first suggested mechanism was taken from the original works. It suggested
that the Counterstereotypic Association Training reduces automatic stereotype
activation. In this study, we measured participants’ reaction time to words that describe
masculine or feminine traits while asking them whether these words described
themselves or not. As we compared across groups and not within subjects, we cannot
talk about a reduction of automatic stereotype activation. Instead we will refer to it as
lower automatic stereotype activation for one group over the other. For the
Counterstereotypic Association Training to have an effect on participants, we expected
participants in the Counterstereotypic Association Training condition to react more
SHE SAVED THE WORLD A LOT
136
slowly to gendered words in general as the match between the word’s gender and the
self was not automatically activated. The results show a significant difference in
reaction time between the Control Training and the Counterstereotypic Association
groups with the latter taking longer with a very large effect size. This means that people
who received the training on average took longer to react to gendered trait words. As we
assume slower reaction to be an indicator of lower automatic activation, we confirmed
the link between the Counterstereotypic Association Training and lower automatic
stereotypc activation.
Our second analysis tested two competing mechanisms against each other.
Mechanism 2 predicted a change in the working self in a way that gender became an
irrelevant category, meaning that it no longer played a role when judging oneself.
Mechanism 3 stated that through the Counterstereotypic Association Training the
working self of the individual reversed. We generally would expect a male participant to
have masculine trait words more accessible than feminine ones in a mixed gender
situation (Kessels & Hannover, 2008) but after having received the training feminine
trait words should be more accessible than masculine ones. To test this we had two
measures we looked at; firstly, the relative accessibility of masculine and feminine traits
words and secondly the content of the traits chosen. Our results were not unambiguous
in a way that we can completely rule out either of the hypotheses, however, they do
point in one direction rather than another. The results showed a main effect for Training
in a way that only for the Control Training group masculine and feminine traits were
differentially accessible. For the Counterstereotypic Association Training group
however, their relative accessibility score did not differ significantly from zero. In
simpler terms this means that for the Control Training group one gender was still more
accessible than the other. For the Counterstereotypic Association Training group neither
SHE SAVED THE WORLD A LOT
137
gender was dominantly accessible over the other. This main effect of Training was
predicted for mechanism 2. Additionally, the fact that the differences were not different
from zero for the Counterstereotypic Association Training group was a unique
prediction for mechanism 2.
An interaction of Training and sex on relative reaction time was predicted for
mechanism 3. However, it did not reach conventional levels of significance. This can be
explained by looking at the results of the post-hoc analyses. Descriptively, males in both
training conditions had feminine trait words more accessible than masculine ones. The
fact that on average males in our sample had feminine trait words more accessible also
explains the insignificant predicted main effect for sex. The question that now arises is
why the males in the Control Training group reacted more quickly to feminine trait
words than masculine trait words. One possible explanation for this is the nature of the
sample. The University of Mannheim is known for its focus on the social sciences and
business. While fields such as mathematical economics and mathematics for teachers
exist, a large proportion of the male sample, namely 60% (72% of the overall sample),
were students of the social sciences, a stereotypically feminine domain (Lojewski,
2011). With that environment in mind, it is not impossible that the male participants had
feminine trait words more accessible than masculine ones. Even though the data pattern
for male participants made it difficult to find the predicted interaction, the results in
general still tell us something about mechanism 2 and mechanism 3. For mechanism 3
to hold true over mechanism 2, instead of equalizing their relative accessibility of male
and female trait words, the males in the Counterstereotypic Association Training should
have remained at a similar level of female trait word accessibility to the males in the
Control Training condition. Additionally, for the interaction predicted for mechanism 3,
we would also have predicted the females of the Counterstereotypic Association
SHE SAVED THE WORLD A LOT
138
Training group to have masculine trait words more accessible than feminine ones. This
however was not the case. Based on the latencies, with the difficulty regarding the
interaction as well as the sex main effect in mind, we therefore conclude that the data
show a clearer tendency towards mechanism 2.
One way to further debunk the question of mechanism 2 versus mechanism 3 is
our second, more explicit, measure of working self; the content of the self-descriptions.
We calculated the average amount of feminine and masculine traits chosen. For the
Control Training group, females chose significantly more feminine trait words than
male participants. No significant difference was found for masculine trait words which
could be due to the lower number of masculine trait words to begin with. Nonetheless,
the direction was as expected. As for mechanism 3, we looked at between group
comparisons which all but one pointed in the expected direction. However, they all
remained far from significant. As the direction of the comparisons mostly pointed in the
expected direction, we tentatively say that the content of self-descriptions point towards
mechanism 3. The insignificance might be due to sample size for example, however, no
significant results prevent us fom concluding this definitely. Lastly, concerning the
content of the self-description, it needs to be noted that the content of self-descriptions
does not allow looking at mechanism 2. Furthermore, as an explicit measure, it is not as
sensitive to changes in the working self as the relative accessibility using reaction time.
We should therefore take these results as an additional indicator to the relative
accessibility, but not as a decisive one.
The difficulty that goes in line with using the results of the content of the self-
descriptions also goes in line with the idea that mechanism 3 might solely be a further
development from mechanism 2. We generally need to be aware that by using the
original instructions of the Counterstereotypic Association Training, we might be unable
SHE SAVED THE WORLD A LOT
139
to capture this development. This inability to detect mechanism 3 in the reaction time
might be due to the length of the Counterstereotypic Association Training as it might
just not be extensive enough to really reverse the working self. While we cannot answer
this question at this point in time, it is something to keep in mind for the future.
To summarize, this experiment allowed us to check three different hypotheses of
how the Counterstereotypic Association Training affects cognitive measures of
individuals. The first mechanism was confirmed as participants in the
Counterstereotypic Association Training group reacted more slowly to gendered words
and we can thus assume them to have lower automatic stereotype activation than
participants in the Control Training group. For mechanism 2, the uselessness of the
gender category for the working self and mechanism 3, the reversal of the working self,
no definite answer is possible at this point. However, the latency data of this study point
in the direction of mechanism 2 despite problems such as the nature of the sample as
elaborated upon above. The content of the self-description might be an indicator that
mechanism 3 could still hold true with more extensive training. A next study certainly
calls for a larger sample in order to detect smaller potential differences when looking at
the content of self-descriptions.
The point of this complete work is to show the effect of the Counterstereotypic
Association Training on stereotype threat. Therefore we now need to put these
mechanisms in relation to stereotype threat. This will be the idea of the next experiment.
SHE SAVED THE WORLD A LOT
140
13 Study 3: The impact of threat
13.1 Introduction
In the last study, we looked at how different cognitive measures were influenced
by the Counterstereotypic Association Training. We laid out three different manners in
which cognitive measures could be changed; firstly, through a lower automatic
stereotype activation and secondly, through changes in the working self that either leave
gender as a useless category or reverse the direction of the working self for the
individual. In the last experiment we were able to show that participants who received
the Counterstereotypic Association Training had lower automatic stereotype activation
than participants in the Control Training group. In this study, in addition to the between
group comparison, we also want to look at the temporal development of automatic
stereotype activation, especially whether it holds across the threat induction.
Furthermore, the results point in the direction that the working self changes in a way
that gender becomes an obsolete category when judging the self. That being said, the
results did not allow us to definitely conclude that this is the way the working self is
influenced. This will be one of the points addressed in the following experiment. The
goal of this study is to bring stereotype threat back into the equation and see how the
proposed mechanisms are influenced by the threat induction. As we defined the working
self as malleable, we measured it at three different time points to see how it progressed
throughout the study, especially for those participants confronted with threat. This study
consisted of a 2 (sex) x 2 (training) x 2 (threat) design. It included measures for the
working self and automatic stereotype activation. We tested the three proposed
mechanisms in the same way as elaborated before, however, additionally, we also
included the Counterstereotypic Association Training’s effects on stereotype threat.
SHE SAVED THE WORLD A LOT
141
Stereotype threat theory predicts girls exposed to threat to underperform in
comparison to girls not exposed to threat. Believing the Counterstereotypic Association
Training to be a useful buffer against stereotype threat effect, we predicted the
following results:
Hypothesis about stereotype threat:
H1: The Control Training Threat group performs significantly worse on the
arithmetic test than the Control Training No Threat group, the Countersterotypic
Association Training Threat group and the Countersterotypic Association Training No
Threat group.
We operationalized automatic stereotype activation through the reaction time to
gendered words meaning that faster reaction times denote higher levels of automatic
activation (Cohen, Servan-Schreiber, & McClelland, 1992). As mechanism 1 assumes
the Counterstereotypic Association Training to produce lower levels of automatic
stereotype activation in comparison to the Control Training group, we expected the
following results:
Hypothesis concerning automatic stereotype activation:
H2: Participants in the Counterstereotypic Association Training condition react
more slowly to gendered trait words than participants in the Control Training condition.
Mechanism 2 predicts the gender to be rendered a useless category for the
working self. This was operationalized through the relative reaction time to masculine
and feminine trait words. For individuals for whom the gender category is not part of
SHE SAVED THE WORLD A LOT
142
the working self, reaction times to masculine and feminine trait words should be equal.
Mechanism 2 predicted the Counterstereotypic Association Training to leave gender a
useless category. For mechanism 2 we thus predicted:
Hypotheses concerning usefulness of gender category:
Hypothesis concerning latencies:
H3: The difference in reaction time between masculine and feminine trait words is
smaller for the participants in the Counterstereotypic Association Training group than
for the participants in the Control Training group at the second measurement of the
working self (time point 2).
H4a: Participants in the Counterstereotypic Association Training group react
equally fast to masculine and feminine trait words at time point 2.
H4b: Participants in the Control Training group react faster to either masculine or
feminine trait words at 2.
Mechanism 3 predicted the Counterstereotypic Association Training to reverse the
working self in a way that females have masculine trait words more accessible than
feminine trait words and vice versa for males. For mechanism 3 to hold true, we
expected the following results:
SHE SAVED THE WORLD A LOT
143
Hypotheses concerning the reversal of the working self:
Hypothesis concerning latencies:
H5: Participants in the Counterstereotypic Association Training group react faster
to trait words opposite to their own sex while participants in the Control Training group
react faster to trait words associated with their own sex.
Additionally, a reversal of the working self can be seen in the number of
masculine or feminine trait words chosen by the individual. Generally, on this measure
by Kessels & Hannover (2008) we would expect females to choose more feminine trait
words than males and males to choose more masculine trait words than females as long
as they find themselves in a mixed gender situation. If the working self is reversed by
the Counterstereotypic Association Training, we would expect differences between the
Counterstereotypic Association Training group and the Control Training group in a way
that:
Hypothesis about content of self-descriptions:
H6: Participants in the Counterstereotypic Association Training condition choose
fewer feminine trait words and more masculine trait words than female participants in
the Control Training group.
No hypotheses were formulated for time point 3 (the measurement of the working
self after the performance task) as the progression of the working self was part of an
exploratory analysis. However, there are two points that need to be noted. Firstly, time
point 3 is interesting to look at in terms of the stability of the working self, especially
after the introduction of threat. Secondly, as previously mentioned, mechanism 3 is
potentially a further development from mechanism 2. Therefore, through a kind of
SHE SAVED THE WORLD A LOT
144
sleeper effect, it is not impossible to find the hypothesized pattern for mechanism 3 at
time point 3.
13.2 Methodology
13.2.1 Sample and overview
203 students from the University of Mannheim participated in the study. 144
participants were female while 59 were male. All participants were students between the
ages of 18 and 40 with a mean age of M = 21.75 years, SD = 3.17. 82% of all
participants were students in the field of the social sciences. Within the female sample
this number rose to 84.2%. In the male subsample, this number dropped to 76.4% of the
students in the field of social sciences. Participants were approached while passing the
laboratory and if interested were led into the room where they were greeted by a female
laboratory assistant. The study was advertised to examine the relationship between
rethinking and performance and was conducted on a laptop and a stationary computer.
All instruction was given through the computer or the laptop depending on task. Upon
entering participants were seated and laptop and computer were prepared for the study.
On average participants needed between 35 and 40 minutes to finish the study and were
compensated with 4€ and chocolate or class credit if wanted.
13.2.2 Material
13.2.2.1 Counterstereotypic Association Training
115 participants completed the Counterstereotypic Association Training. 78 of
those participants were female and 37 male. There were no differences in preparation
and implementation in comparison to the previous two studies reported.
SHE SAVED THE WORLD A LOT
145
13.2.2.2 Control Training
88 students participated in the Control Training. 66 of those were female students
and 22 male students. There were no differences in preparation and implementation in
comparison to the previous two studies reported.
13.2.3 Instruments
13.2.3.1 Cognitive measures
The same measure developed by Kessels and Hannover (2008) to capture the
working self in the previous experiment was used again to firstly look at the automatic
stereotype activation as well as the changes in the working self3. Please note that even
though this measure was originally developed to capture the working self and gender,
we believe that increased reaction time to any type of gender-related words to signify a
reduced automatic activation and thus the measure can be used to capture both the
working self and the automatic stereotype activation. Throughout the experiment the
measure was used at three time points but there were no differences in preparation and
implementation of the measure in comparison to the previous study. To recap, we chose
to use this paradigm by Kessels and Hannover (2008) as it seemed the most efficient, as
it is able to capture the changes in the working self by looking at the relative reaction
3 Other research on automatic activation has used other measures to capture automatic stereotype activation, such as lexical decision tasks. In order to verify our results, we included a sequential priming lexical decision task during our experiment, similar to the one proposed by Banaji & Hardin (1996). In this task, participants had to decided between real words and non-words which were presented in the center of the screen. Each trial started with the presentation of a prime stimulus for 200ms in the center of the screen. These stimuli were images of either women or men. The prime stimulus was followed by feminine associated words, neutral words or nonwords. In total there were 72 words to be evaluated. Half of these were nonwords, the other half real words. In total there were 18 feminine associated words and 18 neutral words. Among those 18 feminine associated words, the first half of the words was presented with a primed stimulus of a woman while the other half was presented with a primed stimulus of a man. We would expect participants with higher automaticity to react quicker to the matched words, meaning those feminine words that were presented with a prime stimulus of a woman.
SHE SAVED THE WORLD A LOT
146
time as well as the reaction time to stereotyped words in general as a proxy for
automatic activation.
13.2.3.2 Mathematics task
In order to capture stereotype threat effects, we used the same arithmetic task
from the IST 2000R. The number sequence task from the IST 2000R that was
previously used as a baseline measure of mathematics skill was not used. Instead the
last mathematic grade received in High School was recorded as a control variable. The
average normed performance score for the age group was M = 13.08, SD = 4.03.
13.2.4 Procedure
The study was a 2 (sex) x2 (training) x2 (threat) design and advertised as a study
investigating the relationship between the ability to rethink and solving different tasks.
For the first factor we differentiated between male and female participants as we
expected the working self to develop in contrasting directions for the third mechanism
to hold true. Additionally, males were added into the sample in order to not render
gender salient for everyone as described in the second pre-test presented earlier. The
second factor, training, denotes that participants either received the Counterstereotypic
Association Training or the Control Training. The last factor, threat, means that
participants were either put in a stereotype threat situation or not.
At the beginning of the study participants were greeted and seated at a table where
a stationary computer and a laptop were set up. The study started by asking participants
to give their consent to participating and the use of their data for research purposes. All
instruction was given at the computer or laptop. However, in order to reduce mistakes,
SHE SAVED THE WORLD A LOT
147
participants also found a sheet of paper on their desks showing the different steps of the
study as well as whether these were to be completed at the computer or the laptop.
All participants continued by responding to Kessels and Hannover’s measure of
accessibility of gender-related self-knowledge. As a reminder, the instruction to the task
read as follows:
This part of the experiment focuses on yourself. Here you always have to decide
whether a description applies to yourself. This description will appear in the center of
the screen. If it applies to you, please press Y. If the description does not apply to you,
please press N. You will be able to see this distinction on the screen as well. As soon as
you have pressed the respective key, a new word will appear. Answer quickly, following
your instinct without thinking too much.
After having finished this task, participants were randomly allocated to the
Counterstereotypic Association Training condition or the Control Training condition.
Participants read the following instructions:
For the following part of the experiment, we would like you to look at a number of
pictures and words. Each time, an image will appear at the center of the screen as well
as two words, one left and one right of the image. Your task is to choose the word NOT
culturally associated with the image in the center.
If this word is located on the left side of the image, please press Y. If this word is
located on the right side of the image, please press N.
SHE SAVED THE WORLD A LOT
148
You will see 480 different combinations of images and words. These are broken down
into six blocks. At the end of each block you will see a white page. Here you have the
opportunity to take a break. Press the space bar to continue.
Following the Counterstereotypic Association Training or the Control Training, all
participants were asked again to respond to Kessels and Hannover’s measure of
accessibility of gender-related self-knowledge again. In a next step, participants were
randomly allocated to the Threat or the No Threat condition. This was done by
differentially introducing the performance task. Women and men received different
tasks. All women were asked to perform on the mathematics test, while men were asked
to perform on a test about synonyms. In addition to the introduction to the task, women
in the Threat condition were told:
Prior studies of this material have shown differences between middle aged male and
female participants, where male participants scored higher than female participants. We
would like to test whether these differences can also be found in students of the
University of Mannheim.
Moreover, women in the Threat condition were asked to indicate their gender before
completing the mathematics task. The instruction for the synonym task given to all men
was:
You are given three words. There is a relationship between the first and the second
word. There is a similar relationship between the third word and one of the five words to
choose from. Your task is to find the matching word.
SHE SAVED THE WORLD A LOT
149
Example:
Forrest : Trees = Lawn : ?
a) Grass b) Hay c) Fodder d) Green e) Meadow
In this example grass is the correct answer.
After completing the performance task, all participants once again finished the working
self measure by Kessels and Hannover (2008). At the end of the study, participants
reported their remaining demographics. Afterwards they were thanked, debriefed and
rewarded.
13.3 Results
13.3.1 Data preparation
Similar to the previous study, we had to transform our raw data into workable
numbers. Firstly, the raw data from the Counterstereotypic Association Training and the
Control Training needed to be transformed. We chose to logarithmically transform the
data as proposed by Fazio (1990). The factors to look at here were firstly the reaction
time across blocks as well as the number of correct matches of word and image for the
participants in the Counterstereotypic Association Training condition. To start, we
checked the reaction times in order to find participants who did not answer either of the
trainings with care. A cut-off point at 300ms per image word combination was set
similar to Gawronski and et al. (2008). All participants who on average answered faster
than 300ms per image word combination per block were excluded from the data. This
pertained to nine participants in total. We continued by looking at the logarithmized
reaction time across blocks. A repeated measure ANOVA shows a significant linear
SHE SAVED THE WORLD A LOT
150
effect of block F (5,121) = 58.66, p < .001 but no significant effect between groups. For
a better understanding of the data and for illustrative purposes, we report the
untransformed reaction times in milliseconds. Participants in the Counterstereotypic
Association Training continuously reacted quicker from block to block (Ms = 3293.3,
2908.0, 2713.5, 2562.4, 2472.4, 2195.6). The participants in the Control Training
condition showed a similar pattern (Ms = 2852.5, 2223.0, 2132.8, 1950.2, 1841.6,
1644.8). As for the number of correct matches made, the repeated measures ANOVA
showed a significant effect with F (5,62) = 2.44, p = .044. Post-hoc analysis revealed
that the number of correct answers given during the third blocked differed significantly
from block 2, 5 and 6. However, overall, with the exception of block 3, the number of
correct answers given was stable. We can therefore conclude that participants not only
showed a learning effect across blocks by reacting faster as time moved on, but that the
number of correct answers given remained more or less stable across all six blocks.
In a second step, we transformed the raw data needed for the analyses of the
working self as well as the automatic stereotype activation. Mean scores were calculated
for reaction time in general, reaction time to masculine trait words and reaction time to
feminine trait words.
13.3.2 Assumptions
Lastly, we checked the remaining data. Instead of a baseline mathematics test
using number sequences, we asked participants to report their last high school
mathematics grade. We looked whether there was a significant difference between
groups based on their high school mathematics performance. This was not the case as
F (3, 131) = 1.13, p = .34. Participants performed equally well in high school
mathematics across all four groups. We also checked the mathematics school grade’s
SHE SAVED THE WORLD A LOT
151
correlation with the arithmetic test score in order to test whether it was an acceptable
control variable. Overall the correlation equaled r = .44, p < .001. However,
interestingly, the correlation was no longer significant for those participants that did the
Control Training and were put in the Threat condition (r = .11, p = .62). Next we tested
whether the assumptions for the analysis of variance were fulfilled. The data were
normally distributed and variance homogenous. Outlier analysis revealed 8 outliers by
influence using Cook’s distance score and Bollen and Jackman’s (1990) cut-off formula
4/n. In the end our sample totaled 186 participants. However, as we were not able to
recruit enought male participants to perform meaningful analyses, our sample included
127 women.
13.3.3 Mathematics score
Just as in our first study, we started the analysis with our hypothesis about
stereotype threat. We hypothesized a specific interaction of kind of training and threat.
We hypothesized the Control Training group that was put in a stereotype threat situation
to perform significantly worse than the remaining three groups. We therefore tested our
hypothesis with a planned contrast as suggested by Field (2013). Our three orthogonal
contrasts were coded in the same manner as in study 1 as [ -3 1 1 1 ] [ 0 -2 1 1 ] and
[ 0 0 1 -1]. The model became significant F (4,121) = 6.36 , p < .001 as well as the
predicted contrast F (4,121) = 12.31, p = .001, d = .7, even when controlling for high
school mathematics grades. A second contrast also became significant. This contrast
F (4,121) = 6.82, p = .01, d = .71 expressed a significant difference between the two No
Threat groups. The ANOVA not using contrasts also revealed a significant main effect
of training F (4,123) = 14.25, p < .001, d = .63. The main effect of threat did not reach
conventional levels of significance. Looking at the direction of the effects, participants
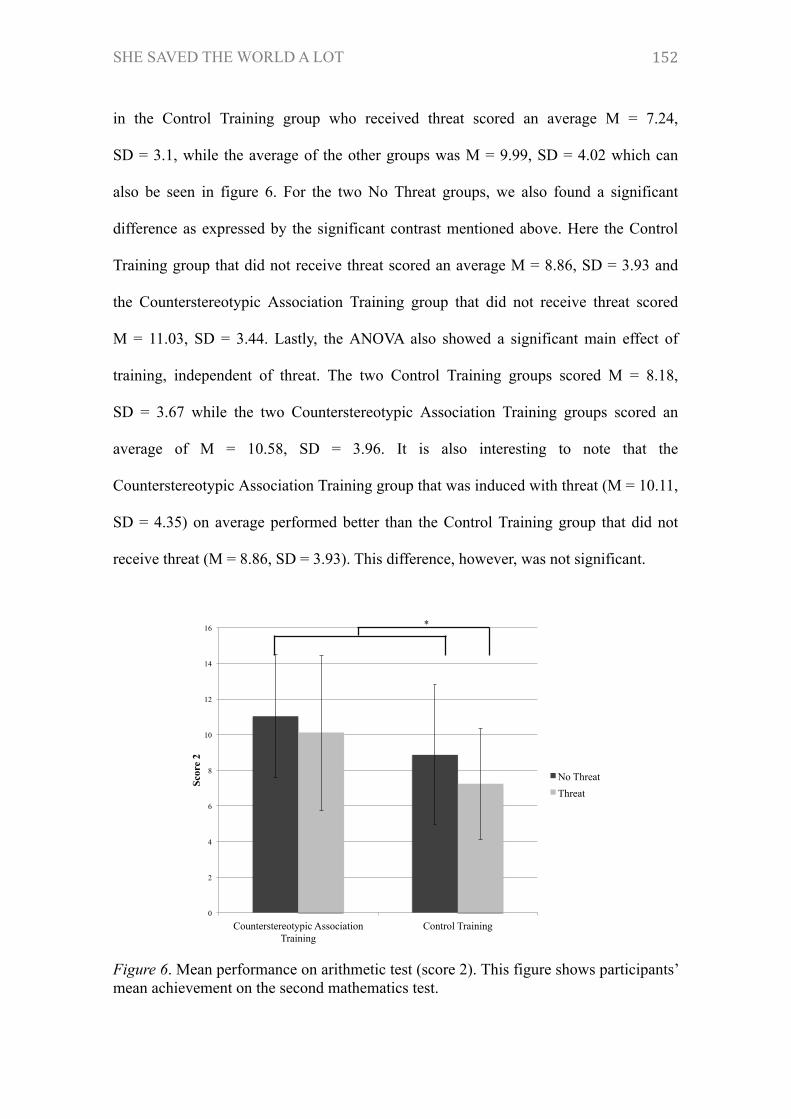
SHE SAVED THE WORLD A LOT
152
in the Control Training group who received threat scored an average M = 7.24,
SD = 3.1, while the average of the other groups was M = 9.99, SD = 4.02 which can
also be seen in figure 6. For the two No Threat groups, we also found a significant
difference as expressed by the significant contrast mentioned above. Here the Control
Training group that did not receive threat scored an average M = 8.86, SD = 3.93 and
the Counterstereotypic Association Training group that did not receive threat scored
M = 11.03, SD = 3.44. Lastly, the ANOVA also showed a significant main effect of
training, independent of threat. The two Control Training groups scored M = 8.18,
SD = 3.67 while the two Counterstereotypic Association Training groups scored an
average of M = 10.58, SD = 3.96. It is also interesting to note that the
Counterstereotypic Association Training group that was induced with threat (M = 10.11,
SD = 4.35) on average performed better than the Control Training group that did not
receive threat (M = 8.86, SD = 3.93). This difference, however, was not significant.
Figure 6. Mean performance on arithmetic test (score 2). This figure shows participants’ mean achievement on the second mathematics test.
0
2
4
6
8
10
12
14
16
Counterstereotypic Association Training
Control Training
Scor
e 2
No Threat
Threat
*
SHE SAVED THE WORLD A LOT
153
13.3.4 Latencies of self-descriptions
13.3.4.1Hypothesis about automatic activation
Our hypothesis about the automatic stereotype activation predicted participants in
the Counterstereotypic Association Training group to react more slowly to gender
associated words than participants in the Control Training group. As we measured these
latencies at three different time points, we performed a multivariate analysis of variance
with the reaction time at the three time points as the dependent variables. The model
became significant for time point 2 (right after the training) with F (1, 121) = 52.04,
p < .001 and time point 3 (right after the mathematics test) with F (1, 121) = 5.39,
p = .022. Post-hoc analyses revealed that the Counterstereotypic Association Training
group took longer to react to gender associated words than the Control Training group at
both time point 2 (M = 7.18, SD = .23 vs. M = 6.65, SD = .52) and time point 3
(M = 7.11, SD = .36 vs. M = 7.0, SD = .24). For time point 2, this is Cohen’s d = 1.32
which can be described as a large effect and for T3 we find Cohen’s d = .36 which is a
small effect (Cohen, 1992).
13.3.4.2 Further analyses of automatic activation
In a next step, we wanted to check the development from time point to time point
and whether this development was different for the training groups as well as the
training condition interacting with the Threat condition. The repeated measures ANOVA
became significant. Time point had a significant effect on reaction time
F (2,242) = 72.34, p < .001. As can be seen in figure 7, for the Counterstereotypic
Association Training group we found a linear trend for the reaction time where
participants reacted slightly faster to gendered words from time point 1 to time point 2
and time point 3. The difference between time point 1 and time point 2 became
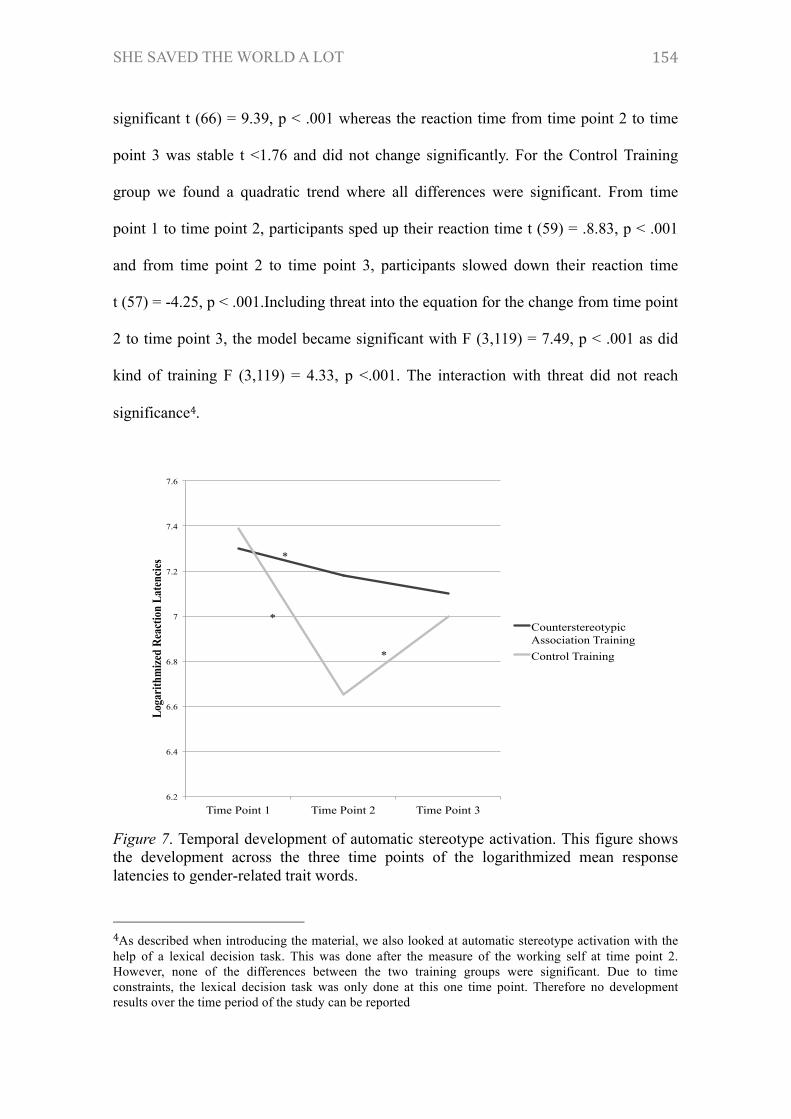
SHE SAVED THE WORLD A LOT
154
significant t (66) = 9.39, p < .001 whereas the reaction time from time point 2 to time
point 3 was stable t <1.76 and did not change significantly. For the Control Training
group we found a quadratic trend where all differences were significant. From time
point 1 to time point 2, participants sped up their reaction time t (59) = .8.83, p < .001
and from time point 2 to time point 3, participants slowed down their reaction time
t (57) = -4.25, p < .001.Including threat into the equation for the change from time point
2 to time point 3, the model became significant with F (3,119) = 7.49, p < .001 as did
kind of training F (3,119) = 4.33, p <.001. The interaction with threat did not reach
significance4.
Figure 7. Temporal development of automatic stereotype activation. This figure shows the development across the three time points of the logarithmized mean response latencies to gender-related trait words.
4As described when introducing the material, we also looked at automatic stereotype activation with the help of a lexical decision task. This was done after the measure of the working self at time point 2. However, none of the differences between the two training groups were significant. Due to time constraints, the lexical decision task was only done at this one time point. Therefore no development results over the time period of the study can be reported
6.2
6.4
6.6
6.8
7
7.2
7.4
7.6
Time Point 1 Time Point 2 Time Point 3
Loga
rith
miz
ed R
eact
ion
Late
ncie
s
Counterstereotypic Association Training Control Training
*
*
*
SHE SAVED THE WORLD A LOT
155
13.3.4.3 Hypotheses about the working self
We also used the latencies to look at mechanism 2 (gender as a useless category)
and 3 (reversal of the working self). We calculated the relative reaction time by
subtracting the reaction time to female trait words from the reaction time to male trait
words. Subsequently, positive reaction times mean that feminine related self-knowledge
was more accessible while negative reaction times denote that masculine related self-
knowledge was more accessible. Reaction times insignificantly different from zero
mean that neither gender-related self-knowledge was more accessible. We first tested
the group differences across the three time points before looking at the development
within participants.
We conducted an analysis of variance with the relative reaction time at time point
1 as our dependent variable. The kind of training served as our independent variable. At
time point 1, before either of the trainings was completed, the model did not become
significant. Post hoc analysis revealed that for both training groups, the relative reaction
time was not significantly different from zero with t < 1.76.
At time point 2, after the completion of the Training, we had clear hypotheses
about mechanism 2 and mechanism 3. For mechanism 2, the uselessness of the gender
category approach, we predicted the relative reaction time to be smaller for the
Counterstereotypic Association Training group than for the Control Training group. We
also predicted the relative reaction time of the Counterstereotypic Association Training
group to be insignificant from zero. For mechanism 3, the reversal of the working self
approach, we predicted the Counterstereotypic Association Training group to have
masculine trait words more accessible, denoted by a negative relative reaction time
score. For the Control Training group we predicted a positive relative reaction time
score to denote more accessibility of feminine trait words. Also at time point 2, the
SHE SAVED THE WORLD A LOT
156
analysis of variance did not reach significance. Additionally, a one-sample t-test
revealed the relative reaction time of both groups to be significantly different from zero
(both t > 4.61). Looking at the means, it can be seen that both the Counterstereotypic
Association Training group (M = .12, SD = .16) and the Control Training group
(M = .14, SD = .25) have feminine related self-knowledge more accessible. These
results go against the predicted hypotheses for both mechanism 2 and mechanism 3.
These results show that neither of the mechanisms can be confirmed by the data at time
point 2.
For time point 3, after the completion of the mathematics task, we did not
formulate any hypotheses. Nonetheless, we deemed it important to examine the
relationship of the working self with the threat induction. We therefore conducted an
analysis of variance with the relative reaction time at time point 3 as our dependent
variable. The kind of training and threat served as our two independent variables. The
model did not reach conventional levels of significance. A post-hoc test revealed the
relative reaction times to not be significantly different from zero for both groups.
However, descriptively, there seemed to be a difference between the Control Training
Threat group and the three remaining groups. The Control Training Threat group had an
average relative reaction time of M = .09, SD = .22 and was almost significantly
different from zero (t (23) = 1.97, p = .061), while the Control Training No Threat group
averaged M = .02, SD = .16, the Counterstereotypic Training Threat group averaged
M = -.01, SD = .16 and lastly, the Counterstereotypic Training No Threat group
averaged M = .03, SD = .2.
SHE SAVED THE WORLD A LOT
157
13.3.4.4 Further analyses of the working self
We also needed to look at the development across the three different time points
within the participants themselves. We calculated a repeated measures ANOVA
including training as an independent variable. The analysis showed the relative reaction
times to differ across time points (F (2,120) = 13.77, p <.001). The repeated measures
ANOVA also showed this difference to be independent of training condition with
F < 1.01. As can be taken from the description of the three different time points already,
the trend for the relative reaction time is quadratic (F (1,121) = 27.75, p < .001 where
time point 2 showed the largest relative reaction time for both training groups. This can
also be seen in figure 8. In a next step, we chose to look at the development between
time point 2 and time point 3 including threat as an additional independent variable. The
interaction between training and threat became significant F (1, 119) = 4.63, p = .034.
Post hoc-analysis showed participants in the Counterstereotypic Association Training
conditions to have the largest change in relative reaction time from time point 2 to time
point 3. For the Counterstereotypic Association Training No Threat group M = .13,
SD = .29 with t (29) = 2.52, p = .018 and for the Threat condition M = .11, SD = .19 and
t (34) = 3.36, p = .002. The Control Training No Threat group (M = .09, SD = .28) and
the Control Training Threat group (M = .1, SD = .29) did not significantly change their
relative reaction time from time point 2 to time point 3.
13.3.5 Content of self-descriptions
13.3.5.1 Hypothesis about the content self-descriptions
A last measure to better understand the changes in the working self are the self-
descriptions chosen by the participants. We analyzed these in the same fashion as the
latencies. Scores were calculated by calculating the number of feminine trait words and
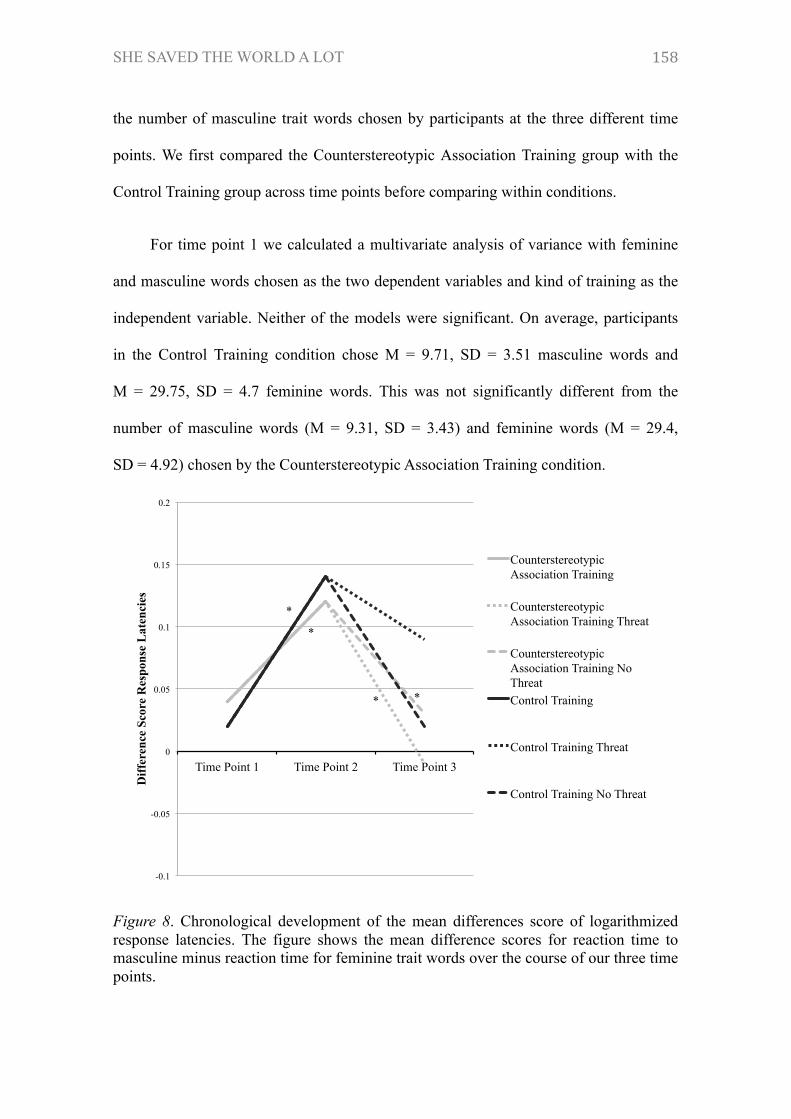
SHE SAVED THE WORLD A LOT
158
the number of masculine trait words chosen by participants at the three different time
points. We first compared the Counterstereotypic Association Training group with the
Control Training group across time points before comparing within conditions.
For time point 1 we calculated a multivariate analysis of variance with feminine
and masculine words chosen as the two dependent variables and kind of training as the
independent variable. Neither of the models were significant. On average, participants
in the Control Training condition chose M = 9.71, SD = 3.51 masculine words and
M = 29.75, SD = 4.7 feminine words. This was not significantly different from the
number of masculine words (M = 9.31, SD = 3.43) and feminine words (M = 29.4,
SD = 4.92) chosen by the Counterstereotypic Association Training condition.
Figure 8. Chronological development of the mean differences score of logarithmized response latencies. The figure shows the mean difference scores for reaction time to masculine minus reaction time for feminine trait words over the course of our three time points.
-0.1
-0.05
0
0.05
0.1
0.15
0.2
Time Point 1 Time Point 2 Time Point 3
Diff
eren
ce S
core
Res
pons
e L
aten
cies
Counterstereotypic Association Training
Counterstereotypic Association Training Threat
Counterstereotypic Association Training No Threat Control Training
Control Training Threat
Control Training No Threat
*
*
* *
SHE SAVED THE WORLD A LOT
159
For time point 2, we predicted the participants in the Counterstereotypic
Association Training condition to choose fewer feminine trait words and more
masculine trait words than the participants in the Control Training condition. To test this
we ran a multivariate analysis of variance as before with the number of feminine and
masculine trait words chosen at time point 2 as the dependent variables. Neither model
became significant. Descriptively, participants in the Control Training condition chose
M = 10.39, SD = 3.51 masculine trait words and M = 31.31, SD = 3.96 feminine trait
words. Participants in the Counterstereotypic Association Training condition chose
M = 10.43, SD = 3.42 masculine trait words and M = 30.15, SD = 5.67 feminine trait
words.
As time point 3 took place after the threat induction, we added threat as an
independent variable to the multivariate analysis. No predictions were made for this
time point. The models did not become significant. However, post-hoc analysis revealed
a difference between the two Counterstereotypic Association Training groups on the
number of masculine trait words chosen. While the participants in this training
condition who did not receive threat chose M = 12.39, SD = 2.04 masculine trait words,
those participants that did receive the threat only chose M = 11.06, SD = 2.29 masculine
trait words (t (65) = 2.49, p = .015).
13.3.5.2 Further analyses of the content of the self-descriptions
In a next step, we looked at the development within participants across the three
different time points and whether this development was different between training
conditions. We calculated a repeated measures ANOVA with the number of masculine
or feminine trait words chosen across the three time points as our dependent variables.
The kind of training served as the independent variable. The model for both masculine
SHE SAVED THE WORLD A LOT
160
(F (2,120) = 26.14, p <.001) and feminine (F (2,120) = 8.05, p = .001) trait words
became significant, however, the interaction with training did not. For the masculine
trait words, there was a clear linear trend (F (1,121) = 46.01, p < .001). For the number
of feminine trait words, the trend was quadratic (F (1,121) = 10.94, p = .001 and not
linear with F < 2.81. The linear trend went in a positive direction, meaning participants
chose more masculine trait words from one time point to the next. Both changes, from
time point 1 to time point 2 and from time point 2 to time point 3 showed a significant
increase. The largest increase was from time point 2 to time point 3 for both training
conditions with M = 1.21, SD = 3.23 for the Control Training condition (t (57) = 2.97,
p = .004) and M = 1.31, SD = 3.52 for the Counterstereotypic Association Training
group (t (64) = 2.91, p = .005. Including threat into the equation for the change from
time point 2 to time point 3 the model did not become significant. The trend was
quadratic for the number of feminine trait words chosen, independent of type of
training. From time point 1 to time point 2, the number of feminine trait words
increased. However the change was only significant for participants in the Control
Training condition t (59) = .4.8, p <.001. From time point 2 to time point 3, the number
of feminine trait words decreased. However, the decrease was not significant.
Descriptively, the decrease was larger for the Control Training group (M = .81,
SD = 3.54) than for the Counterstereotypic Association Training group (M = .38,
SD = 3.86), albeit not significantly so. Threat did not play a role in the change of the
number of words chosen from time point 2 to time point 3.
13.4 Discussion
The results of this study give us many points to discuss. The discussion will be
structured in the same way the result section was. We will first address the results of the
SHE SAVED THE WORLD A LOT
161
mathematics score before coming to the latency scores and the content of the self-
descriptions.
For the mathematics score we predicted the Control Training Threat group to
perform worse than the three other groups if the Counterstereotypic Association
Training was effective. This interaction is what we found in the data. Participants in the
Control Training Threat group underperformed in comparison to our other three groups.
This underperformance is a first indicator that the Counterstereotypic Association
Training is effective in reducing the impact of stereotype threat effects. The data also
revealed two more effects. Firstly, a significant difference between the two No Threat
groups and secondly a main effect of training. Starting with the significant difference
between the two No Threat groups, the data showed the participants in the
Counterstereotypic Association Training group to outperform the participants in the
Control Training group. In the light of an argument from earlier studies considering that
the pure exposure to a mathematics task can be a threatening situation to girls, these
results support our claim that the Counterstereotypic Association Training is an effective
intervention against stereotype threat. We also found a main effect of training in the data
in the way that the participants in the Counterstereotypic Association Training condition
outperformed the participants in the Control Training condition, independent of threat
condition. This finding is an extension of the earlier described effect in the sense that
the Counterstereotypic Association Training is not only effective in no threat, or mild
threat, situations but also in more explicit threat situations. Participants who finished the
Counterstereotypic Association Training performed better on arithmetic mathematics
tasks than participants who did not receive the training. This is also supported by the
fact that, albeit insignificant, the Counterstereotypic Association Training Threat group
outperformed the Control Training No Threat group. We also looked at the effect sizes
SHE SAVED THE WORLD A LOT
162
of the differences we described here and found medium-sized effects. To conclude, all
our data point towards a positive impact of the Counterstereotypic Association Training
on our participants. It did not only protect against Blatant Threat conditions, but also
ameliorated participants’ performance if they did not receive any blatant threat and were
solely exposed to the mathematics task.
We used the results of the latencies to better understand how the
Counterstereotypic Association Training was effective against stereotype threat effects.
For that we proposed three imaginable mechanisms.
The first mechanism predicted lower automatic stereotype activation through the
completion of the Counterstereotypic Association Training. As stereotypes need to be
activated to be applied (Wheeler & Petty, 2001), we expected a reduction of the
automatic activation to have a positive impact on participants under threat. To check this
we looked at how quickly participants reacted to gendered words across three time
points. As we equal faster reaction time with more accessibility of gender concepts, we
predicted the participants in the Counterstereotypic Association Training condition to
react more slowly to these words than participants in the Control Training condition
after either of the trainings was introduced. We did not find any significant difference
between groups at time point 1 before the participants were split into the training
conditions. At time point 2 and time point 3 respectively, we found significant
differences between the two training groups. At time point 2, there was a large effect
between the groups in the sense that the Counterstereotypic Association Training group
reacted significantly slower to gendered words than the Control group as predicted. This
pattern can still be found at time point 3, albeit with a smaller effect size. Nonetheless,
the reduction of automatic stereotype activation lasted across the entire study, especially
the threat induction and mathematics task. Looking at the automatic stereotype
SHE SAVED THE WORLD A LOT
163
activation across all three time points, we saw a linear trend for participants in the
Counterstereotypic Association Training. This finding does not allow us to speak of
reduction of automatic stereotype activation as Kawakami et al. (2000) and Kawkami,
Dovidio and Van Kamp (2005) do. The linear trend might be due to a learning effect.
Similar to Ebbingshaus’s line of argumentation (1885/1971) participants change more
dramatically from the first to the second time point than from the second to the third
time point. After having finished the measure once, participants firstly knew what their
task was and secondly, as the same words were used, were able to react more quickly to
these trait words. For the Control Training condition we found a quadratic trend. The
stark difference in reaction time between time point 1 and time point 2 can also partially
be attributed to a learning effect. However, once participants in the Control Training
condition are exposed to gender cues again, as they are with the latency measure, we
can see that they show faster automatic activation of gender stereotpyes. The
Counterstereotypic Association Training on the other hand buffers against this effect
and all we are left to see is the learning effect. It is also imaginable that parts of the
effect for the Control Training groups are driven by the fact that the Control Training
also used gendered words. Here it would have been useful to test a third group that did
not receive either of the trainings but a distractor task to see how automatic stereotype
activation developed throughout the experiment. Nonetheless, the results let us conclude
that the Counterstereotypic Association Training effectively hinders the automatic
stereotype activation needed for stereotype threat effects to occur. The differences in
automatic activation between the two training groups at time point 2 and time point 3
support this conclusion. When participants in the Counterstereotypic Association
Training group were exposed to threat and thus gender stereotype cues, their reaction
time did not significantly change. The result that stands out at first glance is the finding
SHE SAVED THE WORLD A LOT
164
that participants in the Control Training group slowed down their reaction time from
time point 2 to time point 3. This finding can be explained by Devine and Monteith
(1993) as well as Devine, Plant, Amodio, Harmon-Jones, and Vance (2002). The authors
explain that after people have violated their internalized nonprejudiced standards, they
are more motivated to make the same reaction less likely in the future. For our
participants that would mean that after the stereotypes were applied to themselves,
stereotype activation was reduced afterwards. As we see a significant threat effect on
participants in the Control Training Threat and partially in the Control Training No
Threat group, we can say that the activated stereotypes were applied. At time point 3,
after the stereotype application, we already see a reduced automatic activation again in
comparison to time point 2. Our data however do not allow us to investigate whether
this is really the mechanism to explain this effect. We therefore suggest further research
in this area. All in all for the automatic stereotype activation, the Counterstereotypic
Association Training buffered against gender stereotype cues at time point 2 in
comparison to the Control Training. And secondly, this buffer was strong enough to
withstand the introduction of the threat manipulation.
We looked at two more proposed mechanisms that potentially can explain
stereotype threat reduction through a change in the working self caused by the training.
For mechanism 2, we expected participants to have words of either gender more
accessible while for mechanism 3 we expected participants to have words of the
opposite gender more accessible. Through either excluding gender as a basis for
evaluation of one’s ability (mechanism 2) or matching the gender of the domain with
the way the participant saw herself (mechanism 3), we expected the Counterstereotypic
Association Training to reduce stereotype threat effects through changes in the working
self. The goal we set out for this study to fulfill was to get a better insight into the
SHE SAVED THE WORLD A LOT
165
differentiation between the two mechanisms and how the Counterstereotypic
Association Training really affected the working self. The results of this last study were
somewhat surprising concerning the working self as they showed a completely different
pattern than we saw in the previous study. In fact, both training conditions, the
Counterstereotypic Association Training and the Control Training changed the female
participants’ working self in a way that they had feminine self-knowledge more
accessible after the training. Both groups started off at a similar level. Before
completing either training, participants had neither feminine nor masculine self-
knowledge more accessible. However, after they finished the training, both groups had
feminine self-knowledge more accessible. This goes against predictions for both
mechanisms. We predicted relative reaction times for the Counterstereotypic
Association Training group to be either around zero as both reaction times to masculine
and feminine trait words were equal (mechanism 2) or to be in the negative, meaning
females reacted faster to masculine trait words than feminine trait words which we
interpret as having more masculine self-knowledge accessible (mechanism 3). This is
problematic if the theorized pathways from working self to stereotype threat hold true as
it might mean that the changes in the working self caused by the Counterstereotypic
Association Training work against the desired stereotype threat reduction. If this is the
case, we might actually underestimate the positive effect of the Counterstereotypic
Association Training.
There are a couple of more interesting findings within the relative reaction time
results. Firstly, it needs to repeated that participants had neither gender more accessible
at the beginning of the study. This is interesting in the sense that we generally would
expect women to have feminine self-knowledge more accessible as a default in a mixed
gender situation (Kessles & Hannover, 2008). This did not seem to be the case.
SHE SAVED THE WORLD A LOT
166
Secondly, the trend of the relative reaction time was quadratic; meaning that on average
participants regressed towards zero again at time point 3. Only for the Control Training
Threat group was this difference almost significantly different from zero. This could
possibly be explained by an interaction of threat and experienced competence on the
mathematics task. It is not unlikely that participants were able to estimate how well they
performed on the mathematics task. In the case of the Control Training Threat condition
participants knew they were not expected to perform well based on their gender. Their
average performance also showed that they underperformed. Taken the expectation and
the perceived reality together, it is not surprising participants in this group still had
feminine self-knowledge more accessible and did not return to an equilibrium between
the two genders as can more clearly be seen for the remaining three groups.
Our last variable was the content of the self-descriptions. Here we predicted an
interaction of training and gender of word at time point 2 for mechanism 3 to be true.
Participants of both groups chose a similar number of words to apply to them at time
point 1 meaning they started out at the same level. For time point 2 there were no
differences in the number of masculine trait words chosen. For feminine trait words we
found an almost significant difference in the sense that the participants of the
Counterstereotypic Association Training group chose fewer feminine trait words than
participants in the Control Training group. However to really believe in mechanism 3,
we would also need to see a difference in the number of masculine trait words chosen.
In absolute terms, both groups actually chose more feminine trait words on average at
time point 2 in comparison to time point 1. This also goes in line with the results of the
relative reaction times where both groups were shown to have feminine trait words
more accessible. Interestingly however, the number of masculine trait words chosen
also increased from time point 1 to time point 2 for both groups. Not only does this go
SHE SAVED THE WORLD A LOT
167
against what we would expect based on the results of the relative reaction time, but it
also goes against our expectations for mechanism 3 for the Control Training group. One
explanation for this might be that the trainings are not completely neutral in the sense
that they put gender as a category back into the minds of the participants and while the
participants have feminine trait words more accessible, they choose more gendered
words in general. At time point 3 we included threat into the equation to see how the
threat induction influenced the words chosen by participants. No differences were seen
between the Threat conditions for participants of the Control Training group. For the
Counterstereotypic Association Training group on the other hand, we saw a difference
between the number of masculine trait words chosen between the two Threat groups.
Participants in the Counterstereotypic Association Training Threat condition chose
fewer masculine words than participants in the Counterstereotypic Association Training
No Threat group. It seems that the Counterstereotypic Association Training did not
protect the participants from potentially associating themselves less with masculinity.
We saw a similar pattern for the Control Training group and its relative reaction time at
time point 3 where the participants in this group still had feminine trait words more
accessible. It is interesting that it seems as if threat has an impact on the relative
reaction for the Control Training group and an impact on the number of words chosen
for the Counterstereotypic Association Training group. Either way, the results show that
the working self is not stable to withstand a threat manipulation. The last finding for the
content of the self-descriptions is the fact that masculine trait words showed a linear
effect for both training groups, while the feminine trait words showed a quadratic trend.
At time point 3 fewer feminine trait words were chosen by both groups than at time
point 2. For a late developing mechanism 3 to hold true, we would only expect this
trend for the Counterstereotypic Association Training group. The same holds true for the
SHE SAVED THE WORLD A LOT
168
masculine trait words. Here only the Counterstereotypic Association Training group
should have chosen more masculine trait words from time point 2 to time point 3. The
Control Training group should not have. All in all, the results of the content of self-
descriptions are convoluted. Across the three time points both training groups reacted in
a similar way and no indicators for mechanism 3 were found. On top of that, the results
show the threat induction to have an effect on the content of the self-descriptions, if
only significantly for the Counterstereotypic Association Training group.
To sum up this study, there are some very promising results and some rather
sobering ones. The goal of the study was to better understand how the
Counterstereotypic Association Training protect against stereotype threat effects. We
firstly were able to show that the Counterstereotypic Association Training protects
against blatant threat inductions such as naming specific expectations about
participants’ performance as well as mild inductions by exposure to mathematics test for
women. We proposed three mechanisms through which this protection could work; a
reduction of automatic stereotypic activation, seeing gender as a useless category when
judging the self and a reversal of the working self to the opposite gender. The results of
this study only confirmed the first proposed mechanism. Participants in the
Counterstereotypic Association Training group showed a lower automatic stereotype
activation in comparison to the Control Training. This lowered automatic stereotype
activation withstood the threat induction for the Counterstereotypic Association
Training condition as firstly the difference in reaction between time point 2 and time
point 3 was not significant for the Counterstereotypic Association Training condition
and secondly, participants in the Counterstereotypic Association Training condition still
reacted significantly more slowly to gendered words than participants in the Control
Training condition. The predictions for the other two mechanisms were not confirmed.
SHE SAVED THE WORLD A LOT
169
In fact, results pointed in the opposite direction to what was expected for the
Counterstereotypic Association Training condition and what was seen in the previous
study. Additionally, having a temporal development of the working self included in the
study showed a change in the working selves of the participants caused by the threat
induction. As the working self is defined as local variations as a reaction to the social
environment (Markus & Kunda, 1986) this finding is not greatly surprising and rather
clarifying in our quest to understand how the Counterstereotypic Association Training
and eventually how general counterstereotypes work. We have now conducted three
studies and two pre-tests to understand how this mechanism works. The next chapter
will now look at all of these studies together and what lessons can be learned from
them.
SHE SAVED THE WORLD A LOT
170
14 General summary and final conclusion
14.1 Summary of studies
In this chapter we will look at the results of all the studies performed. We
completed this set of studies to answer the question how the Counterstereotypic
Association Training protected against stereotype threat effects. Ultimately we hope
though that a better understanding of the use of general counterstereotypes, as they are
utilized by the Counterstereotypic Association Training, can be useful for someone
developing interventions, such as changing representation of groups. Before however
drawing final conclusions of the results, let us now look at all the studies one last time.
We started out with a pre-test trying to find an appropriate stereotype threat
induction. In this study we asked our female participants to perform on two
mathematics tests, firstly the number sequence task and secondly an arithmetic task. For
the second test, the arithmetic test, half of the participants were told that we expected
gender differences to show in the number of problems solved. By doing so, we had
hoped to induce stereotype threat in that half of the participants. However, both groups,
the group that was told the expectation and the group that was not, performed equally
well on the arithmetic task and also did not differ significantly when controlling for
their performance on the number sequence task. We explained this finding by
postulating that the no threat induction was in fact a milder threat induction and did not
differ enough from the stereotype threat induction we gave. Additionally, we
hypothesized that due to the fact that we only chose women, some participants were
made especially aware of their group membership which served as an additional threat
induction.
SHE SAVED THE WORLD A LOT
171
We tried to rectify some of these problems in our second pre-test. In this study we
tested two threat inductions against our so-called no threat induction, which, just as in
pre-test 1, constituted solely of the instruction on how to solve the task. Similar to pre-
test 1, we once again included a Threat condition in which participants were told that
we expected males to outperform females. We also included a more Blatant Threat
condition in which additionally to the expectation, we asked participants to indicate
their gender before completing the arithmetic tasks. Another change from pre-test 1 to
pre-test 2 was the fact that male participants were sampled as well. No differences
between groups was found for the male sample, as expected. For the female sample, we
found a significant difference between the three groups. Participants who had received
threat performed significantly worse than participants who had received the blatant
threat or participants who had not received threat. Controlling for the performance on
the number sequence task, it seemed as if the blatant threat was the most effective
stereotype threat manipulation. We therefore decided to use the Blatant Threat condition
in further studies.
The first study really investigating counterstereotypes was the study conducted at
an all girls high school in Germany. The goal of this study was to establish whether the
Counterstereotypic Association Training could be used to protect girls against
stereotype threat effects. To test this we developed a Control Training that required
similar levels of concentration and effort of the participants. In a next step 104
participants either completed the Counterstereotypic Association Training or our
Control Training. Afterwards participants either received the blatant threat or no threat
induction. If the Counterstereotypic Association Training was effective, we expected
participants in the Control Training condition that received the blatant threat to perform
significantly worse than participants of the other three groups. This is the interaction we
SHE SAVED THE WORLD A LOT
172
found in the data. With a medium-sized effect, we were able to show that the
Counterstereotypic Association Training was effective in reducing stereotype threat
effects.
The second study looked at how the Counterstereotypic Association Training
affected cognitive measures. Previously, we had mapped out three potential mechanisms
through which the Counterstereotypic Association Training could reduce stereotype
threat effects. The goal of this study was to investigate how the Counterstereotypic
Association Training affected automatic stereotype activation and the working self, the
central variables in the proposed mechanisms. 60 participants either finished the
Counterstereotypic Association Training or our specially devised Control Training.
Following this they completed a measure of the working self, recording reaction time to
gendered words as well as relative reaction time to feminine and masculine trait words.
The first mechanism we proposed predicted a reduced automatic stereotype activation
for people in the Counterstereotypic Association Training condition. In our results we
saw participants in the Counterstereotypic Association Training group react more slowly
to gendered trait words than participants in the Control Training group. The effect size
of this difference was very large. The second mechanism we proposed predicted the
working self to no longer include gender as a useful category, while the third
mechanism predicted a reversal in the working self in the sense that women had more
masculine trait words accessible and vice versa for male participants. The results were
not completely unambiguous. However, the results of the relative reaction time analysis
clearly pointed towards mechanism 2. The results showed that both males and females
who had finished the Counterstereotypic Association Training did not differ in their
reaction times to feminine and masculine trait words which matched the predictions for
mechanism 2. For the participants in the Control Training condition, both males and
SHE SAVED THE WORLD A LOT
173
females reacted faster to feminine trait words than to masculine trait words. The finding
that males in the Control Training condition reacted faster to feminine trait words than
to masculine trait words was explained by the nature of the sample which stemmed
from a mostly social science background. Nonetheless, the results also showed that
more data were needed to better understand how the working self was affected by the
Counterstereotypic Association Training.
The third study conducted to better understand how counterstereotypes affect
stereotype threat effects included three time points to measure the working self in order
to be able to track the changes from start to finish. 203 participants were asked to
complete the measure of the working self at the beginning and the end of the study as
well as right after finishing the Counterstereotypic Association Training or the Control
Training. The second time point after the training was also right before half of the
participants received the threat induction. By doing so, we had hoped to see how the
trainings changed the working self as well as how the threat affected the measures.
Firstly, we looked at the effect the Counterstereotypic Association Training had on the
mathematics performance of the participants. We found a medium-sized effect of the
training on stereotype threat which showed us that the Training was effective in
reducing threat effects. In a next step we looked at the latencies towards gendered
words. For mechanism 1, we expected no differences between groups at the first time
point but significant differences at the second and third time point. The results
confirmed this prediction. While we did not find a significant difference at time point 1,
we found participants in the Counterstereotypic Association Training condition to react
more slowly to gendered words at time point 2 and time point 3 than the participants in
the Control Training condition. At time point 2 we found this difference to be a large
effect. The difference in reaction time lasted across the mathematics task and was still a
SHE SAVED THE WORLD A LOT
174
small-sized effect at the end of the study. The data for mechanism 2 and 3 pointed in the
opposite direction as predicted. Instead of leaving gender a useless category
(mechanism 2) or reversing the working self (mechanism 3), we found that our female
participants in the Counterstereotypic Association Training condition had feminine trait
words more accessible at time point 2 than at time point 1 and time point 3. This goes
against the hypotheses for either mechanism. Relative reaction time at time point 3
returned to a similar level as time point 1, showing a quadratic trend in the data. The
stark change from time point 2 to time point 3 also indicated that the working self is not
stable enough to last the entire mathematics task and thus aid in reducing threat effects.
Additionally, for those participants who received threat we found threat effects in the
relative reaction as well as the content of the self-descriptions. For participants who
finished the Control Training and received threat, their relative reaction time showed
them to still slightly favor feminine trait words over masculine trait words. For
participants in the Counterstereotypic Association Training group, the results showed
that they chose fewer masculine words to describe themselves in comparison to
participants of the remaining three groups.
14.2 Conclusion and outlook
With this set of studies we conducted we pursued two goals. Firstly, we wanted to
test whether the Counterstereotypic Association Training could effectively be used
against stereotype threat inductions and secondly, we wanted to test the three
mechanisms we proposed through which this protection against threat worked. Let us
now look at how and whether we achieved these goals.
The question whether the Counterstereotypic Association Training is a useful
intervention against stereotype threat effect was answered by our first and our third
SHE SAVED THE WORLD A LOT
175
study. Both studies pointed in the same direction. Not only were we able to show that
the Counterstereotypic Association Training is effective in protecting against a blatant
threat induction but also when there is no real threat induction, participants performed
better on a mathematics test after they completed the training. The fact that we were
able to replicate the results of the first study with our third study gave us the confidence
to conclude that the Counterstereotypic Association Training is effective in reducing
stereotype threat effects.
Our second question deals with how the Counterstereotypic Association Training
protects participants against stereotype threat effect. This question was theoretically
answered by us in the chapter on the Counterstereotypic Association Training (Chapter
6) and empirically answered by our second and out third study. Theoretically we
proposed three mechanisms. The first predicted a mechanism through the reduction of
automatic stereotype activation, the second predicted a mechanism as gender became a
useless category when judging the self and the third predicted a mechanism through a
reversal of the working self and thus matching the domain with the self. Empirically, the
second study showed a strong tendency towards the first mechanism of lower automatic
stereotype activation for the Counterstereotypic Association Training group than the
Control Training group and a milder tendency towards the second mechanism with
leaving the gender a useless category. This pattern could only partially be replicated in
the third study. The third study still showed a strong tendency towards mechanism 1.
However, the data showed the opposite direction of what was expected for mechanism 2
and 3. Bringing the threat induction into the equation additionally showed that the
changes in the working self accounted for by mechanism 2 and 3 did not last long
enough to have an impact on the performance. Taking all this together, the diverging
results for mechanism 2 and the lack of indicators for mechanism 3, we conclude that
SHE SAVED THE WORLD A LOT
176
mechanism 1 is the most likely to be the primary mechanism through which the training
works as it showed large effect sizes in both studies and across time in the third study.
While these results are already a great step forward there is still a cornucopia of
questions that need to be answered. Some of them we have already mentioned
throughout our discussions and given suggestions for solving these. This concerns
mostly questions about our research design and the explanation of some surprising
findings. Therefore we will now only address major research questions left to answer.
Firstly, we did not fully test the mechanisms we proposed as part of the contribution of
this work was the theoretical foundation. Therefore the link between reduced automatic
stereotype activation and stereotype threat should be further investigated. Moreover, the
convoluted results for mechanism 2 and 3 should be looked at again. This includes the
question whether mechanism 3 is solely a further development of mechanism 2. It
secondly includes looking at the effect of threat on the working self. And lastly, it
includes the question why participants showed no difference between feminine and
masculine trait word reaction time for the second study but a large difference between
the two categories for the third study. We also did not apply the gained knowledge to
other types of stereotype threat in domains other than mathematics. We therefore do not
know whether the Counterstereotypic Association Training is effective in protecting
boys, African Americans or even the children of immigrants. We should take the
theoretical elaboration and the empirical evidence on how the Counterstereotypic
Association Training works in reducing threat effects to answer these questions. Lastly,
it is important to investigate whether completing the Counterstereotypic Association
Training has a negative effect on members of groups not especially addressed. We
should ask whether male participants are affected in their mathematical performance
after completion of the training.

SHE SAVED THE WORLD A LOT
177
Most importantly however, all this together should be taken to develop effective
interventions against stereotype threat using easily accessible general
counterstereotypes that change the general representation of groups such as Buffy the
Vampire Slayer did for me.
SHE SAVED THE WORLD A LOT
178
15 Appendix
Appendix A:
Instruction numerical sequence task in German…………………………………………. 180
Appendix B:
Number sequence task problems………………………………………………………… 181
Appendix C:
Instruction arithmetic task in German…………………………………………………… 182
Appendix D:
Arithmetic task problems………………………………………………….……………. 183
Appendix E:
Instruction filler task city selection in German………………………………………….. 185
Appendix F:
Filler task city selection items…………………………………..………………………. 186
Appendix G:
Instruction filler task ice cream selection in German……………………………………. 187
Appendix H:
Filler task ice cream items……………………………………………………………….. 188
Appendix I:
Instruction level of worry thought in German…………………………………………… 189
Appendix J:
Items level of worry thought…………………………………………………………….. 190
Appendix K:
Trait words used in the Counterstereotypic Association Training/Control Training …… 191

SHE SAVED THE WORLD A LOT
179
Appendix L:
Instruction Counterstereotypic Association Training/Control Training in German……... 193
Appendix M:
List of trait words used in Kessels and Hannover (2008) task in German………………… 194
Appendix N:
Instruction Kessels and Hannover (2008) task in German………………………………… 197
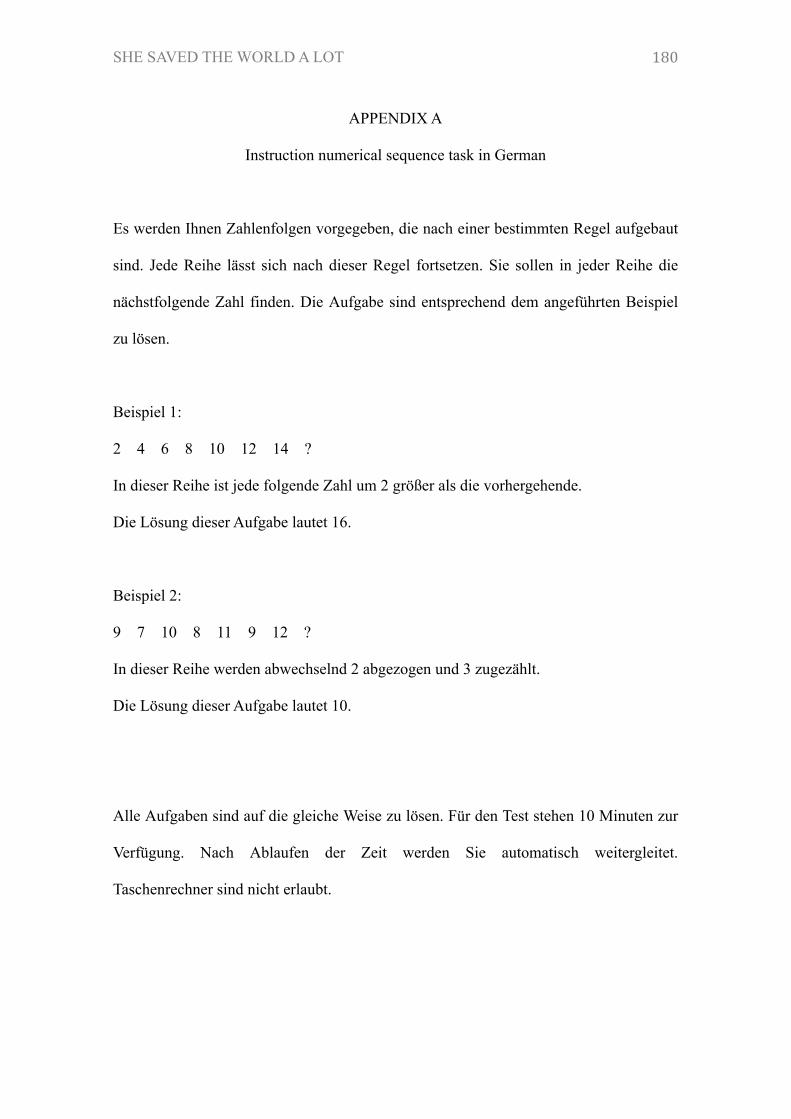
SHE SAVED THE WORLD A LOT
180
APPENDIX A
Instruction numerical sequence task in German
Es werden Ihnen Zahlenfolgen vorgegeben, die nach einer bestimmten Regel aufgebaut
sind. Jede Reihe lässt sich nach dieser Regel fortsetzen. Sie sollen in jeder Reihe die
nächstfolgende Zahl finden. Die Aufgabe sind entsprechend dem angeführten Beispiel
zu lösen.
Beispiel 1:
2 4 6 8 10 12 14 ?
In dieser Reihe ist jede folgende Zahl um 2 größer als die vorhergehende.
Die Lösung dieser Aufgabe lautet 16.
Beispiel 2:
9 7 10 8 11 9 12 ?
In dieser Reihe werden abwechselnd 2 abgezogen und 3 zugezählt.
Die Lösung dieser Aufgabe lautet 10.
Alle Aufgaben sind auf die gleiche Weise zu lösen. Für den Test stehen 10 Minuten zur
Verfügung. Nach Ablaufen der Zeit werden Sie automatisch weitergleitet.
Taschenrechner sind nicht erlaubt.
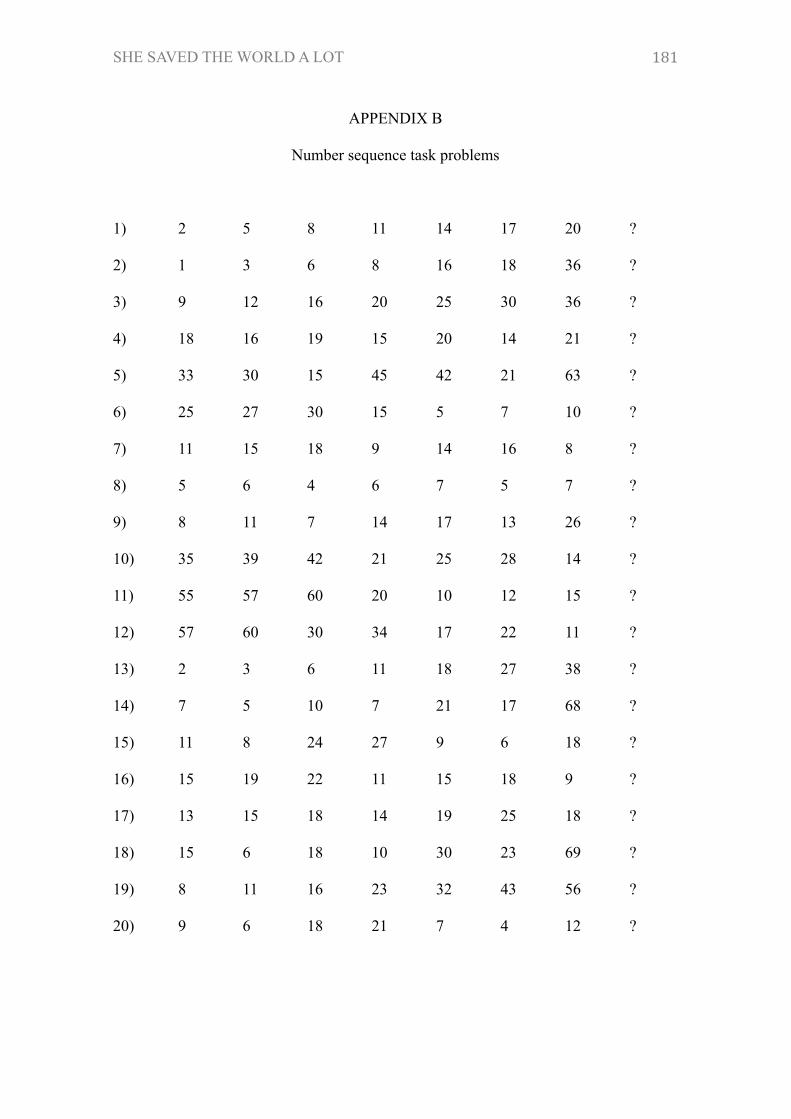
SHE SAVED THE WORLD A LOT
181
APPENDIX B
Number sequence task problems
1) 2 5 8 11 14 17 20 ?
2) 1 3 6 8 16 18 36 ?
3) 9 12 16 20 25 30 36 ?
4) 18 16 19 15 20 14 21 ?
5) 33 30 15 45 42 21 63 ?
6) 25 27 30 15 5 7 10 ?
7) 11 15 18 9 14 16 8 ?
8) 5 6 4 6 7 5 7 ?
9) 8 11 7 14 17 13 26 ?
10) 35 39 42 21 25 28 14 ?
11) 55 57 60 20 10 12 15 ?
12) 57 60 30 34 17 22 11 ?
13) 2 3 6 11 18 27 38 ?
14) 7 5 10 7 21 17 68 ?
15) 11 8 24 27 9 6 18 ?
16) 15 19 22 11 15 18 9 ?
17) 13 15 18 14 19 25 18 ?
18) 15 6 18 10 30 23 69 ?
19) 8 11 16 23 32 43 56 ?
20) 9 6 18 21 7 4 12 ?
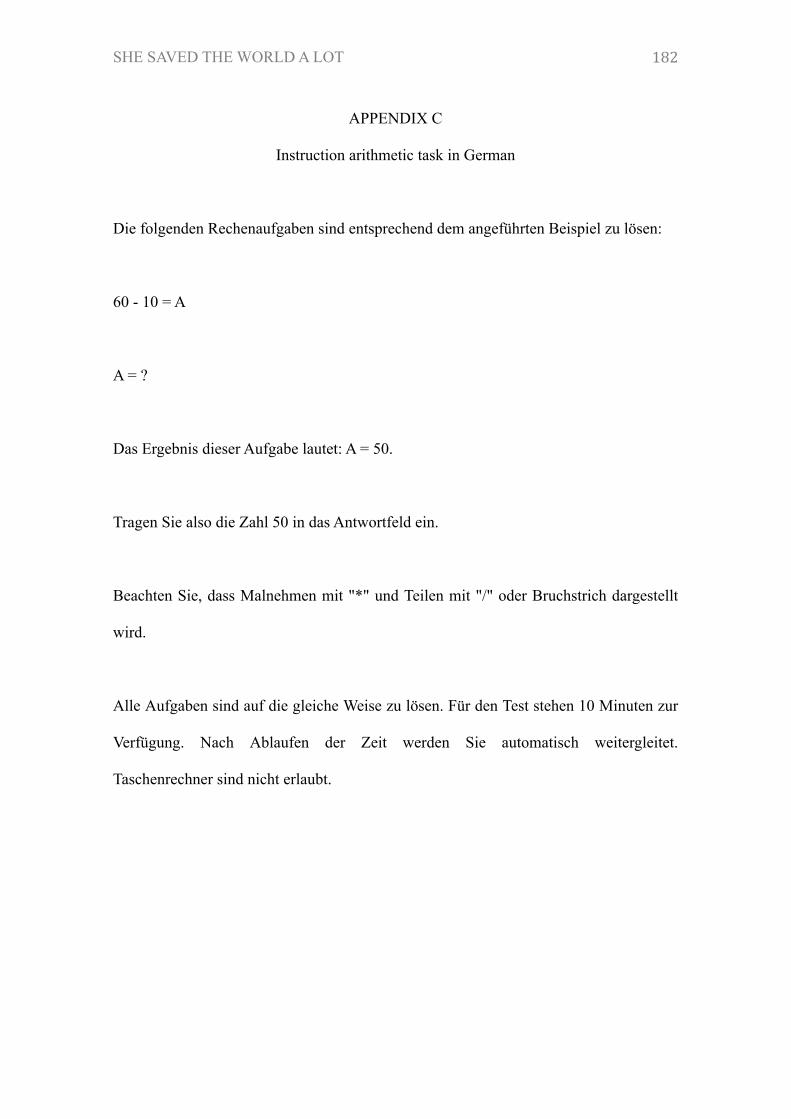
SHE SAVED THE WORLD A LOT
182
APPENDIX C
Instruction arithmetic task in German
Die folgenden Rechenaufgaben sind entsprechend dem angeführten Beispiel zu lösen:
60 - 10 = A
A = ?
Das Ergebnis dieser Aufgabe lautet: A = 50.
Tragen Sie also die Zahl 50 in das Antwortfeld ein.
Beachten Sie, dass Malnehmen mit "*" und Teilen mit "/" oder Bruchstrich dargestellt
wird.
Alle Aufgaben sind auf die gleiche Weise zu lösen. Für den Test stehen 10 Minuten zur
Verfügung. Nach Ablaufen der Zeit werden Sie automatisch weitergleitet.
Taschenrechner sind nicht erlaubt.
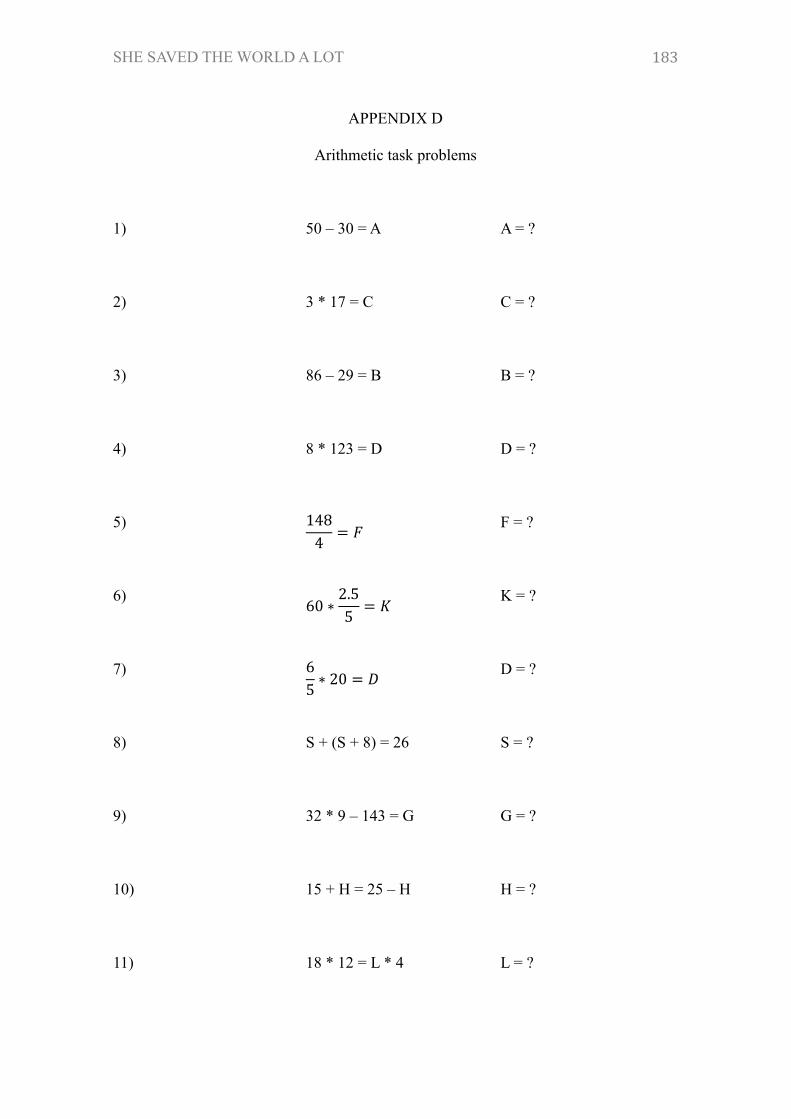
SHE SAVED THE WORLD A LOT
183
APPENDIX D
Arithmetic task problems
1) 50 – 30 = A A = ?
2) 3 * 17 = C C = ?
3) 86 – 29 = B B = ?
4) 8 * 123 = D D = ?
5) 1484 = % F = ?
6) 60 ∗ 2.55 = , K = ?
7) 65 ∗ 20 = - D = ?
8) S + (S + 8) = 26 S = ?
9) 32 * 9 – 143 = G G = ?
10) 15 + H = 25 – H H = ?
11) 18 * 12 = L * 4 L = ?
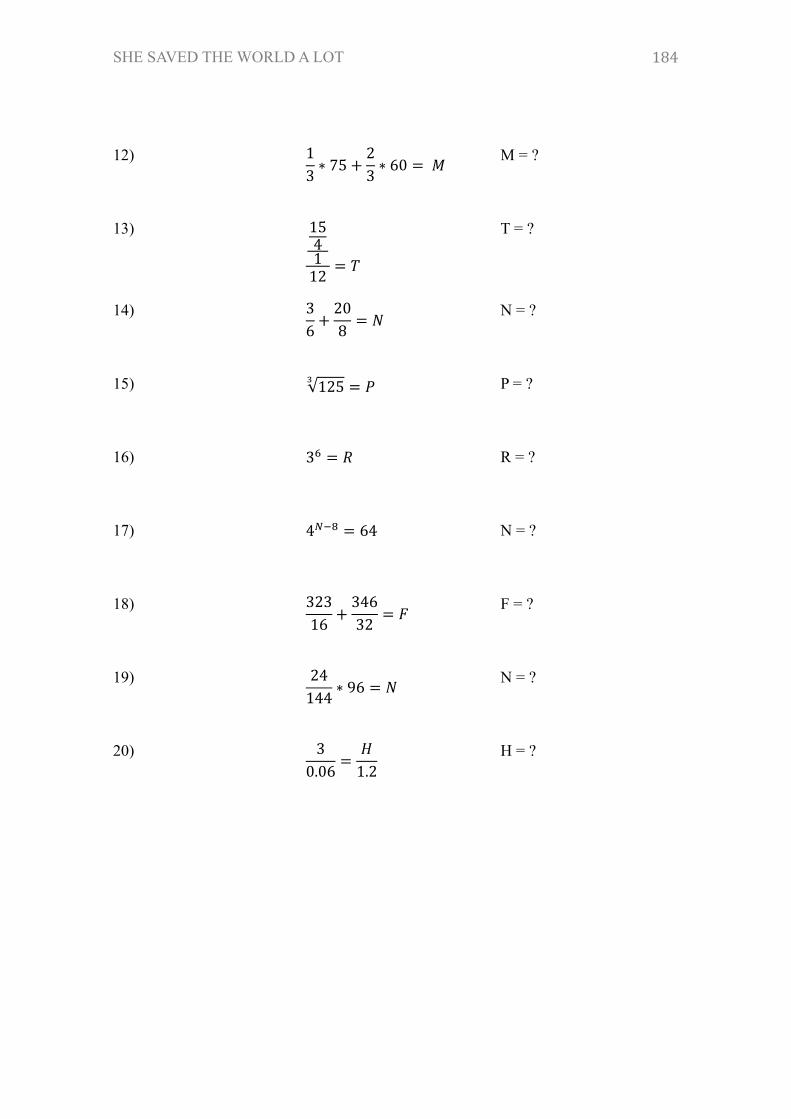
SHE SAVED THE WORLD A LOT
184
12) 13 ∗ 75 +
23 ∗ 60 = 2 M = ?
13) 154112 = 3
T = ?
14) 36 +
208 = 4 N = ?
15) 1255 = 6 P = ?
16) 37 = 8 R = ?
17) 49:; = 64 N = ?
18) 32316 + 34632 = % F = ?
19) 24144 ∗ 96 = 4 N = ?
20) 30.06 =
=1.2 H = ?
SHE SAVED THE WORLD A LOT
185
APPENDIX E
Instruction filler task city selection in German
In der folgenden Aufgabe geht es um Entscheidungen. Sie werden nun 7 Städte sehen,
die auf verschiedenen Dimensionen verglichen werden. Lesen Sie sich diese
Informationen der Dimensionen gut durch. Am Ende der Präsentation müssen Sie sich
für eine der Städte entscheiden. Überlegen Sie dabei in welcher der Städte Sie am
liebsten wohnen würden basierend auf den präsentierten Informationen. Sie wählen eine
Stadt aus indem Sie auf sie klicken. Danach klicken Sie bitte auf weiter.
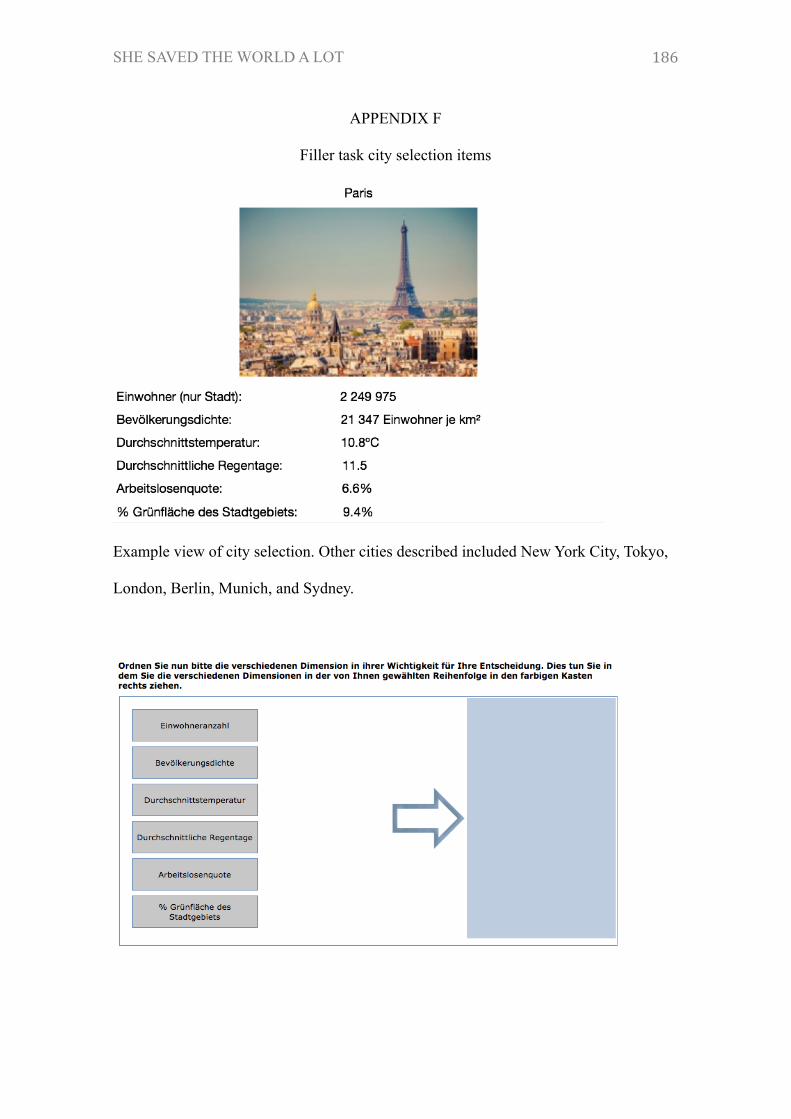
SHE SAVED THE WORLD A LOT
186
APPENDIX F
Filler task city selection items
Example view of city selection. Other cities described included New York City, Tokyo,
London, Berlin, Munich, and Sydney.

SHE SAVED THE WORLD A LOT
187
APPENDIX G
Instruction filler task ice cream selection in German
In der folgenden Aufgabe, bitten wir Sie Ihre Bewertung zu drei verschiedenen
Eisprodukten abzugeben. Dabei kommt es nur auf Ihren persönlichen Geschmack an, so
dass es keine richtigen oder falschen Antworten gibt.
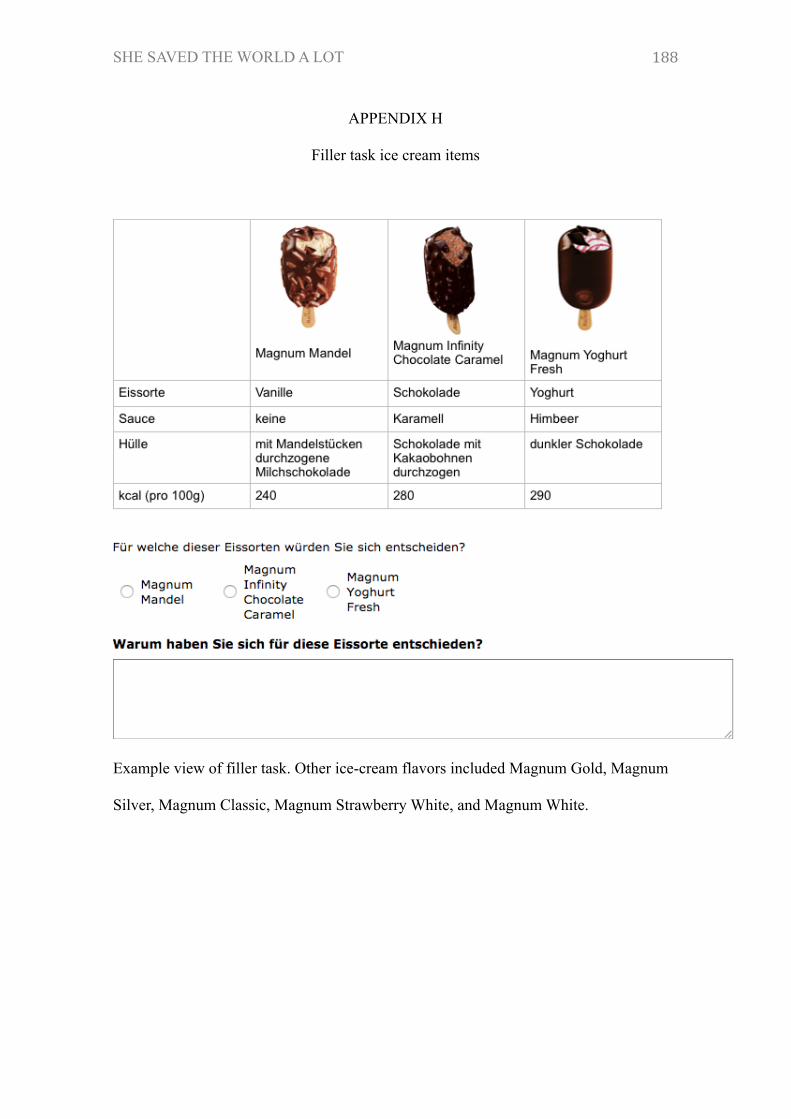
SHE SAVED THE WORLD A LOT
188
APPENDIX H
Filler task ice cream items
Example view of filler task. Other ice-cream flavors included Magnum Gold, Magnum
Silver, Magnum Classic, Magnum Strawberry White, and Magnum White.

SHE SAVED THE WORLD A LOT
189
APPENDIX I
Instruction level of worry thought in German
Geben Sie bitte an, wie sehr Sie die folgenden Gedanken bei der Bearbeitung der letzten
Aufgabe ablenkten.
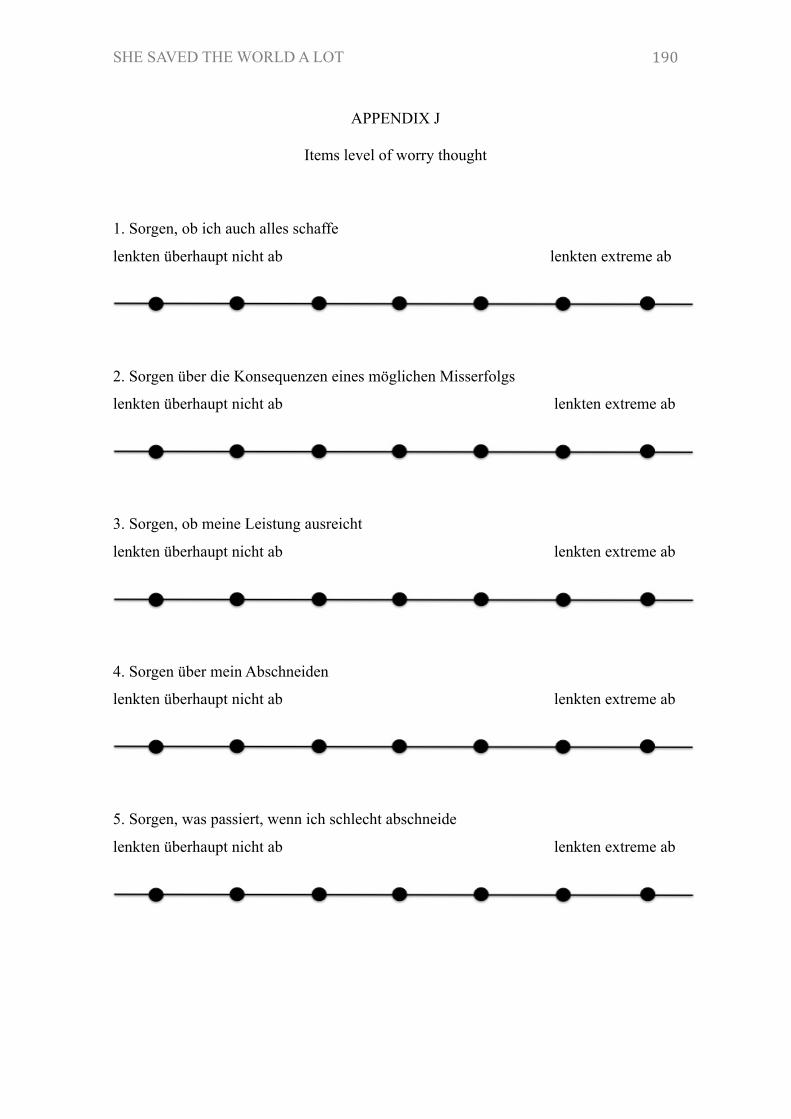
SHE SAVED THE WORLD A LOT
190
APPENDIX J
Items level of worry thought
1. Sorgen, ob ich auch alles schaffe
lenkten überhaupt nicht ab lenkten extreme ab
2. Sorgen über die Konsequenzen eines möglichen Misserfolgs
lenkten überhaupt nicht ab lenkten extreme ab
3. Sorgen, ob meine Leistung ausreicht
lenkten überhaupt nicht ab lenkten extreme ab
4. Sorgen über mein Abschneiden
lenkten überhaupt nicht ab lenkten extreme ab
5. Sorgen, was passiert, wenn ich schlecht abschneide
lenkten überhaupt nicht ab lenkten extreme ab
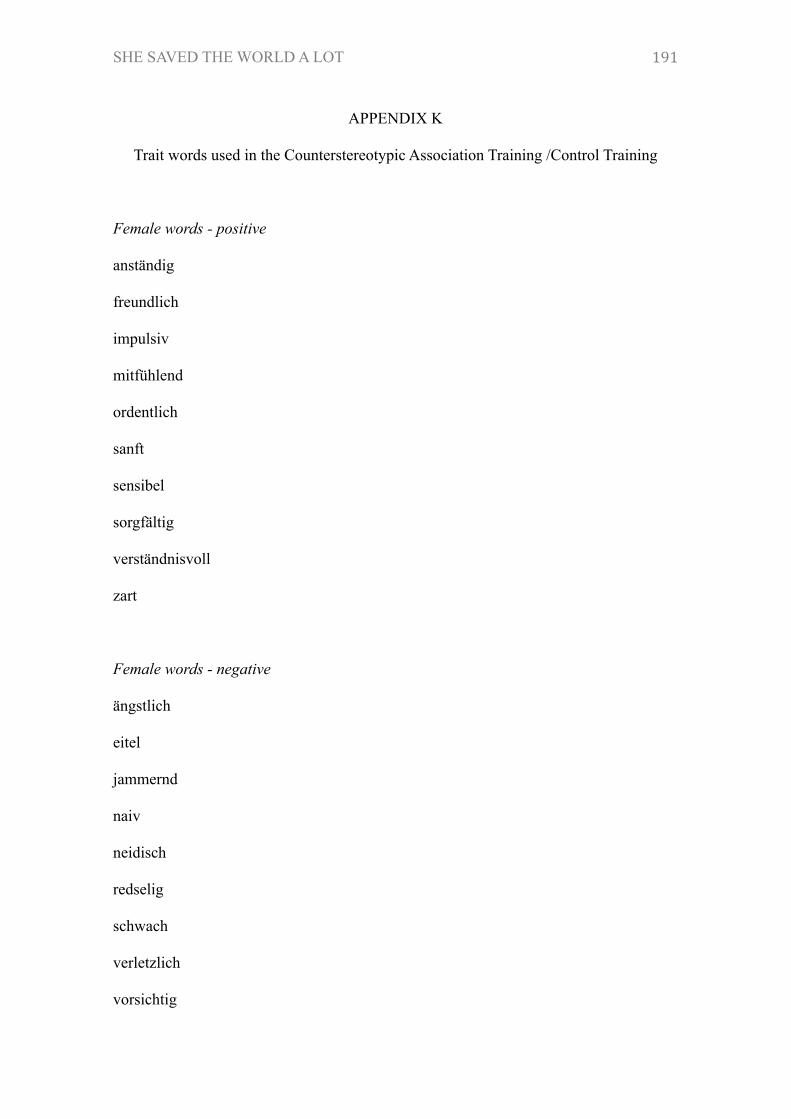
SHE SAVED THE WORLD A LOT
191
APPENDIX K
Trait words used in the Counterstereotypic Association Training /Control Training
Female words - positive
anständig
freundlich
impulsiv
mitfühlend
ordentlich
sanft
sensibel
sorgfältig
verständnisvoll
zart
Female words - negative
ängstlich
eitel
jammernd
naiv
neidisch
redselig
schwach
verletzlich
vorsichtig
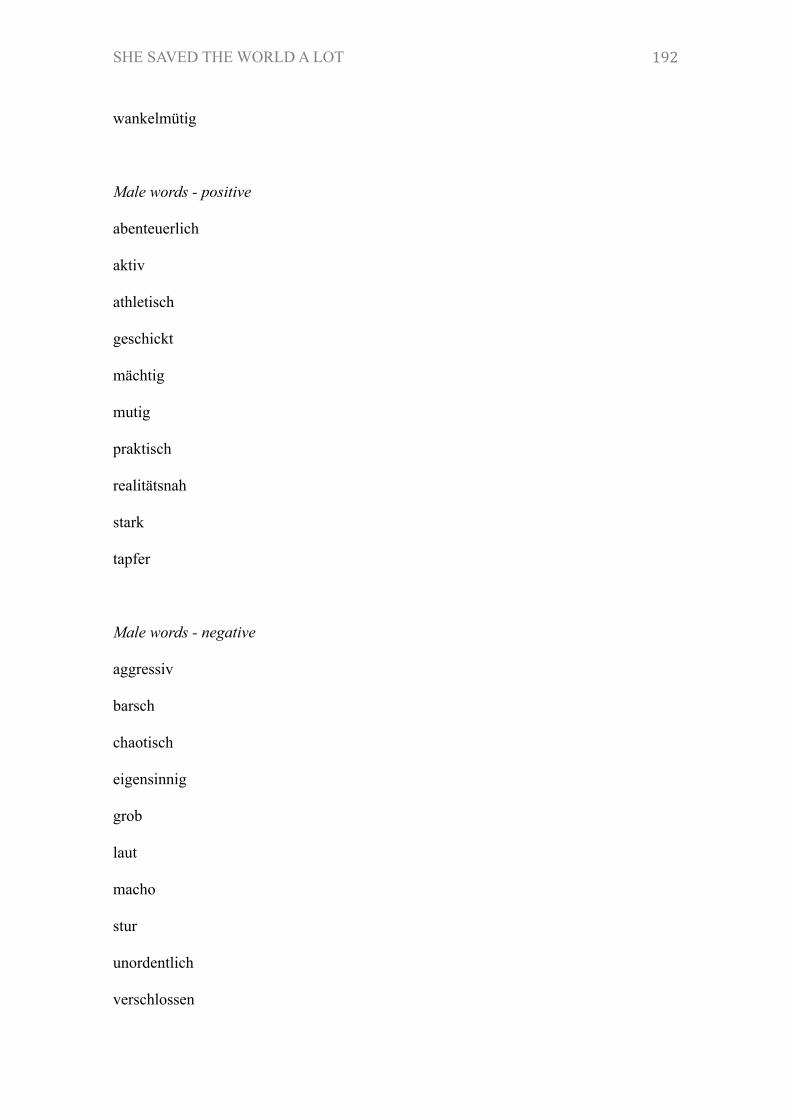
SHE SAVED THE WORLD A LOT
192
wankelmütig
Male words - positive
abenteuerlich
aktiv
athletisch
geschickt
mächtig
mutig
praktisch
realitätsnah
stark
tapfer
Male words - negative
aggressiv
barsch
chaotisch
eigensinnig
grob
laut
macho
stur
unordentlich
verschlossen
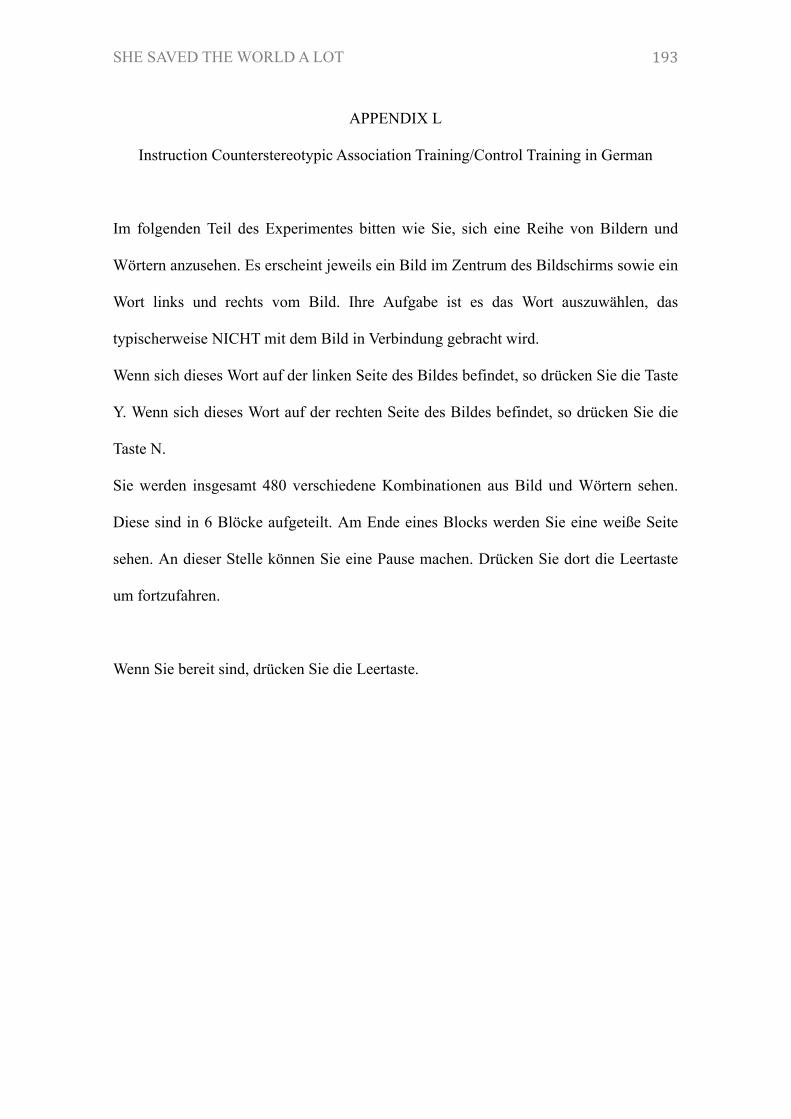
SHE SAVED THE WORLD A LOT
193
APPENDIX L
Instruction Counterstereotypic Association Training/Control Training in German
Im folgenden Teil des Experimentes bitten wie Sie, sich eine Reihe von Bildern und
Wörtern anzusehen. Es erscheint jeweils ein Bild im Zentrum des Bildschirms sowie ein
Wort links und rechts vom Bild. Ihre Aufgabe ist es das Wort auszuwählen, das
typischerweise NICHT mit dem Bild in Verbindung gebracht wird.
Wenn sich dieses Wort auf der linken Seite des Bildes befindet, so drücken Sie die Taste
Y. Wenn sich dieses Wort auf der rechten Seite des Bildes befindet, so drücken Sie die
Taste N.
Sie werden insgesamt 480 verschiedene Kombinationen aus Bild und Wörtern sehen.
Diese sind in 6 Blöcke aufgeteilt. Am Ende eines Blocks werden Sie eine weiße Seite
sehen. An dieser Stelle können Sie eine Pause machen. Drücken Sie dort die Leertaste
um fortzufahren.
Wenn Sie bereit sind, drücken Sie die Leertaste.
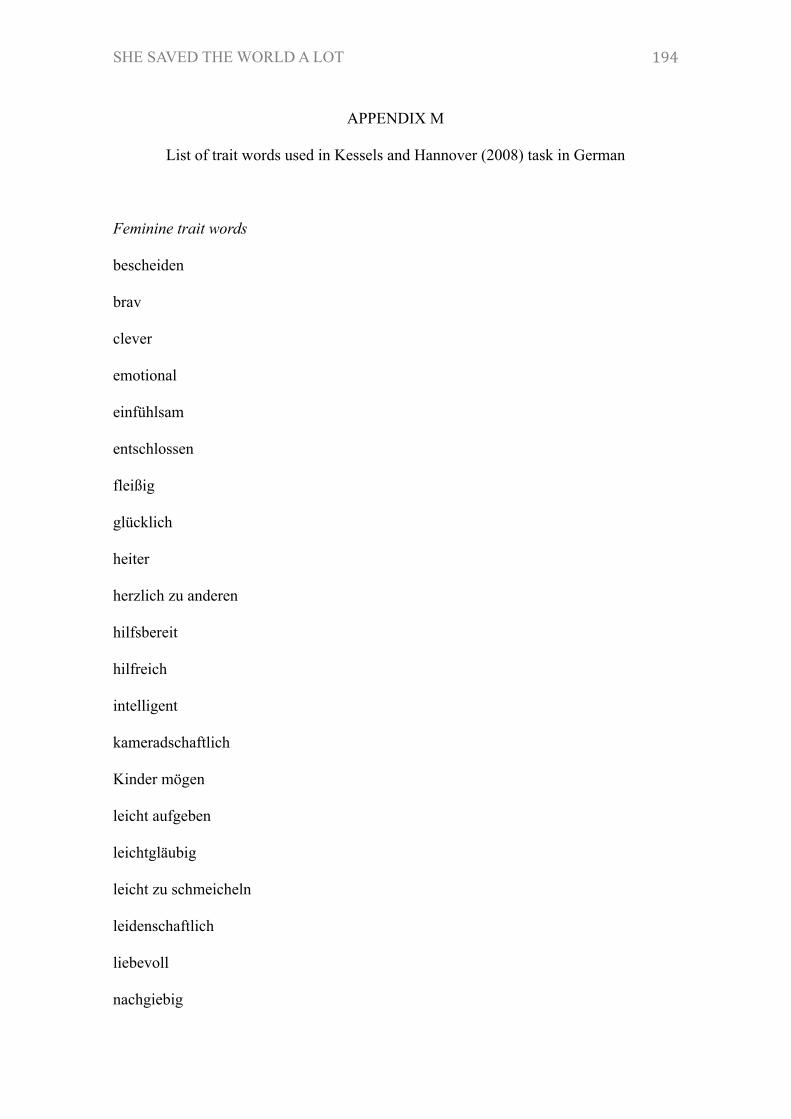
SHE SAVED THE WORLD A LOT
194
APPENDIX M
List of trait words used in Kessels and Hannover (2008) task in German
Feminine trait words
bescheiden
brav
clever
emotional
einfühlsam
entschlossen
fleißig
glücklich
heiter
herzlich zu anderen
hilfsbereit
hilfreich
intelligent
kameradschaftlich
Kinder mögen
leicht aufgeben
leichtgläubig
leicht zu schmeicheln
leidenschaftlich
liebevoll
nachgiebig
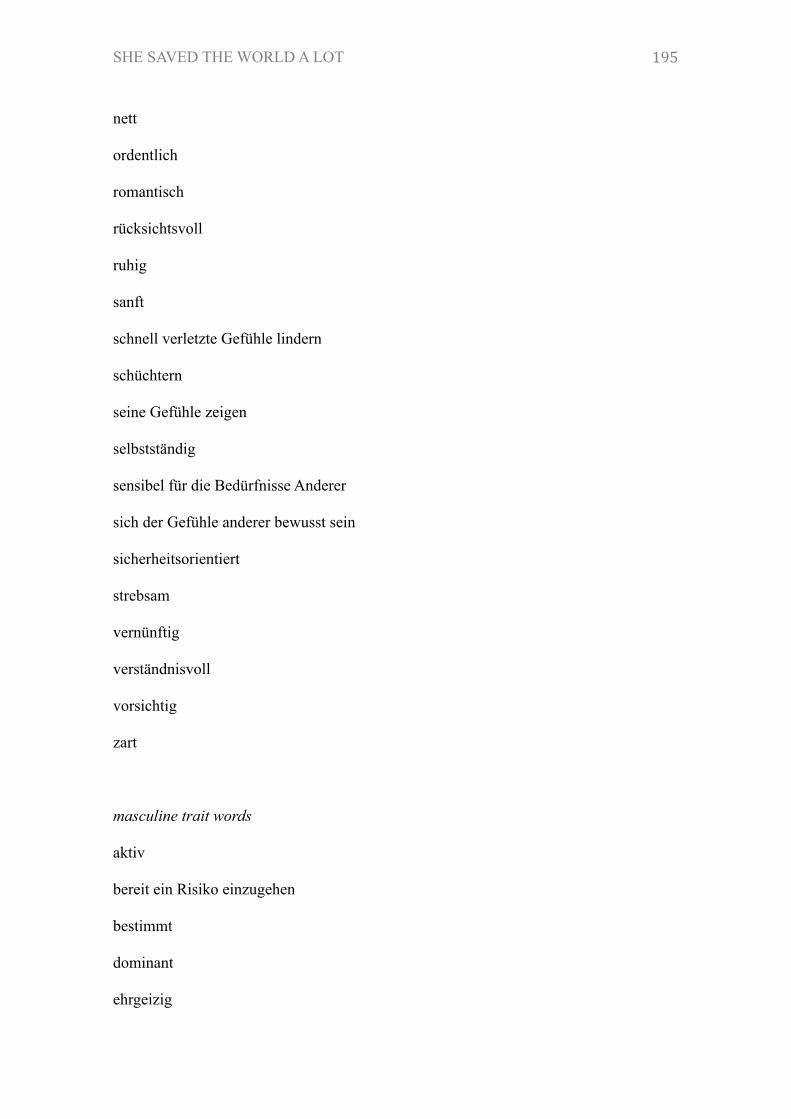
SHE SAVED THE WORLD A LOT
195
nett
ordentlich
romantisch
rücksichtsvoll
ruhig
sanft
schnell verletzte Gefühle lindern
schüchtern
seine Gefühle zeigen
selbstständig
sensibel für die Bedürfnisse Anderer
sich der Gefühle anderer bewusst sein
sicherheitsorientiert
strebsam
vernünftig
verständnisvoll
vorsichtig
zart
masculine trait words
aktiv
bereit ein Risiko einzugehen
bestimmt
dominant
ehrgeizig
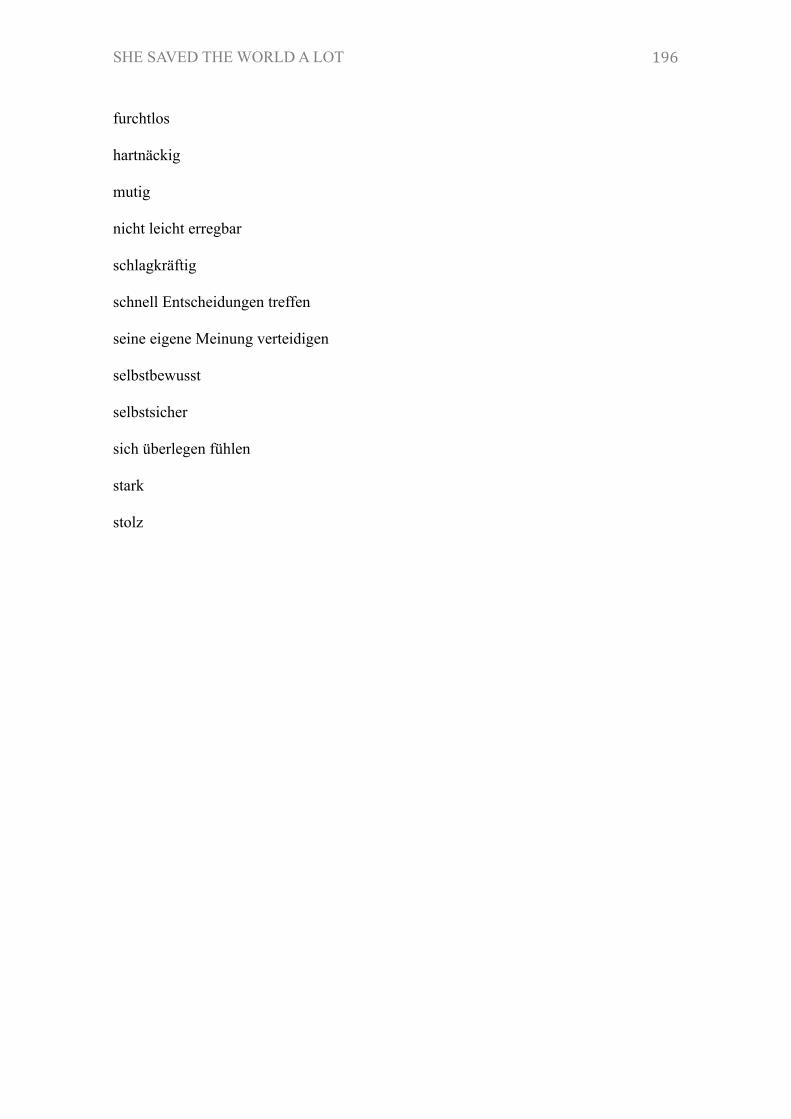
SHE SAVED THE WORLD A LOT
196
furchtlos
hartnäckig
mutig
nicht leicht erregbar
schlagkräftig
schnell Entscheidungen treffen
seine eigene Meinung verteidigen
selbstbewusst
selbstsicher
sich überlegen fühlen
stark
stolz
SHE SAVED THE WORLD A LOT
197
APPENDIX N
Instruction Kessels and Hannover (2008) task in German
In diesem Teil des Experimentes geht es um Sie selbst. Dabei müssen Sie immer
entscheiden, ob eine Beschreibung zu Ihnen passt. Diese Beschreibungen werden Sie in
der Mitte des Bildschirms sehen. Falls diese Beschreibung auf Sie passt, so drücken Sie
Y. Falls die Beschreibung nicht zu Ihnen passt, so drücken Sie die N Taste. Dies wird
Ihnen auch noch einmal am Bildschirm gezeigt. Sobald Sie eine Taste gedrückt haben,
erscheint das nächste Wort.
Beantworten Sie diese Frage zügig und nach Gefühl, ohne viel darüber nachzudenken.
Drücken Sie bitte auf die Leertaste um fortzufahren.
SHE SAVED THE WORLD A LOT
198
16Bibliography
Allport, G. W. (1954). The nature of prejudice. Reading, MA: Addison-Wesley.
Ambady, N., Paik, S. K., Steele, J., Owen-Smith, A., & Mitchell, J. P. (2004). Deflecting
negative self-relevant stereotype activation: The effects of individuation. Journal
of Experimental Social Psychology, 40, 401-408. doi:10.1016/j.jesp.2003.08.003
Aries, E., Oliver, R. R., Blount, K., Christaldi, K., Fredman, S., & Lee, T. (1998).
Race and gender as components of the working self-concept. The Journal of
Social Psychology, 138, 277-290. doi: 10.1080/00224549809600381
Aronson, J., Fried, C. B., & Good, C. (2002). Reducing the effects of stereotype threat
on African American college students by shaping theories of intelligence. Journal
of Experimental Social Psychology, 38, 113-125. doi: 10.1006/jesp.2001.1491
Aronson, J., Lustina, M. J., Good, C., Keough, K., Steele, C. M., & Brown, J. (1999).
When white men can’t do math: Necessary and sufficient factors in stereotype
threat. Journal of Experimental Social Psychology, 35, 29-46. doi:
10.1006/jesp.1998.1371
Ashmore, R. D., & Del Boca, F. K. (1981). Conceptual approaches to stereotypes and
stereotyping. In D. L. Hamilton (Ed.), Cognitive processes in stereotyping and
intergroup behavior (pp. 1-35). Hillsdale, NJ. Erlbaum.
SHE SAVED THE WORLD A LOT
199
Aubrey, J. S., & Harrison, K. (2004). The gender-role content of children’s favorite
television programs and its link to their gender-related perceptions. Media
Psychology, 6, 111-146. doi: 10.1207/s1532785xmep0602_1
Bandura, A. (1977). Social learning theory. Englewood Cliffs, NJ: Prentice-Hall.
Baumeister, R. F. (1999). The self in social psychology. Philadelphia, PA: Psychology
Press.
Baumeister, R. F., & Leary, M. R. (1995). The need to belong: Desire for interpersonal
attachments as a fundamental human motivation. Psychological Bulletin, 117,
497-529. doi: 10.1037/0033-2909.117.3.497
Baker, J. (1987). The influence of role-specific self-concept and sex-role identity on
career choices in science. Journal of Research in Science Teaching, 24, 739-756.
doi: 10.1002/tea.3660240807
Banaji, M., & Hardin, C. (1996). Automatic stereotyping. Psychological Science,
7, 136-141. doi: 10.1111/j.1467-9280.1996.tb00346.x
Beilock, S. L., Jellison, W. A., Rydell, R. J., McConnell, A. R., & Carr, T. H. (2006). On
the causal mechanisms of stereotype threat: Can skills that don’t rely heavily on
working memory still be threatened? Personality and Social Psychology Bulletin,
32, 1059-1071. doi: 10.1177/0146167206288489
SHE SAVED THE WORLD A LOT
200
Bem, S. L. (1974). The measurement of psychological androgyny. Journal of
Consulting and Clinical Psychology, 42, 155-162.
Benbow, C. P., & Stanley, J. C. (1980). Sex differences in mathematical ability: Fact or
artifact? Science, 210, 1262-1264. doi: 10.1126/science.7434028
Ben-Zeev, T., Fein, S., & Inzlicht, M. (2005). Arousal and stereotype threat. Journal of
Experimental Social Psychology, 41, 174-181. doi: 10.1016/j.jesp.2003.11.007
Billson, A. (2005). Buffy the vampire slayer. London, UK: British Film Institute.
Bölling, R. (2000). Königin der Wissenschaft, Sofja Kowalewskaja zum 150.
Geburtstag. Mitteilungen der Deutschen Mathematiker-Vereinigung, 8, 21-28.
Bollen, K. A., & Jackman, R. W. (1990). Regression diagnostics: An expository
treatment of outliers and influential cases. In J. Fox, & J. S. Long (Eds.), Modern
methods of data analysis (pp. 257-291). Newbury Park, CA: Sage.
Borzelleca, D. (2012). The male-female ratio in college. Forbes. Retrieved from
http://www.forbes.com/sites/ccap/2012/02/16/the-male-female-ratio-in-
college/#3fee2cf11525.
Brehm, S., & Brehm, J. (1981). Psychological reactance: A theory of freedom and
control. San Diego, CA: Academic Press.
SHE SAVED THE WORLD A LOT
201
Brown, P. M., & Turner, J. C. (2002). The role of theories in the formation of stereotype
content. In C. McGarty, V. Y. Yzerbyt, & R. Spears (Eds.), Stereotypes as
explanations (pp. 67-89). Cambridge, UK: Cambridge University Press.
Brown, R. P., & Pinel, E. C. (2003). Stigma on my mind: Individual differences in the
experience of stereotype threat. Journal of Experimental Social Psychology, 39,
626-633. doi: 10.1016/S0022-1031(03)00039-8
Cadinu, M., Maass, A., Frigerio, S., Impagliazzo, L., & Latinotti, S. (2003). Stereotype
threat: The effect of expectancy on performance. European Journal of Social
Psychology, 33, 267-285. doi: 10.1002/ejsp.145
Cadinu, M., Maass, A., Lombardo, M., & Frigerio, S. (2006). Stereotype threat: The
moderating role of locus of control beliefs. European Journal of Social
Psychology, 36, 183-197. doi: 10.1002/ejsp.303
Cadinu, M., Maass, A., Rosabianca, A., & Kiesner, J. (2005). Why do women
underperform under stereotype threat? Evidence for the role of negative thinking.
Psychological Science, 16, 572-578. doi: 10.1111/j.0956-7976.2005.01577.x
Campbell, P. B., & Storo, J. N. (1994). Girls are…boys are…:Myths, stereotypes &
gender differences. Office of Educational Research and Improvement. Retrieved
from: http://www.campbell-kibler.com/stereo.pdf.
SHE SAVED THE WORLD A LOT
202
Cherney, I.D., Kelly-Vance, L., Glover, K. G., Ruane, A., & Ryalls, B. O. (2003). The
effects of stereotyped toys and gender on play assessment in children aged 18-47
months. Educational Psychology, 23, 95-106. doi: 10.1080/01443410303222
Cheryan, S., & Bodenhausen, G. V. (2000). When positive stereotypes threaten
intellectual performance: The psychological hazards of model minority status.
Psychological Science, 11, 399-402. doi: 10.1111/1467-9280.00277
Cheryan, S., Plaut, V. C., Davies, P. G., & Steele, C. M. (2009). Ambient belonging:
how stereotypical cues impact gender participation in computer science. Journal
of Personality and Social Psychology, 97, 1045-1060. doi: 10.1037/a0016239
Cialdini, R.B., Borden, R.J., Thorne, A., Walker, M.R., Freeman, S. & Sloan, L.R.
(1976). Basking in reflected glory: Three (football) field studies. Journal of
Personality and Social Psychology, 34, 366-375. doi: 10.1037/0022-
3514.34.3.366
Cohen, J. (1992). A power primer. Psychological Bulletin, 112, 155-159. doi:
10.1037/0033-2909.112.1.155
Cohen, G. L., Garcia, L., Apfel, N., & Master, A. (2006). Reducing the racial
achievement gap: A social-psychological intervention. Science, 313, 1307-1310.
doi: 10.1126/science.1128317
SHE SAVED THE WORLD A LOT
203
Cohen, G. L, Purdie-Vaughns, V. & Garcia, J. (2012). An identity threat perspective on
intervention. In M. Inzlicht & T. Schmader (Eds.), Stereotype threat: Theory,
process, and application. (pp. 280-296). New York, NY: Oxford University Press.
Cohen, G. L., Servan-Schreiber, D., & McClelland J. L. (1992). A parallel distributed
processing approach to automaticity. American Journal of Psychology, 105, 239-
269. doi: 10.2307/1423029
Cohen, G. L., Steele, C. M., Ross, L. D. (1999). The mentor’s dilemma: Providing
critical feedback across racial divide. Personality and Social Psychology Bulletin,
25, 1302-1318. doi: 10.1177/0146167299258011
Dasgupta, N. (2011). Ingroup experts and peers as social vaccines who inoculate the
self-concept: The stereotype inoculation model. Psychological Inquiry, 14, 231-
246. doi: 10.1080/1047840X.2011.607313
Dasgupta, N., & Asgari, S. (2004). Seeing is believing: Exposure to counterstereotypic
women leaders and its effects on the malleability of automatic gender
stereotyping. Journal of Experimental Social Psychology, 40, 642-658. doi:
10.1080/1047840X.2011.607313
Davies, P. G., Spencer, S. J., Quinn, D. M., & Gerhardstein, R. (2002). Consuming
images: How television commercials that elicit stereotype threat can restrain
women academically and professionally. Personality and Social Psychology
Bulletin, 28, 1615-1628. doi: 10.1177/014616702237644
SHE SAVED THE WORLD A LOT
204
D’Ailly, H. H. (1992). Asian mathematics superiority: A search for explanations.
Educational Psychologist, 27, 243-261.
Devine, P. G. (1989). Stereotypes and prejudice: Their automatic and controlled
components. Journal of Personality and Social Psychology, 56, 5-18. doi:
10.1037/0022-3514.56.1.5
Devine, P. G., & Monteith M. J. (1993). The role of discrepancy-associated affect in
prejudice reduction. In D. M. Mackie & D. L. Hamilton (Eds.), Affect, cognition,
and stereotyping: Interactive processes in group perception (pp. 317-344). San
Diego, CA: Academic Press.
Devine, P. G., Plant, E. A., Amodio, D. M., Harmon-Jones, E., & Vance, S. L., (2002).
The regulation of explicit and implicit race bias: The role of motivations to
respond without prejudice. Journal of Personality and Social Psychology, 82,
835-848. doi: 10.1037//0022-3514.82.5.835.835
Dijksterhuis, A., Aarts, H., Bargh, J. A., & van Knippenberg, A. (2000). On the relation
between associative strength and automatic behavior. Journal of Experimental
Social Psychology, 36, 531-544. doi: 10.1006/jesp.2000.1427
Dweck, C. S., & Leggett, E. L. (1988). A social-cognitive approach to motivation and
personality. Psychological Review, 95, 256, 273. doi:10.1037/0033-
295X.95.2.256
SHE SAVED THE WORLD A LOT
205
Ebbinghaus, H. (1971). Über das Gedächtnis: Untersuchungen zur experimentellen
Psychologie [Memory: A contribution to experimental psychology]. Darmstadt:
Wissenschaftliche Buchgesellschaft. (Original work published 1885)
Eccles, J. S. (1987). Gender roles and women’s achievement-related decisions.
Psychology of Women Quarterly, 11, 135-172. doi: 10.1111/j.1471-
6402.1987.tb00781.x
European Commission (2012). She figures 2012: Gender in research and innovation,
statistics and indicators. Luxembourg: Publications Office of the European
Union.
Fazio, R. H. (1990). A practical guide to the use of response latency in social
psychological research. In C. Hendrick & M. S. Clark (Eds.), Research methods
in personality and social psychology (pp. 74–97). London: Sage.
Field, A. (2013). Discovering statistics using SPSS. London, UK: Sage.
Ford, T. E., Ferguson, M. A., Brooks, J. L., & Hagadone, K. M. (2004). Coping sense of
humor reduces effects of stereotype threat on women’s math performance.
Personality and Social Psychology Bulletin, 30, 643-653. doi:
10.1177/0146167203262851
Galdi, S., Cadinu, M., & Tomasetto, C. (2014). The roots of stereotype threat: when
automatic associations disrupt girls’ math performance. Child Development, 85,
250-263. doi: 10.1111/cdev.12128
SHE SAVED THE WORLD A LOT
206
Gawronski, B., Deutsch, R., Mbirkou, S., Seibt, B., & Strack, F. (2008). When “just say
no” is not enough: Affirmation versus negation training and the reduction of
automatic stereotype activation. Journal of Experimental Social Psychology, 44,
370-377. doi: 10.1016/j.jesp.2006.12.004
Geis, F. L., Brown, V., Jennings, J., & Porter, N. (1984). TV commercials as
achievement scripts for women. Sex Roles, 10, 513-525. doi:
10.1007/BF00287260
Gerbner, G., Gross, L., Morgan, M., & Signorielli (1980). The ‘mainstreaming’ of
America: Violence profile no. 11. Journal of Communication, 30, 10-29. doi:
10.1111/j.1460-2466.1980.tb01987.x
George, D., & Mallery, P. (2002). SPSS for Windows step by step: A simple guide and
reference 11.0 update. Boston, MA: Allyn & Bacon.
Gilbert, G. M. (1951). Stereotype persistence and change among college students.
Journal of Abnormal and Social Psychology, 46, 245-254. doi: 10.1037/h0053696
Good, J. J., Woodzicka, J. A., & Wingfield, L. C. (2010). The effects of gender
stereotypic and counter-stereotypic textbook images on science performance.
Journal of Social Psychology, 150, 132-147. doi: 10.1080/00224540903366552
SHE SAVED THE WORLD A LOT
207
Greenberg, B. S. (1988). Some uncommon television images and the drench hypothesis.
In S. Oskamp (Ed.), Television as a social issue (pp.88-102). Beverly Hills, CA:
Sage.
Guiso, L., Monte, F., Sapienza, P., & Zingales, L. (2008). Culture, gender, math.
Science, 320, 1164-1165. doi: 10.1126/science.1154094
Gupta, V. K., & Bhawe, N. M. (2007). The influence of proactive personality and
stereotype threat on women’s entrepreneurial intentions. Journal of Leadership
and Organizational Studies, 13, 73-85. doi: 10.1177/10717919070130040901
Hamilton, D. L., & Gifford, R. K. (1976). Illusory correlation in intergroup perception:
A cognitive basis of stereotypic judgments. Journal of Experimental Social
Psychology, 12, 392-407. doi: 10.1016/S0022-1031(76)80006-6
Hannover, B., & Kühnen, U. (2008). Culture and social cognition in human interaction.
In F. Strack & J. Förster (Eds.), Social cognition – the basis of human interaction.
London, UK: Taylor & Francis Psychology Press.
Henrion, C. (1997). Women in mathematics: The addition of differences. Indianapolis,
Indiana University Press.
Hinton, P. R. (2000). Stereotypes, cognitions, and culture. New York, NY: Psychology
Press.
SHE SAVED THE WORLD A LOT
208
Huguet, P., & Régner, I. (2009). Counter-stereotypic beliefs in math do not protect
school girls from stereotype threat. Journal of Experimental Social Psychology,
45, 1024-1027. doi: 10.1016/j.jesp.2009.04.029
Inzlicht, M., & Ben-Zeev, T. (2000). A threatening intellectual environment: Why
females are susceptible to experiencing problem-solving deficits in the presence
of males. Psychological Science, 11, 365-371. doi: 10.1111/1467-9280.00272
Jensen, A. R. (1980). Bias in mental testing. New York, NY: Free Press.
Johns, M., Schmader, T., & Martens, A. (2005). Knowing is half the battle: Teaching
stereotype threat as a means of improving women’s math performance.
Psychology Sciences, 16, 175-179. doi: 10.1111/j.0956-7976.2005.00799.x
Kane, J., M., & Mertz, J. E. (2012). Debunking myths about gender and mathematics
performance. Notices of the American Mathematical Society, 59, 10-21. doi:
10.1090/noti790
Katz, D., & Braly, K. (1933). Racial stereotypes of one hundred college students.
Journal of Abnormal and Social Psychology, 28, 280-290. doi: 10.1037/h0074049
Kaiser Family Foundation (2016). Population distribution by gender. Retrieved from
http://kff.org/other/state-indicator/distribution-by-gender/?currentTimeframe=0&
sortModel=%7B%22colId%22:%22Location%22,%22sort%22:%22asc%22%D.
SHE SAVED THE WORLD A LOT
209
Kaiser-Meßmer, G. (1993). Results of an empirical study into gender differences in
attitudes towards mathematics. Educational Studies in Mathematics, 25, 209-233.
Kanfer, R., & Ackerman, P. L. (1989). Motivation and cognitive abilities: An
integrative/ aptitude-treatment interaction approach to skill acquisition. Journal of
Applied Psychology, 74, 657-690. doi: 10.1037/0021-9010.74.4.657
Kawakami, K., Dovidio, J. F, Moll, J., Hermsen, S., & Russin, A. (2000). Just say no (to
stereotyping): Effects of training in the negation of stereotypic associations on
stereotype activation. Journal of Personality and Social Psychology, 78, 871-888.
doi: 10.1016/j.jesp.2004.05.004
Kawakami, K., Dovidio, J. F., & van Kamp, S. (2005). Kicking the habit: Effects of
nonstereotypic association training and correction processes on hiring decisions.
Journal of Experimental Social Psychology, 41, 68-75. doi:
10.1016/j.jesp.2004.05.004
Keller, J. (2002). Blatant stereotype threat and women’s math performance: Self-
handicapping as a strategic means to cope with obtrusive negative performance
expectations. Sex Roles, 47, 193-198. doi: 10.1023/A:1021003307511
Kellner, D. (2003). Buffy, the vampire slayer as spectacular allegory: A diagnostic
critique. Retrieved from: https://pages.gseis.ucla.edu/faculty
/kellner/essays/buffy.pdf.
SHE SAVED THE WORLD A LOT
210
Kelly, S. E., & Rozner, S. A. (2012). Winifred Edgerton Merrill: “She opened the door”.
Notices of the American Mathematical Society, 59, 504-512.
Kessels, U. & Hannover, B. (2008). When being a girl matters less. Accessibility of
gender-related self-knowledge in single-sex and coeducational classes. British
Journal of Educational Psychology, 78. 273–289. doi:
10.1348/000709907X215938
Kessels, U., Rau, M., & Hannover, B. (2006). What goes well with physics? Measuring
and altering the image of science. British Journal of Educational Psychology, 74,
761–780. doi: 10.1348/000709905X59961
Koch, S. C., Müller, S. M., & Sieverding, M. (2008). Women and computers. Effects of
stereotype threat on attribution of failure. Computers and Education, 51, 1795-
1803. doi: 10.1016/j.compedu.2008.05.007
Lesko, A. C., & Corpus, J. H. (2006). Discounting the difficult: How high math-
identified women respond to stereotype threat. Sex Roles, 54, 113-125. doi:
10.1007/s11199-005-8873-2
Liepmann, D., Beauducel, A., Brocke, B., & Amthauer, R. (2007). Intelligenz-Struktur-
Test 2000R. Göttingen: Hogrefe.
Lippmann, W. (1922). Public opinion. New York, NY: Harcourt, Brace and Co.
SHE SAVED THE WORLD A LOT
211
Lockwood, P., & Kunda, Z. (1997). Superstars and me: Predicting the impact of role
models on the self. Journal of Personality and Social Psychology, 73, 91-103. doi:
10.1037/0022-514.73.1.91
Lojewski, J. (2011). Geschlecht und Studientfachwahl- fachspezifischer Habitus oder
geschlechtsspezifische Fachkulturen? In P. Bornkessel & J. Asdonk (Eds). Der
Übergang Schule-Hochschule. Wiesbaden, Germany: Springer Fachmedien.
Luhtanen, R., & Crocker, J. (1992). A collective self-esteem scale: Self-evaluation of
one’s social identity. Personality and Social Psychology Bulletin, 18, 302-318.
doi: 10.1177/0146167292183006
Major, B., & O’Brien, L. T. (2005). The social psychology of stigma. Annual Review of
Psychology, 56, 393-421. doi: 10.1146/annurev.psych.56.091103.070137
Markus, H., & Kunda, Z. (1986). Stability and malleability of the self-concept. Journal
of Personality and Social Psychology, 51, 858-866. doi: 10.1037/0022-
3514.51.4.858
Marlens, N., Black, C., & Rosenthal, D. S. (Creators) (1994). Ellen. In The
Black/Marlens Company (Production). Los Angeles, CA: Touchstone Television.
Martin, C. L., & Ruble, D. N. (2010). Patterns of gender development. Annual Review
of Psychology, 61, 353-381. doi: 10.1146/annurev.psych.093008.100511
SHE SAVED THE WORLD A LOT
212
Marx, D. M., & Ko, S. J. (2011). Refocusing or recycling?: The stereotype inoculation
model and its relationship with research on ingroup role models. Psychological
Inquiry, 22, 280-284. doi: 10.1080/1047840X.2011.621050
Marx, D. M., & Ko, S. J. (2012). Superstars “like” me: The effect of role model
similarity on performance under threat. European Journal of Social Psychology,
42, 807-812. doi: 10.1002/ejsp.1907
Marx, D., Ko, S. J., & Friedman, R. (2009). The ‚Obama effect‘: How a salient role
model reduces race-based performance differences. Journal of Experimental
Social Psychology, 45, 953-956. doi: 10.1016/j.jesp.2009.03.012
Marx, D. M., & Roman, J. S. (2002). Female role models: Protecting women's math test
performance. Personality and Social Psychology Bulletin, 28, 1183–1193. doi:
10.1177/01461672022812004
Marx, D., Stapel, D. A., & Muller, D. (2005). We can do it: The interplay of construal
orientation and social comparisons under threat. Journal of Personality and Social
Psychology, 88, 432-446. doi: 10.1037/0022-3514.88.3.432
McCabe, J., Fairchild, E., Grauerholz, L, Pescosolido, B. A., & Tope, D. (2011). Gender
in twentieth-century children’s books patterns of disparity in titles and central
characters. Gender & Society, 25, 197-226. doi: 10.1177/0891243211398358
SHE SAVED THE WORLD A LOT
213
McGarty, C., Yzerbyt, V. Y., & Spears, R. (2002). Social, cultural and cognitive factors
in stereotype threat formation. In C. McGarty, V. Y. Yzerbyt, & R. Spears (Eds.),
Stereotypes as explanations (pp. 1-15). Cambridge: Cambridge University Press.
McGuire, W. J., McGuire, C. V., Child, P., & Fujioka, T. (1978). Salience of Ethnicity in
the Spontaneous Self-Concept as a Function of One's Ethnic Distinctiveness in the
Social Environment. Journal of Personality and Social Psychology, 36, 511-520.
doi: 10.1037/0022-3514.36.5.511
McIntyre, R. B., Lord, C. G., Gresky, D. M., Ten Eyck, L. L., Frye, G. D. J., & Bond Jr.,
C. F. (2005). A social impact trend in the effects of role models on alleviating
women's mathematics stereotype threat. Current Research in Social Psychology,
10, 116–136.
Murphy, M. C., Steele, C. M., & Gross, J. J. (2007). Signaling threat: How situational
cues affect women in math, science, and engineering settings. Psychological
Science, 18, 879-885. doi:10.1111/j.1467-9280.2007.01995.x
National Girls Collaborative Project. (2016). State of Girls and Women in STEM.
Retrieved June 1, 2016, from https://ngcproject.org/statistics.
Nathanson, A. I., Wilson, B. J., McGee, J., & Sebastian, M. (2002). Counteracting the
effects of female stereotypes on television via active mediation. Journal of
Communication, 52, 922-937. doi: 10.1111/j.1460-2466.2002.tb02581.x
SHE SAVED THE WORLD A LOT
214
Nguyen, H. -H. D., O’Neal, A., & Ryan, A. M. (2003). Relating test-taking attitudes and
skills and stereotype threat effects to the racial gap in cognitive ability test
performance. Human Performance, 16, 261-294.
Nobelprize.org (2016). Marie Curie – Facts. Retrieved from
https://www.nobelprize.org/nobel_prizes/chemistry/laureates/1911/marie-curie-
facts.html.
Normand, J-M. (2012). French stereotypes: Arrogant and good in bed? Bien sûr! The
Guardian. Retrieved from https://www.theguardian.com/world/2012/jan/26/
french-stereotypes-arrogant-good-in-bed.
O’Brien, L. T., & Crandall, C. S. (2003). Stereotype threat and arousal: Effects on
women’s math performance. Personality and Social Psychology Bulletin, 29, 782-
789. doi: 10.1177/0146167203029006010
Organisation for Economic Co-operation and Development (2015). Are boys and girls
equally prepared for life? Retrieved from https://www.oecd.org/pisa/pisaproducts
/PIF-2014-gender-international-version.pdf.
Osborne, J. W. (2001). Testing stereotype threat: Does anxiety explain race and sex
differences in achievement?. Contemporary Educational Psychology, 26, 291-310.
doi: 10.1006/ceps.2000.1052
SHE SAVED THE WORLD A LOT
215
Oswald, D. L., & Harvey, R. D. (2000). Hostile environments, stereotype threat, and
math performance among undergraduate women. Current Psychology, 19, 338-
356. doi: 10.1007/s12144-000-1025-5
Pennington, C. R., Heim, D., Levy, A. R., & Larkin, D. T. (2016). Twenty years of
stereotype threat research: A review of psychological mediators. PloS ONE 11, 1-
25. doi: 10.1371/journal.pone.0146487
Plaks, J. E., Stroessner, S. J., Dweck, C. S., & Sherman, J W. (2001). Person theories
and attention allocation: Preferences for stereotypic versus counterstereotypic
information. Journal of Personality and Social Psychology, 80, 876-893. doi:
10.1037//0022-3514.80.6.876
Popham, W. J. (1999). Why standardized test don’t measure educational quality.
Educational Leadership, 56, 8-15.
Quinn, D. M., & Spencer, S. J. (2001). The interference of stereotype threat with
women’s generation of mathematical problem-solving strategies. Journal of
Social Issues, 57, 55-71.
Radbruch, K. (2008). Emmy Noether: Mathematikerin mit hellem Blick in dunkler Zeit.
Speech presented at Emmy Noether Vorlesung at Friederich-Alexander
Universität Erlangen-Nürnberg, Erlangen.
SHE SAVED THE WORLD A LOT
216
Raley, S., & Bianchi, S. (2006). Sons, daughters, and family processes: Does gender of
children matter?. Annual Review of sociology, 32, 401-421. doi:
10.1146/annurev.soc.32.061604.123106
Rosenthal, H. E. S., & Crisp, R. J. (2006). Reducing stereotype threat by blurring
intergroup boundaries. Personality and Social Psychology Bulletin, 2, 307-333.
doi: 10.1177/0146167205281009
Sawyer, T. P., Jr, & Hollis-Sawyer, L. A. (2005). Predicting stereotype threat, test
anxiety, cognitive ability test performance: An examination of three models.
International Journal of Testing, 5, 225-246. doi: 10.1207/s15327574ijt0503_3
Schimel, J., Arndt, J., Banko, K. M., & Cook, A. (2004). Not all self-affirmations were
created equal: The cognitive and social benefit of affirming the intrinsic (vs.)
extrinsic self. Social Cognition, 22, 75-99.
Schmader, T. (2002). Gender identification moderates stereotype threat effects on
women’s math performance. Journal of Experimental Social Psychology, 38, 194-
201. doi: 10.1006/jesp.2001.1500
Schmader, T., & Johns, M. (2003). Converging evidence that stereotype threat reduces
working memory capacity. Journal of Personality and Social Psychology, 85,
440-452. doi: 10.1037/0022-3514.85.3.440
SHE SAVED THE WORLD A LOT
217
Schneider, D. J. (2005). The psychology of stereotyping. London, UK: The Guildford
Press.
Seibt, B., & Förster, J. (2004). Stereotype threat and performance: How self-stereotypes
influence processing by inducing regulatory foci. Journal of Personality and
Social Psychology, 87, 38-56. doi: 10.1037/0022-3514.87.1.38
Shapiro, J. R., & Neuberg, S. L. (2007). From stereotype threat to stereotype threats:
Implications of a multi-threat framework for causes, moderators, mediators,
consequences, and interventions. Personality and Social Psychology Review, 11,
107-130. doi: 10.1177/1088868306294790
Smith, J. L. (2004). Understanding the process of stereotype threat: A review of
mediational variables and new performance goal directions. Educational
Psychology Review, 16, 177-206. doi: 10.1023/B:EDPR.0000034020.20317.89
Spencer, S. J., Logel, C., & Davies, P. G. (2016). Stereotype threat. Annual Review of
Psychology, 67, 415-437. doi: 10.1146/annurev-psych-073115-103235
Spencer, S. J., Steele, C. M., & Quinn, D. M. (1999). Stereotype threat and women’s
math performance. Journal of Experimental Social Psychology, 35, 4-28. doi:
10.1006/jesp.1998.1373
Steele, C. M. (1992). Race and the schooling of black Americans. The Atlantic Monthly,
269, 68-78.
SHE SAVED THE WORLD A LOT
218
Steele, C. M. (2002). Kenneth Clark’s context and mine: Toward a context based theory
of social identity threat. In G. Philogene (Ed.), Race and identity: Perspectives on
American Society. Washington, DC: American Psychological Association.
Steele, C. M., & Aronson, J. (1995). Stereotype threat and the intellectual test
performance of African Americans. Journal of Personality and Social Psychology,
69, 797-813.
Steele, C. M., Spencer, S. J., & Aronson, J. M. (2002). Contending with group image:
The psychology of stereotype and social identity threat. Advances in Experimental
Social Psychology, 34, 379-440.
Steele, J., James, J. B., & Barnett, R. C. (2002). Learning in a man’s world: examining
the perceptions of undergraduate women in male-dominated academic areas.
Psychology of Women Quarterly, 26, 46-50.
Stone, J., Lynch, C. I., Sjomeling, M., & Darley, J. M. (1999). Stereotype threat effects
on black and white athletic performance. Journal of Personality and Social
Psychology, 77, 1213-1227. doi: 10.1037/0022-3514.77.6.1213
Stricker, L. J., & Ward, W. C. (2004). Stereotype threat, inquiring about test takers’
ethnicity and gender, and standardized test performance. Journal of Applied Social
Psychology, 34, 665-693. doi: 10.1111/j.1559-1816.2004.tb02564.x
SHE SAVED THE WORLD A LOT
219
Tiedemann, J. (2000). Parents’ gender stereotypes and teachers’ beliefs as predictors of
children’s concept of their mathematical ability in elementary school. Journal of
Educational Psychology, 92, 133-151. doi: 10.1037/0022-0663.92.1.144
Tversky, A., & Kahnemann, D. (1973). Availability: A heuristic for judging frequency
and probability. Cognitive Psychology, 4, 207-232. doi: 10.1016/0010-
0285(73)90033-9
von Hippel, W., von Hippel, C., Conway, L., Preacher, K. J., Schooler, J. W., &
Radvansky, G. A. (2005). Coping with stereotype threat: Denial as an impression
management strategy. Journal of Personality and Social Psychology, 89, 22-35.
Voyer, D., & Voyer, S. D. (2014). Gender differences in scholastic achievement: A meta-
analysis. Psychological Bulletin, 140, 1174-1204. doi: 10.1037/a0036620
Walton, G. M., & Cohen, G. L. (2003). Stereotype lift. Journal of Experimental Social
Psychology, 39, 456-467. doi: 10.1016/S0022-1031(03)00019-2
Walton, G. M., & Cohen, G. L. (2011). A brief social-belonging intervention improves
academic and health outcomes of minority students. Science, 331, 1447-1451. doi:
10.1126/science.1198364
Walton, G. M., Spencer, S. J., & Erman, S. (2013). Affirmative meritocracy. Social
Issues and Policy Review, 7, 1-35. doi: 10.1016/0010-0285(73)90033-9
SHE SAVED THE WORLD A LOT
220
Wegener, D. T., & Petty, R. E. (1997). The flexible correction model: The role of naive
theories of bias in bias correction. In M. P. Zanna (Ed.), Advances in experimental
social psychology (pp. 141–208). New York: Academic Press.
Weinberger, E., Cosby, B., & Zagor, M. (Creators) (1969). The Bill Cosby show. In
Miller, M. & Weinberger, E. (Producers). Los Angeles: NBC.
Whedon, J. (Creator) (1997). Buffy the Vampire Slayer. In & Greenwalt, D., Noxon, M.,
Kuzui, F. R., & Kuzui K. (Executive Producers). Los Angeles, CA: The WB.
Wheeler, S. C., & Petty, R. E. (2001). The effects of stereotype activation on behavior:
A review of possible mechanisms. Psychological Bulletin, 127, 797-826. doi:
10.1037//0033-2909.127.6.797
Wilcox, R. (2005). Why Buffy matters: The art of Buffy the vampire slayer. London, UK:
I.B. Tauris & Co Ltd.
Wilcox, R. & Lavery, D. (2002). Fighting the forces: What’s at stake in Buffy the
vampire slayer. Lanham, MD: Rowman & Littlefield Publishers.
Yoder, J. D., Christopher, J., & Holmes, J.D. (2008). Are television commercials still
achievement scripts for women? Psychology of Women Quarterly, 32, 303-311.
doi: 10.1111/j.1471-6402.2008.00438.x
Zajonc, R. B. (1965). Social facilitation. Science, 149, 269-274.

SHE SAVED THE WORLD A LOT
221
Zanna, M. P., & Olson, J. M. (Eds.). (1994). The psychology of prejudice. Hillsdale, NJ:
Lawrence Erlbaum Associates, Publishers.