Embed Size (px)
Citation preview
University of Arkansas, FayettevilleScholarWorks@UARK
Civil Engineering Undergraduate Honors Theses Civil Engineering
5-2014
Shear Capacity of Prestressed Lightweight Self-Consolidating ConcreteMicah Alan WyssmannUniversity of Arkansas, Fayetteville
Follow this and additional works at: http://scholarworks.uark.edu/cveguht
Part of the Civil Engineering Commons, and the Structural Engineering Commons
This Thesis is brought to you for free and open access by the Civil Engineering at ScholarWorks@UARK. It has been accepted for inclusion in CivilEngineering Undergraduate Honors Theses by an authorized administrator of ScholarWorks@UARK. For more information, please [email protected], [email protected].
Recommended CitationWyssmann, Micah Alan, "Shear Capacity of Prestressed Lightweight Self-Consolidating Concrete" (2014). Civil EngineeringUndergraduate Honors Theses. 17.http://scholarworks.uark.edu/cveguht/17


SHEAR CAPACITY OF PRESTRESSED LIGHTWEIGHT
SELF-CONSOLIDATING CONCRETE BEAMS
An Undergraduate Honors College Thesis
in the
Department of Civil Engineering
College of Engineering
University of Arkansas
Fayetteville, AR
by
Micah Alan Wyssmann
ABSTRACT
In prestressed members, self-consolidating concrete (SCC) has in some cases exhibited
lower shear capacity than conventional concrete, which has been attributed to decreased
aggregate interlock. However, little data is currently available to assess whether use of
lightweight aggregate in prestressed SCC beams has further impact on aggregate interlock and
shear strength. This study measured the shear capacity of six prestressed beams made from three
different concrete mixtures: lightweight self-consolidating concrete (LWSCC) with expanded
shale aggregate, LWSCC with expanded clay aggregate, and control normal weight SCC with
limestone aggregate. Predicted shear capacities were determined based on current ACI Building
Code and compared with measured shear strengths. ACI predictions underestimated shear
capacity for all tests and were more conservative for the control normal weight SCC beams than
for the LWSCC beams.

1
INTRODUCTION
Presented in this paper are the results of a research project that examined the use of
lightweight self-consolidating concrete (LWSCC) in prestressed beams. Lightweight concrete by
definition has a lower unit weight than that of conventional concrete, which reduces dead load
and thereby decreases overall material requirements. Self-consolidating concrete (SCC) was
developed in response to a need for improved construction and products. The use of SCC
eliminates the need for vibration during placement, which is achieved through both a high
deformability and a resistance to segregation when in its fresh state. These advantages compared
to conventional concrete have been the major driving factor for the prestressed concrete research
that has focused on LWSCC and SCC. However, there is currently little data on the shear
strength of prestressed LWSCC beams, and likewise there is little understanding regarding their
mechanical properties. This experimental study was conducted to determine the shear capacity of
prestressed LWSCC beams and to compare these values both to the predicted shear capacity
obtained using current ACI Building Code (ACI Committee 318, 2011), referred to hereafter as
ACI 318, and to the results for control normal weight SCC beams.
BACKGROUND
The shear strength of prestressed concrete members cast with normal weight self-
consolidating concrete (SCC) has been studied on multiple occasions, but the conclusions vary
regarding whether or not SCC has lower shear strength than conventional concrete (CC).
Multiple studies have displayed similar shear strengths for both SCC and CC in prestressed
beams (Burgueño and Bendert 2007; Hamilton and Labonte 2005; Naito et al. 2006), while
others have shown slightly lower shear strengths for SCC compared to CC (Hegger et al. 2007;
Hassan et al. 2010). Aggregate interlock has long been known as a significant contributing factor

2
to shear strength (Taylor 1970). Khayat and Mitchell (2009) concluded that an observed decrease
in shear strength of SCC relative to CC is likely the result of reduced aggregate interlock in SCC
because of its lower coarse aggregate content. In addition, aggregate type also affects aggregate
interlock in both SCC and CC mixtures, though the effects of aggregate type on shear strength
and on other mixture properties of SCC are still not fully understood (Kim et al. 2010).
ACI 318 design provisions use a modification factor (λ) when calculating shear strength
to account for the decreased mechanical properties of lightweight concrete (LWC) relative to
normal weight mixtures of similar compressive strength. Yang and Ashour (2011) assessed the
aggregate interlock properties of LWC in deep beams, which either have an overall span-to-
depth ratio equal to or less than 4.0 or have a concentrated load placed within a distance of two
times the overall height from the face of a support. Their study determined that the ACI
modification factor for LWC led to conservative shear capacity predictions for some but not all
concrete mix designs. Dymond et al. (2010) determined the shear strength of a single prestressed
LWSCC bridge girder and compared this to the predicted strength from the AASHTO general
method (2002), which was found to be conservative. The AASHTO (2002) method analyzed for
their study differs from the ACI 318 detailed method only by minor variations in the application
of the LWC modification factor. Though cases of decreased shear strength for both LWC and
SCC have been demonstrated, little data is available other than that provided by Dymond et al.
(2010) to assess the shear capacity of prestressed LWSCC members.
MATERIALS AND METHODS
Test Specimens
Six rectangular beams with dimensions of 6.5 in. x 12 in. x 18 ft. were cast for the non-
destructive study of prestress losses at the University of Arkansas (Bymaster 2012). These beams

3
were later used for this study of shear strength. The sample set consisted of two beams made
from each of three mixture designs: LWSCC with expanded clay aggregate, LWSCC with
expanded shale aggregate, and control normal weight SCC with limestone aggregate. Table 1
gives the nominal maximum size, the specific gravity (SG) and the absorption capacity (AC) for
each of the coarse aggregate types. The concrete mixture proportions are given in Table 2 and
were developed during another previous research project at the University of Arkansas (Floyd
2012). Two Grade 270 low-relaxation prestressing steel strands of 0.6 in. diameter were placed
at 10 in. of depth from the top fiber of each beam. Additional Grade 60 steel reinforcement
included two ¾ in. (No. 6) bars placed 2 in. from the top fiber and ¼ in. (No. 2) smooth rebar
shear stirrups. Spacing of the steel reinforcement in the beam design is shown in Figure 1.
Table 1. Aggregate Properties
Aggregate Type Limestone Clay Shale
Nom. Max. Size (in.) 3/8 1/2 3/4
SG (ASTM C127) 2.68 1.24 1.40
SG (ACI 211.2) NA 1.25 1.41
AC (ASTM C127) (%) 0.38 16.3 15.0
AC (ACI 211.2) (%) NA 15.0 12.9
Table 2. Concrete Mixture Proportions
Material Clay Shale Limestone
Cement a. (lb/yd3) 808 832 825
Fly Ash (lb/yd3) 142 147 0
Coarse Aggregate (lb/yd3) 649 703 1392
Fine Aggregate (lb/yd3) 1242 1270 1403
Water (lb/yd3) 333 333 330
w/cm 0.35 0.34 0.40
HRWR ADVA 575
(fl oz/cwt) 9.5 - 11 8 - 10 5 - 6
HRWR ADVA 405 or 408
(fl oz/cwt) 26 25 15
Calculated unit wt. (lb/ft3) 117.6 121.7 146.3 a. Lightweight aggregate mixes used Type III cement; normal weight used Type I

4
Figure 1. Beam Reinforcement Design
For the study of prestress losses, each beam was loaded approximately five months after
casting with about 65 lb./ft. of load (Bymaster 2012). This load met the ACI 318 design
requirements of a Class T beam, which has tensile stress in the extreme fiber that is between 7.5
and 12 times the square root of the compressive strength. Class T beam loading is common in
bridge girders and did not affect the shear capacity of the beams. These loads were left in place
on each beam for a minimum of six months and were removed before shear testing. The average
compressive strengths of each beam were obtained from companion cylinders at the time of
shear testing and are given in Table 3.
5
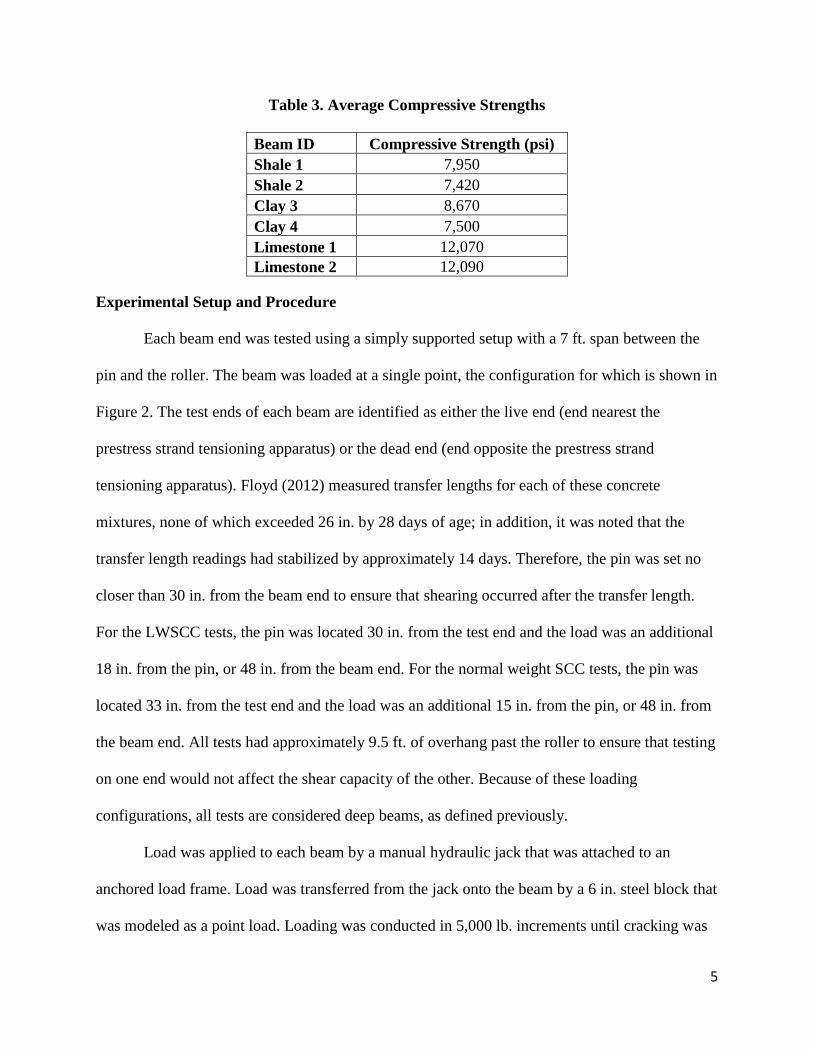
Table 3. Average Compressive Strengths
Beam ID Compressive Strength (psi)
Shale 1 7,950
Shale 2 7,420
Clay 3 8,670
Clay 4 7,500
Limestone 1 12,070
Limestone 2 12,090
Experimental Setup and Procedure
Each beam end was tested using a simply supported setup with a 7 ft. span between the
pin and the roller. The beam was loaded at a single point, the configuration for which is shown in
Figure 2. The test ends of each beam are identified as either the live end (end nearest the
prestress strand tensioning apparatus) or the dead end (end opposite the prestress strand
tensioning apparatus). Floyd (2012) measured transfer lengths for each of these concrete
mixtures, none of which exceeded 26 in. by 28 days of age; in addition, it was noted that the
transfer length readings had stabilized by approximately 14 days. Therefore, the pin was set no
closer than 30 in. from the beam end to ensure that shearing occurred after the transfer length.
For the LWSCC tests, the pin was located 30 in. from the test end and the load was an additional
18 in. from the pin, or 48 in. from the beam end. For the normal weight SCC tests, the pin was
located 33 in. from the test end and the load was an additional 15 in. from the pin, or 48 in. from
the beam end. All tests had approximately 9.5 ft. of overhang past the roller to ensure that testing
on one end would not affect the shear capacity of the other. Because of these loading
configurations, all tests are considered deep beams, as defined previously.
Load was applied to each beam by a manual hydraulic jack that was attached to an
anchored load frame. Load was transferred from the jack onto the beam by a 6 in. steel block that
was modeled as a point load. Loading was conducted in 5,000 lb. increments until cracking was

6
observed. Once cracking occurred, 2,500 lb. load increments were used until failure. At each
load increment, shear and tension cracks were marked (if necessary) and manual deflection
readings were taken.
During testing, two linear voltage differential transformers (LVDTs) were attached to the
prestressing strands on the beam end being tested. These LVDTs monitored strand movement
during loading. Additionally, a linear encoder was used to measure deflection at the point load
location throughout testing. Load, strand slip and deflection data were obtained via
instrumentation and data points were taken and recorded continuously by a computer program.
For the limestone beams, which failed at higher point loads, the recording capacity of the
programmed load variable was exceeded at approximately 86,000 lbs. and manual load readings
were taken from the hydraulic jack pressure gauge at loads exceeding this capacity. Figure 2
displays the testing setup with instrumentation in place.
Figure 2. Beam Test Setup

7
RESULTS
Two modes of shear failure were observed: web-shear failure and flexure-shear failure.
Web-shear cracking is characterized by diagonal cracking within the web of a beam and is the
result of a shear induced principal tension force. Web-shear cracks occurred suddenly between
the pin and the load for all tests, though not always before flexural cracks. All beams that failed
in web-shear did so along this initial observed web-shear crack. Flexure-shear cracking results
from a combination of shear and moment. The beams that failed in flexure-shear did so as a
result of flexure cracks that began in the longer shear span for the loading condition (between the
load and the roller) and then turned to diagonal shear cracks that angled toward the load.
Flexure-shear failures were also characterized by some amount of moment induced crushing in
the top fiber, but web-shear failures did not exhibit this crushing. Figure 3 shows the Clay 4 dead
end test, which displays a typical web-shear failure observed in this study. Figure 4 shows the
Limestone 1 live end test, which is a typical flexure-shear failure that exhibits crushing in the top
fiber.
Figure 3. Clay 4 Dead End Test – Typical Web-Shear Failure

8
Figure 4. Limestone 1 Live End Test – Typical Flexure-Shear Failure
No significant strand slip was measured during any tests and only one notable slip
occurred, which was measured at 0.05 in. during the Limestone 1 dead end test. This indicates
that the loading had no overall effect on the strand bond within the transfer zone. Load-versus-
deflection graphs were created for all the LWSCC beam tests. Since the capacities of the normal
weight SCC beams exceeded the capacity of the program, there are no load versus deflection
graphs for these beams. These graphs confirmed shear failure because minimal deflection was
experienced after the peak load and before failure. Flexure-shear failure generally exhibits
slightly more deflection at a constant load before failure than web-shear failure does, which was
reflected in these graphs. The load versus deflection graph for the Shale 1 live end test is a
representative sample for all LWSCC beam tests and is given in Figure 5.

9
Figure 5. Shale 1 Live End Test – Load-vs.-Deflection
Table 4 outlines the pertinent data for all tests, including the shear span-to-depth ratio
(a/d). Laskar et al. (2010) investigated the a/d ratio for over a hundred prestressed girders
available in literature and concluded that this ratio had a direct affect on the concrete
contribution to shear strength. For the normal weight SCC beams, the load was shifted closer to
the pin support to ensure failure for these relatively stronger beams. This yielded a slightly
smaller a/d ratio for these tests.
0
10000
20000
30000
40000
50000
60000
70000
80000
90000
0 0.5 1 1.5
Load
(lb
.)
Deflection (in.)

10
Table 4. Test Data
Beam Test
Identification Max Load (lb.) Max Deflection (in.) a/d Failure Type
Shale 1 – D 79,300 1.3 1.8 Flexure-Shear
Shale 1 – L 79,700 1.1 1.8 Web-Shear
Shale 2 – D 75,700 0.9 1.8 Web-Shear
Shale 2 – L 78,800 1.2 1.8 Web-Shear
Clay 3 – D 75,300 0.8 1.8 Flexure-Shear
Clay 3 – L 77,200 1.9 1.8 Flexure-Shear
Clay 4 – D 72,600 0.9 1.8 Web-Shear
Clay 4 – L 77,200 1.0 1.8 Web-Shear
Limestone 1 – D 100,000 0.9 1.5 Flexure-Shear
Limestone 1 – L 113,000 1.0 1.5 Flexure-Shear
Limestone 2 – D 111,000 1.0 1.5 Web-Shear
Limestone 2 – L 110,000 1.1 1.5 Web-Shear
Note: D = dead end of specimen; L = live end of specimen
Shear Capacity Comparison
The maximum point load for each beam was used to determine the maximum shear stress
that occurred. These values were compared with the predicted shear capacity computed from
ACI 318 provisions, which is based on the shear resistance contributions of both the concrete and
the steel shear reinforcement as given by:
Vn =Vc +Vs Equation 1
where:
Vn = nominal shear strength (lb.)
Vc = nominal shear strength provided by concrete (lb.)
Vs = nominal shear strength provided by shear reinforcement (lb.)
ACI 318 provides both a general method and a detailed method for computing the concrete
contribution to shear capacity in prestressed members. The general method computes the
nominal shear strength of concrete (Vc), while the detailed method states that the lesser of the
nominal concrete flexure-shear strength (Vci) and the nominal concrete web-shear strength (Vcw)
should be taken. The design method employed to create these beams for the study of prestress

11
losses did not require either a factored moment (Mu or Mmax) or a factored shear force (Vu or Vi),
which are two necessary components for computing the general concrete shear strength and the
flexure-shear strength discussed above. Thus, this study was limited to use of the web-shear
strength (Vcw) to calculate the concrete contribution to shear strength as given by:
ppwpcccw VdbffV 3.05.3 ' Equation 2
where:
Vcw = nominal shear strength provided by concrete when diagonal cracking results from
high principal tensile stress in web (lb.)
λ = modification factor reflecting the reduced mechanical properties of lightweight
concrete
√𝑓𝑐′ = square root of specified compressive strength of concrete
fpc = compressive stress in concrete (after allowance for all prestress losses) at centroid of
cross section resisting externally applied loads (psi)
bw = web width (in.)
dp = distance from extreme compression fiber to centroid of prestressing steel (in.)
Vp = vertical component of effective prestress force at section (lb.) (ACI Committee 318
2011)
The steel contribution to overall shear capacity is given by:
Vs = Av fytd s Equation 3
where:
Vs = nominal shear strength provided by shear reinforcement (lb.)
Av = area of shear reinforcement within spacing s (in.2)
fyt = specified yield strength fy of transverse reinforcement (psi)
d = distance from extreme compression fiber to centroid of longitudinal tension
reinforcement (in.)
s = center-to-center spacing of transverse reinforcement (in.) (ACI Committee 318 2011)
The calculated web-shear strengths were compared with the maximum and minimum
concrete shear strengths outlined in the ACI 318 general method, which are given by dbf wc
'5
and dbf wc
'2 , respectively. After this analysis, it was determined that the calculated values for
Vcw exceeded the maximum concrete contribution in all cases. While this maximum value gives
the true prediction of concrete shear strength according to ACI 318 provisions, the overall shear

12
capacity was also calculated using Vcw to assess the accuracy of this equation. A comparison of
the measured and calculated shear capacities is given in Table 5.
Table 5. Shear Capacity Comparison
Beam Test
Identification
ACI Shear
Capacity (From
Vcw) (lb.)
ACI Shear
Capacity (From
Max Vc) (lb.)
Measured
Shear
Strength (lb.)
Vtest/Vcode
(From
Vcw)
Vtest/Vcode
(From
Max Vc)
Shale 1 – D 55,100 44,600
62,100 1.13 1.39
Shale 1 – L 62,500 1.13 1.40
Shale 2 – D 54,600 43,800
59,300 1.09 1.35
Shale 2 – L 61,700 1.13 1.41
Clay 3 – D 55,900 45,700
59,000 1.05 1.29
Clay 3 – L 60,500 1.08 1.32
Clay 4 – D 54,600 43,900
56,900 1.04 1.30
Clay 4 – L 60,500 1.11 1.38
Limestone 1 – D 62,900 55,700
82,000 1.30 1.47
Limestone 1 – L 92,700 1.47 1.66
Limestone 2 – D 62,900 55,700
91,000 1.45 1.63
Limestone 2 – L 90,200 1.43 1.62
Note: D = dead end of specimen; L = live end of specimen
CONCLUSIONS
The goal of this study was to assess the shear capacity of prestressed LWSCC beams and
compare the measured values with current ACI 318 provisions. The following conclusions and
recommendations have been drawn from this research:
Conservative estimates of shear capacity were provided for the LWSCC beams with a
29% - 41% margin of safety. Comparatively, conservative estimates were found for the
control SCC beams with a 47% - 66% margin of safety.
For web-shear failures only, use of Vcw provided conservative estimates of shear capacity
with a 4% - 13% margin of safety for the LWSCC beams and a 43% - 45% margin of
safety for the control SCC beams. Inclusion of flexure-shear failures yielded a 4% - 13%
margin of safety for the LWSCC beams and a 40% - 47% margin of safety for the control
SCC beams.

13
ACI 318 predictions of shear capacity were adequate for the prestressed LWSCC beams
studied. Estimates for LWSCC beams were less conservative than those given for control
SCC beams, though the change in shear span-to-depth ratio may have influenced this
result.
Further research is needed to assess the accuracy of the ACI 318 general shear and
flexure-shear equations to predict the nominal concrete shear strength in prestressed
LWSCC beams. Additionally, investigation of aggregate interlock and its affect on the
shear strength differences between LWSCC and normal weight SCC in prestressed beams
is needed.

14
REFERENCES
ACI Committee 211. (1998). “Standard practice for selecting proportions for structural
lightweight concrete (ACI 211.2-98),” American Concrete Institute.
ACI Committee 318. (2011). Building code requirements for structural concrete (ACI 318-11)
and commentary (ACI 318R-11), American Concrete Institute, Farmington Hills, MI.
American Association of State and Highway Transportation Officials (AASHTO). (2002).
Standard specifications for highway bridges, 17th Ed., Washington, D.C.
ASTM C127. (2007). “Standard test method for density, relative density (specific gravity), and
absorption of coarse aggregate,” ASTM International, West Conshohocken, PA.
Bymaster, J. C. (2012). “Prestress losses in lightweight self-consolidating concrete,” MS Thesis,
University of Arkansas, Fayetteville.
Burgueño, R., and Bendert, D. A. (2007). “Structural behavior and field-monitoring of SCC
prestressed box beams for demonstration bridge,” Self-consolidating concrete for precast
prestressed applications, SP-247, American Concrete Institute, Fajardo, P.R., 67-76.
Dymond, B. Z., Roberts-Wollmann, C. L., and Cousins, T. E. (2010). “Shear strength of
lightweight self-consolidating concrete bridge girder,” J. Bridge Eng. ASCE, 15(5), 615-
618.
Floyd, R. W. (2012). Investigating the bond of prestressing strands in lightweight self-
consolidating concrete, Doctoral Dissertation, University of Arkansas, Fayetteville.
Hamilton, H. R., and Labonte, T. (2005). “Self-consolidating concrete (SCC) structural
investigation,” Rep. No. 455404712, Dept. of Civil and Coastal Engineering, Univ. of
Florida, Gainesville.
Hassan, A. A. A., Hossain, K. M. A., and Lachemi, M. (2010). “Strength, cracking and
deflection performance of large-scale self-consolidating concrete beams subjected to
shear failure,” Engineering Structures, 32(5), 1262-1271.
Hegger, J., Will, N., and Bülte, S. (2007). “Bond strength and shear capacity of prestressed
beams made of SCC.” Self-consolidating concrete for precast prestressed applications,
SP-247, American Concrete Institute, Fajardo, P.R., 123-138.
Khayat, K. H., and Mitchell, D. (2009). “Self-consolidating concrete for precast, prestressed
concrete bridge elements,” NCHRP Rep. 628, Transportation Research Board,
Washington, D.C.

15
Kim, Y. H., Hueste, M. B. D., Trejo, D., and Cline, D. B. H. (2010). “Shear characteristics and
design for high-strength self-consolidating concrete,” J. of Struct. Eng. ASCE, 136(8),
989-1000.
Laskar, A., Hsu, T. T. C., and Mo, Y. L. (2010). “Shear strengths of prestressed concrete beams
part 1: Experiments and shear design equations,” ACI Struct. J., 107(3), 330-339.
Naito, C. J., Parent, G., and Brunn, G. (2006). “Performance of bulb-tee girders made with self-
consolidating concrete,” PCI J., 51(6), 72-85.
Taylor, H. P. J. (1970). Investigation of the forces carried across cracks in reinforced concrete
beams in shear by interlock of aggregate, Cement and Concrete Association, London, 22.
Yang., K. -H., and Ashour, A. F. (2011). “Aggregate interlock in lightweight concrete
continuous deep beams,” Eng. Strucures, 33(1), 136-145.