Embed Size (px)
Citation preview
~--------------
,::-.,..~
' : ( "'-:J J
SHEAR STRENGTH OF
GRANULAR MATERIALS
Fo Ho Tinoco, Graduate Assistant
and
Ro L Handy, Professor Department of Ci vi I Engineering
November 1967
Iowa State University
Ames, Iowa
j
i
ENGINEERING RESEARCH INSTITUTE
Iowa State University .
SHEAR STRENGTH OF
GRANULAR MATERIALS
F. H. Tinoco, Graduate Assistant
and
R. L. Handy, Professor Department of Civil Engineering
Contribution No. 67-9 of the
Soi I Research Laboratory Engineering Research Institute
Iowa State University
The opinions, findings and conclusions expressed in this publication are those of the authors and not necessarily those of the Iowa . State Highway Commission nor the B1Jreau of Public Roads, U.S. Depart~ ment of Commerce. · ·
ii
CONTENTS
INTRODUCTION
REVIEW OF LITERATURE
PART I. SHEAR STRENGTH OF GRANULAR MATERIALS
THEORETICAL INVESTIGATION
Analysis of Particle Movements during Shear
Requirements for Sliding at Group Contacts
Mechanical Work
Application to Plane Strain, Triaxial Compression and Extension Test
Determination of the Angle of Solid Friction
Interpretation of the Parameter 0
TESTING OF THE THEORY
SUMMARY
1 PART II. SHEAR STRENGTH OF CRUSHED LIMESTONES
MATERIALS
METHODS OF INVES~IGATION
Triaxial Specimen Preparation
Triaxial Apparatus
Isotropically Consolidated - Undrained Triaxial Test
Test Errors
DISCUSSION OF TEST RESULTS
CONCLUS IONS
ACKNOWLEDGEMENTS
REFERENCES
Page
1
2.
10
10
10
16
19.
24
27
29
36
68
69
69
71
71
72
73
75
77
96
97
98
1
INTRODUCTION
Variable and somewhat unpredictable service records of Iowa crushed
limestones used as base courses for flexible pavements indicated the
need for a study of factors affecting the shear strength and defonna-.. _,..._;:....;::.:.;;:- ~-···:;-_..,~ .. ·-- -~----3"._;.:.:'!!" ......... ,,--- __ ,______ --~--;·~---=------
tional behavior of these materials.
Crushed liinestone·s may be considered within the general class of
granular ~aterials. Granu.lar materials are. particle assembiies which ~-~------~ .... -- ---~ ~--~- ----. '-. ---- ---·, .-- - - -- ·- . ~----r~·---, __ ,..._,....._.__...._;.• ,.,,_. ---- -- - ·····-- - ... - ·- -· ---.
are devoid of interparticle cohesion, and where the individual particles ,_______ --------.!,....----- -----. - " - . . "~-----.. ---·--· .- :::,.·~ =--- -- ··-~--.... -----·-· -···-- -~- - ----------:~-
are independent of each other except for friction_al ·_interaction and ..... ·--- ~- ... -----._.,--.o-------· ---..... _ ... -•. •··--------... _· ---- --.--.------- --- -.- ·---·--· .... --~
geometric constra~nts_ i1:cidental -~o the packing of th_e_ .ct~~e-~blies.
The_purpose of this investigationwas to evaluate the effect of
the frictional interaction between the particles and the effect of the ------------------:-
geometric constraints among. these particles on the shear strength of c::_ _____ - --.,,------- •
/ ... ----- - - -.......... .
granular materials o The lt~:_~ was to d~_R-~_Sh~-~E.Y to allow
a separate consideration of the two mechanisms. TheC;e~?~~~-- ~-~was
I s S+<z.? 0\ (
.. :::::,\<.JC)Lj
~-cJ. to test the theory against available published data on granular materials;
----~---·----~------___.. .
~-:;-~ and the~~jwas to study the shear strength and deformational
behavior of the Iowa crushed limestones in the light of the proposed
theory.
2
REVIEW OF LITERATURE
Man has recognized the existence of friction for a long time. The
first known written remarks on the nature of. the laws that govern the
phenomenon were by Leonardo da Vinci (1452-1519). Leonardo da Vinci
proposed that friction was directly ·proportional to the normal force
between sliding surfaces and that it was independent of the contact
area between the surfaces, as reported by MacCurdy (1938).
These laws were rediscovered by .Amontons (1699). 1
However, .Amontons
Laws did not gain acceptance until they were confirmed and again pro-
posed by Coulomb (1781). Coulomb was the first to distinguish between
static and kinetic friction, and he established the independence of the
coefficient of friction from the velocity of sliding.
Terzaghi (1925) proposed that the frictional force developed
between two unlubricated surfaces was the result of molecular bonds
formed at the contacts between the surfaces. Terzaghi made two assump-
tions; namely, that the real contact area is directly proportional to
the normal load and that the shear strength at the contacts is independent
of the normal load. Thus, Terzaghi's theory of friction is expressed
by the following two equations:
F A' S'
µ S'/p
where F is the frictional resistance, A' is the real contact area for
inelastic behavior, S' is the shear strength per unit area of the molecular
bond, µ is the coefficient of friction, and p is the pressure per unit
of real contact area.
i
I
3
The .laws of friction have been further clarified in recent years
by Bowden and Tabor (1950). They found that the real contact area
between two bodies pressed together was much smaller than the apparent
area of contact and that, in fact, adhesion takes place between adjacent ( -.o ... :t,os) · .
asperities. Under any level of the applied .____ __ surfaces at contacts between
loads' these asperities yield plastically' so that the normal stress
at a real contact is a constant equal to the yield stress of the
material. Thus, the real contact area becomes directly proportional
to the applied load, confirming Terzaghi 1 s first assumption. The
tangential force required to shear the junctions at the real contact
is then proportional to the area of real contact. Thus,
A' = N/P m
F = A' S 1
F N • s I /Pm
µ = s I /P m
N • µ, and
where P is the yield pressure at the real contact. m
Therefore, according to Bowden and Tabor the coefficient of
friction depends on the nature or composition of the sliding surfaces
in contact.
The oldest and still most widely used expression for soil shear
strength is the Coulomb failure criterion,
s = c + af tan ¢
and ¢ the angle of internal friction.
4
The combination of Coulomb failure criterion with Mohr's theory
of mechanical strength, ·later modified by Terzaghi (1923) in terms of
the effective principal stresses, is given by:
a' 1
0 I 3
2 . tan (45 + ¢/2) + 2c tan(45 + ¢/2)
where 01
1 and 63
1 are the major and minor effective principal stresses
respectively. In soil mechanics 11effective 11 stress designates total ~-~. ---. -~~------··----··---... . ..-----__,,,,._~~
stress less pore pressure; for example, a' = a - u . .___ _________ ,...~--- _....,..__ -----·- -- --...,___,..-..... - -
The value of ¢ or tan ¢ as determined by the Mohr-Coulomb theory . -------~--
stress history, angularity of grains, initial void ratio, and the level ....__...'--=-- --- ---=--- '---~- ...... --. -- - -- --~-- - -- ,,.. ___ , ----- -- -- -.- .. -,._. -~- ----.
of the ap2lied confining pressures. Therefore, even if tan ¢is a --------- - ------- ............... ------ _ _,......,. ___ - _____ ,......._ ______ _
function of the coefficient of solid friction between the particles,
the determination of the latter is not possible from the former, and
tan ¢ is merely a parameter dependent on the conditions of the assembly ----------~-- - ---------.--.... -- --- ----- -- . .......---·- ..... ~ ..... -~- - - ~-·- ~-------'<.
during the experiment.
Mohr-Coulomb theory is strictly applicable to a body which shears - -------- _______ __.... --~----------~- -----"""-"'-----~~--~--=-"-"'~· - - - -· ~- ---
witho.ut changing its volume. Reynolds (1885) showed that dense sands .,.......~ _____ ,,...., ___ ,....,,_ .
expand at failure, a phenomenon which he named d:!,Ja_tal!cy, whereas ~~-~
loose sands contract during shear to failure. Reynolds' experiments
demonstrated that particle movements during deformation are not neces-
sarily in the direction of the applied shear stresses, and indicated
the effect of geometric constraints on the shear strength of granular
materials.
Taylor (1948) was the first to attempt the separation of the
strength component due to friction from that due to expansion, using
'-.lcl0"·'\
-:..::..l~v..,'.\'.'
. 5
data from shear box tests on sands. Skempton and Bishop (1950) also
attempted thi~ separation. The procedure in each case was to calculate
the work done in expanding the sample by an amount ov per unit area ~--- -------------.---------
against a vertical pressure a , and equate this work to an equivalent n --
s~~~~~~~n~t TD acting horizontally through a distance 66, equal ·
to the relative displacement of the two halves of the box. The dif-
· ference between the maximum applied shear T and TD was expressed in
· terms of a residual angle
tan ¢. r
¢. : r
ov tan ¢_ - i;, A • max uo
An expression based on the same principle was later presented
by Bishop (1954), for use with the triaxial compression test, in the _______ ..... ·~----·-~- -·-- ---""---·· "---·--··
form:
tan2 (45 + 1:. r+. ) 2 'fir
o' (-1-)
03
1 max 0 I
3
where 6v is the rate of unit volume change and oe1
is the rate of
major principal. strain change.
Newland and Allely (1957) considered the resultant direction of
movement occurring during dilatation and determined a value of ¢which
they denoted ¢f' given by:
(Y I .
l+(l) +ov CT' max oe
3 1
in
¢ = <P + 8 max f
where tan e. OV 66 in the shear test and tan e
w /o;'"Jmax
the triaxial test.
The derivation of ¢max = ¢f + 8 was based on the assumption that
I
6
the value of 8 is a constant throughout the surface of sliding when
the maximum shear stress has been reached, where 8 represents the
angle of inclination of the sliding surface with the direction of the
shear force in the case of the direct shear test.
The values of ¢f and ¢r differed considerably, even though both
values were·derived to measure the same physical quantity (Newland
and Allely, 1957).
Rowe (1962) discussed the behavior of ideal packings of spherical
particles subjected to a major effective principal stress a1 ' and
equal minor effective principal stresses a2 ' = a3
1• He derived a
stress-dilatancy relation for these packings given by:
a '/a'= tan a. tan(¢. + 13) 1 3 µ
where a. is the packing characteristic of the ideal assembly and ¢. is µ
the true angle of friction • ..________ -------------Rowe also derived an energy ratio given by
E tan(¢. + 13) µ
tan 13
where for comparison with previously presented expressions dv/vel
ov'"/ oe • 1
Rowe observed that a., the packing characteristic of the ideal as-
sembly, had disappeared in his energy ration equation. Thus, he proceeded
;'~ The expression dv/ve is not identical to ov/ eel Lee (1964) changed t~is expression to ov/ oe1 •
Rowe, Barden, and
I
7
to derive the critical angle of sliding between particles in a random
assembly of particles by postulating that the ratio of energy absorbed -- ---------
in internal friction to energy supplied, namely, E, was a minimum. ------ ··-----..--·--- ..... ----· ,__ -- - ·-·-- - - ----· -- --·
The value of the critical angle of sliding obtained by this procedure
is equal to 45 - 1/2 ¢µ , which substituted in the equation of the .
energy ratio, E, led to
where
2 1 tan (45 + -
2 n. ) "'µ .
Rowe's experiments conducted on randomly packed masses ·of steel,
glass, or quartz particles in which the physical properties were
measured independently, showed that the minimum energy ratio criterion
is closely obeyed by highly dilatant, dense; over-consolidated and re-
loaded assemblies throughout deformation to failure. However, the value
of ¢ to satisfy the theory increases to ¢f when loose packings are
considered because of additional energy losses due to rearranging of ...::.:___---~·-:---=----· ·-~-- ---~------ -----~-=-=-------- ~-- ... _____ , __
l~._ll-.'.:.:ti_:_~~. Rowe found that ¢u :S ¢f :S ¢cv where ¢cv is the
calculated value of ¢when the sample reached the stage of zero rate
of volume change. The angle ¢ was found to differ from ¢ by 5 to CV . u·
7 degrees in the case of sands.
Rowe (1963) applied the stress-dilatancy theory to the stabill.ty
of earth masses behind retaining walls, in slopes and in foundations.
Gibson and Morgenstern (1963), Trollope and Parkin (1963), Roscoe
and Schofield (1964), and Scott (1964) discussed the stress-dilatancy
theory postulated by Rowe (1962) and their criticism was mainly directed
8
toward: (1) the assumed mechanism of deformation; (2) the assumed
absence of rolling; (3) the assumption that the energy ratio E is a
minimum in a random assembly of particles; and (4) the meaning of
the "a. planes" in a random assembly of particles.
Rowe, Barden, and Lee (1964) applied the stress-dilatancy relation
to the case of the triaxial extension test and the direct" shear test.
the stress-dilatancy relation for use with the triaxial extension
test was found to be:
a1
' (1 + dv/vE:1
)
0 I
3
2 !Pi tan (45 + 2
)
and for the direct shear test
¢f + 8 = ¢ and
tan 8 ov oD.
The latter expression is identical to that derived by Newland and
Allely (1957) for use with the direct shear test.
·Rowe's theory has been substantiated by Horne (1965) who d.id not
restrict his analysis to an idealized packing. Horne analyzed a randomly
packed particulate assembly, with assumptions summarized as follows:
(1) The particles are rotund and rigid with a constant coefficient of
solid friction. (2) Deformation occurs as a relative motion between
groups of particles but rolling motion is not admitted between the
groups of particles. Horne obtained the expression for the energy ratio
Eby writing a virtual work equation for the input 01
1 €1
. Then, he
minimized this ratio to obtain the value of S = 45 - 1/2 ¢. which then c u
led to
9
E
For the triaxial compression test with 021 = 03
1 and E:2
reduces to Rowe's equation. Horne thus established the limitations
of the stress-dilatancy theory and concluded that the equation of the
energy ratio E that provided a relationship between the work quantities
. 01
1 E:, o2
' E:2
, and o3
1 E:3
does not provide a relationship between stress.
or strain rates separately. He also concluded that the relation may
not apply to a highly compact assembly with a high degree of inter-
locking.
10
PART I. SHEAR STRENGTH OF GRANULAR MATERIALS
THEORETICAL INVESTIGATION
The coefficient of solid friction between two particles is defined
as µ = tan ¢ = F/N where F denotes the frictional force, N is the force S • ----------- --a , ' ..._.,_,._..,.
The coefficient of solid friction is considered independent of the normal
velocity.-~\ -' '\
/ °'\ /;/ '\
l /~~S OF PARTiCLE MOVEMENTS DUR,ING SHEAR
force applied to the surfaces in contact '.I \ /
\ ! /_ - -- "~-, ____ -;_ -- --"
and independent of the sliding
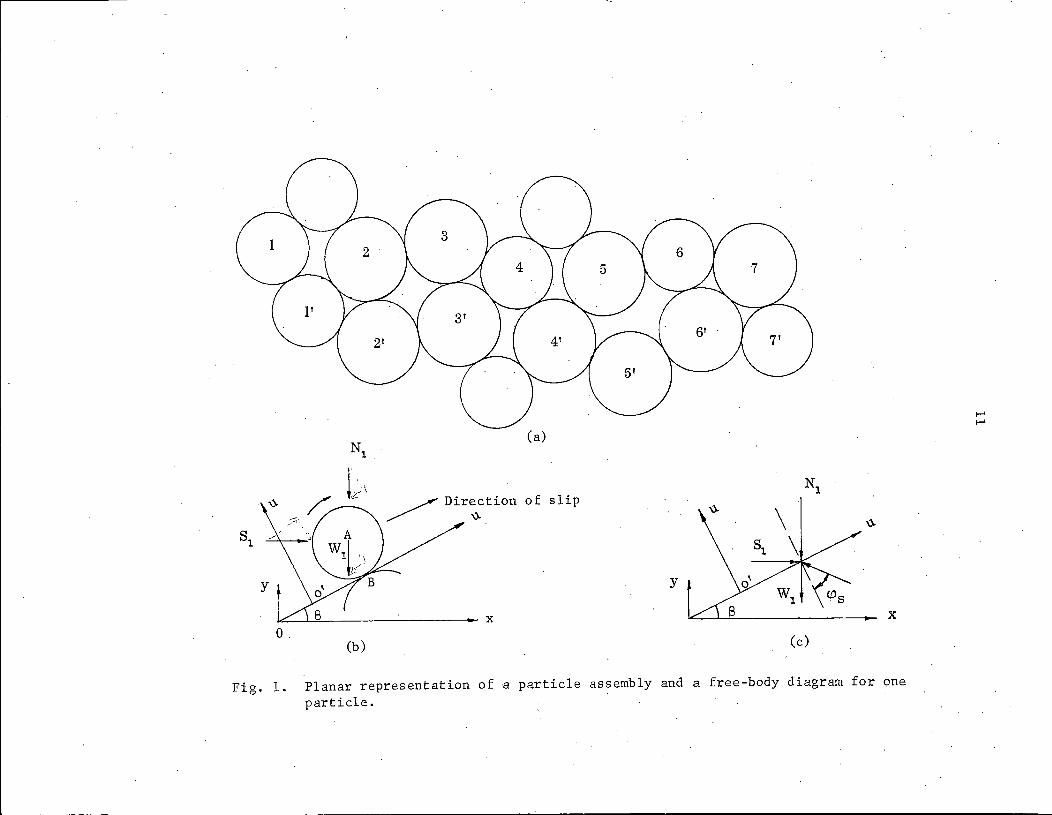
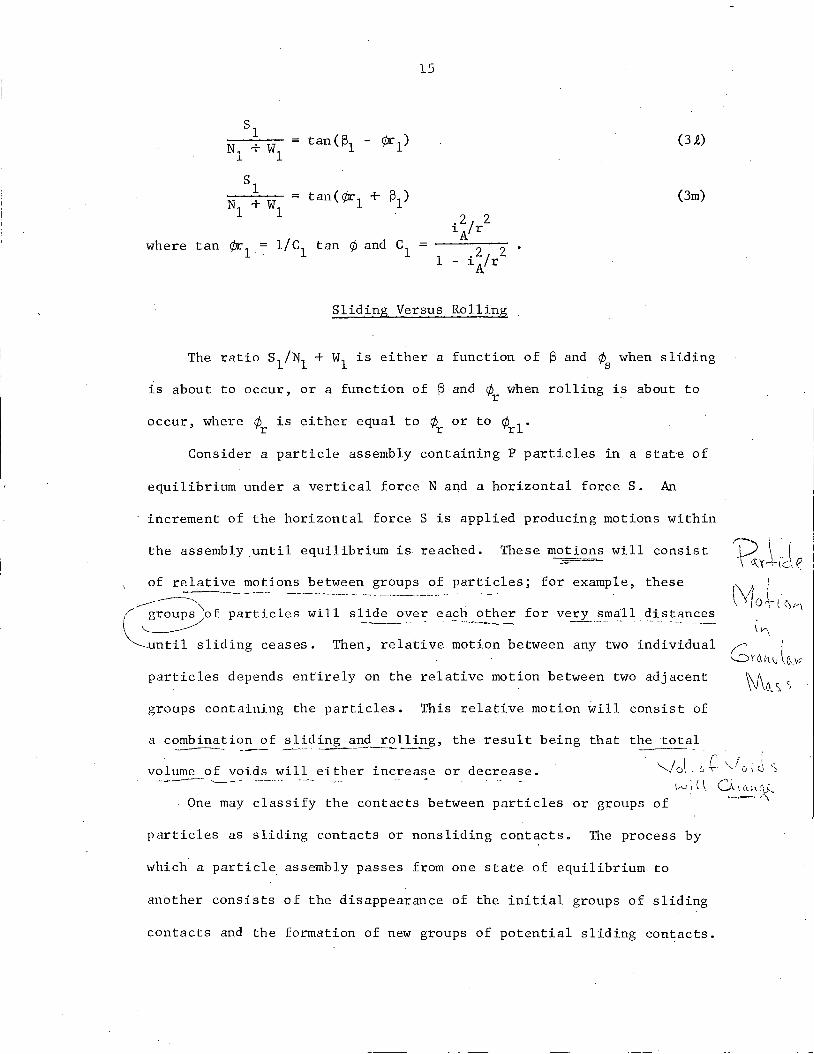
' \ "'-A section through a_particle assembly is shown in Fig. la. The
particles are drawn spherical for s~£i:_~y, but the a~~~
follows is independent of the shape of the particles provided that their ,____ ____ ~ ------- -~---- ---- -...:..__ --~-·-----·-- ........... -...---~
surfnccs arc predominantly convex.
The pnrticle assembly is subjected to a force N, applied in the
vertical direction and a force S, applied in the horizontal direction.
Force S causes particles 1, 2, 3, etc., to move to the left relative to
particles l', 2', 3 1, etc. If grain failure is excluded, then for
particle 1 to move relative to particle 1 1, it must initially slide
along the direction of the tangent at the point of contact of the two
particles; for example, in a direction making an angle sl to the direction
of the horizontal force. Similar arguments may be made for the other
particles, 2, 3, etc.
Nl (a)
! ' Nl ',;
"" ~--::: ~ Dir~tion of slip
;;:;,·.
s1
y y
x x 0.
(b) (c)
Fig. 1. Planar representation of a particle assembly and a free-body diagram for one particle.
t-"' t-"'
i2
Sliding
Consider the single surface of sliding corresponding to particles
1 and l', Fig. lb; resolving forces parallel and perpendicular to this
surface:
IF o'v
~ o'u
Eliminating
and
tan ¢ s
:
Rl
(W 1 + N
1)cos !31 + sl sin 131
s1
cos 13 -1 (Wl + N1
) sin 131
from Eqs. (la) and (lb):
sin
s1
- (W1 + N1) tan 131 s
1 tan 13
1 + (N
1 + W1)
= Rl cos
= Rl sin
where ¢ is the angle of solid friction and tan ¢ = µ s s
of solid friction.
Equation (2) may be transformed to:
¢s (la)
¢s . (lb)
(le)
(2)
coefficient
(2a)
Similar solutions are found for particles 2, 3, etc.
If sliding occurs in the opposite direction, Eq. (2a) becomes:
(2b)
13
Rolling
Consider particle 1 rolling over particle l' along the plane making
an angle l\ with the horizontal plane.
Figures lb and le show the directions of translation and rotation
of particle 1 and the free-body diagram.
Then,
IF I . 0 u
wl g iiA = s1 cos 1\ - (N1 + w1) sin l\ - R1 sin ¢
w _l. v = - S sin g A 1
w LMA ·: -1. i
2 S = R r sin ¢ g A. 1.
(3a)
(3c)
where r is the radius of particle 1, i~ is the radius of gyration of
the particle 1 with respect to its geometric axis, and ¢is a cor-
responding friction angle given by ¢ < ¢ • That is, the acting s
frictional force is less than: the frictional force required for sliding
to take place.
The condition that there is no sliding requires that the relative
velocity of the point of contact at any instant is zero. That is,
point B is the instantaneous center of rotation. From this it follows
that the angular velocity of rotation of the particle is 9 = uA/r, from
which, by differentiation, 8 = iiir· Substituting this in Eq. (3c):
(3a):
2 UA i ~ Ar R1 r sin ¢·
Eliminating the friction force R1 sin ¢ between Eqs. (3d) and
(3d)
Then,
and let
and
ii = A
.2/ 2 iA r
14
c
From Eq. (3b)' the value of R1
sl sin Sl + (Nl + Wl) cos
cos ¢s
is equal to
s1
Substituting the value of R1 in Eq. (3f)
which on rearrangement gives:
sl tan ¢+ c tan s1 l/C tan ¢+ tan s1
Nl + Wl c - tan s1 tan ¢ 1 - l/C tan s1 tan.
and let l/C tan ¢ = tan ¢r then Eq. (3i) is transformed
¢
to give:
If rolling occurs in the opposite direction, then Eq. (3j) is
given by:
¢ ) . r
(3e)
(3f)
(3g)
(3i)
(3j)
(3k)
If rotation occurs in a counter-clockwise direction, Eqs. (3j)
and (3k) are given, respectively, by:
15
sl tan ( f\ - ¢r1) =
Nl + Wl (3~)
sl tan(¢r1 + Sl) =
Nl + Wl .2/ 2
where tan ¢rl = l/Cl tan ¢ and cl 1A r
. 2/ 2 .
1 - 1A r
(3m)
Sliding Versus Rolling
The ratio S/1'11 + w1 is either a function of S and ¢s when sliding
is about to occur, or a function of S and ¢. when rolling is about to . r
occur, where ¢r is either equal to ¢r or to ¢rl.
Consider a particle assembly containing P particles in a state of
equilibrium under a vertical force N and a horizontal force S. An
increment of the horizontal force S is applied producing motions within
the assembly .until equilibrium is reached. These motions will consist ..::-..::·- -=---~
of relative motions between groups of particles; for example, these ~~ --- ··--·--·-~·-· -· --- -------------· ···•· . --- - - .
(.~of particles will slide~'1er e_a~~--~~':.: for ve_ry -~-n1a_ll distances
~until sliding ceases. Then, relative motion between any two individual
particles depends entirely on the relative motion between two adjacent
groups containing the particles. This relative motion will consist of
a combination of sliding and rolling, the result being that the total - --- ------ - -·-....-·--·-------~"- ---- -volume of voids will either increase or decrease. ----- ----
One may classify the contacts between particles or groups of
particles as sliding contacts or nonsliding contacts. The process by
which a particle assembly passes from one state of equilibrium to
another consists of the disappearance of the initial groups of sliding
contacts and the formation of new groups of potential sliding contacts.
\"I
Grett'\.\) lcl_,~-\v\o._) ')
----------------------------- -
16
That is, the proportion of sliding and nonsliding contacts is modified
when the particle assembly reaches a new state of equilibrium. The
modification of the ratio of total number of sliding contacts to
total number of nonsliding contacts results in either a decrease or
an increase in the total volume of voids of the particle assembly.
REQUIREMENTS FOR SLIDING AT GROUP CONTACTS
Sliding at group contacts will occur in some preferential direction
readily found from considerations of the stresses at a point referred
to a principal stress coordinate-axis system.
Let
a' > 0 I > ' 1 2 03 •
Then,
Q I + I a ' - 0 f 2 2
(o ' 2
03 2 "?: ( 2 3 ) (4a). T + - )
n n 2 2
a' + 031
2 o' - f
2 (o '
1 ;5- ( 1 0'3 2 (4b) T + - ) )
n n 2 2
2 o' + 02' 2 o' - 02' 2
(o ' 1 > ( 1 T + - ) ) (4c) n n 2 2
It is apparent from Eqs. (4a), (4b), and (4c) that the absoiute
maximum shearing stress is T = o' - o '/2 and it occurs at 6' = n 1 3 n
o1
' + 03
1 /2. Thus, the sliding contacts in the granular assembly will
be oriented in plane parallel to the o1
1, Oj 1 plane.
Selecting the equality sign in Eq. (4b),
2 °11
+ 0 31
2 T + (0 1
- ) n n 2
0 I
( 1 f
- 03 2 2 . ) (4d)
17
Equation (4d) is the equation of a circle which is referred to as
a Mohr circle. This circle can also be given in parametric form intro-
ducing the parameter 2S where S represents the angle which the given
plane makes with the major principal plane. Then
a'
'T n
0 I 1
(j I
( 1
+ 2
-2
a' 0 I - 0 I
3 + ( 1 3 ) cos 2 s 2
a' 3 ) sin 2s.
(4e)
(4f)
Sliding contacts in a preferential direction were defined as making
a critical angle S with a given plane. Next evaluate this critical c
angle.
Sliding will take. place when
'T n a ' tan ¢ n s
where all terms have been previously defined.
and
and
Substituting Eq. (4g) in Eq. (4f),
0 I
n
0 I
n
tan ¢ s
(J I
( 1
substituting Eq.
a' - 0 I
( 1 3 ) 2
on rearranging
01 I
1 + 1 CT' 3 2
a ' - a ' (-
1---
3-) sin 2S,
2
- 0 I
3 ) sin 2 S tan ti. .,,s 2
(4h) in Eq. (4e),
2s Q' I + (j I
sin 1 3 + tan ¢s 2
1 sin 2s 2
. ¢s
- cos f3 tan
0 I
( 1
(4g)
(4h)
- a' 3 ) cos 2s
2 (4i).
(4j)
18
The critical value of S will be a maximum for sliding to take
place, as previously shown. A maximum S value will make the ratio
o 1 /o' a minimum. Thus, max. imizing the denominator of the second 1 3
right-hand term of Eq. (4j):
and
or
cos 2S + sin 2S tan ¢s 0
tan (- ¢ ) s
2s 90 + ¢ s
cot 2S
Substituting Eq. (4k) in Eq. (4j)'
01 I 1 + sin rps rps 2
CT' 1 sin rps = tan (45 + 2).
3
(4k)
(4.e)
(4m)
Thus, for sliding to take place at group contacts, the value of
the stress ratio 01
1 I o3
' is given by Eq. (4m).
Equation (4m) is identical with the Mohr-Coulomb criteria. How-
ever, Mohr's theory requires that an envelope be drawn tangent to the
Mohr circles representing the maximum stress ratio, and Coulomb theory ---·---,~·-·· ... . .- ... .. -·
requires that such an envelope is required. The purpose of the previous
analysis is to determine whether a sphere in an inclined plane will
roll or slide. Equation (4m) gives the condition for sliding rather
than rolling to take place on a given plane at an angle S = 45 + li2 ¢ . s
19
MECHANICAL WORK
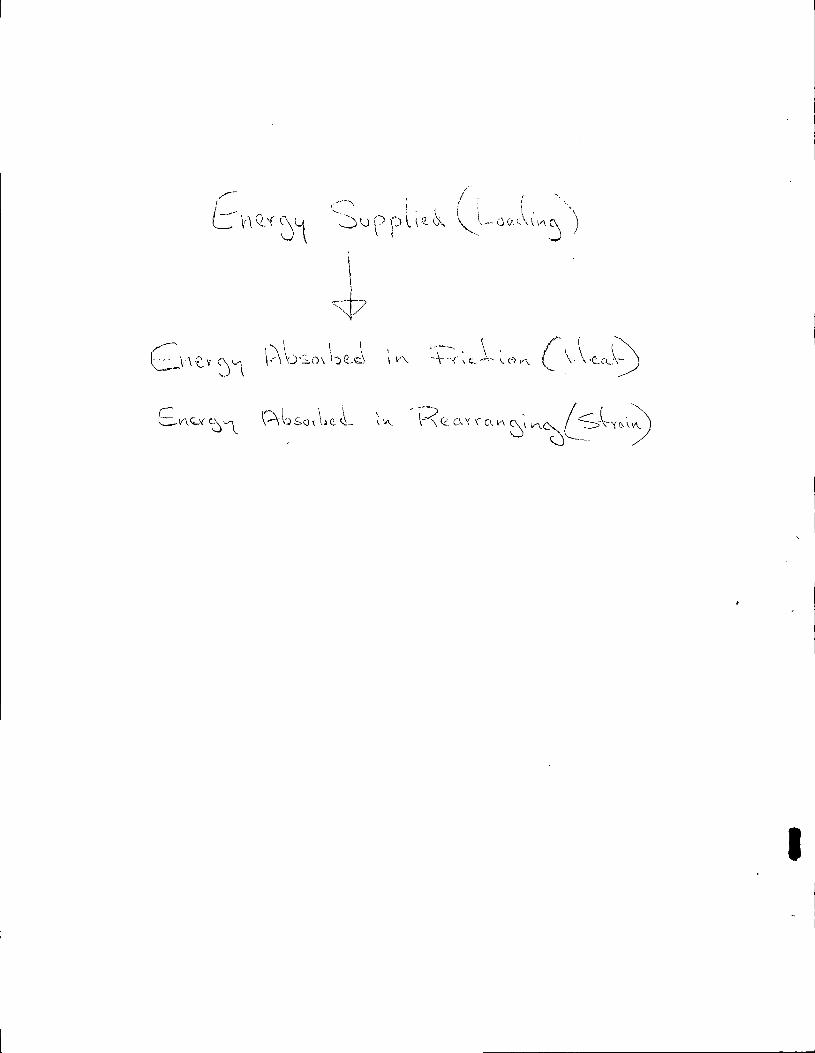
When a body is deformed by a system of external forces in equilibrium,
the mechanical work done by them is equal to the work consumed by the ------~---------·
internal stresses.
In the analysis of the mechanical work done by the external
forces and the work consumed by the internal stresses in a particle
assembly, two assumptions are made:
1. The directions of principal stresses and principal strains
coincide with each other at any and at every instant during deformation.
2. Energy absorbed in particle deformat:_~on is neglected. That
is, any elastic and/ or p~tic -~-~~<?~<:J:!7i<?n of the_J~~J.e is neglected _____ ...,..........__,.
as a result of which the particle is assumed to behave as a rigid body. -----~------~-- ---------------~---~----"···-- - ••"<Z".-. ·- __ ,__.-~ .. --, -----=-·-··----
The state of stress is given through the effective principal
stresses denoted by 01
1, 0
21
, 03
1, and their directions and the change
in the state of strain is defined by the principal strains oel, 0€2'
oe3
, whose directions coincide instantaneously with the principal
directions of stress. Compressive stresses and strains are considered
negative.
If the mechanical work is denoted by W per unit volume of material,
the increment 6W of the work done at a given instant by the principal
stresses is equal to:
(5)
In confined compression testing of granular materials, it is . .
common to subject the sample to an all-around pressure and apply loads
in the directions of the principal stresses. A conunon procedure is to
20
let the minor principal stress, 03
1, remain equal to the initial all-
around pressure.
Therefore, the principal stresses may be expressed by
0 I
1 a ' + (er ' 3 1 (Sa)
(Sb)
Thus, the granular material will reach equilibrium under an all-
around pressure, 03
1, and then, the sample is subjected to the stresses
to:
Then the increment of work oW applied to the system is given by: e
ow e
(Sd)
The increment of internal work absorbed by the system is equal
ow. l
(Se)
G~anular materials are known to change in volume during a shear -----·---.. -- -- -J----- -- --·---~-- ,_.....,....._ ""·J- ----- ,-- '...;:==- •. ~ ~·- .................. _.._._
process. Therefore, let v be the change in volume per unit volume,
considered negative when the sample volume is decreased' and ov be an
increment of the change in volume per unit volume. The increment of
change in volume per unit volume is equal to:
- ov (Sf)
- ov + oe1
+ oe2
and the increment of internal work is
given by:
21
6W. l
(Sg)
The applied stresses produce both a change in volume and sliding
due to friction within the granular assembly. Thus, the increment of
internal work absorbed by the granular assembly may be separated into
two components which will be referred to as frictional, oWif and
dilatancy, 6WiD •
Then,
oWi 6Wif + 6WiD (6)
and
Consider. a granular assembly composed of frictionless particles.
If a system of stresses is applied to this assembly, the increment of
internal work absorbed by the assembly is equal to:
where oelD' oeZD' and oe3D are the increments of principal strains
absorbed by the assembly as a result of which a volume change is
registered within the assembly.
Similarly,
oWi
(6b)
(6c)
Substitutions. of Eq. (6b) and (6a) in the left-hand side of Eq.
(6L1) give
and
+ (0 I 2
22
The following relations are obtained from Eq. (6d):
oel oelf + oelD
0€2 = oe2f + oe2D '
·av = ov f + OVD '
ovD oelD + oe2D + oe3D
ovf oelf + 0€2£ - QE:3f '
oe = 3 Q€3f - oE:3D .
(6d)
Sliding within a granular assembly may be considered analogous to
the sliding between a block and a plane surface which are perfectly
smooth, as a result of which the term ovf is equal to zero. Then,
(6f)
Or
(6g)
and
and
Since 6W 6W.
Let
e . i
{0: I 1
I olf
I
02£
03~
+ 0 I OV 3
(0: I 1
0: I
3 +
CT I
3 +
0: I 3
(0 I 1
( 0: I 2
03~
23
a ') 3
(0 I
1
a ') ( 0: I - -3 2
(0 I 1
-· 0 ') 3 D
- 03 ')n
(6h)
(7a)
' (7b)
(7 c)
(7d)
Substituting Eqs. (7a), (7b), (7c) in the right-hand side of Eq. (7d),
(0 I 1
and using Eq. (6h),
(7 e)
24
Therefore,
(0 I 03 I )D (0 I o ') 6elD
1 1 3 eel (7g)
(7h) (0 I 031
)D (0 I O' I) oe2D
-2 2 3 6e2
03n 0 I ov
I 3 . 0 E:l + 6e2 '~
(7i)
Substituting the values obtained in Eqs. (7g)' (7h)' and (7i) in
the corresponding Eqs. (7 a), (7b)' and (7 c),
o' + (0 I a ') ( O' I 0 I)
oelD olf - -
6 E:l 3 . 1 3 1 3
CJ I (0 I 0 I)
6 E:lD (7 j) -
1 1 3 6 E: 1
02£ 0 ' + (a ' a ') (0 I a ') oe2D
- -3 2 3 2 3 6e2
o' (o ' a ') oe2D
(7k) -2 . 2 3 6e2
a~H = CJ I +a' ov CJ I (1 + ov 6 ) . (7 J,)
3 3 eel + oe2 3 eel + E:2
Equations (7j), (7k), and (7J,) provide the values of the principal
stresses corresponding to friction.
APPLICATION TO PLANE STRAIN, TRIAX.IAL COMPRESSION
AND TRIAXIAL EXTENSION TESTS
Consider a granular assembly subjected to plane strain conditions.
25
The evaluation of olf' o2:f, and o3 :f is performed in a similar manner
as described in the previous section.
The following conditions apply during a plane strain test:
a'>o:'>o' 1 2 3
and e2
= 0.
Therefore, oe2
0
Then, Eq. (7f) is transfonned to
(8)
To solve Eq. (8), it is required that a further assumption be
made. Let oe2D = oe3D That is, the state of strain during a pure
dilation is syrrnnetrical with respect to the intermediate and the minor
principal strain.
Then, one may proceed as follows:
ov = oelD + 2 o e3D
OV - oelD oe3D = 2
and
26
(Sa)
Then,
1 . 0 E:
(a ' 0 I) = [0 I - -(O I + CJ I) J ---1.Q. 1 3 D 1 2 2 3 OE:l
(Sb)
03n 1 (0 I + a ') ov 2 2 3 OE:l . ' (Sc)
and
1 6 E: (J I·= a' - [0 I - 2 (0 I + CJ I) J ---1.Q. lf 1 1 2 3 0 E:l
(Sd)
a ' = 3f a' 3
1( ' + 2 °2 + ') ov
o3 OE:l . (Se)
The corresponding Eqs. · (Sd) and (Se) for triaxial _c~~s-~ior: and
triaxial extension tests are readily derived from these equations. - -·--- ----- -- -
----~·-~-
Tr iaxi al compression test:---) -----------------·-- -··-·-· ... ·-
CY 1 = 0 ' lf 1
(Sf)
a ' (1 + ov ) 3 OE:l
(Sg)
and in the case of triaxial extension test:
03f' ' + (o I 0 I) OE:3D
03 -1 3 . OE:3 (8h)
CJ I al I (1 - .§.'!-) •
lf oE:3 (Si)
Equations (Sd) through (Bi) will be used to determine the angle
of sliding friction for these three types of test.
27
DETERMINATION OF THE ANGLE OF SOLID FRICTION
The condition for sliding to take place between group contacts is:
01:f 1 + sin ¢s
03f 1 - sin ¢s (9a)
and I 0 3f olf - .
sin ¢ = oJ_f
I s + 0Jf (9b)
where the subscript 'f' stands for friction.
The values of crlf and cr)f are given by Eqs. (Sd) through (Si). Once
a test is selected to evaluate the angle of solid friction of a
particle assembly, the corresponding equation from (Sd) through (Si)
is selected and substituted in Eq. (9b).
Thus, for plane strain test,
sin rt-. ..,_,s
6e (a , - a , ) - [a , - le a , + a , ) J ----1Q. - le a '
1 3 1 2 2 3 6 E:l 2 2
6 E: ( I + ,.. I) [ I 1 ( I + (J I) ____lQ + le (J I 0 1 • VJ - 0 1 - 2 °2 3 6 e
1 2 2
for triaxial compression test
sin rt-. ..,_,s
6 81D 6v
(o' - o ') - (a' - a') - a' 1 3 1 3 oe
1 3 oe
1 68
1D 6v (a I + O' I ) + (a I - 0 I ) .-~ + a I
1 3 1 3 oe1
3 oe1
and triaxial extension test,
sin rt-. ..,_,s
683D (a I - 0 I) - (CT I - a I) ~~ -
1 3 1 3 oe3
0 I
1
(o' +a') +(a' - a') 1 3 1 3 - 0 I
1
+ I) 0V a --3 6 E:l
+ 0 I) 6v 3 6 E:l
(9d)
(9e)
Equations (9c), (9d), and (9e) are rearranged to obtain respectively:
(9c)
and
Let
and
0 I
1 0'
3
0' 1
CT' 3
_ (l + 6v ) 6e 1
28
0' 1
1) (1 -= <c;-r sin 3
+[o< + (l + w >] 03 . 0€1
sin ¢s
0 I
1 1 CT' - 6v
3 1 -6 E:3
~4i:E = r4rE (1 -
0 I 1
(6' 3
~) 0€3
1 + sin ¢ - 1)( 6v s)
()" I
1 - -0€3
1 1) (1 + <ar -
3
(1 - sin
(9f)
6e1D ¢s) 0€1
(9g)
(9i)
(9j)
(9k)
683D (9 .e) sin ¢s) ~
3
where the subscripts IP'' 'TC' , and 'TE' stand respectively for plane
strain, triaxial compression and triaxial extension test.
Equations (9f)' (9g), and (9h) are now exp:ressed by:
0' 1
a ; &v [
01' 1
CJ I
1 (1 + ..2_) + _2~) &v l (;' - 1 - - -- = ~ + ...... + 1 + - (1
0 81 sin 2 CJ I 0€1 03 2 0 I
3 3 3
¢ . s (9h)
¢s' (9m)
and
0' 1
CT' -3 1
29
[
011
6v J = ~C + 03 I + (1 T 0€1) sin (9n)
l 6v = ~E + [:l: -. 3 1
0€3
(9p)
There are two unknowns, ¢s and 0, in each of the Eqs. (9m), (9n) ,
and (9p). The determination of these two unknowns is possible by.
plotting the experimental data in the form as given by each of the
respective equations. For example, in the case of the triaxial compres-
sion test) a plot of 01' /03 I - (1 + ov/ 0€1) versus 01' I 03 I + (1 + ov/ 0€1)
allowed the determination of ¢s and ~C if su.ch a plot corresponds to a
straight line of the form:
(9q)
where tan ~ = sin </JS) and ~c= ~C' over a wide range of the deformation
process of the sample. The value of ~c is not in general a constant
throughout the deformation process, but it may reach a value of ~c which is constant over a given deformation range. If ~C reaches a
constant value C4r_.c over a given range of the deformation process, it is
then possible to determine the value of sin ¢ and calculate the value s
of sin ¢s corresponding to any given instant during the process of.deformation
of the sample.
INTERPRETATION OF THE PARAMETER 0
Regrouping terms in Eq. (9f):
30
I CJ I
l = tan2 (45 + l n.. ) + l (1 + ..2...,) ~ t 2 (45 +
1 n.. ) a
3' 2 'f's 2 cr
3 oe
1 an 2 'f's
[
I '] 01 1 °2 + ~ - -(1 + ~) a ' 2 . a ' 3 3
(lOa)
.or
I 0 I 0€1D 0 1 2 1 ¢ ) + .l ov 2 1 1 l) - = tan (45 + ~ tan (45 + 2 ¢s) + (CT' -0 I 2 s 2 0€1 2 0€1 3 3
0 ' [ 2 +l OelD J + 1:_ ~ ov tan (45 ¢) - ~ . (lOb) 2 0
31 6e1
2 s 6€1
Recalling that,
sin sin
then, let
°"° = c:~: -~] 6€1D 1 02 I 6€1D (lOc)
6€1 - 2 cr3
• ~
. . 1 02 I 6€1D ¢s Ccrl· B 6elD
(lOd) q,fD = 2 03' ~sin - CT' - 2 0€1 sin . ¢s;
3
where the subscript D and fD stand for dilatancy and friction due to
dilatancy, respectively, and Eq~ (lOa) is now expressed by:
(} I
2 + .h +l 0 I
6v 2 ¢s 1 - tan (45 ¢s) (1 +~) tan (45 + -) + ~\D' (lOe) CT' - 2 2 CJ I 6e1 2
3 3
or
I 0 I 01 2 1
¢s) + l(l + ..2....) .§;!__ 2 1 ¢s) O' = tan (45 +- tan (45 +-
2 2 0 I 0€1 2 3 3
+ r2r + ~rn (lOf)
The corresponding equations in the case of triaxial compression
test are given by:
31
0 I 2 + .!. · 6v 2 1 1
¢s) ¢s) + Oren' (lOg) or= tan (45 + -6
- tan (45 +-2 el 2 3
and
0· I
2 +.!. + 6v 2 1 1 ¢s) ¢s) + Ore + O:rcrn (lOh) or tan (45
2 oe1
tan (45 + 2 3
where
llrcn ~ [:~: - ~ 6e1D (lOi) oe
1
and
[a ' ~ oelD
~CfD = 0: I -1 sin ¢s (lOj) 6 e
1
The corresponding equations in the case of the triaxial extension
test are given by:
0 I
1 2 + .!. 1 (1 + ~D) ¢s)' (lOk) O' = 1 - av/ 083
tan (45 2 3
and
0 I 1 2 1 1
(1 + '4rE - '4rEfD) ¢). (10 j,) CT'= 1 - ov/ 6e3 tan (45 + 2 s ' 3
where
0 I 6e3D OTED
1 1) (lOm) <ar -
083 3
and
o' 083D 1 1) ~4:rnrn = <07 -
083 sin ¢ • (lOn)
3 s
The different form of Eq. (10£) with respect to Eqs. (10£) and
(lOg) is due to the use of 083
rather than 081 for the derivation of
32
the corresponding equations; the reason being that the minor natural
principal strain, s3
, correspond to the axial strain measured, in a
triaxial extension test.
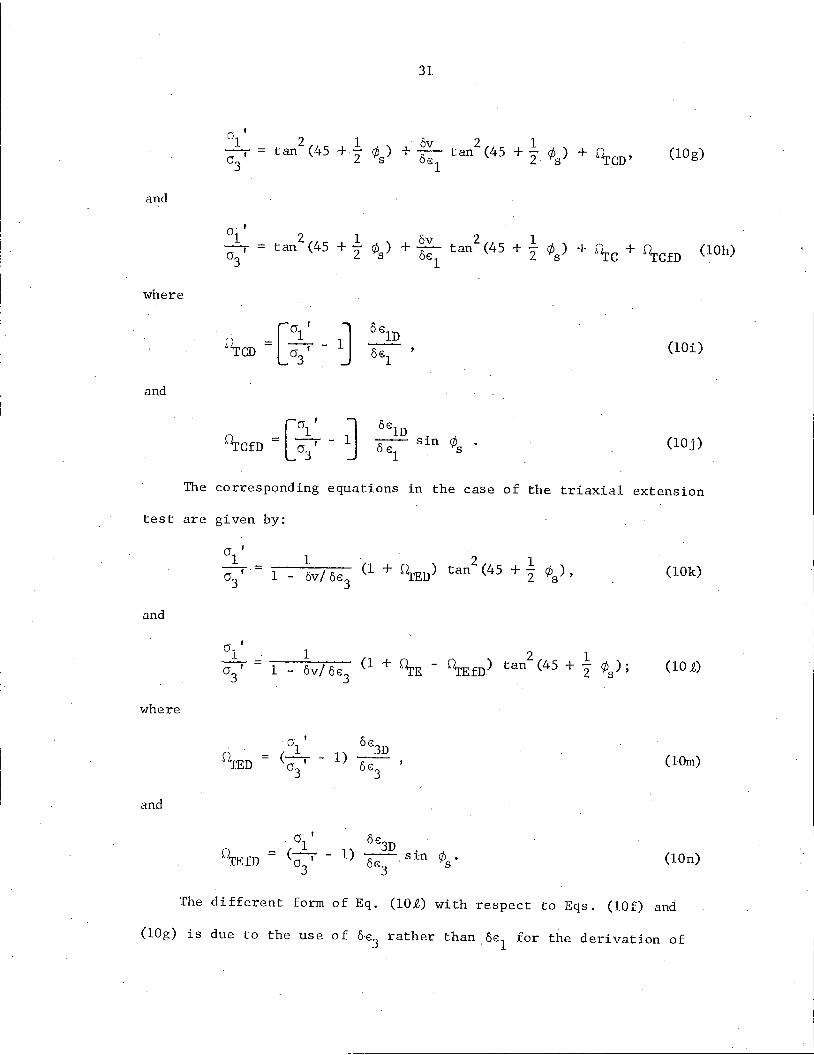
Figure 2 is a model idealization of the terms encountered in Eq.
(lOg).
Figure 2a represents two rigid blocks, whose coefficient of solid
friction is µ = tan ¢ , sliding against each other along a plane in-s .
clined 45 + 1/2 ¢ degrees with respect -to the horizontal plane. The s
value of the ratio a '/a ' is then g.iven by: 1 3
0 I
1 tan 2
(45 + ..!. r-A ) (ii 2 'f's 3
which was obtained from
0 I b 1 ¢s .
tan [ ¢s + (45 - ~)].
Consider that each block is mounted on a set of cylindrical
rollers possessing the same frictional characteristic of the two
blocks as shown in Fig. 2b. Relative movements of the two blocks occur
along the contacts between the rollers and the value of 01
1 /03
1 is
then given by:
0 I
1 CT'
3
2 ¢ 6 2 1 tan (45 + -2.) +.~ tan (45 + -
2 ¢).
2 os1
s
Consider, instead of two rigid blocks, an assembly of frictionless
particles as shown in Fig. 2c. The required ratio 01
1 /03
1 to produce
relative movements between the particles at a given instant is given by:
0 I
1 "()' OTCD •
3
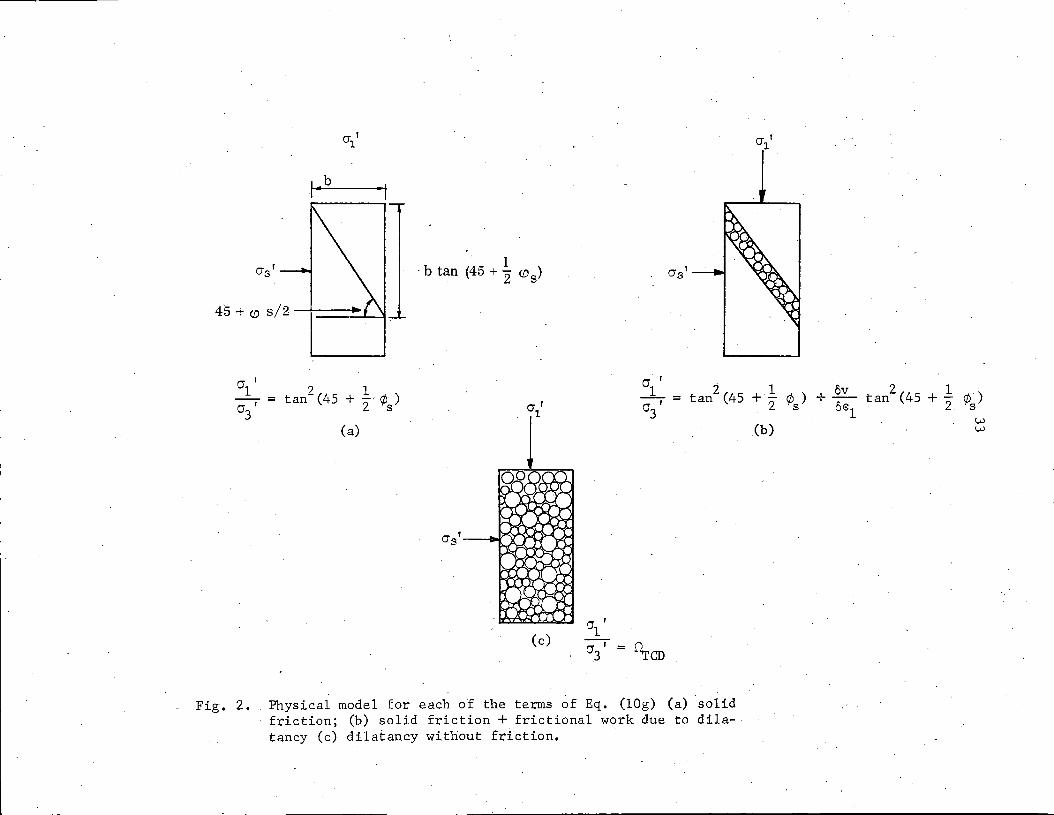
a' l
45 + ([) s/2-+--..
. I ·· b tan (45 + 2 ©
8)
r (jl
a' 1 2 1 -;:;-r = tan (45 + 2 ¢ ) u
3 S cr r
l
CJ I
- 1- = tan2 (45 + l n, ) + ov tan2 (45 + -21
n, ) rJ I 2 'I'S ~E; 'I'S 3 u 1
(a)
(c) IJ I
1 or= 3
Fig. 2 •. Physical model for each of the terms of Eq. (lOg) (a) solid friction; (b) solid friction + frictional work due to dila- · tancy (c) dilatancy without friction.
(b) w w
34
Consider the same assembly as shown in Fig. 2c but filled with
particles possessing a coefficient of solid friction µ = tan ¢ . The s
required ratio 011 /03
1 to produce relative movements between the
particles where no sliding occurs between particles or groups of particles
at a given instant is given by:
' 01.
CT' D.rc + °'rem · 3
Similar analogies can be drawn in the case of Eqs. (lOe) and (lOf).
Thus, the parameters (~D' °'rcn' and ~ED represent the three-
dimensional interference among the particles at a given instant. This
three-dimensional interference produces a rearrangement of the particles
which is commonly known as interlocking. The effect of this three
dimensional interference is not only to increase or decrease the rate
of formation of sliding contacts, but also to increase or decrease the
rate of volume change within the assembly.
The following quantities may be readily determined with a known
value of 0.at any stage of the deformation process;
(a) Plane strain test
6WiD +lei
o' ov
°rn + _2_) 03' Oel 2 CJ I 6e
1 ' 3 (lla)
(llb) 6Wif o' oWiD 1
1) o
3' 6 e
1 C-ar -
03' Oel ' 3
oWiD oWiD/ 03 I Oel
ol' Oel o 'lo ' 1 3 (llc)
oWi . oWif/ o3 ' oe1 f 01' Oel a 'lo ' 1 3
(lld)
I I
35
(b) Tri axial compression test
6WiD
~CD + .2.Y:._ 03' OE:l 0€1
(lle)
6Wif a ' 6WiD 1 1)
03 I OE:l (Di -(j3 I 0€1
, 3
(llf)
oWiD 6WiD/ 03 I 0€1.
al' oel = a '/a ' 1 3
(llg)
6Wif 6Wif/ (J3 I 0€1
(Jl I OE:l = a'/a'
1 3. (llh)
(c) Tri axial extension test
oWiD a' Oran + ~1- OV
03 I 0€3 0'3 I 0 €3 (lli)
6Wif 0 I oWiD 1 1) 03 I 0 €3 ('CT' 03 I 0€3 ' 3
(llj)
where 6WiD and 6Wif are respectively the increments in internal work
absorbed by the sample at a given instant in dilating or in friction;
ratio of the increment in internal work absorbed in dilatancy or in
friction to the product of the effective minor principal stress times
the increment in natural axial strain at a given instant during
are, respectively, the ratio of the increment in internal work absorbed
:tn di la tanc'.y1
or in friction to the increment in the work done on the
sample by 0 11 at a given instant. The quantities oWiD/ a
3' oe1 and
6Wif/ o3
1 oe1 do not represent a particular energy ratio, and they are
selected as a convenient ratio for comparison of work components when
6e1 is applied and a constant effective minor principal stress is
maintained.
I
36
TESTING OF THE T.HE:ORY
Equations (9m), (9n), and (9p) were tested against published data
obtained by dependable research workers in the performance of plane
strain, triaxial compression, and extension tests on cohesionless
soils.
There are two unknowns, sin·¢ and 0, in each of the Eqs. (9m),
(9n), and (9p). Plots of the experimental published data according to
Eqs. (9m), (9n), and (9p) showed a straight line form over a wide
deformation range; and thus allowed the determination of sin ¢ and 0. s
The values of the effective major, intermediat~ and minor principal
stresses; the change in volume in percent of either the initial or the
actual sample volume; and the axial strain in percent of either the
.initial or the actual height of the sample, were obtained from the
published test data.
Although identical notation was used, the value of ov/oe1
was
based on either the "engineering" volumetric and axial strains or the
"natural" volumetric and axial strains. Whereas the "engineering"
volumetric and axial strains were given in percent of the initial
volume and height of the sample, respectively, the "naturalir volumetric·
nnd axial strains were given in percent of the actual volume and height,
respectively, of the sample at that instant. The correct value of
ov/oe1 for use in Eqs. (9m), (9n), and (9p) is the ratio of the
increments in "natural" strains. However, the differences between the
two ratios are small unless the deformation exceeds about 5 percent
of the axial strain. The value of the engineering axial strain in
I I
37
percentage is smaller than the corresponding value of the natural axial
strain in percentage for large axial deformation. The difference did
not influence the value of .sin ¢ , but it may have a slight effect on s
the values of the parameter 0 corresponding to the curve after the
maximum value of 01
1 /03
1 is achieved within the sample.
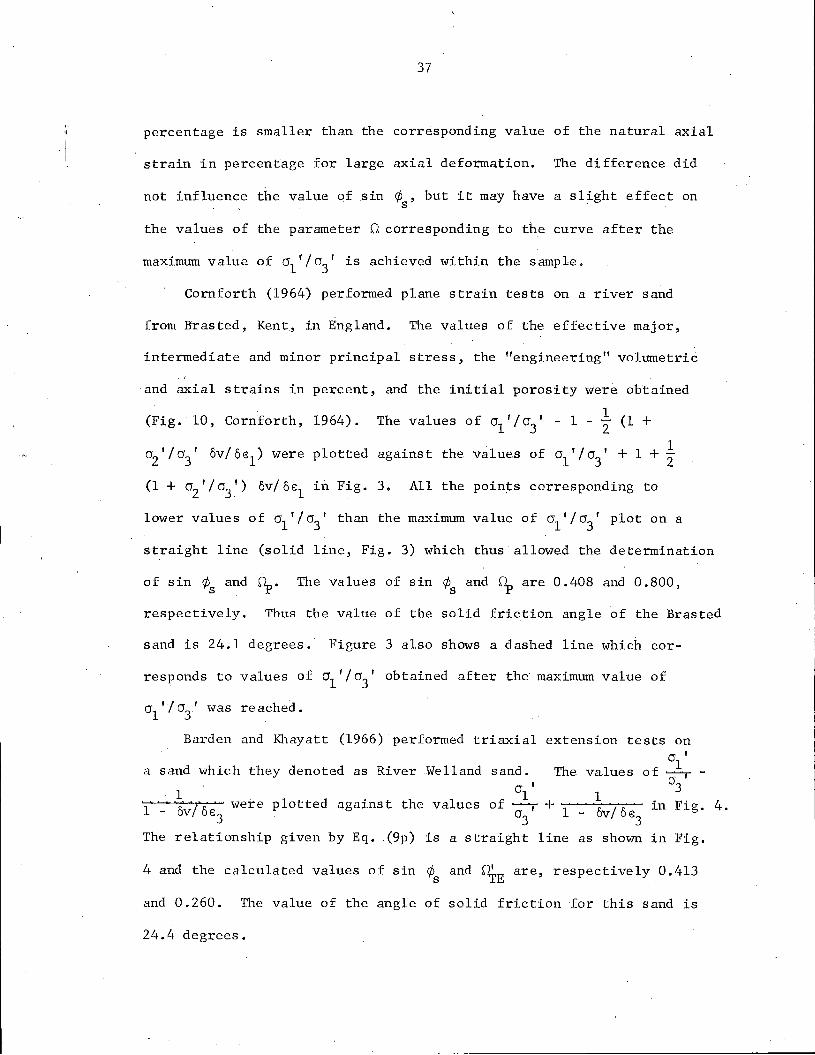
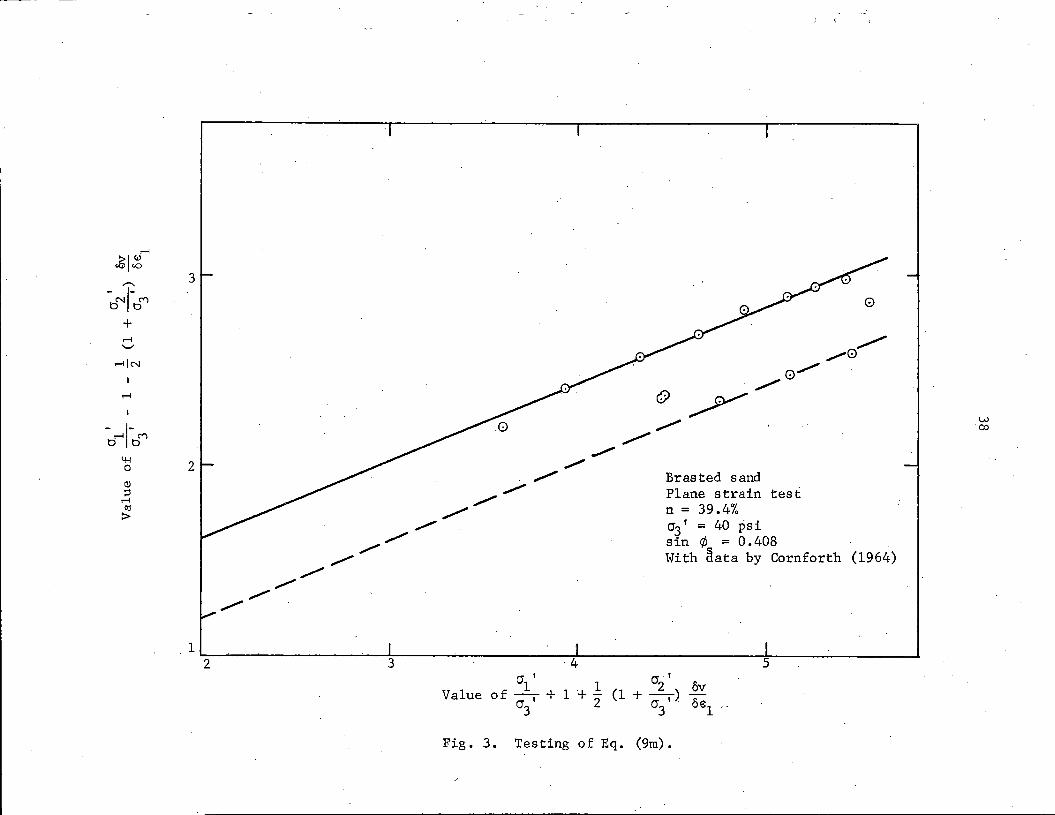
Cornforth (1964) performed plane strain tests on a river sand
from Brasted, Kent., in England. The values of the effective major,
intermediate and minor principal stress, the "engineering" volumetric
and axial strains in percent, and the initial porosity were obtained
(Fig. 10, Cornforth, 1964). 1 The values of 0 1
1 I o3 ' - 1 - 2 (1 +
1 a2'la3' 6v/6el) were plotted against the values of 01'/03' + 1+2
(1 + 02 I I 03') ov/ oel in Fig. 3. All the points corresponding to
lower values of 01
1 /03
1 than the maximum value of 01
1 /03
1 plot on a
straight line (solid line, Fig. 3) which thus allowed the determination
of sin ¢s and q,. The values of sin ¢s and q, are 0.408 and 0.800,
respectively. Thus the value of the solid friction angle of the Brasted
sand is 24.1 degrees. Figure 3 also shows a dashed line which cor-
responds to values of a '/a' obtained after the maximum value of 1 3
cr1'/0
31 was re ached.
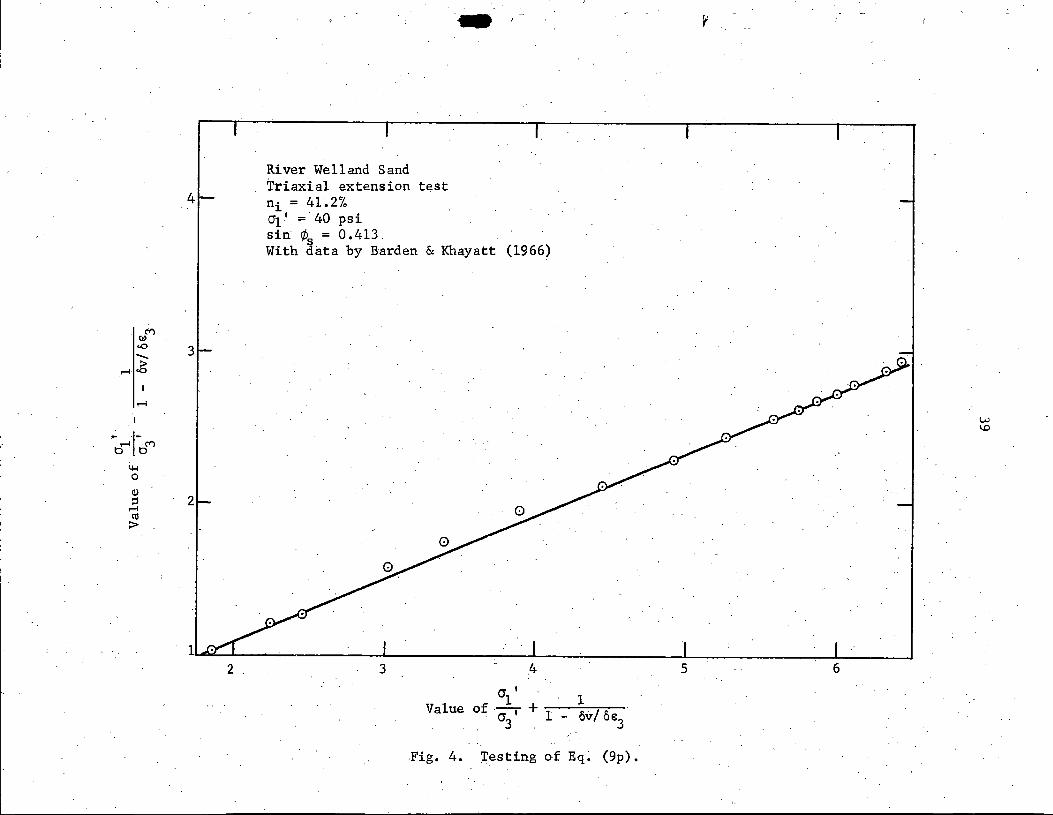
Barden and Khayatt (1966) ·performed triaxial extension tests on
a sand which they denoted as River Welland
1 1 -. I were plotted against the values 6v 6e3
sand. o'
1
(J I
1 The values of --;::-r -a3
of or+ 1 3
1 in Fig. 4.
The relationship given by Eq. (9p) is a straight line as shown in Fig.
4 and the calculated values of sin ¢s and ~E are, respectively 0.413
and 0.260. The value of the angle of solid friction for this sand is
24.4 degrees.
3
2
1 2 3
Q' I
Value 1 1 of -- + Q' I
3
Fig. 3. Testing
4
+! 2
(1
of Eq.
Brasted sand Plane strain test n = 39.4% 0'3 I = 40 psi sin ¢ = 0.408 With ~ata by Cornforth
5 0:. I
+ 0'2 I) ov
3 eel
(9m),
0
(1964)
4
2
River Welland Sand Triaxial extension test ni = 41.2% Ot' = 40 psi sin ¢s = 0. 413. With data by Barden & Khayatt (1966)
3 .4
C' I . 1 Value of -
1- + -----cr3' l - ov/ oe3
Fig. 4. ~esting of Eq~ (9p).
5 6
40
The values of cr11 Jcr
31
- (1 + ov/oe1) were plotted against the
values of (Jl I I 03 f + (1 + ov/ 0€1)' obtained from published triaxial·
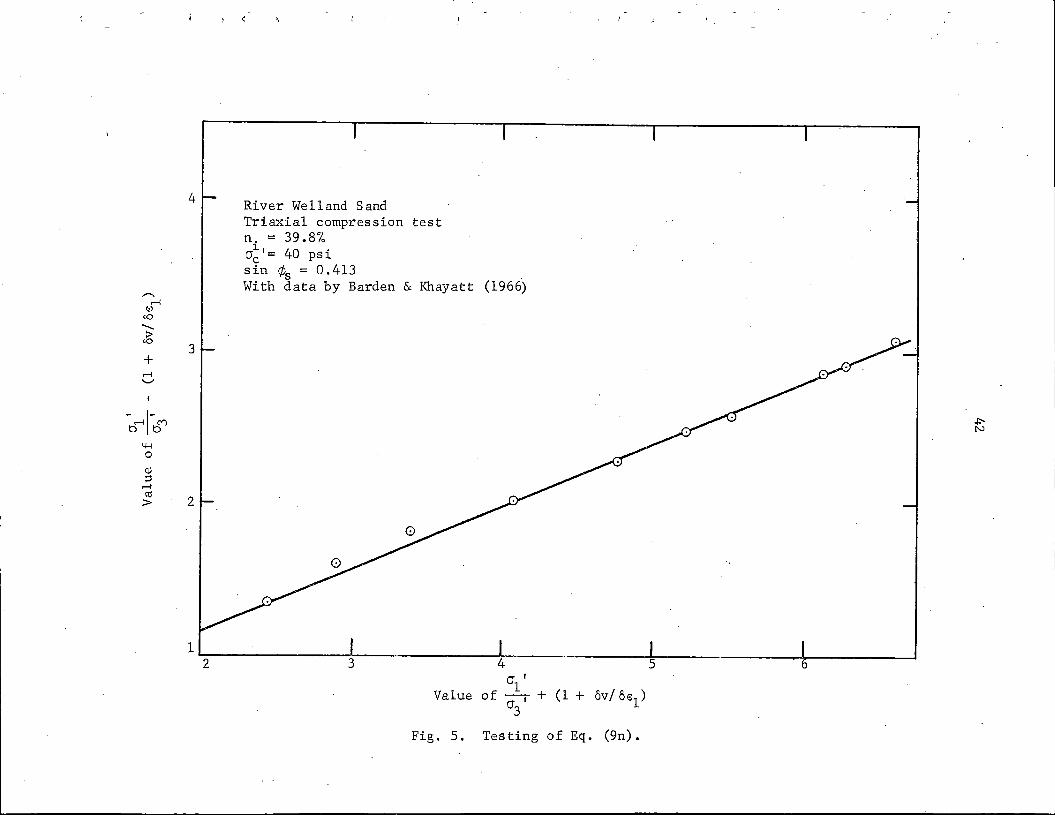
compression test data, in Figs. 5 to 13. The relationship expressed
by Eq. (9n) is also a straight line for all the data presented.
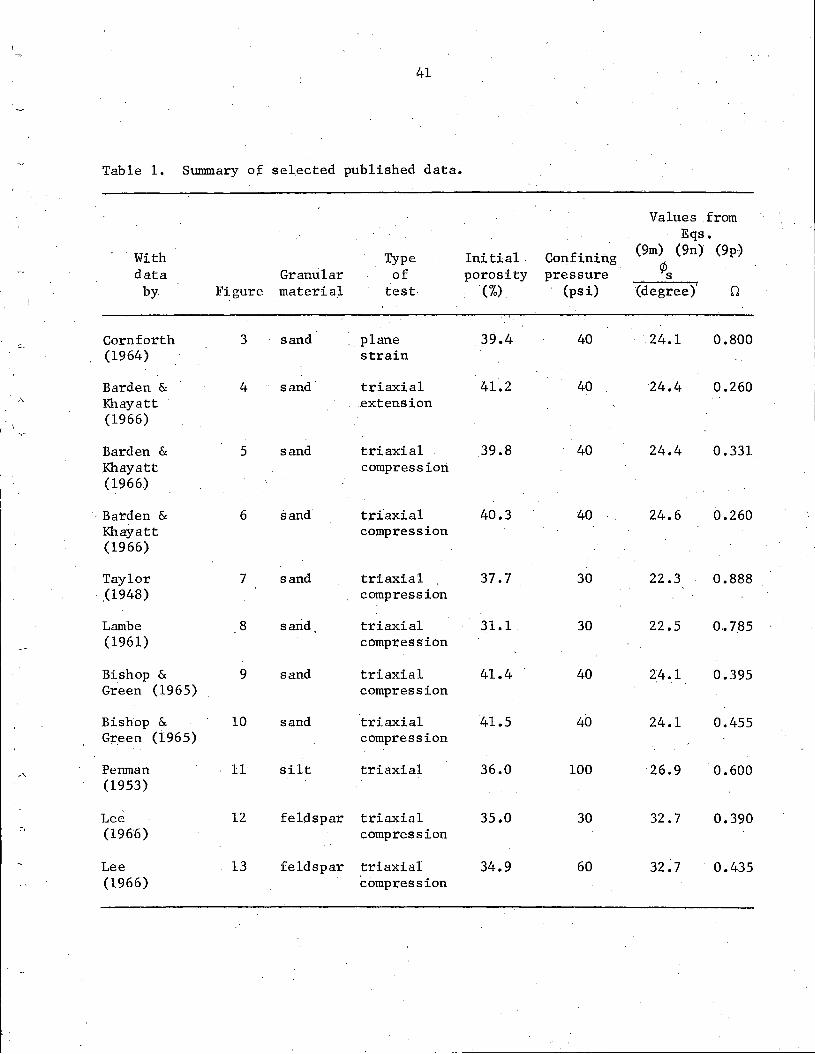
A summary of the published data shown in Figs. 3 to 13 is presented
in Table 1, together with the values of the angle of solid friction and
of the parameter 0 as calculated from the corresponding Eqs. (9m), (9n),
and (9p).
It is apparent from Table 1 that the angle of solid friction of
the· sands varies between 24 t·o 24. 5 degrees and these values are
independent of the initial void ratio, the type of shear test per
fonned on. the sand, and the level of the confining pressure within
the tested range. Deviations are acknowledged in Table 1 for the
older published data, which may be considered less reliable since
many refinements have been introduced in testing techniques.
The main mineral component of these sands is quartz. Horn (1961)
using a special technique measured the coefficient of friction between
two highly polished surfaces of pure quartz. Horn's measured values
for quartz under submerged conditions varied between 0.42 and 0.51,
which correspond to angles of solid friction between 22.8 and 27.0
degrees. The purpose in bringing forward Horn's results in pure
quartz is solely for comparison and not to support the correctness
of the values obtained by the proposed equations. In fact, Horn's
results in feldspar correspond to a solid friction angle of 37
degrees, ·which differs from the value of 32.7 degrees appearing in
Table 1. The independent evaluation of the coefficient of friction
41
Table 1. Summary of selected published data.
Values from Eqs.
With Type Initial Conf irting (9m) (9n) (9p.)
data Granular of porosity pressure ¢s by Figure material test (%). (psi) (degree) 0
Cornforth 3 sand plane· 39.4 40 24.1 0.800 -·
(1964) strain
Barden & 4 sand· triaxial 41.2 40 24.4 0.260 ··' Khayatt .extension
(1966)
Barden & 5 sand triaxial 39.8 40 24.4 0.331 Khayatt compression (1966)
·Barden & 6 sand trfaxial 40.3 40 24.6 0.260 Khayatt compression. (1966)
Taylor 7 sand triaxial 37.7 30 22.3 0.888 . (1948) compression
Lambe 8 sarid triaxial 31.1. 30 22.5 o .. 7.85 (1961) compression
Bishop & 9 sand triaxial 41.4 40 24.1 0.395 Green (1965) compression
Bishop & 10 sand triaxial 41.5 40 24.1 0.455 G:):."_een (i965) compression
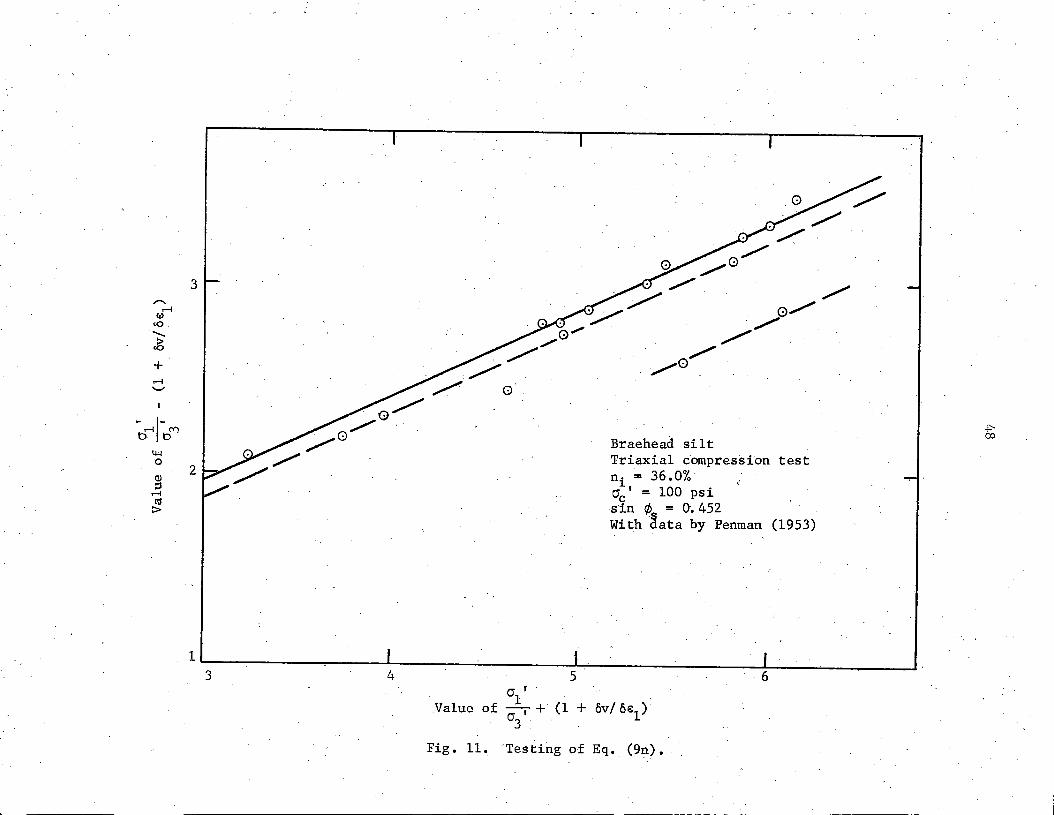
,, Penman 11 silt triaxial . 36.0 100 26.9 0.600 (1953)
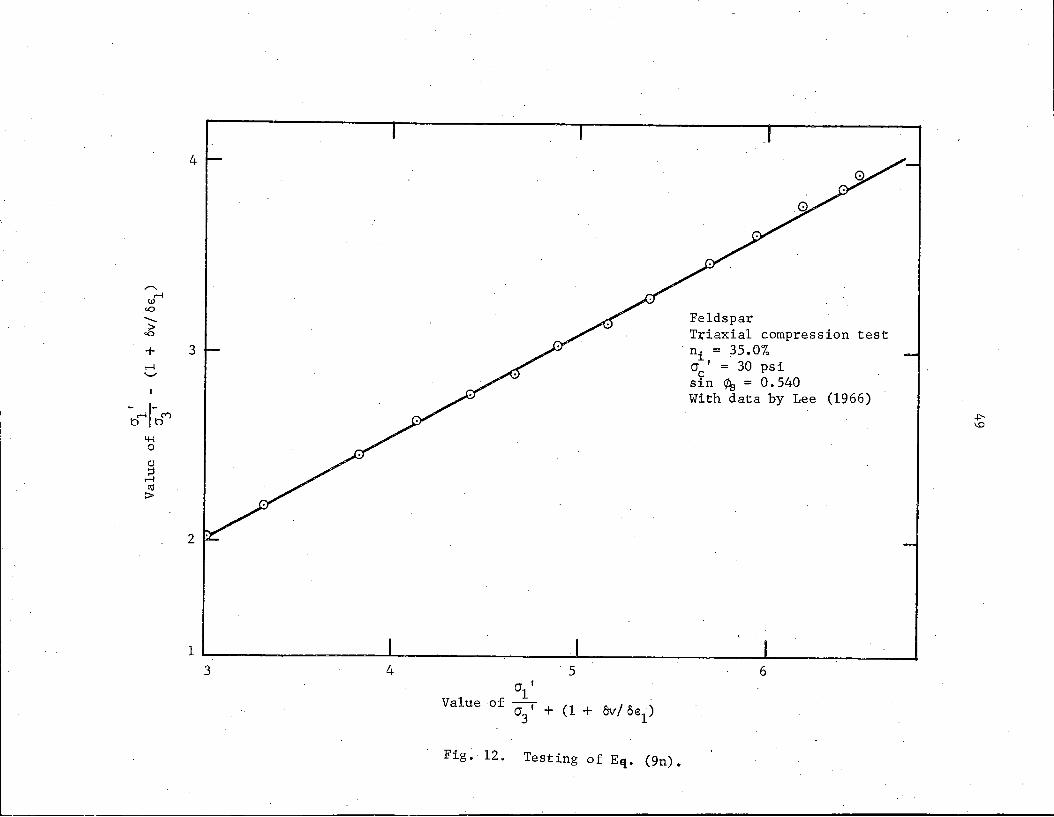
Lee 12 feldspar triaxial 35.0 30 32.7 0.390 c, (1966) compression
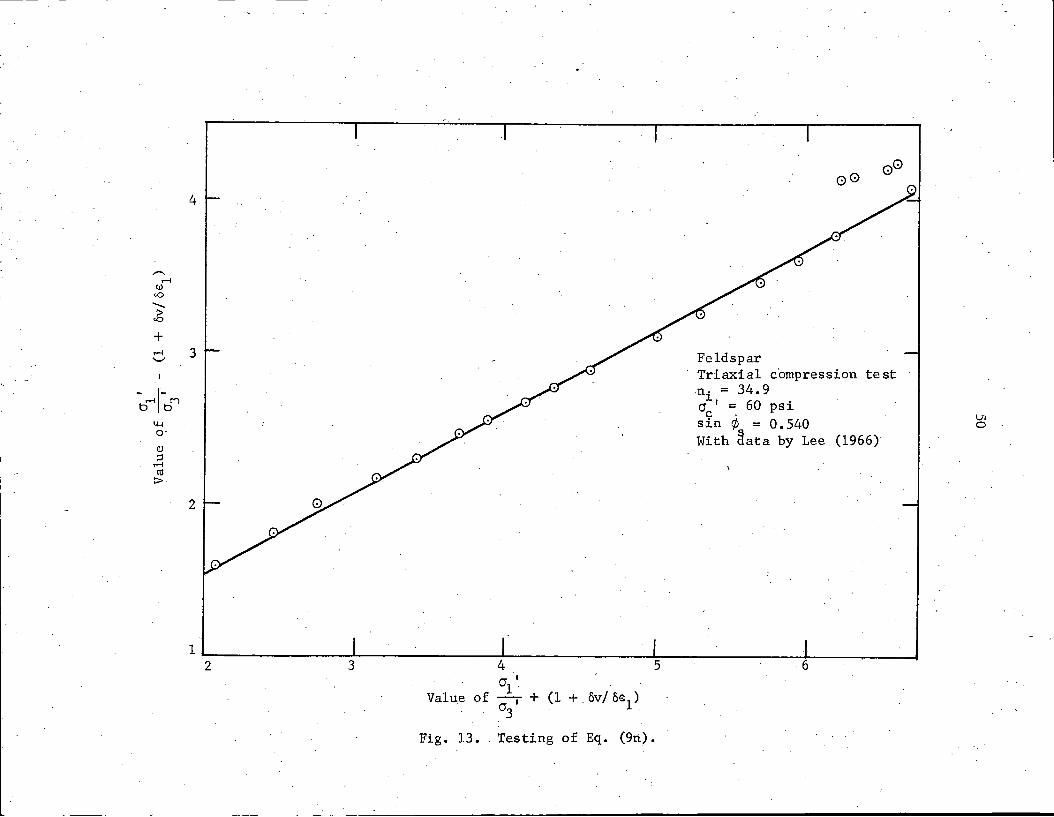
Lee 13 feldspar triaxial 34.9 60 32.7 0.435 (1966) compression
-.-1 <.!)
cO -s + .-1 .._,
-~1-bC'") 4-l 0
Q)
::l .-1 co
:>
4
3
2
River Welland Sand Triaxial compression test n. = 39.8% a~'= 40 psi sin ¢s = 0.413 With data by Barden & Khayatt (1966)
a' 1 Value of (JI + (1 + ov/ oe1)
3
Fig. 5. Testing of Eq. (9n).
4
3 "'"' r-l (!)
<O -J;
+ r-l '-'
-or-ll-bC"') 2
~ 0
(]J
::s r-l co
::>-
1
2
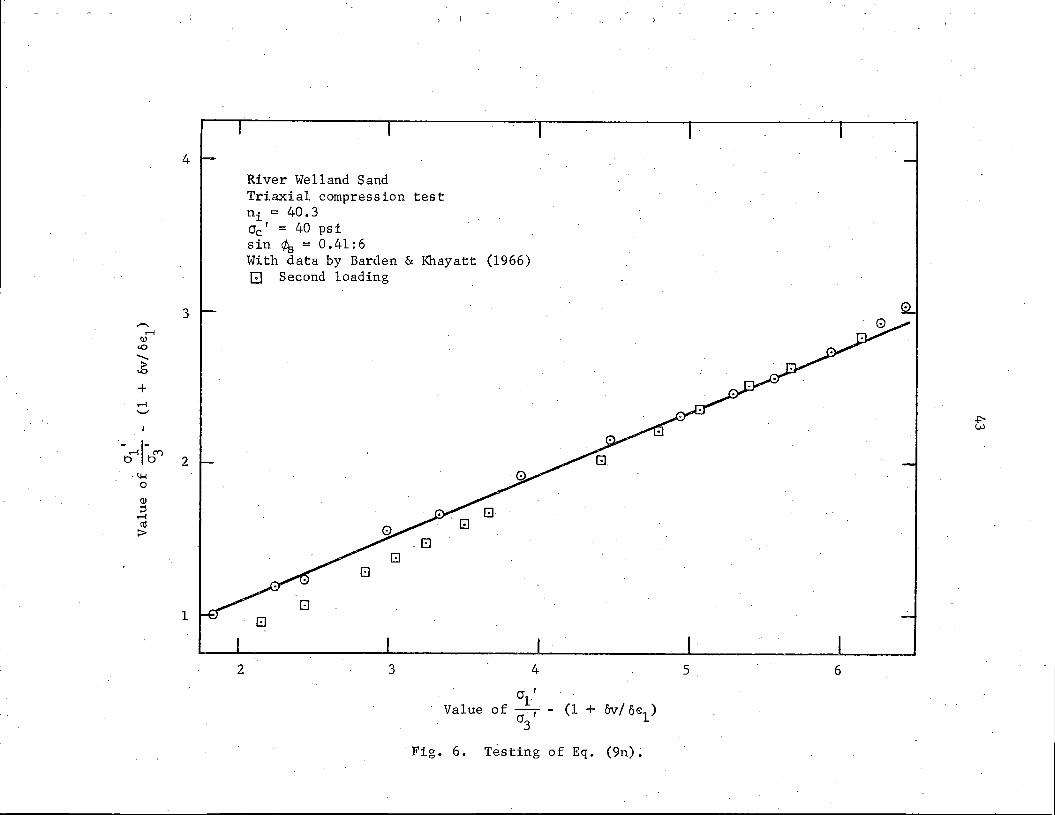
River Welland Sand Triaxial compression test ni = 40.3 O'c' = 40 psi sin ¢s = 0.41:6 With data by Barden & Khayatt (1966) El Second loading
3 4
(J I
Value . 1 of-.-,· 0'3
Fig. 6. Testing
5 6
- (1 + ov/ oe1)
of Eq. (9n)~
4
,...... .--!
(J)
'° -:> '° + .--! .......
I
~I~~ 4-l 3 0
QJ ;:s
.--! ctl
:>
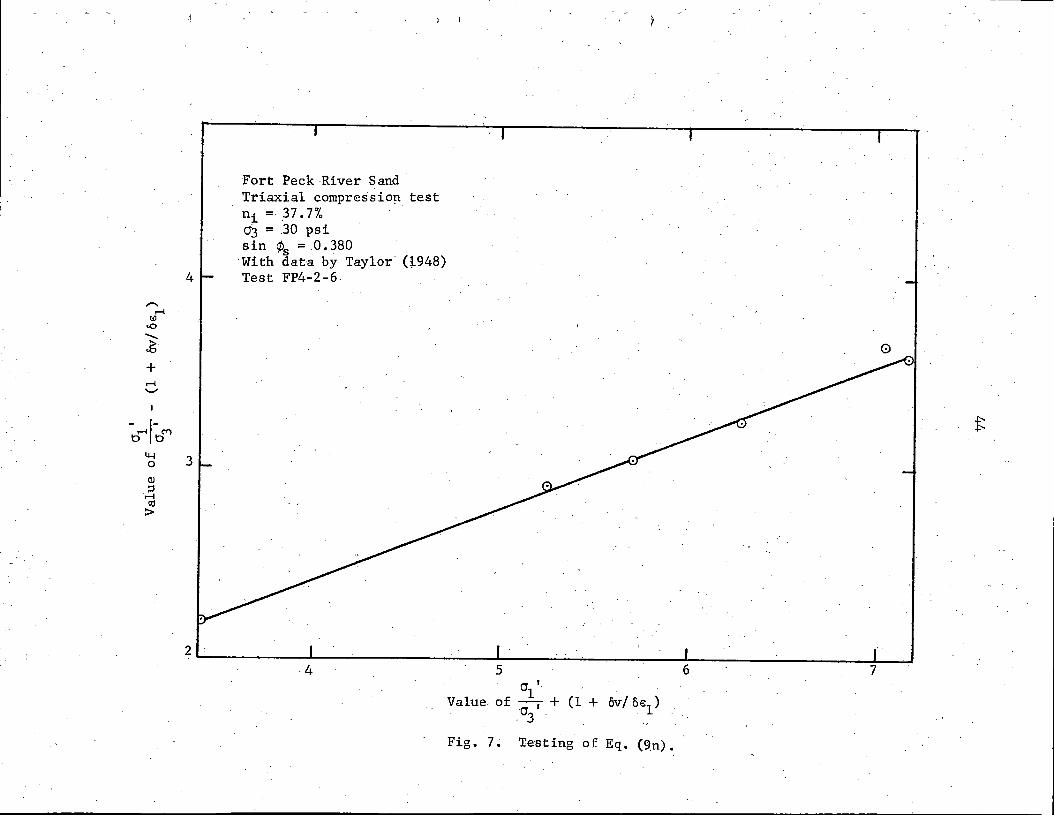
Fort Peck River Sand Triaxial compression test n· = 37.7% ·
]. -d3 = 30 psi sin ¢s = .0.380 With data by Taylor (l:.948) Test FP4-2-6
4
-- ----------------------------------
0
5 . O' •.
1 Value. of - + (1 + ov/ oe1) ._., I v3 .
Fig. 7 •. Testing of Eq. ('n).
3
+
-b.-11-b(") . I.I-I 2
0
Q)
.s Ct!
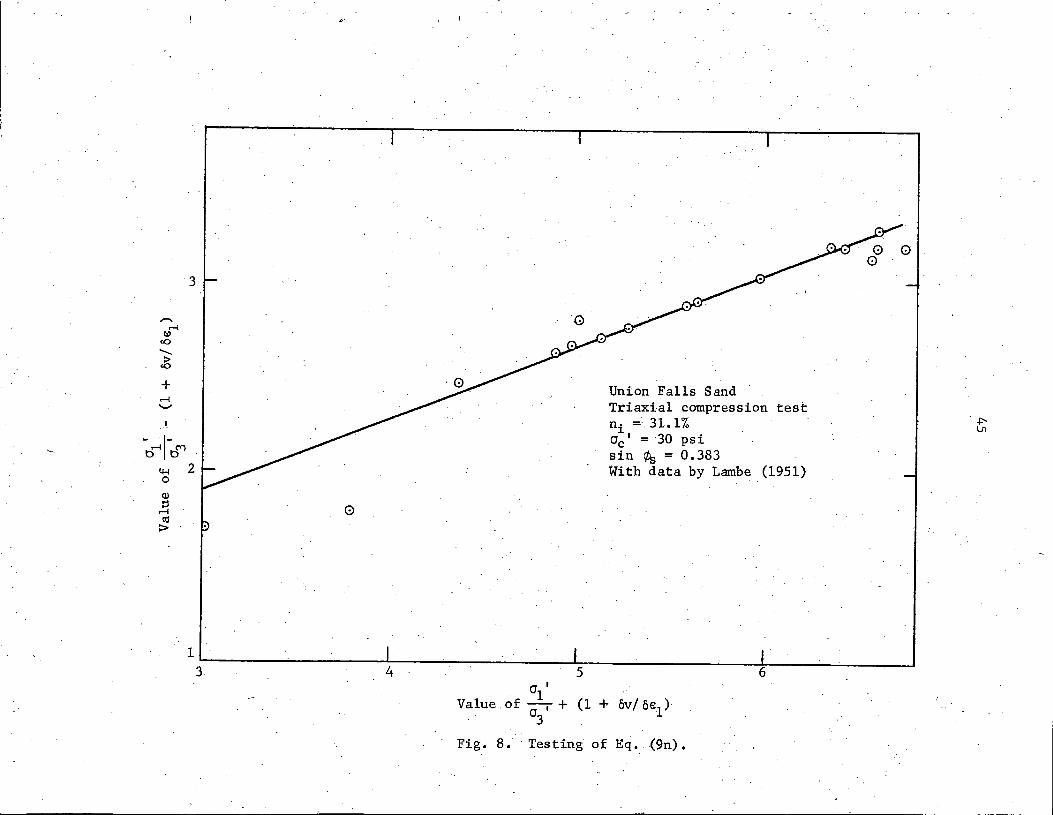
:;:.. 0
Union Falls Sand Triaxial compression test ni = 31.1% O'c' = ·30 psi sin ¢s = O. 383 With data by Lambe (1951)
O' I 1
Value of O' + (1 + ov/ oe1) 3
Fig. 8. ·Testing of Eq. (9n).
0·.
3
-~1-bC"") 2
4-l 0
Q)
.B ctt :>
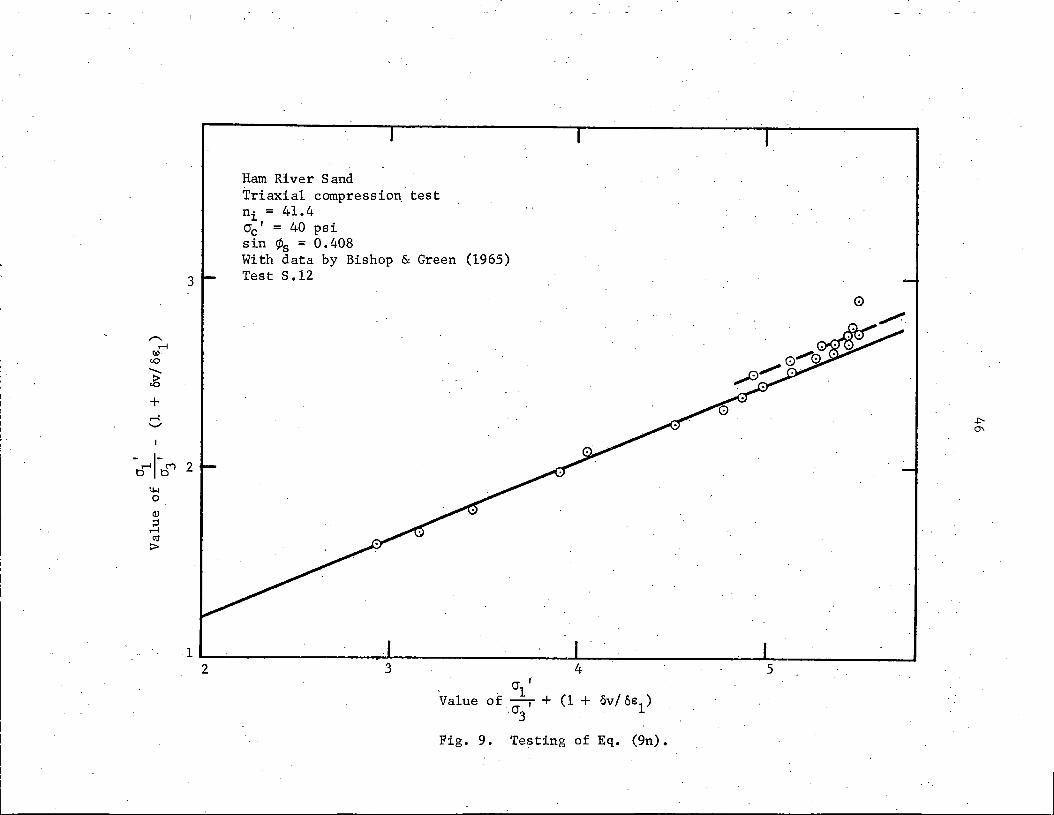
Ham River Sand Triaxial compression test ni = 41.4 O"c' = 40 psi sin ¢s = 0.408 With data by Bishop & Green (1965) Test S.12
. 0"1 I
Value of - + (1 + ov/ oe1) ·~I ·V3
Fig. 9. Testing of Eq. (9n).
0
3 ,,.......
.-! (,)
<O -~ + .-! ..._,
~1~"1 4-1 0
2 a> ~
.-! ct! >
2
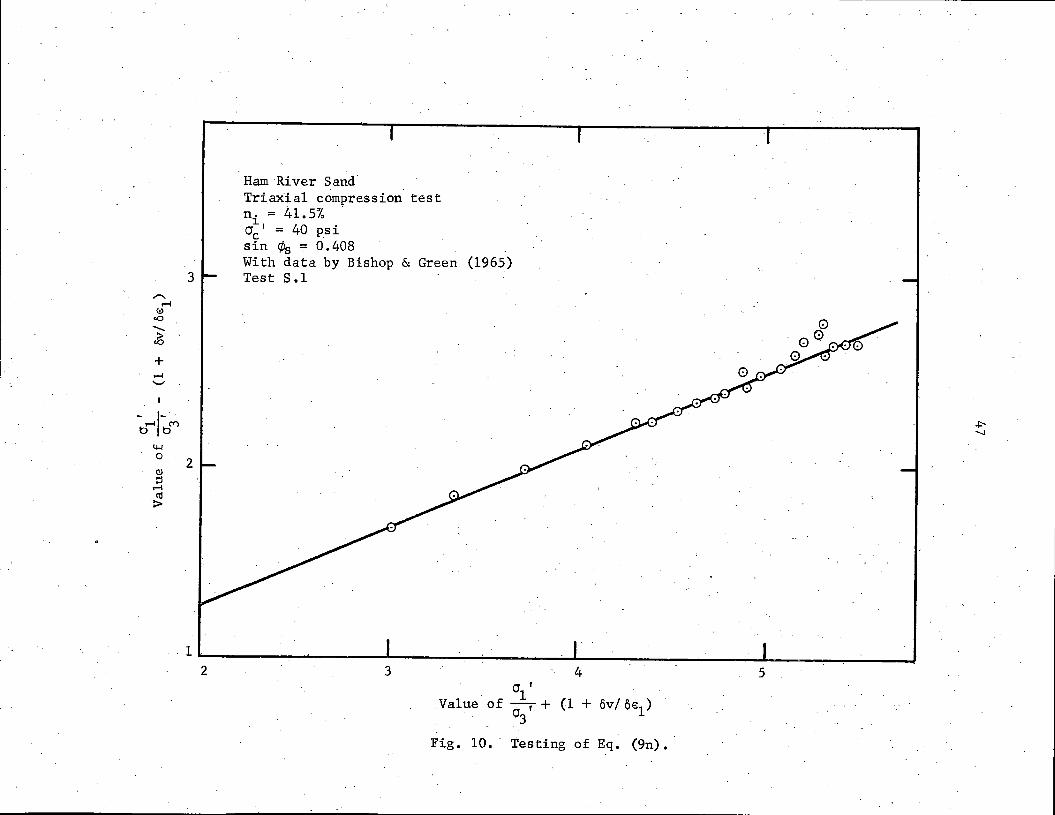
Ham River Sand Triaxial compression test ni = 41.5% .. crc' = 40 psi sin ¢s = 0.408 With data by Bishop & Green (1965) Test S.l
3 4 (J I
1 Value of Ol + (1 + ov/ oe1)
3
Fig. 10. · Testing of Eq. (9n) •.
5
.: .
3 / ,....... 0./ .-I w
<O ./ - / .5 . ./ + ,,.,0. .-I .._, Q
-b.-ll~C'") .p.
Braehead 00
silt 1.1-l Triaxial compressi·on 0 test
2 n. = 36.0% Q)
~ l. .-I CJ I = 100 psi
ct! c > sin ¢~ = O. 452
With ata by Penman (1953)
Fig. 11~ Testing of Eq. (9n).
4
,......_ r-l
(J)
<O -.5 + 3 r-l '-'
ci-41-b~ 4-l 0
Q)
~ r-l co
:>-
2
3 4 5 rJ I 1
Value of -0 , + (l i: Ii: ) 3
+ uv ue1
Fig. 12. Testing of Eq. (9n).
Feldspar Triaxial compression test
· ni = 35.0% cr ' = 30 psi c sin ¢s = 0.540 With data by Lee (1966)
6
,-., ,....-!
w <O -.6 + ,....-! .._,
~,....-11-br') 4-1 o-Q)
;::l ,....-!
t1I :::>
4
3 Feldspar Triaxial c'ompression test
~i,==3~09psi c
sin ¢ = O. 540 With 9ata by Lee (1966)
2
l,__ _____________________ ~-------------'-------~-----------------.--.-L---------------------~----------------.J 2 3 4 5 6
0'1' Valu_e of CJ' + (1 + _ ov/oe1)
3
Fig. 13 •. Testing of Eq. (9n).
Vl 0
51
of minerals is a helpful guide to what values may be expected but
since soils vary widely in mineralogical composition, particularly of
grain surfaces, their coefficient of friction may be expected to
deviate from the value of the main mineral component.
'The values of the parameter 0 for plane strain are considerably
higher than for triaxial compression and extension tests; this is a
direct result of a larger amount of interlocking or three-dimensional
interference among the particles due to the imposed strain conditions,
namely no strain is being allowed in the direction of the intermediate
principal stress.
The parameter 0 is a function of the initial porosity, the level
of the confining pressure and the gradation. However, the calculated
values of 0 from two tests, Figs. 9 and 10, with data from Bishop and
Green (1965) appearing in Table 1 are different in spite of both
samples being at the same initial porosity and confining pressure.
These samples were, however, tested with different boundary conditions.
The sample with the higher value of the parameter Owas tested with
"fixed" ends whereas the other sample was tested with "frictionless"
ends. The term "fixed" ends indicates that friction was developed
between base and cap and the ends of the sample, whereas "frictionless"
ends indicate a reduction of that friction to a minimum. The effect
of "fixed" ends is to increase the value of the parameter n during the
pre-peak defonnation range where "peak" denotes the maximum value of
the ratio 011 /0
31
• This increase is explained by reduced rate of
volume change and by an increased slope of the cr1
1 /cr3
1 versus axial
strain curve, as a result of which the peak value is reached at smaller
52
strains in the sample tested with "fixed" ends (Bishop and Green, 1965).
"Fixed" ends also modified the post-peak behavior: The rate of decrease
in the values of cr1 '/cr31 with respect to axial strain is higher than
in the sample with frictionless ends (Bishop and Green, 1965). The
effect of this higher rate of decrease reduces the value of the
parameter 0 in comparison with the other sample, where post-peak values
of 0 are higher than their pre-peak values,as shown in Fig. 9 by the
upper dashed line. Similar higher values of 0 for post-peak values of
a '/a ' are shown in Fig. 13 with data by Lee (1966) on feldspar 1 3
tested with frictionless ends.
The high calculated values of 0 for the tests with data by Taylor
(1948) and Lambe (1951) are a result of the effect of restrained ends
on the sample's deformational behavior, and also to probable errors in
the measurement of the applied normal loads due to piston friction.
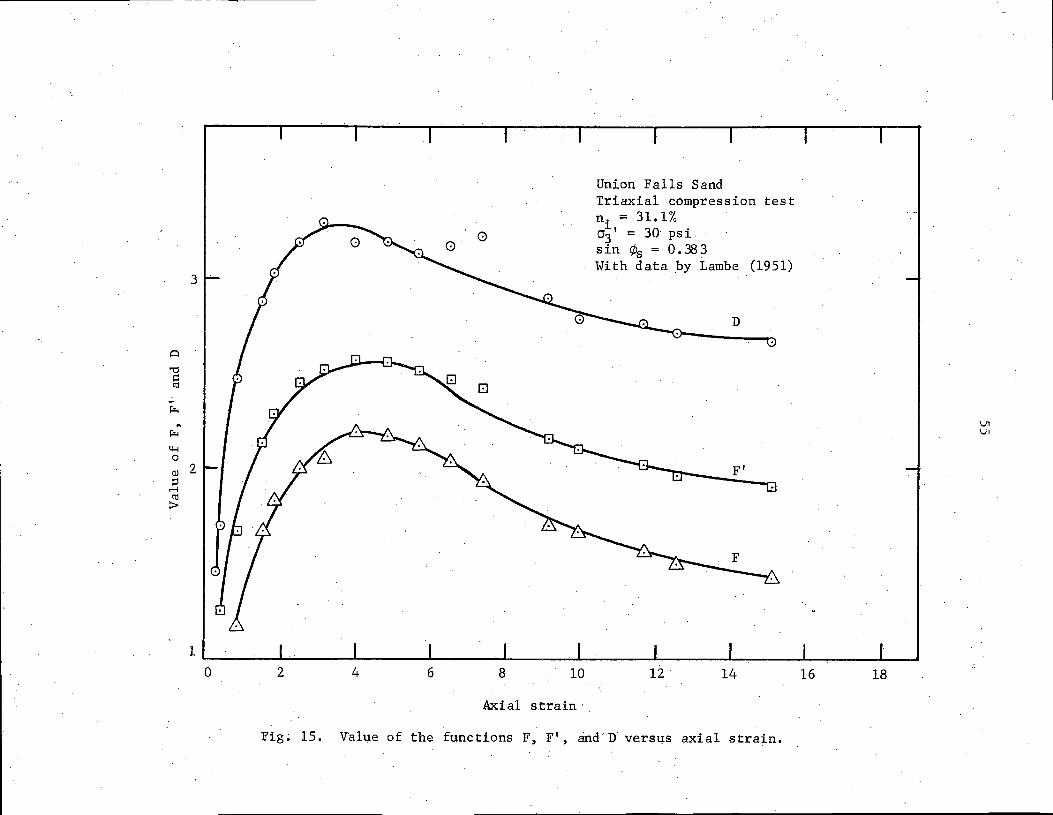
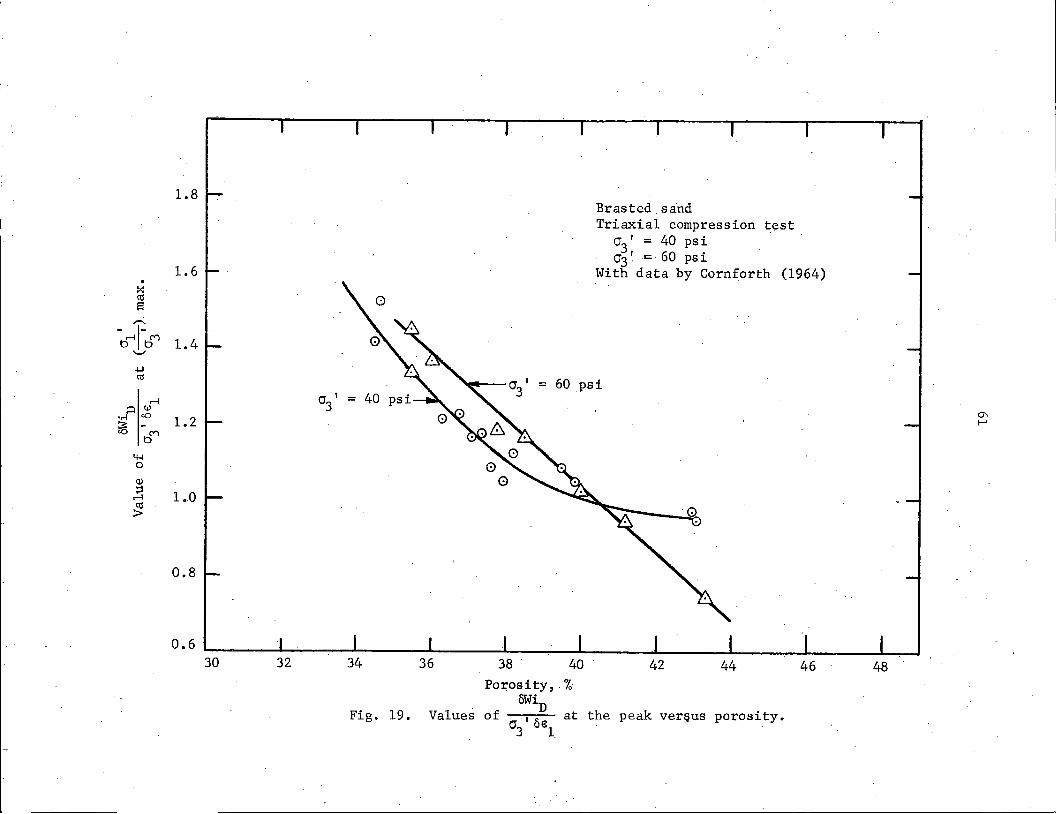
Values of the functions F, F', and D with respect to the axial
strain are plotted in Fig. 14 with data by Cornforth (1964). The
I functions F, F, and Dare defined by Eqs. (12a), (12b), and (12c)
respectively:
Let F oWif
a ' oe ' 3 1 (12a)
F' OWif
03 I Q €1 + of ' (12b)
and. D (12c)
The plot of the values of F against axial strain represents the changes
in the rates of absorption of internal work by friction as the test
progresses. The values of F' plotted against the axial strain represent
3
Q 0 0
1-1 0
-µ., 2 1-1 0
µ.,
~ 0 lJ1
<ll w ;:l
r-l r:o
Brasted sand :> Plane strain test n. = 39 ."4
1 a~' = 40 psi sin ¢s = 0. 408
(1964) With data by Cornforth
0 1 2 3 4
Axial strain, %
Fig. 14. Value of the functions F, F', and D versus axial strain.
-------------- ----
54
these changes plus additional internal work absorbed in friction due
to particle interference. The values of D plotted against the axial
strain represent these changes plus the work absorbed in dilatancy, and
in effect show changes in the rates of the total internal work cor
rected for the work done by the sample against the applied stresses.
An interesting feature of Fig. 14 is the amount of strain required
to achieve the maximum values of F and D within the sample. The
maximum value of the function D occurs at this peak value, and after
the peak it dropped rapidly. This indicates that the sample showed
maximum interference between particles at the peak. . Also to bring
about the highest possible number of sliding contacts within the sample,
this maximum interference is broken up, as shown by the increase in F.
After the maximum value of F has been achieved, F decreases at a faster
rate than D, indicating that the structure of the sample is now in a
looser state.
Similar features are shown in Fig. 15 with data by Lambe (1951).
However, there'is less difference in the amount of strain required for
F and D to develop their respective maximum. This may be explained by
the effect of end restraint on the deformational behavior of the sample.
That is, end restraint apparently decreases the "free" dilatant volume,
and changes the stress distribution within this "free" dilatant volume where the
term "free" volume refers to that part of the sample unaffected by end
restraint.
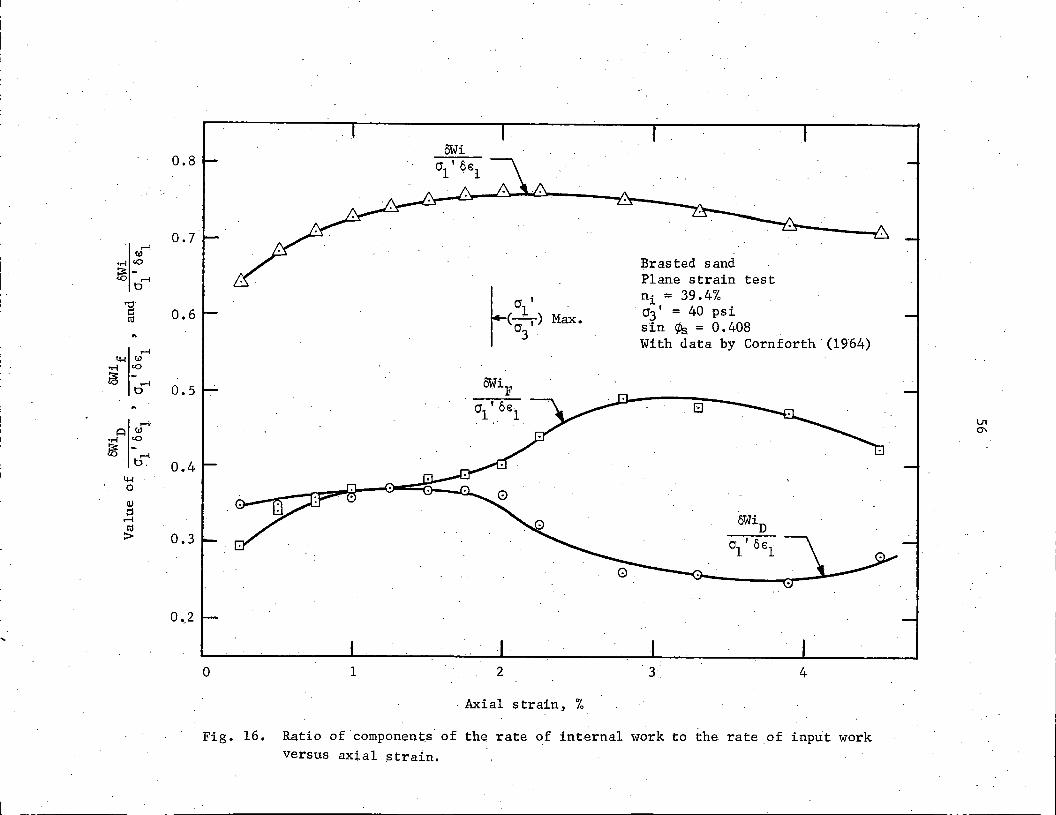
Figure 16 is a plot of the values of fMiD/ a1
1 6e1
, OWif/ o1
' ae1
,
and 6Wi/ 011 6e1 versus the axial strain for a plane strain test with
data by Cornforth (1964). The important feature of this graph is the
3
0
0
2 4 6 8 10
Axial strain ·
Union Falls Sand Triaxial compression test n. = 31.1% a~' = 30 psi s in ¢s = 0 • 38 3 With data by Lambe (1951)
D
12 14
Fig~ 15. Value of the functions F, F', and·D versus axial strain.
16 18
,...; (J)
•.-l <O
~ - ,...; t>
'O" c: ttl
,...; 4-! (J)
•r-1
~ c()
-
4-! 0
Q)
E ttl :>
II'
0.8
0.7
0.6
0.5
0.4
0.3
0 •. 2
~a' <,}I) Max. 3 .
oWiF
crl, oi:::i_
0 1 2
. Axial strain, %
Brasted sand Plane strain test ni = 39.4% cr3 • = 40 psi sin ¢s = 0.408 With data by Cornforth (1964)
3 4
Fig. 16. Ratio of components· of the rate of internal work to the rate of input work versus axial strain.
57
loop made by the functions oWiD/ crl I 0€1 and 6Wi/ crl I 0€1. The start .
of the loop, as seen in Fig. 16, is at the peak value. Then there is
a rapid increase in the values of 6Wif/cr1 ' oe1 with a corresponding
decrease of the values of 6WiD/cr1 ' oe1 • The cause of this loop
is the same as explained with reference to Fig. 14: namely, a break
down of particle interference is required to allow an increase in the ·
number of sliding contacts and, consequently, in the rate of internal
work absorbed in friction.
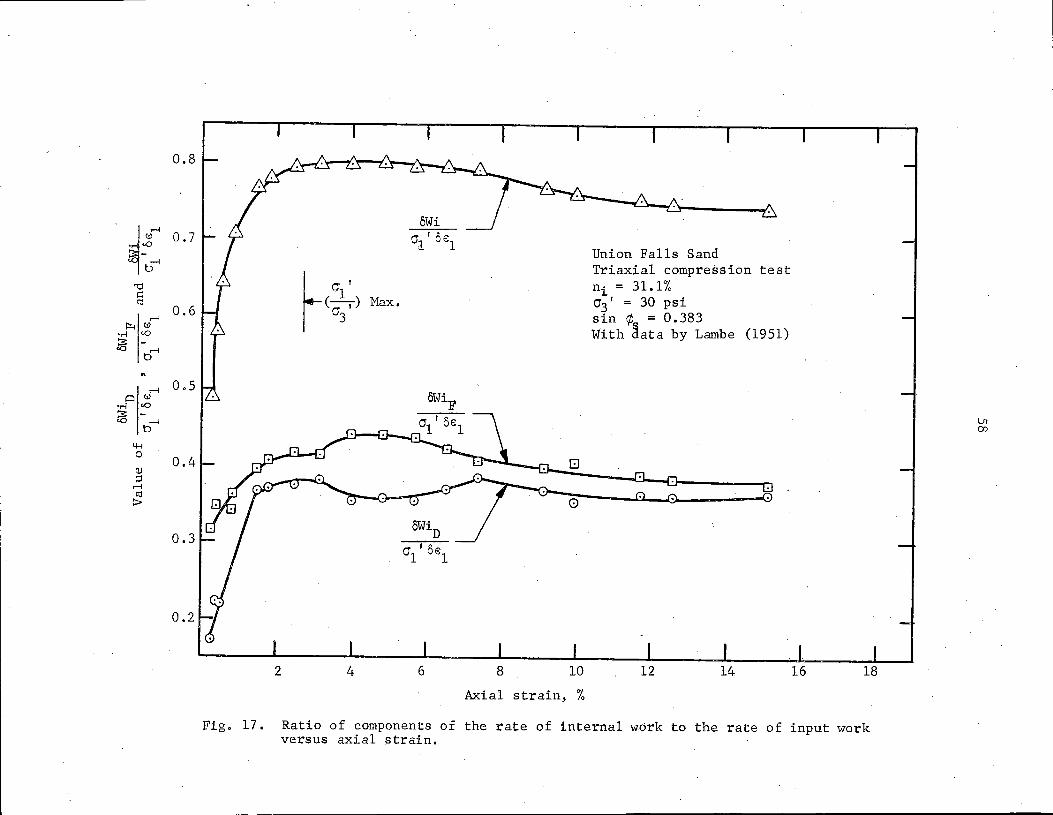
Similar features are shown in Fig. 17 with data by Lambe (1951).
Figure 17 allows one to follow the closing of the loop as the function
oWi/ 01
1 oe1
starts to decrease in rate with respect to axial strain.
One may hypothesize that the closing related to the appearance of a
slip surface al though the fonnation of such slip surface presumably
may start when either the function F or the function oWif/ crl I 0€1 has
reached a maximum value. Since both occur after the peak, one may
concur with Bishop and Green (1965) in concluding that the inhibition
or lack of inhibition of preferential slip zones is a factor of no
significance in determining the peak strength of granular materials.
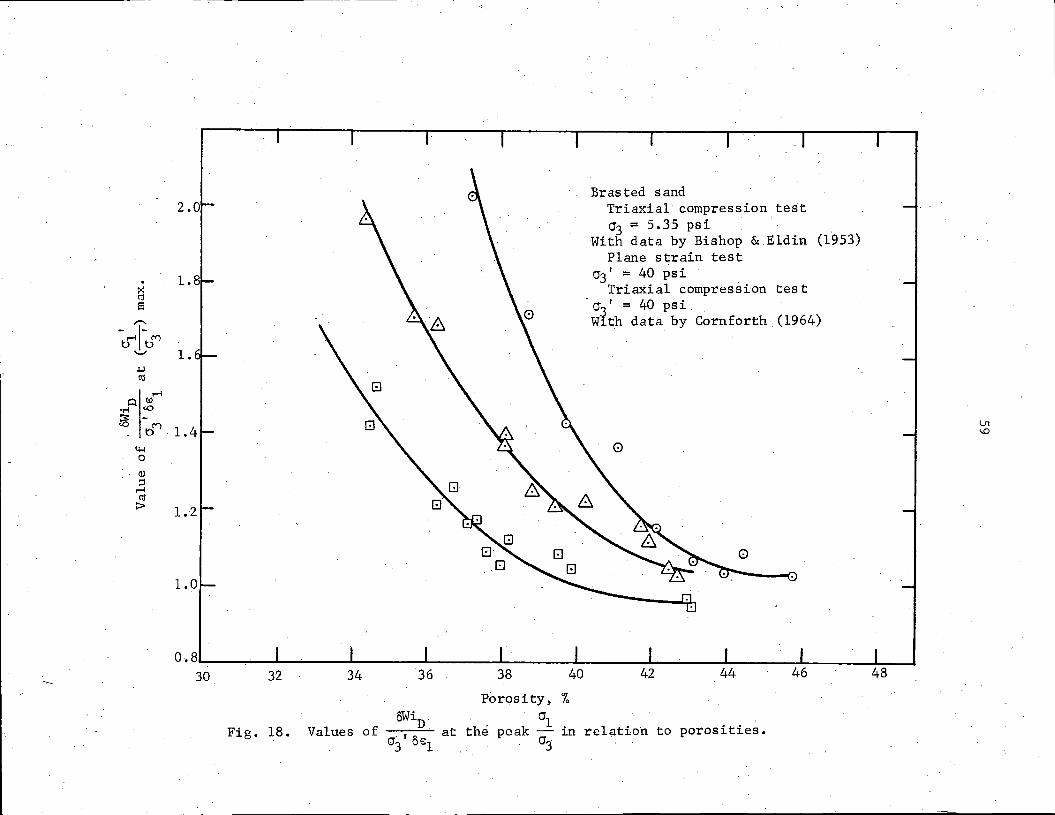
Figure 18 represents the relationship between the function 6WiD/
cr3
' oe1 and porosity on the Brasted sand with data by Cornforth (1964)
and by Bishop and Eldin (1953). The effect of type of shear test,
porosity, and level of confining pressure on the values of 6WiD/cr3 ' oe1
may be studied in this figure.
· It is obvious that increase in porosity decrease the values of
oWiD/ cr3 ' O€l this may be expected from the standpoint that loose soil
contract during shear to failure. The plane strain test perfonned with
0.8
~~f 0.7
~
"" i:: C\j
0.6 ,..;
~ w •.-! <O
~ -tr
,..; 0.5 i:::l w
•.-! <O
~ - ,..; b
4-l 0
0.4 (!)
::I ,..; C\j
:>-
0.3
0.2
6Wi 01' 0€1
Union Falls Sand Triaxial compression test
~ 0' ni = 31.1%
(CJ~ I ) Max. 03
1 = 30 psi sin cp = 0.383 With ~ata by Lambe (1951)
G
0
6WiD
O'l I 0€1
2 4 6 8 10 12 14 16 18
Axial strain, %
Fig. 17. Ratio of components of the rate of internal work to the rate of input work versus a~ial strain.
LJ1 OJ
2.0
. 1.8 @ e
1.
1.0
Fig. 18.
Porosity, %
Brasted sand Triaxial compression test a3 = 5.35 psi
With data by Bishop & Eldin (1953) Plane strain test
0'3 I = 40 psi Trimtial compression test
a~' = 40 psi With data by Cornforth (1964)
0
al peak -
03 in rel~tioh to porosities.
60
a minor princi~al stress of 40 psi showed higher values of 6WiD/cr3
1 oe1
in the whole range of porosities than the triaxial compression test
at same effective minor principal stress. This has been explained on
the basis of the larger amount of particle interferences.in the plane
strain test due to the imposed strain conditions. The effect of con
fining pressure is to decrease the values of oWiD/cr3
1 oe1 over the whole
range of porosities tested. However, this relationship was changed
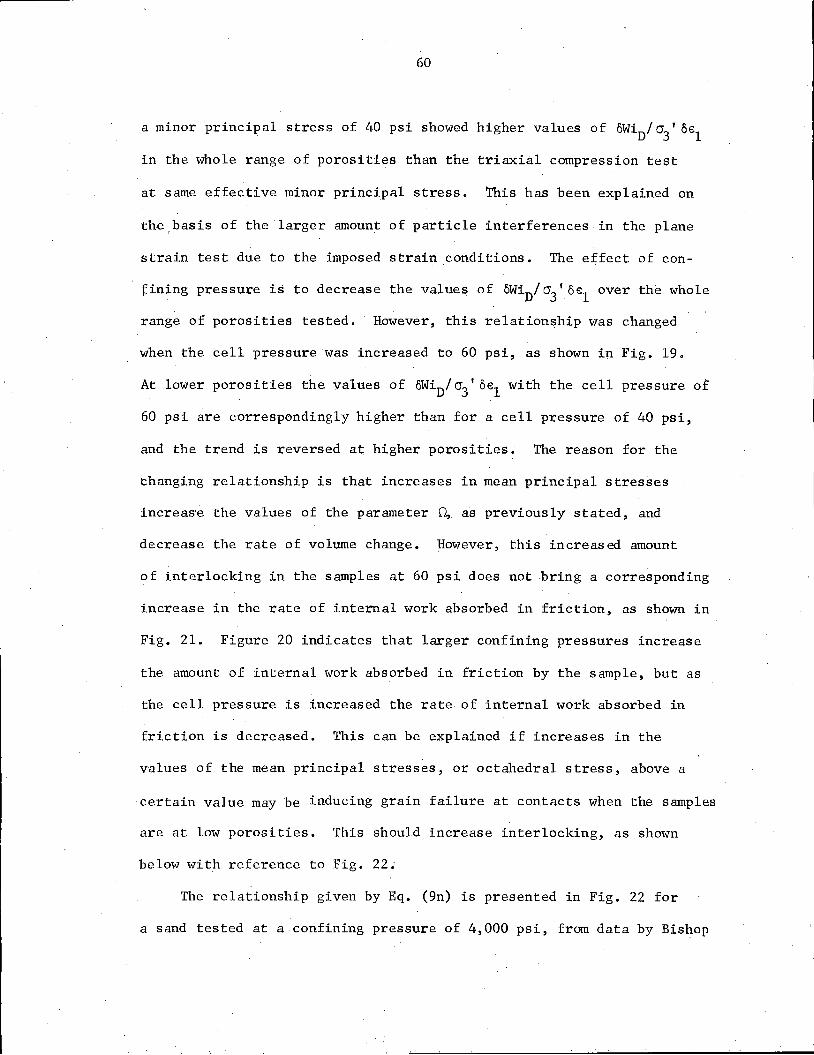
when the cell pressure was increased to 60 psi, as shown in Fig. 19.
At lower porosities the values of 6WiD/cr31 oe1 with the cell pressure of
60 psi are correspondingly higher than for a cell pressure of 40 psi,
and the trend is reversed at higher porosities. The reason for the
thanging relationship is that increases in mean principal stresses
increaS'e the values of the parameter 0, as previously stated, and
decrease the rate of volume change. However, this increased amount
of interlocking in the samples at 60 psi does not bring a corresponding
increase in the rate of internal work absorbed in friction, as shown in
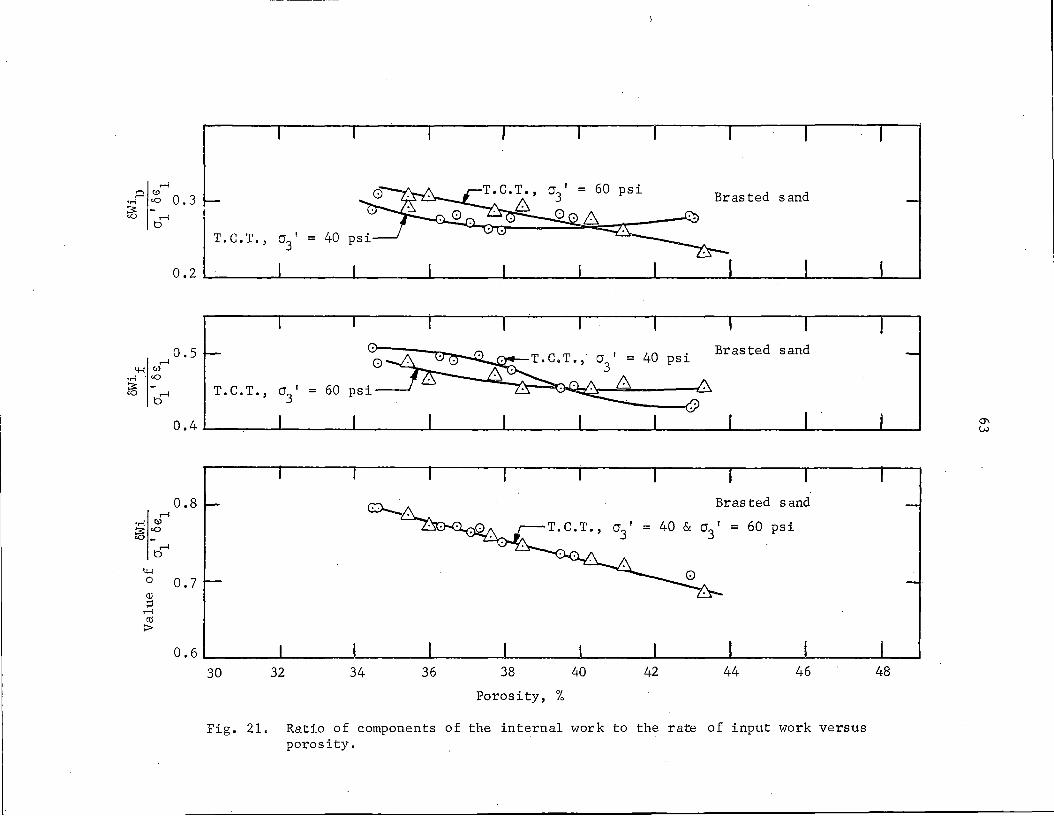
Fig. 21. Figure 20 indicates that larger confining pressures increase
the amount of internal work absorbed in friction by the sample, but as
the cell pressure is increased the rate of internal work absorbed in
friction is decreased. This can be explained if increases in the
values of the mean principal stresses, or octahedral stress, above a
certain value may be inducing grain failure at contacts when the samples
are at low porosities. This should increase interlocking, as shown
below with reference to Fig. 22~
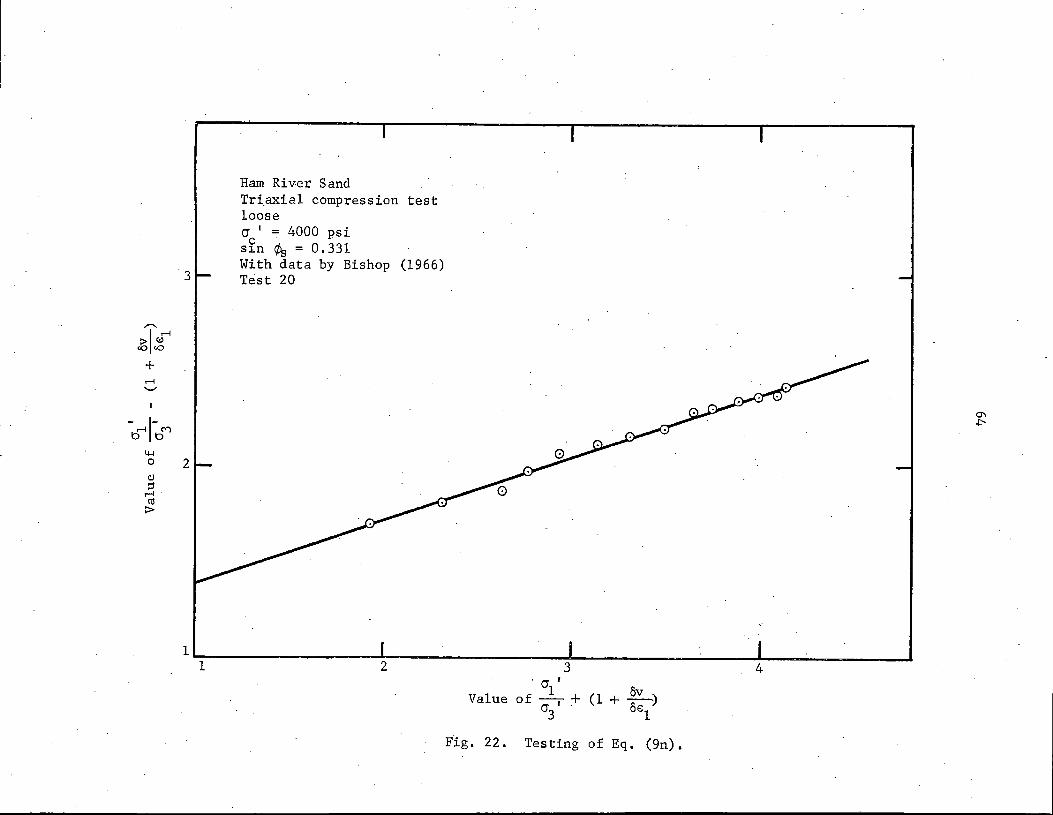
The relationship given by Eq. (9n) is presented in Fig. 22 for
a sand tested at a confining pressure of 4,000 psi, from data by· Bishop
1.8
1.6 . ~ c1l 13
,.--.
-oi1-be') 1.4 .._, .µ c1l
.--I &::! (!)
•r-1 G() 12 ~ - . G() be')
4-l 0
QJ
::s ,.,...! 1.0
c1l ::>
0.8
(j I
3
36
Fig. 19. Values
Brasted. sand Triaxial compression test
CJ I = 40 psi 31 60 . cr3 . =· psi
With data by Cornforth (1964)
38 40 42 44 Po~osity, .. %
oWiD of , ~ at the peak vereus porosity.
0'3 uel
46 48
r-l ~ w 0.3 ··r-l <O
-~ r-l t>
0.2
0.5 r-l
4-1 W· •r-l c.O
. 15 ~
0.4
0.8 r-l
w •r-l <O
~ -r-l t>
4-1 0.7 0
<l)
;::l ..-4
Ctj :>
o.6
0'3 I = 5.35 psi Brasted sand • S. T., 0'3
I. = 40 ps
.C~T., 0'3 I = 40
8T.C.T., 031 = 40 psi
Brasted sand
T.C.T., 0'3 I = 5.35
.S. T., 0: I = 40 3 .. (1 I = 5.35 psi 3 Brasted sand
T.C.T., 0 I = 40 3
30 32 34 36 38 40 42 44 46 48
Porosity, %
Fig. 20. Ratio of components of internal work to the rate of input work versus porosity.
(J\
N
.---l ~ w
•r-l . c.O
~ -~
.---l ·r-l w ti5 c.O
~ ~ 0
<l) ;:l
.---l co :>
0.5
0.8
0.7
0.6
psi Brasted sand
T. c . T. ' 03 I = 40
Brasted sand
T. c. T.' 03 I 60
Bras ted sand
o ' 40 & a ' = 60 psi 3 3
30 32 34 36 38 40 42 44 46
Porosity, %
Fig. 21. Ratio of components of the internal work to the rate of input work versus porosity.
48
,,,....._
>I~ c.O c.O
+ ...-l .,_..
- ...-l1- C"") b b
4-1 0
aJ ::i ...-l. m
;:::..
3
2
1. 1
Ham River Sand Tri.axial compression test loose cr ' = 4000 psi c . sin ¢s = 0.331 With data by Bishop (1966) Test 20
2 3 4 . <J I
OV ) Value 1 (1 + of -- + (J I . eel 3
Fig. 22. Testing of Eq, (9n).
65
(1966). The relationship is a straight line and the calculated
values of angle of solid friction and the parameter 0 are 19.3 degrees
and 1.057, respectively. The values of the angle of solid friction
and 0 for the same sand tested at a confining pressure or 40 psi with
data by Bishop and Green (1965) and presented in Fig. 9 are 24.1 degrees
and 0.395, respectively. Thus an extremely high confining pressure
produced a decrease in the angle of solid friction and an increase in
the value of 0. Bishop (1966) showed that grain failure occurred
within the sample at this high confining pressure, and showed that the
gradation of the medium to fine sand was changed to a gradation
corresponding to ·a silty sand. The calculated values of the angle of
solid friction and of the parameter 0 at the high confining pressure
do not represent true values, because the development of the theory
assumes no grain failure at the contacts. That is, the rate of work
internally absorbed by the sample in fracturing individual grains must
be added to the calculated rates of internal work absorbed in friction
and dilatancy. However, the extrapolation of the theory beyond its
limitations serves the purpose of explaining the mechanism of the
changing relationship from increases in cell pressure within a given
range.
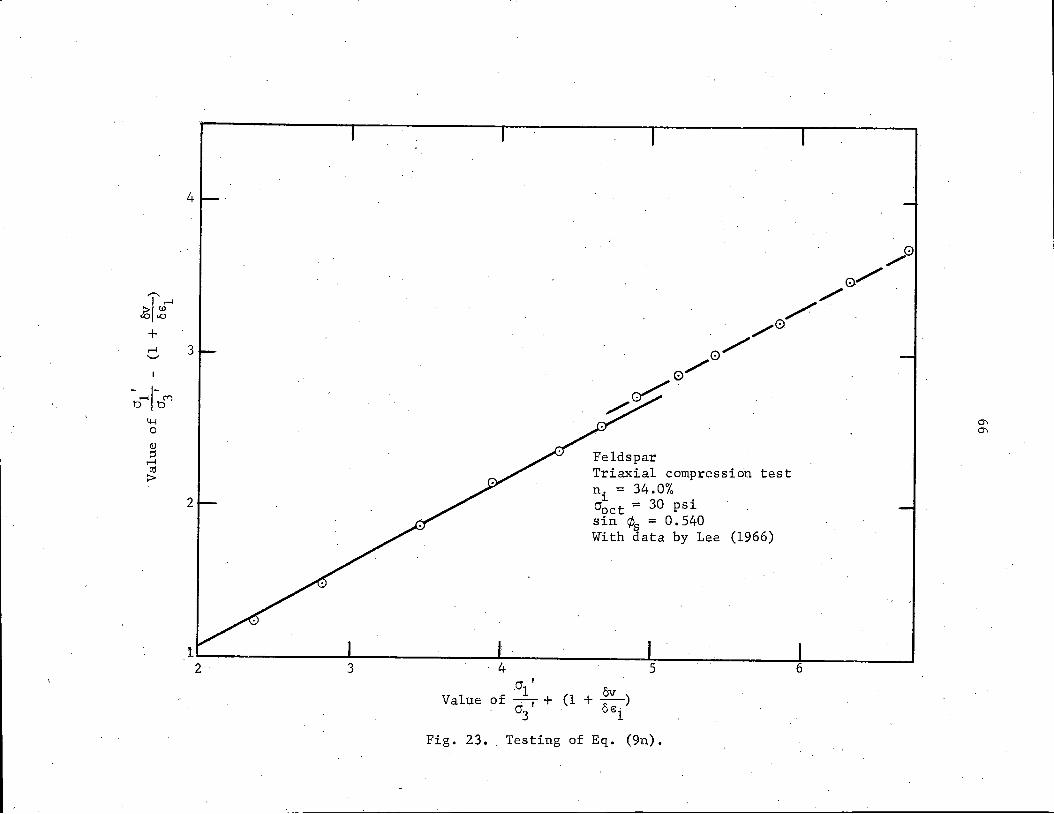
It may now be shown that if the mean effective principal stress
(or effective octahedral stress) is kept constant, the value of 0
must decrease. This is shown in Fig. 23, which represents the relationship
given by Eq. (9n) for a triaxial compression test on feldspar where
the e·ffective octahedral stress was kept constant and equal to 30 psi,
data are by Lee (1966). The calculated value of 0 is 0.04, which may
,,.....,
~1 w~ <O <O
+ ~ '-'
~~1-d'") ~ 0
(j)
::l ~ cu
:>-
4
3
2
Feldspar Triaxial compression test n. = 34.0% cr~ct = 30 psi sin ¢s = 0.540 With data by Lee (1966)
.crl' o Value of -.-, + (1 + 0: )
0'3 1
Fig. 23. Testing of Eq. (9n).
67
~ompared with a value of Q of 0.390 for a test on the same material
at a constant cell pressure equal to 30 psi also with data by Lee
(1966).
The first two point values corresponding to very small deforma
tions are not shown in Fig. 23, and fell below the solid line in
Fig. 23. The calculated values of the parameter Q for these points
gave high negative values, indicating that during the initial stages
of deformation the preferential mechanism of distortion is not by
sliding but rather by compression, which would explain the negative
values of 0.
68
SUMMARY
1. A theory was developed to allow the separate determination of
effects of the interparticle ~~and of geometric constraints ·------~----------,
among the particles on the shearing resistance and deformational
behavior of granular materials.
2. According to the theory the effect of interparticle friction may -·----·---·--· --·· ------·---.-~~.
be measured by the angle of solid friction. The calculated
angle of solid friction was found to be independent of the type
of shear test, stress history, porosity, and the level of the
confining pressure in the ranges cormnonly used in soil shear
testing. Th~~--°-i--.~-o~~~--... ~E~C:-~~o~-.-depends only on the nature -----....._,
of the particle surfaces.
3. The effect of the geometric constraints is measured by the parameter
D, which D was found to depend on the gradation of the granular
material, initial p~y, type o~--~hea~-~est, and the level
of the co~_~ssure.
4. The parameter 0 allowed the calculation of components of the rate
of internal work absorbed by the sample. The calculation of these
components and their changes throughout deformation allowed the
qualitative examination of the deformational behavior of granular
materials and justified the postulated mechanism of deformation.
~-~ --~~-~~\..) , ..... ....,..., V"'i:-....._ Ci... '1' '"'"\
69
PART II. SHEAR STRENGTH OF CRUSHED LIMESTONES
MATERIALS
Three crushed stones were selected as representative of Iowa State
Highway Commission-approved crushed stone for rolled-stone bases. One
is a weathered, moderately hard limestone of the Pennsylvanian system,
obtained from near Bedford, in Taylor County, Iowa, and hereafter re-
£erred to as the Bedford sample. The second is a hard, concrete -quality limestone of the Mississipian system, obtained from near
Gilmore City, Humboldt County, Iowa, and hereafter referred to as
the Gilmore sample; and the third is a hard dolomite of the Devonian ._______ system, obtained near Garner, Hancock County, Iowa and hereafter re-
ferred to as the Garner sample.
X-ray diffraction analysis (Hoover, 1965) of powdered representa-
tive samples showed calcite as the predominant mineral in the three
stones, but there was a considerable difference in calcite-dolomite
ratio, ranging from 25 in the Bedford stone to 1.16 in the Garner.
X-ray tests on Rel-insoluble residues showed no montmorillonite in any
of the samples, a small amount of vermiculite or chlorite in the Garner,
a predominance of illite in the Bedford and Garner samples, plus
kaolinite and quartz. Kaolinite in the Bedford stone was poorly
crystalline and quartz was almost nonexistent in the Gilmore sample.
The percent of insoluble residues were 10.9, 6.70, and 1.66 in the
Bedford, Garner, and Gilmore, respectively. Cation exchange
capacities and pH's of the whole samples were closely comparable.
Engineering properties of the three crushed stones are shown
in Table 2. The Bedford sample contains more gravel, less sand, and
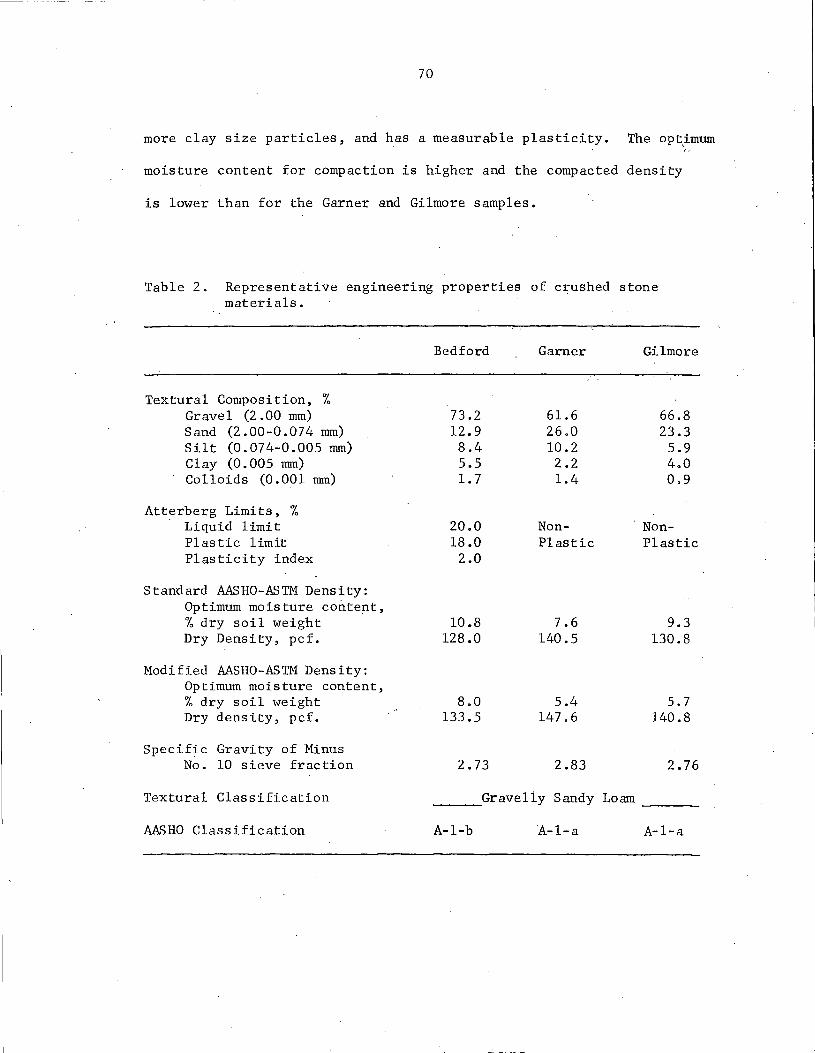
70
more clay size particles, and has a measurable plasticity. The optimum ',,
moisture content for compaction is higher and the compacted density
is lower than for the Garner and Gilmore samples.
Table 2. Representative engineering properties of crushed stone materials.
Textural Composition, % Gravel (2 .00 mm) Sand (2.00-0.074 mm) Silt (0.074-0.005 mm) Clay (0.005 mm) Colloids (0.001 nnn)
Atterberg Limits, % Liquid limit Plastic limit Plasticity index
Standard AASHO-ASTM Density: Optimum moisture content, % dry soil weight · Dry Density, pcf.
Modified AASHO-ASTM Density: Optimum moisture content, % dry soil weight Dry density, pcf.
Specific Gravity of Minus No. 10 sieve fraction
Textural Classification
AASHO Classification
Bedford
73.2 12.9 8.4 5.5 1. 7
20.0 18.0 2.0
10.8 128.0
8.0 133.5
2.73
Garner
61.6 26.0 10 .2 2.2 1.4
Non-Plastic
7.6 140. 5
5.4 147.6
2.83
Gravelly Sandy
A-1-b A-1-a
Loam
Gilmore
66.8 23.3
5.9 4.0 0.9
Non-Plastic
9.3 130.8
5.7 140.8
2.76
A-1-a
71
METHODS OF INVESTIGATION
For the laboratory measurement of shear strength under controlled
conditions of drainage and deformation, the engineer is largely dependent
on the triaxial test, or the cylindrical compression test. The test
may, however, be performed in various ways.
The type of test selected for this investigation was the iso
tropically consolidated-undrained triaxial test or CIU test. The term
isotropically consolidated is a misnomer but is widely used in the
soil mechanics literature. Isotropically consolidated means that the
soil is consolidated under an equal all-around pressure.
TRIAXIAL SPECIMEN PREPARATION
Previous studies have indicated that granular materials are more
suitably compacted using vibratory methods. This method was chosen
for the compaction of the triaxial specimens (4 in. by 8 in. cylinders)
to the standard Proctor density as determined by AASHO/ASTM procedures.
A syntron, Model V-60, electromagnetic vibrator table with a
constant frequency of 3600 vibrations per minute was used. The ampli-'
tude could be varied with a rheostat graduated from 0 to 100.
Hoover (1965) found that this size triaxial specimen could be·com
pacted to Standard Proctor density with little or no particle degradation
and segregation by using the following combination of factors:
1. Rheostat dial setting of 90, for an amplitude of 0.368 in •
. 2. Period of vibration of two minutes.
3. Surcharge weight of 35 pounds.
72
No moisture-density relationship was determined for the vibratory
compaction, the moisture content being obtained from standard Proctor
compaction. The dry density of the crushed stones was the controlling
factor in the preparation of the triaxial specimens. However,
vibratory compaction of the Garner limestone yielded a dry density
higher than standard Proctor.
Preparation of the triaxial shear specimens began by air-drying
sufficient crushed stones for a 4 in. by 8 in. specimen. Distilled
water was added to obtain the optimum moisture content. All mixing
was accomplished by hand tq prevent degradation and segregation of the
material. The mix was added to the mold in three equal layers, each
layer being rodded 25 times with a 5/8 in.-diarn tapered-point steel
rod. The surcharge weight of 35 pounds was placed on top of the
specimen and compaction was achieved in accordance with the previously
mentioned specifications.
After removal from the vibrator table, each specimen was extruded
from the mold by hydraulic jacking. The specimen was wrapped in a
double layer of Saran Wrap and aluminum foil, weighed, and placed in
a curing room, at near 75°F and 100 percent relative humidity until
testing time.
TRIAXIAL APPARATUS
The triaxial apparatus used in this investigation was designed
in the Engineering Research Institute Soil Research Laboratory and
built by the Engineering Research Institute shop. The unit consists
of two bays capable of testing two specimens simultaneously under
different lateral pressure and drainage conditions.
73
Rate of strain can be varied between 0.0001 and near 0.1 in.
per minute. The set rate is constant within 1/2 of 1 percent under
all loads, as produced through a combination of a Dynamatic Adjust-0-
Speed Motor controlled by a Dynamatic Silicon Controlled Rectifier,
Turner Two-speed Transmission, and Link Belt Worm Gear Speed Reducer.
A maximum axial load of 11,000 pounds can be transferred to a specimen
through a calibrated proving ring. The vertical deflection of the
specimen is measured with a dial gage extensometer.
Lateral pressures can be applied to a specimen within a plexiglass
cell by an air over liquid system or by air pressure only. This pres
sure can be varied between 0 and 100 psi and is held within± 0.3 psi
throughout a test by means of a diaphragm regulator.
Pore water pressures are measured at the base of the specimen
.through a 4 in.-diam porous stone by a Karol-Warner Model 53-PP pore
pressure device which operates on the null-balance principle, measuring
both positive (0 to 100 psi) and negative pore pressures (O to 15 psi).
Specimen volume changes can be obtained, when water is used in the
cell, to a precision of 0.01 cu in. This is determined by maintaining
a constant water level within the cell and measuring the amount of water
that flows from or into an adjustable graduated tube that is under
pressure equal to the applied cell pressure.
ISOTROPICALLY CONSOLIDATED - UNDRAINED TRIAXIAL TEST
Every specimen obtained from the curing room was weighed, measured,
and placed in the triaxial cell. Each specimen was sealed in a rubber
74
membrane of uniform 0. 025 in. -wall-thickness, and had a saturated
l/2•in.-thick corrundum porous stone on the top and bottom. The cell
was filled with water to a fixed height, and all-around pressure was
applied and drainage permitted through the base of the specimen
during the consolidation phase. Volume change measurements were made
at time intervals of 2, 4, 9, 16, 25, 36, and 49 minutes. A time of
49 minutes was found adequate for consolidation of all specimens.
After consolidation was complete, the specimen was sheared with the
drainage valve closed and the pore pressure device incorporated into
the system. The axial load was applied at a constant axial strain
rate of 0.01 in. per minute. Volume change, pore pressure, and axial
load (from proving ring deflection) were recorded at 0.010 in. intervals
tip to 0.250 in. vertical deflection, and then every 0.025 in. up to 1
in. or more of vertical deflection depending on the deformation
. characteristics of the specimen. The specimen was removed at the
end of the test, weighed, and three portions from the top, middle
and bottom were taken for moisture content determinations.
Composite specimens of each stone were tested at lateral pressures
of 10, 20, 30, 40, 60, and 80 psi.
Selected specimens also were tested with slight variations from
the above procedure. Bedford limestone specimens were tested under
a "repeated" loading condition whereby the specimen was first loaded
up to 0.075 in. of total axial deflection and then unloaded. After a
waiting period to allow for equilibration, the specimen was loaded
again to an additional 0.075 in. of axial deflection and unloaded.
After equilibrimn was again reached, the specimen was loaded as
previously indicated.
75
,,..../_,,-----~· - - - "-
Some specimens of the Gilmore limestone were loaded und(r "repeated" ) ,/ .,,, -------;•
loading, but with a different procedure. The specimen was axi~Ily
loaded up to the maximum effective principal stress ratio and then
unloaded. After equilibrium was achieved, the specimen was loaded
as previously indicated.
Calculation and reduction of the triaxial test data were ac-
complished by using an IBM 360 Computer program and a 1627 L-Comp
plotter through the Iowa State University Computer Center. These data
provided a print-out of all relations and a plot of the effective
stress ratio, volume change and pore pressure versus percent strain.
(.v~f'{ These data WttS then used for the analyses.
----------------------,,,,.,,....,,.--- -- ........ ....___
( TEST ERRORS -" '·'------- r-------~/
Nonuniformity of stress and deformation are by far the most
important sources of error since if deformation is localized, the
usual overall measurements are misleading. This can also lead to
errors in the calculated value of the deviator stress, as indicated
in the following paragraph. Nonuniformity may be introduced initially
in the preparation of the sample, but its main cause is friction at .....:::.:::=c:.~··--·-·
--.-....~·---
the end plattens, which will modify the values of volume change and
the slope of the stress-strain curve. Nevertheless the maximum
values of the stress ratio should agree regardless of testing with
friction or frictionless ends (Bishop and Green, 1965). Friction at
the end plattens will produce two elastic cones at the ends of the
sample, with the result that the middle zone will bulge more than the
end zones and the deformed sample will take on a barrel shape.
76
Errors in the calculated values of deviator stress are mainly
caused by piston friction and also by the wrong area correction, which
is related to the above-cited nonuniformity of deformation. The
errors involved become unacceptable for axial strains larger than 10 --·-----·.
percent of the initial height of the sample •. ---- - -- --- ·--------- - - - --~- -- ---""~------·-... -------- ----------
Axial strain is usually calculated from the axial displacements of
the piston measured relative to the initial position of the piston.
Errors in the measured axial strain are thus caused by friction in
the piston and bedding errors related to the initial positioning of
the piston.
The method used for calculating the volumetric strain is by
measuring the volume of water entering or leaving the cell. The main
sources of error are nonuniform deformation, evaporation, leakage and
membrane penetration. Evaporation and leakage are minor errors and can
be totally eliminated in tests of short duration. Errors due to membrane
penetration are related to the shape and size of the particle and to
nonuniform deformation.
All these errors can and should be minimized by modification in
the design of the cell and measuring instrumentation. However, most
of the above-mentioned errors were present in some amount in the
testing program, and must be kept in mind in evaluating the data.
77
DISCUSSION OF TEST RESULTS
z.0 Q(\_t<.S·-
\ ' ("".l
Equation (9n) was applied to selected results from the numerous
triaxial tests performed on crushed l.imestones. The selection was
based on variables which may have an influence on the behavior of
the crushed· limestones, such as initial void ratio, level of con----...____.-~------- ~ ... ----~--
fining pressure, s~ress history, and change in the gradation of the --_... ... ----.-......-------- -·~-
sample. These test results are shown in Figs. 24 to 30.
·Linear relations were found over a wide deformation range
regardless of the variables being investigated. Two features common
to all of Figs. 24 to 30 are first the existence of more than one
linear relation, and second, deviation from a linear relation during
the initial stages of deformation (less than one percent of the axial
strain).
The existence of more than one linear relation was previously
explained to be due to the use of "fixed" ends, which introduce
non-uniformity of strains within the sample.
Reasons for deviations from a linear relation during the initial
stages of deformation will· be advanced when references are made to
Figs. 32 to 36.
Solid Friction and Dilatancy
Table J is summary of selected test results. The calculated
value of the solid friction angle of the limestones was 34.2 degrees
regardless of initial void ratio, stress history, gradation and packing,
and level of confining pressure.
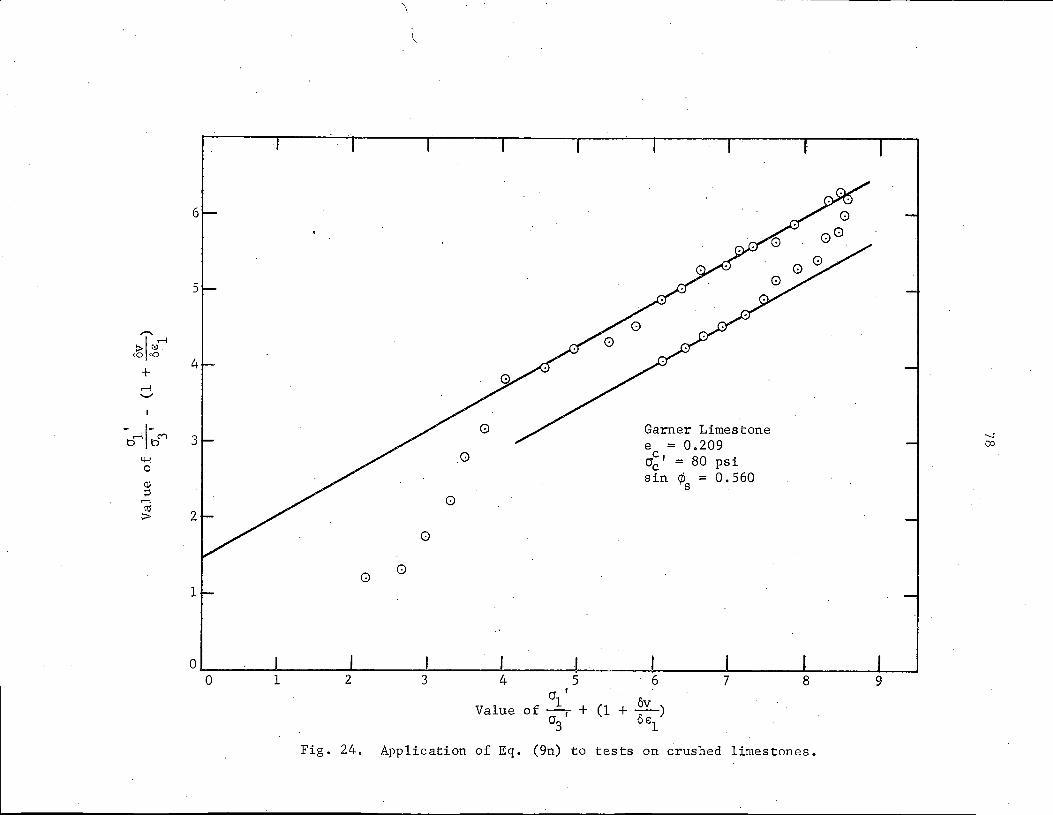
5
,,..._
>I~ '° '° +
4
..-! '-'
-b'1~C') 0 Garner Limestone '-.I 3 e = 0.209 00
~ 0 c, = 80 psi O'c 0
sin ¢s = 0.560 Q) ;:l
0 ..-! C'j
2 :;;.
0
0 0
1
0 0 1 2 3 4 5 6 7 8 9
O' I
(1 + ov ) Value 1 of -- + a r 0€1 3
Fig. 24. Application of Eq. (9n) to tests on crushed limestones.
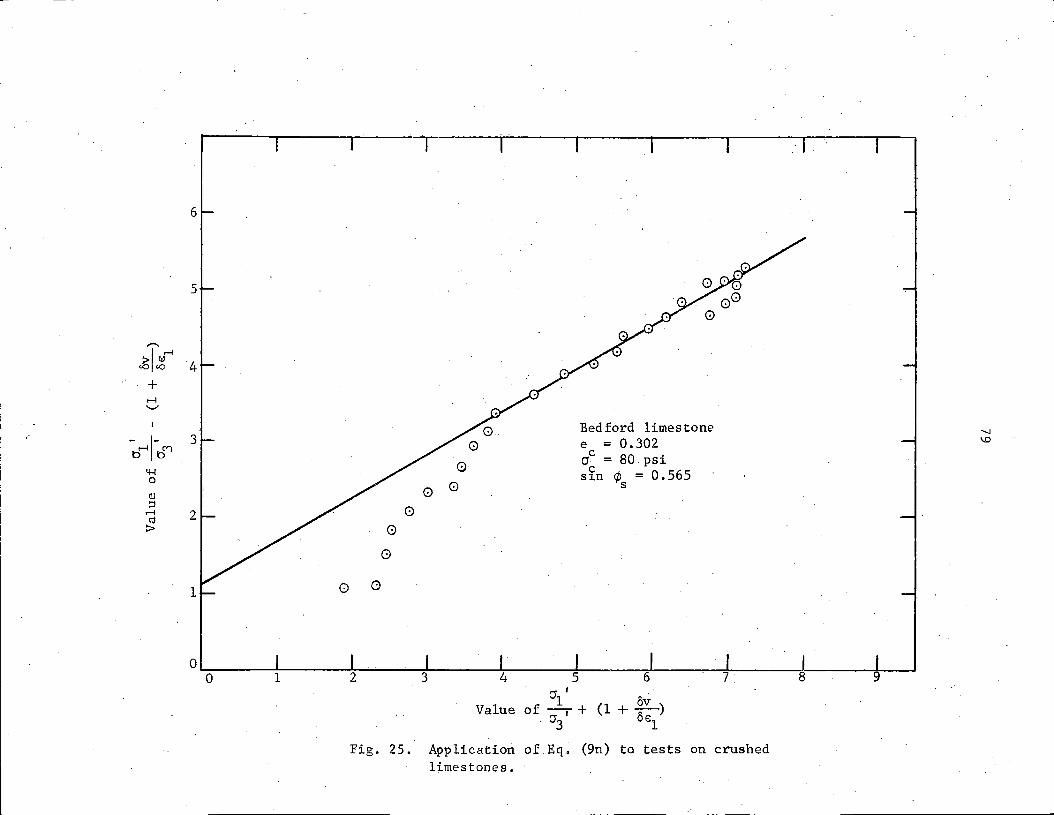
6
5
,-...
>jtI' <O <O 4
+ .-I ..._,,
Bedford limestone '-I
-tr,-bC"") 3 e = 0.302 \D
r:f = 80 psi 4-1 c 0
0 srn ¢ = 0.565
0 s
<l.l ::J
0 .-I 2 qj ;:::,. 0
G
1 0 0
0 0 1 2 3 4 5 6 7 8
cr r
(1 + OV ) Value of _l_+ cr r 0€1 3
Fig. 25. Application of Eq; (9n) to tests on crushed limestones,
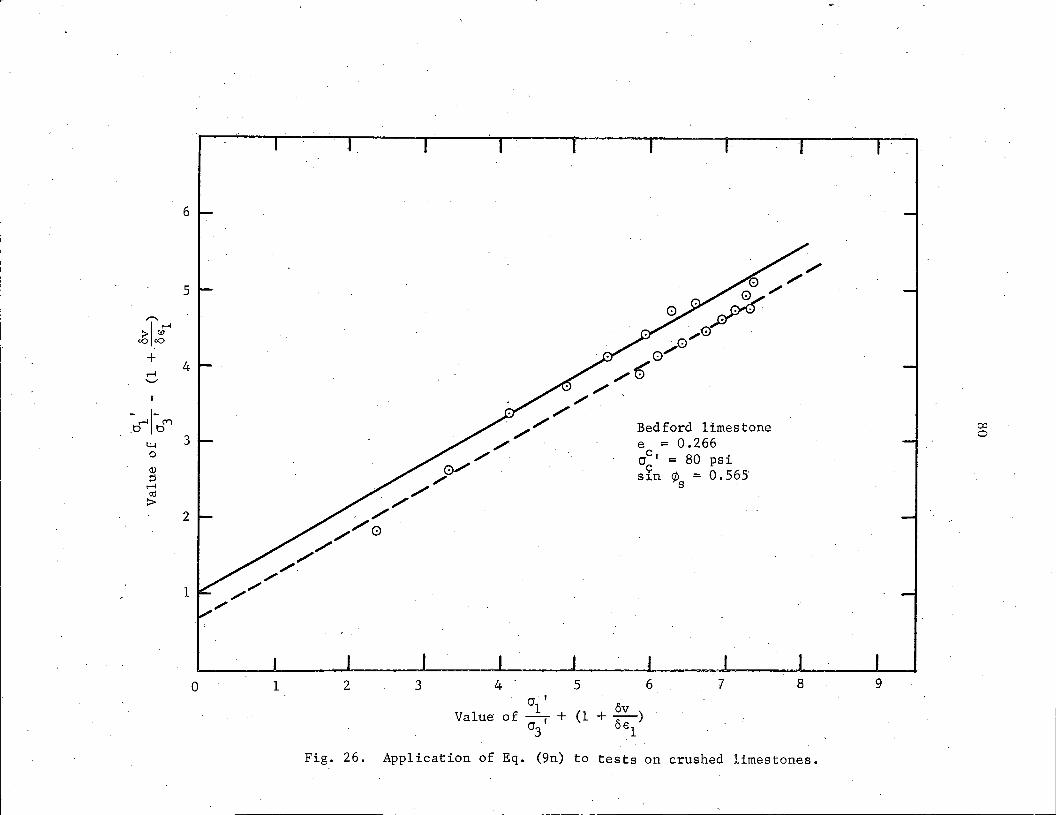
6
5
,,......
>I~ <O <O
+ r-l
4 '-"
-tI'1-0M 4-l 3 0
QJ ::l
r-l ctl
:>-2
1
0 1 2 3 4
Value
Fig. 26. Application of
5 . . I
crl (1 of-+ a' 3
Eq. (9n) to
Bedford limestone e = 0.266 rl • = 80 psi sfn ¢ = 0.565
s
6 7
+ ov ) 0€1
8
tests on crushed limestones.
9
co 0
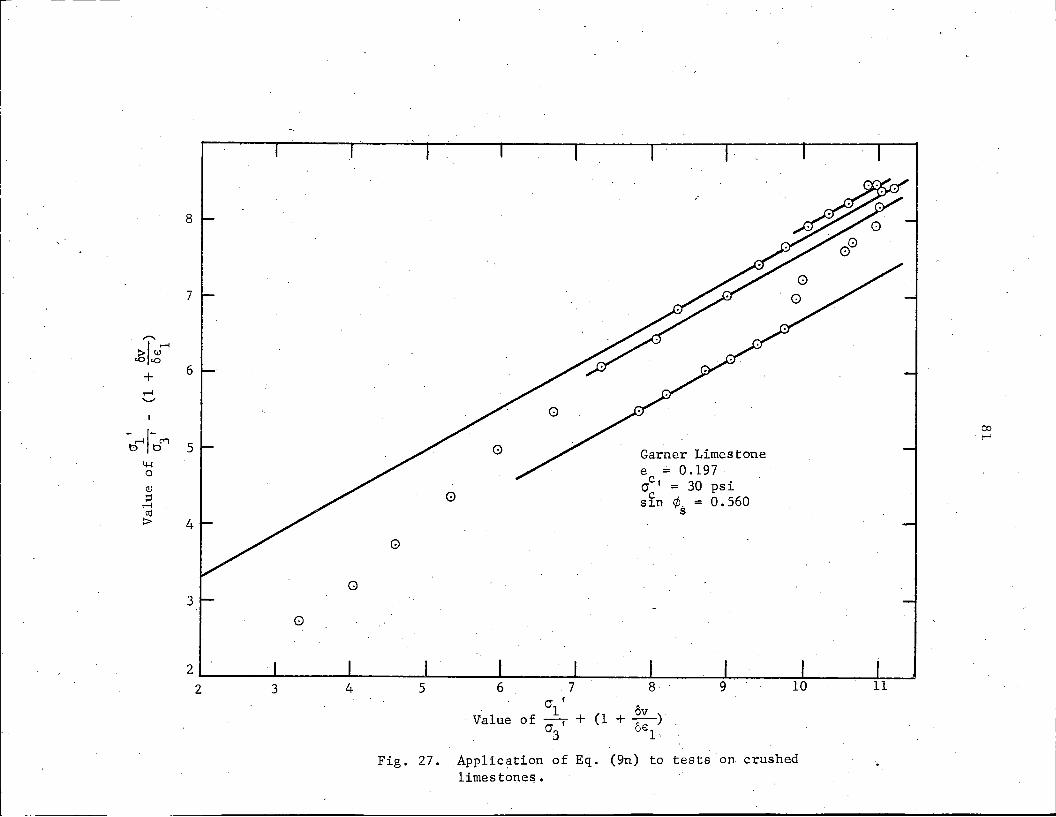
8
7
+ 6
5
4
Q
3
0
2
2 3 4
G
5 6 7 'J I
·Value of _l_ + 'J I
3
Garner Limestone e =0.197-crc' = 30 psi sln ¢ = O. 560
s
8 9
(1 + &v ) OE\.
10
Fig. 27. Application of Eq. (9n) to tests on crushed limestones.
11
co . !-'
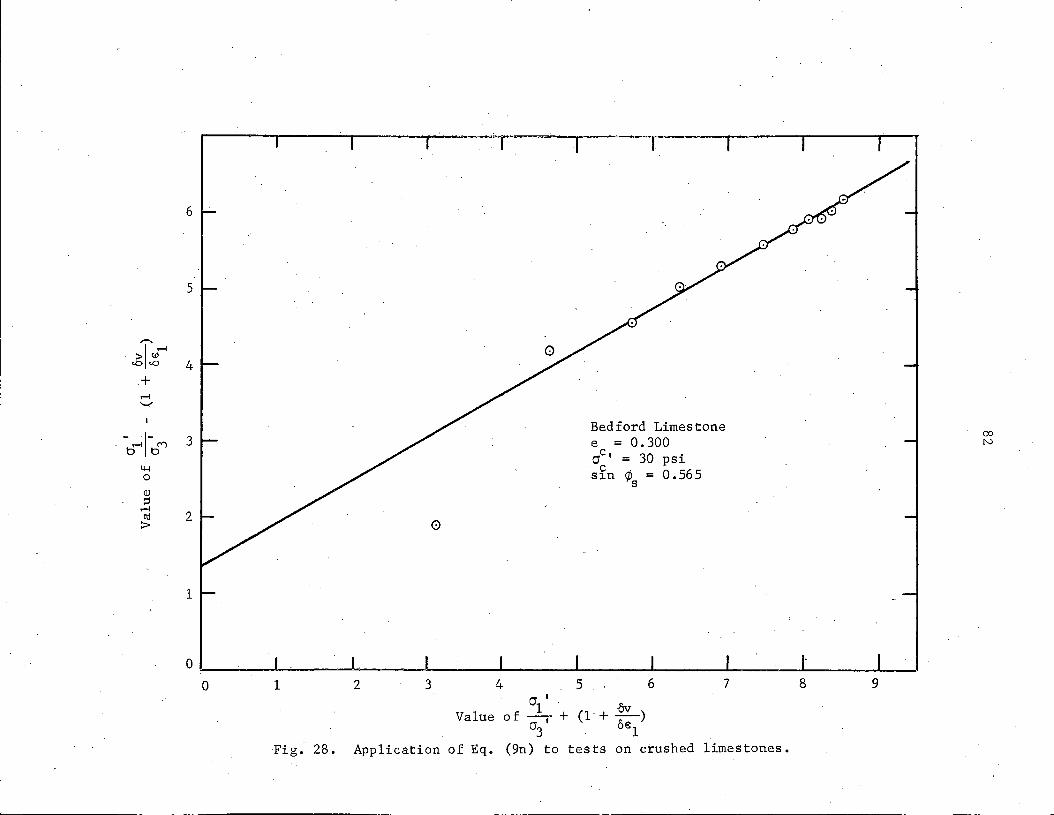
6
5
,...., >I (1)...-1
c.O <O 4 + ...-I '-'
. -tr1-t>CV"l Bedford Limestone
3 = 0.300 Cf)
e N
r:f' = 30 psi 4-l c 0 sin ¢s = 0.565 Q.)
::i ...-I co
::=-2
0
1
0
0 1 2 3 4 5 6 7 8 9 O' I
+ ov ) Value 1 (1 of -- + a' oel 3 Fig. 28. Application of Eq. (9n) to tests on crushed limestones.
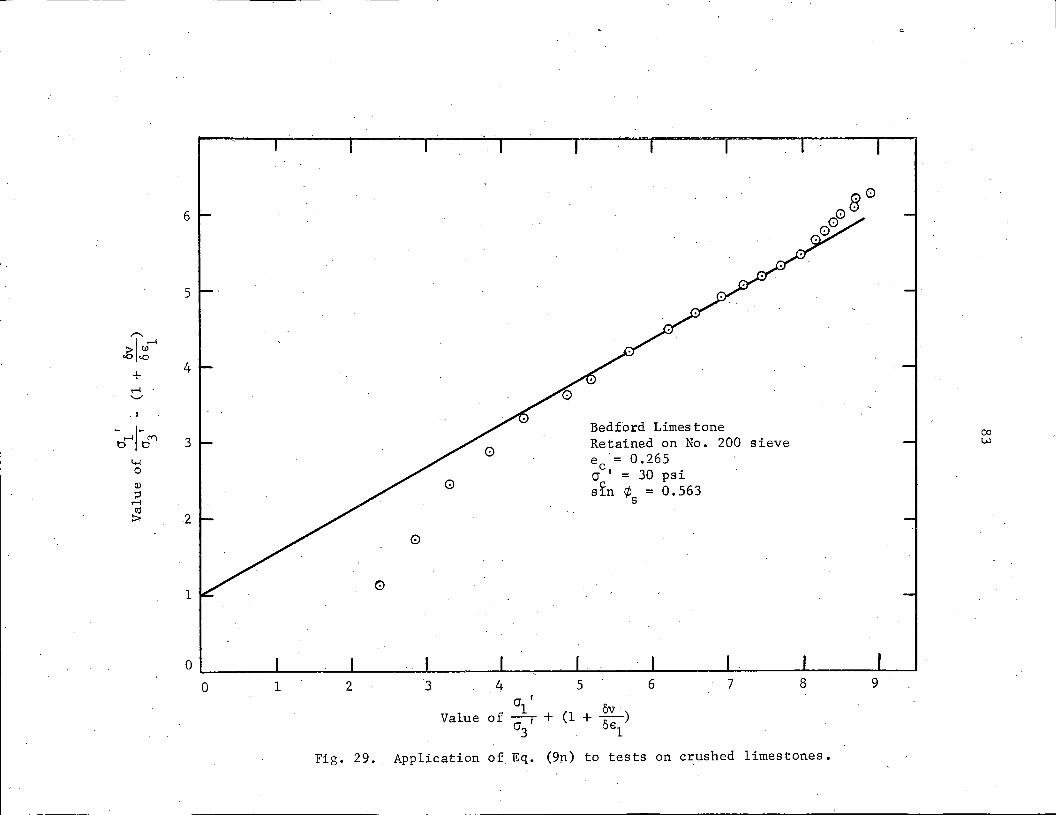
6
5
.-.. .gl~M
+ 4
M '-"
. I
-Mi-M t> 0 3
4-1 0
QJ ;::l M tiS
:> 2
1 0
0
0 1 2
Fig. 29.
3 4
Value of
Application of
5
Bedford Limes tone Retained on No. 200 sieve ec = 0.265 a 1 = 30 psi
c sin ¢ = O. 563 s
6 7 8 CJ I
(1 + ov ) _l_ + a ' oel 3
Eq. (9n) to tests on crushed limestones.
9
00 w
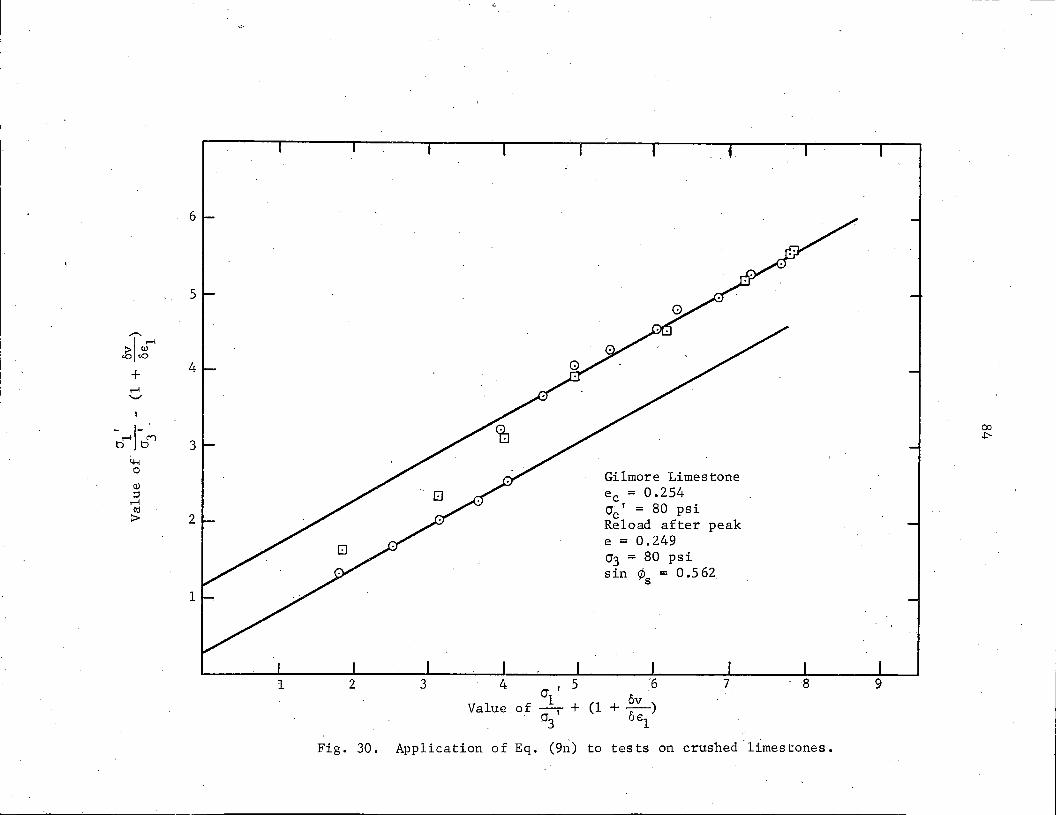
6
5
,,....._
>I er <O <O
+ 4
H .._,
~1-b~ CP
3 +--
4-1 0 Gilmore Limestone Q)
ec = 0.254 ::l H
Cd o' = 80 psi ::> 2 c
Reload after peak e = 0.249 03 = 80 psi sin ¢s = 0 .5 62
1
1 2 3 4 o' 5 6 7 8 9
Value 1 (1 + av ) of -- + o' oel 3
Fig. 30. Application of Eq. (9r{) to tests on crushed limestones.
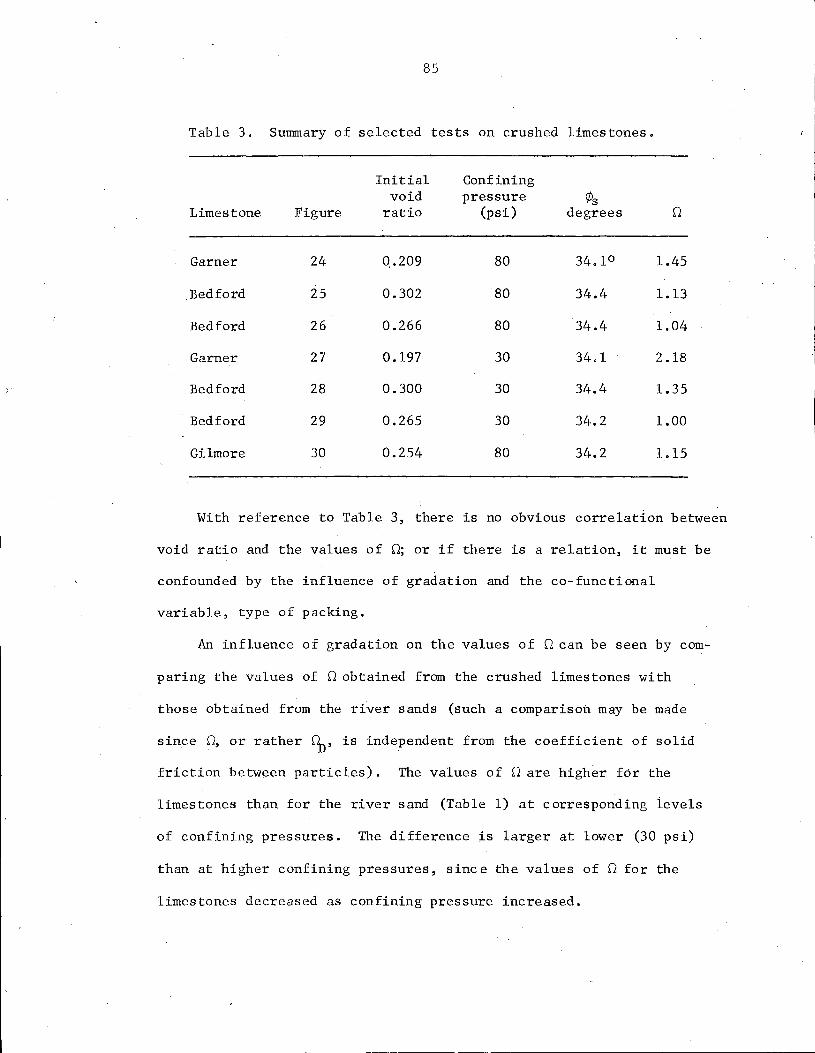
85
Table 3. Summary of selected tests on crushed limestones.
Initial Confining void pressure ¢s
Limestone Figure ratio (psi) degrees
Garner 24 Q.209 80 34.1° 1.45
Bedford 25 0.302 80 34.4 1.13
Bedford 26 0.266 80 34.4 1.04
Garner 27 0.197 30 34.1 2.18
Bedford 28 0.300 30 34.4 1.35
Bedford 29 0.265 30 34.2 1.00
Gilmore 30 0.254 80 34.2 1.15
With reference to Table 3, there is no obvious correlation between
void ratio and the values of O; or if there is a relation, it must be
confounded by the influence of gradation and the co-functional
variable, type of packing.
An influence of gradation on the values of 0 can be seen by com-
paring the values of Q obtained from the crushed limestones with
those obtained from the river sands (such a comparison may be made
since 0, or rather °n' is independent from the coefficient of solid
friction between particles). The values of 0 are higher for the
limestones than for the river sand (Table 1) at corresponding levels
of confining pressures. The difference is larger at lower (30 psi)
than at higher confining pressures, since the values of Q for the
limestones decreased as confining pressure increased.
86
The larger values of 0 obtained from limestones compared to river
sands may relate to the larger range in particle sizes, which could
tend to increase the amount of particle rearr.angement by rolling. That
is, small particles in the crushed limestones may act as rollers between
other individual particles or groups of particles. This effect would
be reduced by increasing the confining pressure~ due to an increase
in the number of "fixed" contacts within. the assembly. · That is indi
cated by comparing the values of 0 given in Table 3 for Figs. 28 and 29.
From Fig. 28, 0 = 1.35 for the whole Bedford sample tested at a confining
pressure of 30 psi; from Fig. 29, 0 = 1.00 for a Bedford sample tested
at the same confining pressure, but with the particles passing a US No.
200 sieve previously removed by dry sieving. This latter sample had
a lower initial void ratio than did the former sample.
The stress history did not affect the values of 0 or the linear
relation, as shown in Fig. 30. The effect of stress history was
studied by unloading the sample after the maximum value of 011 /03
1 was
reached and subsequently loading the sample to this maximum value.
Deformation Stages
Figures 31 to 35 show the ratio of the rate of internal work ab
sorbed either in friction or in dilatancy to the rate of gross work
input (represented by the product a1 'oe1), as related to percent of
axial strain. A feature connnon to all of the Figs. 31 to 35 is the
increase of the frictional work ratio oWif/ crl I 0€1' followed by sudden
decreases during the initial stages of deformation, with this cycle
being repeated to a lesser extent as the deformation increased. This
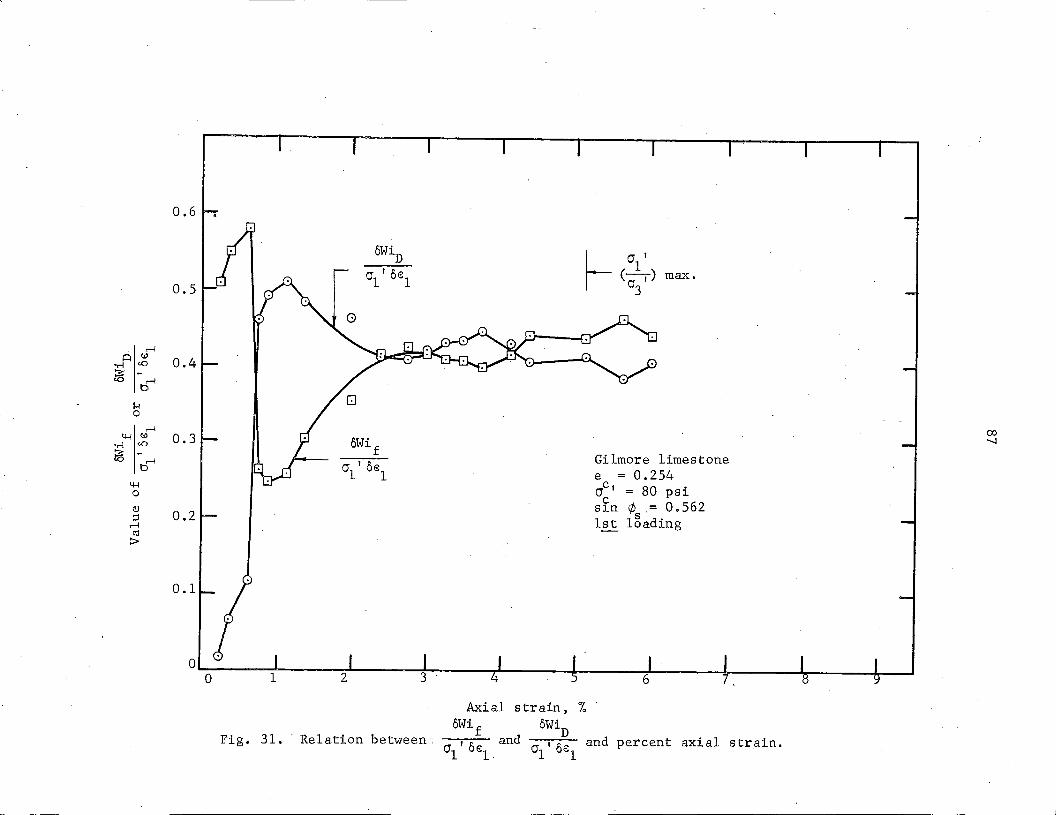
0.6
0.5
,....{
i:::l w 0.4 •r-1 <.O
~ -,....{
b
1-l 0
,....{
4-l w 0.3 •r-1 <.O
~ -tr
4-l 0
Q)
::l 0.2 ,....{
cu ::>
0.1
oWif
C\ I OE:l
Axial strain, %
0 I
1 (O')
3 max.
Gilmore limestone e = 0.254 rJC I = 80 psi c sin ¢ = 0.562
1st i3ading
oWif oWiD Fig. 31. ·Relation between , J: and , i: and percent axial strain.
crl uE:l. crl uE:l
(X)
-...J
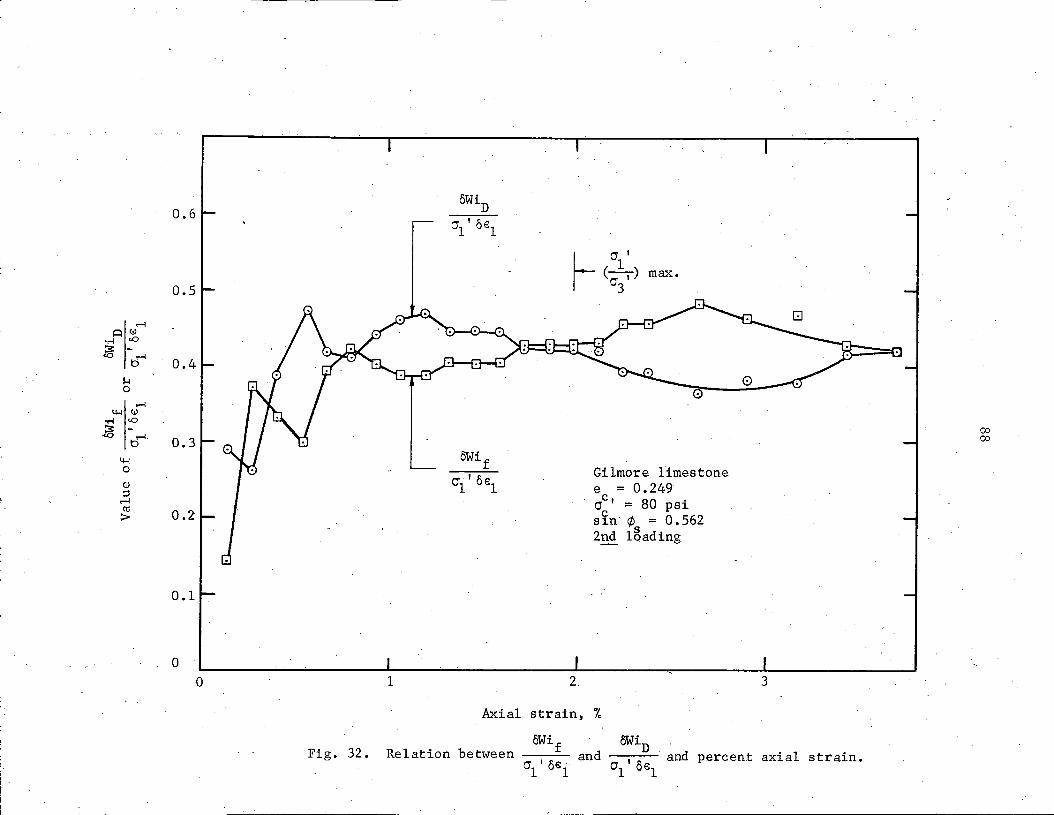
0.6 oWiD
crl' oe:l
~ CT I
1 <o:-i) max.
0.5 3
.--l ~ (i)
•.-! <.Q
~ ~ 0.4
1-1 0 0
.--l 4-1 (i)
•.-! <.Q
00 .~ -00 ~· 0.3
4-1 oWif Gilmore limestone 0
0"1 I 0 E:l Q) e = 0.249 ::s c, 80 psi .--l cr = Cd 0.2 s ln · ¢ = 0. 562 :>-
2nd l&ading
0.1
0
0 1 2. 3
Axial strain, %
Fig. 32. OWif oWiD
Relation between and and percent axial strain. crl, oe:l crl' oe:l
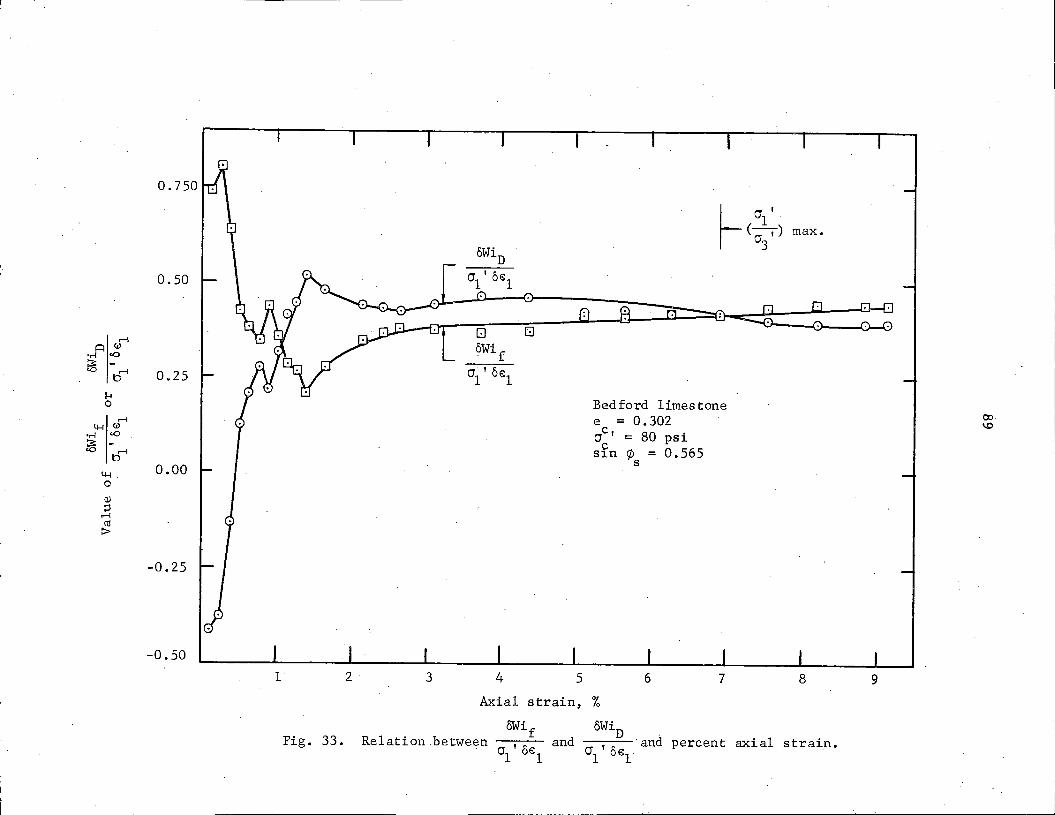
0.50
...-! ~ (!)
•r-1 c.O
~ ti" 0.25 1-1 0
...-! 4-l (!)
•r-1 c.O
~ -t>.-!
4-l 0.00 0
Q)
;:I .-I cu
::>
-0.25
-0.50
1 2
Fig. 33.
3
D G oWif
0'1' oi;;l
4 5
Bedford limestone e = 0.302 crc' = 80 psi c sin ¢ = 0.565
s
6 7
Axial strain, %
a' (--1.,-) max.
0'3
8
oWif oWiD Relation between~ ,
0 and , and percent axial strai.n.
O'l €1 O'l oel
9
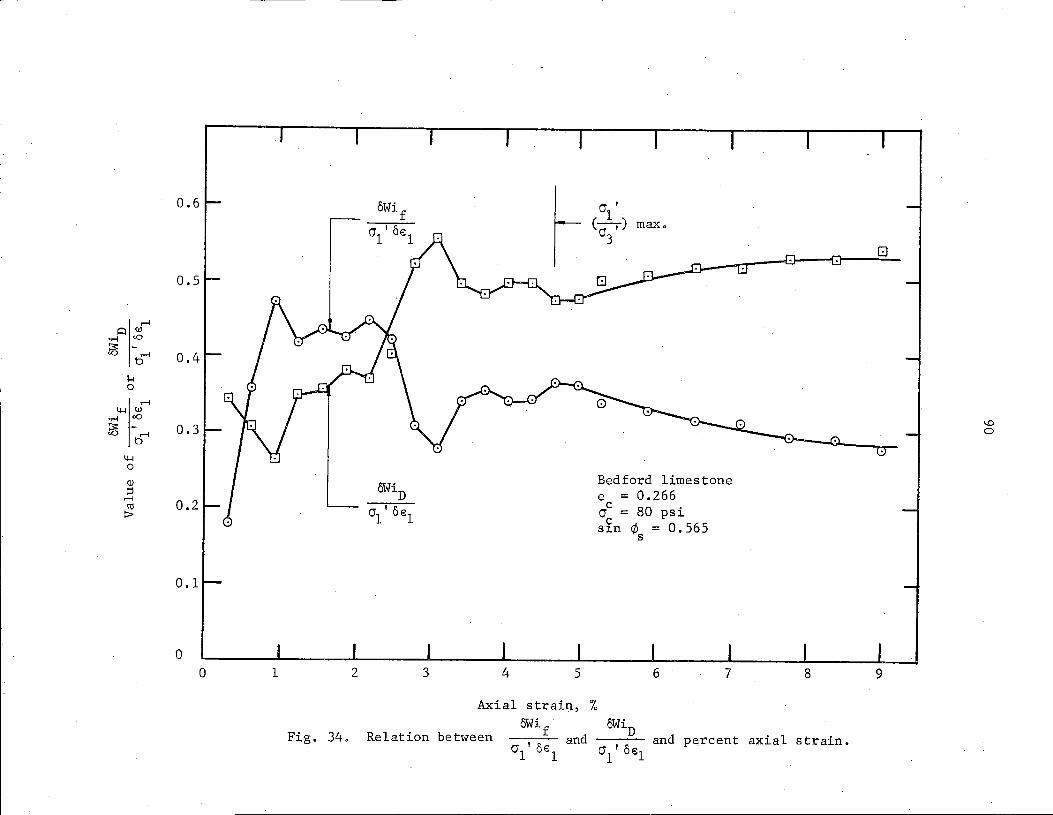
0.6
0.5
.--! ~ (i)
"M <O
~ -c 0.4 1-l 0
.--! ~ (i)
"M <O
~ - 0.3 c ~ 0
Qi
::l .--!
0.2 cu :::=-
0.1
0 0 1 2
Fig. 34.
CT I oWif
~ 1 01' 0€1
(O') max. 3
oWiD
crl' 0€1
3 4 5
Axial strair)., %
oWif Relation between , and
crl 6€1
Bedford limestone e = 0.266 crc = 80 psi c sin ¢ = O. 565
s
6 7 8
oWiD and percent axial strain.
crl' 6€1
8
\.0 0
9
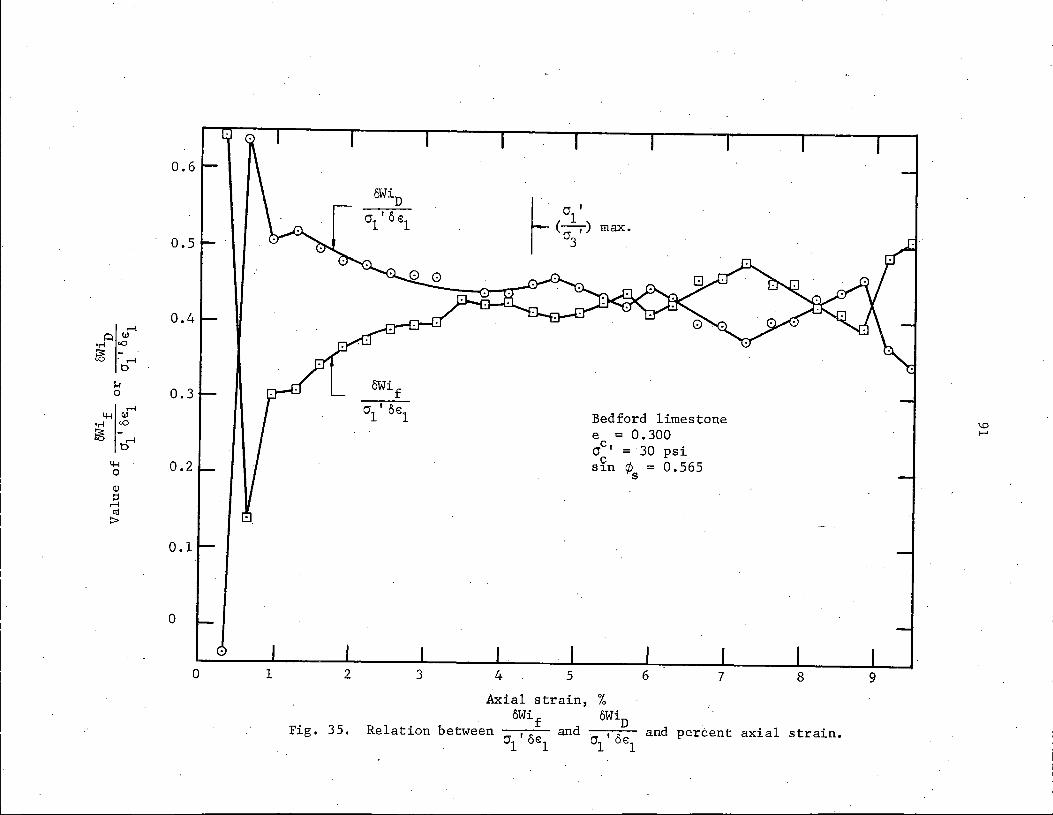
0.6
0.5
0.4 ...-!
i::i w "M c()
~ -. ...-!
b
$.f oWif 0 0.3 ...-! 01
1 eel Bedford limestone 4-1 w
\0 "M c()
I-' ~ - e = 0.300 ~ O'C I = 30 psi c ¢ = 0.565 4-1 0.2 sin 0 s
Q)
;:l ...-! m :>
0.1
0
0 1 2 3 4 5 6 7 8 9
Axial strain, %
35. Relation between oWif
and oWiD
and percent axial strain. Fig. O'l I OE:l O'l I OE:l
92
is accompanied by inverse trends in the dilational work ratio
oWi DI 0 11 oe1 .
The initial increase in the values of 6Wif/o1
• oe1
suggests an
initial sliding between individual particles or groups of particles.
Thus, deformation begins the moment that the ratio cr1
'/cr3
• exceeds
unity. This deformation will consist of relative motions due to
rolling .and sliding among the particles, as reflected on increases
of both 6Wi/ a1 ' oe1 and oWiD/ 0 11 oe1 • Since instantaneous relative
motions among all the particles within the assembly are not possible;
there are four possible dissimilar actions between individual particles
or groups of particles; namely, sliding, rolling, rotation, or breaking
of the contact.
Certain number of contacts within the assembly are fixed, thereby
forming instantaneous rigid groups of particles. Sliding therefore
occurs only at the boundary surface of such groups, and all the
contacts on the boundary surface must slide. Allowing a given group
of particles to slide for a short distance before sliding ceases
implies that the restraints produced by other groups must be such as
to allow the motion to occur, i.e. the restraining contacts temporarily
become rolling contacts, sliding contacts, or disappear (that is,
break). Formation of new groups of contacts causes the slide of the
original group to be completely arrested, and favors the formation of
increased number of sliding contacts as reflected in increases of both
6Wi/ 011 oe1 and oWiD/ 01
1 oe1 • The continuous increase of oWi/ 01
1 oe1
during the initial stages of deformation implies that slides are re
stricted to very small groups of particles.
93
Eventually the number of sliding contacts is increased, larger
groups of particles slide within the assembly, producing a sudden
decrease in the ratio oWif/a1 • oe1 with a corresponding sudden increase
in the ratio oWiD/ al I 0€1. Still the slides between larger groups
of particles must be arrested before they become catasgrophic (that
is, formation of slip surface); most li~ely when a larger group of
particles slides, the portion of the stresses carried out by this
group is transferred to adjacent groups, inducing particle rearrange
ments and a sudden increase in the ratio oWiD/a1 • oe1
and the cor
responding decrease in the ratio oWif/011 oe1 • The arresting of the
slide of a large group of particles is shown to have been accomplished
by subsequent increase in the ratio oWif/a1 ' oe1 . This partial col
lapse within the assembly during the initial stages of deformation is
the reason for the deviation from a linear relation between the terms
given in Eq. (9n).
The postulated mechanism of deformation is not altered by re
loading after the maximum value of a1 ' I a3
' is .reached, as shown in Fig.
32. Increases in density and confining pressure did not alter the
above postulated mechanism, as shown in Figs. 33 to 35.
The behavior during the initial deformation stages, for which a
low value of the ratio o-11 /03
1 was applied, is probably much the same
. as occurs during compaction of a granular assembly. Further densifica
tion can only be achieved by sliding between group contacts and sub
sequent particle rearrangement to allow the formation of new groups
and different sets of sliding contacts. The amount of energy required
for further densification increases as the relative proportion of
94
possible sliding contacts increases. Thus, vibrational methods of
compaction are most successful in densification of granular materials
because the process is to break the contacts and reduce the amount of
sliding involved while promoting particle rearrangement by rolling
and rotation.
Maximum Stress Ratio and Initial Void Ratio
Figure 36 shows the relation between the maximum value of cr '/cr' 1 3
and the initial void ratio for the three stones at different confining
pressures·. However, the slope of this linear relation decreases as
the confining pressures increases, and becomes independent of the initial
void ratio at a confining pressure of 80 psi in the case of the Bedford
samples. This suggests that the influence of the initial void ratio
is confounded with the effect of the gradation and type of packing,
since a different relationship was obtained for the Garner and Gilmore
stones (Fig. 36).
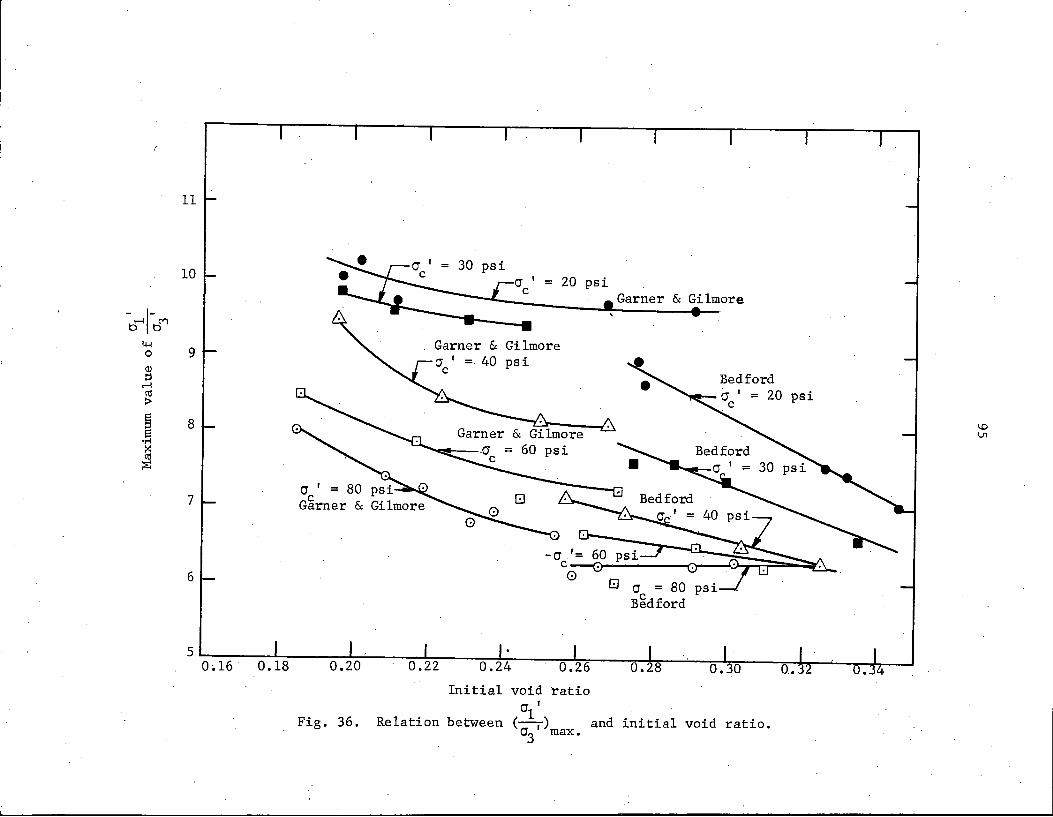
11
10
-b...-11-bC"'l
4-1 0 9 <!) ;:I
..-l t1! :>
s 8 s •r-1 :< t1!
;:El
0 I = 80 7 G~rner &
6
5 0~16 0.18 0.20
Fig. 36.
0.22
Relation
30 = 20 psi
Gilmore psi
0.24 0.26
Initial void ratio 0 I
between 1 and ( cr3
1 )max.
Garner & Gilmore
Bedford = 20 psi
cr = 80 B~dford
0.28 0.30
initial void ratio.
0.32
96
CONCLUSIONS
1. The theoretical equations developed in this report allowed
the determination of the angle of solid friction between particles which
was found to depend solely on the nature of the particle sur.face.
2. The separation of the frictional and dilational components
of the shear strength of granular materials qualitatively corroborated
the postulated mechanisms of deformation.
3. The influence of variables such as void ratio, gradation,
packing, level of confining pressur.e, stress history, and type of
shear test, on the shear strength of granular material was reflected
C\ I --:-:> l -e in the values of the parameter O. :::::.-\1us l"-.c.....\-lc:. "
4. The determination of the coefficient of solid friction allows
the establishment of a lower bound solution of the shear strength of
granular materials. An upper bound solution cannot be established
due to the dependence of the parameter 0 on test and boundary conditions.
97
ACKNOWLEDGEMENTS
This research was part of a study of the factors influencing
stability of granular base course mixes conducted at the Engineerin~
Research Institute, Iowa State University, under sponsorship of the
Iowa Highway Research Board., Iowa State Highway Connnission, and Bureau
of Public Roads, U. S. Department of Connnerce.
The authors express their acknowledgement to Dr. Turgut Demirel,
Associate Professor of Civil Engineering, for his guidance and counseling
on energy concepts.and related subjects. Special thanks are due to the staff of
the Soil Research Laboratory, Engineering Research Institute, for their unselfish
assistance during this study and to J. M. Hoover, Associate Professor
of Civil Engineering, as director of the project.
98
REFERENCES
Amontons. 1699. De la resistance cause'e dans les machines. Academie Royale des Sciences, Paris, France, Histoire avec les Memoires de Mathematique et de Physique 1699:206-227.
Barden, ·L. and A. J. Khayatt. 1966. Incremental strain rate ratios and strength of sand in the triaxial test. Geotechnique 16:338-357.
Bishop, A. W. 1954. Correspondence (on a paper by A. D. M. Penman). Geotechnique 4:43-45.
Bishop, A. W. 1966. The strength of soils as engineering materials. Geotechnique 16:89-130.
Bishop, A. W. and A. K. G. Eldin. 1953. The effect of stress history on the relation between ¢and porosity in sand. International Conference on Soil Mechanics and Foundations Engineering, 3rd, Zurich, Switzerland, Proceedings 1:100-105.
Bishop, A. W. and G. E. Green. 1965. The influence of end restraint on the compression strength of a cohesionless soil. Geotechnique 15: 243-266.
Bowden, F. P. and D. Tabor. 1950. The friction and lubrication of solids. Loridon, England, Oxford University Press.
Cornforth, D. H. 1964·. Some experiments on the influence of strain conditions on the strength of sand. Geotechnique 14:143-167.
Coulomb, C. A. 1781. Theorie des machines simples, en ayant egard au frottement de leurs parties, et a la roideur des cordages. Academie Royale des Sciences, Paris, France, Memoires de Mathematique et de Physique 10, NO. 2:161-332. 1785.
Gibson, R. E. and N. R. Morg~nstern. 1963. Stress-dilatancy, earth pressures, and slopes (by) P. W. Rowe: (discussion). American Society of Civil Engineers Proceedings 89 No. SM6:127-129.
Handy, R. L. 1965. Quantitative X-ray diffraction measurements by fast scanning. American Society for Testing and·Materials Special Technical Publication 395:30-44.
Hoover, J. M. 1965. Factors influencing stability of granuiar base course mixes: final report. Ames, Iowa, Engineering Experiment Station, Iowa State University of Science and Technology.
Horn, H. M. 1961. An investigation of the frictional characteristics of minerals. Microfilm copy, unpublished Ph.D. thesis, University of Illinois. Urbana, Illinois. Ann Arbor, Michigan, University Microfilms, Inc.
99
Horne, M. R. 1965. The behavior of an assembly of rotund, rigid, cohesionless particles. 1. Royal Society of London, London, England, Pro-ceedings Series A, 286:62-78. · ·
Lambe, T. W. 1951. Soil testing for engineers. New York, N.Y., Wiley and Sons, Inc.
Lee, I. K. 1966. Stress-dilatancy performance of feldspar. American Society of Civil Engineers Proceedings 92, No. SM2:79-103.
MacCurdy, E. 1938. The notebooks of Leonardo da Vinci. Vol. 1. New York, N.Y., Reynal and Hitchcock.
Newland, P. L. and G. H. Allely. 1957. Volume changes in drained triaxial tests on granular materials. Geotechnique 7:17-34.
Penman, A. D. M. 1953. Shear characteristics of a satur·ated silt. Geotechnique 3:312-328.
Reynolds, 0. 1885. On the dilatancy of media composed of rigid particles in contact. London, England, Philosophical Magazine Series 5, 20:469-481.
Roscoe, K. H. and A. N. Schofield. 1964. Stress-dilatancy, earth pressures, and slopes (by) P. W. Rowe: (discussion). American Society of Civil Engineers Proceedings 90, No. SM1:136-150.
Rowe, P. W. 1962. The stress-dilatancy relation for static equilibrium of an assembly of particles in contact. Royal Society of London, London, England, Proceedings Series A, 269:500-529.
Rowe, P. W. 1963. Stress-dilatancy, earth pressures, and slopes. American Society of Civil Engineers Proceedings 89, No. SM3:37-61 •.
Rowe, P. W. 1964. Stress-dilatancy, earth pressures, and slopes (by) P. W. Rowe: (discussion: closure). American Society of Civil Engineers Proceedings 90, No. SM4:145-180.
Rowe, P. W., L. Barden and I. K. Lee. 1964. Energy components during the triaxial cell and direct shear tests. Geotechnique 14:247-261.
Scott, R. F. 1964. Stress-dilatancy, earth pressures, and slopes (by) P. W. Rowe: (discussion). American Society of Civil Engineers Proceedings 90, No. SM1:133-135.
Skempton, A. W. and A. W. Bishop. 1950. Measurement of shear strength of soils. Geotechnique 2:90-108.
Taylor, D. W. 1948. Fundamentals of soil mechanics. New York, N.Y., Wiley and Sons, Inc.
100
Terzaghi, K. 1923. Die Berechnung der Durchl~ssikeitsziffer des Tones aus dem Verlauf der hydrodynamischen Spannungserscheinungen. Akademie der Wissenschaften, Wien, Osterreisch, Mathematisch-naturwissenschaftliche Klasse, Sitsungsberichte Part 2a, 132:125-138.
Terzaghi, K. 1925. Erdbaumechanik auf bodenphysikalischer Grundlage. Wien, Osterreisch, F. Deuticke.
Trollope, D. H. and A. K. Parkin. 1963. Strese-dilatancy, earth pressures, and slopes (by) P. W. Rowe: (discussion). American Society of Civil Engineers Proceedings 89, No. SM6:129-133.