Embed Size (px)
Citation preview

HAL Id: hal-00022654https://hal.archives-ouvertes.fr/hal-00022654
Submitted on 12 Apr 2006
HAL is a multi-disciplinary open accessarchive for the deposit and dissemination of sci-entific research documents, whether they are pub-lished or not. The documents may come fromteaching and research institutions in France orabroad, or from public or private research centers.
L’archive ouverte pluridisciplinaire HAL, estdestinée au dépôt et à la diffusion de documentsscientifiques de niveau recherche, publiés ou non,émanant des établissements d’enseignement et derecherche français ou étrangers, des laboratoirespublics ou privés.
Shear strength properties of wet granular materialsVincent Richefeu, Moulay Saïd El Youssoufi, Farhang Radjai
To cite this version:Vincent Richefeu, Moulay Saïd El Youssoufi, Farhang Radjai. Shear strength properties of wet granularmaterials. Physical Review E : Statistical, Nonlinear, and Soft Matter Physics, American PhysicalSociety, 2006, 73, pp.051304. <hal-00022654>
Shear strength properties of wet granular materials
Vincent Richefeu,∗ Moulay Saıd El Youssoufi, and Farhang RadjaıLaboratoire de Mecanique et Genie Civil UMR CNRS 5508, Cc. 048, Universite Montpellier 2,
Place Eugene Bataillon, 34095 Montpellier Cedex 5, France
(Dated: April 11, 2006)
We investigate shear strength properties of wet granular materials in the pendular state (i.e. thestate where the liquid phase is discontinuous) as a function of water content. Sand and glass beadswere wetted and tested in a direct shear cell and under various confining pressures. In parallel,we carried out three-dimensional molecular dynamics simulations by using an explicit equationexpressing capillary force as a function of interparticle distance, water bridge volume and surfacetension. We show that, due to the peculiar features of capillary interactions, the major influence ofwater content over the shear strength stems from the distribution of liquid bonds. This propertyresults in shear strength saturation as a function of water content. We arrive at the same conclusionby a microscopic analysis of the shear strength. We propose a model that accounts for the capillaryforce, the granular texture and particle size polydispersity. We find fairly good agreement of thetheoretical estimate of the shear strength with both experimental data and simulations. Fromnumerical data, we analyze the connectivity and anisotropy of different classes of liquid bondsaccording to the sign and level of the normal force as well as the bond direction. We find thatweak compressive bonds are almost isotropically distributed whereas strong compressive and tensilebonds have a pronounced anisotropy. The probability distribution function of normal forces isexponentially decreasing for strong compressive bonds, a decreasing power-law function over nearlyone decade for weak compressive bonds and an increasing linear function in the range of tensilebonds. These features suggest that different bond classes do not play the same role with respect tothe shear strength.
I. INTRODUCTION
Capillary cohesion is known to influence strongly thestrength and flow properties of granular materials. Forexample, sandcastles keep standing basically due to smallamounts of water between sand grains [1, 2]. At low levelsof water content, the water forms a discontinuous phasecomposed of interparticle bridges that are unevenly dis-tributed in the bulk (the pendular state). Obviously,cohesion effects appear only at low confining pressures,e.g. in surface soils. It is a common observation that,when plowing a wet granular soil, large cohesive aggre-gates are formed. The largest capillary cohesion forcefor millimeter-size sand grains is about 4× 10⁻⁴ N inde-pendently of meniscus volume. This force is nearly fourtimes the grain weight, allowing thus for the formationof cohesive aggregates. Transformations involving pri-mary particle agglomeration into coherent granules areof special interest in many applications in a wide rangeof industries such as pharmaceuticals, agronomic prod-ucts and detergents [3, 4].
Although capillary phenomena at the interface be-tween two solid bodies are well understood, it is muchless clear how a collection of grains reacts to the pres-ence of a liquid. The issue is basically the same as incohesionless granular media where the influence of inter-particle friction on the shear strength depends both onthe features of the friction law itself and the granularstructure. Similarly, the question here is the extent to
which the features of cohesion interactions are reflectedin a global property such as shear strength. At least twofactors seem to be important: the local force thresholdsand the distribution of cohesive bonds in the bulk [2, 5].There are reasons to think that the spatial distributionof water bonds should prevail over the absolute amountof water going to each bond. Our results, as we shall seein this paper, credit this point.
There is a vast literature dealing with the experimentalbehavior of wet granular media. In soil mechanics, wherestability considerations are of primary importance, theinfluence of water content on unsaturated earth is mostlystudied in shear tests through the Coulomb cohesion pa-rameter representing the shear strength at zero confiningstress [6]. On the other hand, the flowability of wet pow-ders is expressed in terms of tensile strength measuredas the fluidization threshold under vibration or air flow[7]. Direct measurements of tensile strength have beenreported more recently [8–10]. In granular media, it isgenerally much more difficult to access local informationsuch as contact forces or liquid bonds. Few investigationshave recently been reported to visualize liquid bonds bymeans of the index matching technique [5, 11]. Theseobservations underline the influence of the distributionof water bonds.
A detailed description of the behavior at the parti-cle scale can be obtained by means of molecular dynam-ics (MD) simulations with an appropriate prescription offorce laws. Recently, several simulations of wet granularmedia have been reported [12–14]. Mikami et al. usedthis type of simulation together with a regression expres-sion for the liquid bridge force as a function of liquidbridge volume and separation distance between particles

2
[15]. They mainly studied bubbling behavior and ag-glomerate formation in a fluidized bed and they foundrealistic results. Dense agglomerates were simulated byGroger et al. using a cohesive discrete element method[16]. They found a good agreement with experimentaldata for the yield stress at all confining pressures down tothe value of the tensile stress. Shear strength behavior ofunsaturated granulates was also studied numerically byJiang et al. as a function of suction (pressure differencebetween liquid and gas) [17].
In this paper, we investigate the cohesive behavior ofwet dense granular packings under monotonous shear-ing by means of experiments and three-dimensional MDsimulations. We also analyze the shear strength from amicroscopic expression of the stress tensor. The experi-ments are described in section II. We study the Coulombcohesion as a function of water content for four differentmaterials. The simulations are presented in section III.We use an explicit expression of the capillary force asa function of interparticle distance, bridge volume andsurface tension. The Coulomb cohesion is studied as afunction of water content. We also investigate the bondconnectivity and force distributions. In section IV, wepropose a new expression for the shear strength that ac-counts for particle polydispersity as well as material andstructural parameters. We finally compare the experi-mental and numerical results to the theoretical predic-tions.
II. EXPERIMENTS
The experiments were designed to measure the shearstrength at low confining pressures (< 1 kPa). The prin-ciples of the device are similar to those used in severalother investigations [18–21]. We present here the setup,the materials, the wetting protocol and our main results.
A. Experimental setup
A schematic representation of the shearing setup isshown in Fig. 1. The wet grains are poured in a plexiglascylindrical cell and confined by means of a circular lid ofarea S placed on top of the material. The lid is equippedwith a reservoir allowing to impose an overload by addingdesired amount of sand. The total vertical force N actingon the sample is the sum of the weights of lid and sand(shown by A on the figure). The cell is composed of twodisjoint parts kept together during sample preparation.The upper part can move horizontally with respect to thelower part by pulling on a rope attached to it and whichsupports a cupel through a pulley (shown by B on thefigure). The pulling force T can be increased by addingsand into the cupel. The friction force between the twoparts of the cell is reduced by water lubricating the rimsand we checked that it remains negligibly small duringshear. In order to reduce the friction force exerted by
FIG. 1: Testing cell and shearing setup.
the material along the walls (Janssen effect), the thick-ness h of the upper part of the sample was taken to bebelow the diameter of the cell (46 mm). The heights ofthe upper and lower parts are about 10 mm and 15 mmrespectively. The sample is sheared along the commonsection of the two parts of the cell. This shear plane issubjected to a tangential stress τ = T/S and a normalstress σ = N/S + ρgh, where ρ is the bulk density and gis the gravity.
In the experiments, we gradually increase the shearstress τ for a fixed value of σ. Unstable shearing occurswhen τ reaches the shear strength τm, resulting in a sud-den slide of the upper part of the sample. The upper partis stopped by collision with two bars located 5 mm awayfrom the cell. We did not measure the displacements. Werecorded τm for different values of σ in the range varyingfrom 200 Pa to 800 Pa, and for different values of watercontent.
B. Materials and wetting protocol
We used four types of materials: (1) a sand composedof angular grains with diameter in the range from 0.1 mmto 0.4 mm, (2) “tightly-graded” polydisperse glass beadswith diameters from 0.4 mm to 0.5 mm, (3) “well-graded”polydisperse glass beads with diameters from 0.4 mm to0.8 mm, and (4) monodisperse glass beads of diameter1 mm.
In order to wet the grains, we add distilled water todry material placed in a vessel which is then closed andenergetically shaken for about one minute. The vesselused for mixing is transparent so that during shaking wecan check visually whether the water is homogeneouslymixed with the grains. In particular, we continue shaking
3
until all visible water clusters disappear. Increasing theduration of shaking beyond 1 minute did not change themeasured values of the shear strength. After mixing, thewetted material is poured into the testing cell. The watercontent is evaluated by comparing the masses of a sampleof the material before and after testing by means of aheat chamber used for drying the sample at 105◦C. Thewater content is given by w = mw/ms, where mw andms are the masses of water and grains, respectively. Thewet materials were tested for water contents below 0.05corresponding to the pendular state for our materials.The experiments were performed at ambient conditions.Each experiment lasted a few minutes. The loss of liquidwas always below two percent. This loss is not only due toevaporation but also due to partial wetting of the internalwalls of the cell. It is small enough to assume a constantliquid volume (as in simulations, see below).
C. Results
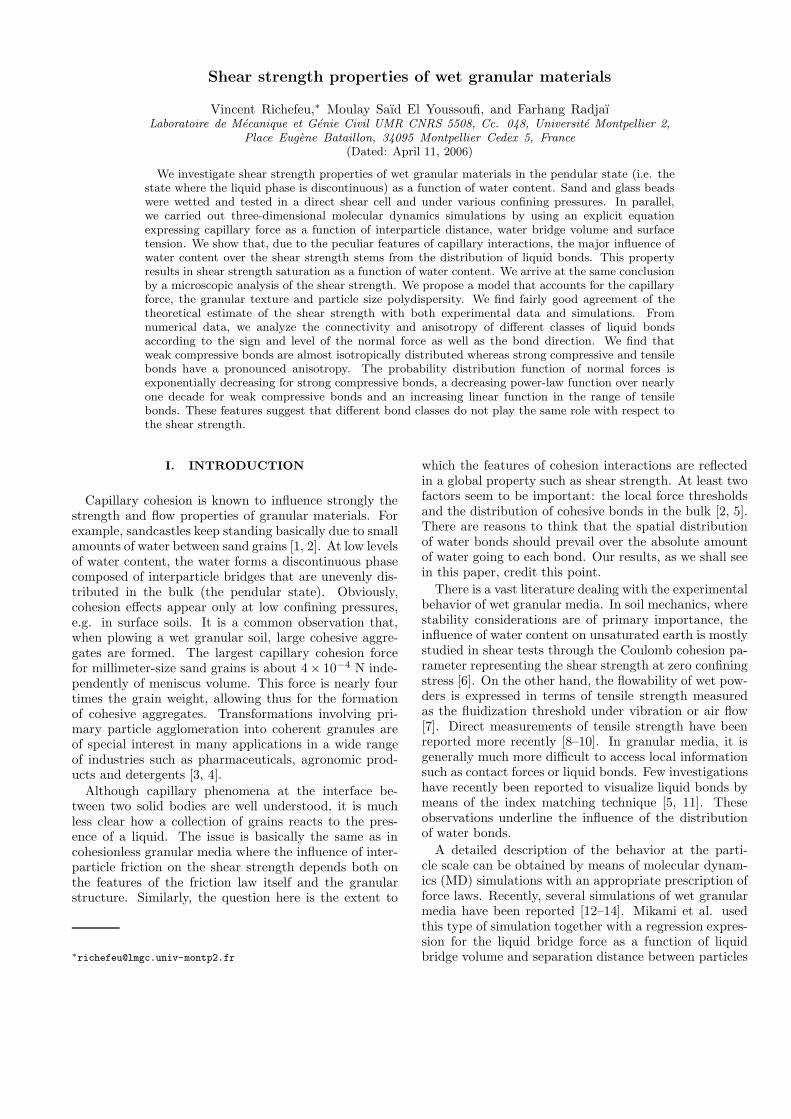
Figure 2(a) shows the yield loci τ -σ for the sand atseveral levels of water content w. Within experimentalprecision, the data are well fitted by a straight line, inagreement with the Mohr-Coulomb model
τ = µσ + c, (1)
where µ = tanϕ is the internal coefficient of friction andc is the Coulomb cohesion. It is remarkable that ϕ ≃33◦ is almost independant of w. On the other hand,the Coulomb cohesion increases nonlinearly with w andsaturates to cm ≃ 600 Pa at wm ≃ 0.03, as shown inFig. 2(b).
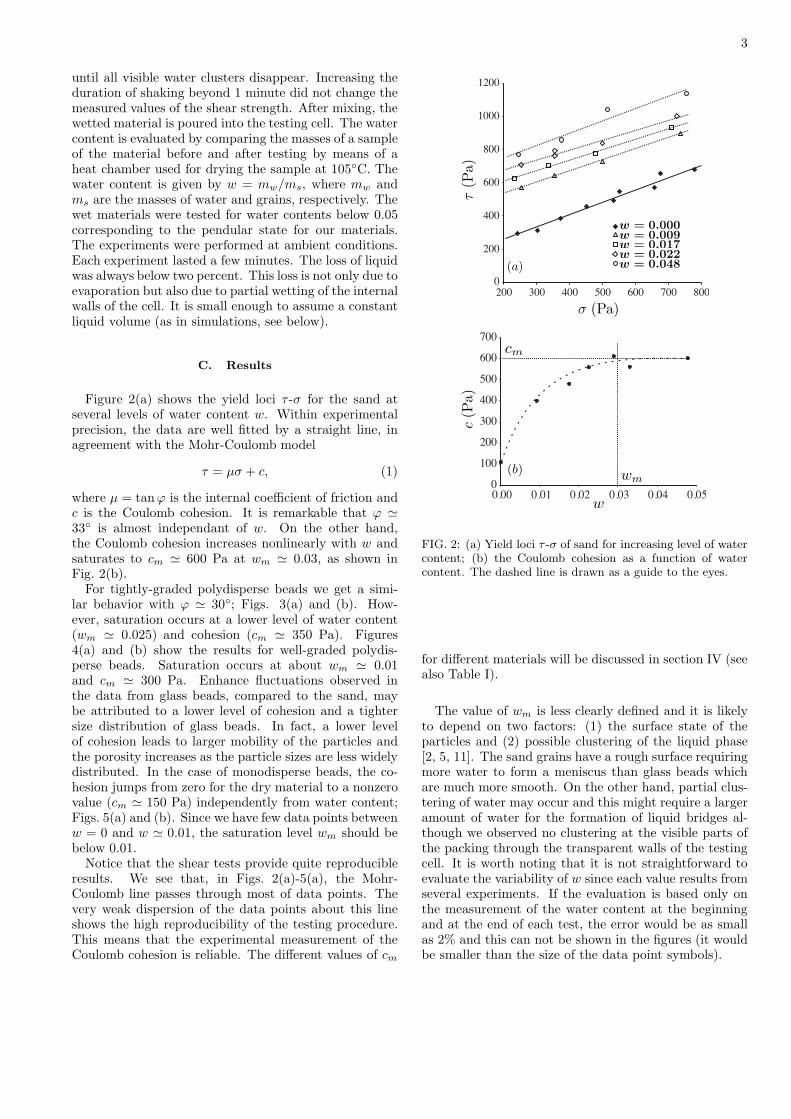
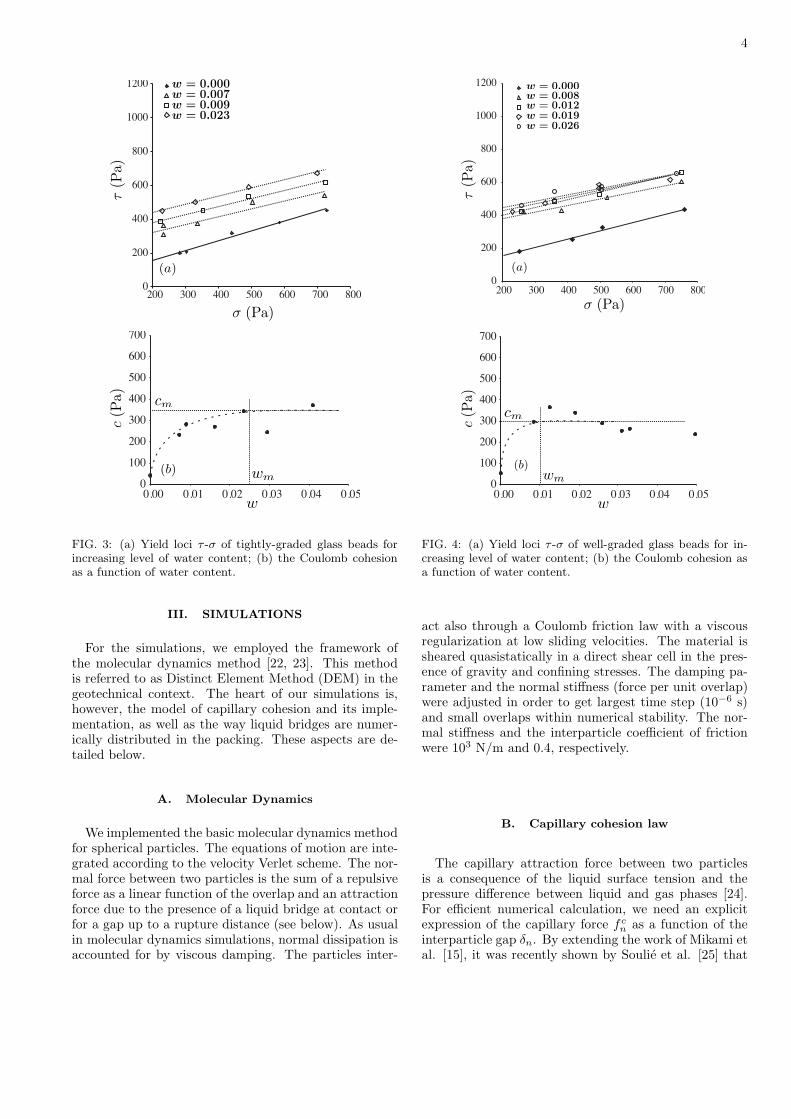
For tightly-graded polydisperse beads we get a simi-lar behavior with ϕ ≃ 30◦; Figs. 3(a) and (b). How-ever, saturation occurs at a lower level of water content(wm ≃ 0.025) and cohesion (cm ≃ 350 Pa). Figures4(a) and (b) show the results for well-graded polydis-perse beads. Saturation occurs at about wm ≃ 0.01and cm ≃ 300 Pa. Enhance fluctuations observed inthe data from glass beads, compared to the sand, maybe attributed to a lower level of cohesion and a tightersize distribution of glass beads. In fact, a lower levelof cohesion leads to larger mobility of the particles andthe porosity increases as the particle sizes are less widelydistributed. In the case of monodisperse beads, the co-hesion jumps from zero for the dry material to a nonzerovalue (cm ≃ 150 Pa) independently from water content;Figs. 5(a) and (b). Since we have few data points betweenw = 0 and w ≃ 0.01, the saturation level wm should bebelow 0.01.
Notice that the shear tests provide quite reproducibleresults. We see that, in Figs. 2(a)-5(a), the Mohr-Coulomb line passes through most of data points. Thevery weak dispersion of the data points about this lineshows the high reproducibility of the testing procedure.This means that the experimental measurement of theCoulomb cohesion is reliable. The different values of cm
(a)
(b)
cm
wm
c(P
a)
τ(P
a)
σ (Pa)
w
w = 0.000w = 0.009w = 0.017w = 0.022w = 0.048
FIG. 2: (a) Yield loci τ -σ of sand for increasing level of watercontent; (b) the Coulomb cohesion as a function of watercontent. The dashed line is drawn as a guide to the eyes.
for different materials will be discussed in section IV (seealso Table I).
The value of wm is less clearly defined and it is likelyto depend on two factors: (1) the surface state of theparticles and (2) possible clustering of the liquid phase[2, 5, 11]. The sand grains have a rough surface requiringmore water to form a meniscus than glass beads whichare much more smooth. On the other hand, partial clus-tering of water may occur and this might require a largeramount of water for the formation of liquid bridges al-though we observed no clustering at the visible parts ofthe packing through the transparent walls of the testingcell. It is worth noting that it is not straightforward toevaluate the variability of w since each value results fromseveral experiments. If the evaluation is based only onthe measurement of the water content at the beginningand at the end of each test, the error would be as smallas 2% and this can not be shown in the figures (it wouldbe smaller than the size of the data point symbols).
4
(a)
(b)
cm
wm
c(P
a)
τ(P
a)
σ (Pa)
w
w = 0.000
w = 0.009
w = 0.007
w = 0.023
FIG. 3: (a) Yield loci τ -σ of tightly-graded glass beads forincreasing level of water content; (b) the Coulomb cohesionas a function of water content.
III. SIMULATIONS
For the simulations, we employed the framework ofthe molecular dynamics method [22, 23]. This methodis referred to as Distinct Element Method (DEM) in thegeotechnical context. The heart of our simulations is,however, the model of capillary cohesion and its imple-mentation, as well as the way liquid bridges are numer-ically distributed in the packing. These aspects are de-tailed below.
A. Molecular Dynamics
We implemented the basic molecular dynamics methodfor spherical particles. The equations of motion are inte-grated according to the velocity Verlet scheme. The nor-mal force between two particles is the sum of a repulsiveforce as a linear function of the overlap and an attractionforce due to the presence of a liquid bridge at contact orfor a gap up to a rupture distance (see below). As usualin molecular dynamics simulations, normal dissipation isaccounted for by viscous damping. The particles inter-
(a)
(b)
cm
wm
c(P
a)τ
(Pa)
σ (Pa)
w
w = 0.000
w = 0.008
w = 0.012
w = 0.019
w = 0.026
FIG. 4: (a) Yield loci τ -σ of well-graded glass beads for in-creasing level of water content; (b) the Coulomb cohesion asa function of water content.
act also through a Coulomb friction law with a viscousregularization at low sliding velocities. The material issheared quasistatically in a direct shear cell in the pres-ence of gravity and confining stresses. The damping pa-rameter and the normal stiffness (force per unit overlap)were adjusted in order to get largest time step (10−6 s)and small overlaps within numerical stability. The nor-mal stiffness and the interparticle coefficient of frictionwere 103 N/m and 0.4, respectively.
B. Capillary cohesion law
The capillary attraction force between two particlesis a consequence of the liquid surface tension and thepressure difference between liquid and gas phases [24].For efficient numerical calculation, we need an explicitexpression of the capillary force f c
n as a function of theinterparticle gap δn. By extending the work of Mikami etal. [15], it was recently shown by Soulie et al. [25] that
5
(a)
(b)
cm
wm
c(P
a)τ
(Pa)
σ (Pa)
w
w = 0.000
w = 0.007w = 0.016
w = 0.019
w = 0.033
FIG. 5: (a) Yield loci τ -σ of monodisperse glass beads forincreasing level of water content; (b) the Coulomb cohesionas a function of water content.
the capillary force can be cast in the following form:
f cn =
−πγs
√R1R2{exp(Aδ⋆
n + B) + C} for δ⋆n > 0
−πγs
√R1R2{exp(B) + C} for δ⋆
n ≤ 0,
(2)where R1 and R2 are the sphere radii (R1 ≤ R2), γs isthe liquid surface tension, δ⋆
n = δn/R2 (see Fig. 6). Theparameters A, B and C are functions of the liquid volumeVb of the bond and the contact angle θ as follows
A = −1.1(V ⋆b )−0.53,
B = (−0.148 lnV ⋆b − 0.96) θ2
−0.0082 lnV ⋆b + 0.48,
C = 0.0018 lnV ⋆b + 0.078,
(3)
where V ⋆b = Vb/R3
2.It can be shown that a liquid bond is stable as long
as the gap is below a de-bonding distance δmaxn given by
[13]
δmaxn = (1 + 0.5θ)V
1/3
b . (4)
fn
δmax
nδn
−f0
zc−
zc+
z−
R1
R2
δn
θ
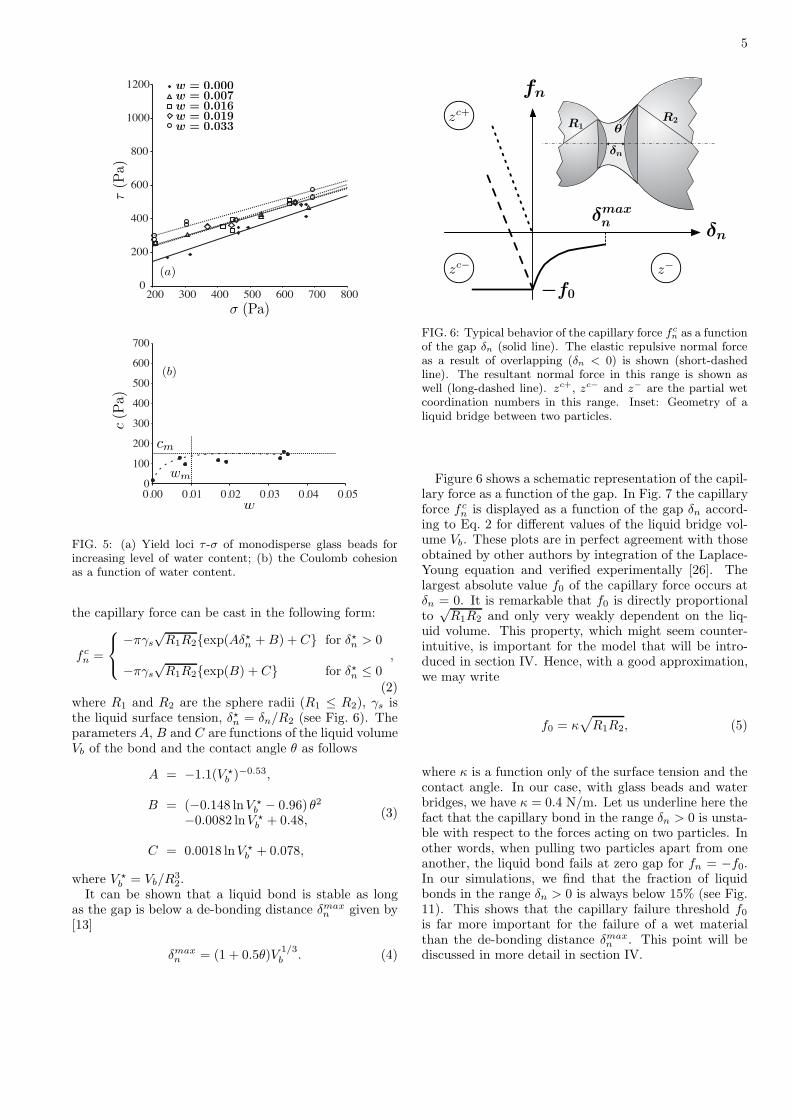
FIG. 6: Typical behavior of the capillary force fc
n as a functionof the gap δn (solid line). The elastic repulsive normal forceas a result of overlapping (δn < 0) is shown (short-dashedline). The resultant normal force in this range is shown aswell (long-dashed line). zc+, zc− and z− are the partial wetcoordination numbers in this range. Inset: Geometry of aliquid bridge between two particles.
Figure 6 shows a schematic representation of the capil-lary force as a function of the gap. In Fig. 7 the capillaryforce f c
n is displayed as a function of the gap δn accord-ing to Eq. 2 for different values of the liquid bridge vol-ume Vb. These plots are in perfect agreement with thoseobtained by other authors by integration of the Laplace-Young equation and verified experimentally [26]. Thelargest absolute value f0 of the capillary force occurs atδn = 0. It is remarkable that f0 is directly proportionalto
√R1R2 and only very weakly dependent on the liq-
uid volume. This property, which might seem counter-intuitive, is important for the model that will be intro-duced in section IV. Hence, with a good approximation,we may write
f0 = κ√
R1R2, (5)
where κ is a function only of the surface tension and thecontact angle. In our case, with glass beads and waterbridges, we have κ = 0.4 N/m. Let us underline here thefact that the capillary bond in the range δn > 0 is unsta-ble with respect to the forces acting on two particles. Inother words, when pulling two particles apart from oneanother, the liquid bond fails at zero gap for fn = −f0.In our simulations, we find that the fraction of liquidbonds in the range δn > 0 is always below 15% (see Fig.11). This shows that the capillary failure threshold f0
is far more important for the failure of a wet materialthan the de-bonding distance δmax
n . This point will bediscussed in more detail in section IV.

6
δn (10−4 m)
−f0
fc n
(10−
4N
)
FIG. 7: Capillary force as a function of the gap according toEq. 2 for increasing liquid volume Vb.
C. Sample preparation
The numerical samples are composed of spherical par-ticles of three different diameters (2 mm, 1.5 mm and 1mm) placed randomly in a cylindrical cell in appropri-ate proportions (50%, 30% and 20%) to represent one ofour experimental samples composed of glass beads. Theinitial configuration is prepared under gravity withoutintroducing capillary bonds. Then, we attribute a capil-lary bond to each pair of particles within the de-bondingdistance. Finally, the sample is consolidated under theaction of a vertical confining pressure with a zero coef-ficient of friction. The consolidation is stopped and thecoefficient of friction set to 0.4 as soon as the solid frac-tion φ = 0.6 is reached. The subsequent compaction isnegligibly small.
The volume Vb attributed to a capillary bond betweentwo particles is taken to be proportional to the particlediameters and the intercenter distance, and such that thetotal volume of all liquid bonds in the sample is equal tothat of the added water. Since all particle pairs withinthe de-bonding distance are considered, the liquid coordi-nation number z (i.e. the average number of liquid bondsper particle) obtained by this procedure has the highestpossible value. For our sample we get z = 8 for w = 0.01(see Fig. 14). In our simulations, the liquid bond volumesvary by a factor 8 from the contact between the small-est particles to that between the largest particles. On theother hand, the contact angle with a good approximationwas set to zero. Moreover, since the de-bonding length
varies as V1/3
b , there is a factor 2 between the shortestand longest de-bonding distances.
During shearing, the number of liquid bonds evolvesand the available liquid must be redistributed in the sys-tem. We used two different methods for redistribution:(1) we simply apply the above procedure every time thecontact list is updated; (2) the volume of a broken liquidbond is split between the corresponding particles (pro-
δℓ/〈d〉
τ(P
a)
w = 0.01
w = 0.00
FIG. 8: The shear stress τ as a function of shearing distance δℓ
normalized by the average particle diameter 〈d〉 for a dry anda wet sample simulated by the molecular dynamics method.The confining stress is σ = 300 Pa.
portionally to their diameters) and conserved for the for-mation of new liquid bonds when a contact occurs withthe same particles. In this method, the volume of freeliquid left after de-bonding is kept with the two particles(and not distributed to the other bonds of the same par-ticles) and used only if a new contact is formed. Thisimplies that, if the initial liquid distribution is homoge-neous, then it will remain so during deformation as inthe first method. In other words, the liquid will not mi-grate considerably and one should expect quite similarresults from both methods. Indeed, in different tests, wefound that both methods lead to nearly identical results.Unless mentioned explicitly, all results presented in thissection were obtained by the first method.
D. Boundary conditions and driving
As in experiments, the cylindrical cell is composed oftwo disjoint parts. The lower part is fixed whereas theupper part moves horizontally, giving rise to a shear planealong the common section of the two parts. We apply aconstant vertical load σ, the same as in experiments, ontop of the sample. However, in contrast to experiments,shearing is controlled by imposing a constant horizontalvelocity on the upper part. The numerical sample hasexactly the same dimensions as in experiments.
E. Results
Figure 8 shows the stress-strain plot for a dry and awet sample with w = 0.01. The initial configuration isthe same in both simulations. The initial elastic increaseof τ (up to ∼ 75 Pa) as a function of δℓ is common be-tween the two samples. We observe no stress peak in the

7
τ(P
a)
σ (Pa)
(a)
(b)
cm
wm
c(P
a)
w
w = 0.000 × 10⁻²
w = 0.125 × 10⁻²
w = 0.500 × 10⁻²
w = 1.000 × 10⁻²
w = 2.000 × 10⁻²
FIG. 9: (a) Yield loci τ -σ from 15 simulations for increasinglevel of water content; (b) the corresponding values of theCoulomb cohesion c as a function of water content.
wet case. The steady state (“critical state” in soils me-chanics) is reached at δℓ ≃ 〈d〉 for all water contents. Thesteady state deformation involves numerous instabilitiesthat occur throughout the system and appear in the formof rapid stress drops on the stress-strain plots. We seethat in transition from dry to wet materials the frequencyof such instabilities declines while their amplitudes grow.
We now turn to the evolution of the Coulomb cohesionas a function of w. Figure 9(a) shows fitted yield locifrom 15 simulations involving three different values ofthe confining pressure σ and five different values of thewater content w. The Coulomb cohesion c is drawn asa function of w in Fig. 9(b). The latter is very similarto the corresponding experimental plot (Fig. 5(b)) formonodisperse glass beads. We observe a saturation ofc at still lower levels of water content (wm ≃ 0.001).Note also that, while the average grain size is nearly thesame in these simulations and in the case of monodisperseexperimental glass beads, the maximum cohesion cm =120 Pa in the simulations is very close to that (150 Pa)for 1 mm glass beads.
In contrast to the experiments, where the stresses aremeasured at the walls, it is also possible to compute thestress tensor for grain-to-grain forces in the simulations(see below). However, we found that in our simulations,the results from these two methods do not coincide. Thisis because in direct shearing, wall effects give rise to large
y
z
(a)
(b)x
y
z
x
FIG. 10: (Color online) Compressive force network (a) andtensile force network (b) in a thin vertical layer. Weak forcesare not shown. xz is the shear plane and y-axis points upward.
stress gradients in the bulk. This point has been ana-lyzed in detail by Thornton and Zhang [27]. We usedhere the wall stresses τ and σ for comparison with thecorresponding experimental values.
Figure 10 displays a typical example of the force net-work in a thin vertical layer (parallel to xy plane). Weobserve a strongly inhomogeneous transmission of bothcompressive and tensile forces. The liquid bonds belongto three different classes: (1) contacts carrying a com-pressive (positive) force; (2) contacts carrying a tensile(negative) force; (3) liquid bonds with no contact andthus carrying a tensile force. We denote the correspond-ing partial coordination numbers by zc+, zc− and z−,respectively (see Fig. 6). Fig. 11 shows the evolution ofthese partial coordination numbers as a function of sheardisplacement. Interestingly, although the bonds are op-timally distributed in the sample (according to the firstredistribution method), z− is only about one bond perparticle. This means that the overall contribution of thisclass, involving a low number of bonds and rather weakforces, to stress transmission is marginal. The evolutionof particle connectivity is mainly reflected in the regularfall-off of zc− during shear. This class, with numerouscontacts and a high force level, provides the largest con-tribution to the transmission of tensile stresses in thepacking. The rather large and constant value of zc+ isa reflection of the fact that the packing is globally sub-

8
δℓ/〈d〉
part
ialcoord
inati
on
num
ber
FIG. 11: Partial coordination numbers as a function of shear-ing distance.
jected to boundary compressive stresses.The probability distribution function P of normal
bond forces is shown in Fig. 12. The largest forces be-long to the compressive network (involving no limitingthreshold) whereas the tensile forces extend down to thecapillary force threshold −f0. The distribution revealsthree different force intervals with different statistics ineach interval:
P (fn) ∝
e−β fn〈fn〉 for fn > 〈fn〉
(
fn
〈fn〉
)−α
for 0 < fn < 〈fn〉γ fn+f0
〈fn〉 + P0 for − f0 < fn < 0
, (6)
where 〈fn〉 is the average normal force, α ≃ 0.4, β ≃ 0.16,γ ≃ 0.15 and P0 = P (−f0). The distribution for com-pressive forces is reminiscent of that observed in dry gran-ular media [28–30]. The exponent β has, however, asmaller value in the cohesive case. This means that ten-sile forces allow the packing to sustain stronger compres-sive force chains than in a cohesionless material. Thepower law distribution of weak compressive forces (therange 0 < fn < 〈fn〉) over nearly one decade suggeststhat, in the presence of cohesive bonds, the contact net-work in this range is self-similar. These contacts are re-ferred to as “weak contacts” and they play an importantrole in propping strong force chains in the complemen-tary “strong network” (the range fn > 〈fn〉) [31]. Theprobability distribution P is robust and the exponentsdo not evolve during shear.
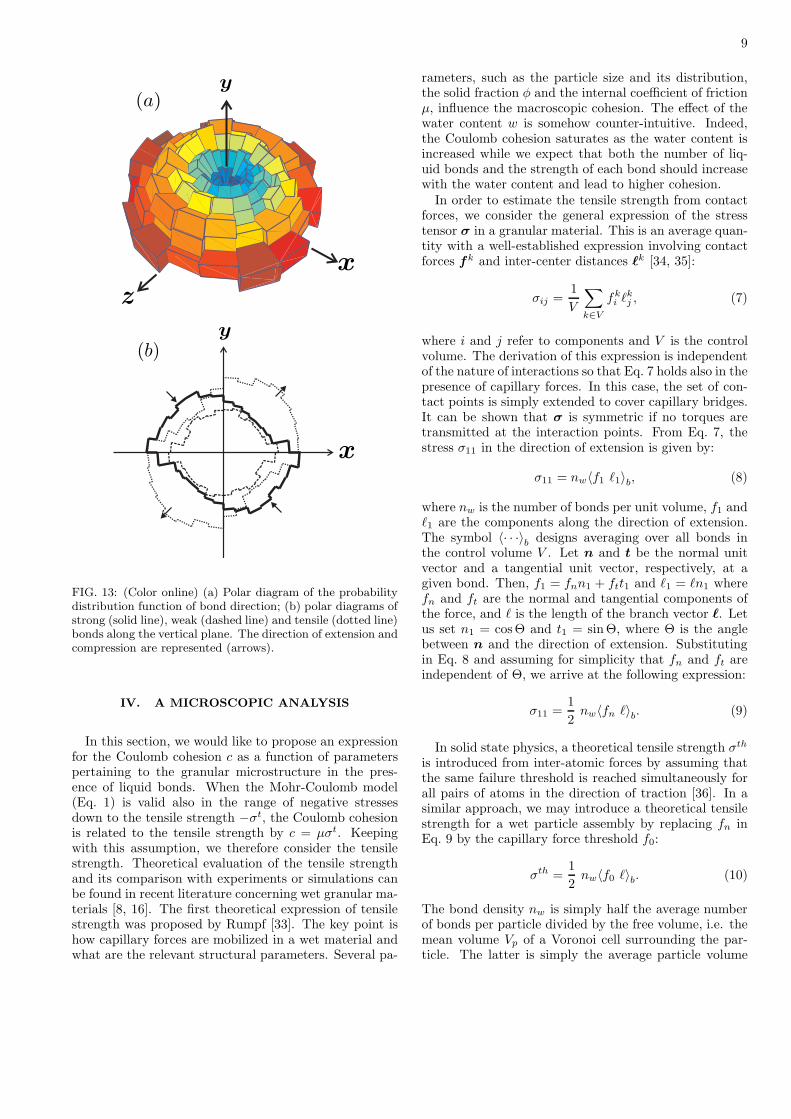
Figure 13(a) shows a polar diagram of the probabilitydistribution function P (n) of bond directions n at theend of shearing for w = 0.02 (the distribution being sim-ilar in other cases). The distribution is nearly isotropicalong the shear plane (xz plane in the figure) but it showsa pronounced anisotropy in the shear direction along thevertical plane (xy plane in the figure). Fig. 13(b) displaysthree separate polar diagrams of the strong, weak and
P
fn/〈fn〉
Pfn/〈fn〉
P
fn/〈fn〉
(a)
(b)
(c)
FIG. 12: Probalility distribution function P of normal forcesfn normalized by the mean 〈fn〉 represented on linear scale(a), log-linear scale (b) and log-log scale (c).
tensile bonds along the vertical plane. The strong com-pressive bonds form an anisotropic distribution with itslongest axis oriented at 45◦ to the horizontal, as expected.The weak compressive bonds have a nearly isotropic dis-tribution. Finally, the tensile bonds have an anisotropicdistribution whose longest axis is perpendicular to thatof strong compressive bonds. It has also been arguedthat the tensile forces play the same role in sustainingthe strong force chains as the weak network [32].
9
x
y
z
(a)
(b)y
x
FIG. 13: (Color online) (a) Polar diagram of the probabilitydistribution function of bond direction; (b) polar diagrams ofstrong (solid line), weak (dashed line) and tensile (dotted line)bonds along the vertical plane. The direction of extension andcompression are represented (arrows).
IV. A MICROSCOPIC ANALYSIS
In this section, we would like to propose an expressionfor the Coulomb cohesion c as a function of parameterspertaining to the granular microstructure in the pres-ence of liquid bonds. When the Mohr-Coulomb model(Eq. 1) is valid also in the range of negative stressesdown to the tensile strength −σt, the Coulomb cohesionis related to the tensile strength by c = µσt. Keepingwith this assumption, we therefore consider the tensilestrength. Theoretical evaluation of the tensile strengthand its comparison with experiments or simulations canbe found in recent literature concerning wet granular ma-terials [8, 16]. The first theoretical expression of tensilestrength was proposed by Rumpf [33]. The key point ishow capillary forces are mobilized in a wet material andwhat are the relevant structural parameters. Several pa-
rameters, such as the particle size and its distribution,the solid fraction φ and the internal coefficient of frictionµ, influence the macroscopic cohesion. The effect of thewater content w is somehow counter-intuitive. Indeed,the Coulomb cohesion saturates as the water content isincreased while we expect that both the number of liq-uid bonds and the strength of each bond should increasewith the water content and lead to higher cohesion.
In order to estimate the tensile strength from contactforces, we consider the general expression of the stresstensor σ in a granular material. This is an average quan-tity with a well-established expression involving contactforces fk and inter-center distances ℓk [34, 35]:
σij =1
V
∑
k∈V
fki ℓk
j , (7)
where i and j refer to components and V is the controlvolume. The derivation of this expression is independentof the nature of interactions so that Eq. 7 holds also in thepresence of capillary forces. In this case, the set of con-tact points is simply extended to cover capillary bridges.It can be shown that σ is symmetric if no torques aretransmitted at the interaction points. From Eq. 7, thestress σ11 in the direction of extension is given by:
σ11 = nw〈f1 ℓ1〉b, (8)
where nw is the number of bonds per unit volume, f1 andℓ1 are the components along the direction of extension.The symbol 〈· · ·〉b designs averaging over all bonds inthe control volume V . Let n and t be the normal unitvector and a tangential unit vector, respectively, at agiven bond. Then, f1 = fnn1 + ftt1 and ℓ1 = ℓn1 wherefn and ft are the normal and tangential components ofthe force, and ℓ is the length of the branch vector ℓ. Letus set n1 = cosΘ and t1 = sin Θ, where Θ is the anglebetween n and the direction of extension. Substitutingin Eq. 8 and assuming for simplicity that fn and ft areindependent of Θ, we arrive at the following expression:
σ11 =1
2nw〈fn ℓ〉b. (9)
In solid state physics, a theoretical tensile strength σth
is introduced from inter-atomic forces by assuming thatthe same failure threshold is reached simultaneously forall pairs of atoms in the direction of traction [36]. In asimilar approach, we may introduce a theoretical tensilestrength for a wet particle assembly by replacing fn inEq. 9 by the capillary force threshold f0:
σth =1
2nw〈f0 ℓ〉b. (10)
The bond density nw is simply half the average numberof bonds per particle divided by the free volume, i.e. themean volume Vp of a Voronoi cell surrounding the par-ticle. The latter is simply the average particle volume

10
(1/6)π〈d3〉 divided by the solid fraction φ. Introducingthese expressions in Eq. 10 and using Eq. 5, we get
σth =3
2πκ φ z
〈(R1 + R2)√
R1R2)〉〈d3〉 =
3
4πsκ φ z
〈d〉 , (11)
where z is the average number of bonds per particle andwe have
s =〈d1/2〉〈d〉〈d3/2〉
〈d3〉 . (12)
In derivation of the expression of s, it was assumed thatthe particle radii R1 and R2 are not correlated. Thismeans that various granulometric classes are homoge-neously distributed in the bulk. It is easy to see thatfor a uniform size distribution, s varies from 8/15 to 1as the smallest particle size increases from 0 to the meanparticle size. For a monodisperse assembly, we have s = 1(see Table I). Eq. 11 is similar to the expression proposedfirst by Rumpf [33] for monodisperse materials (so, with-out the s prefactor), and recently derived from the stresstensor by Groger et al. [16]. Our equation 11 accounts ina simple way for polydispersity and the correlation be-tween the capillary force threshold f0 and the particlesize d. For real polydisperse materials, the factor s iscrucial for comparing the model with experiments.
By definition, the Coulomb cohesion is the yield shearstress at zero confining pressure in which case the cap-illary forces are the only forces acting in the material.In this limit, the normal stress σ on the shear plane issimply equal to the average capillary force divided bythe sample section S. We have seen that “gap” liquidbonds (without contact) contribute only marginally toforce transmission (z− being below one bond per parti-cle); see Fig. 11. It is thus reasonable to assume thatthe capillary force at each bond is f0. This means that,in the absence of confining stresses, we may set σ = σth.Then, the shear stress at yield is the theoretical cohesioncth given by
cth = µσth =3
4πµs
κ φ z
〈d〉 . (13)
It is important to note that the water content does notenter the above expression of cth. The only parameterrelated to water is κ. This suggests that the water con-tent manifests itself mainly through the wet coordinationnumber z = z− + zc− + zc+. In particular, the cohesioncm at saturation corresponds to the saturation of z asthe water content w is increased. In fact, when a cer-tain amount of water is homogeneously distributed in thewhole sample within the de-bonding distance, one findsthat z increases with w and saturates beyond w = wm.This is shown in Fig. 14 for the initial configuration ofour numerical samples. This is a purely geometrical ef-fect related to steric exclusions among particles and itexplains therefore the saturation of cohesion with watercontent according to Eq. 13.
z
w
FIG. 14: The initial wet coordination number in simulationsas a function of water content.
Although this geometrical saturation should dominatein the pendular state, it does not elude that other mecha-nisms might play a role in the experiments. In particular,as the liquid content is increased, the liquid bonds maycoalesce at least locally, leading to bond saturation. Wedid not observe liquid bond clustering at the visible partsof our samples.
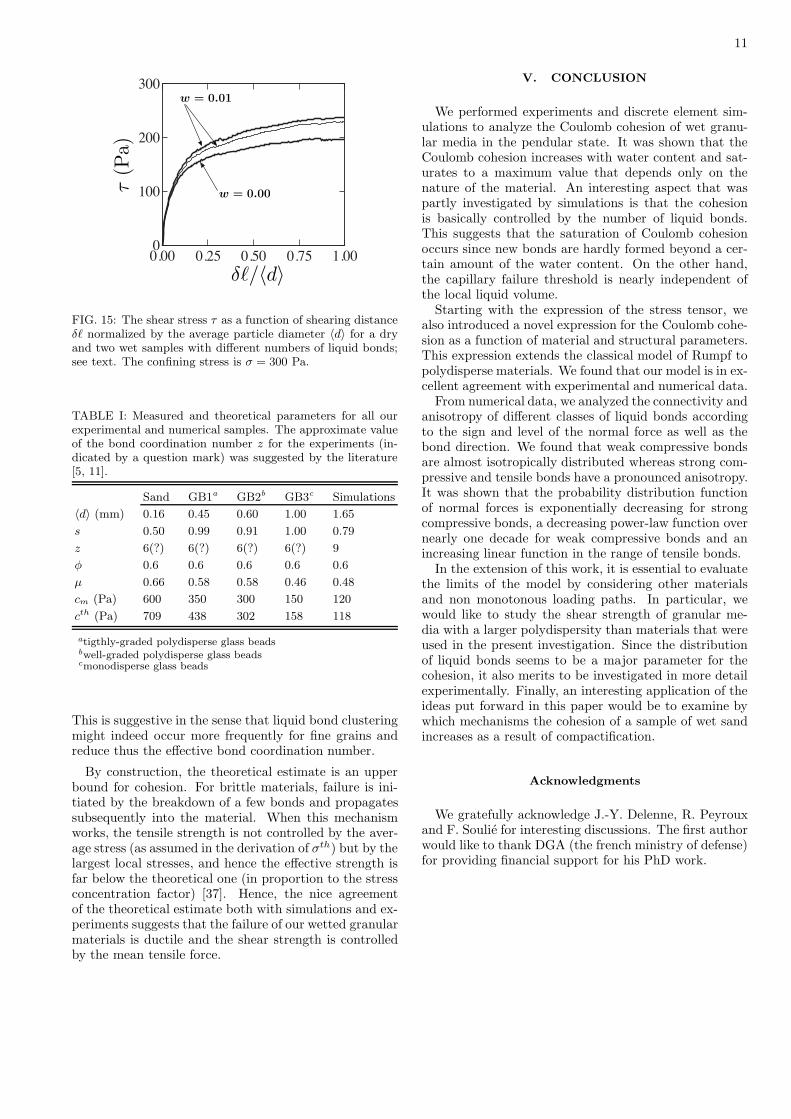
The initial value of z depends also on the prepara-tion protocol. Since f0 is independent of w, the sameamount of water can be distributed in such a way as toproduce a lower number of liquid bonds and thus a lowermacroscopic cohesion. This effect is illustrated in Fig. 15where the stress-strain plots are shown for two initiallyidentical configurations differing only in the number ofliquid bonds for the same water content. The simulationwas carried out by using the second method of liquid re-distribution (section III). In the sample where half ofthe water bonds has been removed, the wet coordinationnumber increases with deformation. But in the initialstages of deformation, the cohesion is close to half thatof the sample involving a double number of water bonds,and it increases as the wet coordination number grows.
We summarize in Table I the theoretical estimates cth
and the measured values cm of the saturated Coulombcohesion for all our experimental and numerical samplestogether with the values of the parameters involved inEq. 13. The value of the polydispersity factor s was cal-culated from the knowledge of the particle size distribu-tions. Note that cth is in excellent agreement with cm
both for experiments and simulations. It is noteworthythat if the prefactor s were not incorporated in Eq. 13(i.e. if Rumpf’s equation had been used), the measuredvalue of cm would be below cth by a factor s.
This agreement between the theoretical estimate andexperiments with sand and glass beads was obtained withz = 6 which is a reasonable value of the bond coordina-tion number in the case of a homogeneous distribution ofwater in the bulk, and it is suggested by recent experi-mental observations [5, 11]. Note, however, that in thecase of fine-grain samples (sand and GB1 in Table I) acloser agreement can be obtained with a lower value of z.
11
δℓ/〈d〉
τ(P
a)
w = 0.01
w = 0.00
FIG. 15: The shear stress τ as a function of shearing distanceδℓ normalized by the average particle diameter 〈d〉 for a dryand two wet samples with different numbers of liquid bonds;see text. The confining stress is σ = 300 Pa.
TABLE I: Measured and theoretical parameters for all ourexperimental and numerical samples. The approximate valueof the bond coordination number z for the experiments (in-dicated by a question mark) was suggested by the literature[5, 11].
Sand GB1a GB2b GB3c Simulations
〈d〉 (mm) 0.16 0.45 0.60 1.00 1.65
s 0.50 0.99 0.91 1.00 0.79
z 6(?) 6(?) 6(?) 6(?) 9
φ 0.6 0.6 0.6 0.6 0.6
µ 0.66 0.58 0.58 0.46 0.48
cm (Pa) 600 350 300 150 120
cth (Pa) 709 438 302 158 118
atigthly-graded polydisperse glass beadsbwell-graded polydisperse glass beadscmonodisperse glass beads
This is suggestive in the sense that liquid bond clusteringmight indeed occur more frequently for fine grains andreduce thus the effective bond coordination number.
By construction, the theoretical estimate is an upperbound for cohesion. For brittle materials, failure is ini-tiated by the breakdown of a few bonds and propagatessubsequently into the material. When this mechanismworks, the tensile strength is not controlled by the aver-age stress (as assumed in the derivation of σth) but by thelargest local stresses, and hence the effective strength isfar below the theoretical one (in proportion to the stressconcentration factor) [37]. Hence, the nice agreementof the theoretical estimate both with simulations and ex-periments suggests that the failure of our wetted granularmaterials is ductile and the shear strength is controlledby the mean tensile force.
V. CONCLUSION
We performed experiments and discrete element sim-ulations to analyze the Coulomb cohesion of wet granu-lar media in the pendular state. It was shown that theCoulomb cohesion increases with water content and sat-urates to a maximum value that depends only on thenature of the material. An interesting aspect that waspartly investigated by simulations is that the cohesionis basically controlled by the number of liquid bonds.This suggests that the saturation of Coulomb cohesionoccurs since new bonds are hardly formed beyond a cer-tain amount of the water content. On the other hand,the capillary failure threshold is nearly independent ofthe local liquid volume.
Starting with the expression of the stress tensor, wealso introduced a novel expression for the Coulomb cohe-sion as a function of material and structural parameters.This expression extends the classical model of Rumpf topolydisperse materials. We found that our model is in ex-cellent agreement with experimental and numerical data.
From numerical data, we analyzed the connectivity andanisotropy of different classes of liquid bonds accordingto the sign and level of the normal force as well as thebond direction. We found that weak compressive bondsare almost isotropically distributed whereas strong com-pressive and tensile bonds have a pronounced anisotropy.It was shown that the probability distribution functionof normal forces is exponentially decreasing for strongcompressive bonds, a decreasing power-law function overnearly one decade for weak compressive bonds and anincreasing linear function in the range of tensile bonds.
In the extension of this work, it is essential to evaluatethe limits of the model by considering other materialsand non monotonous loading paths. In particular, wewould like to study the shear strength of granular me-dia with a larger polydispersity than materials that wereused in the present investigation. Since the distributionof liquid bonds seems to be a major parameter for thecohesion, it also merits to be investigated in more detailexperimentally. Finally, an interesting application of theideas put forward in this paper would be to examine bywhich mechanisms the cohesion of a sample of wet sandincreases as a result of compactification.
Acknowledgments
We gratefully acknowledge J.-Y. Delenne, R. Peyrouxand F. Soulie for interesting discussions. The first authorwould like to thank DGA (the french ministry of defense)for providing financial support for his PhD work.

12
[1] D. J. Hornbaker, R. Albert, I. Albert, A.-L. Barabasi,and P. Schiffer, Nature 387, 765 (1997).
[2] T. C. Halsey and A. J. Levine, Phys. Rev. Lett. 80, 3141(1998).
[3] D. Bika, M. Gentzler, and J. Michaels, Powder Technol-ogy 117, 98 (2001).
[4] S. Iveson, J. Beathe, and N. Page, Powder Technology127, 149 (2002).
[5] M. Kohonen, D. Geromichalos, M. Scheel, C. Schier, andS. Herminghaus, Physica A 339, 7 (2004).
[6] J. K. Mitchell and K. Soga, Fundamentals of Soil Behav-
ior, third edition (Wiley, 2005).[7] A. Castellanos, J. M. Valverde, and M. A. S. Quintanilla,
Phys. Rev. E 65, 061301 (2002).[8] P. Pierrat and H. Caram, Powder Technology 91, 83
(1997).[9] G. Betz, P. J. Burgin, and H. Leuenberger, International
Journal of Pharmaceutics 252, 11 (2002).[10] T. Kim and C. Hwang, Engineering Geology 69, 233
(2003).[11] Z. Fournier, D. Gerimichalos, S. Herminghaus, M. M.
Kohonen, F. Mugele, M. Scheel, M. Schulz, B. Schulz,C. Schier, R. Seemann, et al., Applied Physics: Con-densed Matter 17, 477 (2005).
[12] C. Thornton, M. T. Ciomocos, and M. J. Adams, PowderTechnology 140, 258 (2004).
[13] G. Lian, C. Thornton, and M. J. Adams, Chemical En-gineering Science 53, 3381 (1998).
[14] M. J. Rhodes, X. S. Wang, M. Nguyen, P. Stewart,and K. Liffman, Chemical Engineering Science 56, 4433(2001).
[15] T. Mikami, H. Kamiya, and M. Horio, Chemical Engi-neering Science 53, 1927 (1998).
[16] T. Groger, U. Tuzun, and D. Heyes, Powder Technology133, 203 (2003).
[17] M. J. Jiang, S. Leroueil, and J. M. Konrad, Computersand Geotechnics 31, 473 (2004).
[18] M. K. Hubbert, Bulletin of the Geological Society ofAmerica 62, 355 (1951).
[19] W. Schellart, Tectonophysics 324, 1 (2000).[20] D. Rossi and F. Storti, Journal of Structural Geology 25,
1893 (2003).
[21] J. van Mechelen, Tectonophysics 384, 275 (2004).[22] P. A. Cundall and O. D. L. Strack, Geotechnique 29, 47
(1979).[23] M. P. Allen and D. J. Tildesley, Computer Simulation of
Liquids (Oxford University Press, Oxford, 1987).[24] G. Lian, C. Thornton, and M. Adams, Journal of Colloid
and Interface Science 161, 138 (1993).[25] F. Soulie, F. Cherblanc, M. S. El Yous-
soufi, and C. Saix, Int. J. for Numericaland Analytical Methods in Geomechanics (inpress, http://www3.interscience.wiley.com/cgi-bin/jissue/110435841).
[26] C. Willett, M. Adans, S. Johnson, and J. Seville, Lang-muir 16, 9396 (2000).
[27] C. Thornton and L. Zhang, in Powders and grains 2001,edited by Y. Kishino (A.A. Balkema, 2001), pp. 183–190.
[28] F. Radjaı, S. Roux, and J. J. Moreau, Chaos 9, 544(1999).
[29] T. S. Majmudar and R. P. Behringer, Nature 435, 1079(2005).
[30] D. M. Mueth, H. M. Jaeger, and S. R. Nagel, Phys. Rev.E 57, 3164 (1998).
[31] F. Radjaı, D. E. Wolf, M. Jean, and J. J. Moreau, Phys.Rev. Lett. 80, 61 (1998).
[32] F. Radjaı, I. Preechawuttipong, and R. Peyroux, in Con-
tinuous and discontinuous modelling of cohesive fric-
tional materials, edited by P. A. Vermeer, S. Diebels,W. Ehlers, H. J. Herrmann, S. Luding, and E. Ramm(2000).
[33] H. Rumpf, Chemical Engineering Technology 42, 538(1970).
[34] J. Christoffersen, M. M. Mehrabadi, and S. Nemat-Nasser, J. Appl. Mech. 48, 339 (1981).
[35] J. J. Moreau, in Friction, Arching, Contact Dynamics
(World Scientific, Singapore, 1997), pp. 233–247.[36] M. S. El Youssoufi, J.-Y. Delenne, and F. Radjaı, Phys.
Rev. E 71, 051307 (2005).[37] H. J. Herrmann and S. Roux, Statistical Models for Frac-
ture in Disordered Media (North Holland, Amsterdam,1990).