Embed Size (px)
Citation preview

Shell and Tube Heat Exchanger
October 7, 20XXCycle 2
Group 1XMeYouHerHim
Use subtle, pleasing background. This one is a bit too ominous – like the Hand of God is about to reach out and touch us.

Outline
• Objectives• Background• Experimental Strategy• Results• Error Analysis• Conclusions• Recommendations• References
Select a font size that is appropriate for the size of the room and size of the projection screen
Number your slides – this is required and helps the audience during Q&A session.
An outline slide is required.

Objectives and Background
You only have 10 minutes. Create transitions but know that separate transition slides can waste time. Each slide has to be visible long enough for the audience to absorb the information.

Objectives
• Operate shell and tube heat exchanger varying steam flow
• Determine the outside overall heat transfer coefficient (Uo)
• Determine shellside heat transfer (QSS)
• Determine tubeside heat transfer (QTS)
Condense the objective into the primary objective(s). Do not list all tasks performed.

Heat Exchanger Background• Exchange heat between fluids• Latent heat and sensible heat transfer• Common to chemical process industry• Types of heat exchangers
– Air Cooled– Double Pipe– Spiral Plate and Tube– Shell and Tube
Need to provide context (Background) for your work, but maintain focus on Objective(s) --> Results --> Conclusion(s) --> Recommendation(s)

Heat Exchanger BackgroundShell and Tube Heat Exchangers
• Account for 60% of heat exchangers in use today
• Can handle large flows, low temperatures and pressures, high temperatures and pressures
• Our shell and tube heat exchanger– Basco Type 500 U-tube Water Heater– 1 Shell Pass– 16 Tubes

Experimental Strategy

Equipment Diagram is required. Do not use instrument labels, use descriptive titles.Make it legible.

Experimental Strategy
• 5 Runs Total• Varied Steam Valve (TV-04) Position
– 105% open– 75% open– 65% open– 60% open– 52% open
• Cooling water flow rate constant
“5 Runs” ??One test at each of 5 conditions, or 5 replicates at each of these 5 test conditions?
What does 105% open mean to the audience?
These two experimental strategy slides say what was done, but not why this method was chosen.
Experimental Strategy
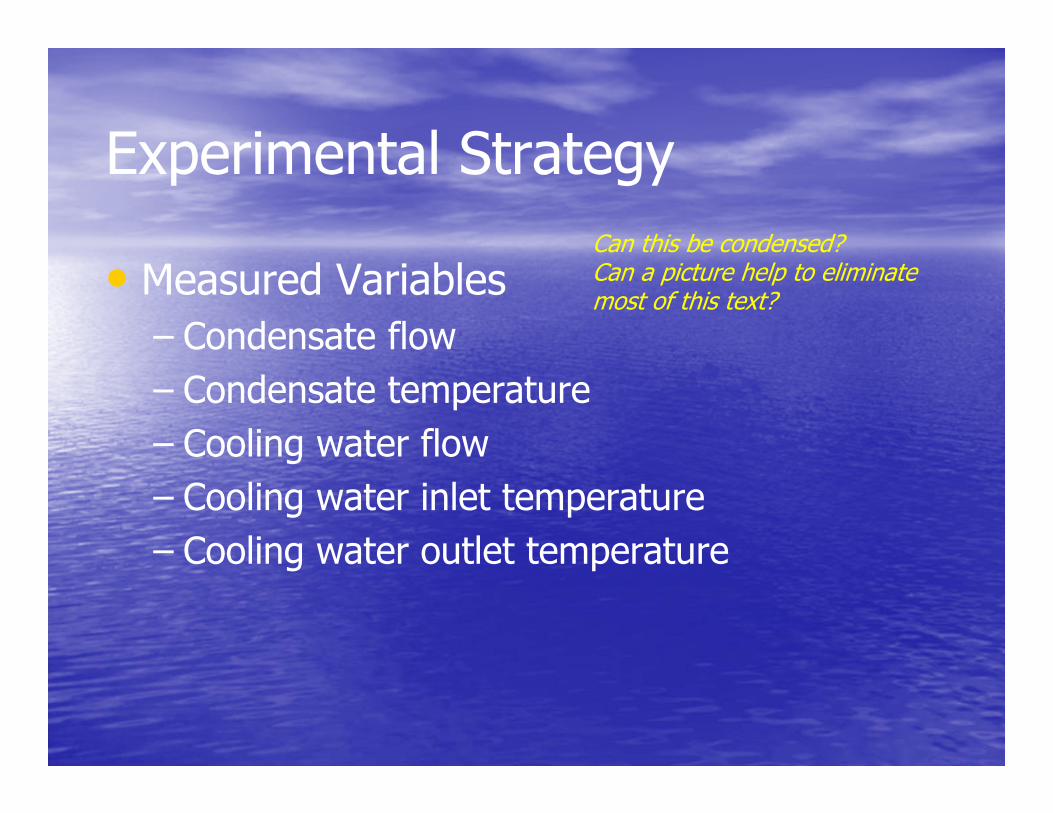
• Measured Variables– Condensate flow– Condensate temperature– Cooling water flow– Cooling water inlet temperature– Cooling water outlet temperature
Can this be condensed?Can a picture help to eliminate most of this text?

Heat Exchanger Calculations
• Heat transfer rate QTS = mCpT QSS = mH + mCpT
• Overall heat transfer coefficient Uo = QSS/(Ao*TLM)
Log mean temperature TLM = ((Thi-Tco) – (Tho – Tci)) / ln[(Thi – Tco) – (Tho – Tci)]
The equations used must be shown in a slide.Nomenclature needs to be defined.

Simplified Process Flow Diagram
Thi
Tho
Tci TcoQout, TSQin, TS
Qin, SS
Qout, SS
This picture could have been used to show what/ where measurements were taken.

Results

Experimental Results
Steam Valve% Open
Heat Transfer Rate (QTS)(btu/hr)
Heat Transfer Rate (QSS)(btu/hr)
Overall Heat Transfer
Coefficient (Uo)
(btu/lb*F*hr)
105% 276489 275350 211
75% 250275 254588 201
65% 183357 181872 148
60% 134200 133777 112
52% 98289 93757 78
Compare these tabulated results to the graphs in the next slides.Which is easier for the audience to absorb?
Pay attention to significant figures!

Shellside vs. Tubeside Heat Transfer
Heat Tranfer Rate (Q)Q-tubeside vs. Q-shellside
90000
140000
190000
240000
290000
75000 125000 175000 225000 275000
Qshellside(btu/hr)
Qtu
besi
de(b
tu/h
r)
Both values are equal. So, both axes should be scaled equally.

90000
140000
190000
240000
290000
75 125 175 225 275Condensate Mass Out
(lb/hr)
Hat
e Tr
ansf
er R
ate
(btu
/hr)
Q-Shellside Q-Tubeside
Steam vs. Heat Transfer Rate (QTS, QSS)
Maybe after too many hours analyzing the data….

Steam vs. Overall Heat Transfer Coefficient
50
100
150
200
250
300
50 100 150 200 250 300
Condensate Mass Out (lb/hr)
Hea
t Tra
nsfe
r C
oeffi
cien
t (b
tu/lb
*F*h
r)
U inside U outside

Error Analysis
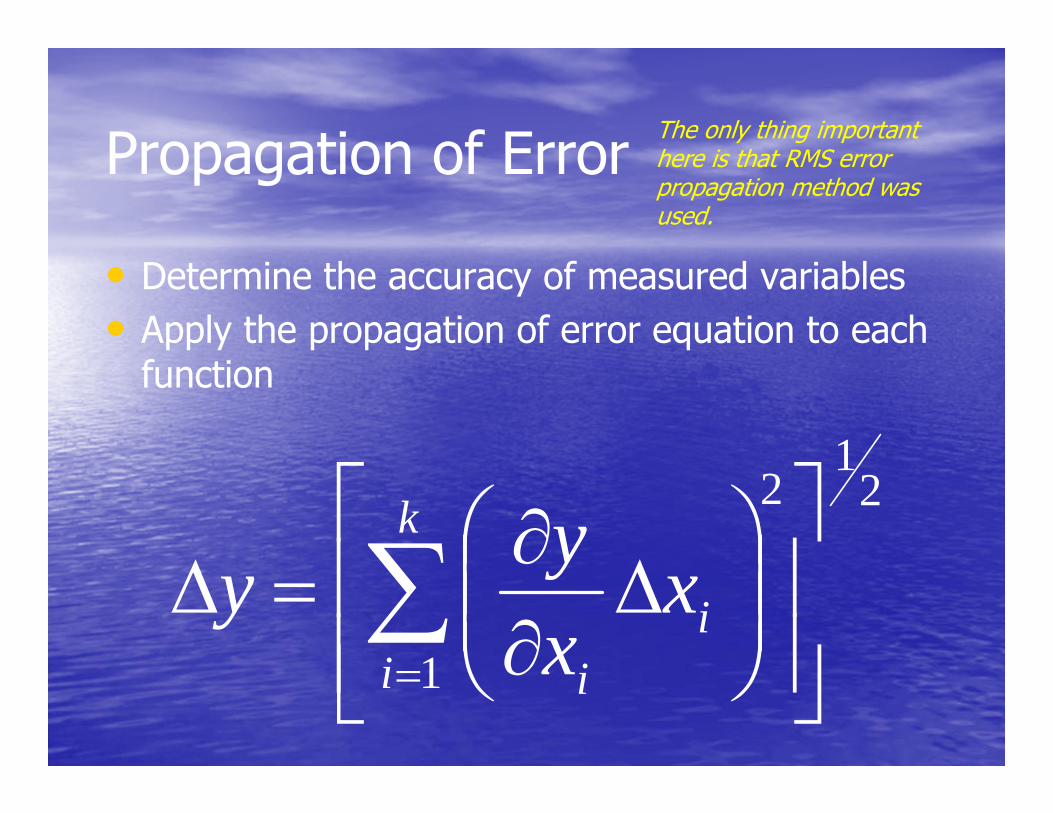
Propagation of Error
• Determine the accuracy of measured variables• Apply the propagation of error equation to each
function
21
1
2
k
ii
i
xxyy
The only thing important here is that RMS error propagation method was used.

Variable Measurement Accuracy• Flow rate of the steam +/- 5 lb/hr• Flow rate of the cooling water +/- 50 lb/hr• Temperature readings +/- 2 °F• Largest sources of error
– Mass flow rate of the steam – Mass flow rate of the cooling water
These values can be reported with the results.Either tabulate key results with uncertainty, or show graphically with error bars.

Calculated Error Values
• ∆QTS ≈ +/- 1,000 btu/hr• ∆QSS ≈ +/- 50,000 btu/hr• ∆Uo≈ +/- 4 btu/lb °F hr• ∆Ui≈ +/- 4 to +/- 1.6 btu/lb °F hr
The problem with Error Analysis is that it is a lot of work, and you want everyone to know how hard you worked on it.Move all these slides (and any other supporting slides) after the Q&A slide at the end.If anyone has follow up questions on this, you can take them to the extra slides. This is an excellent technique that can really impress your audience.

Propagation of Error Heat Transfer
90000140000190000240000290000340000
75 125 175 225 275
Condensate Mass Out (lb/hr)
Hea
t Tra
nsfe
r Rat
e(b
tu/h
r)
Q-tubeside Q-shellside
This is just a repeat of an earlier slide with error bars included. Why put the audience through it twice?

Propagation of Error Heat Transfer Coefficient
50
100
150
200
250
300
50 100 150 200 250 300
Condensate Mass Out (lb/hr)
Hea
t Tra
nsfe
r C
oeffi
cien
t (b
tu/lb
*F*h
r)
U inside U outside

Conclusions and
Recommendations
Finally….

Conclusions
• QTS, QSS, Uo all increase as the steam flow rate increases
• QTS, QSS, Uo all have a linear relationship with the mass flow rate of the steam
• Heat transfer rate of the tube side is equal to the heat transfer rate of the shell side

Recommendations
• Operation Recommendation– Operate the shell and tube heat exchanger at
approximately 75% for sufficient heat transfer and economic efficiency
• Experiment Recommendations– Monitor pressure gauge (PG-07) at low steam
rates to prevent a vacuum
The first one is good.Second one has nothing to do with anything else presented up to this point.

References
• API Heat Transfer. Shell and Tube Heat Exchanger Picturewww.apiheattransfer.com/en/Products/HeatExchangers/ShellAndTube/
• Georgia Tech. Propagation of Error. www.swiki.che.gatech.edu/CHE4200. August 2002.
• Geankoplis, Christie J. Transport Processes and Unit Operations, 3rd ed. Englewood Cliffs, NJ. Prentice-Hall Publishing, Inc. 1993.
• Heald, C. C. Cameron Hydraulic Data. Liberty Corner, NJ. Ingersoll-Dresser Pump Co. 1998.
• Peters, Timmerhaus, West. Plant Design and Economics for Chemical Engineers, 5th ed. New York, NY. McGaw-Hill Co. Inc., 2003.
Another required slide.

This presentation was 28 slides. That’s enough for most 50 minute lectures! You only have 10.
Proofread.Any spelin errors?Appropriate grammar?Format consistency?Punctuation consistency?
Practice.Use a stopwatch.Don’t rush it.Work on voice rate, volume, clarity.Avoid casual language!Show confidence – you just ran the experiment and calculated the results –you are the resident expert on this project!