Embed Size (px)
Citation preview
Shepparton North East Growth Corridor Development Traffic Impact Assessment
Nordic Pty Ltd 21 November 2008 Document No.: 1007tpe
D R A F T
Traffic Impact Assessment Prepared for
Nordic Pty Ltd Prepared by Maunsell Australia Pty Ltd Level 9, 8 Exhibition Street, Melbourne VIC 3000, Australia T +61 3 9653 1234 F +61 3 9654 7117 www.maunsell.com ABN 20 093 846 925
21 November 2008 600 282 55 © Maunsell Australia Pty Ltd 2008 The information contained in this document produced by Maunsell Australia Pty Ltd is solely for the use of the Client identified on the cover sheet for the purpose for which it has been prepared and Maunsell Australia Pty Ltd undertakes no duty to or accepts any responsibility to any third party who may rely upon this document. All rights reserved. No section or element of this document may be removed from this document, reproduced, electronically stored or transmitted in any form without the written permission of Maunsell Australia Pty Ltd.
D R A F T
Shepparton North East Growth Corridor Development Traffic Impact Assessment P:\60028255 V07PU Shepparton\6_Draft_docs\6.1_Reports\Traffic and Transportation\1007tpe Traffic Assessment 20Nov08.doc Revision 21 November 2008
Quality Information Document Traffic Impact Assessment
Ref 600 282 55
Date 21 November 2008
Prepared by Kate Butler
Reviewed by Nicole Broekman
Revision History
Authorised Revision Revision
Date Details Name/Position Signature
0 24/10/2008 Draft Traffic Impact Assessment
Stephen Pelosi
D R A F T
Shepparton North East Growth Corridor Development Traffic Impact Assessment P:\60028255 V07PU Shepparton\6_Draft_docs\6.1_Reports\Traffic and Transportation\1007tpe Traffic Assessment 20Nov08.doc Revision 21 November 2008
Table of Contents Executive Summary i 1.0 Introduction 1
1.1 Project Background 1 1.2 Purpose 2 1.3 Project Methodology 2 1.4 Report Structure 2
2.0 Existing Conditions 3 2.1 Site Locality 3 2.2 Road Network 3 2.3 Traffic Volumes on Local Roads 4 2.4 Turning Movement Counts 5 2.5 Accident History 7 2.6 Committed Traffic Improvements and Developments 9
2.6.1 Shepparton Valley Bypass 9 2.6.2 Northern Neighbourhood Centre Extension 9
2.7 Cycle Network 10 3.0 Existing Traffic Operation 12
3.1 Overview of Local Road Network 12 3.2 SIDRA INTERSECTION Analysis 12
3.2.1 Verney Road and Grahamvale Road Intersections 13 3.2.2 Hawkins Street / Goulburn Valley Highway 15 3.2.3 Verney Road and Hawkins Street (Estimated Intersection) 15
4.0 Proposed Development 17 4.1 Land Use 17
4.1.1 Residential 17 4.1.2 Retail and Community Facilities 17 4.1.3 Grahamvale Primary School 17
4.2 Car Parking Rates 17 4.2.1 Residential Car Parking 17 4.2.2 Retail Car Parking 18
5.0 Vehicular Traffic Generation and Distribution 19 5.1 Traffic Generation 19
5.1.1 Background Traffic Growth 19 5.1.2 Residential 19 5.1.3 Retail 19 5.1.4 Primary School 20 5.1.5 Primary School Traffic Generation Methodology 20
5.2 Vehicular Traffic Distribution 22 5.3 Summary of Forecast Traffic 23
6.0 Traffic Impact 24 6.1 Verney Road and Grahamvale Road Intersections 24
6.1.1 Verney Road Intersections 24 6.1.2 Grahamvale Road Intersections 25
6.2 Hawkins Street Intersections 26 6.2.1 Hawkins / Goulburn Valley Highway Priority Intersection 26
6.3 Verney Road / Hawkins Street T-Intersection Estimate 29 6.4 Development Entrance Treatments 30 6.5 Conclusions 31
6.5.1 Verney Road and Grahamvale Road 31 6.5.2 Hawkins Street / Goulburn Valley Highway 31 6.5.3 Hawkins Street / Verney Road 32 6.5.4 Development Entrance Treatments 32
7.0 Further Issues 33 7.1 Sustainable Transport Design 33
D R A F T
Shepparton North East Growth Corridor Development Traffic Impact Assessment P:\60028255 V07PU Shepparton\6_Draft_docs\6.1_Reports\Traffic and Transportation\1007tpe Traffic Assessment 20Nov08.doc Revision 21 November 2008
7.2 Encouraging Shepparton Bypass Development 33 7.3 Data Collection and Analysis 33 7.4 Further Developments of in the North East Growth Area 34
Appendix A Existing Traffic Flows A Appendix B SIDRA Analysis B Appendix C Additional Traffic Movement Distribution C
List of Tables Table 2.1: Peak Hour Traffic Volumes 4 Table 3.1: SIDRA Definition of Levels of Service and Delay 13 Table 3.2: Verney Road / Balaclava Road Existing Peak Hour Intersection Operation
(Roundabout) 14 Table 3.3: Verney Road / Ford Road Existing Peak Hour Intersection Operation
(Roundabout) 14 Table 3.4: Grahamvale Road / Dookie Shepparton Road Existing Peak Hour Intersection
Operation (Roundabout) 14 Table 3.5: Grahamvale Road / Ford Road Existing Peak Hour Intersection Operation
(Priority Junction) 15 Table 3.6: Hawkins Street / Goulburn Valley Highway SIDRA Analysis for 2008 Scenario 15 Table 3.7: Verney Road / Hawkins Street SIDRA Analysis for 2008 Intersection Estimate 16 Table 4.1: Residential Dwelling Composition 17 Table 5.1: RTA Guide Generation Rates (October 2002) 19 Table 5.2: Total Trips Generated by Students on the External Road Network 21 Table 5.3: Summary of Forecast Traffic 23 Table 6.1: Verney Road / Balaclava Road 2020 Peak Hour Roundabout Operation with
Development Traffic 24 Table 6.2: Verney Road / Ford Road 2020 Peak Hour Roundabout Operation with
Development Traffic 25 Table 6.3: Grahamvale Road / Dookie Shepparton Road 2020 Peak Hour Roundabout
Operation with Development Traffic 25 Table 6.4: Grahamvale Road / Ford Road 2020 Peak Hour Priority Junction Operation with
Development Traffic 26 Table 6.5: Estimated 2020 Traffic Flows* 26 Table 6.6: Hawkins Street / Goulburn Valley Highway SIDRA Analysis for 2020 Scenario
without Development Traffic 27 Table 6.7: Estimated 2020 Traffic Flows with Development Traffic* 27 Table 6.8: Hawkins Street / Goulburn Valley Highway SIDRA Analysis for 2020 Scenario
without Development Traffic 28 Table 6.9: Hawkins Street / Goulburn Valley Highway SIDRA Analysis for 2020 Scenario
with Proposed Development Signalised Intersection 29 Table 6.10: Verney Road / Hawkins Street SIDRA Analysis 2020 with Proposed
Development T-Intersection Estimate 30 Table 6.11: Verney Road / Hawkins Street 2020 Peak Hour Roundabout Operation with
NEGA Traffic Flows 30
D R A F T
Shepparton North East Growth Corridor Development Traffic Impact Assessment P:\60028255 V07PU Shepparton\6_Draft_docs\6.1_Reports\Traffic and Transportation\1007tpe Traffic Assessment 20Nov08.doc Revision 21 November 2008
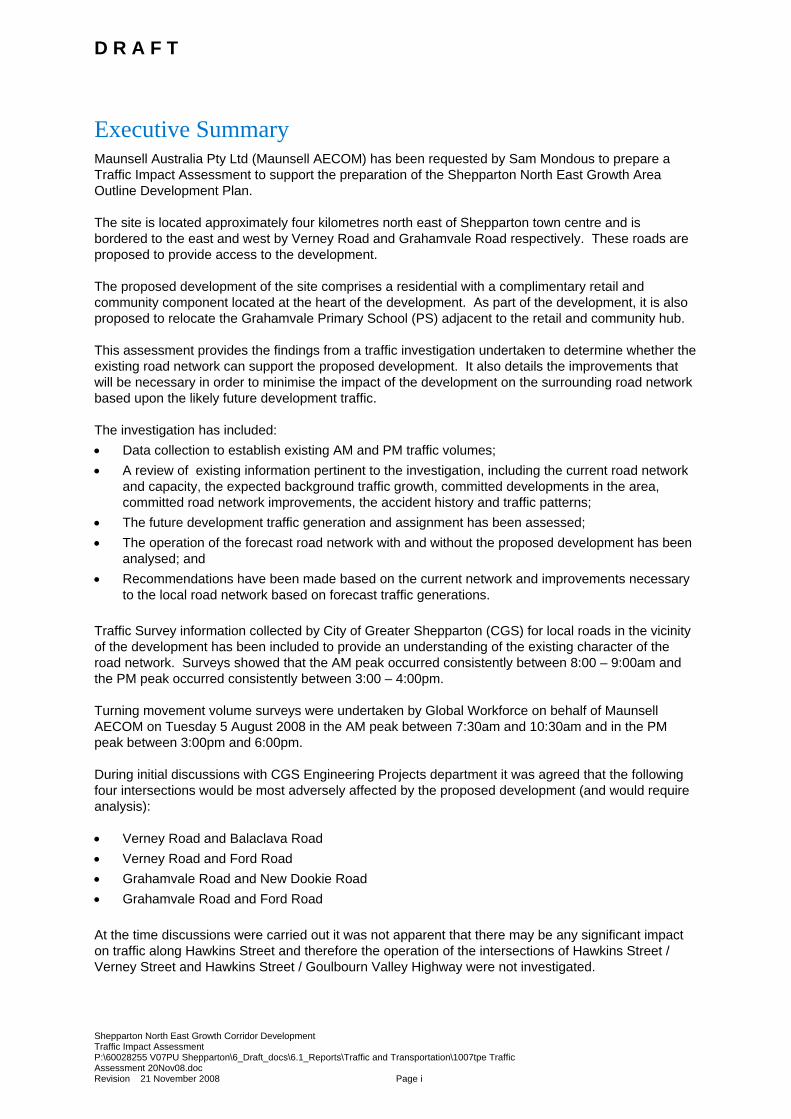
Executive Summary Maunsell Australia Pty Ltd (Maunsell AECOM) has been requested by Sam Mondous to prepare a Traffic Impact Assessment to support the preparation of the Shepparton North East Growth Area Outline Development Plan. The site is located approximately four kilometres north east of Shepparton town centre and is bordered to the east and west by Verney Road and Grahamvale Road respectively. These roads are proposed to provide access to the development. The proposed development of the site comprises a residential with a complimentary retail and community component located at the heart of the development. As part of the development, it is also proposed to relocate the Grahamvale Primary School (PS) adjacent to the retail and community hub. This assessment provides the findings from a traffic investigation undertaken to determine whether the existing road network can support the proposed development. It also details the improvements that will be necessary in order to minimise the impact of the development on the surrounding road network based upon the likely future development traffic. The investigation has included: • Data collection to establish existing AM and PM traffic volumes; • A review of existing information pertinent to the investigation, including the current road network
and capacity, the expected background traffic growth, committed developments in the area, committed road network improvements, the accident history and traffic patterns;
• The future development traffic generation and assignment has been assessed; • The operation of the forecast road network with and without the proposed development has been
analysed; and • Recommendations have been made based on the current network and improvements necessary
to the local road network based on forecast traffic generations. Traffic Survey information collected by City of Greater Shepparton (CGS) for local roads in the vicinity of the development has been included to provide an understanding of the existing character of the road network. Surveys showed that the AM peak occurred consistently between 8:00 – 9:00am and the PM peak occurred consistently between 3:00 – 4:00pm. Turning movement volume surveys were undertaken by Global Workforce on behalf of Maunsell AECOM on Tuesday 5 August 2008 in the AM peak between 7:30am and 10:30am and in the PM peak between 3:00pm and 6:00pm. During initial discussions with CGS Engineering Projects department it was agreed that the following four intersections would be most adversely affected by the proposed development (and would require analysis): • Verney Road and Balaclava Road • Verney Road and Ford Road • Grahamvale Road and New Dookie Road • Grahamvale Road and Ford Road At the time discussions were carried out it was not apparent that there may be any significant impact on traffic along Hawkins Street and therefore the operation of the intersections of Hawkins Street / Verney Street and Hawkins Street / Goulbourn Valley Highway were not investigated.
D R A F T
Shepparton North East Growth Corridor Development Traffic Impact Assessment P:\60028255 V07PU Shepparton\6_Draft_docs\6.1_Reports\Traffic and Transportation\1007tpe Traffic Assessment 20Nov08.doc Revision 21 November 2008 Page i
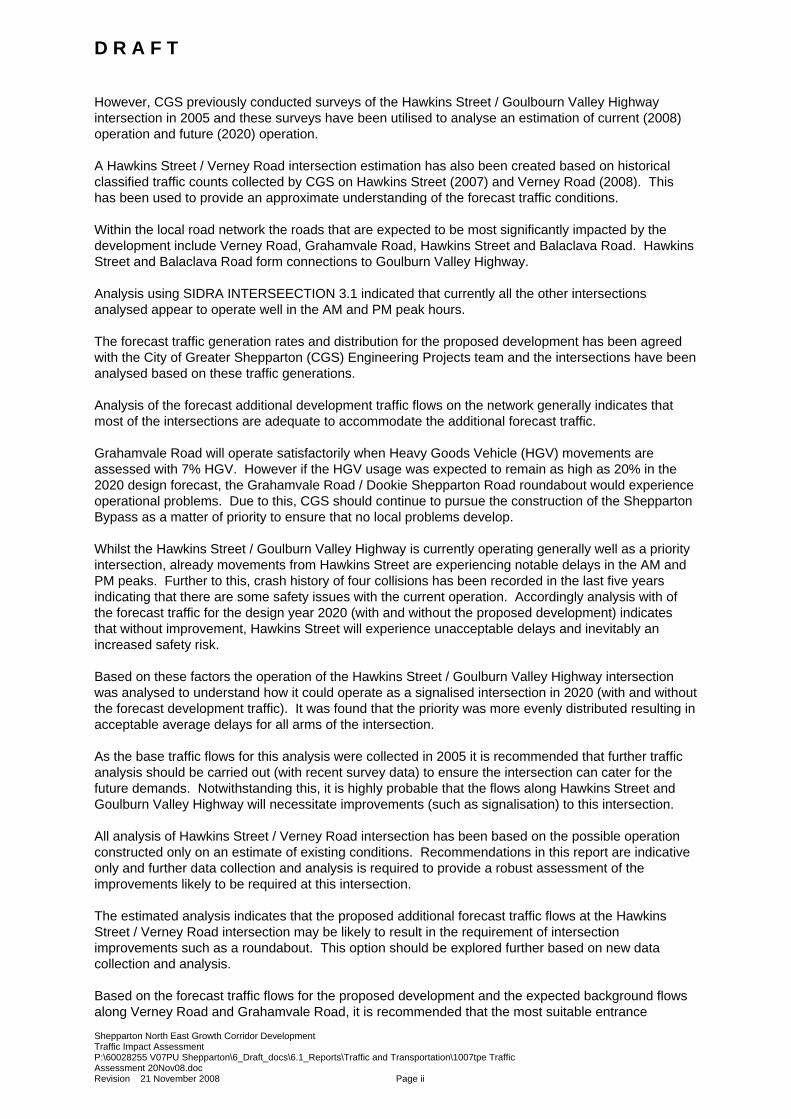
However, CGS previously conducted surveys of the Hawkins Street / Goulbourn Valley Highway intersection in 2005 and these surveys have been utilised to analyse an estimation of current (2008) operation and future (2020) operation. A Hawkins Street / Verney Road intersection estimation has also been created based on historical classified traffic counts collected by CGS on Hawkins Street (2007) and Verney Road (2008). This has been used to provide an approximate understanding of the forecast traffic conditions. Within the local road network the roads that are expected to be most significantly impacted by the development include Verney Road, Grahamvale Road, Hawkins Street and Balaclava Road. Hawkins Street and Balaclava Road form connections to Goulburn Valley Highway. Analysis using SIDRA INTERSEECTION 3.1 indicated that currently all the other intersections analysed appear to operate well in the AM and PM peak hours. The forecast traffic generation rates and distribution for the proposed development has been agreed with the City of Greater Shepparton (CGS) Engineering Projects team and the intersections have been analysed based on these traffic generations. Analysis of the forecast additional development traffic flows on the network generally indicates that most of the intersections are adequate to accommodate the additional forecast traffic. Grahamvale Road will operate satisfactorily when Heavy Goods Vehicle (HGV) movements are assessed with 7% HGV. However if the HGV usage was expected to remain as high as 20% in the 2020 design forecast, the Grahamvale Road / Dookie Shepparton Road roundabout would experience operational problems. Due to this, CGS should continue to pursue the construction of the Shepparton Bypass as a matter of priority to ensure that no local problems develop. Whilst the Hawkins Street / Goulburn Valley Highway is currently operating generally well as a priority intersection, already movements from Hawkins Street are experiencing notable delays in the AM and PM peaks. Further to this, crash history of four collisions has been recorded in the last five years indicating that there are some safety issues with the current operation. Accordingly analysis with of the forecast traffic for the design year 2020 (with and without the proposed development) indicates that without improvement, Hawkins Street will experience unacceptable delays and inevitably an increased safety risk. Based on these factors the operation of the Hawkins Street / Goulburn Valley Highway intersection was analysed to understand how it could operate as a signalised intersection in 2020 (with and without the forecast development traffic). It was found that the priority was more evenly distributed resulting in acceptable average delays for all arms of the intersection. As the base traffic flows for this analysis were collected in 2005 it is recommended that further traffic analysis should be carried out (with recent survey data) to ensure the intersection can cater for the future demands. Notwithstanding this, it is highly probable that the flows along Hawkins Street and Goulburn Valley Highway will necessitate improvements (such as signalisation) to this intersection. All analysis of Hawkins Street / Verney Road intersection has been based on the possible operation constructed only on an estimate of existing conditions. Recommendations in this report are indicative only and further data collection and analysis is required to provide a robust assessment of the improvements likely to be required at this intersection. The estimated analysis indicates that the proposed additional forecast traffic flows at the Hawkins Street / Verney Road intersection may be likely to result in the requirement of intersection improvements such as a roundabout. This option should be explored further based on new data collection and analysis. Based on the forecast traffic flows for the proposed development and the expected background flows along Verney Road and Grahamvale Road, it is recommended that the most suitable entrance
D R A F T
Shepparton North East Growth Corridor Development Traffic Impact Assessment P:\60028255 V07PU Shepparton\6_Draft_docs\6.1_Reports\Traffic and Transportation\1007tpe Traffic Assessment 20Nov08.doc Revision 21 November 2008 Page ii
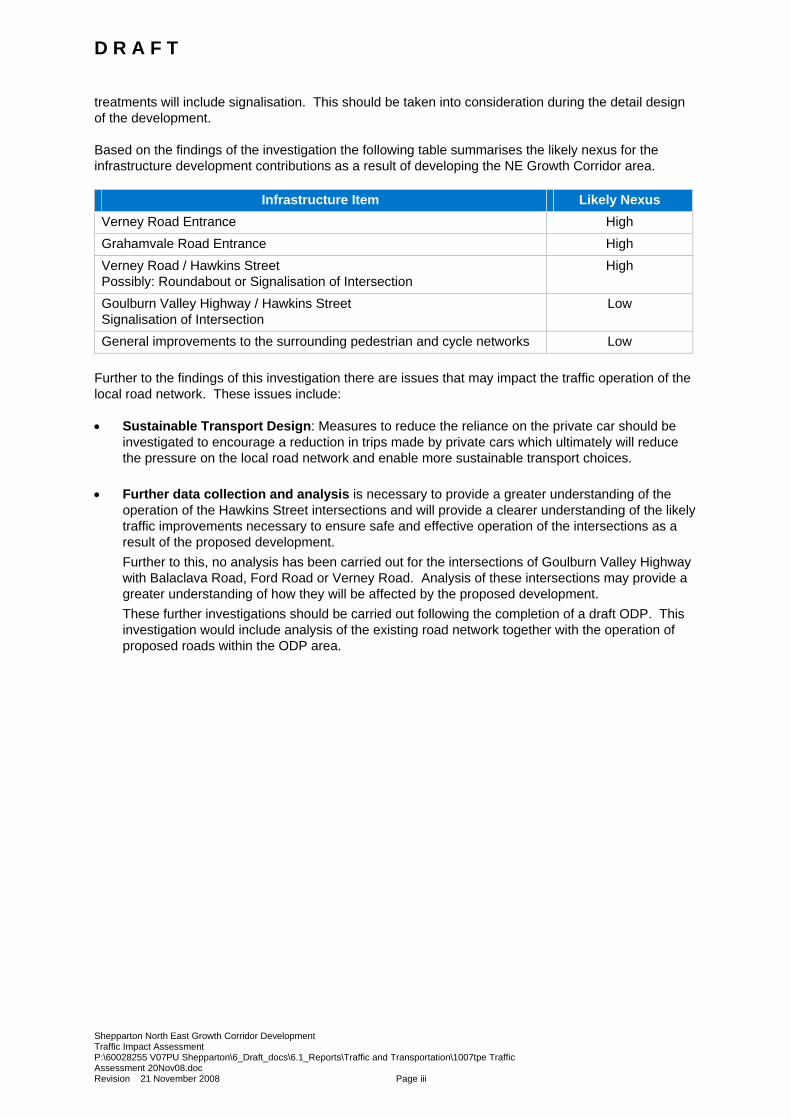
treatments will include signalisation. This should be taken into consideration during the detail design of the development. Based on the findings of the investigation the following table summarises the likely nexus for the infrastructure development contributions as a result of developing the NE Growth Corridor area.
Infrastructure Item Likely Nexus Verney Road Entrance High Grahamvale Road Entrance High Verney Road / Hawkins Street Possibly: Roundabout or Signalisation of Intersection
High
Goulburn Valley Highway / Hawkins Street Signalisation of Intersection
Low
General improvements to the surrounding pedestrian and cycle networks Low Further to the findings of this investigation there are issues that may impact the traffic operation of the local road network. These issues include: • Sustainable Transport Design: Measures to reduce the reliance on the private car should be
investigated to encourage a reduction in trips made by private cars which ultimately will reduce the pressure on the local road network and enable more sustainable transport choices.
• Further data collection and analysis is necessary to provide a greater understanding of the
operation of the Hawkins Street intersections and will provide a clearer understanding of the likely traffic improvements necessary to ensure safe and effective operation of the intersections as a result of the proposed development. Further to this, no analysis has been carried out for the intersections of Goulburn Valley Highway with Balaclava Road, Ford Road or Verney Road. Analysis of these intersections may provide a greater understanding of how they will be affected by the proposed development. These further investigations should be carried out following the completion of a draft ODP. This investigation would include analysis of the existing road network together with the operation of proposed roads within the ODP area.
D R A F T
Shepparton North East Growth Corridor Development Traffic Impact Assessment P:\60028255 V07PU Shepparton\6_Draft_docs\6.1_Reports\Traffic and Transportation\1007tpe Traffic Assessment 20Nov08.doc Revision 21 November 2008 Page iii
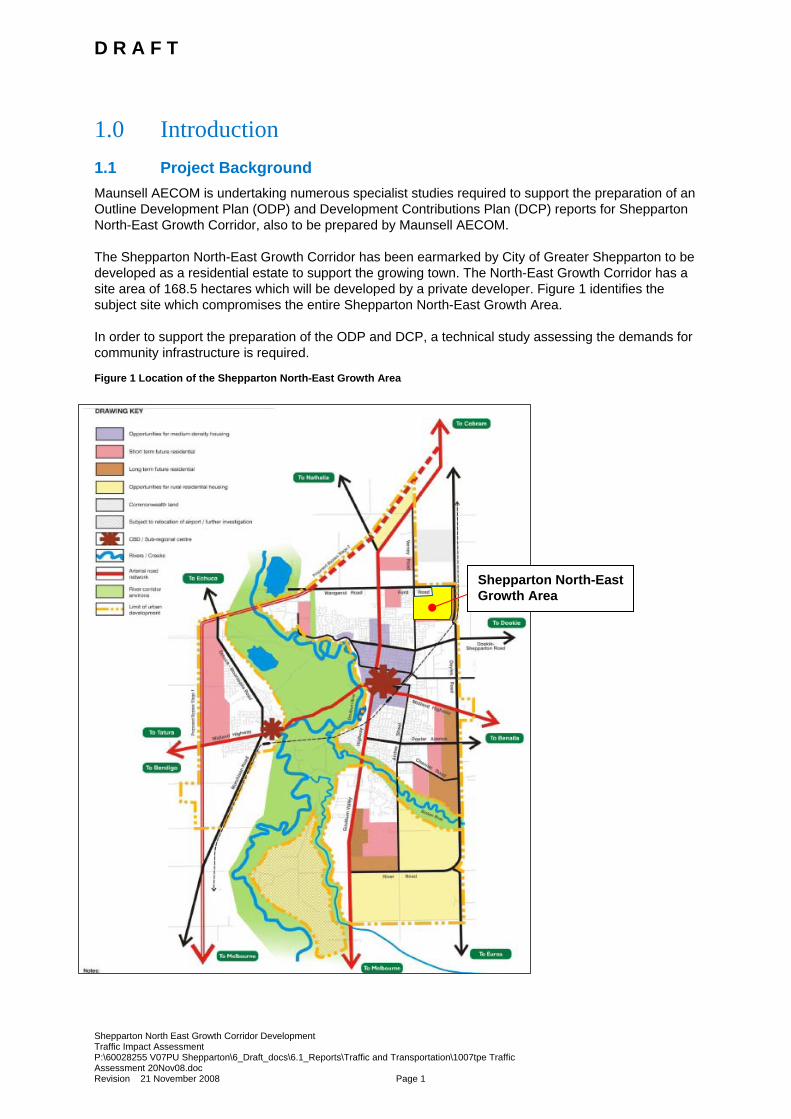
1.0 Introduction 1.1 Project Background Maunsell AECOM is undertaking numerous specialist studies required to support the preparation of an Outline Development Plan (ODP) and Development Contributions Plan (DCP) reports for Shepparton North-East Growth Corridor, also to be prepared by Maunsell AECOM. The Shepparton North-East Growth Corridor has been earmarked by City of Greater Shepparton to be developed as a residential estate to support the growing town. The North-East Growth Corridor has a site area of 168.5 hectares which will be developed by a private developer. Figure 1 identifies the subject site which compromises the entire Shepparton North-East Growth Area. In order to support the preparation of the ODP and DCP, a technical study assessing the demands for community infrastructure is required.
Figure 1 Location of the Shepparton North-East Growth Area
-
Shepparton North-East Growth Area
D R A F T
Shepparton North East Growth Corridor Development Traffic Impact Assessment P:\60028255 V07PU Shepparton\6_Draft_docs\6.1_Reports\Traffic and Transportation\1007tpe Traffic Assessment 20Nov08.doc Revision 21 November 2008 Page 1
1.2 Purpose This report provides the findings from a traffic investigation undertaken to determine whether the existing road network can support the proposed development. It also details the improvements that will be necessary in order to minimise the impact of the development on the surrounding road network based upon the likely future development traffic.
1.3 Project Methodology Maunsell’s Traffic Engineers will investigate the overall implications of residential expansion on the existing transport network to the north east of Shepparton including the broader sub-region. We will investigate the following: • Reviewing existing information pertinent to the investigation, including the current road network
and capacity, the expected background traffic growth, committed developments in the area, committed road network improvements, the accident history and traffic patterns;
• Assessment of the existing traffic movements in the area and anticipated traffic generated by the development in the growth area;
• Potential capacity constraints on the existing road network; • The adequacy of access and car parking requirements to support future residential development
in the growth area; • Recommendations on necessary improvements to the local road network in order to support the
proposed development; • Potential design solutions for the growth area, which will ensure public transport, walking and
cycling are practical and realistic alternatives for local trips; • Impact of additional traffic on Ford Road due to the opening of the Shepparton Bypass; and • Opportunities to maximise benefits of existing public transport services and infrastructure
requirements.
1.4 Report Structure The remainder of this report is set out as follows: Chapter 2: Describes the existing conditions including; site locality, local road network, traffic
volume and intersection turning movement volume surveys, local accident history and other committed traffic improvements and developments, cycle network and road network improvements located in the vicinity of the site.
Chapter 3: Assessment of existing intersection operation using SIDRA INTERSECTION software
Chapter 4: Details of the proposed development and car parking rates.
Chapter 5: Details the vehicular traffic generation associated with the site and the expected traffic distribution.
Chapter 6: Includes a description of the expected traffic impact of the development based on the forecast traffic flows on the local road network and the traffic impact conclusions.
Chapter 7: Discusses further traffic issues that should be considered as a part of the development process.
Appendix A details the existing traffic flows, Appendix B includes the summaries for the SIDRA analysis and Appendix C includes the details of the traffic distribution.
D R A F T
Shepparton North East Growth Corridor Development Traffic Impact Assessment P:\60028255 V07PU Shepparton\6_Draft_docs\6.1_Reports\Traffic and Transportation\1007tpe Traffic Assessment 20Nov08.doc Revision 21 November 2008 Page 2
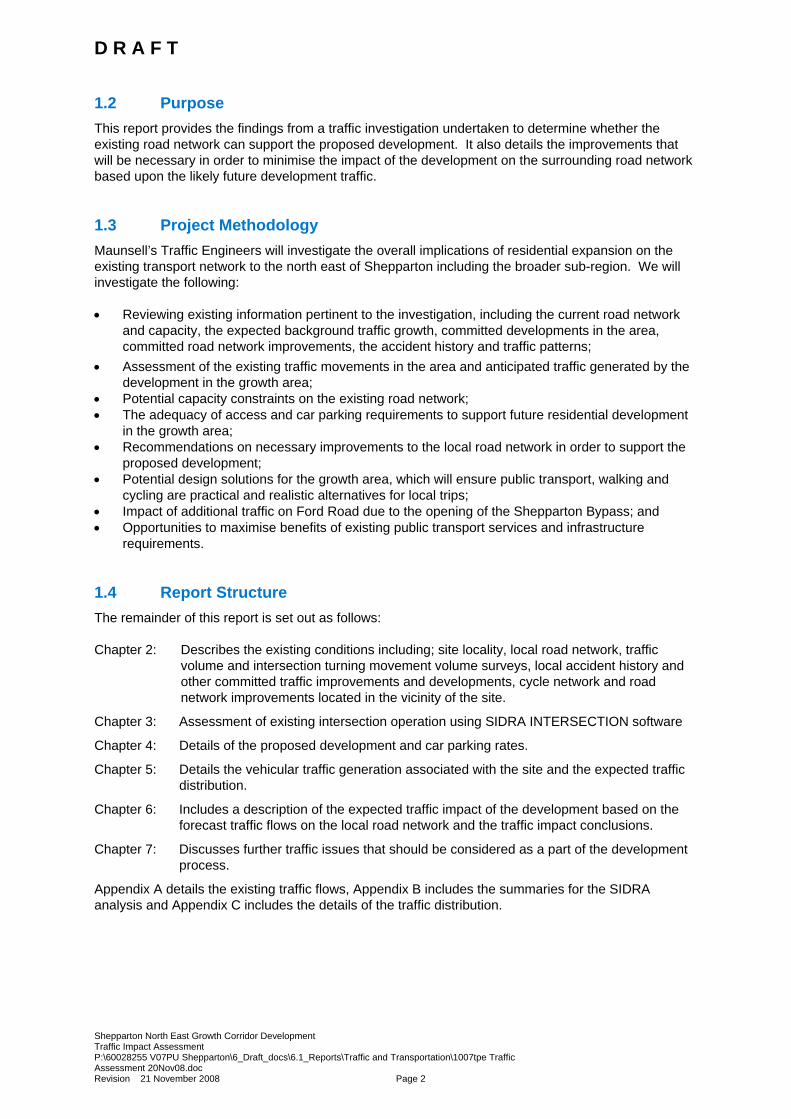
2.0 Existing Conditions 2.1 Site Locality The site is located approximately four kilometres north east of Shepparton town centre. As shown in Figure 2.1, the development site is bordered by Ford Road in the north, Grahamvale Road to the east, private agricultural land to the south and Verney Road to the west.
Figure 2.1: Site Location
(source: maps.google.com)
2.2 Road Network Verney Road is a local road aligned north south between Goulburn Valley Highway and Balaclava/New Dookie Road. In the vicinity of the site there is one lane in each direction and cycle lanes on both sides. Mainly the shoulders are unsealed, however near some intersections the shoulders are sealed and formal footpaths exist. There is a short length of shared path on the western side of Verney Road in the vicinity of the site. Balaclava Road is a collector road aligned east west between Goulburn Valley Highway (Numurkah Road) and New Dookie Road. There is one lane in each direction, cycle lanes on both sides and parallel car parking on the northern side. There are formal footpaths on both sides. New Dookie Road extends east approximately 400 m where it becomes Dookie Shepparton Road and continues to Dookie. In the vicinity of the site (between Verney Road and Grahamvale Road) this road has one lane in each direction with unsealed shoulders.
Site Location
D R A F T
Shepparton North East Growth Corridor Development Traffic Impact Assessment P:\60028255 V07PU Shepparton\6_Draft_docs\6.1_Reports\Traffic and Transportation\1007tpe Traffic Assessment 20Nov08.doc Revision 21 November 2008 Page 3
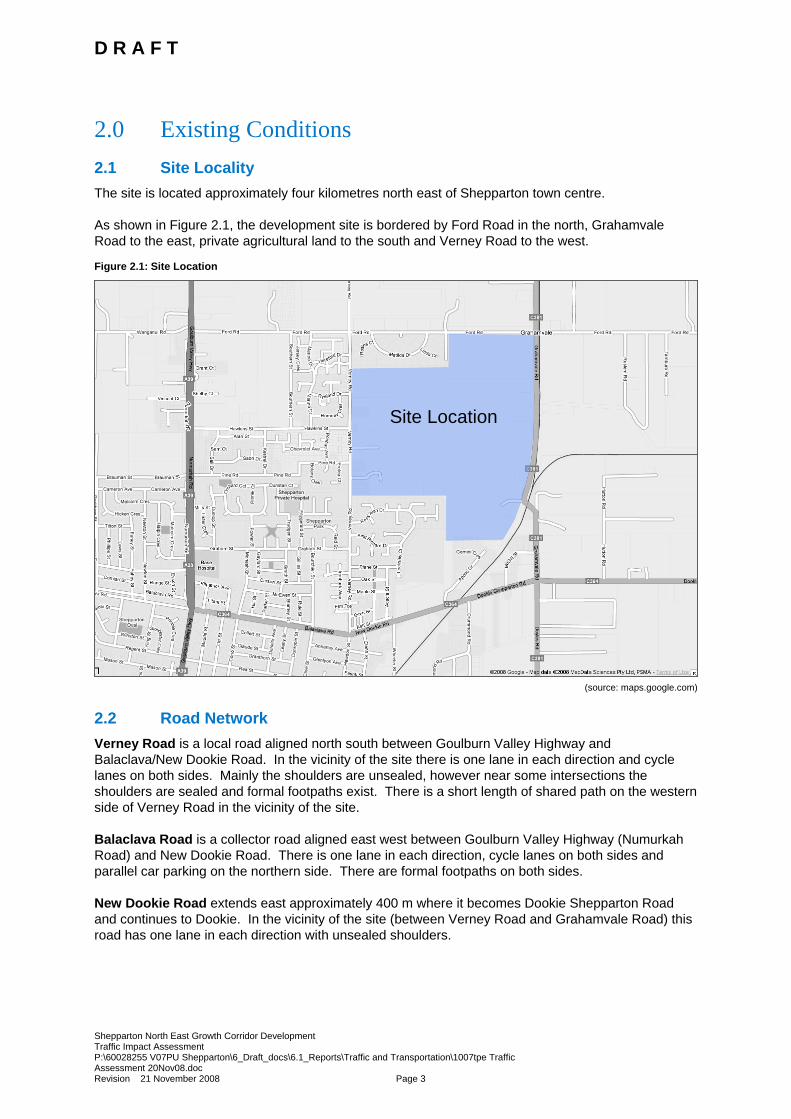
Forming the eastern border of the site, Grahamvale Road is a local road aligned north south from Katamatite Shepparton Road to the roundabout at Dookie Shepparton Road. In the vicinity of the site Grahamvale Road has one lane in each direction and a narrow sealed shoulder. Grahamvale Road is the current formal town bypass for Heavy Goods Vehicles (HGVs) and accordingly HGVs comprise approximately 20% of all movements along this route. Forming the northern border of the site, Ford Road is a local road aligned east west between Lemnos North Road, Lemnos and Goulburn Valley Highway. In the vicinity of the site there is one lane in each direction (unmarked) and unsealed shoulders. Hawkins Street is aligned east west between Verney Road and Goulburn Valley Highway and provides the most direct access to Goulburn Valley Highway from the site. Hawkins Street has been designed to act as a an informal collector road with the Northern Neighbourhood (Retail) Centre located on the corner of Hawkins Street and Goulburn Valley Highway and reduced number of houses with frontages (including 18 crossovers on the North side and 12 crossovers on the South side). Goulburn Valley Highway (Numurkah Road) is defined as a road of national importance. In the greater area near the site the Goulburn Valley Highway (Numurkah Road) has one lane in each direction, sealed shoulders and a series of service roads to cater for active frontages.
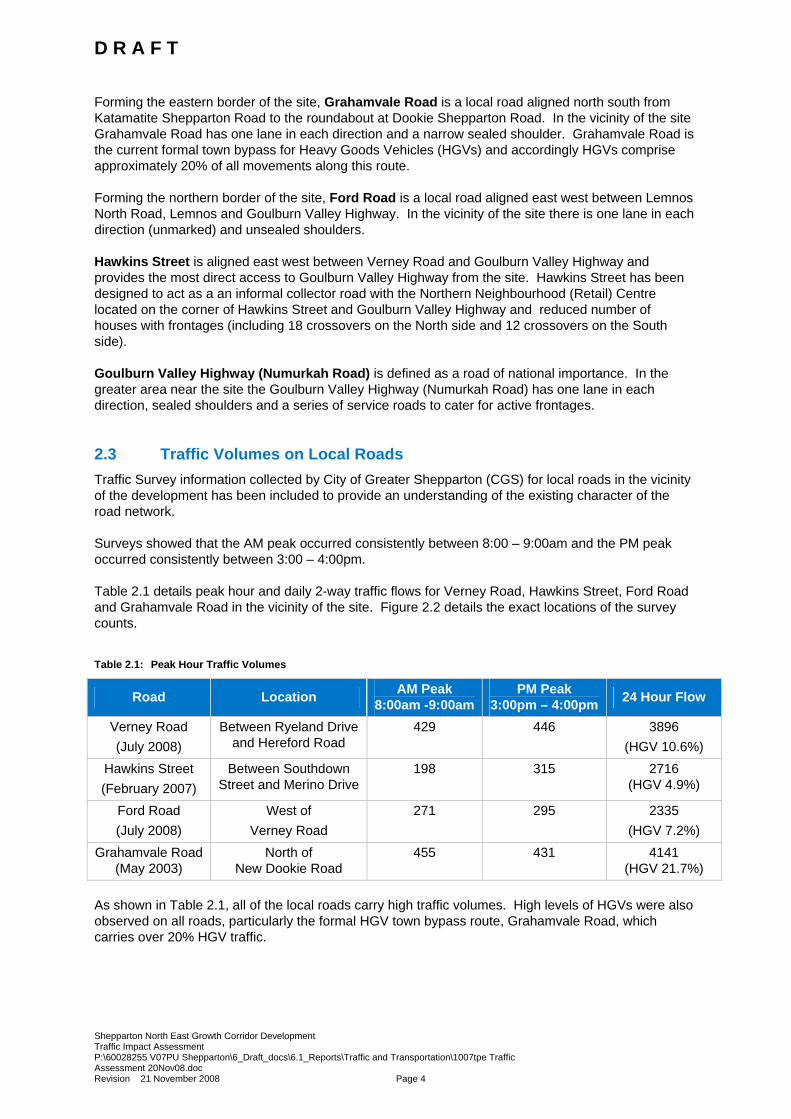
2.3 Traffic Volumes on Local Roads Traffic Survey information collected by City of Greater Shepparton (CGS) for local roads in the vicinity of the development has been included to provide an understanding of the existing character of the road network. Surveys showed that the AM peak occurred consistently between 8:00 – 9:00am and the PM peak occurred consistently between 3:00 – 4:00pm. Table 2.1 details peak hour and daily 2-way traffic flows for Verney Road, Hawkins Street, Ford Road and Grahamvale Road in the vicinity of the site. Figure 2.2 details the exact locations of the survey counts.
Table 2.1: Peak Hour Traffic Volumes
Road Location AM Peak 8:00am -9:00am
PM Peak 3:00pm – 4:00pm 24 Hour Flow
Verney Road (July 2008)
Between Ryeland Drive and Hereford Road
429
446
3896 (HGV 10.6%)
Hawkins Street (February 2007)
Between Southdown Street and Merino Drive
198 315 2716 (HGV 4.9%)
Ford Road (July 2008)
West of Verney Road
271
295 2335 (HGV 7.2%)
Grahamvale Road (May 2003)
North of New Dookie Road
455 431 4141 (HGV 21.7%)
As shown in Table 2.1, all of the local roads carry high traffic volumes. High levels of HGVs were also observed on all roads, particularly the formal HGV town bypass route, Grahamvale Road, which carries over 20% HGV traffic.
D R A F T
Shepparton North East Growth Corridor Development Traffic Impact Assessment P:\60028255 V07PU Shepparton\6_Draft_docs\6.1_Reports\Traffic and Transportation\1007tpe Traffic Assessment 20Nov08.doc Revision 21 November 2008 Page 4
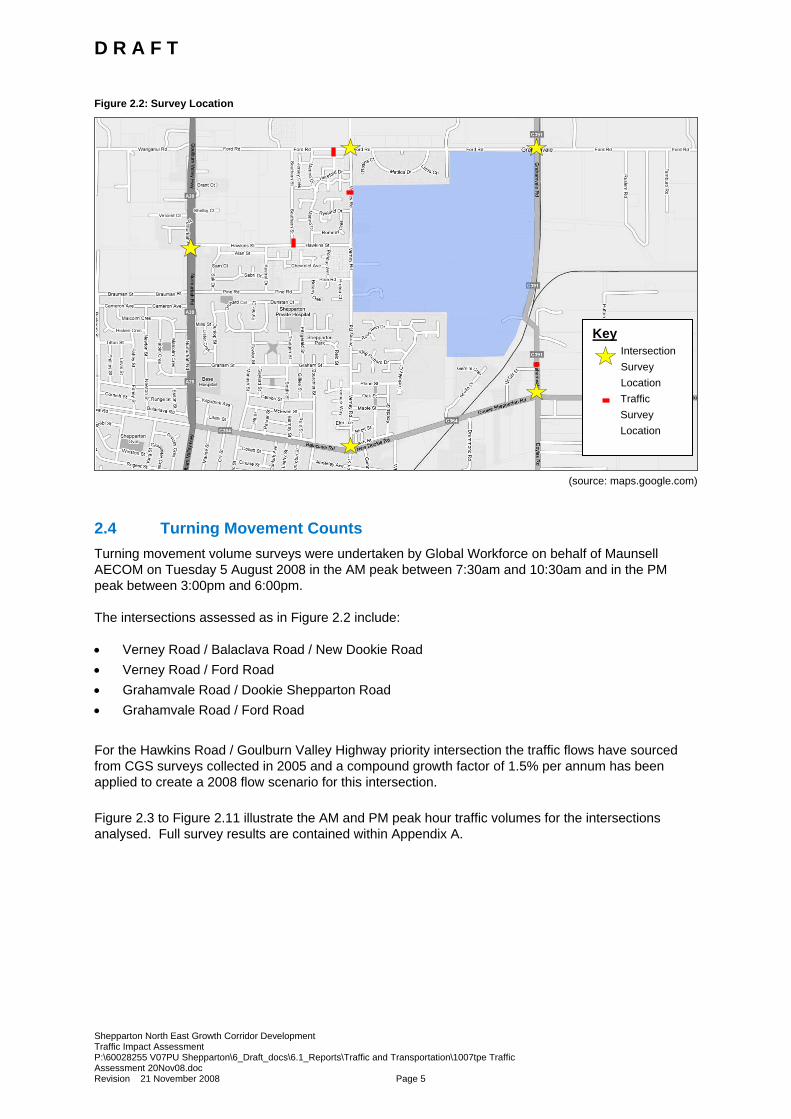
Figure 2.2: Survey Location
(source: maps.google.com)
2.4 Turning Movement Counts Turning movement volume surveys were undertaken by Global Workforce on behalf of Maunsell AECOM on Tuesday 5 August 2008 in the AM peak between 7:30am and 10:30am and in the PM peak between 3:00pm and 6:00pm. The intersections assessed as in Figure 2.2 include: • Verney Road / Balaclava Road / New Dookie Road • Verney Road / Ford Road • Grahamvale Road / Dookie Shepparton Road • Grahamvale Road / Ford Road For the Hawkins Road / Goulburn Valley Highway priority intersection the traffic flows have sourced from CGS surveys collected in 2005 and a compound growth factor of 1.5% per annum has been applied to create a 2008 flow scenario for this intersection. Figure 2.3 to Figure 2.11 illustrate the AM and PM peak hour traffic volumes for the intersections analysed. Full survey results are contained within Appendix A.
Key Intersection Survey Location Traffic Survey Location
D R A F T
Shepparton North East Growth Corridor Development Traffic Impact Assessment P:\60028255 V07PU Shepparton\6_Draft_docs\6.1_Reports\Traffic and Transportation\1007tpe Traffic Assessment 20Nov08.doc Revision 21 November 2008 Page 5
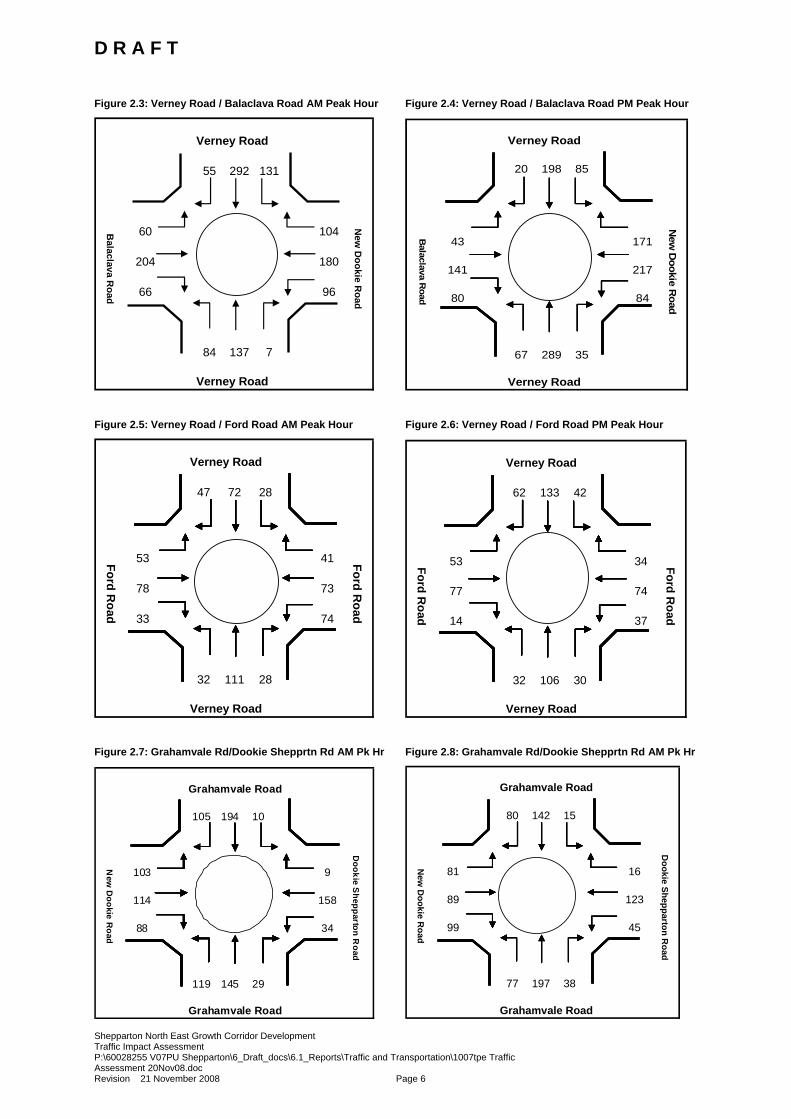
Figure 2.3: Verney Road / Balaclava Road AM Peak Hour Figure 2.4: Verney Road / Balaclava Road PM Peak Hour
Verney Road
55 292 131
60 104
204 180
66 96
84 137 7
Verney Road
Balaclava R
oad
New
Dookie R
oad
Verney Road
20 198 85
43 171
141 217
80 84
67 289 35
Verney Road
New
Dookie R
oad
Balaclava R
oad
Figure 2.5: Verney Road / Ford Road AM Peak Hour Figure 2.6: Verney Road / Ford Road PM Peak Hour
Verney Road
47 72 28
53 41
78 73
33 74
32 111 28
Verney Road
Ford Road
Ford Road
Verney Road
62 133 42
53 34
77 74
14 37
32 106 30
Verney Road
Ford Road
Ford Road
Figure 2.7: Grahamvale Rd/Dookie Shepprtn Rd AM Pk Hr Figure 2.8: Grahamvale Rd/Dookie Shepprtn Rd AM Pk Hr
Grahamvale Road
105 194 10
103 9
114 158
88 34
119 145 29
Grahamvale Road
Dookie S
hepparton Road
New
Dookie R
oad
Grahamvale Road
80 142 15
81 16
89 123
99 45
77 197 38
Grahamvale Road
Dookie Shepparton R
oad
New
Dookie R
oad
D R A F T
Shepparton North East Growth Corridor Development Traffic Impact Assessment P:\60028255 V07PU Shepparton\6_Draft_docs\6.1_Reports\Traffic and Transportation\1007tpe Traffic Assessment 20Nov08.doc Revision 21 November 2008 Page 6
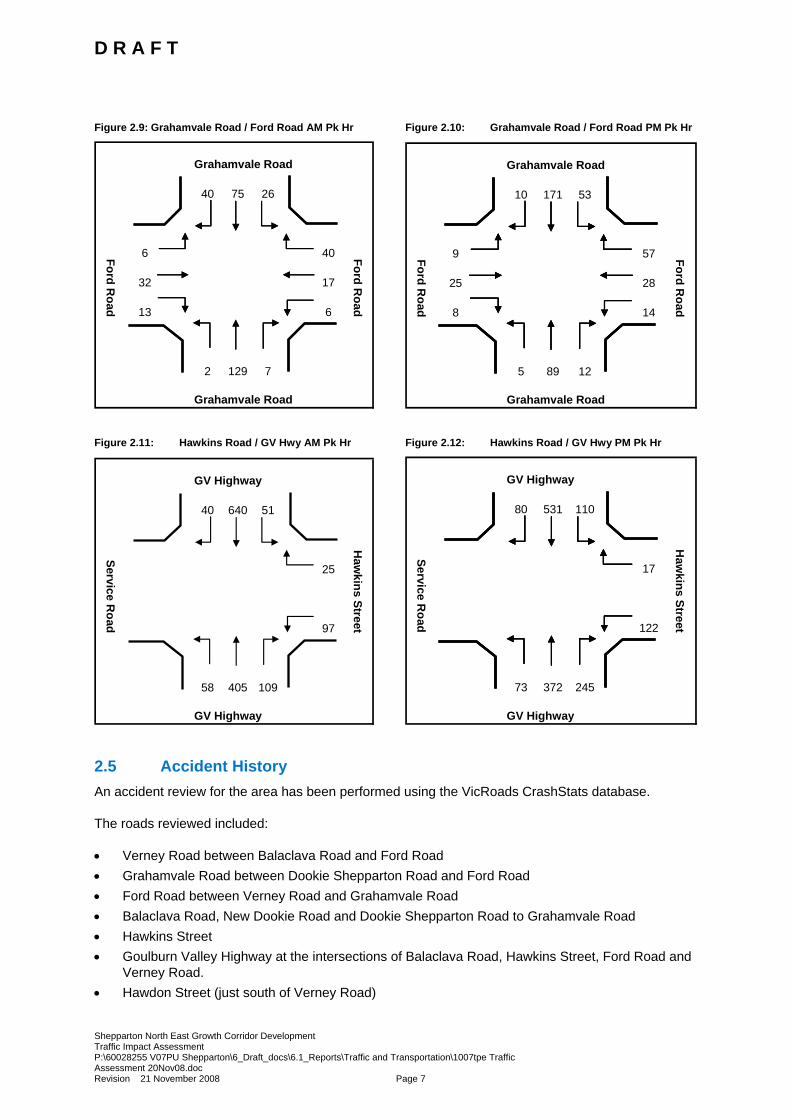
Figure 2.9: Grahamvale Road / Ford Road AM Pk Hr Figure 2.10: Grahamvale Road / Ford Road PM Pk Hr
Grahamvale Road
40 75 26
6 40
32 17
13 6
2 129 7
Grahamvale Road
Ford Road
Ford Road
Grahamvale Road
10 171 53
9 57
25 28
8 14
5 89 12
Grahamvale Road
Ford Road
Ford Road
Figure 2.11: Hawkins Road / GV Hwy AM Pk Hr Figure 2.12: Hawkins Road / GV Hwy PM Pk Hr
GV Highway
40 640 51
0 25
0 0
0 97
58 405 109
GV Highway
Haw
kins Street
Service Road
GV Highway
80 531 110
0 17
0 0
0 122
73 372 245
GV Highway
Haw
kins Street
Service Road
2.5 Accident History An accident review for the area has been performed using the VicRoads CrashStats database. The roads reviewed included: • Verney Road between Balaclava Road and Ford Road • Grahamvale Road between Dookie Shepparton Road and Ford Road • Ford Road between Verney Road and Grahamvale Road • Balaclava Road, New Dookie Road and Dookie Shepparton Road to Grahamvale Road • Hawkins Street • Goulburn Valley Highway at the intersections of Balaclava Road, Hawkins Street, Ford Road and
Verney Road. • Hawdon Street (just south of Verney Road)
D R A F T
Shepparton North East Growth Corridor Development Traffic Impact Assessment P:\60028255 V07PU Shepparton\6_Draft_docs\6.1_Reports\Traffic and Transportation\1007tpe Traffic Assessment 20Nov08.doc Revision 21 November 2008 Page 7
In the five year period between January 2003 and December 2007 there have been 32 accidents along these roads. This resulted in 14 serious injuries and 28 other injuries. No fatalities were recorded at these locations. Between 2003 and 2006 the priority intersection of Hawkins Street and Goulburn Valley Highway experienced four accidents, all during light, day and clear conditions. The accidents were all collisions and they resulted in one serious and seven non-serious injuries. One accident involved a motorbike and another involved a cyclist. These accidents indicate that there are existing safety issues at this intersection. Another pattern was observed just south of the Verney Road / Hawdon Street intersection where 3 rear end accidents were recorded, however there was no pattern to the time of day or road conditions of these accidents. No serious injuries were sustained.
D R A F T
Shepparton North East Growth Corridor Development Traffic Impact Assessment P:\60028255 V07PU Shepparton\6_Draft_docs\6.1_Reports\Traffic and Transportation\1007tpe Traffic Assessment 20Nov08.doc Revision 21 November 2008 Page 8
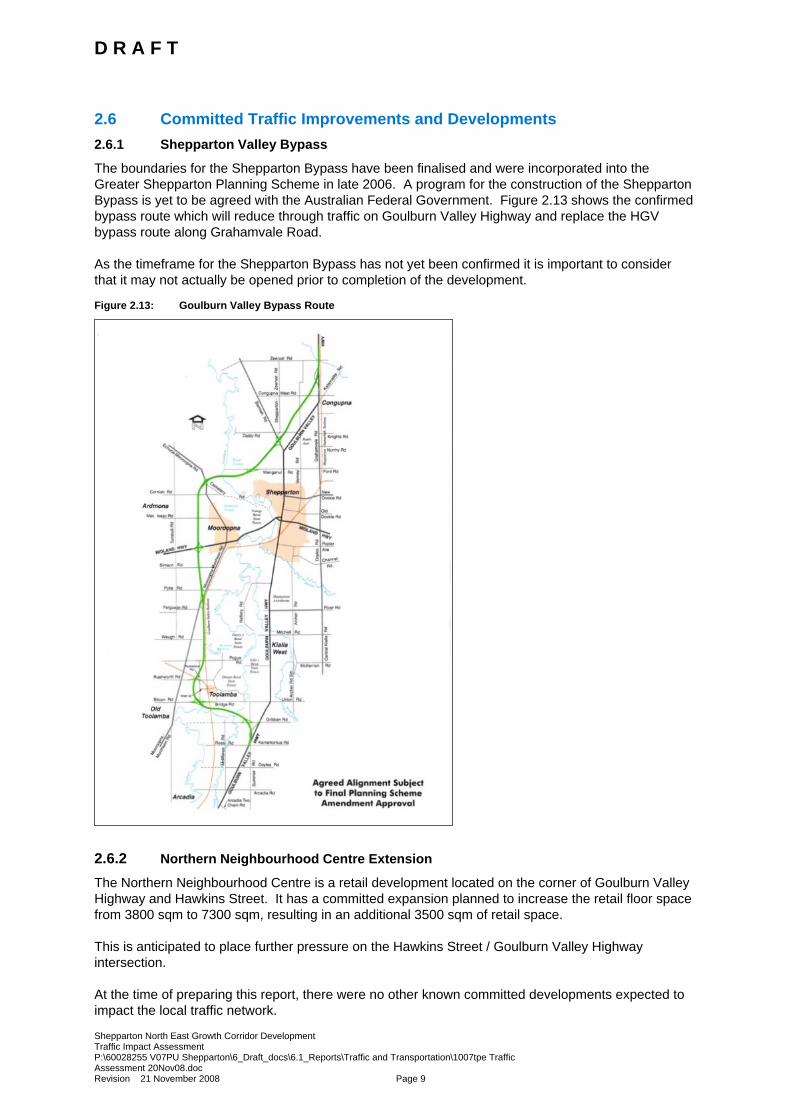
2.6 Committed Traffic Improvements and Developments 2.6.1 Shepparton Valley Bypass
The boundaries for the Shepparton Bypass have been finalised and were incorporated into the Greater Shepparton Planning Scheme in late 2006. A program for the construction of the Shepparton Bypass is yet to be agreed with the Australian Federal Government. Figure 2.13 shows the confirmed bypass route which will reduce through traffic on Goulburn Valley Highway and replace the HGV bypass route along Grahamvale Road. As the timeframe for the Shepparton Bypass has not yet been confirmed it is important to consider that it may not actually be opened prior to completion of the development.
Figure 2.13: Goulburn Valley Bypass Route
2.6.2 Northern Neighbourhood Centre Extension The Northern Neighbourhood Centre is a retail development located on the corner of Goulburn Valley Highway and Hawkins Street. It has a committed expansion planned to increase the retail floor space from 3800 sqm to 7300 sqm, resulting in an additional 3500 sqm of retail space. This is anticipated to place further pressure on the Hawkins Street / Goulburn Valley Highway intersection. At the time of preparing this report, there were no other known committed developments expected to impact the local traffic network.
D R A F T
Shepparton North East Growth Corridor Development Traffic Impact Assessment P:\60028255 V07PU Shepparton\6_Draft_docs\6.1_Reports\Traffic and Transportation\1007tpe Traffic Assessment 20Nov08.doc Revision 21 November 2008 Page 9
2.7 Cycle Network Shepparton has a well established cycle network that is continuously improving. The Shepparton Cycle network map provided by CGS is included in Figure 2.14. As shown in Figure 2.14, there are currently on-road cycle lanes on Verney Road, Balaclava Road and Goulburn Valley Highway. An on-road cycle lane is proposed to extend from Balaclava Road along Dookie Shepparton Road and past Grahamvale Road. There is also a shared path along a section of the west side of Verney Road and this is proposed to be extended. The proposed development is well placed to integrate a safe, convenient cycle network, maximise permeable route and connections to the external road network.
D R A F T
Shepparton North East Growth Corridor Development Traffic Impact Assessment P:\60028255 V07PU Shepparton\6_Draft_docs\6.1_Reports\Traffic and Transportation\1007tpe Traffic Assessment 20Nov08.doc Revision 21 November 2008 Page 10
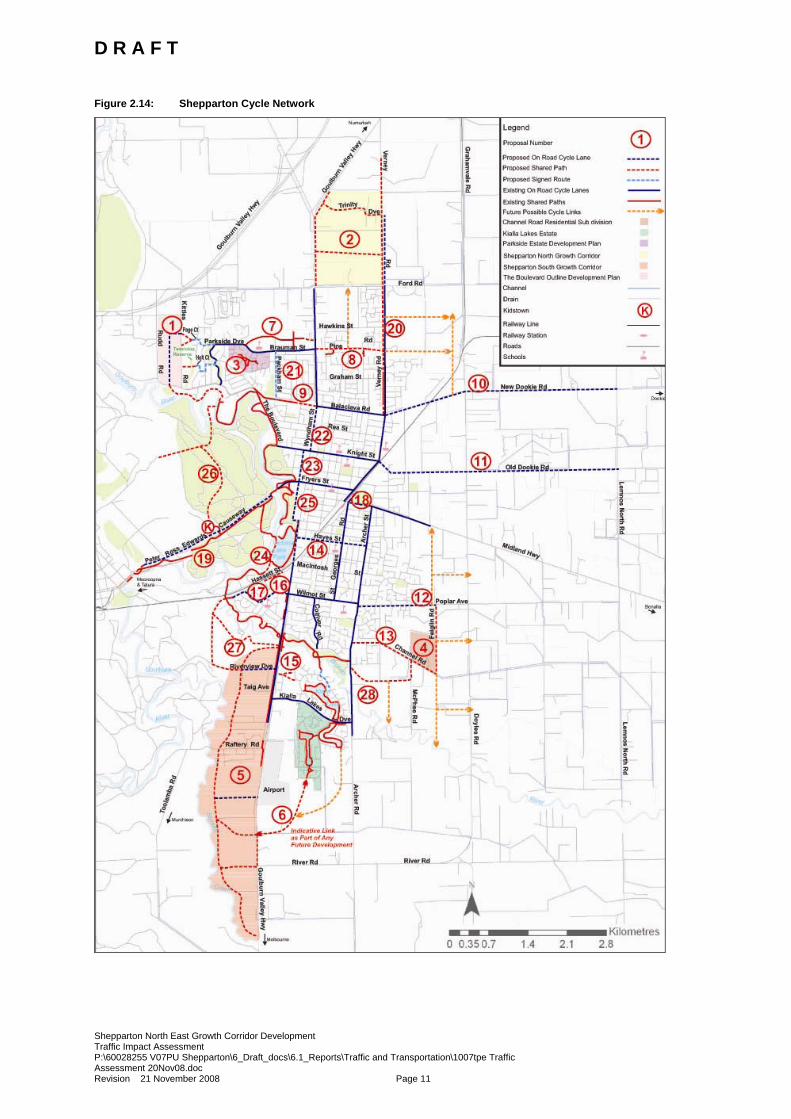
Figure 2.14: Shepparton Cycle Network
D R A F T
Shepparton North East Growth Corridor Development Traffic Impact Assessment P:\60028255 V07PU Shepparton\6_Draft_docs\6.1_Reports\Traffic and Transportation\1007tpe Traffic Assessment 20Nov08.doc Revision 21 November 2008 Page 11
3.0 Existing Traffic Operation 3.1 Overview of Local Road Network During initial discussions with CGS Engineering Projects department it was agreed that the following four intersections would be most adversely affected by the proposed development: • Verney Road and Balaclava Road • Verney Road and Ford Road • Grahamvale Road and New Dookie Road • Grahamvale Road and Ford Road At the time it was not apparent that there may be any significant impact on traffic along Hawkins Street and therefore the operation of the intersections of Hawkins Street / Verney Street and Hawkins Street / Goulbourn Valley Highway were not investigated. However, CGS previously conducted surveys of the Hawkins Street / Goulbourn Valley Highway intersection in 2005 to determine whether signalisation was warranted in line with VicRoads requirements. In 2005 investigations concluded that signalisation was not warranted, but the intersection was flagged as a potential future location suitable for signalisation. Historical traffic growth in this area has averaged 1.5% per annum1. Therefore, a growth factor of 1.5% per annum has been applied to the traffic movement flows recorded in 2005 and the intersection has been modelled using SIDRA to provide an estimation of current (2008) operation. A Hawkins Street / Verney Road intersection estimation has also been created based on historical classified traffic counts collected by CGS on Hawkins Street (2007) and Verney Road (2008). In order to provide an approximate of the forecast traffic conditions the estimated intersection is analysed later in this chapter.
3.2 SIDRA INTERSECTION Analysis The operation of the local intersections described in 3.1 have been analysed using SIDRA INTERSECTION 3.1 (SIDRA). The SIDRA software package is a computer program that estimates intersection capacity and performance statistics using iterative approximation. The following three main operational parameters have been detailed to provide a broad understanding of the intersection performance. These are Degree of Saturation, Level of Service and Average Delay. Each is described below.
Degree of Saturation
The level of congestion at an intersection is most commonly measured by the Degree of Saturation (DOS). This is defined as the ratio of arrival flow to capacity and is otherwise known as the volume capacity ratio, and has a theoretical maximum value of one. In practice, a DOS of greater than 0.95 would indicate that the intersection is operating under congested conditions, with lengthening queues and delays. As a guide the operating conditions under various degrees of saturation can be defined as: • DOS < 0.75 Very good operating conditions;
1 Source: CGS
D R A F T
Shepparton North East Growth Corridor Development Traffic Impact Assessment P:\60028255 V07PU Shepparton\6_Draft_docs\6.1_Reports\Traffic and Transportation\1007tpe Traffic Assessment 20Nov08.doc Revision 21 November 2008 Page 12
• 0.75 < DOS < 0.90 Good operating conditions; • 0.90 < DOS < 0.95 Acceptable operating conditions; and • DOS < 0.95 Congested operating conditions. When utilising SIDRA to analyse intersections, it is prudent to compare not only the DOS, but also factors such as queues and delays, which are qualitatively captured through assessment of the level of service. Level of Service
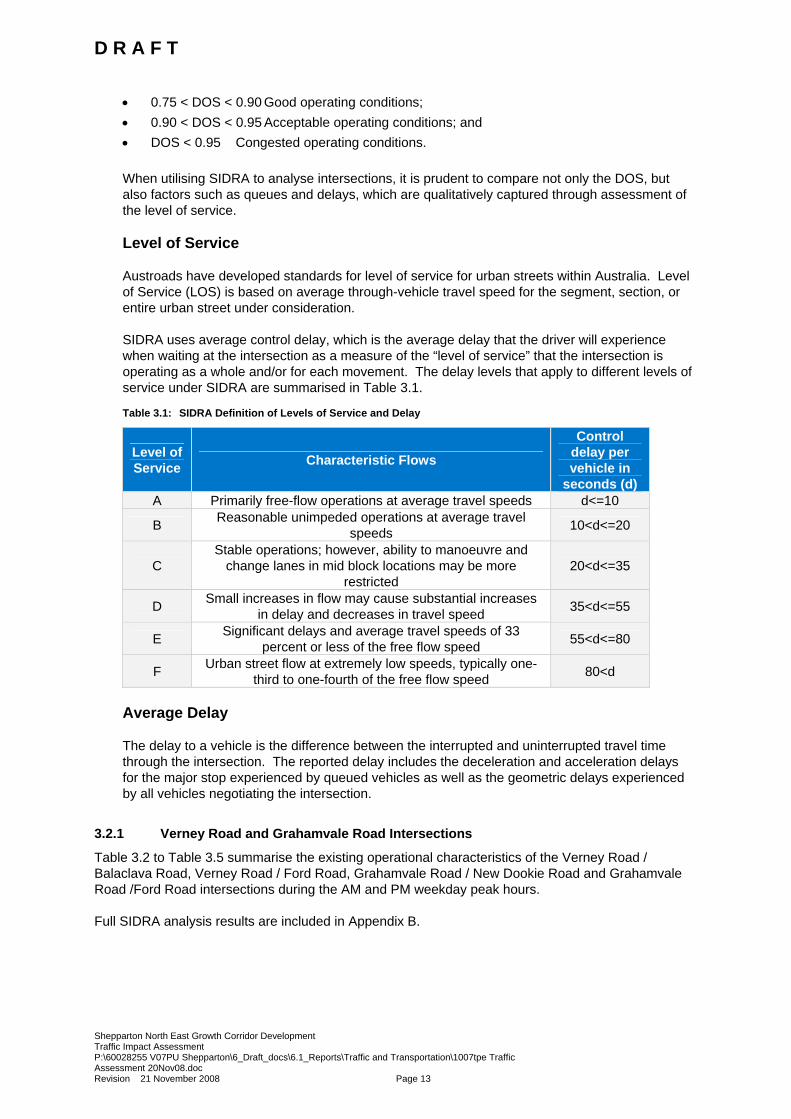
Austroads have developed standards for level of service for urban streets within Australia. Level of Service (LOS) is based on average through-vehicle travel speed for the segment, section, or entire urban street under consideration. SIDRA uses average control delay, which is the average delay that the driver will experience when waiting at the intersection as a measure of the “level of service” that the intersection is operating as a whole and/or for each movement. The delay levels that apply to different levels of service under SIDRA are summarised in Table 3.1.
Table 3.1: SIDRA Definition of Levels of Service and Delay
Level of Service Characteristic Flows
Control delay per vehicle in
seconds (d) A Primarily free-flow operations at average travel speeds d<=10
B Reasonable unimpeded operations at average travel speeds 10<d<=20
C Stable operations; however, ability to manoeuvre and
change lanes in mid block locations may be more restricted
20<d<=35
D Small increases in flow may cause substantial increases in delay and decreases in travel speed 35<d<=55
E Significant delays and average travel speeds of 33 percent or less of the free flow speed 55<d<=80
F Urban street flow at extremely low speeds, typically one-third to one-fourth of the free flow speed 80<d
Average Delay
The delay to a vehicle is the difference between the interrupted and uninterrupted travel time through the intersection. The reported delay includes the deceleration and acceleration delays for the major stop experienced by queued vehicles as well as the geometric delays experienced by all vehicles negotiating the intersection.
3.2.1 Verney Road and Grahamvale Road Intersections
Table 3.2 to Table 3.5 summarise the existing operational characteristics of the Verney Road / Balaclava Road, Verney Road / Ford Road, Grahamvale Road / New Dookie Road and Grahamvale Road /Ford Road intersections during the AM and PM weekday peak hours. Full SIDRA analysis results are included in Appendix B.
D R A F T
Shepparton North East Growth Corridor Development Traffic Impact Assessment P:\60028255 V07PU Shepparton\6_Draft_docs\6.1_Reports\Traffic and Transportation\1007tpe Traffic Assessment 20Nov08.doc Revision 21 November 2008 Page 13
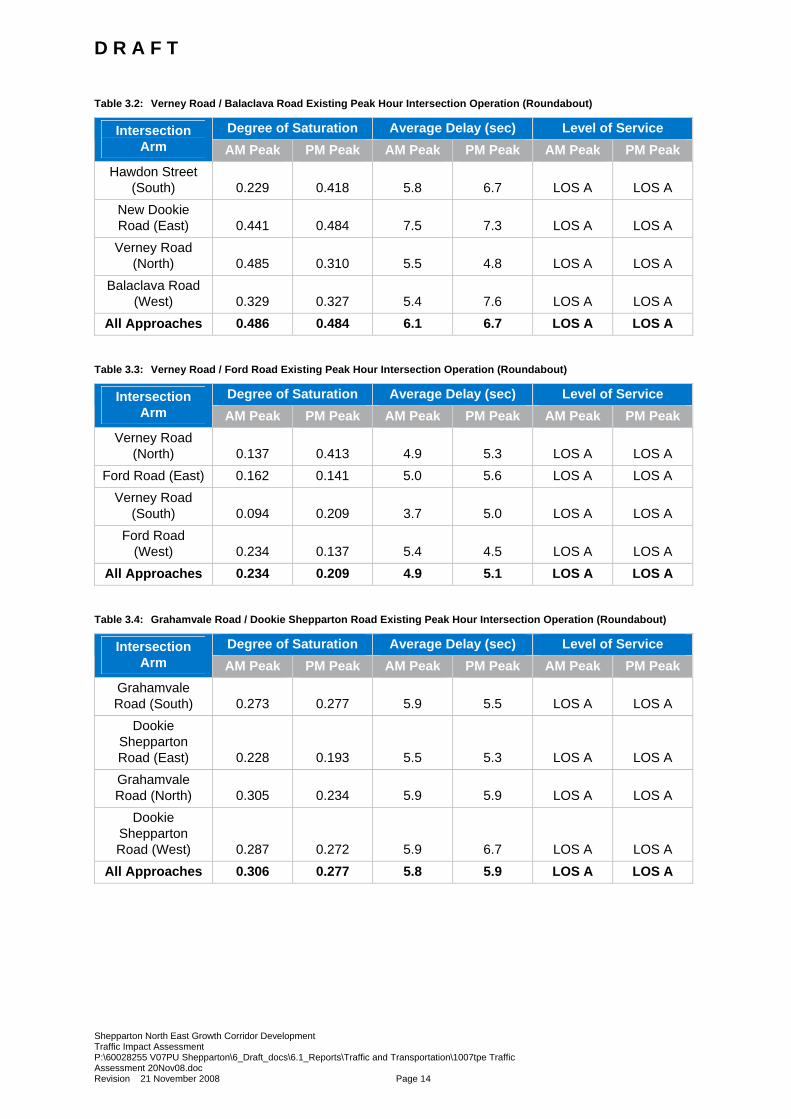
Table 3.2: Verney Road / Balaclava Road Existing Peak Hour Intersection Operation (Roundabout)
Degree of Saturation Average Delay (sec) Level of Service Intersection Arm AM Peak PM Peak AM Peak PM Peak AM Peak PM Peak
Hawdon Street (South) 0.229 0.418 5.8 6.7 LOS A LOS A
New Dookie Road (East) 0.441 0.484 7.5 7.3 LOS A LOS A Verney Road
(North) 0.485 0.310 5.5 4.8 LOS A LOS A Balaclava Road
(West) 0.329 0.327 5.4 7.6 LOS A LOS A All Approaches 0.486 0.484 6.1 6.7 LOS A LOS A
Table 3.3: Verney Road / Ford Road Existing Peak Hour Intersection Operation (Roundabout)
Degree of Saturation Average Delay (sec) Level of Service Intersection Arm AM Peak PM Peak AM Peak PM Peak AM Peak PM Peak
Verney Road (North) 0.137 0.413 4.9 5.3 LOS A LOS A
Ford Road (East) 0.162 0.141 5.0 5.6 LOS A LOS A Verney Road
(South) 0.094 0.209 3.7 5.0 LOS A LOS A Ford Road
(West) 0.234 0.137 5.4 4.5 LOS A LOS A All Approaches 0.234 0.209 4.9 5.1 LOS A LOS A
Table 3.4: Grahamvale Road / Dookie Shepparton Road Existing Peak Hour Intersection Operation (Roundabout)
Degree of Saturation Average Delay (sec) Level of Service Intersection Arm AM Peak PM Peak AM Peak PM Peak AM Peak PM Peak
Grahamvale Road (South) 0.273 0.277 5.9 5.5 LOS A LOS A
Dookie Shepparton Road (East) 0.228 0.193 5.5 5.3 LOS A LOS A Grahamvale Road (North) 0.305 0.234 5.9 5.9 LOS A LOS A
Dookie Shepparton Road (West) 0.287 0.272 5.9 6.7 LOS A LOS A
All Approaches 0.306 0.277 5.8 5.9 LOS A LOS A
D R A F T
Shepparton North East Growth Corridor Development Traffic Impact Assessment P:\60028255 V07PU Shepparton\6_Draft_docs\6.1_Reports\Traffic and Transportation\1007tpe Traffic Assessment 20Nov08.doc Revision 21 November 2008 Page 14
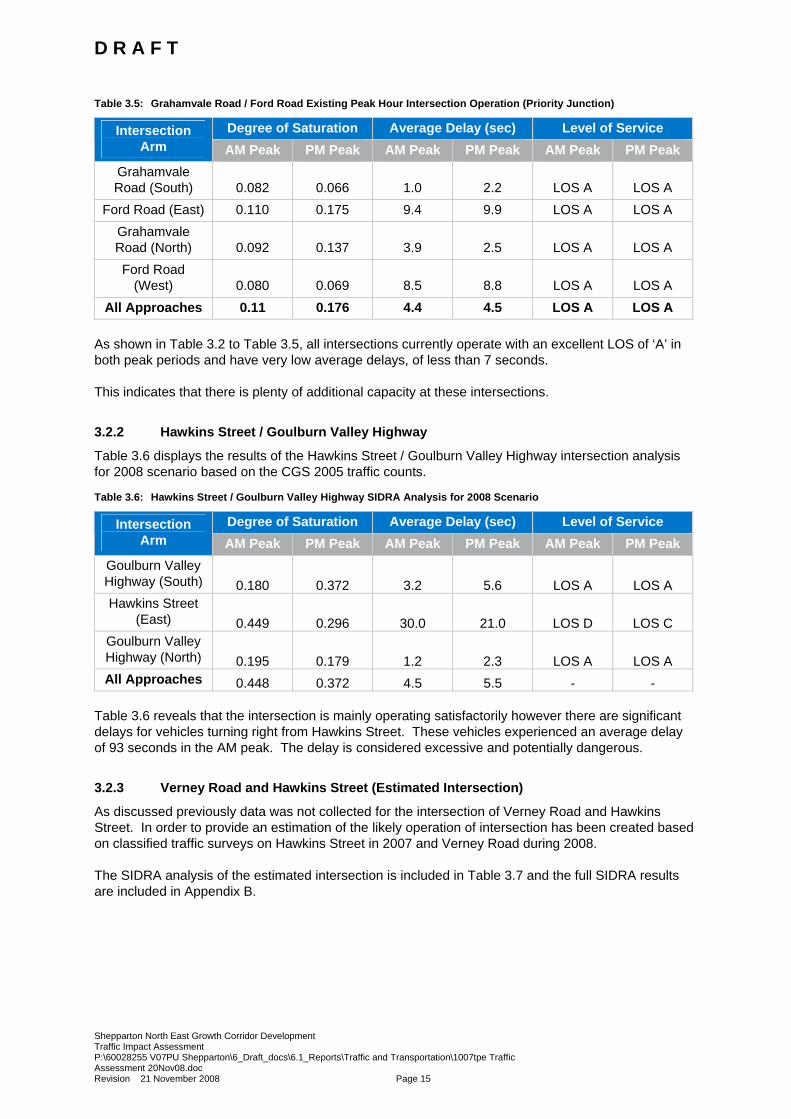
Table 3.5: Grahamvale Road / Ford Road Existing Peak Hour Intersection Operation (Priority Junction)
Degree of Saturation Average Delay (sec) Level of Service Intersection Arm AM Peak PM Peak AM Peak PM Peak AM Peak PM Peak
Grahamvale Road (South) 0.082 0.066 1.0 2.2 LOS A LOS A
Ford Road (East) 0.110 0.175 9.4 9.9 LOS A LOS A Grahamvale Road (North) 0.092 0.137 3.9 2.5 LOS A LOS A Ford Road
(West) 0.080 0.069 8.5 8.8 LOS A LOS A All Approaches 0.11 0.176 4.4 4.5 LOS A LOS A
As shown in Table 3.2 to Table 3.5, all intersections currently operate with an excellent LOS of ‘A’ in both peak periods and have very low average delays, of less than 7 seconds. This indicates that there is plenty of additional capacity at these intersections.
3.2.2 Hawkins Street / Goulburn Valley Highway
Table 3.6 displays the results of the Hawkins Street / Goulburn Valley Highway intersection analysis for 2008 scenario based on the CGS 2005 traffic counts.
Table 3.6: Hawkins Street / Goulburn Valley Highway SIDRA Analysis for 2008 Scenario
Degree of Saturation Average Delay (sec) Level of Service Intersection Arm AM Peak PM Peak AM Peak PM Peak AM Peak PM Peak
Goulburn Valley Highway (South) 0.180 0.372 3.2 5.6 LOS A LOS A Hawkins Street
(East) 0.449 0.296 30.0 21.0 LOS D LOS C Goulburn Valley Highway (North) 0.195 0.179 1.2 2.3 LOS A LOS A All Approaches 0.448 0.372 4.5 5.5 - -
Table 3.6 reveals that the intersection is mainly operating satisfactorily however there are significant delays for vehicles turning right from Hawkins Street. These vehicles experienced an average delay of 93 seconds in the AM peak. The delay is considered excessive and potentially dangerous.
3.2.3 Verney Road and Hawkins Street (Estimated Intersection)
As discussed previously data was not collected for the intersection of Verney Road and Hawkins Street. In order to provide an estimation of the likely operation of intersection has been created based on classified traffic surveys on Hawkins Street in 2007 and Verney Road during 2008. The SIDRA analysis of the estimated intersection is included in Table 3.7 and the full SIDRA results are included in Appendix B.
D R A F T
Shepparton North East Growth Corridor Development Traffic Impact Assessment P:\60028255 V07PU Shepparton\6_Draft_docs\6.1_Reports\Traffic and Transportation\1007tpe Traffic Assessment 20Nov08.doc Revision 21 November 2008 Page 15
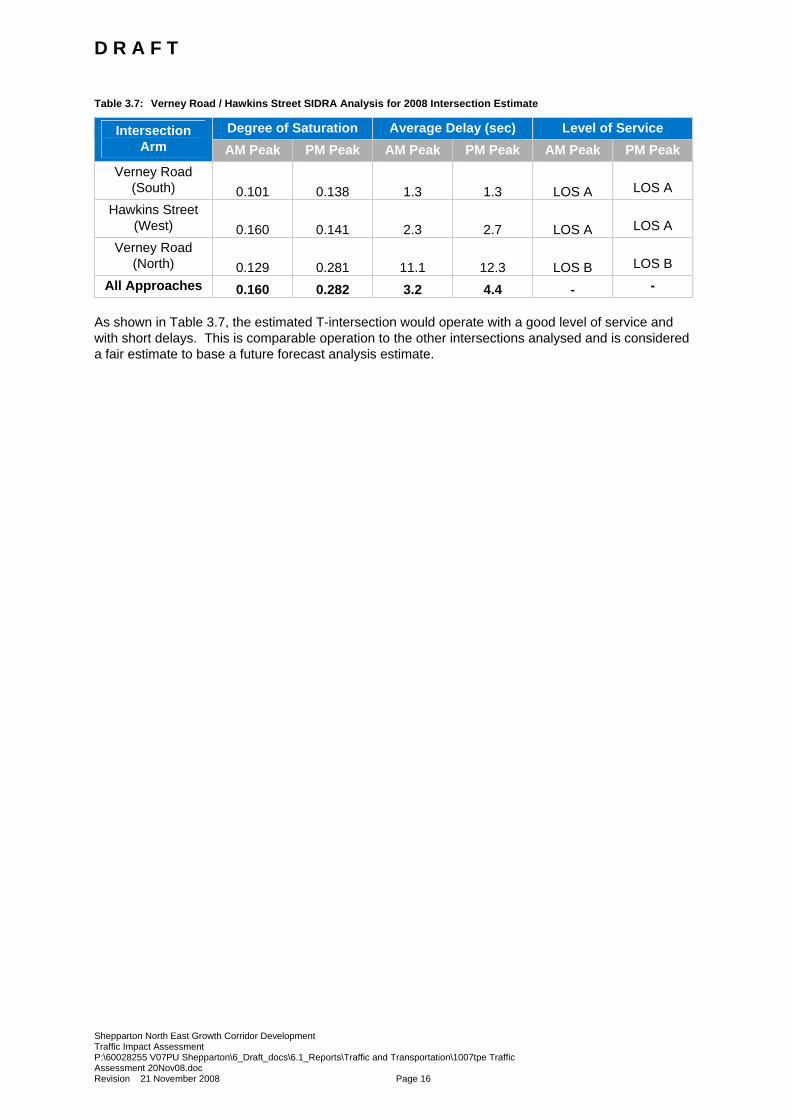
Table 3.7: Verney Road / Hawkins Street SIDRA Analysis for 2008 Intersection Estimate
Degree of Saturation Average Delay (sec) Level of Service Intersection Arm AM Peak PM Peak AM Peak PM Peak AM Peak PM Peak
Verney Road (South) 0.101 0.138 1.3 1.3 LOS A LOS A
Hawkins Street (West) 0.160 0.141 2.3 2.7 LOS A LOS A
Verney Road (North) 0.129 0.281 11.1 12.3 LOS B LOS B
All Approaches 0.160 0.282 3.2 4.4 - - As shown in Table 3.7, the estimated T-intersection would operate with a good level of service and with short delays. This is comparable operation to the other intersections analysed and is considered a fair estimate to base a future forecast analysis estimate.
D R A F T
Shepparton North East Growth Corridor Development Traffic Impact Assessment P:\60028255 V07PU Shepparton\6_Draft_docs\6.1_Reports\Traffic and Transportation\1007tpe Traffic Assessment 20Nov08.doc Revision 21 November 2008 Page 16
4.0 Proposed Development The proposed mixed use development is primarily residential with a complimentary retail and community component located at the heart of the development. As part of the development, it is also proposed to relocate the Grahamvale Primary School (PS) adjacent to the retail and community hub. Primary access to the site is proposed along Verney Road, between Ryeland Drive and Hawkins Street. Secondary access is proposed along Grahamvale Road.
4.1 Land Use 4.1.1 Residential
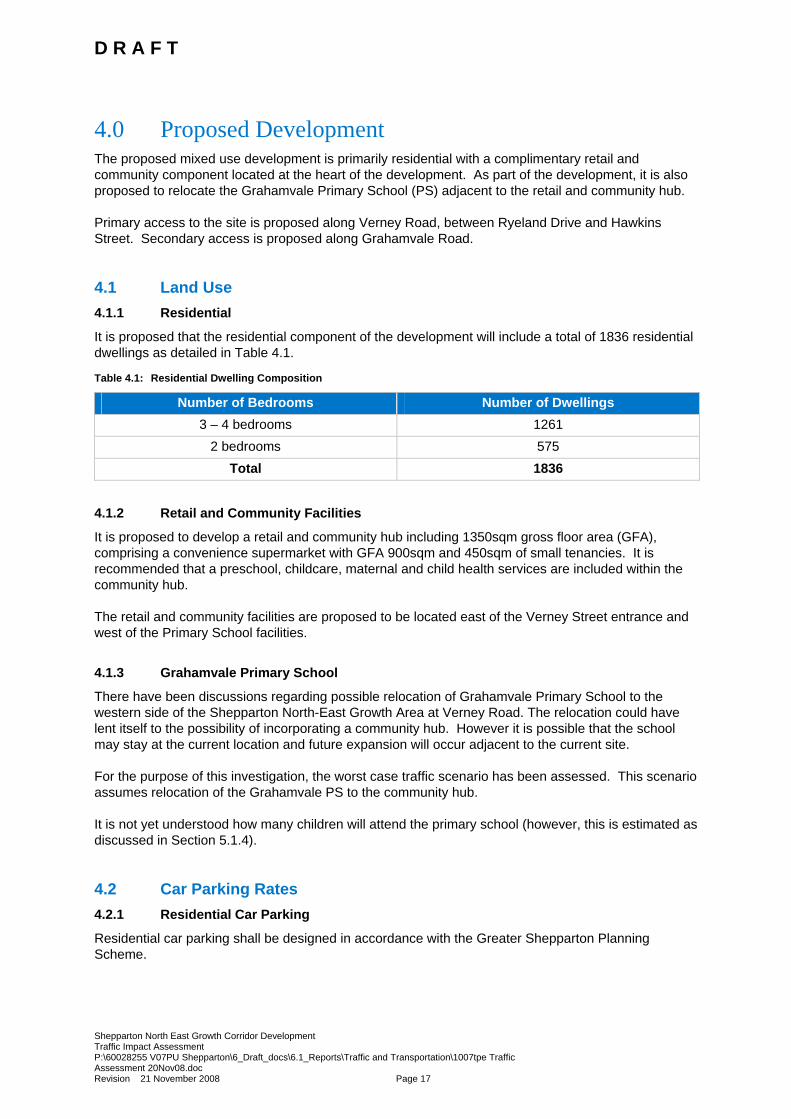
It is proposed that the residential component of the development will include a total of 1836 residential dwellings as detailed in Table 4.1.
Table 4.1: Residential Dwelling Composition
Number of Bedrooms Number of Dwellings 3 – 4 bedrooms 1261
2 bedrooms 575 Total 1836
4.1.2 Retail and Community Facilities
It is proposed to develop a retail and community hub including 1350sqm gross floor area (GFA), comprising a convenience supermarket with GFA 900sqm and 450sqm of small tenancies. It is recommended that a preschool, childcare, maternal and child health services are included within the community hub. The retail and community facilities are proposed to be located east of the Verney Street entrance and west of the Primary School facilities.
4.1.3 Grahamvale Primary School
There have been discussions regarding possible relocation of Grahamvale Primary School to the western side of the Shepparton North-East Growth Area at Verney Road. The relocation could have lent itself to the possibility of incorporating a community hub. However it is possible that the school may stay at the current location and future expansion will occur adjacent to the current site. For the purpose of this investigation, the worst case traffic scenario has been assessed. This scenario assumes relocation of the Grahamvale PS to the community hub. It is not yet understood how many children will attend the primary school (however, this is estimated as discussed in Section 5.1.4).
4.2 Car Parking Rates 4.2.1 Residential Car Parking
Residential car parking shall be designed in accordance with the Greater Shepparton Planning Scheme.
D R A F T
Shepparton North East Growth Corridor Development Traffic Impact Assessment P:\60028255 V07PU Shepparton\6_Draft_docs\6.1_Reports\Traffic and Transportation\1007tpe Traffic Assessment 20Nov08.doc Revision 21 November 2008 Page 17
4.2.2 Retail Car Parking
Car parking for the development should be designed in accordance with the most current car parking rates applicable. According to the current Clause 52.06 of the Greater Shepparton Planning Scheme, a provision of 8 Car spaces to each 100sqm of leasable floor area is required for the majority of retail developments anticipated to occupy this retail component. However, recently the Department of Planning and Community Development (DPCD) facilitated a state wide review of planning scheme parking rates. This process culminated in the release of a report by an Advisory Committee (appointed by the Minister for Planning) titled Review of Parking Provisions in the Victoria Planning Provisions, August 2007. This report aims to provide advice on car parking issues and to prepare a new Clause 52.06 suitable for inclusion in the Victoria Planning Provisions (VPP) and planning schemes. The Advisory Committee report has been prepared following extensive research across Victoria and contribution from numerous stakeholders and experts. If adopted, the report’s recommendations will alter the existing parking rates provided in Clause 52.06 of the VPP. In general the parking rates proposed in the Advisory Committee report are lower or equal to the existing parking rates in Clause 52.06. However, it is relevant to note that the adoption of this report is, in all likelihood, some months away and there is not necessarily a guarantee that the report’s recommendations will be adopted in any form. Comments are currently being sought on the Advisory Committee report and the Advisory Committee is currently analysing the submissions on all the draft documents. Notwithstanding the uncertainty in respect of the possible adoption of the revised parking rates proposed in the Advisory Committee report, it is still important for the parking rates to be considered for future developments. The Advisory Committee Report specifies a proposed parking rate of 4.0 car spaces per 100sqm of leasable floor area for retail developments (for standard retail developments, as in this case). Therefore, even though the current planning scheme rate is 8 spaces per 100sqm of leasable floor area, it is expected that a lower rate of 4.0 spaces per 100sqm of leasable floor area is in line with the recommendations of the recent Advisory Committee Report and will be considered suitable for this future development.
D R A F T
Shepparton North East Growth Corridor Development Traffic Impact Assessment P:\60028255 V07PU Shepparton\6_Draft_docs\6.1_Reports\Traffic and Transportation\1007tpe Traffic Assessment 20Nov08.doc Revision 21 November 2008 Page 18
5.0 Vehicular Traffic Generation and Distribution The following traffic investigation has been undertaken to ascertain the levels of traffic that will be generated and assigned to the existing road network as a result of new residential development in the Shepparton North East Growth Area.
5.1 Traffic Generation Traffic generation rates have been discussed and agreed with the CGS Engineering Projects department and are presented as follows.
5.1.1 Background Traffic Growth
An annual background traffic growth rate of 1.5% per annum has been applied to surveyed traffic movements. This is based on the historical growth rate of the area as monitored by CGS. The growth rate takes into account growth in traffic caused by developments in the greater area, such as other residential and retail developments.
5.1.2 Residential
The Greater Shepparton Infrastructure Design Manual requires a traffic generation of 10 vehicle trips per lot per day. This results in a total of 18,360 vehicle trips per day. In accordance with the Greater Shepparton Infrastructure Design Manual a weekday peak hour vehicle trip rate of 0.9 movements per dwelling has been agreed with CGS Engineering Projects department and applied to the AM and PM peak hours. This results in a total traffic generation of 1652 movements generated by residential traffic in the AM and PM peak hours. Vehicle trips are defined as a one-way vehicular movement from one point to another excluding the return journey. Therefore a vehicle entering and leaving a land use is counted as two trips. For residential trips the following profile has been assumed: • AM Peak: 10% of trips in and 90% of trips out • PM Peak: 70% of trips in and 30% of trips out
5.1.3 Retail
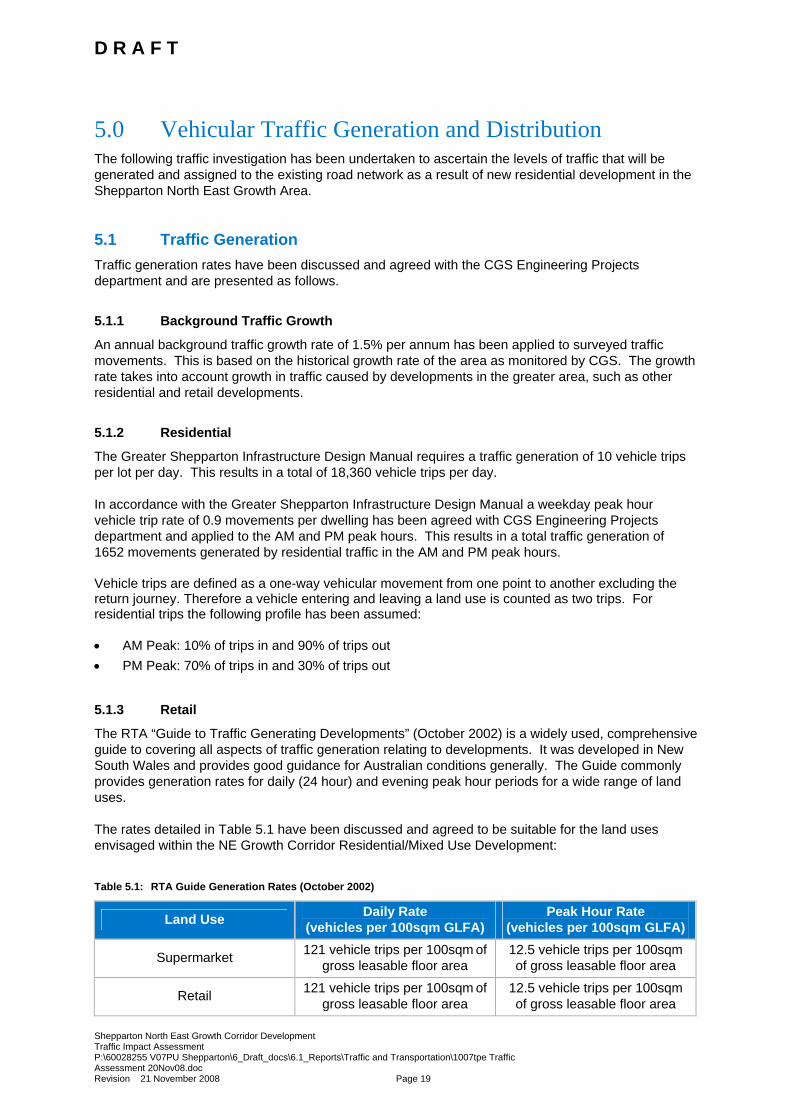
The RTA “Guide to Traffic Generating Developments” (October 2002) is a widely used, comprehensive guide to covering all aspects of traffic generation relating to developments. It was developed in New South Wales and provides good guidance for Australian conditions generally. The Guide commonly provides generation rates for daily (24 hour) and evening peak hour periods for a wide range of land uses. The rates detailed in Table 5.1 have been discussed and agreed to be suitable for the land uses envisaged within the NE Growth Corridor Residential/Mixed Use Development:
Table 5.1: RTA Guide Generation Rates (October 2002)
Land Use Daily Rate (vehicles per 100sqm GLFA)
Peak Hour Rate (vehicles per 100sqm GLFA)
Supermarket 121 vehicle trips per 100sqm of gross leasable floor area
12.5 vehicle trips per 100sqm
of gross leasable floor area
Retail 121 vehicle trips per 100sqm of gross leasable floor area
12.5 vehicle trips per 100sqm
of gross leasable floor area
D R A F T
Shepparton North East Growth Corridor Development Traffic Impact Assessment P:\60028255 V07PU Shepparton\6_Draft_docs\6.1_Reports\Traffic and Transportation\1007tpe Traffic Assessment 20Nov08.doc Revision 21 November 2008 Page 19
Based on the proposed development of 1350sqm supermarket and retail area the traffic generation is estimated to be 1634 per day and 169 movements in the peak hours. However it is estimated that only 10% of traffic attracted to the retail site will originate from traffic passing outside the development2. Therefore the additional traffic on the external road network is estimated to be 164 movements per day and 17 movements in the peak hours. For retail trips the following profile has been assumed: • AM Peak: 50% of trips in and 50% of trips out • PM Peak: 50% of trips in and 50% of trips out
5.1.4 Primary School
As described in section 4.1.3, for the purpose of the traffic generation assessment, it has been assumed that Grahamvale Primary School will relocate to the centre of the development. In this case, access is proposed to remain available via Grahamvale Road, but it is expected that many trips will be redistributed to arrive and depart through Verney Road3. As we do not have information regarding the anticipated growth of the school an estimation has been created based on reasonable assumptions. The current school student population is 300 students. It is estimated that when the development site is fully occupied in 2020 there will be a projected development population of 4140 people. Based on ABS population statistics it is anticipated that the development site would include approximately 455 primary school-aged children4, who are most suitably located for enrolment at Grahamvale PS. Discussions with the Department of Education revealed that one of the major attractors to the current school is the “country feel”, which would change as the area is developed. It considered that the school population will draw fewer children from other areas in Shepparton. Demand for student placements residing off-site is estimated to include approximately half of current student population, 145 placements. This would result in a total primary school population of 600 children. Students residing within the development site area would not generate any external trips to/from the site. School trips are actually taken into consideration within the standard residential peak hour traffic generation rate of 0.9 trips per dwelling, as discussed in 5.1.2. The relocation of the school would therefore be likely to result in a reduction in external trips. For the purpose of this investigation the effect of any potential reduction in trips from the external road network has not been analysed.
5.1.5 Primary School Traffic Generation Methodology
As there are no formal guidelines recommended for calculating traffic generation for primary schools a methodology has been formulated and agreed with the CGS Engineering Projects department. The methodology is described in the following paragraphs.
2 ‘Shepparton North East Growth Area Activity Centre Demand’ report prepared by Applied Development Research Pty Ltd, October 2008 3 This is consistent with the overall proposed development traffic distribution as discussed in section 5.2. 4 Based on Shepparton ABS Population Data (2006) for people aged from 5 to 11.
D R A F T
Shepparton North East Growth Corridor Development Traffic Impact Assessment P:\60028255 V07PU Shepparton\6_Draft_docs\6.1_Reports\Traffic and Transportation\1007tpe Traffic Assessment 20Nov08.doc Revision 21 November 2008 Page 20
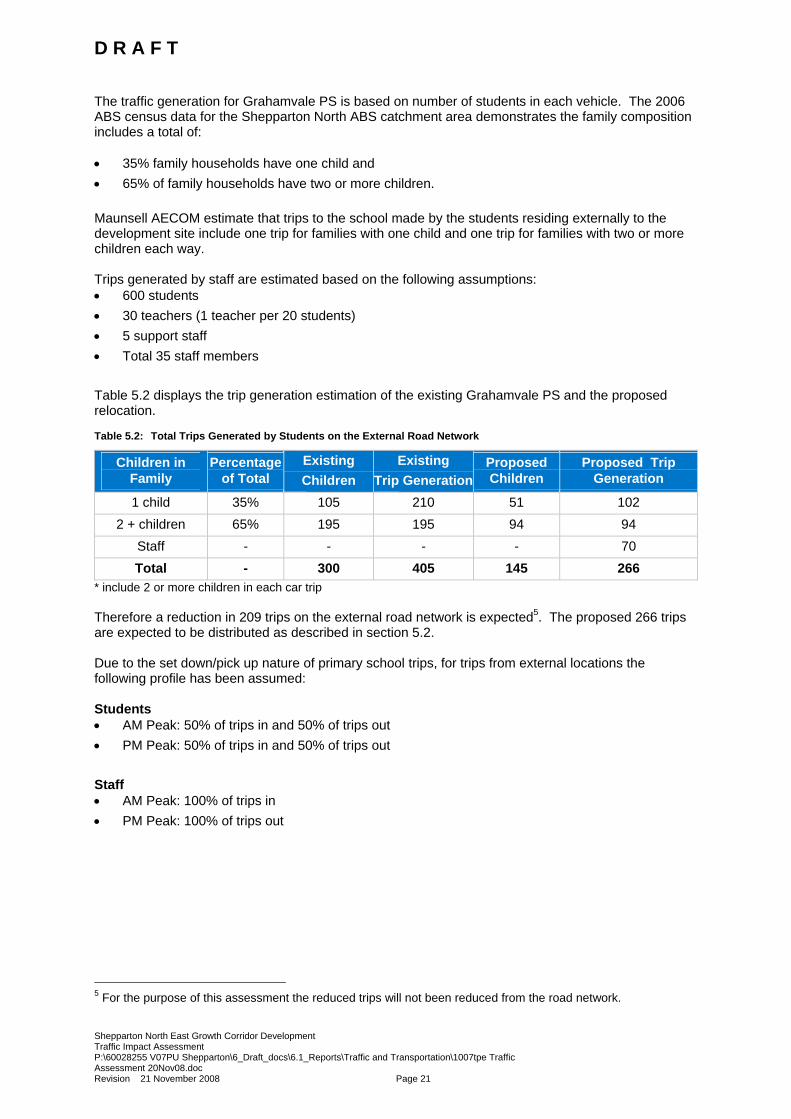
The traffic generation for Grahamvale PS is based on number of students in each vehicle. The 2006 ABS census data for the Shepparton North ABS catchment area demonstrates the family composition includes a total of: • 35% family households have one child and • 65% of family households have two or more children. Maunsell AECOM estimate that trips to the school made by the students residing externally to the development site include one trip for families with one child and one trip for families with two or more children each way. Trips generated by staff are estimated based on the following assumptions: • 600 students • 30 teachers (1 teacher per 20 students) • 5 support staff • Total 35 staff members Table 5.2 displays the trip generation estimation of the existing Grahamvale PS and the proposed relocation.
Table 5.2: Total Trips Generated by Students on the External Road Network
Children in Family
Percentage of Total
Existing Children
Existing Trip Generation
Proposed Children
Proposed Trip Generation
1 child 35% 105 210 51 102 2 + children 65% 195 195 94 94
Staff - - - - 70 Total - 300 405 145 266
* include 2 or more children in each car trip Therefore a reduction in 209 trips on the external road network is expected5. The proposed 266 trips are expected to be distributed as described in section 5.2. Due to the set down/pick up nature of primary school trips, for trips from external locations the following profile has been assumed: Students • AM Peak: 50% of trips in and 50% of trips out • PM Peak: 50% of trips in and 50% of trips out Staff • AM Peak: 100% of trips in • PM Peak: 100% of trips out
5 For the purpose of this assessment the reduced trips will not been reduced from the road network.
D R A F T
Shepparton North East Growth Corridor Development Traffic Impact Assessment P:\60028255 V07PU Shepparton\6_Draft_docs\6.1_Reports\Traffic and Transportation\1007tpe Traffic Assessment 20Nov08.doc Revision 21 November 2008 Page 21
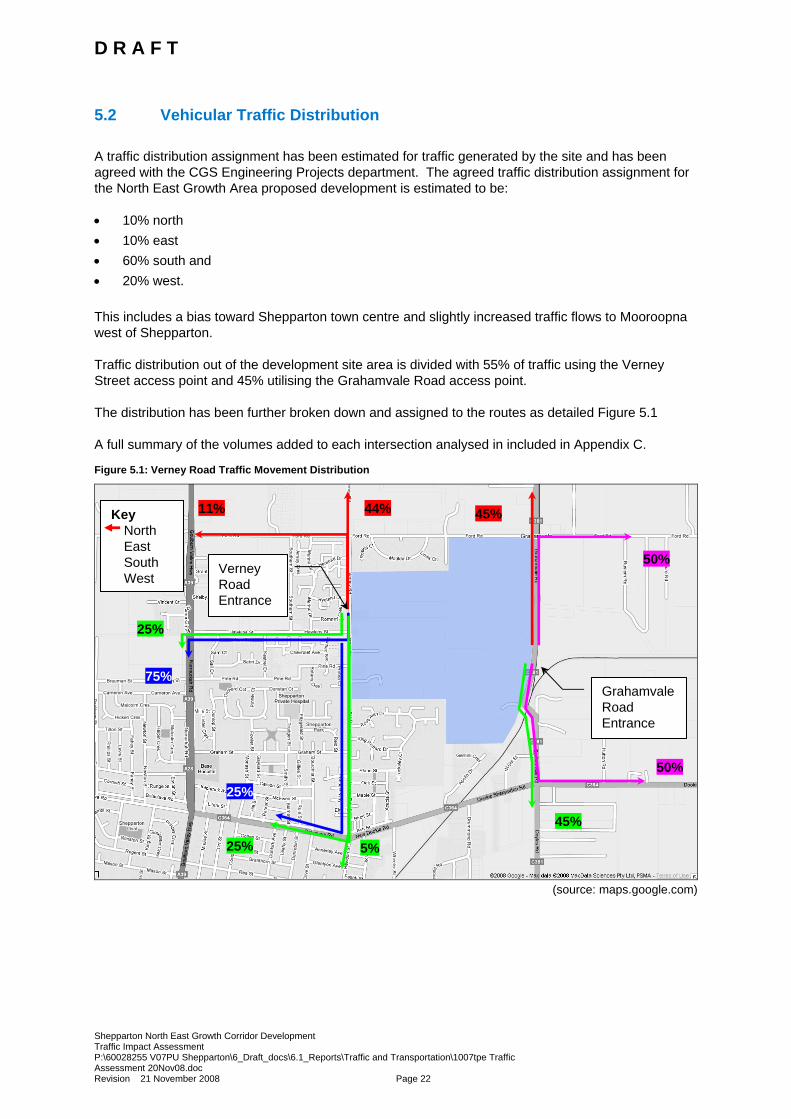
5.2 Vehicular Traffic Distribution A traffic distribution assignment has been estimated for traffic generated by the site and has been agreed with the CGS Engineering Projects department. The agreed traffic distribution assignment for the North East Growth Area proposed development is estimated to be: • 10% north • 10% east • 60% south and • 20% west. This includes a bias toward Shepparton town centre and slightly increased traffic flows to Mooroopna west of Shepparton. Traffic distribution out of the development site area is divided with 55% of traffic using the Verney Street access point and 45% utilising the Grahamvale Road access point. The distribution has been further broken down and assigned to the routes as detailed Figure 5.1 A full summary of the volumes added to each intersection analysed in included in Appendix C.
Figure 5.1: Verney Road Traffic Movement Distribution
(source: maps.google.com)
44% 11%
5%
75%
25%
25%
25%
45%
50%
45%
50%
Key North East South West
Verney Road Entrance
Grahamvale Road Entrance
D R A F T
Shepparton North East Growth Corridor Development Traffic Impact Assessment P:\60028255 V07PU Shepparton\6_Draft_docs\6.1_Reports\Traffic and Transportation\1007tpe Traffic Assessment 20Nov08.doc Revision 21 November 2008 Page 22
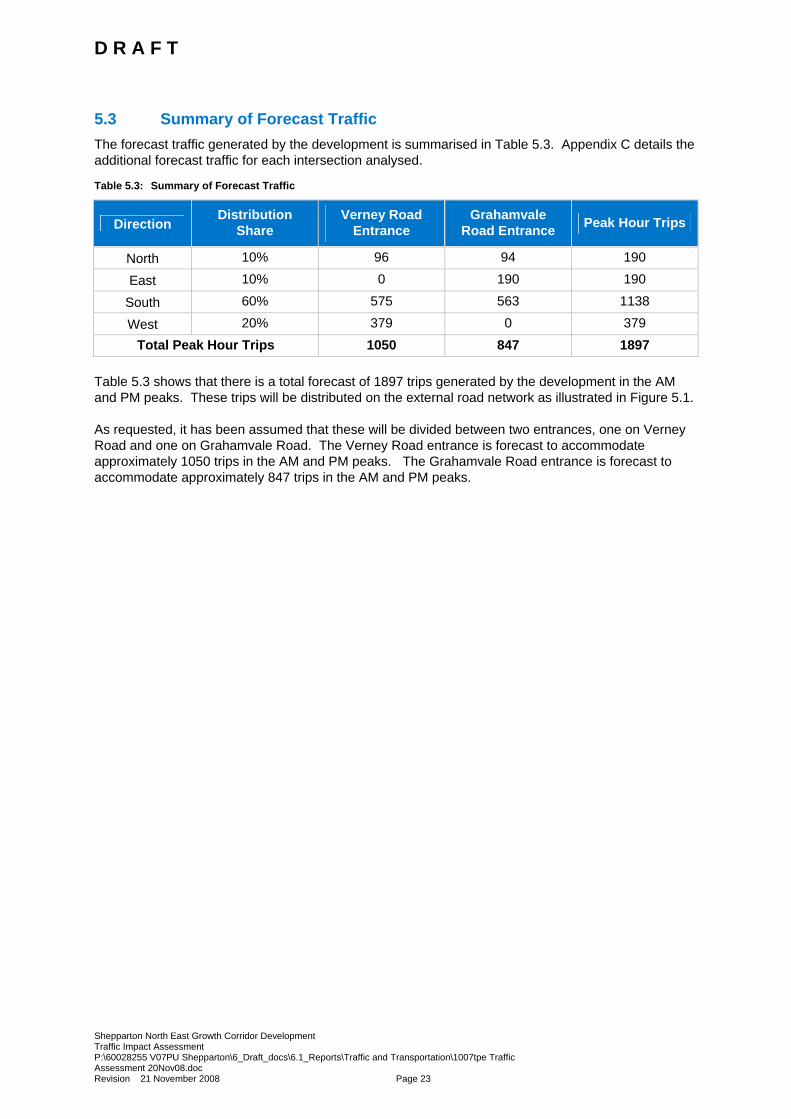
5.3 Summary of Forecast Traffic The forecast traffic generated by the development is summarised in Table 5.3. Appendix C details the additional forecast traffic for each intersection analysed.
Table 5.3: Summary of Forecast Traffic
Direction Distribution
Share Verney Road
Entrance Grahamvale
Road Entrance Peak Hour Trips
North 10% 96 94 190
East 10% 0 190 190
South 60% 575 563 1138
West 20% 379 0 379 Total Peak Hour Trips 1050 847 1897
Table 5.3 shows that there is a total forecast of 1897 trips generated by the development in the AM and PM peaks. These trips will be distributed on the external road network as illustrated in Figure 5.1. As requested, it has been assumed that these will be divided between two entrances, one on Verney Road and one on Grahamvale Road. The Verney Road entrance is forecast to accommodate approximately 1050 trips in the AM and PM peaks. The Grahamvale Road entrance is forecast to accommodate approximately 847 trips in the AM and PM peaks.
D R A F T
Shepparton North East Growth Corridor Development Traffic Impact Assessment P:\60028255 V07PU Shepparton\6_Draft_docs\6.1_Reports\Traffic and Transportation\1007tpe Traffic Assessment 20Nov08.doc Revision 21 November 2008 Page 23
6.0 Traffic Impact The following paragraphs outline the impact of the proposed development on the surrounding road network. The analysis has been estimated for the year the development is expected to be completed (2020) and assumes full occupancy of residential, retail and educational facilities. The intersections analysed include: • Verney Road and Balaclava Road • Verney Road and Ford Road • Grahamvale Road and Dookie Shepparton Road • Grahamvale Road and Ford Road and • Hawkins Street and Goulburn Valley • Hawkins Street and Verney Road (example based on an estimated traffic profile) Full SIDRA analysis results are contained within Appendix B. Recommendations are also provided in Section 6.4 on appropriate treatments at the entrances to the development site on Verney Road and Grahamvale Road.
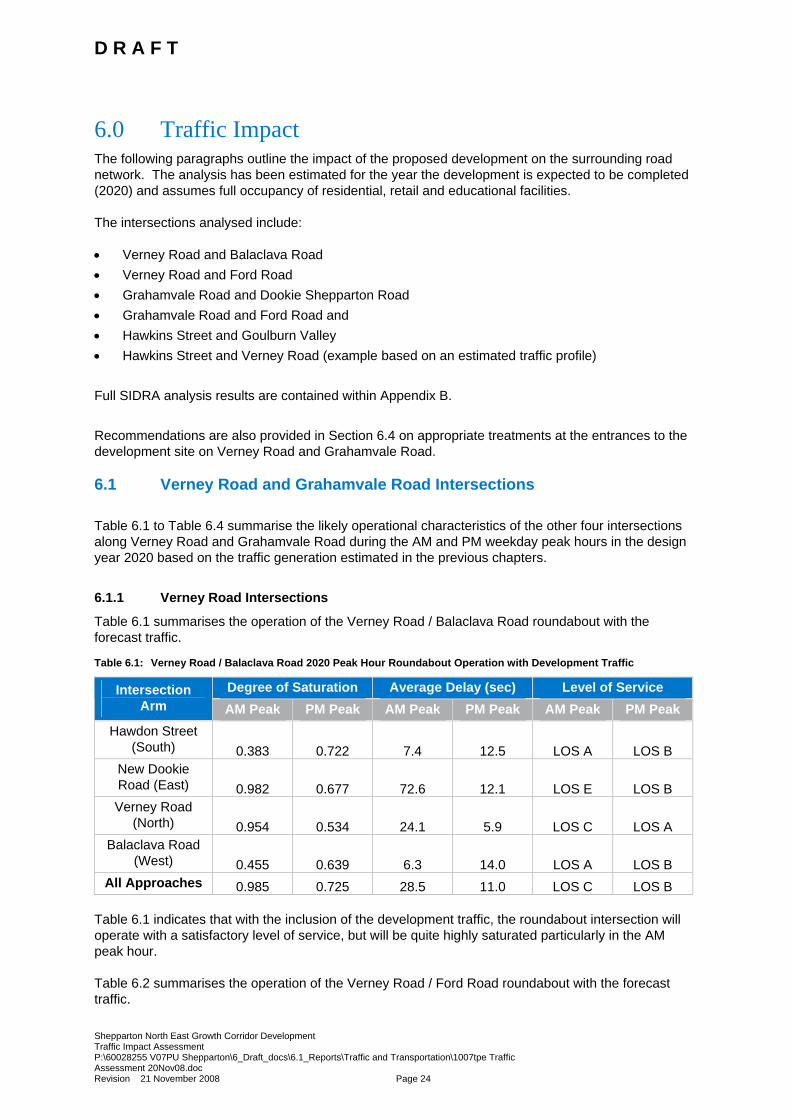
6.1 Verney Road and Grahamvale Road Intersections Table 6.1 to Table 6.4 summarise the likely operational characteristics of the other four intersections along Verney Road and Grahamvale Road during the AM and PM weekday peak hours in the design year 2020 based on the traffic generation estimated in the previous chapters.
6.1.1 Verney Road Intersections
Table 6.1 summarises the operation of the Verney Road / Balaclava Road roundabout with the forecast traffic.
Table 6.1: Verney Road / Balaclava Road 2020 Peak Hour Roundabout Operation with Development Traffic
Degree of Saturation Average Delay (sec) Level of Service Intersection Arm AM Peak PM Peak AM Peak PM Peak AM Peak PM Peak
Hawdon Street (South) 0.383 0.722 7.4 12.5 LOS A LOS B
New Dookie Road (East) 0.982 0.677 72.6 12.1 LOS E LOS B Verney Road
(North) 0.954 0.534 24.1 5.9 LOS C LOS A Balaclava Road
(West) 0.455 0.639 6.3 14.0 LOS A LOS B All Approaches 0.985 0.725 28.5 11.0 LOS C LOS B
Table 6.1 indicates that with the inclusion of the development traffic, the roundabout intersection will operate with a satisfactory level of service, but will be quite highly saturated particularly in the AM peak hour. Table 6.2 summarises the operation of the Verney Road / Ford Road roundabout with the forecast traffic.
D R A F T
Shepparton North East Growth Corridor Development Traffic Impact Assessment P:\60028255 V07PU Shepparton\6_Draft_docs\6.1_Reports\Traffic and Transportation\1007tpe Traffic Assessment 20Nov08.doc Revision 21 November 2008 Page 24
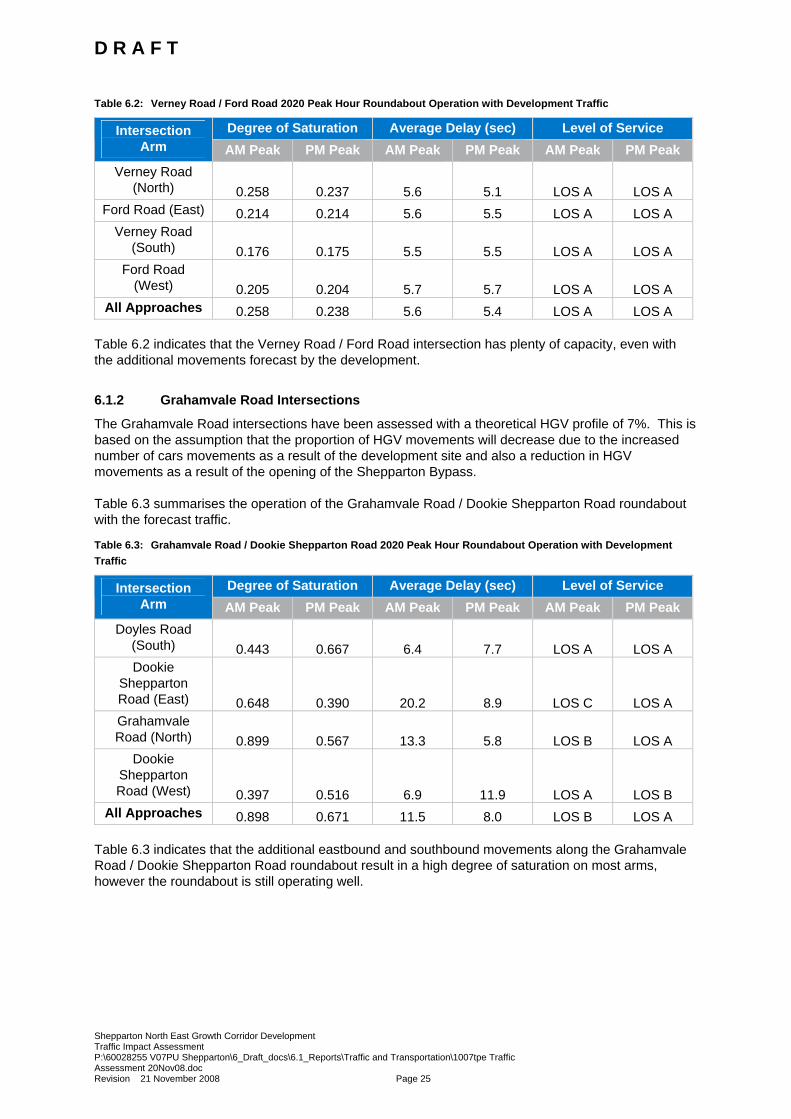
Table 6.2: Verney Road / Ford Road 2020 Peak Hour Roundabout Operation with Development Traffic
Degree of Saturation Average Delay (sec) Level of Service Intersection Arm AM Peak PM Peak AM Peak PM Peak AM Peak PM Peak
Verney Road (North) 0.258 0.237 5.6 5.1 LOS A LOS A
Ford Road (East) 0.214 0.214 5.6 5.5 LOS A LOS A Verney Road
(South) 0.176 0.175 5.5 5.5 LOS A LOS A Ford Road
(West) 0.205 0.204 5.7 5.7 LOS A LOS A All Approaches 0.258 0.238 5.6 5.4 LOS A LOS A
Table 6.2 indicates that the Verney Road / Ford Road intersection has plenty of capacity, even with the additional movements forecast by the development.
6.1.2 Grahamvale Road Intersections
The Grahamvale Road intersections have been assessed with a theoretical HGV profile of 7%. This is based on the assumption that the proportion of HGV movements will decrease due to the increased number of cars movements as a result of the development site and also a reduction in HGV movements as a result of the opening of the Shepparton Bypass. Table 6.3 summarises the operation of the Grahamvale Road / Dookie Shepparton Road roundabout with the forecast traffic.
Table 6.3: Grahamvale Road / Dookie Shepparton Road 2020 Peak Hour Roundabout Operation with Development Traffic
Degree of Saturation Average Delay (sec) Level of Service Intersection Arm AM Peak PM Peak AM Peak PM Peak AM Peak PM Peak
Doyles Road (South) 0.443 0.667 6.4 7.7 LOS A LOS A Dookie
Shepparton Road (East) 0.648 0.390 20.2 8.9 LOS C LOS A Grahamvale Road (North) 0.899 0.567 13.3 5.8 LOS B LOS A
Dookie Shepparton Road (West) 0.397 0.516 6.9 11.9 LOS A LOS B
All Approaches 0.898 0.671 11.5 8.0 LOS B LOS A
Table 6.3 indicates that the additional eastbound and southbound movements along the Grahamvale Road / Dookie Shepparton Road roundabout result in a high degree of saturation on most arms, however the roundabout is still operating well.
D R A F T
Shepparton North East Growth Corridor Development Traffic Impact Assessment P:\60028255 V07PU Shepparton\6_Draft_docs\6.1_Reports\Traffic and Transportation\1007tpe Traffic Assessment 20Nov08.doc Revision 21 November 2008 Page 25
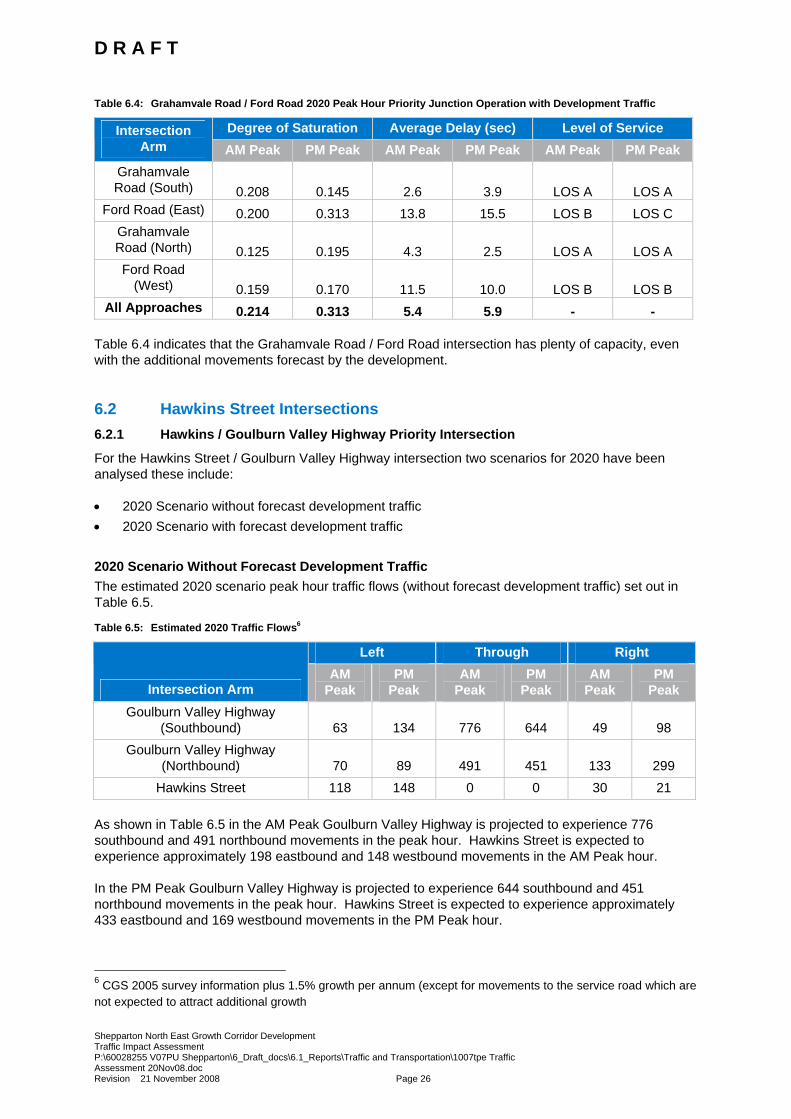
Table 6.4: Grahamvale Road / Ford Road 2020 Peak Hour Priority Junction Operation with Development Traffic
Degree of Saturation Average Delay (sec) Level of Service Intersection Arm AM Peak PM Peak AM Peak PM Peak AM Peak PM Peak
Grahamvale Road (South) 0.208 0.145 2.6 3.9 LOS A LOS A
Ford Road (East) 0.200 0.313 13.8 15.5 LOS B LOS C Grahamvale Road (North) 0.125 0.195 4.3 2.5 LOS A LOS A Ford Road
(West) 0.159 0.170 11.5 10.0 LOS B LOS B All Approaches 0.214 0.313 5.4 5.9 - -
Table 6.4 indicates that the Grahamvale Road / Ford Road intersection has plenty of capacity, even with the additional movements forecast by the development.
6.2 Hawkins Street Intersections 6.2.1 Hawkins / Goulburn Valley Highway Priority Intersection
For the Hawkins Street / Goulburn Valley Highway intersection two scenarios for 2020 have been analysed these include: • 2020 Scenario without forecast development traffic • 2020 Scenario with forecast development traffic 2020 Scenario Without Forecast Development Traffic The estimated 2020 scenario peak hour traffic flows (without forecast development traffic) set out in Table 6.5.
Table 6.5: Estimated 2020 Traffic Flows6
Left Through Right
Intersection Arm AM
Peak PM
Peak AM
Peak PM
Peak AM
Peak PM
Peak Goulburn Valley Highway
(Southbound) 63 134 776 644 49 98 Goulburn Valley Highway
(Northbound) 70 89 491 451 133 299 Hawkins Street 118 148 0 0 30 21
As shown in Table 6.5 in the AM Peak Goulburn Valley Highway is projected to experience 776 southbound and 491 northbound movements in the peak hour. Hawkins Street is expected to experience approximately 198 eastbound and 148 westbound movements in the AM Peak hour. In the PM Peak Goulburn Valley Highway is projected to experience 644 southbound and 451 northbound movements in the peak hour. Hawkins Street is expected to experience approximately 433 eastbound and 169 westbound movements in the PM Peak hour.
6 CGS 2005 survey information plus 1.5% growth per annum (except for movements to the service road which are not expected to attract additional growth
D R A F T
Shepparton North East Growth Corridor Development Traffic Impact Assessment P:\60028255 V07PU Shepparton\6_Draft_docs\6.1_Reports\Traffic and Transportation\1007tpe Traffic Assessment 20Nov08.doc Revision 21 November 2008 Page 26
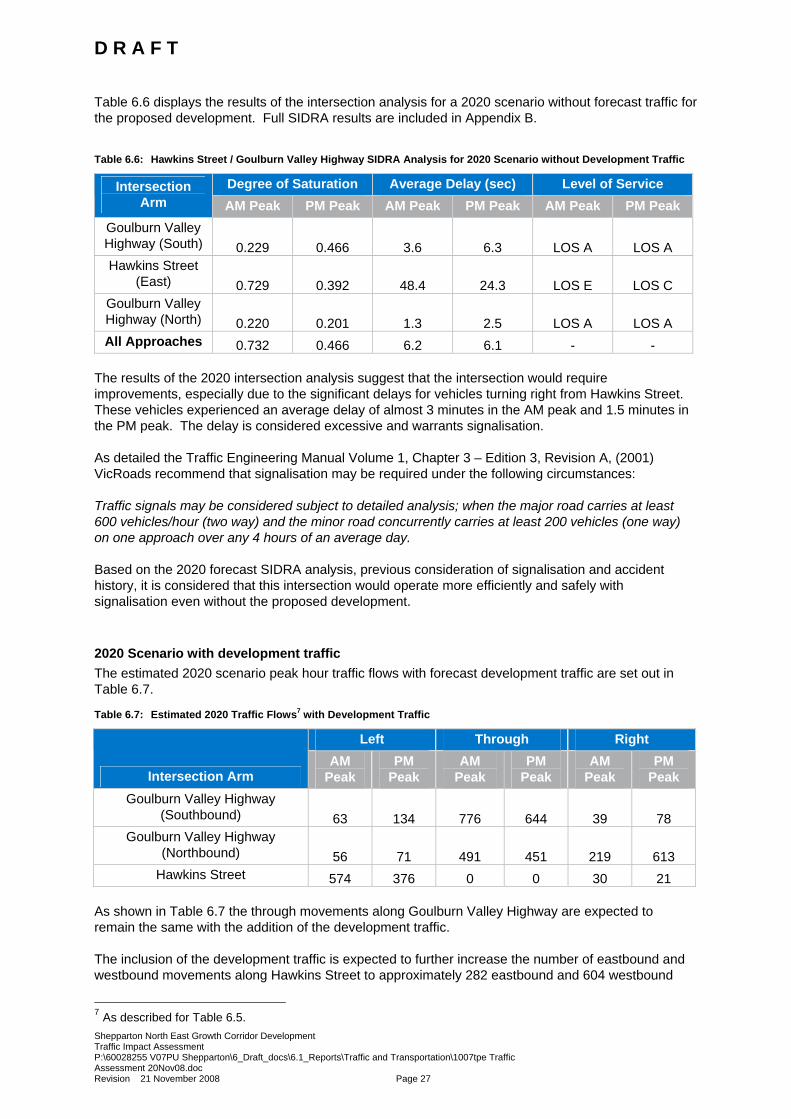
Table 6.6 displays the results of the intersection analysis for a 2020 scenario without forecast traffic for the proposed development. Full SIDRA results are included in Appendix B.
Table 6.6: Hawkins Street / Goulburn Valley Highway SIDRA Analysis for 2020 Scenario without Development Traffic
Degree of Saturation Average Delay (sec) Level of Service Intersection Arm AM Peak PM Peak AM Peak PM Peak AM Peak PM Peak
Goulburn Valley Highway (South) 0.229 0.466 3.6 6.3 LOS A LOS A Hawkins Street
(East) 0.729 0.392 48.4 24.3 LOS E LOS C Goulburn Valley Highway (North) 0.220 0.201 1.3 2.5 LOS A LOS A All Approaches 0.732 0.466 6.2 6.1 - -
The results of the 2020 intersection analysis suggest that the intersection would require improvements, especially due to the significant delays for vehicles turning right from Hawkins Street. These vehicles experienced an average delay of almost 3 minutes in the AM peak and 1.5 minutes in the PM peak. The delay is considered excessive and warrants signalisation. As detailed the Traffic Engineering Manual Volume 1, Chapter 3 – Edition 3, Revision A, (2001) VicRoads recommend that signalisation may be required under the following circumstances: Traffic signals may be considered subject to detailed analysis; when the major road carries at least 600 vehicles/hour (two way) and the minor road concurrently carries at least 200 vehicles (one way) on one approach over any 4 hours of an average day. Based on the 2020 forecast SIDRA analysis, previous consideration of signalisation and accident history, it is considered that this intersection would operate more efficiently and safely with signalisation even without the proposed development. 2020 Scenario with development traffic The estimated 2020 scenario peak hour traffic flows with forecast development traffic are set out in Table 6.7.
Table 6.7: Estimated 2020 Traffic Flows7 with Development Traffic
Left Through Right
Intersection Arm AM
Peak PM
Peak AM
Peak PM
Peak AM
Peak PM
Peak Goulburn Valley Highway
(Southbound) 63 134 776 644 39 78 Goulburn Valley Highway
(Northbound) 56 71 491 451 219 613 Hawkins Street 574 376 0 0 30 21
As shown in Table 6.7 the through movements along Goulburn Valley Highway are expected to remain the same with the addition of the development traffic. The inclusion of the development traffic is expected to further increase the number of eastbound and westbound movements along Hawkins Street to approximately 282 eastbound and 604 westbound
7 As described for Table 6.5.
D R A F T
Shepparton North East Growth Corridor Development Traffic Impact Assessment P:\60028255 V07PU Shepparton\6_Draft_docs\6.1_Reports\Traffic and Transportation\1007tpe Traffic Assessment 20Nov08.doc Revision 21 November 2008 Page 27
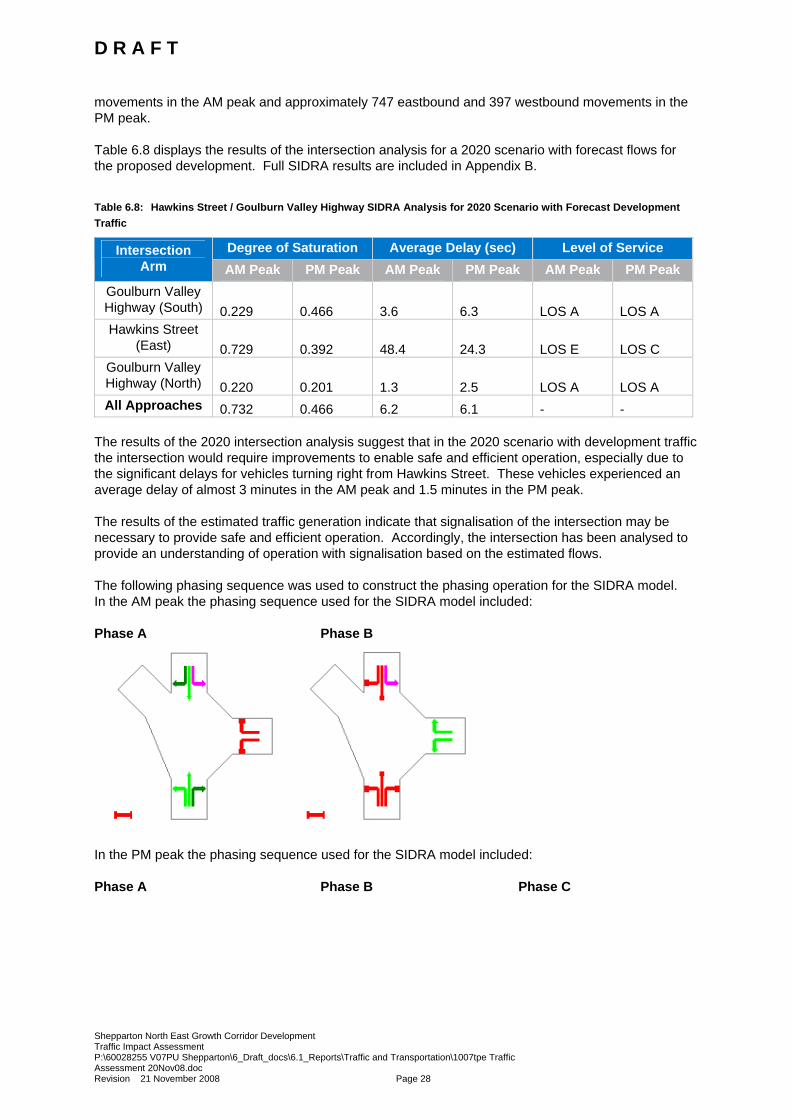
movements in the AM peak and approximately 747 eastbound and 397 westbound movements in the PM peak. Table 6.8 displays the results of the intersection analysis for a 2020 scenario with forecast flows for the proposed development. Full SIDRA results are included in Appendix B.
Table 6.8: Hawkins Street / Goulburn Valley Highway SIDRA Analysis for 2020 Scenario with Forecast Development Traffic
Degree of Saturation Average Delay (sec) Level of Service Intersection Arm AM Peak PM Peak AM Peak PM Peak AM Peak PM Peak
Goulburn Valley Highway (South) 0.229 0.466 3.6 6.3 LOS A LOS A Hawkins Street
(East) 0.729 0.392 48.4 24.3 LOS E LOS C Goulburn Valley Highway (North) 0.220 0.201 1.3 2.5 LOS A LOS A All Approaches 0.732 0.466 6.2 6.1 - -
The results of the 2020 intersection analysis suggest that in the 2020 scenario with development traffic the intersection would require improvements to enable safe and efficient operation, especially due to the significant delays for vehicles turning right from Hawkins Street. These vehicles experienced an average delay of almost 3 minutes in the AM peak and 1.5 minutes in the PM peak. The results of the estimated traffic generation indicate that signalisation of the intersection may be necessary to provide safe and efficient operation. Accordingly, the intersection has been analysed to provide an understanding of operation with signalisation based on the estimated flows. The following phasing sequence was used to construct the phasing operation for the SIDRA model. In the AM peak the phasing sequence used for the SIDRA model included: Phase A Phase B
In the PM peak the phasing sequence used for the SIDRA model included: Phase A Phase B Phase C
D R A F T
Shepparton North East Growth Corridor Development Traffic Impact Assessment P:\60028255 V07PU Shepparton\6_Draft_docs\6.1_Reports\Traffic and Transportation\1007tpe Traffic Assessment 20Nov08.doc Revision 21 November 2008 Page 28
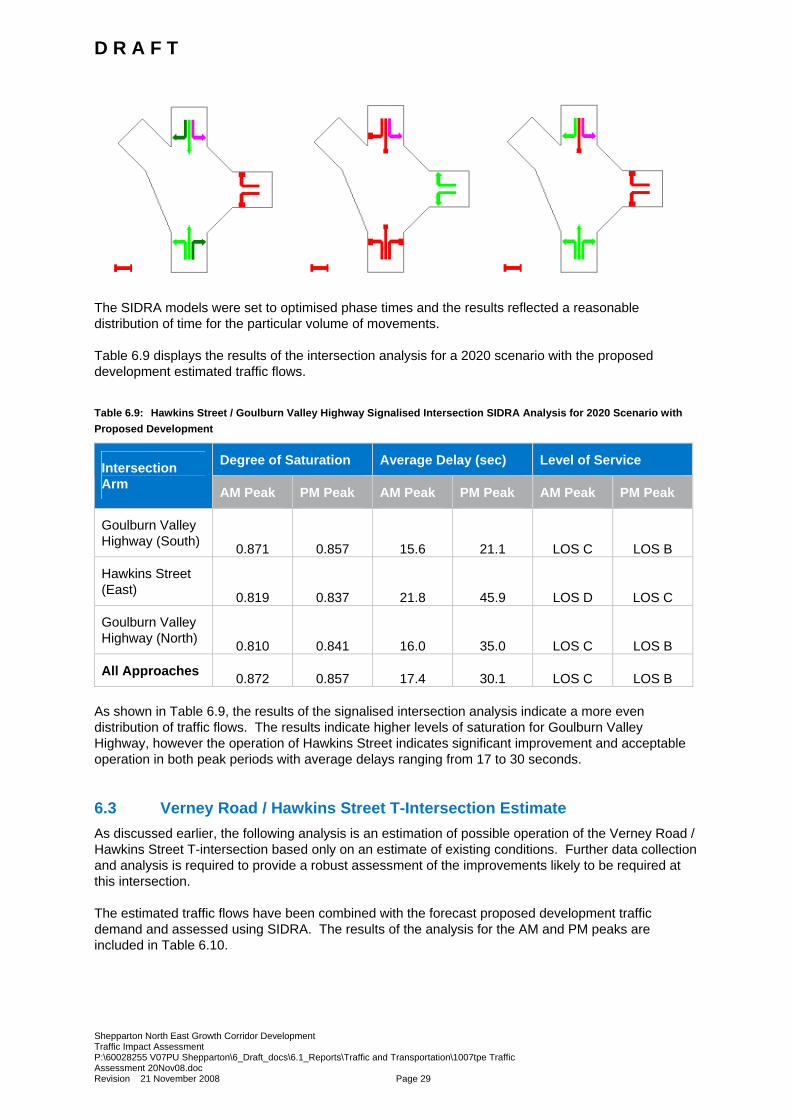
The SIDRA models were set to optimised phase times and the results reflected a reasonable distribution of time for the particular volume of movements. Table 6.9 displays the results of the intersection analysis for a 2020 scenario with the proposed development estimated traffic flows.
Table 6.9: Hawkins Street / Goulburn Valley Highway Signalised Intersection SIDRA Analysis for 2020 Scenario with Proposed Development
Degree of Saturation Average Delay (sec) Level of Service Intersection Arm AM Peak PM Peak AM Peak PM Peak AM Peak PM Peak
Goulburn Valley Highway (South) 0.871 0.857 15.6 21.1 LOS C LOS B
Hawkins Street (East) 0.819 0.837 21.8 45.9 LOS D LOS C
Goulburn Valley Highway (North) 0.810 0.841 16.0 35.0 LOS C LOS B
All Approaches 0.872 0.857 17.4 30.1 LOS C LOS B As shown in Table 6.9, the results of the signalised intersection analysis indicate a more even distribution of traffic flows. The results indicate higher levels of saturation for Goulburn Valley Highway, however the operation of Hawkins Street indicates significant improvement and acceptable operation in both peak periods with average delays ranging from 17 to 30 seconds.
6.3 Verney Road / Hawkins Street T-Intersection Estimate As discussed earlier, the following analysis is an estimation of possible operation of the Verney Road / Hawkins Street T-intersection based only on an estimate of existing conditions. Further data collection and analysis is required to provide a robust assessment of the improvements likely to be required at this intersection. The estimated traffic flows have been combined with the forecast proposed development traffic demand and assessed using SIDRA. The results of the analysis for the AM and PM peaks are included in Table 6.10.
D R A F T
Shepparton North East Growth Corridor Development Traffic Impact Assessment P:\60028255 V07PU Shepparton\6_Draft_docs\6.1_Reports\Traffic and Transportation\1007tpe Traffic Assessment 20Nov08.doc Revision 21 November 2008 Page 29
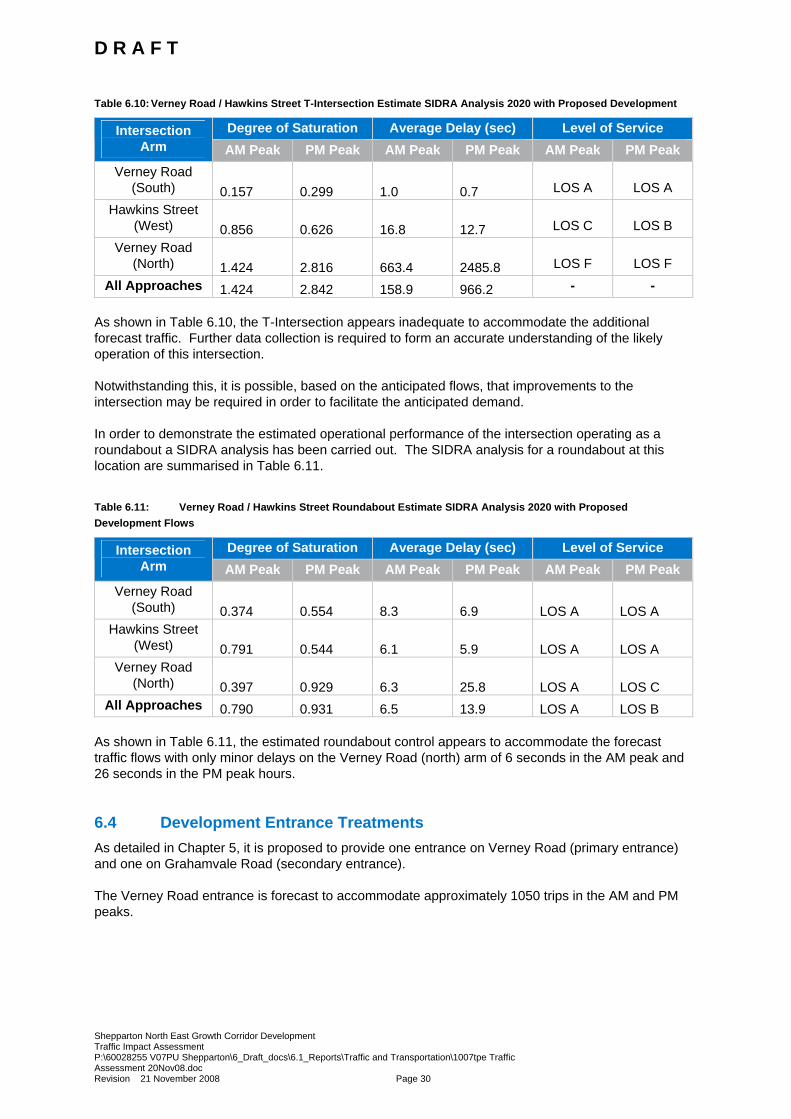
Table 6.10: Verney Road / Hawkins Street T-Intersection Estimate SIDRA Analysis 2020 with Proposed Development
Degree of Saturation Average Delay (sec) Level of Service Intersection Arm AM Peak PM Peak AM Peak PM Peak AM Peak PM Peak
Verney Road (South) 0.157 0.299 1.0 0.7 LOS A LOS A
Hawkins Street (West) 0.856 0.626 16.8 12.7 LOS C LOS B
Verney Road (North) 1.424 2.816 663.4 2485.8 LOS F LOS F
All Approaches 1.424 2.842 158.9 966.2 - - As shown in Table 6.10, the T-Intersection appears inadequate to accommodate the additional forecast traffic. Further data collection is required to form an accurate understanding of the likely operation of this intersection. Notwithstanding this, it is possible, based on the anticipated flows, that improvements to the intersection may be required in order to facilitate the anticipated demand. In order to demonstrate the estimated operational performance of the intersection operating as a roundabout a SIDRA analysis has been carried out. The SIDRA analysis for a roundabout at this location are summarised in Table 6.11.
Table 6.11: Verney Road / Hawkins Street Roundabout Estimate SIDRA Analysis 2020 with Proposed Development Flows
Degree of Saturation Average Delay (sec) Level of Service Intersection Arm AM Peak PM Peak AM Peak PM Peak AM Peak PM Peak
Verney Road (South) 0.374 0.554 8.3 6.9 LOS A LOS A
Hawkins Street (West) 0.791 0.544 6.1 5.9 LOS A LOS A
Verney Road (North) 0.397 0.929 6.3 25.8 LOS A LOS C
All Approaches 0.790 0.931 6.5 13.9 LOS A LOS B As shown in Table 6.11, the estimated roundabout control appears to accommodate the forecast traffic flows with only minor delays on the Verney Road (north) arm of 6 seconds in the AM peak and 26 seconds in the PM peak hours.
6.4 Development Entrance Treatments As detailed in Chapter 5, it is proposed to provide one entrance on Verney Road (primary entrance) and one on Grahamvale Road (secondary entrance). The Verney Road entrance is forecast to accommodate approximately 1050 trips in the AM and PM peaks.
D R A F T
Shepparton North East Growth Corridor Development Traffic Impact Assessment P:\60028255 V07PU Shepparton\6_Draft_docs\6.1_Reports\Traffic and Transportation\1007tpe Traffic Assessment 20Nov08.doc Revision 21 November 2008 Page 30
Based on classified traffic counts provided by CGS and the 1.5% growth rate of the local area, it is estimated that the traffic along Verney Road, in the vicinity of the proposed entrance will carry approximately: • 300 southbound movements and 210 northbound movements in the AM peak • 260 southbound movements and 230 northbound movements in the AM peak The Grahamvale Road entrance is forecast to accommodate approximately 847 trips in the AM and PM peaks. Based on turning movement counts carried out on behalf of Maunsell AECOM at the Grahamvale Road / New Dookie Road intersection and the 1.5% growth rate of the local area, it is estimated that the traffic along Grahamvale Road, in the vicinity of the proposed entrance will carry approximately: • 300 southbound movements and 210 northbound movements in the AM peak • 260 southbound movements and 230 northbound movements in the AM peak As detailed the Traffic Engineering Manual Volume 1, Chapter 3 – Edition 3, Revision A, (2001) VicRoads recommend that signalisation may be required when: • Traffic Volume – Signals may be considered when the major road carries at least 600 vehicles
per hour and the minor road concurrently carries at least 200 vehicles per hour over any four hours of the day; or
• Continuous Traffic – Where traffic on the major road is sufficient to cause undue delay or hazard for traffic on a minor road, signals may be warranted when traffic on the major road carries at least 900 vehicles per hour and the minor road carries at least 100 vehicles per hour over any four hours of an average day.
Therefore, based on the forecast traffic flows for a development this size with two entrances and the expected background flows along Verney Road and Grahamvale Road, it is recommended that the most suitable proposed development entrance treatments will include signalisation. This should be taken into consideration during the detail design of the development.
6.5 Conclusions The following paragraphs discuss the conclusions of the traffic impact on the local road network as a result of the proposed development of the North East Growth Area in Shepparton.
6.5.1 Verney Road and Grahamvale Road
Generally the intersections are adequate to accommodate the additional forecast traffic as proposed in Chapter 5. Grahamvale Road will operate satisfactorily when HGV movements are assessed with 7% HGV. However if the HGV usage was expected to remain as high as 20% in the 2020 design forecast the Grahamvale Road / Dookie Shepparton Road roundabout would experience operational problems. Due to this CGS should continue to pursue the construction of the Shepparton Bypass as a matter of priority to ensure that no local problems develop.
6.5.2 Hawkins Street / Goulburn Valley Highway
Whilst the Hawkins Street / Goulburn Valley Highway is currently operating generally well as a priority intersection, already movements from Hawkins Street are experiencing delays and crash history of four collisions in the last five years indicates that there are some safety issues with the current operation. CGS are aware of these issues and are monitoring the intersection.
D R A F T
Shepparton North East Growth Corridor Development Traffic Impact Assessment P:\60028255 V07PU Shepparton\6_Draft_docs\6.1_Reports\Traffic and Transportation\1007tpe Traffic Assessment 20Nov08.doc Revision 21 November 2008 Page 31
Accordingly analysis of the forecast traffic for the design year 2020 (with and without the proposed development) indicate that without improvement, Hawkins Street will experience excessive delays and inevitably an increased safety risk. Based on these factors the operation of the Hawkins Street / Goulburn Valley Highway intersection was analysed to understand how it could operate as a signalised intersection in 2020 (with and without the forecast development traffic). It was found that the priority was more evenly distributed resulting in acceptable average delays for all arms of the intersection. As the base traffic flows for this analysis were collected in 2005 it is recommended that further traffic analysis should be carried out (with recent survey data) to ensure the intersection can cater for the future demands. Notwithstanding this, it is highly probable that the flows along Hawkins Street and Goulburn Valley Highway will necessitate improvements (such as signalisation) to this intersection.
6.5.3 Hawkins Street / Verney Road
As previously discussed, all analysis of Hawkins Street / Verney Road intersection has been based on the possible operation constructed only on an estimate of existing conditions. Recommendations in this report are indicative only and further data collection and analysis is required to provide a robust assessment of the improvements likely to be required at this intersection. The estimated analysis indicates that the proposed additional forecast traffic flows at the Hawkins Street / Verney Road intersection may be likely to result in the requirement of intersection improvements such as a roundabout. This option should be explored further based on new data collection and analysis.
6.5.4 Development Entrance Treatments
Based on the forecast traffic flows for the proposed development and the expected background flows along Verney Road and Grahamvale Road, it is recommended that the most suitable entrance treatments will include signalisation. This should be taken into consideration during the detail design of the development.
D R A F T
Shepparton North East Growth Corridor Development Traffic Impact Assessment P:\60028255 V07PU Shepparton\6_Draft_docs\6.1_Reports\Traffic and Transportation\1007tpe Traffic Assessment 20Nov08.doc Revision 21 November 2008 Page 32
7.0 Further Issues Further to the findings of this investigation there are issues that may impact the traffic operation of the local road network. These issues have been summarised in the following paragraphs.
7.1 Sustainable Transport Design Measures to reduce the reliance on the private car should be investigated for this development. This will enable a reduction in trips made by private cars reducing the pressure on the local road network. This will also enable residents and employers travel options other than the private car. Well planned and strategically placed bus routes and links to existing services should be explored for trips to Shepparton, Mooroopna, other civic attractions, employment areas and secondary colleges. This will enable sustainable transport choice, reduction in vehicle trips on the local road network and increase the accessibility of residents that do not drive (including senior citizens and teenagers). A well planned, permeable cycle network with strategic links should also be designed to assist the reduction in vehicle trips on the local road network. There is already a good cyclist network infrastructure established in the local area and there is opportunity to strengthen this as a part of the proposed development. In addition safe, well planned permeable pedestrian network should be established to encourage local trips by foot and reduce vehicle trips on the local road network. Other sustainable travel planning initiatives such as local travel plans and car sharing clubs should also be considered to reduce the reliance of the private car, reduce vehicle trips on the local road network and increase accessibility of the future residents and employees of the North East Growth Area development. The development should be designed in accordance with the Public Transport: Guidelines for Land Use and Development.
7.2 Encouraging Shepparton Bypass Development The development and opening of the Shepparton Bypass will directly impact the local road network of the North East Growth Area development. As discussed previously, Grahamvale Road is currently the bypass route for HGVs and accordingly experiences a high proportion of HGV traffic. It is estimated that the traffic operation with forecast development flows is likely fit comfortably within the existing intersections with Ford Road and New Dookie Road however, if Grahamvale Road was to experience 20% HGV traffic these two intersections may experience operational difficulties and increase the risk of accidents. In addition, there are considerable safety issues as Grahamvale Road will also accommodate the secondary access point for the development likely to carry approximately 45% of all trips to/from the site. It is recommended that CGS continue to pursue the timely development of the Shepparton Bypass in order to reduce the risk and enable satisfactory traffic operation along Grahamvale Road.
7.3 Data Collection and Analysis As previously discussed, further data collection and analysis is necessary to provide a greater understanding of the operation of the Hawkins Street intersections and will provide a clearer
D R A F T
Shepparton North East Growth Corridor Development Traffic Impact Assessment P:\60028255 V07PU Shepparton\6_Draft_docs\6.1_Reports\Traffic and Transportation\1007tpe Traffic Assessment 20Nov08.doc Revision 21 November 2008 Page 33
understanding of the likely traffic improvements necessary to ensure safe and effective operation of the intersections as a result of the proposed development. No analysis has been carried out for the intersections of Goulburn Valley Highway with Balaclava Road, Ford Road or Verney Road. Analysis of these intersections may provide a greater understanding of how they will be affected by the proposed development.
7.4 Further Developments of in the North East Growth Area Consideration should be given to the possibility of further residential development on the North East Shepparton Growth Area site. This investigation has considered a traffic forecast as described in Chapter 5 of this report, it does not take into consideration any additional development of the site than described in this report. If there is potential to develop the North East Growth Area further this should be addressed in the Outline Development Plan.
D R A F T
Shepparton North East Growth Corridor Development Traffic Impact Assessment P:\60028255 V07PU Shepparton\6_Draft_docs\6.1_Reports\Traffic and Transportation\1007tpe Traffic Assessment 20Nov08.doc Revision 21 November 2008 Page 34
Appendix A Existing Traffic Flows
D R A F T
Shepparton North East Growth Corridor Development Traffic Impact Assessment P:\60028255 V07PU Shepparton\6_Draft_docs\6.1_Reports\Traffic and Transportation\1007tpe Traffic Assessment 20Nov08.doc Revision 21 November 2008 Page A
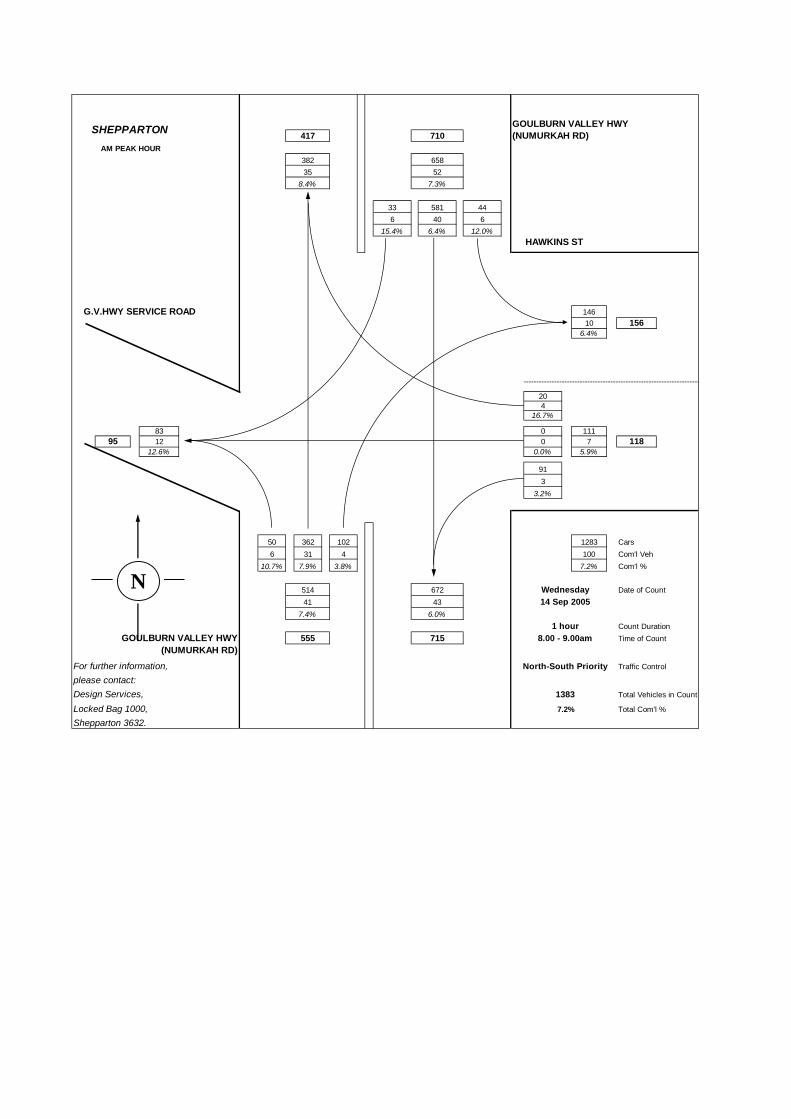
GOULBURN VALLEY HWY417 710 (NUMURKAH RD)
382 65835 52
8.4% 7.3%
33 581 446 40 6
15.4% 6.4% 12.0%HAWKINS ST
G.V.HWY SERVICE ROAD 14610 156
6.4%
204
16.7%
83 0 11195 12 0 7 118
12.6% 0.0% 5.9%
913
3.2%
50 362 102 1283 Cars6 31 4 100 Com'l Veh
10.7% 7.9% 3.8% 7.2% Com'l %
514 672 Wednesday Date of Count41 43 14 Sep 2005
7.4% 6.0%1 hour Count Duration
GOULBURN VALLEY HWY 555 715 8.00 - 9.00am Time of Count
For further information,
(NUMURKAH RD)North-South Priority Traffic Control
please contact:Design Services, 1383 Total Vehicles in Count
Locked Bag 1000, Total Com'l %
Shepparton 3632.
SHEPPARTONAM PEAK HOUR
7.2%
N

GOULBURN VALLEY HWY378 700 (NUMURKAH RD)
363 67715 23
4.0% 3.3%
77 496 1041 19 3
1.3% 3.7% 2.8%HAWKINS ST
G.V.HWY SERVICE ROAD 3406 346
1.7%
152
11.8%
146 0 132149 3 0 3 135
2.0% 0.0% 2.2%
1171
0.8%
69 348 236 1462 Cars2 13 3 44 Com'l Veh
2.8% 3.6% 1.3% 2.9% Com'l %
653 613 Wednesday Date of Count18 20 14 Sep 2005
2.7% 3.2%1 hour Count Duration
GOULBURN VALLEY HWY 671 633 4.45 - 5.45pm Time of Count
For further information,
(NUMURKAH RD)North-South Priority Traffic Control
please contact:Design Services, 1506 Total Vehicles in Count
Locked Bag 1000, Total Com'l %
Shepparton 3632.
SHEPPARTONPM PEAK HOUR
2.9%
N
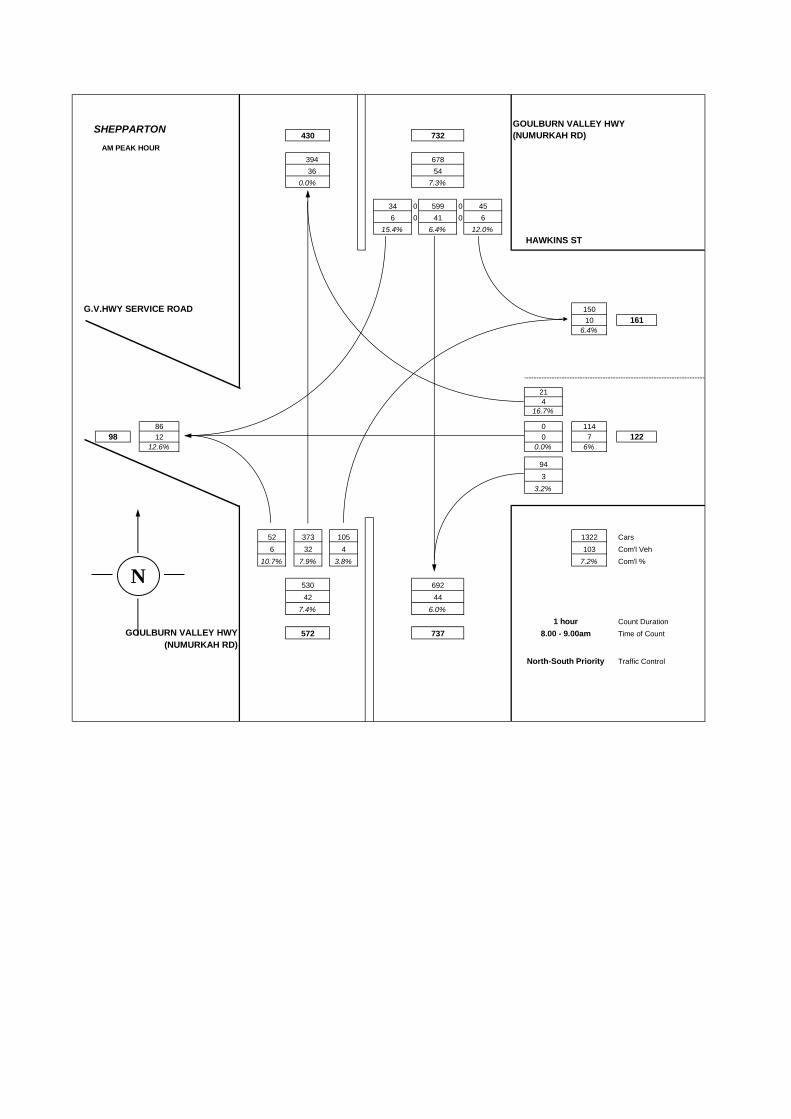
GOULBURN VALLEY HWY430 732 (NUMURKAH RD)
394 67836 54
0.0% 7.3%
34 0 599 0 456 0 41 0 6
15.4% 6.4% 12.0%HAWKINS ST
G.V.HWY SERVICE ROAD 15010 161
6.4%
214
16.7%
86 0 11498 12 0 7 122
12.6% 0.0% 6%
943
3.2%
52 373 105 1322 Cars6 32 4 103 Com'l Veh
10.7% 7.9% 3.8% 7.2% Com'l %
530 69242 44
7.4% 6.0%1 hour Count Duration
GOULBURN VALLEY HWY 572 737 8.00 - 9.00am Time of Count(NUMURKAH RD)
North-South Priority Traffic Control
SHEPPARTON
AM PEAK HOUR
N
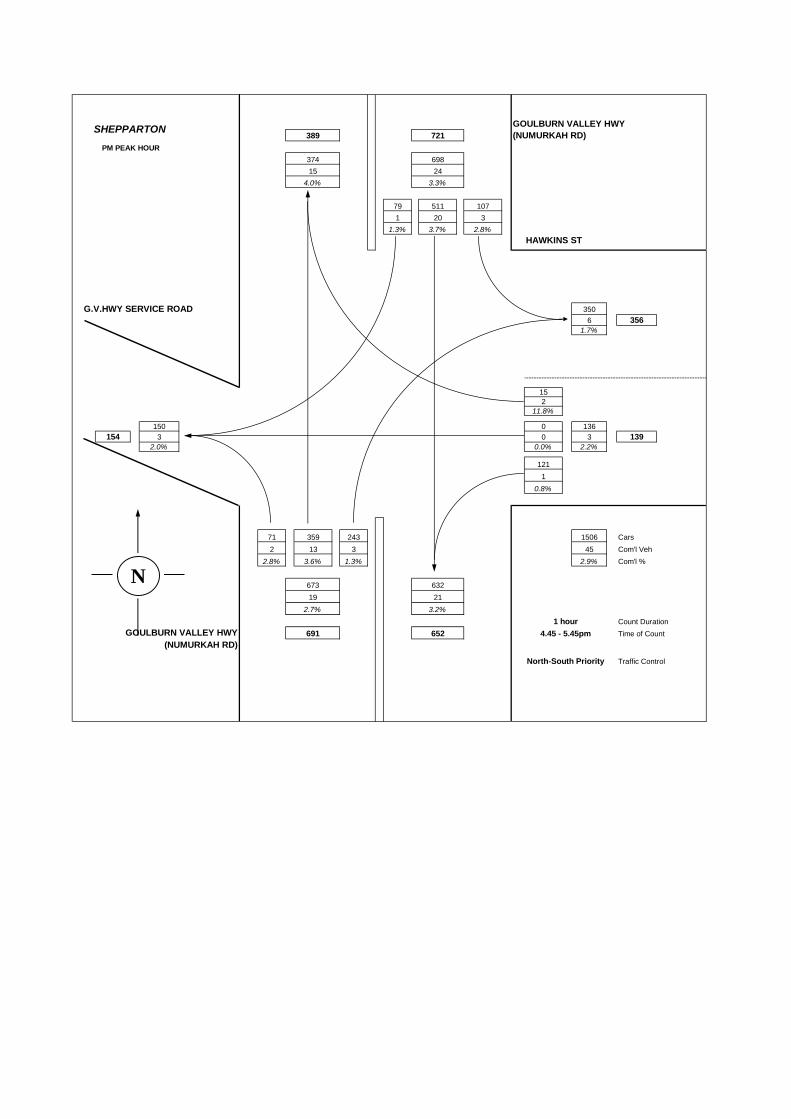
GOULBURN VALLEY HWY389 721 (NUMURKAH RD)
374 69815 24
4.0% 3.3%
79 511 1071 20 3
1.3% 3.7% 2.8%HAWKINS ST
G.V.HWY SERVICE ROAD 3506 356
1.7%
152
11.8%
150 0 136154 3 0 3 139
2.0% 0.0% 2.2%
1211
0.8%
71 359 243 1506 Cars2 13 3 45 Com'l Veh
2.8% 3.6% 1.3% 2.9% Com'l %
673 63219 21
2.7% 3.2%1 hour Count Duration
GOULBURN VALLEY HWY 691 652 4.45 - 5.45pm Time of Count(NUMURKAH RD)
North-South Priority Traffic Control
SHEPPARTON
PM PEAK HOUR
N
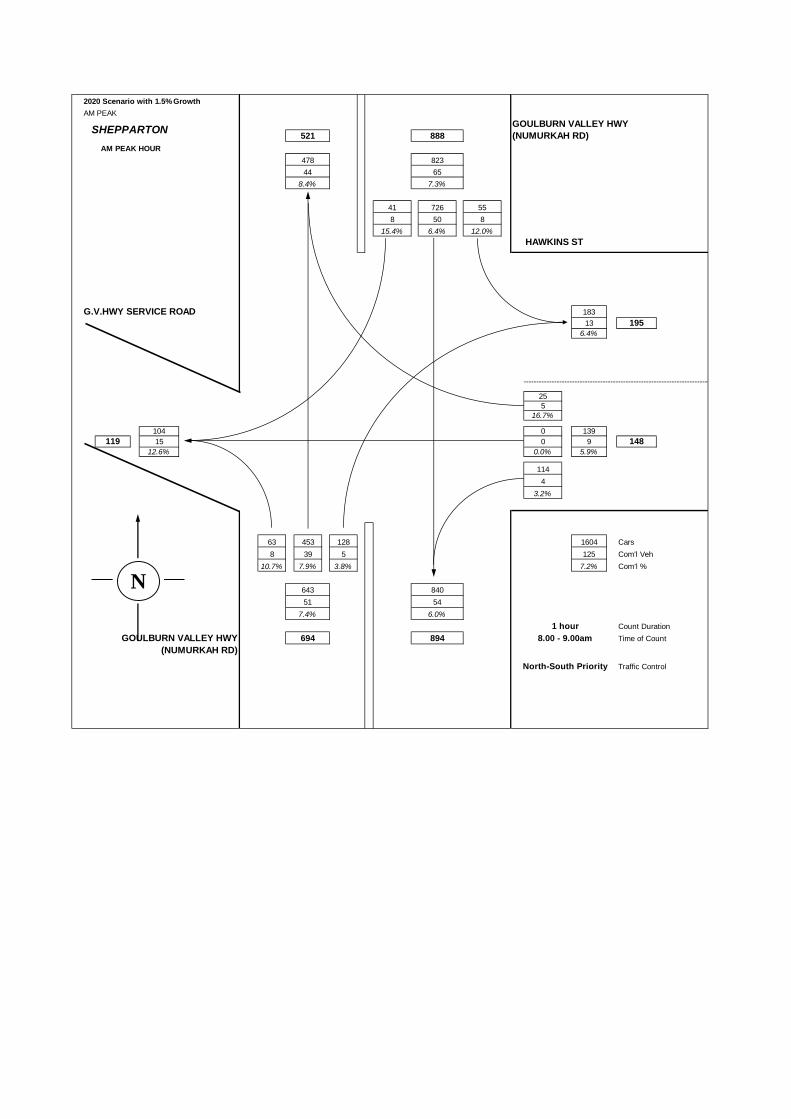
2020 Scenario with 1.5% GrowthAM PEAK
GOULBURN VALLEY HWY521 888 (NUMURKAH RD)
478 82344 65
8.4% 7.3%
41 726 558 50 8
15.4% 6.4% 12.0%HAWKINS ST
G.V.HWY SERVICE ROAD 18313 195
6.4%
255
16.7%
104 0 139119 15 0 9 148
12.6% 0.0% 5.9%
1144
3.2%
63 453 128 1604 Cars8 39 5 125 Com'l Veh
10.7% 7.9% 3.8% 7.2% Com'l %
643 84051 54
7.4% 6.0%1 hour Count Duration
GOULBURN VALLEY HWY 694 894 8.00 - 9.00am Time of Count(NUMURKAH RD)
North-South Priority Traffic Control
SHEPPARTONAM PEAK HOUR
N
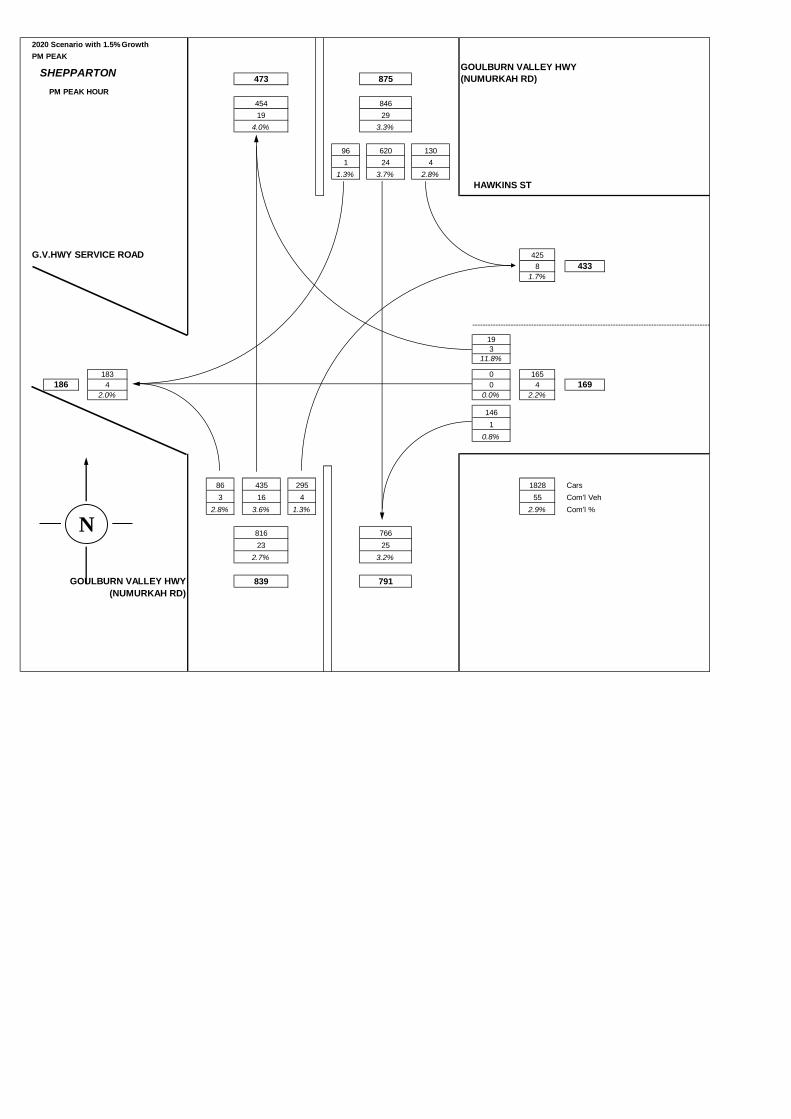
2020 Scenario with 1.5% GrowthPM PEAK
GOULBURN VALLEY HWY473 875 (NUMURKAH RD)
454 84619 29
4.0% 3.3%
96 620 1301 24 4
1.3% 3.7% 2.8%HAWKINS ST
G.V.HWY SERVICE ROAD 4258 433
1.7%
193
11.8%
183 0 165186 4 0 4 169
2.0% 0.0% 2.2%
1461
0.8%
86 435 295 1828 Cars3 16 4 55 Com'l Veh
2.8% 3.6% 1.3% 2.9% Com'l %
816 76623 25
2.7% 3.2%
GOULBURN VALLEY HWY 839 791(NUMURKAH RD)
Left ThroughRightGoulburn Valley Highway (Southbound) 134 # #Goulburn Valley Highway (Northbound) 89 # #Hawkins Street 148 0 #
SHEPPARTONPM PEAK HOUR
N
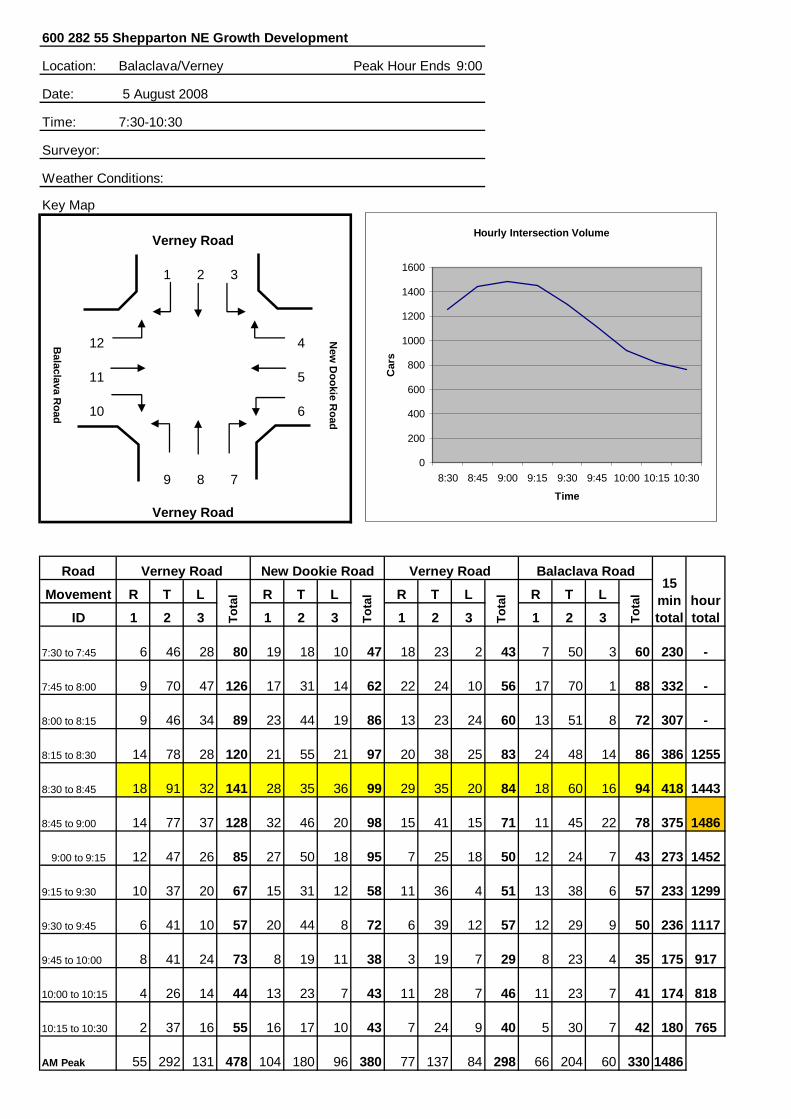
600 282 55 Shepparton NE Growth Development
Location: Balaclava/Verney Peak Hour Ends: 9:00
Date: 5 August 2008
Time: 7:30-10:30
Surveyor:
Weather Conditions:
Key Map
Verney Road
1 2 3
12 4
11 5
10 6
9 8 7
Verney Road
R T L R T L R T L R T L
1 2 3 1 2 3 1 2 3 1 2 3
7:30 to 7:45 6 46 28 80 19 18 10 47 18 23 2 43 7 50 3 60 230 -
7:45 to 8:00 9 70 47 126 17 31 14 62 22 24 10 56 17 70 1 88 332 -
8:00 to 8:15 9 46 34 89 23 44 19 86 13 23 24 60 13 51 8 72 307 -
8:15 to 8:30 14 78 28 120 21 55 21 97 20 38 25 83 24 48 14 86 386 1255
8:30 to 8:45 18 91 32 141 28 35 36 99 29 35 20 84 18 60 16 94 418 1443
8:45 to 9:00 14 77 37 128 32 46 20 98 15 41 15 71 11 45 22 78 375 1486
12 47 26 85 27 50 18 95 7 25 18 50 12 24 7 43 273 1452
9:15 to 9:30 10 37 20 67 15 31 12 58 11 36 4 51 13 38 6 57 233 1299
9:30 to 9:45 6 41 10 57 20 44 8 72 6 39 12 57 12 29 9 50 236 1117
9:45 to 10:00 8 41 24 73 8 19 11 38 3 19 7 29 8 23 4 35 175 917
10:00 to 10:15 4 26 14 44 13 23 7 43 11 28 7 46 11 23 7 41 174 818
10:15 to 10:30 2 37 16 55 16 17 10 43 7 24 9 40 5 30 7 42 180 765
AM Peak 55 292 131 478 104 180 96 380 77 137 84 298 66 204 60 330 1486
15mintotal
hourtotalTo
tal
Tota
l
Tota
l
Tota
l
Balaclava RoadRoad
Balaclava R
oad
New
Dookie R
oad
Verney Road New Dookie Road
9:00 to 9:15
ID
Movement
Verney Road
Hourly Intersection Volume
0
200
400
600
800
1000
1200
1400
1600
8:30 8:45 9:00 9:15 9:30 9:45 10:00 10:15 10:30
Time
Car
s
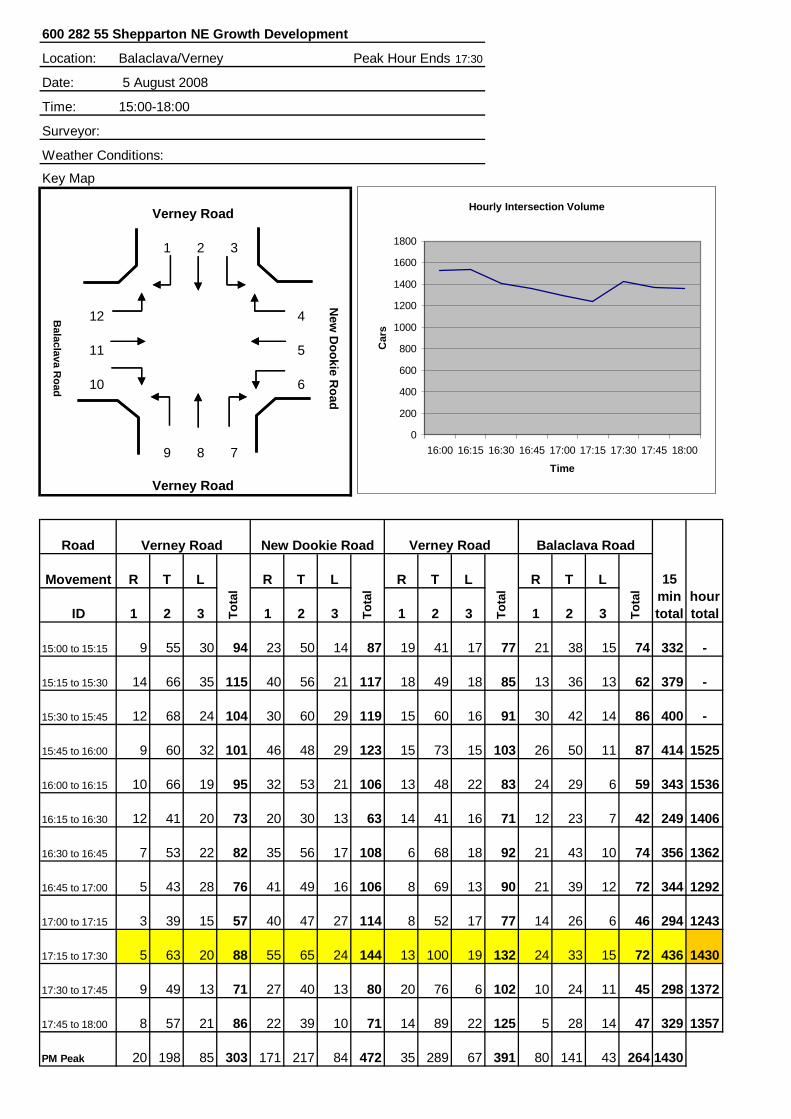
600 282 55 Shepparton NE Growth Development
Location: Balaclava/Verney Peak Hour Ends:17:30
Date: 5 August 2008
Time: 15:00-18:00
Surveyor:
Weather Conditions:
Key Map
Verney Road
1 2 3
12 4
11 5
10 6
9 8 7
Verney Road
R T L R T L R T L R T L
1 2 3 1 2 3 1 2 3 1 2 3
15:00 to 15:15 9 55 30 94 23 50 14 87 19 41 17 77 21 38 15 74 332 -
15:15 to 15:30 14 66 35 115 40 56 21 117 18 49 18 85 13 36 13 62 379 -
15:30 to 15:45 12 68 24 104 30 60 29 119 15 60 16 91 30 42 14 86 400 -
15:45 to 16:00 9 60 32 101 46 48 29 123 15 73 15 103 26 50 11 87 414 1525
16:00 to 16:15 10 66 19 95 32 53 21 106 13 48 22 83 24 29 6 59 343 1536
16:15 to 16:30 12 41 20 73 20 30 13 63 14 41 16 71 12 23 7 42 249 1406
16:30 to 16:45 7 53 22 82 35 56 17 108 6 68 18 92 21 43 10 74 356 1362
16:45 to 17:00 5 43 28 76 41 49 16 106 8 69 13 90 21 39 12 72 344 1292
17:00 to 17:15 3 39 15 57 40 47 27 114 8 52 17 77 14 26 6 46 294 1243
17:15 to 17:30 5 63 20 88 55 65 24 144 13 100 19 132 24 33 15 72 436 1430
17:30 to 17:45 9 49 13 71 27 40 13 80 20 76 6 102 10 24 11 45 298 1372
17:45 to 18:00 8 57 21 86 22 39 10 71 14 89 22 125 5 28 14 47 329 1357
PM Peak 20 198 85 303 171 217 84 472 35 289 67 391 80 141 43 264 1430
Verney RoadRoad
15mintotal
hourtotalTo
tal
Tota
l
Tota
l
Tota
l
Balaclava Road
New
Dookie R
oad
Balaclava R
oad
ID
Movement
Verney Road New Dookie Road
Hourly Intersection Volume
0
200
400
600
800
1000
1200
1400
1600
1800
16:00 16:15 16:30 16:45 17:00 17:15 17:30 17:45 18:00
Time
Car
s
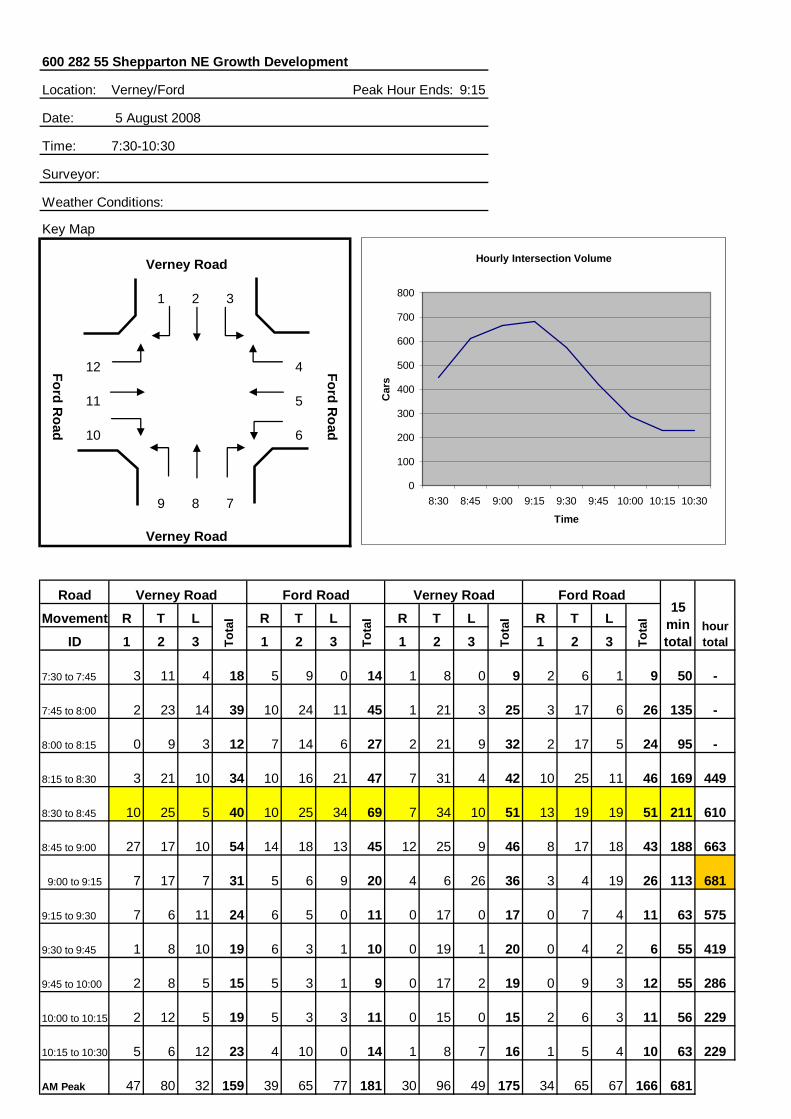
600 282 55 Shepparton NE Growth Development
Location: Verney/Ford Peak Hour Ends: 9:15
Date: 5 August 2008
Time: 7:30-10:30
Surveyor:
Weather Conditions:
Key Map
Verney Road
1 2 3
12 4
11 5
10 6
9 8 7
Verney Road
R T L R T L R T L R T L
1 2 3 1 2 3 1 2 3 1 2 3
7:30 to 7:45 3 11 4 18 5 9 0 14 1 8 0 9 2 6 1 9 50 -
7:45 to 8:00 2 23 14 39 10 24 11 45 1 21 3 25 3 17 6 26 135 -
8:00 to 8:15 0 9 3 12 7 14 6 27 2 21 9 32 2 17 5 24 95 -
8:15 to 8:30 3 21 10 34 10 16 21 47 7 31 4 42 10 25 11 46 169 449
8:30 to 8:45 10 25 5 40 10 25 34 69 7 34 10 51 13 19 19 51 211 610
8:45 to 9:00 27 17 10 54 14 18 13 45 12 25 9 46 8 17 18 43 188 663
7 17 7 31 5 6 9 20 4 6 26 36 3 4 19 26 113 681
9:15 to 9:30 7 6 11 24 6 5 0 11 0 17 0 17 0 7 4 11 63 575
9:30 to 9:45 1 8 10 19 6 3 1 10 0 19 1 20 0 4 2 6 55 419
9:45 to 10:00 2 8 5 15 5 3 1 9 0 17 2 19 0 9 3 12 55 286
10:00 to 10:15 2 12 5 19 5 3 3 11 0 15 0 15 2 6 3 11 56 229
10:15 to 10:30 5 6 12 23 4 10 0 14 1 8 7 16 1 5 4 10 63 229
AM Peak 47 80 32 159 39 65 77 181 30 96 49 175 34 65 67 166 681
15mintotal
hourtotalTo
tal
Tota
l
Tota
l
Tota
l
Verney Road Ford Road
Ford Road
Ford Road
ID
9:00 to 9:15
Movement
Verney Road Ford RoadRoad
Hourly Intersection Volume
0
100
200
300
400
500
600
700
800
8:30 8:45 9:00 9:15 9:30 9:45 10:00 10:15 10:30
Time
Car
s

600 282 55 Shepparton NE Growth Development
Location: Verney/Ford Peak Hour Ends: 16:00
Date: 5 August 2008
Time: 15:00-18:00
Surveyor:
Weather Conditions:
Key Map
Verney Road
1 2 3
12 4
11 5
10 6
9 8 7
Verney Road
R T L R T L R T L R T L
1 2 3 1 2 3 1 2 3 1 2 3
15:00 to 15:15 16 30 6 52 15 11 6 32 2 13 4 19 1 17 9 27 130 -
15:15 to 15:30 13 40 11 64 7 28 16 51 8 28 10 46 4 9 5 18 179 -
15:30 to 15:45 18 32 6 56 6 18 8 32 14 38 13 65 3 26 23 52 205 -
15:45 to 16:00 15 31 19 65 6 17 7 30 6 27 5 38 6 25 16 47 180 694
16:00 to 16:15 4 16 8 28 6 8 7 21 10 25 3 38 1 14 11 26 113 677
16:15 to 16:30 5 6 10 21 11 8 7 26 10 13 7 30 10 6 8 24 101 599
16:30 to 16:45 7 17 10 34 18 20 16 54 11 10 12 33 14 5 14 33 154 548
16:45 to 17:00 7 11 10 28 5 11 8 24 9 10 6 25 8 9 7 24 101 469
17:00 to 17:15 9 18 9 36 6 10 3 19 3 13 3 19 0 11 15 26 100 456
17:15 to 17:30 3 30 6 39 9 9 8 26 3 13 10 26 2 19 6 27 118 473
17:30 to 17:45 6 13 6 25 10 7 5 22 4 15 4 23 18 13 8 39 109 428
17:45 to 18:00 7 22 10 39 2 4 6 12 3 18 5 26 4 12 7 23 100 427
PM Peak 62 133 42 237 34 74 37 145 30 106 32 168 14 77 53 144 694
15mintotal
hourtotalTo
tal
Tota
l
Tota
l
Tota
l
Verney Road Ford Road
Ford Road
Ford Road
ID
Movement
Verney Road Ford RoadRoad
Hourly Intersection Volume
0
100
200
300
400
500
600
700
800
16:00 16:15 16:30 16:45 17:00 17:15 17:30 17:45 18:00
Time
Car
s
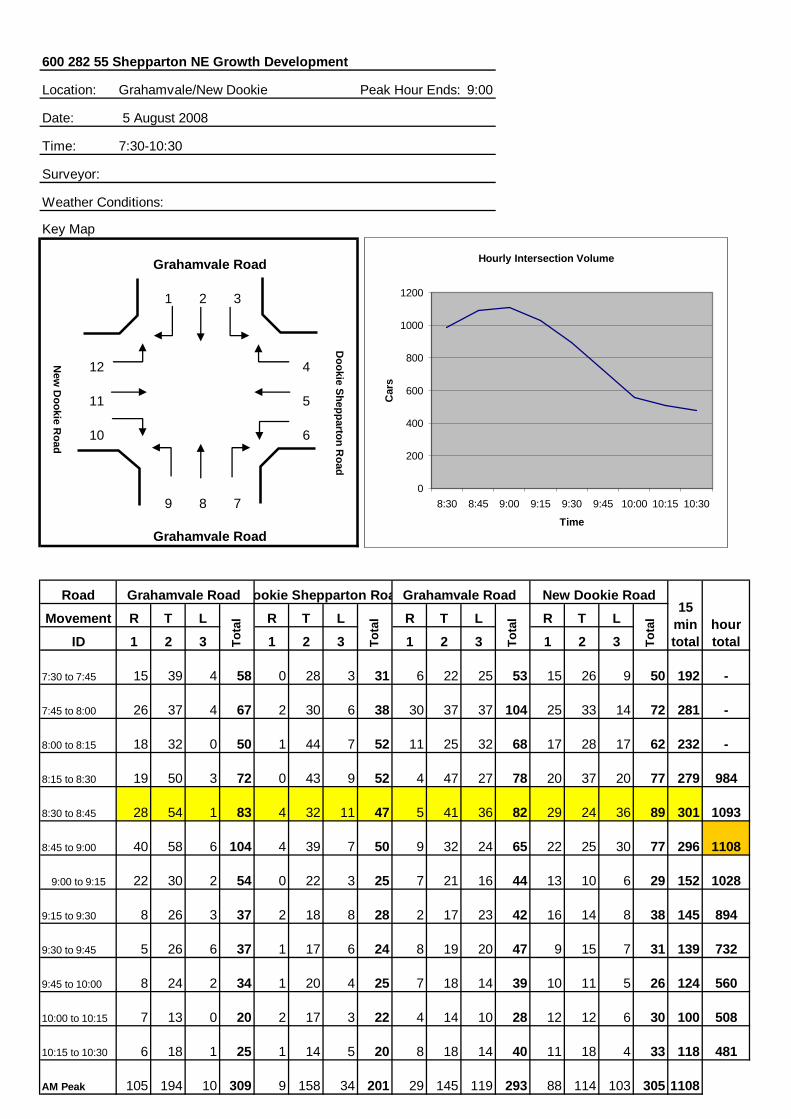
600 282 55 Shepparton NE Growth Development
Location: Grahamvale/New Dookie Peak Hour Ends: 9:00
Date: 5 August 2008
Time: 7:30-10:30
Surveyor:
Weather Conditions:
Key Map
Grahamvale Road
1 2 3
12 4
11 5
10 6
9 8 7
Grahamvale Road
R T L R T L R T L R T L
1 2 3 1 2 3 1 2 3 1 2 3
7:30 to 7:45 15 39 4 58 0 28 3 31 6 22 25 53 15 26 9 50 192 -
7:45 to 8:00 26 37 4 67 2 30 6 38 30 37 37 104 25 33 14 72 281 -
8:00 to 8:15 18 32 0 50 1 44 7 52 11 25 32 68 17 28 17 62 232 -
8:15 to 8:30 19 50 3 72 0 43 9 52 4 47 27 78 20 37 20 77 279 984
8:30 to 8:45 28 54 1 83 4 32 11 47 5 41 36 82 29 24 36 89 301 1093
8:45 to 9:00 40 58 6 104 4 39 7 50 9 32 24 65 22 25 30 77 296 1108
22 30 2 54 0 22 3 25 7 21 16 44 13 10 6 29 152 1028
9:15 to 9:30 8 26 3 37 2 18 8 28 2 17 23 42 16 14 8 38 145 894
9:30 to 9:45 5 26 6 37 1 17 6 24 8 19 20 47 9 15 7 31 139 732
9:45 to 10:00 8 24 2 34 1 20 4 25 7 18 14 39 10 11 5 26 124 560
10:00 to 10:15 7 13 0 20 2 17 3 22 4 14 10 28 12 12 6 30 100 508
10:15 to 10:30 6 18 1 25 1 14 5 20 8 18 14 40 11 18 4 33 118 481
AM Peak 105 194 10 309 9 158 34 201 29 145 119 293 88 114 103 305 1108
hourtotalTo
tal
Tota
l
Tota
l
Tota
l
Grahamvale Road New Dookie Road
9:00 to 9:15
Movement
New
Dookie R
oad
15mintotal
Dookie Shepparton R
oad
Grahamvale Road Dookie Shepparton Road
ID
Road
Hourly Intersection Volume
0
200
400
600
800
1000
1200
8:30 8:45 9:00 9:15 9:30 9:45 10:00 10:15 10:30
Time
Car
s
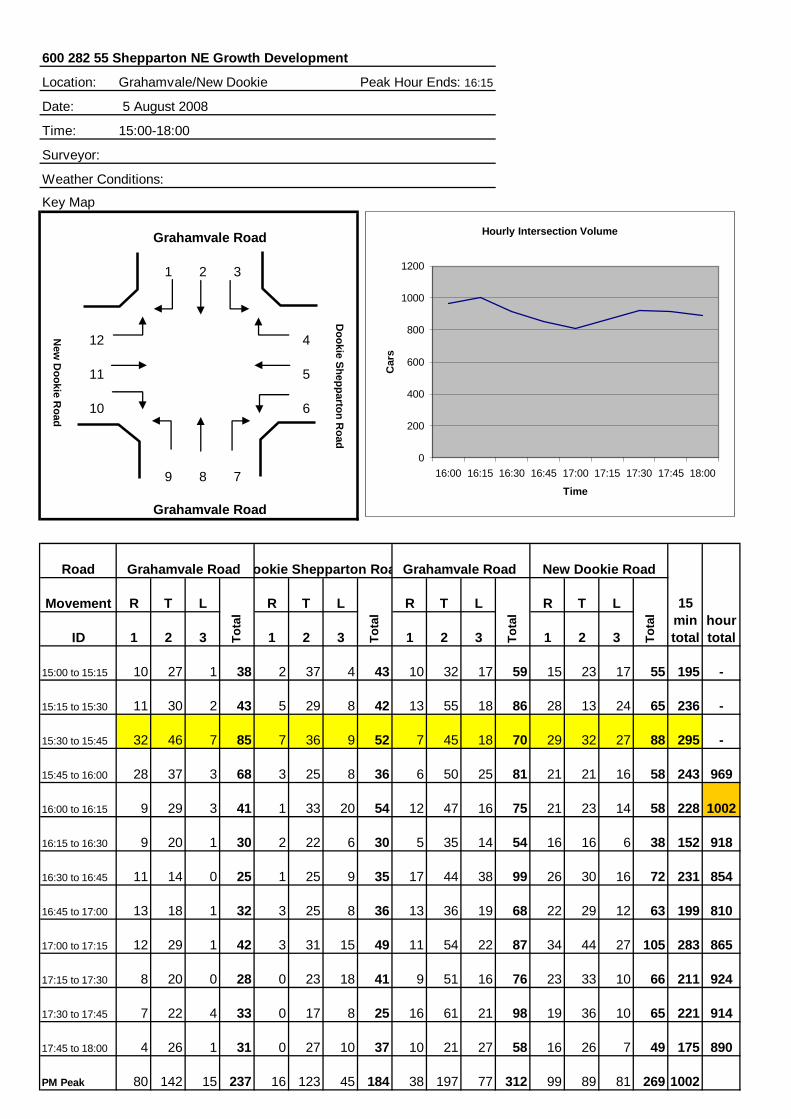
600 282 55 Shepparton NE Growth Development
Location: Grahamvale/New Dookie Peak Hour Ends: 16:15
Date: 5 August 2008
Time: 15:00-18:00
Surveyor:
Weather Conditions:
Key Map
Grahamvale Road
1 2 3
12 4
11 5
10 6
9 8 7
Grahamvale Road
R T L R T L R T L R T L
1 2 3 1 2 3 1 2 3 1 2 3
15:00 to 15:15 10 27 1 38 2 37 4 43 10 32 17 59 15 23 17 55 195 -
15:15 to 15:30 11 30 2 43 5 29 8 42 13 55 18 86 28 13 24 65 236 -
15:30 to 15:45 32 46 7 85 7 36 9 52 7 45 18 70 29 32 27 88 295 -
15:45 to 16:00 28 37 3 68 3 25 8 36 6 50 25 81 21 21 16 58 243 969
16:00 to 16:15 9 29 3 41 1 33 20 54 12 47 16 75 21 23 14 58 228 1002
16:15 to 16:30 9 20 1 30 2 22 6 30 5 35 14 54 16 16 6 38 152 918
16:30 to 16:45 11 14 0 25 1 25 9 35 17 44 38 99 26 30 16 72 231 854
16:45 to 17:00 13 18 1 32 3 25 8 36 13 36 19 68 22 29 12 63 199 810
17:00 to 17:15 12 29 1 42 3 31 15 49 11 54 22 87 34 44 27 105 283 865
17:15 to 17:30 8 20 0 28 0 23 18 41 9 51 16 76 23 33 10 66 211 924
17:30 to 17:45 7 22 4 33 0 17 8 25 16 61 21 98 19 36 10 65 221 914
17:45 to 18:00 4 26 1 31 0 27 10 37 10 21 27 58 16 26 7 49 175 890
PM Peak 80 142 15 237 16 123 45 184 38 197 77 312 99 89 81 269 1002
15mintotal
hourtotalTo
tal
Tota
l
Grahamvale Road New Dookie Road
Dookie Shepparton R
oad
New
Dookie R
oad
Tota
l
ID
Movement
Grahamvale Road Dookie Shepparton RoadRoad
Tota
l
Hourly Intersection Volume
0
200
400
600
800
1000
1200
16:00 16:15 16:30 16:45 17:00 17:15 17:30 17:45 18:00
Time
Car
s
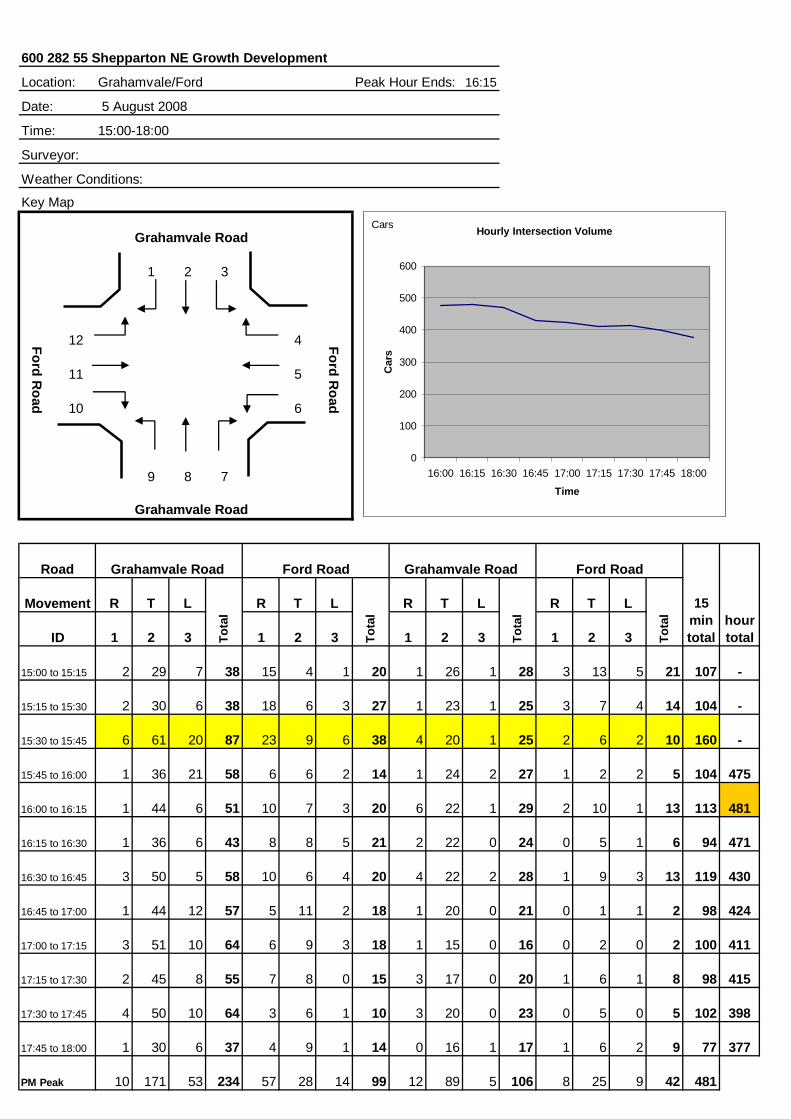
600 282 55 Shepparton NE Growth Development
Location: Grahamvale/Ford Peak Hour Ends: 16:15
Date: 5 August 2008
Time: 15:00-18:00
Surveyor:
Weather Conditions:
Key Map
Grahamvale Road
1 2 3
12 4
11 5
10 6
9 8 7
Grahamvale Road
R T L R T L R T L R T L
1 2 3 1 2 3 1 2 3 1 2 3
15:00 to 15:15 2 29 7 38 15 4 1 20 1 26 1 28 3 13 5 21 107 -
15:15 to 15:30 2 30 6 38 18 6 3 27 1 23 1 25 3 7 4 14 104 -
15:30 to 15:45 6 61 20 87 23 9 6 38 4 20 1 25 2 6 2 10 160 -
15:45 to 16:00 1 36 21 58 6 6 2 14 1 24 2 27 1 2 2 5 104 475
16:00 to 16:15 1 44 6 51 10 7 3 20 6 22 1 29 2 10 1 13 113 481
16:15 to 16:30 1 36 6 43 8 8 5 21 2 22 0 24 0 5 1 6 94 471
16:30 to 16:45 3 50 5 58 10 6 4 20 4 22 2 28 1 9 3 13 119 430
16:45 to 17:00 1 44 12 57 5 11 2 18 1 20 0 21 0 1 1 2 98 424
17:00 to 17:15 3 51 10 64 6 9 3 18 1 15 0 16 0 2 0 2 100 411
17:15 to 17:30 2 45 8 55 7 8 0 15 3 17 0 20 1 6 1 8 98 415
17:30 to 17:45 4 50 10 64 3 6 1 10 3 20 0 23 0 5 0 5 102 398
17:45 to 18:00 1 30 6 37 4 9 1 14 0 16 1 17 1 6 2 9 77 377
PM Peak 10 171 53 234 57 28 14 99 12 89 5 106 8 25 9 42 481
Grahamvale RoadRoad
15mintotal
hourtotalTo
tal
Tota
l
Tota
l
Tota
l
Ford Road
Ford Road
Ford Road
ID
Movement
Grahamvale Road Ford Road
Hourly Intersection Volume
0
100
200
300
400
500
600
16:00 16:15 16:30 16:45 17:00 17:15 17:30 17:45 18:00
Time
Car
s
Cars

Appendix B SIDRA Analysis
D R A F T
Shepparton North East Growth Corridor Development Traffic Impact Assessment P:\60028255 V07PU Shepparton\6_Draft_docs\6.1_Reports\Traffic and Transportation\1007tpe Traffic Assessment 20Nov08.doc Revision 21 November 2008 Page B
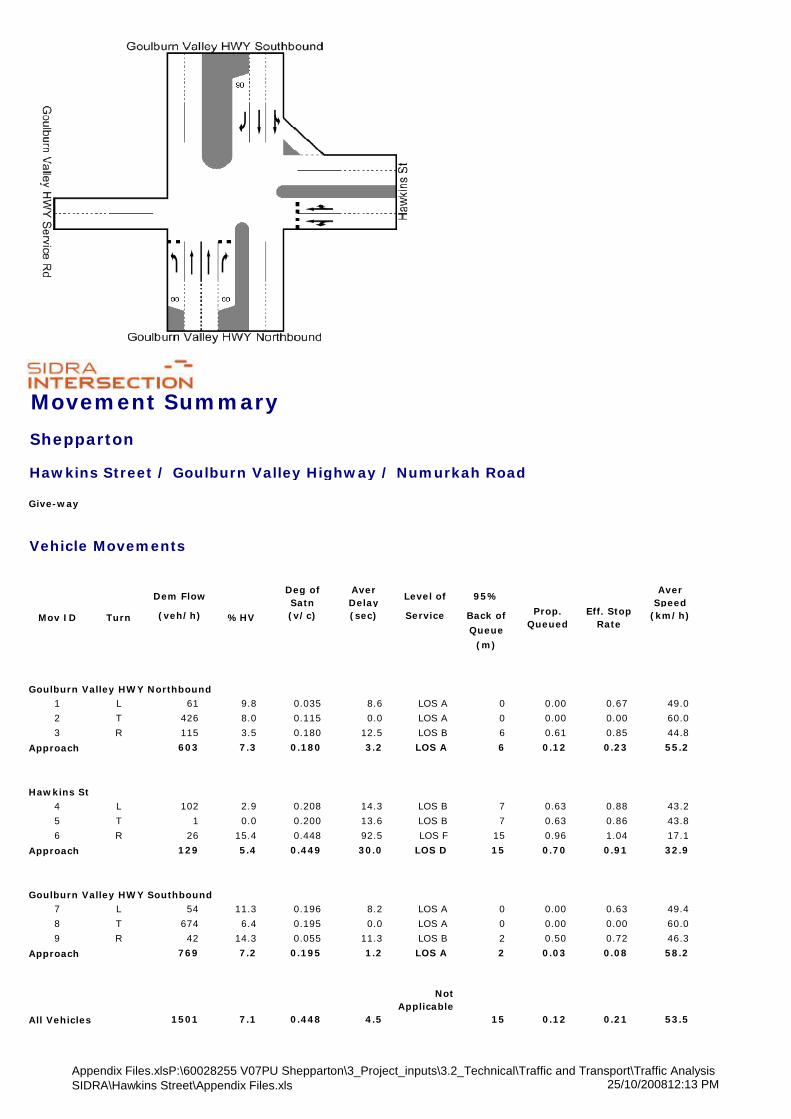
Movement Summary
Shepparton
Hawkins Street / Goulburn Valley Highway / Numurkah Road
Dem FlowDeg ofSatn
AverDelay
Level of 95%Aver
Speed(veh/h) (v/c) (sec) Service Back of (km/h)
Queue
(m)
1 L 61 9.8 0.035 8.6 LOS A 0 0.00 0.67 49.0
2 T 426 8.0 0.115 0.0 LOS A 0 0.00 0.00 60.0
3 R 115 3.5 0.180 12.5 LOS B 6 0.61 0.85 44.8
603 7.3 0.180 3.2 LOS A 6 0.12 0.23 55.2
4 L 102 2.9 0.208 14.3 LOS B 7 0.63 0.88 43.2
5 T 1 0.0 0.200 13.6 LOS B 7 0.63 0.86 43.8
6 R 26 15.4 0.448 92.5 LOS F 15 0.96 1.04 17.1
129 5.4 0.449 30.0 LOS D 15 0.70 0.91 32.9
7 L 54 11.3 0.196 8.2 LOS A 0 0.00 0.63 49.4
8 T 674 6.4 0.195 0.0 LOS A 0 0.00 0.00 60.0
9 R 42 14.3 0.055 11.3 LOS B 2 0.50 0.72 46.3
769 7.2 0.195 1.2 LOS A 2 0.03 0.08 58.2
1501 7.1 0.448 4.5
NotApplicable
15 0.12 0.21 53.5
Approach
All Vehicles
Hawkins St
Approach
Goulburn Valley HWY Southbound
Goulburn Valley HWY Northbound
Approach
Mov ID Turn %HVProp.
QueuedEff. Stop
Rate
Give-way
Vehicle Movements
Appendix Files.xlsP:\60028255 V07PU Shepparton\3_Project_inputs\3.2_Technical\Traffic and Transport\Traffic AnalysisSIDRA\Hawkins Street\Appendix Files.xls 25/10/200812:13 PM

Movement Summary
Shepparton
Hawkins Street / Goulburn Valley Highway / Numurkah Road
Dem FlowDeg ofSatn
AverDelay
Level of 95%Aver
Speed(veh/h) (v/c) (sec) Service Back of (km/h)
Queue
(m)
1 L 77 2.6 0.042 8.3 LOS A 0 0.00 0.67 49.0
2 T 392 3.6 0.103 0.0 LOS A 0 0.00 0.00 60.0
3 R 259 1.2 0.372 13.2 LOS B 17 0.64 0.93 44.2
728 2.6 0.372 5.6 LOS A 17 0.23 0.40 52.1
4 L 128 0.8 0.229 13.2 LOS B 8 0.59 0.87 44.0
5 T 1 0.0 0.250 12.6 LOS B 8 0.59 0.85 44.7
6 R 18 11.1 0.295 77.1 LOS F 9 0.95 1.01 19.4
147 2.0 0.296 21.0 LOS C 9 0.63 0.89 38.0
7 L 116 2.6 0.179 7.9 LOS A 0 0.00 0.63 49.4
8 T 559 3.8 0.179 0.0 LOS A 0 0.00 0.00 60.0
9 R 84 1.2 0.092 10.2 LOS B 3 0.48 0.72 46.9
759 3.3 0.179 2.3 LOS A 3 0.05 0.18 56.4
1634 2.9 0.372 5.5
NotApplicable
17 0.18 0.34 52.2
Approach
All Vehicles
Hawkins St
Approach
Goulburn Valley HWY Southbound
Goulburn Valley HWY Northbound
Approach
Mov ID Turn %HVProp.
QueuedEff. Stop
Rate
Give-way
Vehicle Movements
P:\60028255 V07PU Shepparton\3_Project_inputs\3.2_Technical\Traffic and Transport\Traffic Analysis SIDRA\HawkinsStreet\ Appendix Files.xls 25/10/2008 11:50 AM
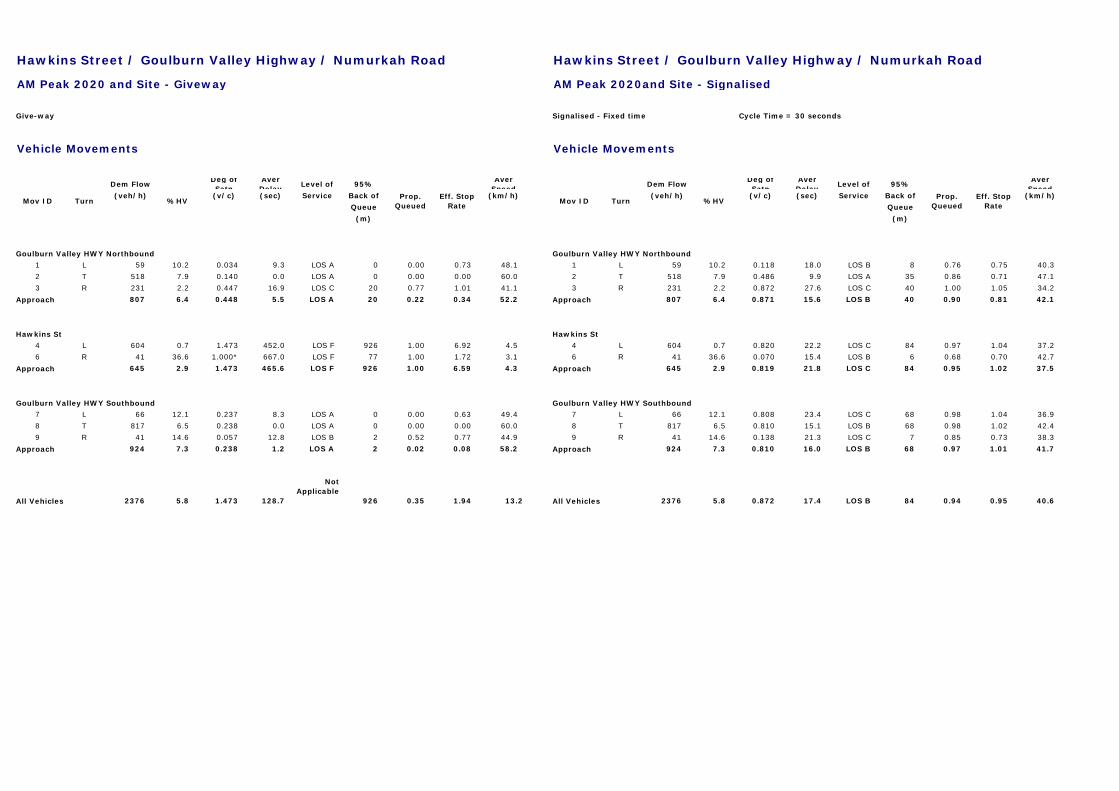
Hawkins Street / Goulburn Valley Highway / Numurkah Road Hawkins Street / Goulburn Valley Highway / Numurkah Road
AM Peak 2020 and Site - Giveway AM Peak 2020and Site - Signalised
Dem FlowDeg ofSatn
AverDelay
Level of 95%Aver
SpeedDem Flow
Deg ofSatn
AverDelay
Level of 95%Aver
Speed(veh/h) (v/c) (sec) Service Back of (km/h) (veh/h) (v/c) (sec) Service Back of (km/h)
Queue Queue
(m) (m)
1 L 59 10.2 0.034 9.3 LOS A 0 0.00 0.73 48.1 1 L 59 10.2 0.118 18.0 LOS B 8 0.76 0.75 40.3
2 T 518 7.9 0.140 0.0 LOS A 0 0.00 0.00 60.0 2 T 518 7.9 0.486 9.9 LOS A 35 0.86 0.71 47.1
3 R 231 2.2 0.447 16.9 LOS C 20 0.77 1.01 41.1 3 R 231 2.2 0.872 27.6 LOS C 40 1.00 1.05 34.2
807 6.4 0.448 5.5 LOS A 20 0.22 0.34 52.2 807 6.4 0.871 15.6 LOS B 40 0.90 0.81 42.1
4 L 604 0.7 1.473 452.0 LOS F 926 1.00 6.92 4.5 4 L 604 0.7 0.820 22.2 LOS C 84 0.97 1.04 37.2
6 R 41 36.6 1.000* 667.0 LOS F 77 1.00 1.72 3.1 6 R 41 36.6 0.070 15.4 LOS B 6 0.68 0.70 42.7
645 2.9 1.473 465.6 LOS F 926 1.00 6.59 4.3 645 2.9 0.819 21.8 LOS C 84 0.95 1.02 37.5
7 L 66 12.1 0.237 8.3 LOS A 0 0.00 0.63 49.4 7 L 66 12.1 0.808 23.4 LOS C 68 0.98 1.04 36.9
8 T 817 6.5 0.238 0.0 LOS A 0 0.00 0.00 60.0 8 T 817 6.5 0.810 15.1 LOS B 68 0.98 1.02 42.4
9 R 41 14.6 0.057 12.8 LOS B 2 0.52 0.77 44.9 9 R 41 14.6 0.138 21.3 LOS C 7 0.85 0.73 38.3
924 7.3 0.238 1.2 LOS A 2 0.02 0.08 58.2 924 7.3 0.810 16.0 LOS B 68 0.97 1.01 41.7
2376 5.8 1.473 128.7
NotApplicable
926 0.35 1.94 13.2 2376 5.8 0.872 17.4 LOS B 84 0.94 0.95 40.6All Vehicles
Goulburn Valley HWY Southbound
Approach
All Vehicles
Cycle Time = 30 seconds
Hawkins St
Approach
Goulburn Valley HWY Southbound
Approach
Signalised - Fixed time
Approach
Hawkins St
Approach
Vehicle Movements
Eff. StopRate
Goulburn Valley HWY Northbound
Turn %HVProp.
QueuedEff. Stop
Rate
Goulburn Valley HWY Northbound
Mov ID
Approach
Give-way
Vehicle Movements
Mov ID Turn %HVProp.
Queued
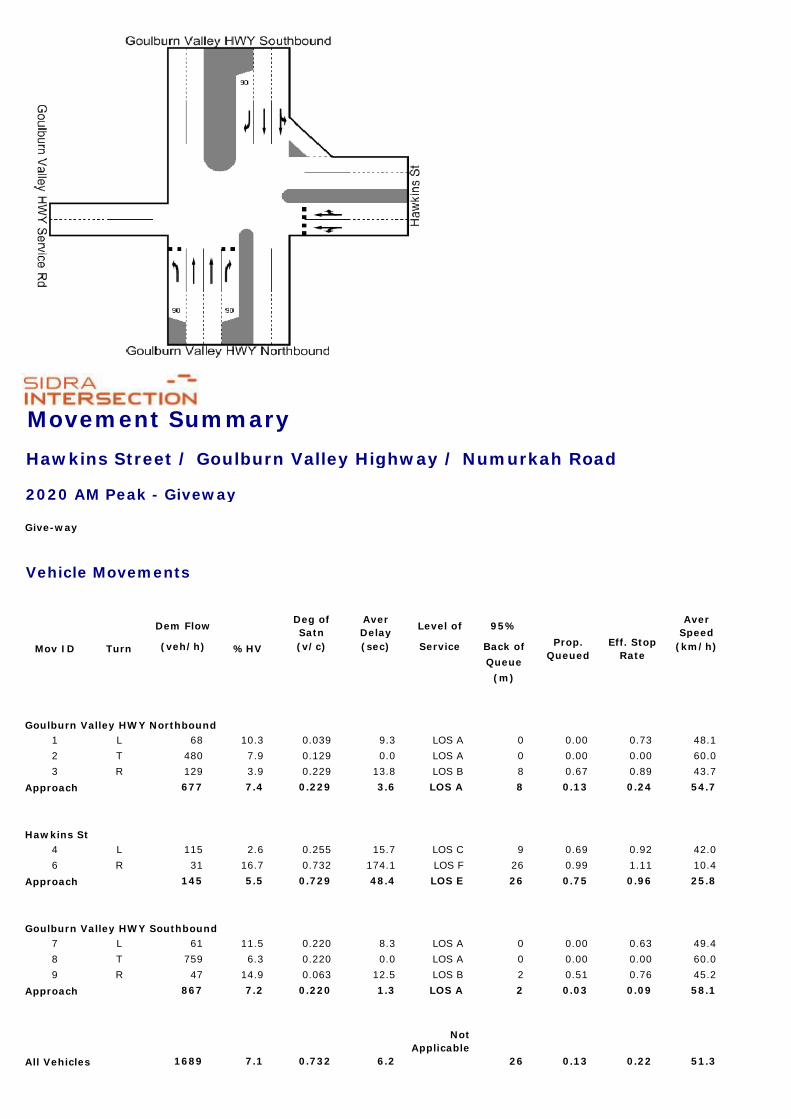
Movement Summary
Hawkins Street / Goulburn Valley Highway / Numurkah Road
2020 AM Peak - Giveway
Dem FlowDeg ofSatn
AverDelay
Level of 95%Aver
Speed(veh/h) (v/c) (sec) Service Back of (km/h)
Queue
(m)
1 L 68 10.3 0.039 9.3 LOS A 0 0.00 0.73 48.1
2 T 480 7.9 0.129 0.0 LOS A 0 0.00 0.00 60.0
3 R 129 3.9 0.229 13.8 LOS B 8 0.67 0.89 43.7
677 7.4 0.229 3.6 LOS A 8 0.13 0.24 54.7
4 L 115 2.6 0.255 15.7 LOS C 9 0.69 0.92 42.0
6 R 31 16.7 0.732 174.1 LOS F 26 0.99 1.11 10.4
145 5.5 0.729 48.4 LOS E 26 0.75 0.96 25.8
7 L 61 11.5 0.220 8.3 LOS A 0 0.00 0.63 49.4
8 T 759 6.3 0.220 0.0 LOS A 0 0.00 0.00 60.0
9 R 47 14.9 0.063 12.5 LOS B 2 0.51 0.76 45.2
867 7.2 0.220 1.3 LOS A 2 0.03 0.09 58.1
1689 7.1 0.732 6.2
NotApplicable
26 0.13 0.22 51.3
Approach
Goulburn Valley HWY Southbound
Goulburn Valley HWY Northbound
Approach
Hawkins St
%HVProp.
QueuedEff. Stop
Rate
Approach
All Vehicles
Give-way
Vehicle Movements
Mov ID Turn
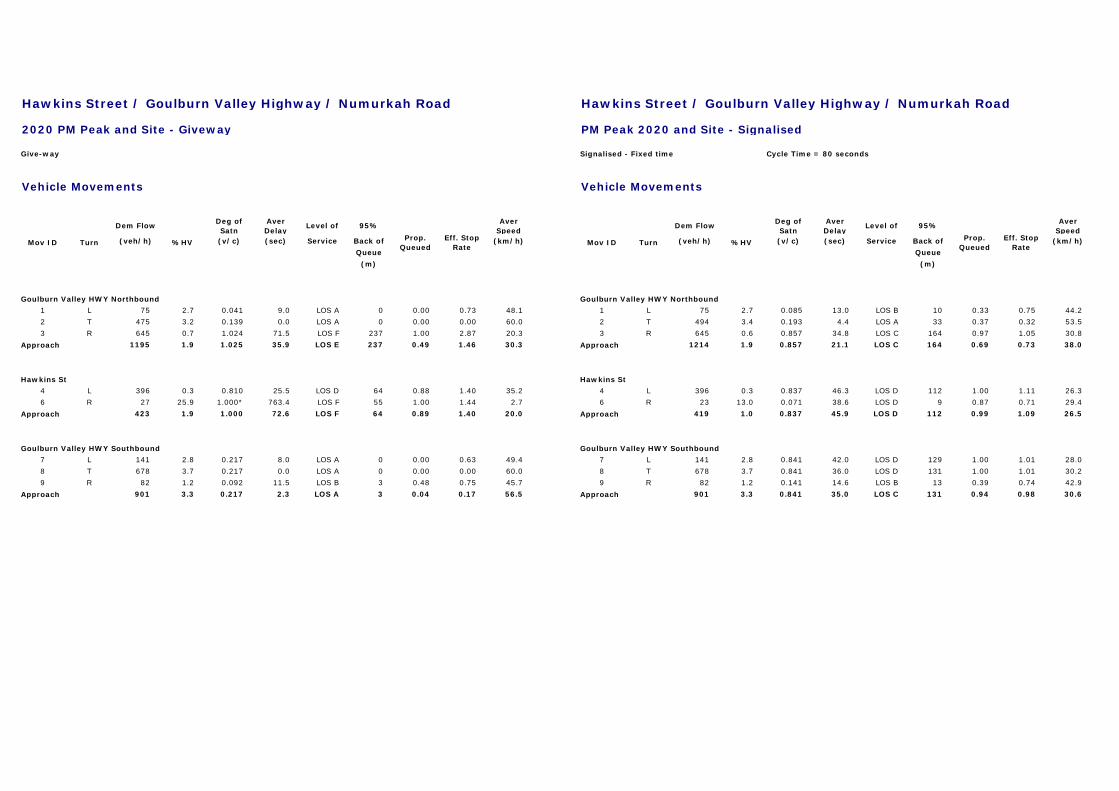
Hawkins Street / Goulburn Valley Highway / Numurkah Road Hawkins Street / Goulburn Valley Highway / Numurkah Road
2020 PM Peak and Site - Giveway PM Peak 2020 and Site - Signalised
Dem FlowDeg ofSatn
AverDelay
Level of 95%Aver
SpeedDem Flow
Deg ofSatn
AverDelay
Level of 95%Aver
Speed(veh/h) (v/c) (sec) Service Back of (km/h) (veh/h) (v/c) (sec) Service Back of (km/h)
Queue Queue
(m) (m)
1 L 75 2.7 0.041 9.0 LOS A 0 0.00 0.73 48.1 1 L 75 2.7 0.085 13.0 LOS B 10 0.33 0.75 44.2
2 T 475 3.2 0.139 0.0 LOS A 0 0.00 0.00 60.0 2 T 494 3.4 0.193 4.4 LOS A 33 0.37 0.32 53.5
3 R 645 0.7 1.024 71.5 LOS F 237 1.00 2.87 20.3 3 R 645 0.6 0.857 34.8 LOS C 164 0.97 1.05 30.8
1195 1.9 1.025 35.9 LOS E 237 0.49 1.46 30.3 1214 1.9 0.857 21.1 LOS C 164 0.69 0.73 38.0
4 L 396 0.3 0.810 25.5 LOS D 64 0.88 1.40 35.2 4 L 396 0.3 0.837 46.3 LOS D 112 1.00 1.11 26.3
6 R 27 25.9 1.000* 763.4 LOS F 55 1.00 1.44 2.7 6 R 23 13.0 0.071 38.6 LOS D 9 0.87 0.71 29.4
423 1.9 1.000 72.6 LOS F 64 0.89 1.40 20.0 419 1.0 0.837 45.9 LOS D 112 0.99 1.09 26.5
7 L 141 2.8 0.217 8.0 LOS A 0 0.00 0.63 49.4 7 L 141 2.8 0.841 42.0 LOS D 129 1.00 1.01 28.0
8 T 678 3.7 0.217 0.0 LOS A 0 0.00 0.00 60.0 8 T 678 3.7 0.841 36.0 LOS D 131 1.00 1.01 30.2
9 R 82 1.2 0.092 11.5 LOS B 3 0.48 0.75 45.7 9 R 82 1.2 0.141 14.6 LOS B 13 0.39 0.74 42.9
901 3.3 0.217 2.3 LOS A 3 0.04 0.17 56.5 901 3.3 0.841 35.0 LOS C 131 0.94 0.98 30.6
Give-way
Vehicle Movements
Mov ID Turn %HVProp.
QueuedEff. Stop
Rate
Goulburn Valley HWY Northbound
Approach
Hawkins St
Approach
Goulburn Valley HWY Southbound
Approach
Signalised - Fixed time
Mov ID Turn %HV
Approach
Hawkins St
Cycle Time = 80 seconds
Vehicle Movements
Prop.Queued
Eff. StopRate
Goulburn Valley HWY Northbound
Approach
Goulburn Valley HWY Southbound
Approach
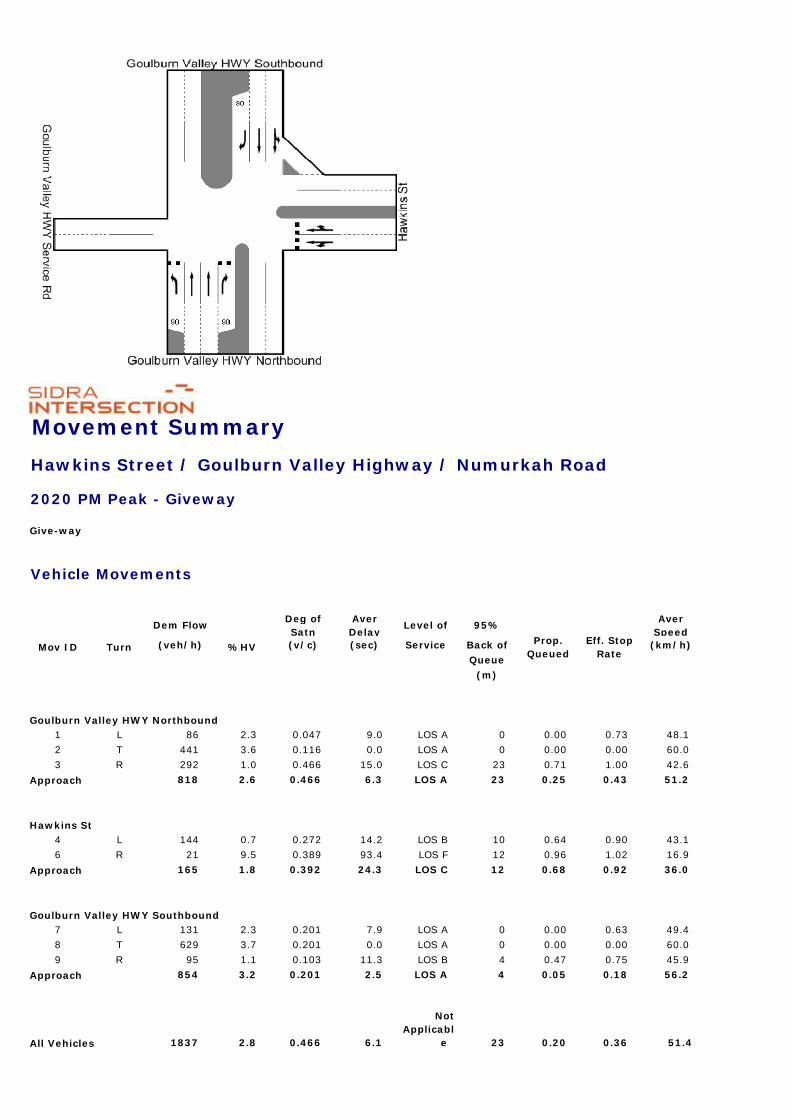
Movement Summary
Hawkins Street / Goulburn Valley Highway / Numurkah Road
2020 PM Peak - Giveway
Dem FlowDeg ofSatn
AverDelay
Level of 95%Aver
Speed(veh/h) (v/c) (sec) Service Back of (km/h)
Queue
(m)
1 L 86 2.3 0.047 9.0 LOS A 0 0.00 0.73 48.1
2 T 441 3.6 0.116 0.0 LOS A 0 0.00 0.00 60.0
3 R 292 1.0 0.466 15.0 LOS C 23 0.71 1.00 42.6
818 2.6 0.466 6.3 LOS A 23 0.25 0.43 51.2
4 L 144 0.7 0.272 14.2 LOS B 10 0.64 0.90 43.1
6 R 21 9.5 0.389 93.4 LOS F 12 0.96 1.02 16.9
165 1.8 0.392 24.3 LOS C 12 0.68 0.92 36.0
7 L 131 2.3 0.201 7.9 LOS A 0 0.00 0.63 49.4
8 T 629 3.7 0.201 0.0 LOS A 0 0.00 0.00 60.0
9 R 95 1.1 0.103 11.3 LOS B 4 0.47 0.75 45.9
854 3.2 0.201 2.5 LOS A 4 0.05 0.18 56.2
1837 2.8 0.466 6.1
NotApplicabl
e 23 0.20 0.36 51.4
Approach
Goulburn Valley HWY Southbound
Goulburn Valley HWY Northbound
Approach
Hawkins St
%HVProp.
QueuedEff. Stop
Rate
Approach
All Vehicles
Give-way
Vehicle Movements
Mov ID Turn

600 282 55 Shepparton NE Growth Development Graham/Ford 2020 with Devt AM
Location: Grahamvale/Ford Existing Peak Hour: 8:00 - 9:00am 8:00 - 9:00
Grahamvale Road
48 105 31 Growth Rate 1.02
Vehicle
per annumMov ID
DemFlow
%HVDeg ofSatn
AverDelay
Level of 95%Prop.Queued
Eff.StopRate
AverSpeed
7 48 No Years 12(veh/h) (v/c) (sec) Service Back of (km/h)
38 20
16 7 9 L 2 33.3 0.214 7.3 LOS A 12 0.31 0.42 42.2
8 T 245 6.9 0.208 0.7 LOS A 12 0.31 0.00 47.2
2 233 8 7 R 93 6.5 0.208 7.5 LOS A 12 0.31 0.61 42.1
Grahamvale Road 340 7.1 0.208 2.6 LOS A 12 0.31 0.17 45.7
6 L 7 12.5 0.200 14.1 LOS B 7 0.57 0.60 37.5
R T L R T L R T L R T L 5 T 21 4.8 0.200 12.8 LOS B 7 0.57 0.79 38.3
1 2 3 4 5 6 7 8 9 10 11 12 4 R 51 7.8 0.200 14.3 LOS B 7 0.57 0.80 37.3
8:00 - 9:00am 40 75 26 141 40 17 6 63 7 129 2 138 13 32 6 51 80 7.5 0.200 13.8 LOS B 7 0.57 0.78 37.6
2020 Growth 48 90 31 169 48 20 7 75 8 154 2 165 16 38 7 61
2020 + Devt 48 105 31 169 48 20 7 75 8 233 2 165 16 38 7 61 94 3 L 33 6.3 0.125 8.7 LOS A 7 0.42 0.37 42.3
2 T 111 7.2 0.125 1.3 LOS A 7 0.42 0.00 46.3
Out 1 R 51 7.8 0.125 8.1 LOS A 7 0.42 0.65 41.7
In 194 7.2 0.125 4.3 LOS A 7 0.42 0.23 44.3
12 L 22 8.7 0.160 12.7 LOS B 6 0.55 0.70 39.6
11 T 40 7.5 0.159 10.6 LOS B 6 0.55 0.78 39.9
10 R 17 5.9 0.159 12.1 LOS B 6 0.55 0.78 38.8
80 7.5 0.159 11.5 LOS B 6 0.55 0.75 39.6
694 7.2 0.214 5.4
NotApplica
ble 12 0.40 0.32 43.4All Vehicles
Ford Road (West)
Approach
Approach
Grahamvale Road (North)
Approach
ID Tota
lMovement
Grahamvale Road
Tota
l
Tota
l
Tota
l
Grahamvale Road Ford Road
Give-way
Ford RoadRoad
Ford Road
Approach
Ford Road (East)
Grahamvale Road (South)
Ford Road
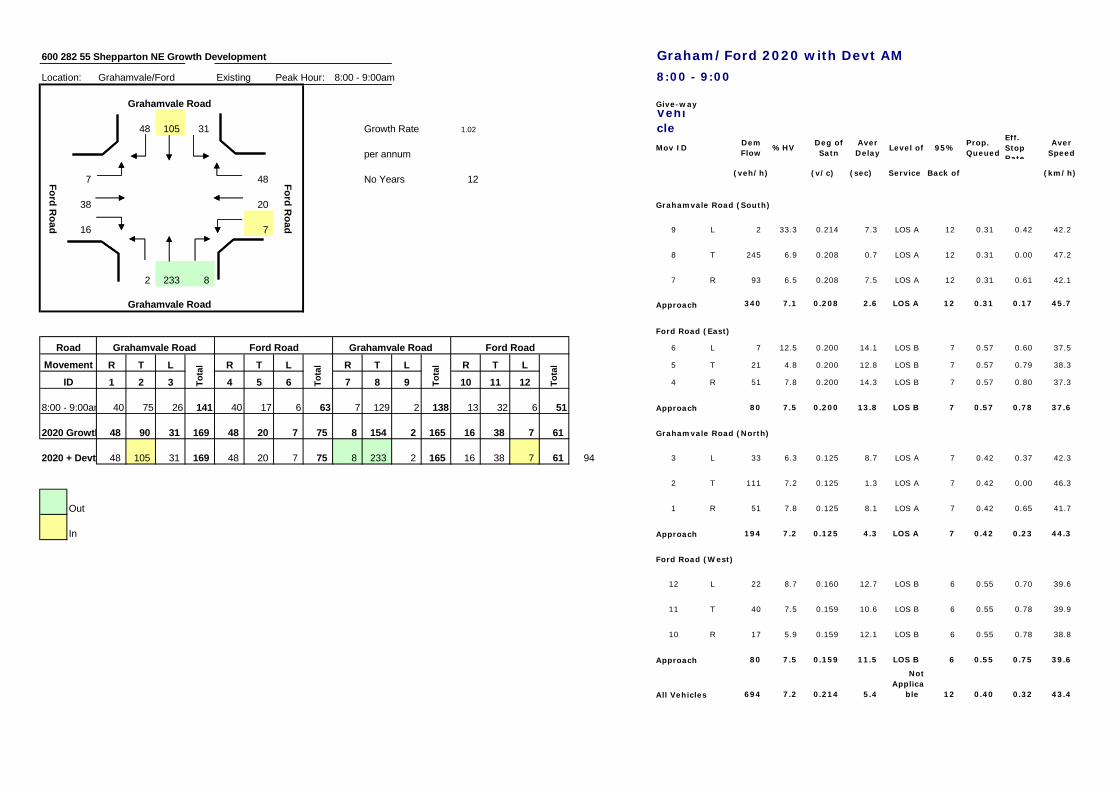
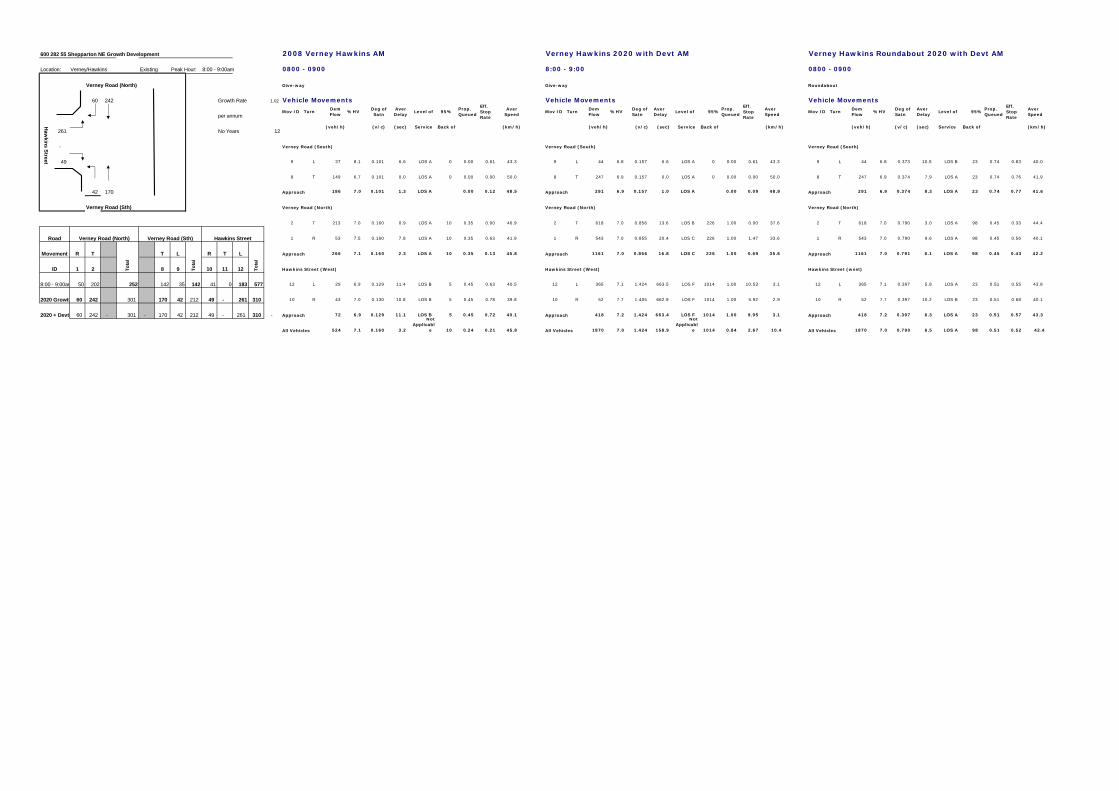
600 282 55 Shepparton NE Growth Development 2008 Verney Hawkins AM Verney Hawkins 2020 with Devt AM Verney Hawkins Roundabout 2020 with Devt AM
Location: Verney/Hawkins Existing Peak Hour: 8:00 - 9:00am 0800 - 0900 8:00 - 9:00 0800 - 0900
Verney Road (North)
60 242 Growth Rate 1.02
per annumMov ID Turn
DemFlow
%HVDeg ofSatn
AverDelay
Level of 95%Prop.Queued
Eff.StopRate
AverSpeed
Mov ID TurnDemFlow
%HVDeg ofSatn
AverDelay
Level of 95%Prop.Queued
Eff.StopRate
AverSpeed
Mov ID TurnDemFlow
%HVDeg ofSatn
AverDelay
Level of 95%Prop.Queued
Eff.StopRate
AverSpeed
261 No Years 12(veh/h) (v/c) (sec) Service Back of (km/h) (veh/h) (v/c) (sec) Service Back of (km/h) (veh/h) (v/c) (sec) Service Back of (km/h)
-
49 9 L 37 8.1 0.101 6.6 LOS A 0 0.00 0.61 43.3 9 L 44 6.8 0.157 6.6 LOS A 0 0.00 0.61 43.3 9 L 44 6.8 0.373 10.5 LOS B 23 0.74 0.83 40.0
8 T 149 6.7 0.101 0.0 LOS A 0 0.00 0.00 50.0 8 T 247 6.9 0.157 0.0 LOS A 0 0.00 0.00 50.0 8 T 247 6.9 0.374 7.9 LOS A 23 0.74 0.76 41.9
42 170 186 7.0 0.101 1.3 LOS A 0.00 0.12 48.5 291 6.9 0.157 1.0 LOS A 0.00 0.09 48.9 291 6.9 0.374 8.3 LOS A 23 0.74 0.77 41.6
Verney Road (Sth)
2 T 213 7.0 0.160 0.9 LOS A 10 0.35 0.00 46.9 2 T 618 7.0 0.856 13.6 LOS B 226 1.00 0.00 37.6 2 T 618 7.0 0.790 3.0 LOS A 98 0.45 0.33 44.4
1 R 53 7.5 0.160 7.8 LOS A 10 0.35 0.63 41.9 1 R 543 7.0 0.855 20.4 LOS C 226 1.00 1.47 33.6 1 R 543 7.0 0.790 9.6 LOS A 98 0.45 0.56 40.1
R T T L R T L 266 7.1 0.160 2.3 LOS A 10 0.35 0.13 45.8 1161 7.0 0.856 16.8 LOS C 226 1.00 0.69 35.6 1161 7.0 0.791 6.1 LOS A 98 0.45 0.43 42.2
1 2 8 9 10 11 12
8:00 - 9:00am 50 202 252 142 35 142 41 0 183 577 12 L 29 6.9 0.129 11.4 LOS B 5 0.45 0.63 40.5 12 L 365 7.1 1.424 663.5 LOS F 1014 1.00 10.53 3.1 12 L 365 7.1 0.397 5.8 LOS A 23 0.51 0.55 43.8
2020 Growth 60 242 301 170 42 212 49 - 261 310 10 R 43 7.0 0.130 10.8 LOS B 5 0.45 0.78 39.8 10 R 52 7.7 1.405 662.9 LOS F 1014 1.00 5.92 2.9 10 R 52 7.7 0.397 10.2 LOS B 23 0.51 0.68 40.1
2020 + Devt 60 242 - 301 - 170 42 212 49 - 261 310 - 72 6.9 0.129 11.1 LOS B 5 0.45 0.72 40.1 418 7.2 1.424 663.4 LOS F 1014 1.00 9.95 3.1 418 7.2 0.397 6.3 LOS A 23 0.51 0.57 43.3
524 7.1 0.160 3.2
NotApplicabl
e 10 0.24 0.21 45.8 1870 7.0 1.424 158.9
NotApplicabl
e 1014 0.84 2.67 10.4 1870 7.0 0.790 6.5 LOS A 98 0.51 0.52 42.4All Vehicles
Vehicle Movements Vehicle Movements Vehicle Movements
Hawkins Street (west)
Approach
Approach
Verney Road (North)
Approach
All Vehicles
Roundabout
Hawkins Street (West)
Approach
Approach
Verney Road (North)
Approach
Verney Road (South)
Tota
l
Tota
l
Verney Road (Sth) Hawkins Street
Haw
kins Street
ID Tota
l
Movement
Verney Road (North)Road
Give-way Give-way
All Vehicles
Verney Road (North)
Approach
Hawkins Street (West)
Verney Road (South)
Approach
Verney Road (South)
Approach
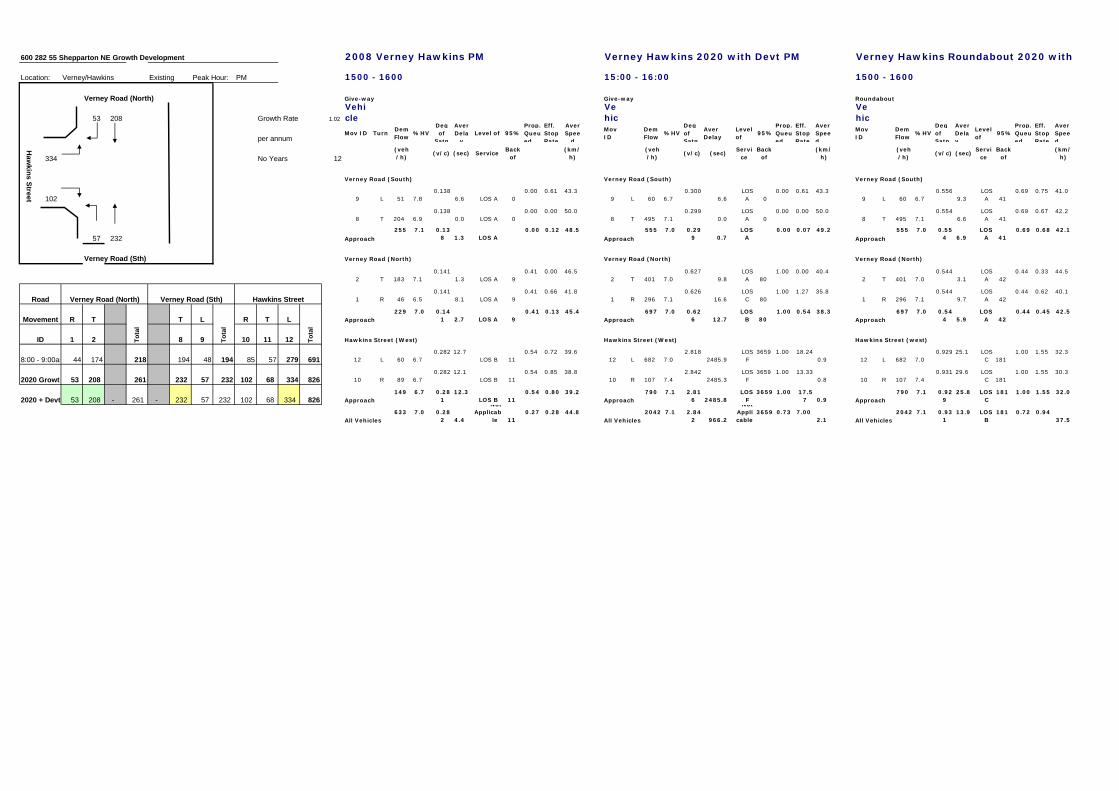
600 282 55 Shepparton NE Growth Development 2008 Verney Hawkins PM Verney Hawkins 2020 with Devt PM Verney Hawkins Roundabout 2020 with Devt PM
Location: Verney/Hawkins Existing Peak Hour: PM 1500 - 1600 15:00 - 16:00 1500 - 1600
Verney Road (North)
53 208 Growth Rate 1.02
Vehicle
Vehic
Vehic
per annumMov ID Turn
DemFlow
%HVDegof
Satn
AverDela
yLevel of 95%
Prop.Queued
Eff.StopRate
AverSpee
d
MovID
DemFlow
%HVDegofSatn
AverDelay
Levelof
95%Prop.Queued
Eff.StopRate
AverSpeed
MovID
DemFlow
%HVDegofSatn
AverDelay
Levelof
95%Prop.Queued
Eff.StopRate
AverSpeed
334 No Years 12(veh/h)
(v/c) (sec) ServiceBack
of(km/
h)(veh/h)
(v/c) (sec)Servi
ceBack
of(km/
h)(veh/h)
(v/c) (sec)Servi
ceBack
of(km/
h)
102 9 L 51 7.80.138
6.6 LOS A 00.00 0.61 43.3
9 L 60 6.70.300
6.6LOSA 0
0.00 0.61 43.39 L 60 6.7
0.556 9.3
LOSA 41
0.69 0.75 41.0
8 T 204 6.90.138
0.0 LOS A 00.00 0.00 50.0
8 T 495 7.10.299
0.0LOSA 0
0.00 0.00 50.08 T 495 7.1
0.554 6.6
LOSA 41
0.69 0.67 42.2
57 232255 7.1 0.13
8 1.3 LOS A0.00 0.12 48.5 555 7.0 0.29
9 0.7LOS
A0.00 0.07 49.2 555 7.0 0.55
4 6.9LOS
A 410.69 0.68 42.1
Verney Road (Sth)
2 T 183 7.10.141
1.3 LOS A 90.41 0.00 46.5
2 T 401 7.00.627
9.8LOSA 80
1.00 0.00 40.42 T 401 7.0
0.544 3.1
LOSA 42
0.44 0.33 44.5
1 R 46 6.50.141
8.1 LOS A 90.41 0.66 41.8
1 R 296 7.10.626
16.6LOSC 80
1.00 1.27 35.81 R 296 7.1
0.544 9.7
LOSA 42
0.44 0.62 40.1
R T T L R T L229 7.0 0.14
1 2.7 LOS A 90.41 0.13 45.4 697 7.0 0.62
6 12.7LOS
B 801.00 0.54 38.3 697 7.0 0.54
4 5.9LOS
A 420.44 0.45 42.5
1 2 8 9 10 11 12
8:00 - 9:00am 44 174 218 194 48 194 85 57 279 691 12 L 60 6.70.282 12.7
LOS B 110.54 0.72 39.6
12 L 682 7.02.818
2485.9LOS
F3659 1.00 18.24
0.9 12 L 682 7.00.929 25.1 LOS
C 1811.00 1.55 32.3
2020 Growth 53 208 261 232 57 232 102 68 334 826 10 R 89 6.70.282 12.1
LOS B 110.54 0.85 38.8
10 R 107 7.42.842
2485.3LOS
F3659 1.00 13.33
0.8 10 R 107 7.40.931 29.6 LOS
C 1811.00 1.55 30.3
2020 + Devt 53 208 - 261 - 232 57 232 102 68 334 826149 6.7 0.28
112.3
LOS B 110.54 0.80 39.2 790 7.1 2.81
6 2485.8LOS
F3659 1.00 17.5
7 0.9790 7.1 0.92
925.8 LOS
C181 1.00 1.55 32.0
633 7.0 0.282 4.4
NotApplicab
le 110.27 0.28 44.8 2042 7.1 2.84
2 966.2
NotApplicable
3659 0.73 7.00 2.1
2042 7.1 0.931
13.9 LOSB
181 0.72 0.94 37.5All Vehicles
Hawkins Street (west)
Approach
Approach
Verney Road (North)
Approach
All Vehicles
Roundabout
Approach
Hawkins Street (West)
Approach
Verney Road (South)
Approach
Verney Road (North)
Verney Road (South)
Haw
kins Street
ID Tota
l
Movement
Verney Road (North)RoadTo
tal
Tota
l
Verney Road (Sth) Hawkins Street
Give-way Give-way
Verney Road (South)
Approach
Approach
All Vehicles
Verney Road (North)
Approach
Hawkins Street (West)
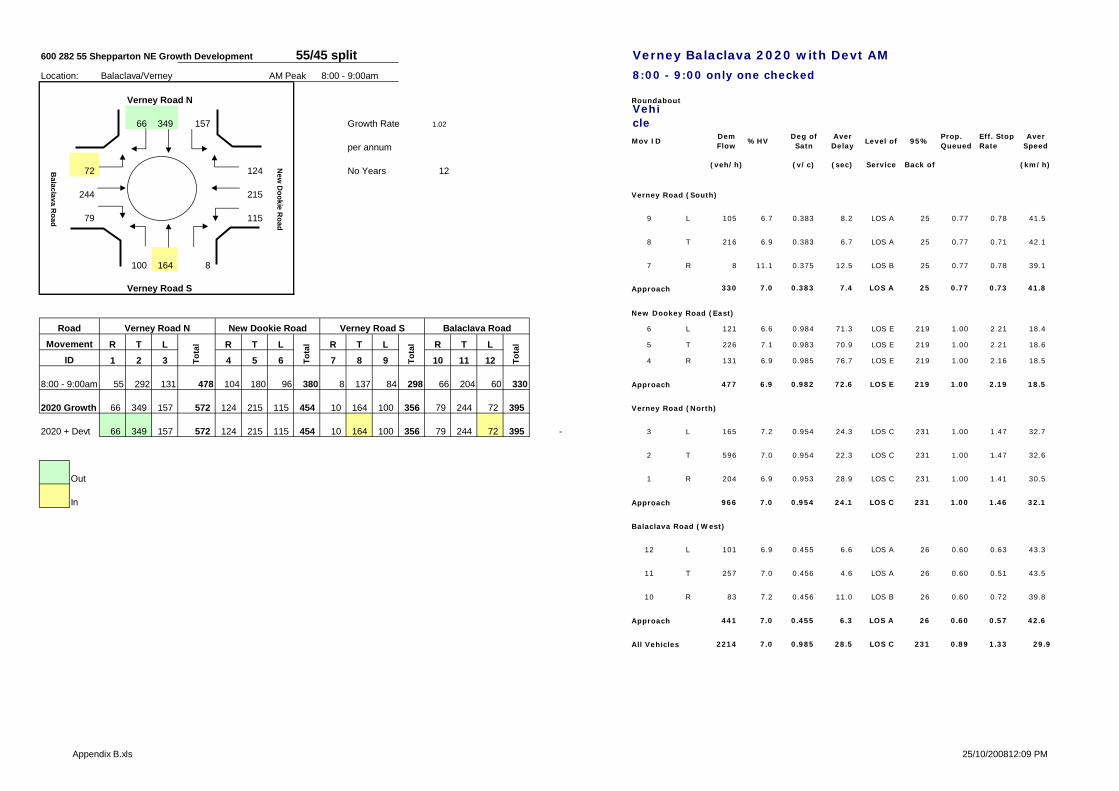
600 282 55 Shepparton NE Growth Development 55/45 split Verney Balaclava 2020 with Devt AM
Location: Balaclava/Verney AM Peak 8:00 - 9:00am 8:00 - 9:00 only one checked
Verney Road N
66 349 157 Growth Rate 1.02
Vehicle
per annumMov ID
DemFlow
%HVDeg ofSatn
AverDelay
Level of 95%Prop.Queued
Eff. StopRate
AverSpeed
72 124 No Years 12(veh/h) (v/c) (sec) Service Back of (km/h)
244 215
79 115 9 L 105 6.7 0.383 8.2 LOS A 25 0.77 0.78 41.5
8 T 216 6.9 0.383 6.7 LOS A 25 0.77 0.71 42.1
100 164 8 7 R 8 11.1 0.375 12.5 LOS B 25 0.77 0.78 39.1
Verney Road S 330 7.0 0.383 7.4 LOS A 25 0.77 0.73 41.8
6 L 121 6.6 0.984 71.3 LOS E 219 1.00 2.21 18.4
R T L R T L R T L R T L 5 T 226 7.1 0.983 70.9 LOS E 219 1.00 2.21 18.6
1 2 3 4 5 6 7 8 9 10 11 12 4 R 131 6.9 0.985 76.7 LOS E 219 1.00 2.16 18.5
8:00 - 9:00am 55 292 131 478 104 180 96 380 8 137 84 298 66 204 60 330 477 6.9 0.982 72.6 LOS E 219 1.00 2.19 18.5
2020 Growth 66 349 157 572 124 215 115 454 10 164 100 356 79 244 72 395
2020 + Devt 66 349 157 572 124 215 115 454 10 164 100 356 79 244 72 395 - 3 L 165 7.2 0.954 24.3 LOS C 231 1.00 1.47 32.7
2 T 596 7.0 0.954 22.3 LOS C 231 1.00 1.47 32.6
Out 1 R 204 6.9 0.953 28.9 LOS C 231 1.00 1.41 30.5
In 966 7.0 0.954 24.1 LOS C 231 1.00 1.46 32.1
12 L 101 6.9 0.455 6.6 LOS A 26 0.60 0.63 43.3
11 T 257 7.0 0.456 4.6 LOS A 26 0.60 0.51 43.5
10 R 83 7.2 0.456 11.0 LOS B 26 0.60 0.72 39.8
441 7.0 0.455 6.3 LOS A 26 0.60 0.57 42.6
2214 7.0 0.985 28.5 LOS C 231 0.89 1.33 29.9
Approach
All Vehicles
Verney Road (North)
Approach
Balaclava Road (West)
Approach
Roundabout
Verney Road (South)
Approach
IDMovement
Verney Road SNew Dookey Road (East)
Balaclava R
oad
New
Dookie R
oad
Verney Road N
Tota
l
New Dookie Road
Tota
l
Tota
l
Balaclava RoadRoad
Tota
l
Appendix B.xls 25/10/200812:09 PM
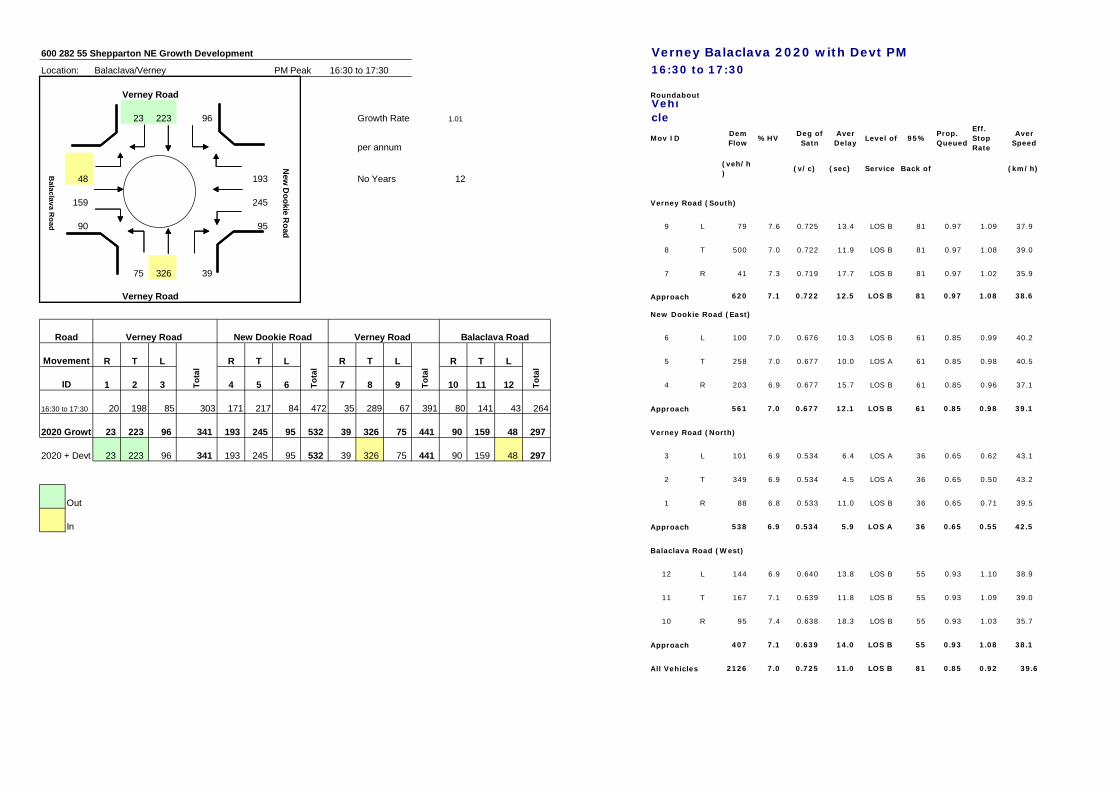
600 282 55 Shepparton NE Growth Development Verney Balaclava 2020 with Devt PMLocation: Balaclava/Verney PM Peak 16:30 to 17:30 16:30 to 17:30
Verney Road
23 223 96 Growth Rate 1.01
Vehicle
per annumMov ID
DemFlow
%HVDeg ofSatn
AverDelay
Level of 95%Prop.Queued
Eff.StopRate
AverSpeed
48 193 No Years 12
(veh/h)
(v/c) (sec) Service Back of (km/h)
159 245
90 95 9 L 79 7.6 0.725 13.4 LOS B 81 0.97 1.09 37.9
8 T 500 7.0 0.722 11.9 LOS B 81 0.97 1.08 39.0
75 326 39 7 R 41 7.3 0.719 17.7 LOS B 81 0.97 1.02 35.9
Verney Road 620 7.1 0.722 12.5 LOS B 81 0.97 1.08 38.6
6 L 100 7.0 0.676 10.3 LOS B 61 0.85 0.99 40.2
R T L R T L R T L R T L 5 T 258 7.0 0.677 10.0 LOS A 61 0.85 0.98 40.5
1 2 3 4 5 6 7 8 9 10 11 12 4 R 203 6.9 0.677 15.7 LOS B 61 0.85 0.96 37.1
16:30 to 17:30 20 198 85 303 171 217 84 472 35 289 67 391 80 141 43 264 561 7.0 0.677 12.1 LOS B 61 0.85 0.98 39.1
2020 Growth 23 223 96 341 193 245 95 532 39 326 75 441 90 159 48 297
2020 + Devt 23 223 96 341 193 245 95 532 39 326 75 441 90 159 48 297 3 L 101 6.9 0.534 6.4 LOS A 36 0.65 0.62 43.1
2 T 349 6.9 0.534 4.5 LOS A 36 0.65 0.50 43.2
Out 1 R 88 6.8 0.533 11.0 LOS B 36 0.65 0.71 39.5
In 538 6.9 0.534 5.9 LOS A 36 0.65 0.55 42.5
12 L 144 6.9 0.640 13.8 LOS B 55 0.93 1.10 38.9
11 T 167 7.1 0.639 11.8 LOS B 55 0.93 1.09 39.0
10 R 95 7.4 0.638 18.3 LOS B 55 0.93 1.03 35.7
407 7.1 0.639 14.0 LOS B 55 0.93 1.08 38.1
2126 7.0 0.725 11.0 LOS B 81 0.85 0.92 39.6All Vehicles
Balaclava Road (West)
Approach
Approach
Verney Road (North)
Approach
New Dookie Road (East)
New
Dookie R
oad
Balaclava R
oad
ID
Movement
Verney Road New Dookie RoadRoad
Tota
l
Tota
l
Tota
l
Verney Road
Tota
l
Balaclava Road
Verney Road (South)
Approach
Roundabout
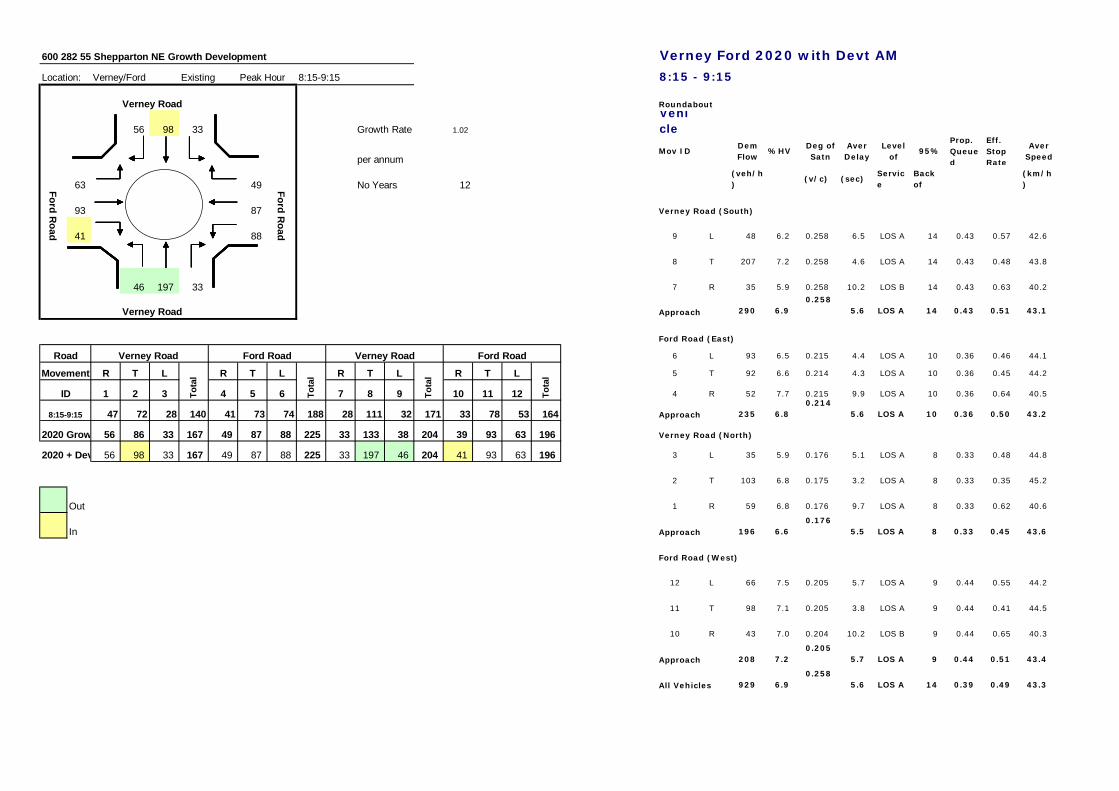
600 282 55 Shepparton NE Growth Development Verney Ford 2020 with Devt AM
Location: Verney/Ford Existing Peak Hour 8:15-9:15 8:15 - 9:15
Verney Road
56 98 33 Growth Rate 1.02
Vehicle
per annumMov ID
DemFlow
%HVDeg ofSatn
AverDelay
Levelof
95%Prop.Queued
Eff.StopRate
AverSpeed
63 49 No Years 12(veh/h)
(v/c) (sec)Service
Backof
(km/h)
93 87
41 88 9 L 48 6.2 0.258 6.5 LOS A 14 0.43 0.57 42.6
8 T 207 7.2 0.258 4.6 LOS A 14 0.43 0.48 43.8
46 197 33 7 R 35 5.9 0.258 10.2 LOS B 14 0.43 0.63 40.2
Verney Road 290 6.90.258
5.6 LOS A 14 0.43 0.51 43.1
6 L 93 6.5 0.215 4.4 LOS A 10 0.36 0.46 44.1
R T L R T L R T L R T L 5 T 92 6.6 0.214 4.3 LOS A 10 0.36 0.45 44.2
1 2 3 4 5 6 7 8 9 10 11 12 4 R 52 7.7 0.215 9.9 LOS A 10 0.36 0.64 40.5
47 72 28 140 41 73 74 188 28 111 32 171 33 78 53 164 235 6.80.214
5.6 LOS A 10 0.36 0.50 43.2
2020 Growth 56 86 33 167 49 87 88 225 33 133 38 204 39 93 63 196
2020 + Devt 56 98 33 167 49 87 88 225 33 197 46 204 41 93 63 196 3 L 35 5.9 0.176 5.1 LOS A 8 0.33 0.48 44.8
2 T 103 6.8 0.175 3.2 LOS A 8 0.33 0.35 45.2
Out 1 R 59 6.8 0.176 9.7 LOS A 8 0.33 0.62 40.6
In 196 6.60.176
5.5 LOS A 8 0.33 0.45 43.6
12 L 66 7.5 0.205 5.7 LOS A 9 0.44 0.55 44.2
11 T 98 7.1 0.205 3.8 LOS A 9 0.44 0.41 44.5
10 R 43 7.0 0.204 10.2 LOS B 9 0.44 0.65 40.3
208 7.20.205
5.7 LOS A 9 0.44 0.51 43.4
929 6.90.258
5.6 LOS A 14 0.39 0.49 43.3
Ford Road (East)
Ford Road
All Vehicles
Ford Road (West)
Approach
Approach
Verney Road (North)
Approach
8:15-9:15
Movement
Verney Road Ford RoadRoad
Tota
l
Tota
l
ID Tota
l
Tota
l
Roundabout
Ford Road
Verney Road Ford Road
Verney Road (South)
Approach
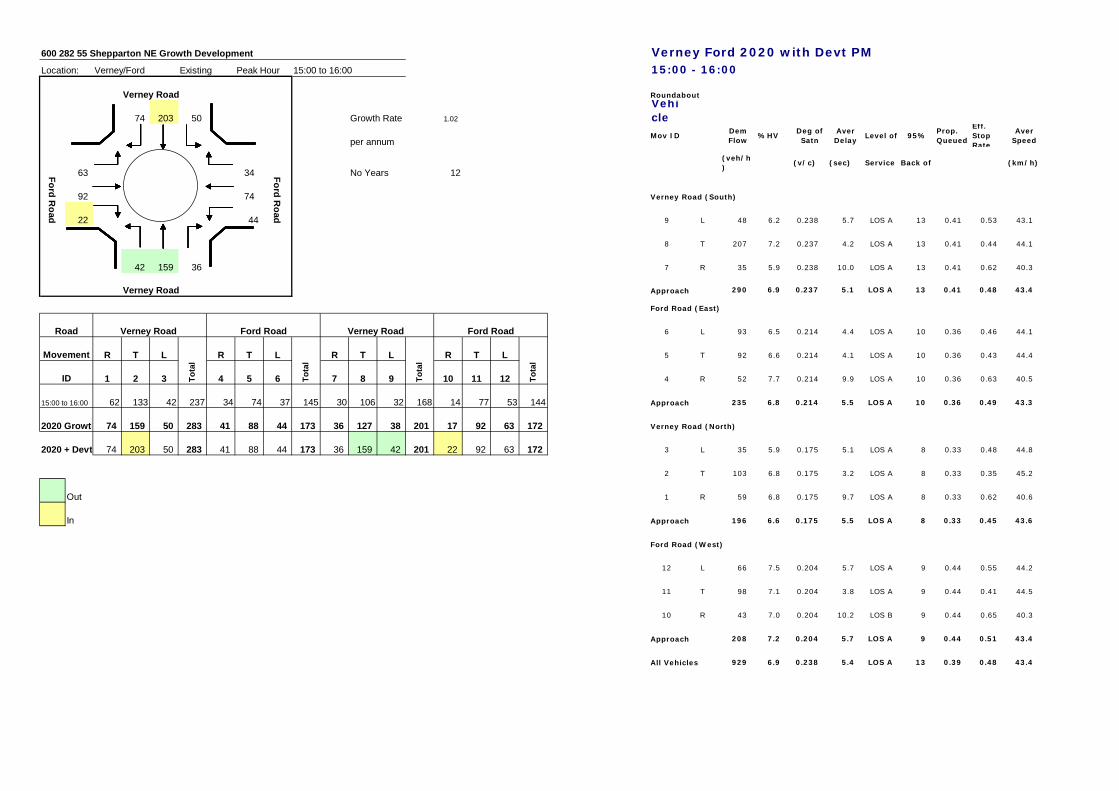
600 282 55 Shepparton NE Growth Development Verney Ford 2020 with Devt PMLocation: Verney/Ford Existing Peak Hour 15:00 to 16:00 15:00 - 16:00
Verney Road
74 203 50 Growth Rate 1.02
Vehicle
per annumMov ID
DemFlow
%HVDeg ofSatn
AverDelay
Level of 95%Prop.Queued
Eff.StopRate
AverSpeed
63 34 No Years 12(veh/h)
(v/c) (sec) Service Back of (km/h)
92 74
22 44 9 L 48 6.2 0.238 5.7 LOS A 13 0.41 0.53 43.1
8 T 207 7.2 0.237 4.2 LOS A 13 0.41 0.44 44.1
42 159 36 7 R 35 5.9 0.238 10.0 LOS A 13 0.41 0.62 40.3
Verney Road 290 6.9 0.237 5.1 LOS A 13 0.41 0.48 43.4
6 L 93 6.5 0.214 4.4 LOS A 10 0.36 0.46 44.1
R T L R T L R T L R T L 5 T 92 6.6 0.214 4.1 LOS A 10 0.36 0.43 44.4
1 2 3 4 5 6 7 8 9 10 11 12 4 R 52 7.7 0.214 9.9 LOS A 10 0.36 0.63 40.5
15:00 to 16:00 62 133 42 237 34 74 37 145 30 106 32 168 14 77 53 144 235 6.8 0.214 5.5 LOS A 10 0.36 0.49 43.3
2020 Growth 74 159 50 283 41 88 44 173 36 127 38 201 17 92 63 172
2020 + Devt 74 203 50 283 41 88 44 173 36 159 42 201 22 92 63 172 3 L 35 5.9 0.175 5.1 LOS A 8 0.33 0.48 44.8
2 T 103 6.8 0.175 3.2 LOS A 8 0.33 0.35 45.2
Out 1 R 59 6.8 0.175 9.7 LOS A 8 0.33 0.62 40.6
In 196 6.6 0.175 5.5 LOS A 8 0.33 0.45 43.6
12 L 66 7.5 0.204 5.7 LOS A 9 0.44 0.55 44.2
11 T 98 7.1 0.204 3.8 LOS A 9 0.44 0.41 44.5
10 R 43 7.0 0.204 10.2 LOS B 9 0.44 0.65 40.3
208 7.2 0.204 5.7 LOS A 9 0.44 0.51 43.4
929 6.9 0.238 5.4 LOS A 13 0.39 0.48 43.4All Vehicles
Approach
Ford Road (West)
Approach
Ford Road (East)
Approach
Verney Road (North)
Roundabout
Verney Road (South)
Approach
Ford Road
Ford Road
Tota
l
Ford Road
ID
Movement
Verney RoadRoad
Tota
l
Tota
l
Tota
l
Verney Road Ford Road
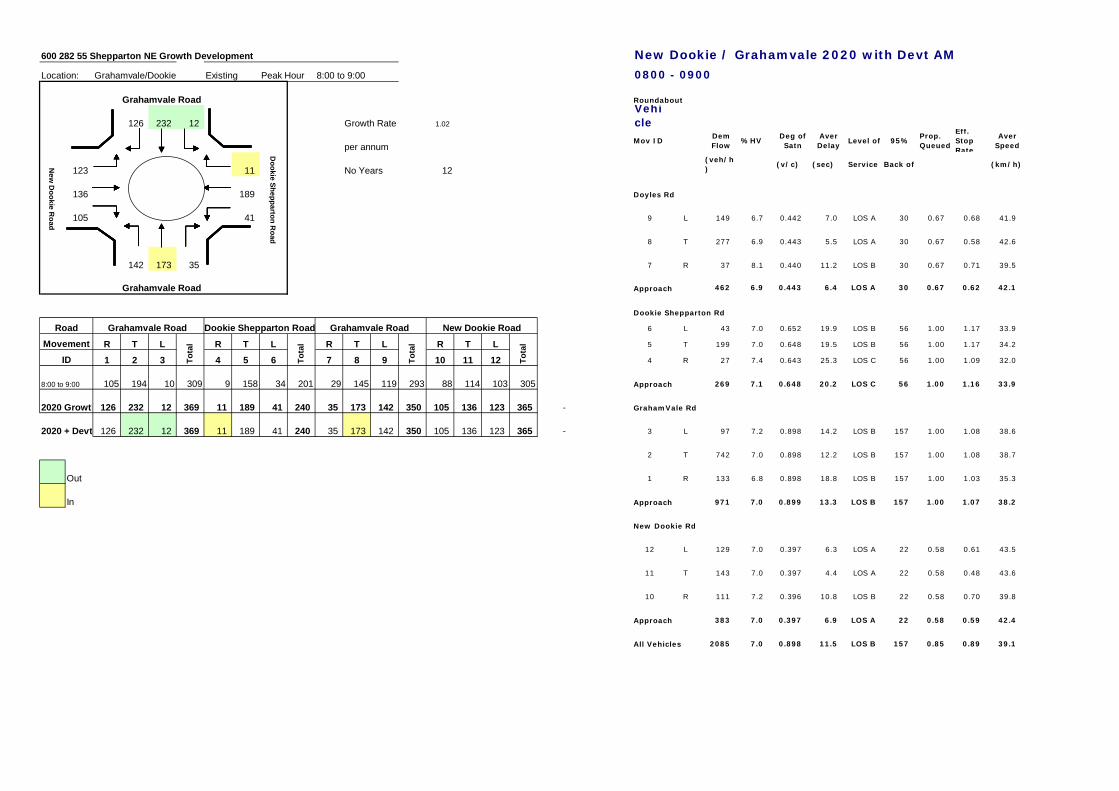
600 282 55 Shepparton NE Growth Development New Dookie / Grahamvale 2020 with Devt AM
Location: Grahamvale/Dookie Existing Peak Hour 8:00 to 9:00 0800 - 0900
Grahamvale Road
126 232 12 Growth Rate 1.02
Vehicle
per annumMov ID
DemFlow
%HVDeg ofSatn
AverDelay
Level of 95%Prop.Queued
Eff.StopRate
AverSpeed
123 11 No Years 12(veh/h)
(v/c) (sec) Service Back of (km/h)
136 189
105 41 9 L 149 6.7 0.442 7.0 LOS A 30 0.67 0.68 41.9
8 T 277 6.9 0.443 5.5 LOS A 30 0.67 0.58 42.6
142 173 35 7 R 37 8.1 0.440 11.2 LOS B 30 0.67 0.71 39.5
Grahamvale Road 462 6.9 0.443 6.4 LOS A 30 0.67 0.62 42.1
6 L 43 7.0 0.652 19.9 LOS B 56 1.00 1.17 33.9
R T L R T L R T L R T L 5 T 199 7.0 0.648 19.5 LOS B 56 1.00 1.17 34.2
1 2 3 4 5 6 7 8 9 10 11 12 4 R 27 7.4 0.643 25.3 LOS C 56 1.00 1.09 32.0
8:00 to 9:00 105 194 10 309 9 158 34 201 29 145 119 293 88 114 103 305 269 7.1 0.648 20.2 LOS C 56 1.00 1.16 33.9
2020 Growth 126 232 12 369 11 189 41 240 35 173 142 350 105 136 123 365 -
2020 + Devt 126 232 12 369 11 189 41 240 35 173 142 350 105 136 123 365 - 3 L 97 7.2 0.898 14.2 LOS B 157 1.00 1.08 38.6
2 T 742 7.0 0.898 12.2 LOS B 157 1.00 1.08 38.7
Out 1 R 133 6.8 0.898 18.8 LOS B 157 1.00 1.03 35.3
In 971 7.0 0.899 13.3 LOS B 157 1.00 1.07 38.2
12 L 129 7.0 0.397 6.3 LOS A 22 0.58 0.61 43.5
11 T 143 7.0 0.397 4.4 LOS A 22 0.58 0.48 43.6
10 R 111 7.2 0.396 10.8 LOS B 22 0.58 0.70 39.8
383 7.0 0.397 6.9 LOS A 22 0.58 0.59 42.4
2085 7.0 0.898 11.5 LOS B 157 0.85 0.89 39.1
New Dookie Rd
Approach
All Vehicles
GrahamVale Rd
Approach
Dookie Shepparton Rd
Approach
Roundabout
Doyles Rd
Approach
Dookie Shepparton R
oad
Grahamvale Road Dookie Shepparton Road
ID
RoadMovement
New
Dookie R
oad
Tota
l
Tota
l
Tota
l
Tota
l
Grahamvale Road New Dookie Road
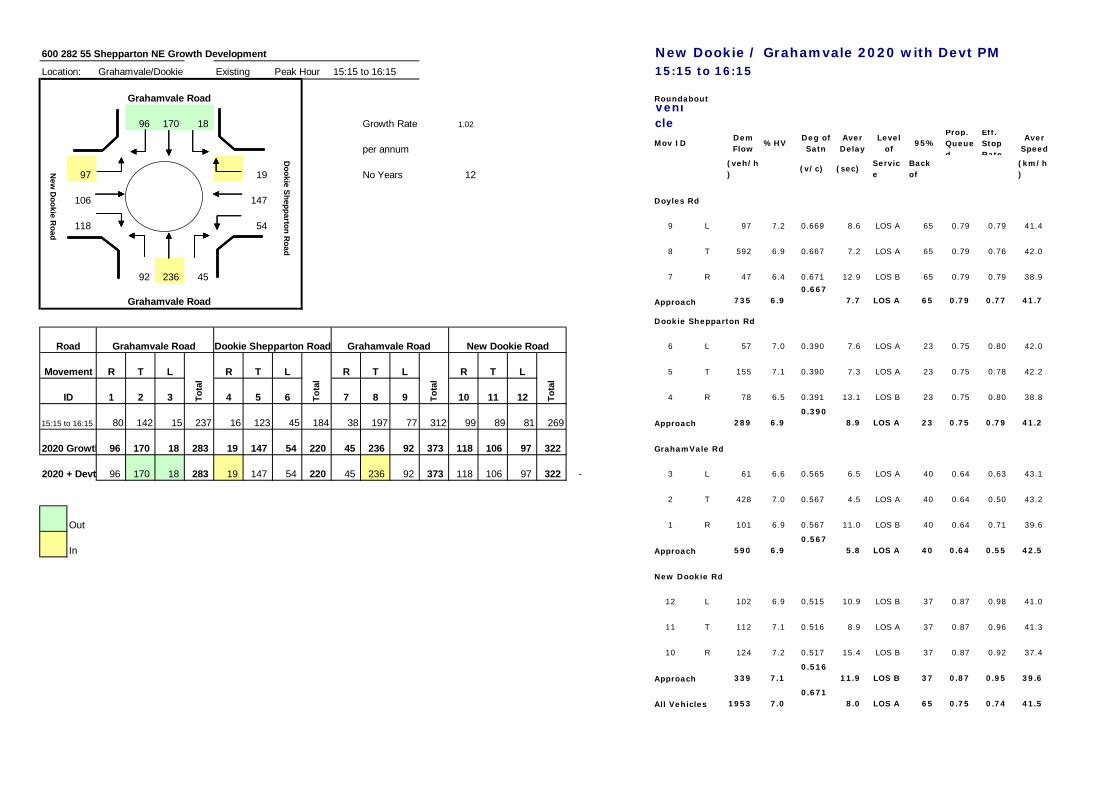
600 282 55 Shepparton NE Growth Development New Dookie / Grahamvale 2020 with Devt PMLocation: Grahamvale/Dookie Existing Peak Hour 15:15 to 16:15 15:15 to 16:15
Grahamvale Road
96 170 18 Growth Rate 1.02
Vehicle
per annumMov ID
DemFlow
%HVDeg ofSatn
AverDelay
Levelof
95%Prop.Queued
Eff.StopRate
AverSpeed
97 19 No Years 12(veh/h)
(v/c) (sec)Service
Backof
(km/h)
106 147
118 54 9 L 97 7.2 0.669 8.6 LOS A 65 0.79 0.79 41.4
8 T 592 6.9 0.667 7.2 LOS A 65 0.79 0.76 42.0
92 236 45 7 R 47 6.4 0.671 12.9 LOS B 65 0.79 0.79 38.9
Grahamvale Road 735 6.90.667
7.7 LOS A 65 0.79 0.77 41.7
6 L 57 7.0 0.390 7.6 LOS A 23 0.75 0.80 42.0
R T L R T L R T L R T L 5 T 155 7.1 0.390 7.3 LOS A 23 0.75 0.78 42.2
1 2 3 4 5 6 7 8 9 10 11 12 4 R 78 6.5 0.391 13.1 LOS B 23 0.75 0.80 38.8
15:15 to 16:15 80 142 15 237 16 123 45 184 38 197 77 312 99 89 81 269 289 6.90.390
8.9 LOS A 23 0.75 0.79 41.2
2020 Growth 96 170 18 283 19 147 54 220 45 236 92 373 118 106 97 322
2020 + Devt 96 170 18 283 19 147 54 220 45 236 92 373 118 106 97 322 - 3 L 61 6.6 0.565 6.5 LOS A 40 0.64 0.63 43.1
2 T 428 7.0 0.567 4.5 LOS A 40 0.64 0.50 43.2
Out 1 R 101 6.9 0.567 11.0 LOS B 40 0.64 0.71 39.6
In 590 6.90.567
5.8 LOS A 40 0.64 0.55 42.5
12 L 102 6.9 0.515 10.9 LOS B 37 0.87 0.98 41.0
11 T 112 7.1 0.516 8.9 LOS A 37 0.87 0.96 41.3
10 R 124 7.2 0.517 15.4 LOS B 37 0.87 0.92 37.4
339 7.10.516
11.9 LOS B 37 0.87 0.95 39.6
1953 7.00.671
8.0 LOS A 65 0.75 0.74 41.5All Vehicles
New Dookie Rd
Approach
Approach
GrahamVale Rd
Approach
Tota
l
New
Dookie R
oad
Tota
l
ID
Movement
Grahamvale Road Dookie Shepparton Road
Dookie Shepparton R
oad
Road
Roundabout
Tota
l
Grahamvale Road New Dookie Road
Tota
l
Dookie Shepparton Rd
Doyles Rd
Approach
Appendix C Additional Traffic Movement Distribution
D R A F T
Shepparton North East Growth Corridor Development Traffic Impact Assessment P:\60028255 V07PU Shepparton\6_Draft_docs\6.1_Reports\Traffic and Transportation\1007tpe Traffic Assessment 20Nov08.doc Revision 21 November 2008 Page C
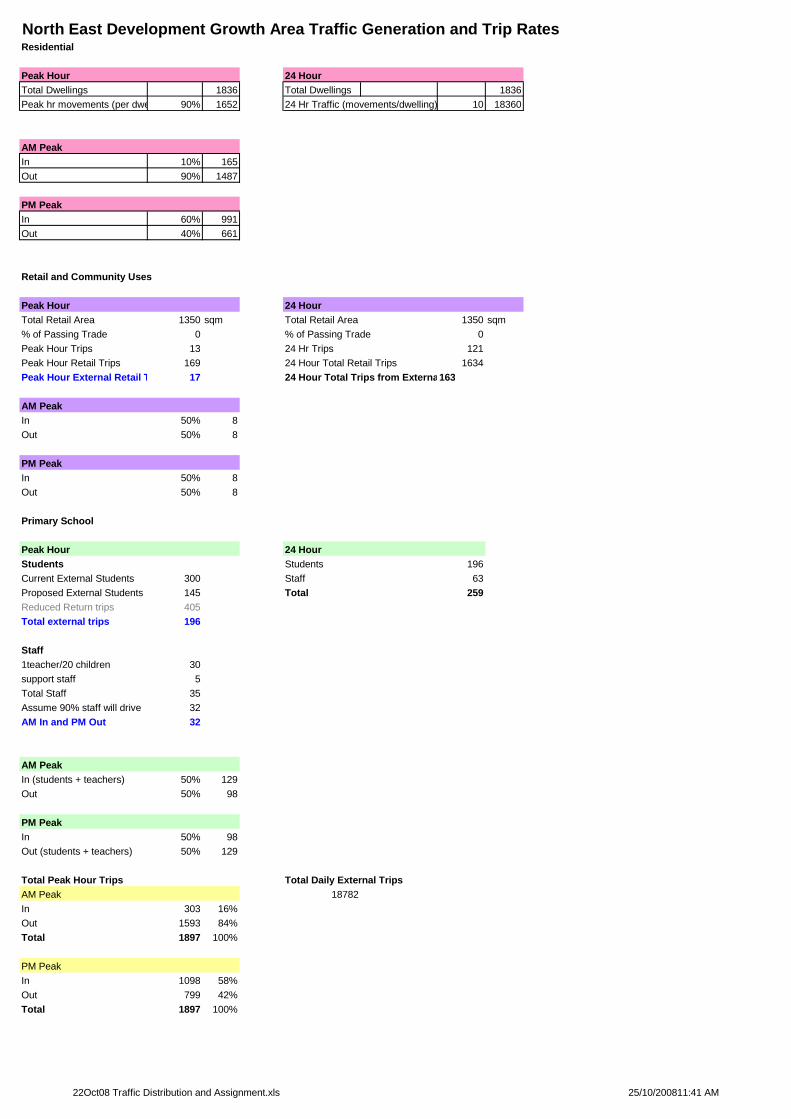
North East Development Growth Area Traffic Generation and Trip RatesResidential
Peak Hour 24 HourTotal Dwellings 1836 Total Dwellings 1836Peak hr movements (per dwelling) 90% 1652 24 Hr Traffic (movements/dwelling) 10 18360
AM PeakIn 10% 165Out 90% 1487
PM PeakIn 60% 991Out 40% 661
Retail and Community Uses
Peak Hour 24 HourTotal Retail Area 1350 sqm Total Retail Area 1350 sqm% of Passing Trade 0 % of Passing Trade 0Peak Hour Trips 13 24 Hr Trips 121Peak Hour Retail Trips 169 24 Hour Total Retail Trips 1634Peak Hour External Retail Trips 17 24 Hour Total Trips from External163
AM PeakIn 50% 8Out 50% 8
PM PeakIn 50% 8Out 50% 8
Primary School
Peak Hour 24 HourStudents Students 196Current External Students 300 Staff 63Proposed External Students 145 Total 259Reduced Return trips 405Total external trips 196
Staff1teacher/20 children 30support staff 5Total Staff 35Assume 90% staff will drive 32AM In and PM Out 32
AM PeakIn (students + teachers) 50% 129Out 50% 98
PM PeakIn 50% 98Out (students + teachers) 50% 129
Total Peak Hour Trips Total Daily External TripsAM Peak 18782In 303 16%Out 1593 84%Total 1897 100%
PM PeakIn 1098 58%Out 799 42%Total 1897 100%
22Oct08 Traffic Distribution and Assignment.xls 25/10/200811:41 AM
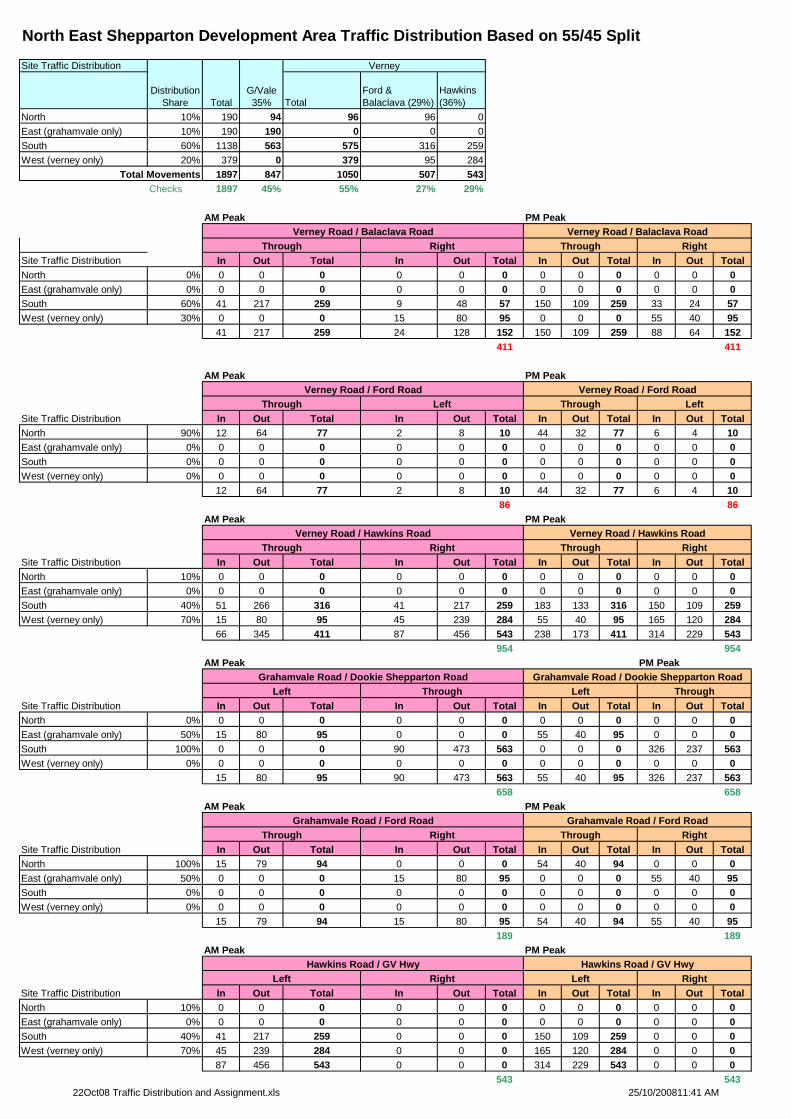
North East Shepparton Development Area Traffic Distribution Based on 55/45 Split
Site Traffic Distribution
TotalFord &Balaclava (29%)
Hawkins(36%)
North 10% 190 94 96 96 0East (grahamvale only) 10% 190 190 0 0 0South 60% 1138 563 575 316 259West (verney only) 20% 379 0 379 95 284
Total Movements 1897 847 1050 507 543Checks 1897 45% 55% 27% 29%
AM Peak PM Peak
Site Traffic Distribution In Out Total In Out Total In Out Total In Out TotalNorth 0% 0 0 0 0 0 0 0 0 0 0 0 0East (grahamvale only) 0% 0 0 0 0 0 0 0 0 0 0 0 0South 60% 41 217 259 9 48 57 150 109 259 33 24 57West (verney only) 30% 0 0 0 15 80 95 0 0 0 55 40 95
41 217 259 24 128 152 150 109 259 88 64 152411 411
AM Peak PM Peak
Site Traffic Distribution In Out Total In Out Total In Out Total In Out TotalNorth 90% 12 64 77 2 8 10 44 32 77 6 4 10East (grahamvale only) 0% 0 0 0 0 0 0 0 0 0 0 0 0South 0% 0 0 0 0 0 0 0 0 0 0 0 0West (verney only) 0% 0 0 0 0 0 0 0 0 0 0 0 0
12 64 77 2 8 10 44 32 77 6 4 1086 86
AM Peak PM Peak
Site Traffic Distribution In Out Total In Out Total In Out Total In Out TotalNorth 10% 0 0 0 0 0 0 0 0 0 0 0 0East (grahamvale only) 0% 0 0 0 0 0 0 0 0 0 0 0 0South 40% 51 266 316 41 217 259 183 133 316 150 109 259West (verney only) 70% 15 80 95 45 239 284 55 40 95 165 120 284
66 345 411 87 456 543 238 173 411 314 229 543954 954
AM Peak PM Peak
Site Traffic Distribution In Out Total In Out Total In Out Total In Out TotalNorth 0% 0 0 0 0 0 0 0 0 0 0 0 0East (grahamvale only) 50% 15 80 95 0 0 0 55 40 95 0 0 0South 100% 0 0 0 90 473 563 0 0 0 326 237 563West (verney only) 0% 0 0 0 0 0 0 0 0 0 0 0 0
15 80 95 90 473 563 55 40 95 326 237 563658 658
AM Peak PM Peak
Site Traffic Distribution In Out Total In Out Total In Out Total In Out TotalNorth 100% 15 79 94 0 0 0 54 40 94 0 0 0East (grahamvale only) 50% 0 0 0 15 80 95 0 0 0 55 40 95South 0% 0 0 0 0 0 0 0 0 0 0 0 0West (verney only) 0% 0 0 0 0 0 0 0 0 0 0 0 0
15 79 94 15 80 95 54 40 94 55 40 95189 189
AM Peak PM Peak
Site Traffic Distribution In Out Total In Out Total In Out Total In Out TotalNorth 10% 0 0 0 0 0 0 0 0 0 0 0 0East (grahamvale only) 0% 0 0 0 0 0 0 0 0 0 0 0 0South 40% 41 217 259 0 0 0 150 109 259 0 0 0West (verney only) 70% 45 239 284 0 0 0 165 120 284 0 0 0
87 456 543 0 0 0 314 229 543 0 0 0543 543
Verney
DistributionShare Total
G/Vale35%
Verney Road / Balaclava Road Verney Road / Balaclava RoadThrough
RightVerney Road / Hawkins Road
Verney Road / Ford RoadThrough Left
Grahamvale Road / Dookie Shepparton Road
Through
RightThrough Right
Through RightGrahamvale Road / Ford Road
Through Right
Grahamvale Road / Dookie Shepparton Road
Hawkins Road / GV Hwy
Verney Road / Ford RoadThrough Left
RightVerney Road / Hawkins Road
Through
Left Right
Through
Hawkins Road / GV HwyLeft Right
Left Left Through
Grahamvale Road / Ford Road
22Oct08 Traffic Distribution and Assignment.xls 25/10/200811:41 AM