Embed Size (px)
Citation preview
Sheriff ’s Office Patrol Division Staffing Study
January 2020 OFFICE OF PERFORMANCE AND ANALYSIS

Sheriff’s Office Patrol Division Staffing Study
Page 1
Dakota County Board of Commissioners: Mike Slavik, District 1 Kathleen A. Gaylord, District 2 Thomas A. Egan, District 3 Joe Atkins, District 4 Liz Workman, District 5 Mary Liz Holberg, District 6 Chris Gerlach, District 7 Dakota County Manager: Matt Smith This report was prepared for: Joe Leko, Chief Deputy Sheriff This report was prepared by: Lisa Melquist, Management Analyst Dave Paulsen, Management Analyst Dakota County Office of Performance and Analysis Dakota County Administration Center 1590 Highway 55 Hastings, Minnesota 55033-2372 “Bridging today and tomorrow with planning and analysis to improve residents’ lives and their government.” This report was prepared with input and assistance from the following individuals: Steve Anderson, Sheriff’s Office - Program Administration Supervisor Stacy Manka, Employee Relations Generalist Dan Scheuermann, Sheriff’s Office - Commander Richard Schroeder, Sheriff’s Office - Captain Robert Shingledecker, Sheriff’s Office – Sergeant Jodi Rolloff, Sheriff’s Office – Correctional Lieutenant Brian Christensen, Financial Services - Manager, Accounting Payroll Scott Laursen, Information Technology – GIS Specialist Lisa Blount, Information Technology – IT Project Manager
Sheriff’s Office Patrol Division Staffing Study
Page 2
Sheriff’s Office Patrol Division Staffing Study O F F I C E O F P E R F O R M A N C E A N D A N A LY S I S
Table of Contents
EXECUTIVE SUMMARY ..................................................................................................... 4
RECOMMENDATIONS ...................................................................................................... 5
BACKGROUND ................................................................................................................. 7
CURRENT STATE .............................................................................................................. 7
Historical Context .................................................................................................................... 7
Population Growth ............................................................................................................... 7
History of Calls for Service .................................................................................................... 8
Current Staffing Practices ....................................................................................................... 9
Shift Structure ....................................................................................................................... 9
Factors that Affect Staffing Levels......................................................................................... 10
Use of Flex Time and Other Paid Leave .............................................................................. 10
Patrol Deputy Flex and Comp Usage .................................................................................. 11
Non-Patrol Staffing Levels .................................................................................................. 12
Other Circumstances that Affect Patrol Deputies .............................................................. 13
Impact on Patrol Coverage ................................................................................................. 14
ANALYSIS ....................................................................................................................... 14
Shift Relief Factor .................................................................................................................. 14
2018 Call Analysis .................................................................................................................. 16
Location .............................................................................................................................. 16
Time of Day ......................................................................................................................... 18
Day of Week and Month .................................................................................................... 18
Calls by Problem Type ........................................................................................................ 19
Time-Consuming Calls ........................................................................................................... 20
Evaluating Stress and Safety ................................................................................................. 21
Law Enforcement Stressor Literature Review .................................................................... 21
Employee Opinion Survey .................................................................................................. 23
Workplace Climate Survey ................................................................................................. 24
DISCUSSION ................................................................................................................... 25
APPENDIX A: PROJECT SCOPE ......................................................................................... 28
APPENDIX B: PATROL DIVISION ORGANIZATIONAL CHART .............................................. 31

Sheriff’s Office Patrol Division Staffing Study
Page 3
APPENDIX C: POLICE STAFFING LEVEL MODELS ............................................................... 32
APPENDIX D: 2018 CALL ANALYSIS .................................................................................. 34
Methodology ......................................................................................................................... 34
2018 Calls by Month and Number of DCSO Patrol Staff who Responded ............................ 34
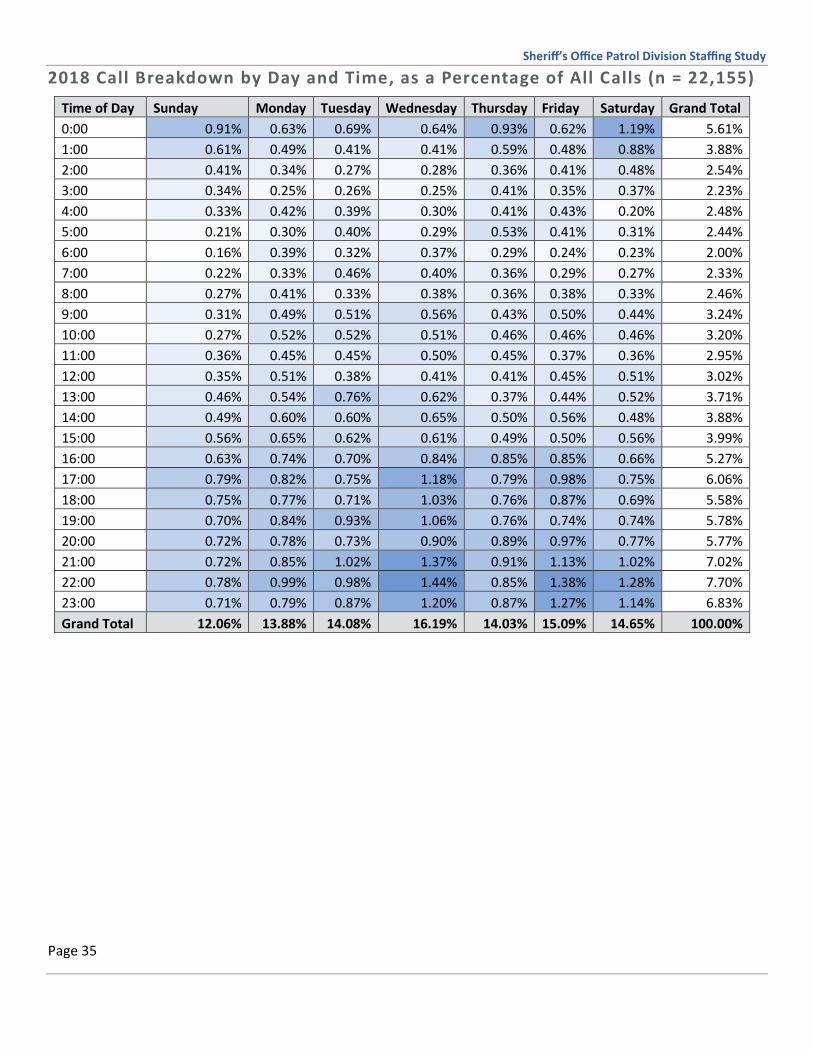
2018 Call Breakdown by Day and Time, as a Percentage of All Calls (n = 22,155) ............... 35
2018 Call and Response Distribution by Problem Type ........................................................ 36
2018 Call Breakdown by Day and Time, Traffic Stops Only (n = 10,195) .............................. 38
2018 Call Breakdown by Day and Time, Excluding Traffic Stops (n = 11,960) ...................... 39
2018 Call Breakdown by Day and Time, Excluding Self-Initiated Calls (n = 8,647) ............... 40
2018 Call Breakdown by Day and Time, Calls That Ended in Arrest (n = 520) ...................... 41
2018 Calls and Responses by City/Township ........................................................................ 42
APPENDIX E: EMPLOYEE OPINION SURVEY RESULTS ........................................................ 44
APPENDIX F: CONTINUED DISCUSSION AND SERVICE ALTERNATIVES .............................. 45
Taxing Alternative ................................................................................................................. 45
Contracting Services .............................................................................................................. 45
Sheriff’s Office Patrol Division Staffing Study
Page 4
EXECUTIVE SUMMARY For approximately three decades, the Sheriff’s Office Patrol Unit has operated with eighteen licensed deputies.
During that time, the population of Dakota County has increased by more than 50 percent. The majority of that
growth has occurred in the urban areas of the County. However, rural areas—those where the Sheriff’s Office is the
primary law enforcement agency—have also grown by 22 percent, or approximately 3,300 residents.
In recent years, the Sheriff’s Office has experienced staffing challenges to maintain minimum staffing of at least two
deputies during each shift. Three deputies are scheduled per shift—with the exception of Wednesdays, when six
deputies are scheduled per shift to increase availability for training. There are three shifts per day:
▪ Days (6 a.m. to 4 p.m.),
▪ Afternoons (4 p.m. to 2 a.m.), and
▪ Midnights (8 p.m. to 6 a.m.).
Using three years of payroll shift data, OPA used the Shift Relief Factor staffing model, which is widely used in law
enforcement and similar shift-based professions, to determine whether the current complement of eighteen
deputies is adequate for the Patrol Division. This Shift Relief Factor calculation included an analysis of flex time off,
comp time used, leave/light duty, and time spent training or otherwise occupied. The results indicate that the
Sheriff’s Office needs four additional deputies, for a total to twenty-two, to compensate for non-patrol time.
Furthermore, OPA analyzed 2018 call activity to understand the distribution of calls throughout the week as an
indication of workload. That data indicates that calls—especially traffic stops—are most frequent during the
evening hours (5 p.m. to 2 a.m.) on Wednesdays, Fridays, and Saturdays.
Dispositions of all calls, including traffic stops were examined for day and time as calls involving an arrest are more
likely to be time-consuming than other types of calls. Arrests involve one deputy transporting the arrestee to the
jail in Hastings, booking the person into the jail, and driving back to their post—a process that can take several
hours. In 2018, 51 percent of the calls that ended in an arrest occurred between the hours of 8:00 p.m. to 2:00 a.m.
One contributing factor for the increased activity from 8 p.m. to 2 a.m. is that the afternoon and midnight shifts
overlap during these exact hours, which may allow for more proactive policing activities. Even if this plays a role,
arrests are more likely during these hours, which affect coverage for the other deputies on duty while the arresting
deputy conducts the transportation and follow-up activities. Furthermore, arrests can be an extremely dangerous
time for the arresting deputy and back-up is always preferable, but requires enough available staff to do so.
Taking the Shift Relief Factor and 2018 call data into account, data supports the Sheriff’s Office hiring four new
deputies into the Patrol Division, bringing the total to twenty-two deputies. Specific options about shift coverage
and prioritization for these four potential new deputies, using the analyzed data and considering distribution across
shifts to reduce minimum staffing, can be found in the Recommendations section on page 5 of this report.
Sheriff’s Office Patrol Division Staffing Study
Page 5
RECOMMENDATIONS Based on data collected, which included an analysis of 2018 call activity and three years of shift data, the Dakota
County Sheriff’s Office Patrol Division needs four additional deputies beyond the current roster of 18 to provide full
coverage for the Patrol workload.
As discussed in this report, calls for service, traffic stops and arrests are more heavily concentrated during the
evening hours than at other times of day. Additionally, as a whole Wednesdays, Fridays and Saturdays have a
heavier percentage of the workload as compared to other days, especially pertaining to traffic stops.
OPA offers three shift options for consideration, which may enable the additional four positions to increase staffing
during the busiest workload times and examine workload from different perspectives. The positions within each
conceptual option are ranked in order of priority in the event that the Sheriff’s Office hires fewer than four new
deputies.
The first option keeps the current shift structure, but as there would not be enough people to add another person
to all current shifts (six would be needed to achieve that), priority is given to the days and times that have the most
activity:
▪ Option 1:
1. Team 1 afternoons (4 p.m. to 2 a.m.) – Wednesdays through Fridays and every other weekend,
2. Team 2 afternoons (4 p.m. to 2 a.m.) – Mondays through Wednesdays and every other (opposite)
weekend,
3. Team 1 midnights (8 p.m. to 6 a.m.) – Wednesdays through Fridays and every other weekend, and
4. Team 2 midnights (8 p.m. to 6 a.m.) – Mondays through Wednesdays and every other (opposite)
weekend.
The second option utilizes the first two positions to augment existing staffing on the afternoon shifts, as that is
when a bulk of Patrol activity occurs. However, the afternoon shift already overlaps six hours with the midnight
shift and day shifts have no overlap. Positions three and four below would offer some overlap with the day shift to
increase coverage to reduce the frequency of minimum staffing during the day shift in the event of flex usage,
training, etc. It also offers a different option regarding a consistent set of days worked each week—4 on and 3 off,
with having one weekend day off per week and having all staff scheduled for Wednesdays for training, if needed.
▪ Option 2:
1. Afternoons Wednesdays through Saturdays (4 p.m. to 2 a.m.),
2. Afternoons Sundays through Wednesdays (4 p.m. to 2 a.m.),
3. 12 p.m. to 8 p.m. Wednesdays through Saturdays, and
4. 12 p.m. to 8 p.m. Sundays through Wednesdays.
The third option is based on the distribution of calls, excluding self-initiated calls. The majority of the workload in
2018 was the result of calls such as traffic stops, which are self-initiated by deputies. When excluding traffic stops
and other self-initiated activities, a slightly different picture emerges. External calls for service are still more

Sheriff’s Office Patrol Division Staffing Study
Page 6
concentrated during each evening hour. However, the day shift could benefit from additional coverage, particularly
since that shift does not have any double-coverage times whereas the afternoon and evening shifts overlap from 8
p.m. to 2 a.m. The third option provides additional coverage to the day shift.
▪ Option 3:
1. Team 2 days (6 a.m. to 4 p.m.) – Mondays through Wednesdays and every other (opposite)
weekend.
2. Team 1 days (6 a.m. to 4 p.m.) – Wednesdays through Fridays and every other weekend,
3. Team 2 afternoons (4 p.m. to 2 a.m.) – Mondays through Wednesdays and every other weekend,
and
4. Team 1 afternoons (4 p.m. to 2 a.m.) – Wednesdays through Fridays and every other (opposite)
weekend.

Sheriff’s Office Patrol Division Staffing Study
Page 7
BACKGROUND The Dakota County Sheriff’s Office (DCSO) is responsible for conducting law enforcement activities throughout the
County. There are also twelve city police departments within the County, which operate independently of the
Sheriff’s Office:
• Apple Valley Police Department
• Burnsville Police Department
• Eagan Police Department
• Farmington Police Department
• Hastings Police Department
• Inver Grove Heights Police Department
• Lakeville Police Department
• Mendota Heights Police Department (which also serves Lilydale and Mendota)
• Northfield Police Department1
• Rosemount Police Department
• South Saint Paul Police Department
• West Saint Paul Police Department.
For cities that have their own police departments, those departments take primary jurisdiction for calls within their
borders, but can ask for assistance from the Sheriff’s Office. The DCSO is responsible for policing activities in the
rest of the County, and holds Joint Powers Agreements (JPAs) with the rural townships to enforce their ordinances.
Twenty rural communities do not have their own police departments and, thus, are served by the DCSO through
JPAs.2
If requested by other neighboring counties, the DCSO may also be called on to assist on calls that occur outside of
the Dakota County boundaries.
CURRENT STATE
Historical Context
Population Growth
For the twenty rural Dakota County communities, which make up sixty percent of the total area of the County, the
Sheriff’s Office is the primary law enforcement agency. While those six rural cities and fourteen townships make up
a large percentage of the area of the County, the majority of the County’s population is concentrated in the
northern, urban areas. As illustrated in the chart below, Dakota County’s urban areas—and those which have their
1 The majority of Northfield falls within Rice County. A small portion of rural Northfield is within Dakota County’s borders. 2 Castle Rock Township, Coates, Douglas Township, Empire Township, Eureka Township, Greenvale Township, Hampton, Hampton Township, Marshan Township, Miesville, New Trier, Nininger Township, Northfield Township, Randolph, Randolph Township, Ravenna Township, Sciota Township, Vermillion, Vermillion Township, and Waterford Township.
Sheriff’s Office Patrol Division Staffing Study
Page 8
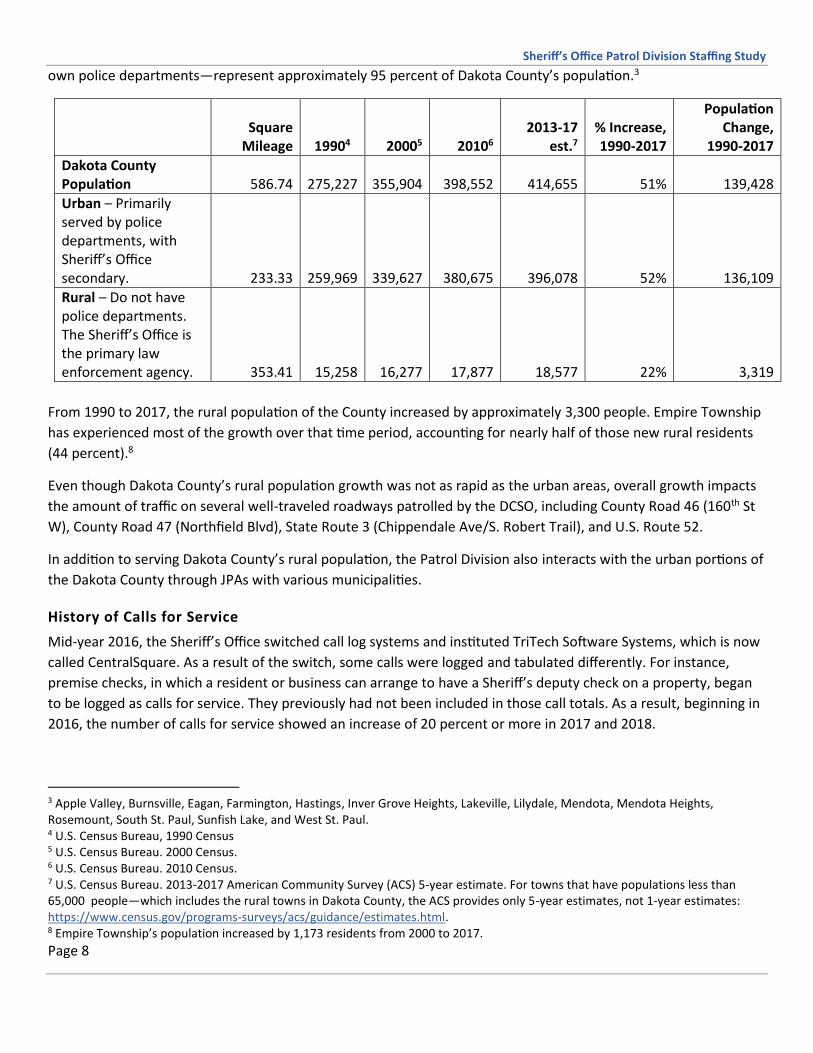
own police departments—represent approximately 95 percent of Dakota County’s population.3
Square Mileage 19904 20005 20106
2013-17 est.7
% Increase, 1990-2017
Population Change,
1990-2017
Dakota County Population 586.74 275,227 355,904 398,552 414,655 51% 139,428
Urban – Primarily served by police departments, with Sheriff’s Office secondary. 233.33 259,969 339,627 380,675 396,078 52% 136,109
Rural – Do not have police departments. The Sheriff’s Office is the primary law enforcement agency. 353.41 15,258 16,277 17,877 18,577 22% 3,319
From 1990 to 2017, the rural population of the County increased by approximately 3,300 people. Empire Township
has experienced most of the growth over that time period, accounting for nearly half of those new rural residents
(44 percent).8
Even though Dakota County’s rural population growth was not as rapid as the urban areas, overall growth impacts
the amount of traffic on several well-traveled roadways patrolled by the DCSO, including County Road 46 (160th St
W), County Road 47 (Northfield Blvd), State Route 3 (Chippendale Ave/S. Robert Trail), and U.S. Route 52.
In addition to serving Dakota County’s rural population, the Patrol Division also interacts with the urban portions of
the Dakota County through JPAs with various municipalities.
History of Calls for Service
Mid-year 2016, the Sheriff’s Office switched call log systems and instituted TriTech Software Systems, which is now
called CentralSquare. As a result of the switch, some calls were logged and tabulated differently. For instance,
premise checks, in which a resident or business can arrange to have a Sheriff’s deputy check on a property, began
to be logged as calls for service. They previously had not been included in those call totals. As a result, beginning in
2016, the number of calls for service showed an increase of 20 percent or more in 2017 and 2018.
3 Apple Valley, Burnsville, Eagan, Farmington, Hastings, Inver Grove Heights, Lakeville, Lilydale, Mendota, Mendota Heights, Rosemount, South St. Paul, Sunfish Lake, and West St. Paul. 4 U.S. Census Bureau, 1990 Census 5 U.S. Census Bureau. 2000 Census. 6 U.S. Census Bureau. 2010 Census. 7 U.S. Census Bureau. 2013-2017 American Community Survey (ACS) 5-year estimate. For towns that have populations less than 65,000 people—which includes the rural towns in Dakota County, the ACS provides only 5-year estimates, not 1-year estimates: https://www.census.gov/programs-surveys/acs/guidance/estimates.html. 8 Empire Township’s population increased by 1,173 residents from 2000 to 2017.
Sheriff’s Office Patrol Division Staffing Study
Page 9
From 2008 to 2015, the number of calls the Sheriff’s Office received ranged from 22,080 to 30,645 calls per year,
with an average of 25,385.
As workload is now recorded differently in the new system compared to historical information, a direct apples-to-
apples comparison of recent years with pre-2017 data is not possible. As a result, OPA examined 2018 calls in more
detail to provide an understanding of workload, presented later in this report.
Current Staffing Practices
Shift Structure
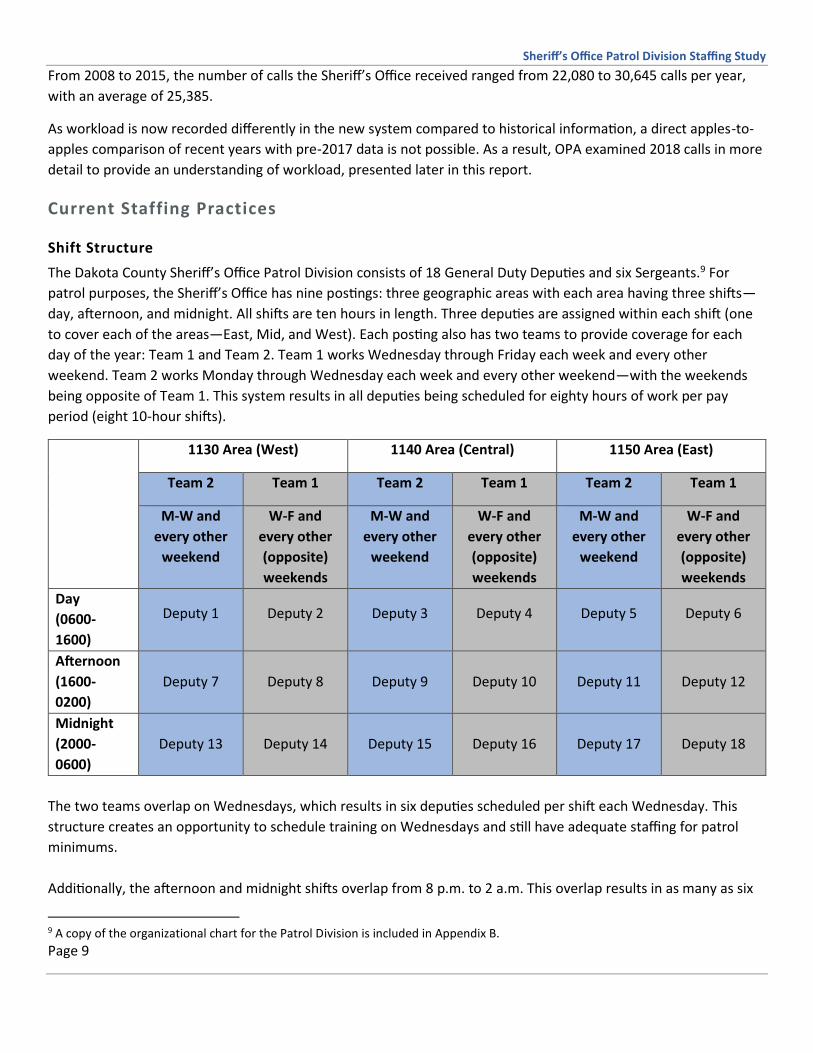
The Dakota County Sheriff’s Office Patrol Division consists of 18 General Duty Deputies and six Sergeants.9 For
patrol purposes, the Sheriff’s Office has nine postings: three geographic areas with each area having three shifts—
day, afternoon, and midnight. All shifts are ten hours in length. Three deputies are assigned within each shift (one
to cover each of the areas—East, Mid, and West). Each posting also has two teams to provide coverage for each
day of the year: Team 1 and Team 2. Team 1 works Wednesday through Friday each week and every other
weekend. Team 2 works Monday through Wednesday each week and every other weekend—with the weekends
being opposite of Team 1. This system results in all deputies being scheduled for eighty hours of work per pay
period (eight 10-hour shifts).
1130 Area (West) 1140 Area (Central) 1150 Area (East)
Team 2 Team 1 Team 2 Team 1 Team 2 Team 1
M-W and
every other
weekend
W-F and
every other
(opposite)
weekends
M-W and
every other
weekend
W-F and
every other
(opposite)
weekends
M-W and
every other
weekend
W-F and
every other
(opposite)
weekends
Day
(0600-
1600)
Deputy 1 Deputy 2 Deputy 3 Deputy 4 Deputy 5 Deputy 6
Afternoon
(1600-
0200)
Deputy 7 Deputy 8 Deputy 9 Deputy 10 Deputy 11 Deputy 12
Midnight
(2000-
0600)
Deputy 13 Deputy 14 Deputy 15 Deputy 16 Deputy 17 Deputy 18
The two teams overlap on Wednesdays, which results in six deputies scheduled per shift each Wednesday. This
structure creates an opportunity to schedule training on Wednesdays and still have adequate staffing for patrol
minimums.
Additionally, the afternoon and midnight shifts overlap from 8 p.m. to 2 a.m. This overlap results in as many as six
9 A copy of the organizational chart for the Patrol Division is included in Appendix B.
Sheriff’s Office Patrol Division Staffing Study
Page 10
deputies/squad cars (up to 12 on Wednesdays) and two sergeants (four on Wednesdays) from 8 p.m. to 2 a.m.
The implementation of this shift structure has eliminated difficulties associated with FLSA (Fair Labor Standards
Act) and the payback of hours. The previous scheduling format resulted in deputies occasionally being overpaid if
they did not work 80 hours during a given pay period. This required a payback of overpayment amounts, resulting
in lower employee morale and uncertainty about anticipated pay.
Factors that Affect Staffing Levels
Use of Flex Time and Other Paid Leave
The use of accrued flex leave is a large driver of staffing levels. Per County policy, staff accrue flex time based on
their length of tenure with the County. Flex time can be used for illness, vacation, or funeral leave. Accrual rates
are as follows:
Length of Tenure Hours of Flex Time Accrued per Calendar Year
0 - 4.99 years 160 (20 days)
5 - 9.99 years 192 (24 days)
10 - 14.99 years 240 (30 days)
15+ years 304 (38 days)
Flex leave scheduling is provided to Patrol Deputies on a first requested, first served basis. Three Patrol Deputies
are scheduled per shift, except for Wednesdays when six Patrol Deputies are scheduled to work each shift. Two
shifts, the afternoon and midnight shifts, overlap for a total of six hours. Each shift requires a minimum of two
deputies. As three deputies are scheduled per shift for most days, only one deputy is allowed to take flex leave per
shift in order to maintain minimum staffing. Unforeseen circumstances, such as injury, illness, or a family
emergency can affect shift coverage, particularly if another deputy has requested and been granted flex leave.
Other types of paid leave, such as military leave, compensatory time (comp)10, and other miscellaneous paid time
off, can also affect staffing levels. When deputies work beyond their assigned schedule, they can elect to take the
extra hours as either overtime or comp time. In either case, they receive compensation or comp time at a rate of
one-and-a-half times the number of extra hours they worked. Comp time is held on the books and allows deputies
to take time off at a later time, much like flex leave.
To understand how absences for various types of leave might vary based on tenure (and potentially by generation),
OPA analyzed data about paid time off, provided by Financial Services, for different ranks within the Sheriff’s Office
for calendar years 2012-2018.
10 Sheriff’s deputies who are scheduled for and work on holidays receive compensatory time at a rate of 1.5x the number of hours worked on the holiday. For a ten hour shift, a deputy would earn 15 hours of comp time for later use.
Sheriff’s Office Patrol Division Staffing Study
Page 11
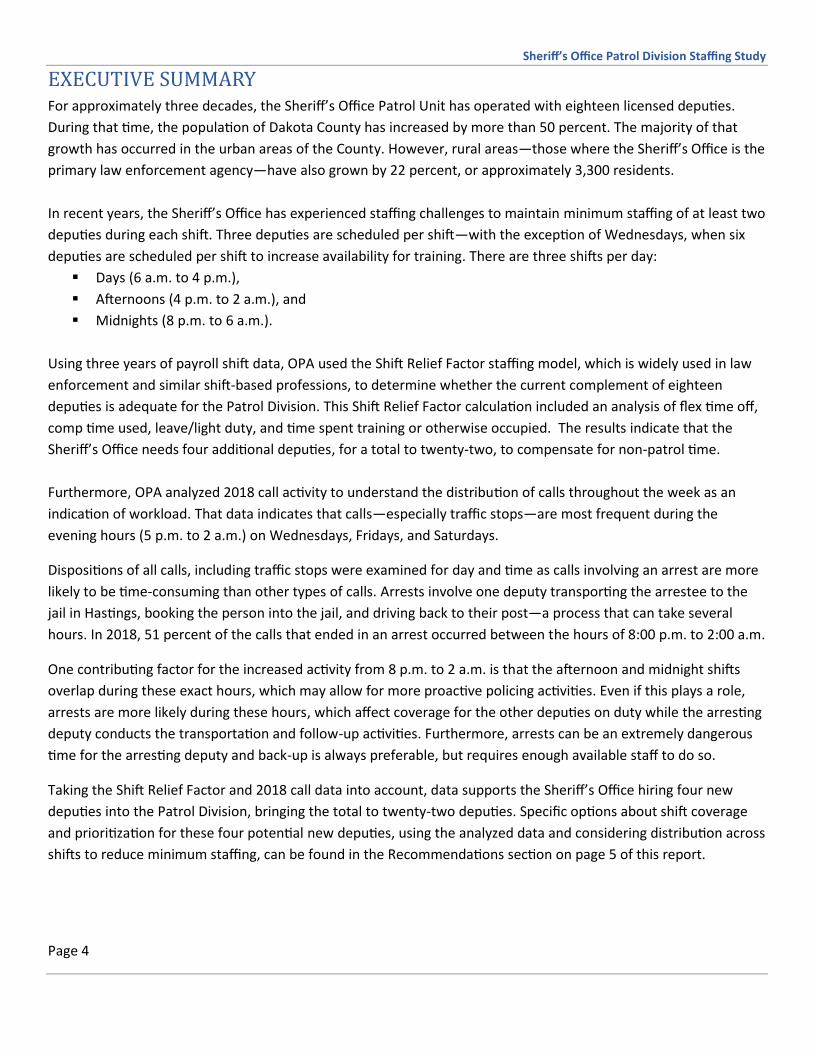
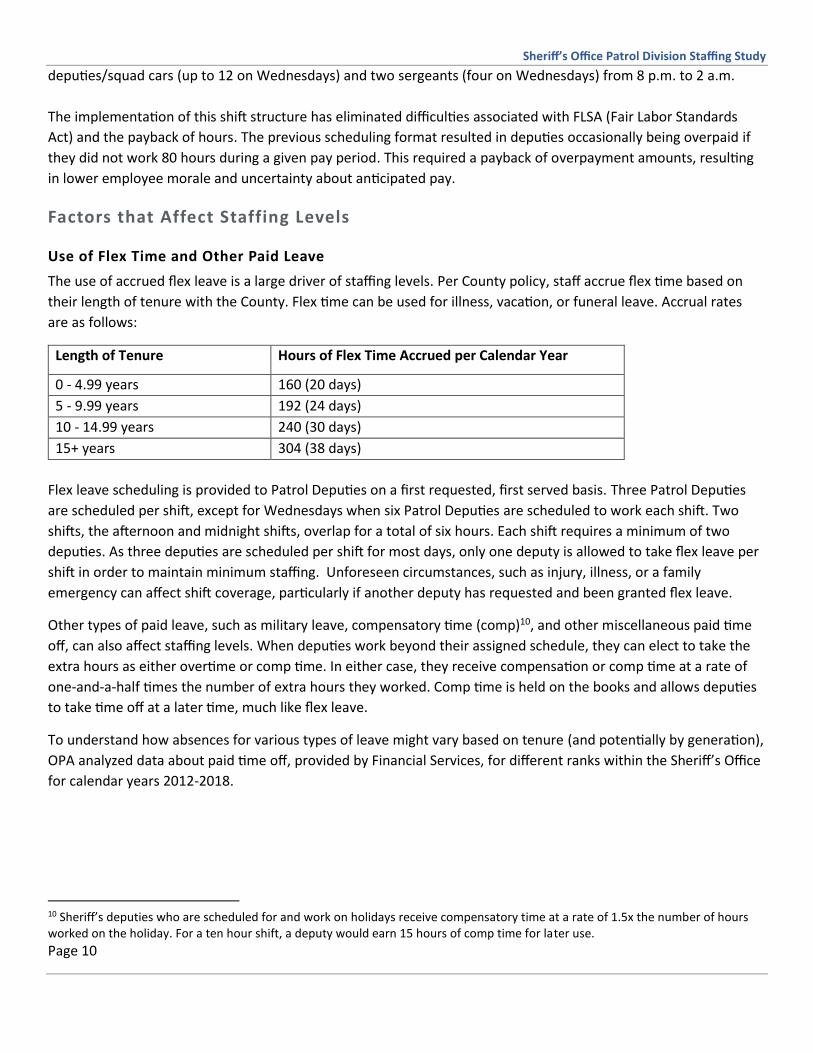
Overall, the data11 showed that individuals at the highest ranks (Commander and Captain), tended to use paid
leave less often than lower ranks, despite having longer tenure with the County and, therefore, earning more flex
leave.
On average, General Duty Deputies used 4.5 to 6.5 weeks of paid leave per year, whereas Commanders used an
average of 2 to 3.4 weeks of paid leave per year.12
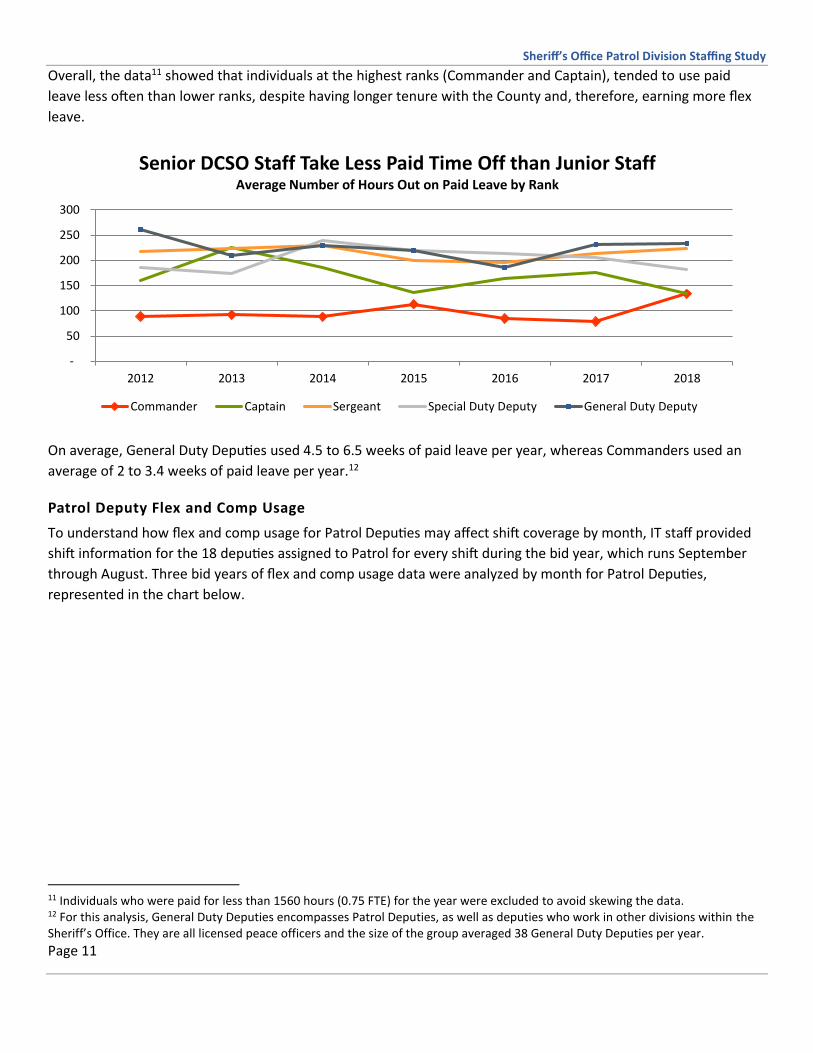
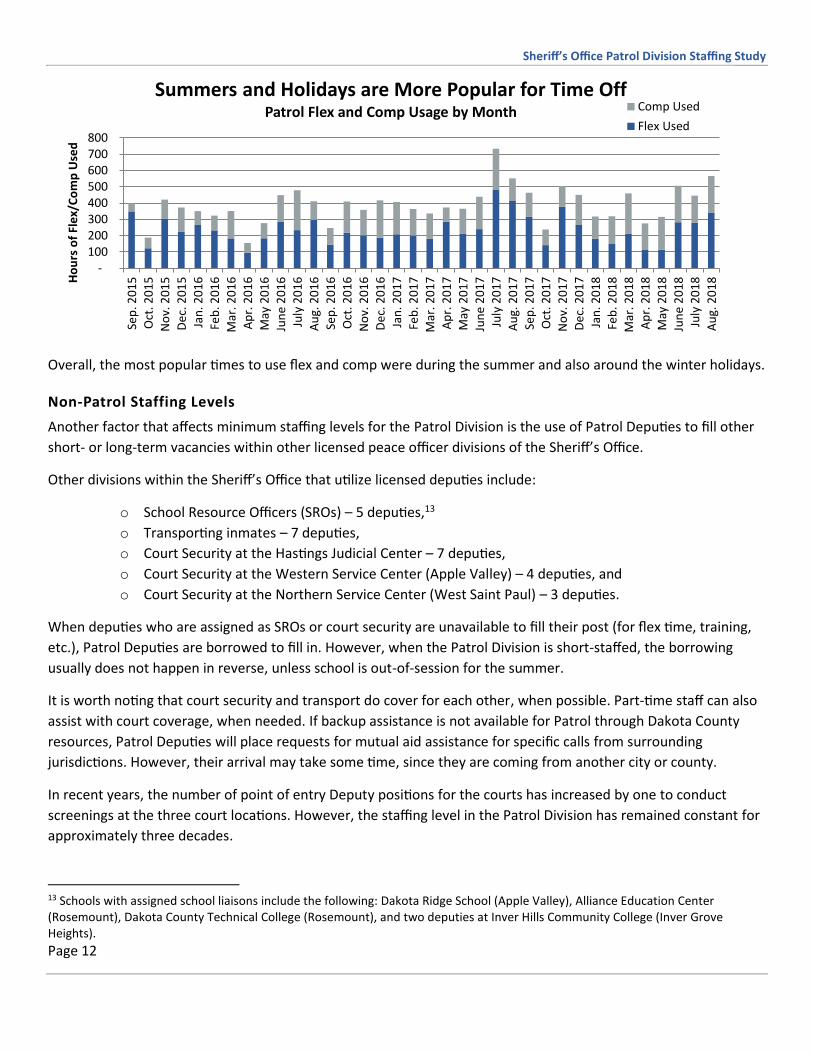
Patrol Deputy Flex and Comp Usage
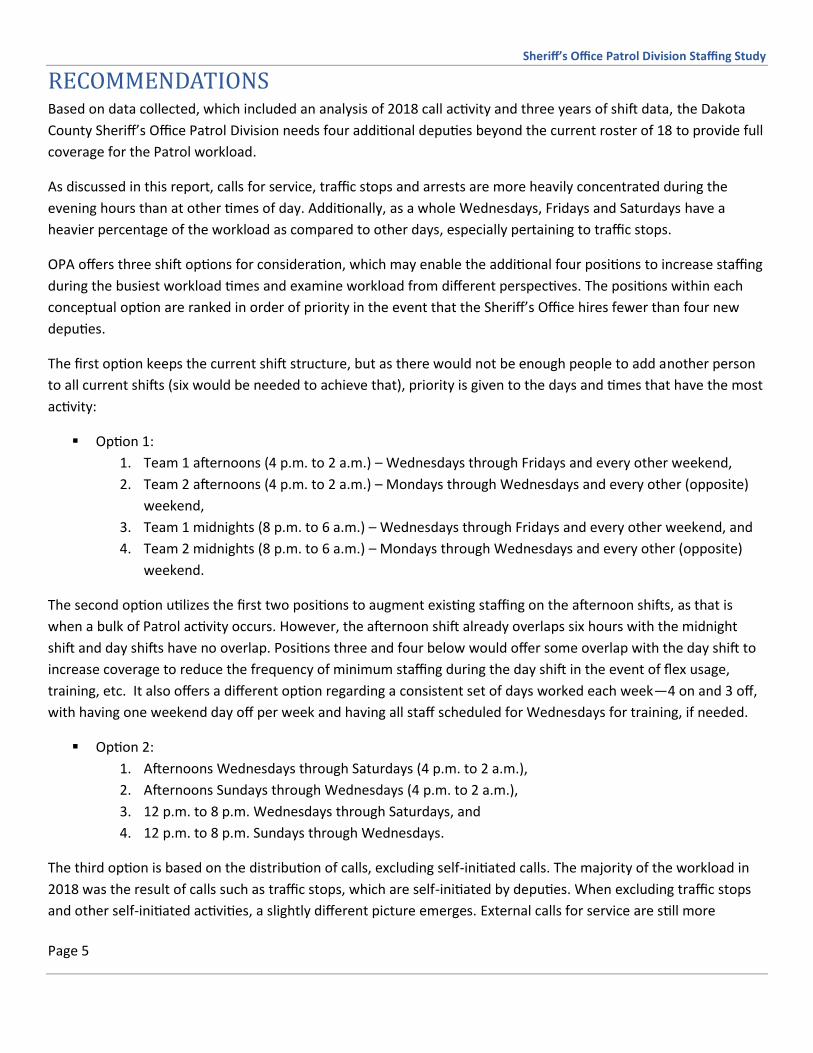
To understand how flex and comp usage for Patrol Deputies may affect shift coverage by month, IT staff provided
shift information for the 18 deputies assigned to Patrol for every shift during the bid year, which runs September
through August. Three bid years of flex and comp usage data were analyzed by month for Patrol Deputies,
represented in the chart below.
11 Individuals who were paid for less than 1560 hours (0.75 FTE) for the year were excluded to avoid skewing the data. 12 For this analysis, General Duty Deputies encompasses Patrol Deputies, as well as deputies who work in other divisions within the Sheriff’s Office. They are all licensed peace officers and the size of the group averaged 38 General Duty Deputies per year.
-
50
100
150
200
250
300
2012 2013 2014 2015 2016 2017 2018
Senior DCSO Staff Take Less Paid Time Off than Junior StaffAverage Number of Hours Out on Paid Leave by Rank
Commander Captain Sergeant Special Duty Deputy General Duty Deputy
Sheriff’s Office Patrol Division Staffing Study
Page 12
Overall, the most popular times to use flex and comp were during the summer and also around the winter holidays.
Non-Patrol Staffing Levels
Another factor that affects minimum staffing levels for the Patrol Division is the use of Patrol Deputies to fill other
short- or long-term vacancies within other licensed peace officer divisions of the Sheriff’s Office.
Other divisions within the Sheriff’s Office that utilize licensed deputies include:
o School Resource Officers (SROs) – 5 deputies,13
o Transporting inmates – 7 deputies,
o Court Security at the Hastings Judicial Center – 7 deputies,
o Court Security at the Western Service Center (Apple Valley) – 4 deputies, and
o Court Security at the Northern Service Center (West Saint Paul) – 3 deputies.
When deputies who are assigned as SROs or court security are unavailable to fill their post (for flex time, training,
etc.), Patrol Deputies are borrowed to fill in. However, when the Patrol Division is short-staffed, the borrowing
usually does not happen in reverse, unless school is out-of-session for the summer.
It is worth noting that court security and transport do cover for each other, when possible. Part-time staff can also
assist with court coverage, when needed. If backup assistance is not available for Patrol through Dakota County
resources, Patrol Deputies will place requests for mutual aid assistance for specific calls from surrounding
jurisdictions. However, their arrival may take some time, since they are coming from another city or county.
In recent years, the number of point of entry Deputy positions for the courts has increased by one to conduct
screenings at the three court locations. However, the staffing level in the Patrol Division has remained constant for
approximately three decades.
13 Schools with assigned school liaisons include the following: Dakota Ridge School (Apple Valley), Alliance Education Center (Rosemount), Dakota County Technical College (Rosemount), and two deputies at Inver Hills Community College (Inver Grove Heights).
- 100 200 300 400 500 600 700 800
Sep
. 20
15
Oct
. 20
15
No
v. 2
01
5
De
c. 2
01
5
Jan
. 20
16
Feb
. 20
16
Mar
. 20
16
Ap
r. 2
01
6M
ay 2
01
6Ju
ne
20
16
July
20
16
Au
g. 2
01
6Se
p. 2
01
6
Oct
. 20
16
No
v. 2
01
6D
ec.
20
16
Jan
. 20
17
Feb
. 20
17
Mar
. 20
17
Ap
r. 2
01
7M
ay 2
01
7
Jun
e 2
01
7Ju
ly 2
01
7
Au
g. 2
01
7
Sep
. 20
17
Oct
. 20
17
No
v. 2
01
7D
ec.
20
17
Jan
. 20
18
Feb
. 20
18
Mar
. 20
18
Ap
r. 2
01
8
May
20
18
Jun
e 2
01
8Ju
ly 2
01
8
Au
g. 2
01
8Ho
urs
of
Fle
x/C
om
p U
sed
Summers and Holidays are More Popular for Time OffPatrol Flex and Comp Usage by Month Comp Used
Flex Used

Sheriff’s Office Patrol Division Staffing Study
Page 13
Other Circumstances that Affect Patrol Deputies
Canine Unit
Within the eighteen Patrol posts, two are allocated to canine duties (one day shift and one afternoon shift),
although only one canine unit is currently active. Canine units conduct patrol just like other deputies, but are called
upon for specialized assistance. The most frequent use is related to suspect tracking. However, if the canine unit is
one of only two units on duty, the canine units cannot be utilized for specialized activities as it would leave a post
unstaffed. In those instances, assistance from Goodhue County or others is requested.
Parks, Lakes and Trails
Additionally, the Parks, Lakes and Trails (PLT) Unit of the Sheriff’s Office performs activities relating to the safety of
Dakota County parks. The PLT Unit is made up of one sergeant, one special duty deputy, and 14 non-licensed park
rangers. As the 14 park rangers are not licensed peace officers, they may occasionally need back up from the Patrol
Division and call on them to assist in those circumstances.
Sheriff’s Office Patrol Division Staffing Study
Page 14
Impact on Patrol Coverage
If patrol staffing is at minimum levels (two deputies plus a sergeant), County coverage is split into two areas
utilizing U.S. Route 52 as the dividing line (East and West). In these instances, deputies try to remain available for
calls in case an emergency or other resource-heavy situation arises. For instance, if an arrest is made, one deputy is
responsible for the arrest and transportation to the jail in Hastings. This process can take several hours before the
deputy is back at their post. While conducting that arrest and booking process, only one deputy plus the sergeant
are available for calls. Therefore, consciously or not, proactive policing is likely reduced when only two deputies are
on duty.
ANALYSIS
Shift Relief Factor
OPA reviewed the potential use of several different staffing models to determine the optimal staffing level for the
Dakota County Sheriff’s Office Patrol Unit.14 Based upon available data, the most useful model is the Shift Relief
Factor. This model is widely utilized by law enforcement, corrections, and manufacturing to assist in determining
the number of full-time equivalents (FTEs) needed to cover a shift every day for one year. 15 OPA used staffing
information provided by the Sheriff’s Office and IT to calculate the Shift Relief Factor for the Patrol Unit. The
formula for Shift Relief Factor is:
𝑆ℎ𝑖𝑓𝑡 𝑅𝑒𝑙𝑖𝑒𝑓 𝐹𝑎𝑐𝑡𝑜𝑟 =(𝑇𝑜𝑡𝑎𝑙 # 𝑜𝑓 𝐻𝑜𝑢𝑟𝑠 𝑅𝑒𝑞𝑢𝑖𝑟𝑒𝑑 𝑡𝑜 𝐶𝑜𝑣𝑒𝑟 𝑂𝑛𝑒 𝑆ℎ𝑖𝑓𝑡 𝑃𝑜𝑠𝑖𝑡𝑖𝑜𝑛 𝐸𝑣𝑒𝑟𝑦 𝐷𝑎𝑦 𝑓𝑜𝑟 𝑂𝑛𝑒 𝑌𝑒𝑎𝑟)
(365 𝑥 𝑆ℎ𝑖𝑓𝑡 𝐿𝑒𝑛𝑔𝑡ℎ) − (𝐴𝑣𝑒𝑟𝑎𝑔𝑒 # 𝑜𝑓 𝐻𝑜𝑢𝑟𝑠 𝑂𝑓𝑓 𝑃𝑎𝑡𝑟𝑜𝑙 𝑝𝑒𝑟 𝐷𝑒𝑝𝑢𝑡𝑦 𝑝𝑒𝑟 𝑌𝑒𝑎𝑟)
In order to utilize the Shift Relief Factor model to determine the appropriate range of deputies for Dakota County,
the Shift Relief Factor range must be multiplied by each Patrol Deputy posting. For patrol purposes, the Sheriff’s
Office has nine postings: three geographic areas with each area having three shifts (day, afternoon, and midnight).
The Shift Relief Factor provides a calculation of the optimal number of deputies needed to fill these nine postings,
taking into account shift length and the number of hours deputies are unavailable because they are either off duty
or busy performing activities in which they cannot respond to calls. Within the formula, the average number of hours
off Patrol per Deputy per year includes:
• regular days off;
• time off duty, including: o comp time used, o flex usage, o holidays, and o leave/light duty; and
• time spent working, but busy performing other activities, such as: o training, o instructing, or o performing non-patrol duties (such as meetings, time spent guarding jail inmates in the hospital,
covering other short-staffed divisions, etc.).
14 Reviews of the advantages and disadvantages associated with various staffing level models is contained in Appendix C. 15 Etico Solutions, Inc. Police Patrol Staffing Study – Madison, WI. July 2008.

Sheriff’s Office Patrol Division Staffing Study
Page 15
To calculate the Shift Relief Factor, OPA analyzed three bid years of payroll data for Patrol staff to determine the
average number of hours each deputy is not available for patrol per year. As mentioned above, the Sheriff’s Office
Patrol Unit operates on a September to August bid year. Data for bid years 2015 through 2018 are aggregated in
the table below.
Total Hours per Year 2015-16 2016-17 2017-18 Three Year
Average
Average # of Hours per
Deputy per Year
Regular Shift Worked 26,701 25,954 25,798 26,151 1,452.82
Regular Days Off (expressed in hours) 28,157 28,157 28,157 28,157 1,564.29
Comp Used 1,399 2,031 2,090 1,840 102.21
Flex Used 2,781 2,972 2,775 2,842 157.90
Holiday-No Work 536 328 408 424 23.56
Leave/Light Duty 146 - - 49 2.70
Off Duty Subtotal 4,862 5,330 5,272 5,155 286.4
Training 3,870 3,802 4,608 4,093 227.39
Instructing 578 612 753 648 35.97
Occupied 2,453 2,232 1,671 2,119 117.70
Busy Subtotal 6,901 6,645 7,032 6,859 381.1
Total Paid Hours 38,463 37,929 38,103 38,165 2,120
Per Deputy (n = 18) 2,137 2,107 2,117 2,120
Total Hours Off Patrol for Whole Patrol Unit 39,919 40,132 40,461 40,171
Average # of Hours Off Patrol per Deputy 2,218 2,230 2,248 2,232
Shift Relief Factor (SRF) 2.55 2.57 2.60 2.57
SRF times 9 posts = optimal number of deputies 22.94 23.13 23.43 23.16
Utilizing payroll information for the deputies assigned to Patrol over the three bid years, the Shift Relief Factor is
calculated to range from 2.55 to 2.6, with an average of 2.57. This number is multiplied by nine postings to get an
ideal number of 23 deputies to fully staff the Patrol Unit. However, while this formula calculated that the ideal
Sheriff’s Office Patrol Division Staffing Study
Page 16
number of deputies to cover these postings is 23, we anticipate that the total number of comp hours worked and
which are redeemed for time off at a rate of 1.5 times the number of hours worked would decrease with the
addition of new deputies. Ultimately, we anticipate that if four new Patrol Deputies are hired, total comp time
would decrease which would reduce the Shift Relief Factor and likely result in an optimal number closer to 22
deputies.
Additionally, the Shift Relief Factor does not include overtime worked in the formula, because it does not directly
affect those shifts that deputies are scheduled to work. However, this data does provide additional information
about the extra hours that deputies are working beyond their normal shifts. The aggregated overtime hours
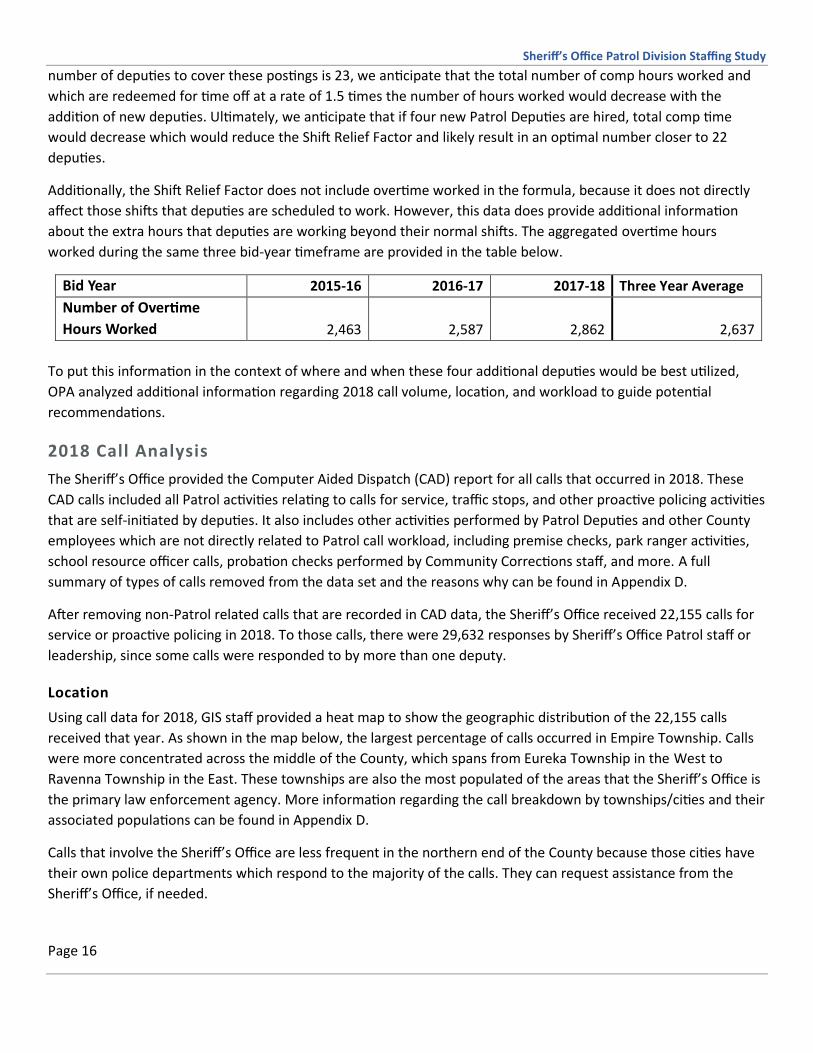
worked during the same three bid-year timeframe are provided in the table below.
Bid Year 2015-16 2016-17 2017-18 Three Year Average
Number of Overtime
Hours Worked 2,463 2,587 2,862 2,637
To put this information in the context of where and when these four additional deputies would be best utilized,
OPA analyzed additional information regarding 2018 call volume, location, and workload to guide potential
recommendations.
2018 Call Analysis
The Sheriff’s Office provided the Computer Aided Dispatch (CAD) report for all calls that occurred in 2018. These
CAD calls included all Patrol activities relating to calls for service, traffic stops, and other proactive policing activities
that are self-initiated by deputies. It also includes other activities performed by Patrol Deputies and other County
employees which are not directly related to Patrol call workload, including premise checks, park ranger activities,
school resource officer calls, probation checks performed by Community Corrections staff, and more. A full
summary of types of calls removed from the data set and the reasons why can be found in Appendix D.
After removing non-Patrol related calls that are recorded in CAD data, the Sheriff’s Office received 22,155 calls for
service or proactive policing in 2018. To those calls, there were 29,632 responses by Sheriff’s Office Patrol staff or
leadership, since some calls were responded to by more than one deputy.
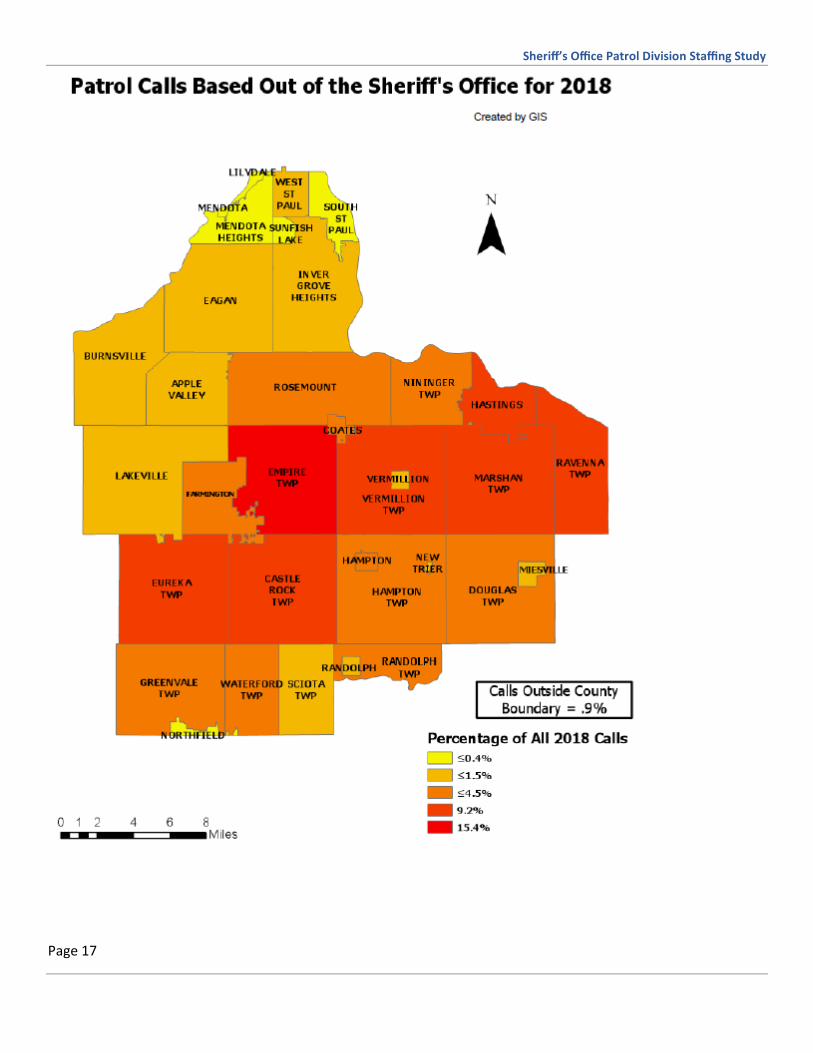
Location
Using call data for 2018, GIS staff provided a heat map to show the geographic distribution of the 22,155 calls
received that year. As shown in the map below, the largest percentage of calls occurred in Empire Township. Calls
were more concentrated across the middle of the County, which spans from Eureka Township in the West to
Ravenna Township in the East. These townships are also the most populated of the areas that the Sheriff’s Office is
the primary law enforcement agency. More information regarding the call breakdown by townships/cities and their
associated populations can be found in Appendix D.
Calls that involve the Sheriff’s Office are less frequent in the northern end of the County because those cities have
their own police departments which respond to the majority of the calls. They can request assistance from the
Sheriff’s Office, if needed.
Sheriff’s Office Patrol Division Staffing Study
Page 17

Sheriff’s Office Patrol Division Staffing Study
Page 18
Time of Day
To understand call distribution throughout the day, OPA analyzed the 2018 calls for service for by call hour, with
the results shown in the chart below. As a whole, the least busy times in terms of number of calls, occur from 2:00
a.m. to 8:00 a.m. The busiest time of the day, as a whole, occurs from 9 p.m. to midnight.
Additional information about calls, including time by day of week, is broken down in Appendix D. Overall,
Wednesdays, Fridays, and Saturdays are the busiest evenings for calls. However, the nature of having more staff on
Wednesday evenings may again play a role in the spike of calls on that night of the week, since additional deputies
are on the roads.
Day of Week and Month
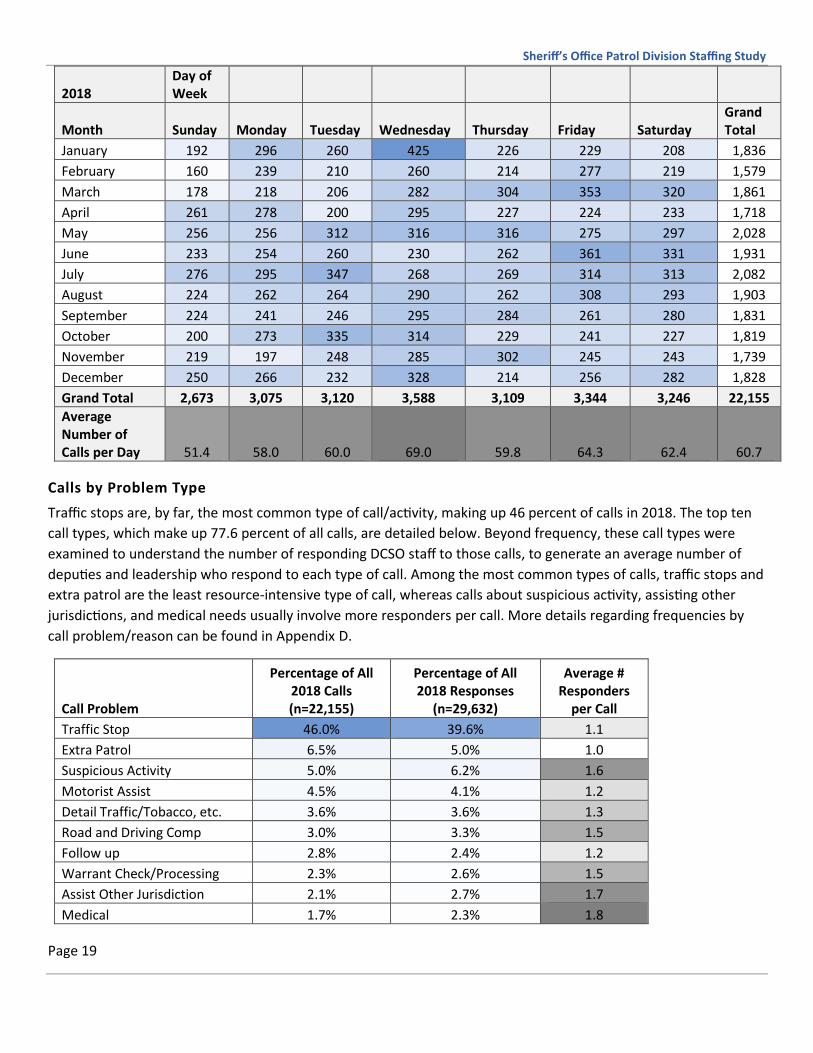
Calls were analyzed by distribution for day of week and month. As shown in the following table, Wednesdays are
the most common day for calls and Sundays were the least common. However, the information below should also
be considered in the context of the 2018 calendar. For instance, there were five Wednesdays in January in 2018,
which likely contributed to the high call frequency (425) on Wednesdays that month compared to other months. It
is also possible that Wednesdays are impacted by team schedules overlapping, with all deputies scheduled to work
each Wednesday, as calls include self-initiated calls such as traffic stops.
For context, the bottom row in the table shows the average number of calls per day of week in 2018, which ranged
from a low of 51.4 on Sundays to a high of 69.0 on Wednesdays.
0.00%
2.00%
4.00%
6.00%
8.00%
10.00%
Pe
rce
nta
ge o
f To
tal 2
01
8 C
alls
Time of Day
Calls are Most Common During Evenings2018 Calls by Time of Day
Sheriff’s Office Patrol Division Staffing Study
Page 19
2018 Day of Week
Month Sunday Monday Tuesday Wednesday Thursday Friday Saturday Grand Total
January 192 296 260 425 226 229 208 1,836
February 160 239 210 260 214 277 219 1,579
March 178 218 206 282 304 353 320 1,861
April 261 278 200 295 227 224 233 1,718
May 256 256 312 316 316 275 297 2,028
June 233 254 260 230 262 361 331 1,931
July 276 295 347 268 269 314 313 2,082
August 224 262 264 290 262 308 293 1,903
September 224 241 246 295 284 261 280 1,831
October 200 273 335 314 229 241 227 1,819
November 219 197 248 285 302 245 243 1,739
December 250 266 232 328 214 256 282 1,828
Grand Total 2,673 3,075 3,120 3,588 3,109 3,344 3,246 22,155
Average Number of Calls per Day 51.4 58.0 60.0 69.0 59.8 64.3 62.4 60.7
Calls by Problem Type
Traffic stops are, by far, the most common type of call/activity, making up 46 percent of calls in 2018. The top ten
call types, which make up 77.6 percent of all calls, are detailed below. Beyond frequency, these call types were
examined to understand the number of responding DCSO staff to those calls, to generate an average number of
deputies and leadership who respond to each type of call. Among the most common types of calls, traffic stops and
extra patrol are the least resource-intensive type of call, whereas calls about suspicious activity, assisting other
jurisdictions, and medical needs usually involve more responders per call. More details regarding frequencies by
call problem/reason can be found in Appendix D.
Call Problem
Percentage of All 2018 Calls (n=22,155)
Percentage of All 2018 Responses
(n=29,632)
Average # Responders
per Call
Traffic Stop 46.0% 39.6% 1.1
Extra Patrol 6.5% 5.0% 1.0
Suspicious Activity 5.0% 6.2% 1.6
Motorist Assist 4.5% 4.1% 1.2
Detail Traffic/Tobacco, etc. 3.6% 3.6% 1.3
Road and Driving Comp 3.0% 3.3% 1.5
Follow up 2.8% 2.4% 1.2
Warrant Check/Processing 2.3% 2.6% 1.5
Assist Other Jurisdiction 2.1% 2.7% 1.7
Medical 1.7% 2.3% 1.8

Sheriff’s Office Patrol Division Staffing Study
Page 20
Time-Consuming Calls
Certain types of calls are more time-consuming due to the complexity of the situation, the severity of offense and
required follow-up. These include calls that involve car crashes and interactions that result in an arrest. The
following time-consuming calls were reviewed for historical frequency: Part I crimes16, Part II crimes17, arrests, car
crashes, and DWIs. The eight year timeframe of 2011 to 2018 was utilized, since all five types of calls had data
readily available for review through the Federal Bureau of Investigation’s Uniform Crime Report.
For all five types of time consuming calls, the eight year timeframe illustrates either a decreasing or nearly flat
trend line, as illustrated in the charts below.
It is also worth noting that, except for arrests, the 2018 totals were less than the average for the previous seven
years.
Average
2011-2017 2018
Part I 215 162
Part II 811 759
DWI 139 123
Crashes 247 194
Arrests 559 586
The Sheriff’s Office indicated that they have experienced a rise in time-consuming calls resulting from mental
health crises. Due to the amount of information shared by the 911 caller and the potentially evolving nature of
16 Part I crimes include forcible rape, robbery, aggravated assault, burglary (breaking or entering), larceny, motor vehicle theft, and arson. Source:
FBI. https://ucr.fbi.gov/crime-in-the-u.s/2011/crime-in-the-u.s.-2011/offense-definitions. Website accessed on 01/31/19. 17 Part II crimes include other assaults (simple), forgery and counterfeiting, fraud, embezzlement, stolen property, vandalism, weapons, prostitution and commercialized vice, sex offenses (except forcible rape, prostitution, and commercialized vice), drug abuse violations, gambling, offenses against the family and children, driving under the influence, liquor laws, drunkenness, disorderly conduct, vagrancy, and all other offenses (expect traffic violations). Source: FBI. Ibid.
0
200
400
600
800
1000
1200
2011 2012 2013 2014 2015 2016 2017 2018
Part I and Part II CrimeTrendlines
Part I Part II
0
200
400
600
800
2011 2012 2013 2014 2015 2016 2017 2018
Arrests, Crashes, and DWITrendlines
DWI Crashes Arrests

Sheriff’s Office Patrol Division Staffing Study
Page 21
situations, call data does not capture any mental health calls that were not apparent when dispatched. As such,
there is, unfortunately, insufficient/incomplete data concerning calls involving mental health issues.
Evaluating Stress and Safety
Law Enforcement Stressor Literature Review
Law enforcement work is often categorized as psychologically stressful, including high demands, unpredictable
encounters, and traumatic situations.18 During a literature review of the stressors associated with law
enforcement, factors contributing to stress levels were often divided into two types: organizational stressors not
associated directly with law enforcement work, and operational stressors relating to specific encounters.19
Examples of organizational stressors include the demands of work impinging upon home life, lack of consultation
and communication, inadequate support, lack of control over workload, and excessive workload in general.
Organizational issues can specifically impact law enforcement personnel stress levels through excessive overtime,20
excessive workload, and inadequate staff.21
Examples of operational stressors include items such as interactions with someone who is drunk/belligerent, verbal
and physical aggression from the public, having to use force to restrain, and the potential unpredictability of
situations when responding to calls. Operational circumstances potentially impacting patrol deputy stress levels
include too few officers available to handle patrol functions22 and working alone at night without support of an
immediate backup.23
Together organizational and operational stressors can negatively impact employees in the form of physical health
problems, as well as personal challenges such as high divorce rates, alcoholism, post-traumatic stress, and job
performance issues.24
18 University of Buffalo. “Impact of Stress on Police Officers’ Physical and Mental Health.” Science Daily. www.sciencedaily.com. September 29,
2008. Website accessed on August 5, 2019.
19 Collins, P.A. and A.C.C. Gibbs. “Stress in police officers: a study of the origins, prevalence and severity of stress-related symptoms within a county
police force.” Occupational Medicine. 2003.
20 National Institute of Justice. “Officer Work Hours, Stress and Fatigue.” NIJ.gov. August 2012.
21 Zhao, Jihong “Solomon.” University of Nebraska at Omaha. “Predicting Five Dimensions of Public Officer Stress: Looking More Deeply Into
Organizational Settings for Sources of Public Stress.” Police Quaterly. March 2002.
22 Ayers, Richard M. The National Sheriffs’ Association. “Preventing Law Enforcement Stress: The Organization’s Role.” October 1993.
23 University of Buffalo. “Impact of Stress on Police Officers’ Physical and Mental Health.” Science Daily. www.sciencedaily.com. September 29,
2008. Website accessed on August 5, 2019.
24 Ayers, Richard M. The National Sheriffs’ Association. “Preventing Law Enforcement Stress: The Organization’s Role.” October 1993.
Sheriff’s Office Patrol Division Staffing Study
Page 22
Where overtime or staffing shortages are referenced, these issues contribute toward stress within law
enforcement. As with any stressor, actions taken to help address those items, whether real or perceived, may help
reduce deputy-related stress.25
25 Ayers, Richard M. The National Sheriffs’ Association. “Preventing Law Enforcement Stress: The Organization’s Role.” October 1993.

Sheriff’s Office Patrol Division Staffing Study
Page 23
Employee Opinion Survey26
In order to review stress levels impacting Dakota County Patrol Deputies in particular, as well as their impression of
employee safety, OPA reviewed available employee survey information.
The Dakota County Employee Relations (ER) Department conducts the Employee Opinion Survey (EOS) every three
years. The survey is distributed to all Dakota County employees. The survey was most recently conducted in April
2019 and contained 69 questions grouped into twelve categories.27 Patrol Deputy responses are included within
the overall Sheriff’s Office totals. As a whole, the Sheriff’s Office employee response rate in 2019 was slightly lower
than the overall County response rate with 63 percent for the Sheriff’s Office compared to 67 percent Countywide.
Respondents are asked to use a five-point agree/disagree scale. OPA staff selected several questions that they felt
would provide the most value in the context of understanding the stress levels of Dakota County Patrol Deputies,
compared to other County staff:
2. At work, I have the opportunity to do what I do best.
3. I am satisfied with the level of challenge I’m offered.
9. I am satisfied with the physical working conditions in my area.
12. I believe the workload in my department is appropriately assigned.
13. I feel that the stress levels in my work unit are acceptable.
51. I am treated with respect at work.28
All five of these questions were asked in each version of the EOS (2013, 2016, and 2019).
With the exception of question 9, regarding satisfaction with physical working conditions, all of the selected
questions saw increased percentages of employees who agreed with the statement from 2013 through 2019.
Question 9 had a decrease in the percentage of employees who agreed with the statement in the Sheriff’s Office
from 2013 (69 percent) to 2019 (61 percent). It is worth noting that this trend also applied to employees
Countywide. From 2013 to 2019, the percentage of all employees who agreed with question 9 decreased from 70
percent to 66 percent.
The majority of Sheriff’s Office employees agreed with all of the selected questions, with the exception of question
12 regarding assignment of workload—in 2019, fifty percent of all DCSO staff who responded agreed with the
statement “I believe the workload in my department is appropriately assigned.”
26 Additional details regarding the Employee Opinion Survey are included within Appendix E. 27 Clear Objective & Purpose, Inclusion & Fairness, The Work Itself, Supervision Effectiveness, Workplace Culture, Staff Recognition, Workload & Resources, Leadership, Learning & Career Development, Communication, Values, and General Satisfaction. 28 EOS Question 51 regarding “respect at work” is included within the internal “Inclusion and Fairness” portion of the survey. As a result, responses may more closely reflect internal working conditions, rather than issues of respect experienced by Patrol Deputies, while in the field.

Sheriff’s Office Patrol Division Staffing Study
Page 24
EMPLOYEE OPINION SURVEY – INTERPRETATION
Overall, the stress-related questions within the Employee Opinion Survey for the Sheriff’s Office were very
favorable. These results are inconsistent with the anecdotal impression of high stress levels among Patrol Deputies.
Several possibilities exist to help explain this inconsistency:
1) Since the results represent the Sheriff’s Office as a whole, non-Patrol employees may have affected the
overall survey results of the Office.
2) The lower Sheriff’s Office survey response rate (63 percent compared with 67 percent Countywide) may
have influenced questions pertaining to job stressors.
3) It is unclear how many Patrol staff completed the survey, so it is possible that they are not well
represented in the results.
Workplace Climate Survey
Since 2003, the Workplace Climate Survey has been conducted each year, with half of employees taking the survey
during the first six months of the year, then the other half taking the survey during the last six months of the year.
Scoring is based on a five point scale with a score of 5 being “Strongly Agree” and 1 being “Strongly Disagree.” The
survey considers all Sheriff’s Office employees in a single score and does not separate out the Patrol Division.
Of the 14 questions asked in the survey, the following two items may have value for reviewing workplace stressors:
3. I know what actions to take and where to go when there is a personal safety threat at work.
11. My fellow employees are committed to doing quality work.
For question 3 concerning personal safety threats at work, the 2018 Sheriff’s Office score was a positive response
of 4.3, which falls between Agree (4) and Strongly Agree (5).
Question number 11 addresses the quality of work by co-workers, which could also be a stressor. The Sheriff’s
Office response for question 11 was 3.58, the lowest of any division, falling between Neutral (3) and Agree (4).
Although no specific question appears to address stressors specific to Patrol Deputies, the overall nature of the
survey provides some indication of job satisfaction.
From 2014 to 2018, the overall level of agreement within the Workplace Climate Survey for the Sheriff’s Office has
stayed nearly the same— 3.7 in 2008 compared to 3.8 in 2018.
WORKPLACE CLIMATE SURVEY – INTERPRETATION
The question which most closely reflects stressors related to Patrol Deputies, question 3 regarding personal safety
threats, indicates a positive score of 4.3. Given that the score reflects the entire Sheriff’s Office, it is not possible to
determine if the scores from Patrol Deputies differ from other employees in the Sheriff’s Office.
Sheriff’s Office Patrol Division Staffing Study
Page 25
DISCUSSION For approximately three decades, the Sheriff’s Office Patrol Unit has operated with eighteen licensed deputies.
During that time, the population of Dakota County has increased by more than 50 percent. The majority of that
growth has occurred in the urban areas of the County. However, rural areas—those where the Sheriff’s Office is the
primary law enforcement agency—have also grown by 22 percent, or 3,319 residents.
In recent years, the Sheriff’s Office has experienced staffing challenges to maintain minimum staffing of at least two
deputies during each shift. The current shift structure schedules three deputies per shift, with the exception of
Wednesdays, when six deputies are scheduled for each shift. However, in recent bid years, the amounts of time
spent training/instructing and comp time used have increased. Training is necessary to maintain credentials and
increase safety both for deputies and the public, but it does create a burden on shift coverage. From the 2015-16
bid year to the 2017-18 bid year, comp time used increased by nearly half. Furthermore, deputies have consistently
worked more overtime hours per year than a full-time equivalent staff, averaging 2,637 overtime hours worked
compared to the FTE figure of 2,088 hours per year. As overtime and comp time occur when the Sheriff’s Office
needs staff to work beyond their scheduled hours, and are paid/accrued at a rate of one-and-a-half times the
number of hours worked, this increase indicates that the existing complement of deputies is not large enough to
perform all necessary duties.
The Shift Relief Factor model supports this conclusion. Using three-years of staffing data and the Shift Relief Factor
formula, which is commonly used by law enforcement and other industries to determine the appropriate number
of staff needed, indicates that the twenty-two to twenty-three deputies would be an appropriate staffing
complement for the Patrol Division. If four new deputies are hired, bringing the total to twenty-two, OPA
anticipates that the total number of comp and overtime hours would decrease, which would reduce the impact of
comp usage on shift coverage.
Patrol call data from 2018 indicates that calls are most frequent during the evening hours on Wednesdays, Fridays,
and Saturdays. While this data includes calls for service and self-initiated calls such as traffic stops, calls were
separated into two different groups to determine how traffic stops impact overall calls, particularly on Wednesdays
when shifts are scheduled to be double-staffed. These tables can be found in Appendix D. Traffic stops do account
for the increase in calls on Wednesday, Friday, and Saturday evenings. However, when excluding traffic stops to
look at the distribution of all other calls by day of the week and time of day, more calls for service occur during the
evening hours than at other times of day.
Furthermore, calls that ended in arrest were examined by time and day, as these calls are more likely to take a
disproportionate amount of time as compared to other calls. Calls ending in arrest may take several hours from
start to finish, involving one deputy transporting the arrestee to jail in Hastings, booking into the jail, and driving
back to their post. In 2018, 51 percent of the calls that ended in an arrest occurred between the hours of 8:00 p.m.
to 2:00 a.m.
One contributing factor for the increased activity from 8 p.m. to 2 a.m. is that the afternoon and midnight shifts
overlap during these exact hours, which may allow for more proactive policing activities. Even if this plays a role,
arrests are more likely during these hours which affect coverage for the other deputies on duty while the arresting

Sheriff’s Office Patrol Division Staffing Study
Page 26
deputy conducts the transportation and follow-up activities. Furthermore, arrests can be an extremely dangerous
time for the arresting deputy and back-up is always preferable, but requires enough available staff to do so.
Taking the Shift Relief Factor and 2018 call data into account, data supports the Sheriff’s Office hiring four new
deputies into the Patrol Division, bringing the total to twenty-two deputies. Based on the time distribution of calls,
an option to consider would be to add additional positions to the afternoon shift (4:00 p.m. to 2:00 a.m.). Call data
indicates that Wednesdays through Saturdays were the busiest days in terms of 2018 Patrol activity. As deputies
are added, these days may benefit from additional Patrol coverage.
Using the information discussed throughout this report, OPA offers three different shift options for the additional
four positions that would increase staffing for the busiest workload times. For each option, the positions to be
added are ranked in order of priority if the Sheriff’s Office hires fewer than four new deputies.
The first option keeps the current shift structure, but as there would not be enough people to add another person
to all current shifts (six would be needed to achieve that), priority is given to the days and times that have the most
activity:
▪ Option 1:
1. Team 1 afternoons (4 p.m. to 2 a.m.) – Wednesdays through Fridays and every other weekend,
2. Team 2 afternoons (4 p.m. to 2 a.m.) – Mondays through Wednesdays and every other (opposite)
weekend,
3. Team 1 midnights (8 p.m. to 6 a.m.) – Wednesdays through Fridays and every other weekend, and
4. Team 2 midnights (8 p.m. to 6 a.m.) – Mondays through Wednesdays and every other (opposite)
weekend.
The second option utilizes the first two positions to augment existing staffing on the afternoon shifts, as that is
when a bulk of Patrol activity occurs. However, the afternoon shift already overlaps six hours with the midnight
shift and day shifts have no overlap. Positions three and four below would offer some overlap with the day shift to
increase coverage to reduce the frequency of minimum staffing during the day shift in the event of flex usage,
training, etc. It also offers a different option regarding a consistent set of days worked each week—4 on and 3 off,
with having one weekend day off per week and having all staff scheduled for Wednesdays for training, if needed.
▪ Option 2:
1. Afternoons Wednesdays through Saturdays (4 p.m. to 2 a.m.),
2. Afternoons Sundays through Wednesdays (4 p.m. to 2 a.m.),
3. 12 p.m. to 8 p.m. Wednesdays through Saturdays, and
4. 12 p.m. to 8 p.m. Sundays through Wednesdays.
The third option is based on the distribution of calls, excluding self-initiated calls. The majority of the workload in
2018 was the result of calls such as traffic stops, which are self-initiated by deputies. When excluding traffic stops
and other self-initiated activities, a slightly different picture emerges. External calls for service are still more
concentrated during each evening hour. However, the day shift could benefit from additional coverage, particularly

Sheriff’s Office Patrol Division Staffing Study
Page 27
since that shift does not have any double-coverage times whereas the afternoon and evening shifts overlap from 8
p.m. to 2 a.m. The third option provides additional coverage to the day shift.
▪ Option 3:
1. Team 2 days (6 a.m. to 4 p.m.) – Mondays through Wednesdays and every other (opposite)
weekend.
2. Team 1 days (6 a.m. to 4 p.m.) – Wednesdays through Fridays and every other weekend,
3. Team 2 afternoons (4 p.m. to 2 a.m.) – Mondays through Wednesdays and every other weekend,
and
4. Team 1 afternoons (4 p.m. to 2 a.m.) – Wednesdays through Fridays and every other (opposite)
weekend.
By adding four additional deputies, the Sheriff’s Office will reduce the frequency of minimum Patrol staffing, which
would likely decrease the amount of comp and overtime needed. It would also increase the ability to provide
backup to others and proactive policing. Together these factors will contribute toward making the Patrol Division
and Dakota County residents safer.

Sheriff’s Office Patrol Division Staffing Study
Page 28
APPENDIX A: PROJECT SCOPE
January 2019 Final Patrol Staffing Study Project Scope Statement
Prepared by: OPA and ER
Project Background (WHY) History Dakota County’s Patrol Division has operated with the same number of full-time equivalent deputies without a formal review of patrol staffing levels for approximately thirty years. Over that same time period, the County has experienced growth and a variety of Sheriff’s Office initiatives have been implemented, which typically require more trained staff to implement. The Patrol Division frequently operates at minimum staffing levels, which creates challenges when responding to calls for mutual aid by local police departments, during normal traffic stops, or processing violations. Staffing levels are also challenged by typical personnel needs, such as time off or training. By conducting a staffing study, the Patrol Division will have an overview of their current staffing, as well as potential staffing alterations, based upon a review of available data, various association standards, and outside peer models.
Purpose/Deliverables/Outcomes (WHAT) Statement of Purpose Evaluate the patrol deputy staffing levels to determine whether they meet needs and how they compare to available standards. Deliverables and format The primary deliverable will be a report/memo that overviews current staffing and scheduling of Patrol Deputies, as well as recommendations for potential improvements, if warranted. Parameters (inclusion/exclusion) Inclusions
• Review of issues impacting patrol deputy staffing levels.
• Brief summarization of current staffing practices (i.e. geographical coverage within the County, response procedures, etc.).
• Brief summarization of potential benefits/issues resulting from current patrol staffing levels.
• Consider non-patrol deputy staffing levels, only in terms of their interaction with patrol staffing (e.g. court duty, school resource officers, etc.).
Sheriff’s Office Patrol Division Staffing Study
Page 29
• Consideration of various programs that utilize deputies from the Patrol Division (e.g. canine patrol officers).
• Review of staffing levels and approaches based upon available standards and peer models (cities with similar coverage features such as Hastings and counties such as Washington).
Exclusions
• Review of the Patrol Division command structure (i.e. sergeants and other primarily administrative positions).
• Isolated review of non-patrol deputy staffing levels. Constraints Availability of aggregate data (e.g. times of year most frequently impacted by minimum staffing, response times, etc.). Success measure Completion of a staffing study that evaluates the Patrol Division, which details the reasons why changes to Patrol staffing should be considered or not.
Process/Methodology/Resources (HOW) Guiding questions
1. Is the Patrol Division adequately staffed? 2. What standards exist to provide guidance for minimum staffing levels? 3. What are the advantages and disadvantages of the various standards (staffing levels based on call
volume or population, associate standards such as the Police Executive Research Forum (PERF), etc.)?
4. What internal activities impact staffing levels and distribution (i.e. training, Sheriff’s Office initiatives, employee leaves/vacations, etc.)?
5. What external activities impact staffing levels and distribution (i.e. mutual aid requests)? 6. What measures are available to evaluate performance (i.e. response times, call volumes by area and
time, traffic counts, etc.)? 7. What options are available utilizing existing staffing levels (differing staffing structures, shift
distributions, team structure, shift scheduling software, etc.)? 8. How would circumstances change with alterations to staffing/coverage? Anticipated benefits?
Disadvantages? 9. How much time is spent by leadership to rearrange schedules to meet mandatory minimum staffing
levels? 10. How has policing workload changed (i.e. are there more mental health/mutual aid/other types of calls
that would necessitate more available Patrol Deputies)? Methodology
• Key Person interviews.
• Review of existing schedules, staffing levels, contract provisions, safety protocols, and past scheduling formats.
• Review of applicable standards and peer staffing models.
• Analyze anticipated impact of changes in staffing model, if changes are recommended. Requested resources (OPA or ER) OPA – Staff to research issue, draft report, and provide recommendations. ER – Staff resources to support project and provide applicable data, if available and needed.

Sheriff’s Office Patrol Division Staffing Study
Page 30
Department provided resources (Sheriff’s Office) Sheriff’s Office – Staff assistance to gather background information and data.
Project Team and Audience (WHO) Project Sponsor Joe Leko, Chief Deputy Sheriff Team Members Richard Schroeder, Captain (Resources and Coordination) Robert Shingledecker, Sergeant (History and Background) Additional Patrol Sergeants (as needed) Steve Anderson, Program Administration Supervisor (Data Resources) Audience (beyond Project Sponsor and Team Members) Sheriff’s Office County Administration Board of County Commissioners
Timeline (WHEN)
Task Staff Timeline
Project reviewed by Measure & Improve and SLT
Measure & Improve; SLT
November 2018
Request and compile initial information
OPA, ER, Sheriff’s Office
January-March 2019
Best practices research regarding patrol staffing models/standards
OPA January – February 2018
Summarize current state of Patrol Division, including historical overview and existing data (response times, etc.)
OPA with support from Sheriff’s Office and ER
March-May 2019
Draft initial topic areas for recommendations
OPA June 2019
Project Mid-Point Meeting to Revisit Purpose/Deliverables/Outcomes
OPA, ER, Sheriff’s Office
June 2019
Author first draft of report, including recommendations
OPA with support from Sheriff’s Office and ER
June-July 2019
Present draft report findings and receive feedback
OPA August 2019
Prepare report revisions, per draft report feedback
OPA September 2019
Provide final report OPA October 2019
_________________________ Joe Leko, Chief Deputy Sheriff Date: ____________________

Sheriff’s Office Patrol Division Staffing Study
Page 31
APPENDIX B: PATROL DIVISION ORGANIZATIONAL CHART
County Sheriff
Chief Deputy Sheriff
Commander
Captain
Sergeant Sergeant
Sergeant Sergeant
3 General Duty Deputies
3 General Duty Deputies
3 General Duty Deputies
3 General Duty Deputies
Sergeant Sergeant
3 General Duty Deputies
3 General Duty Deputies

Sheriff’s Office Patrol Division Staffing Study
Page 32
APPENDIX C: POLICE STAFFING LEVEL MODELS The following models are frequently utilized by municipalities to review law enforcement staffing levels. A brief
summary of each model is provided, as well as the advantages and disadvantages to the various approaches.29
1) Population Ratios – Evaluation of the officer-to-population ratio (sworn officers per 1,000 citizens).30
Advantages – Utilizes easily accessible data and can be produced with minimal work. It provides for easy
comparisons between jurisdictions.
Disadvantages – Does not account for other factors, such as crime rates, community expectations,
geographic size, and workday population. Also, no national standard exists for officer-per-capita needs.
2) Benchmarking – Comparisons with one or more “similar” agencies, in order to evaluate staffing levels.
Advantages – Attempts to reduce errors associated with officer-to-population ratios, by limiting
comparisons to similar jurisdictions.
Disadvantages – It is difficult to find truly similar jurisdictions, unless a focus is placed on a small number of
variables, such as population and crime rate. The model fails to consider agency philosophies and their
impact on staffing (i.e. agencies focusing on community policing have higher staffing needs). There is also
no way to determine if the peer communities are appropriately staffed.
3) Crime Trends – Determine the level of staffing based on crime rate.
Advantages – Linked to the goal of crime reduction.
Disadvantages – Does not consider the costs or side effects of utilizing staffing levels to address crime rates.
It provides a disincentive for good performance and ignores law enforcement activities unrelated to crime.
4) Minimum Staffing – Determination of staffing levels based upon a predetermined minimum.
Advantages – Incorporates past practices, supervisory judgement, and collective bargaining agreements.
Disadvantages – Establishes an artificial minimum based upon factors other than need and workload.
5) Budget – Staffing levels based on available funding.
Advantages – It is common for available funding to determine staffing levels.
Disadvantages – Artificially creates the impression of over or understaffing based upon an authorized
number.
29 Madison, Wisconsin. “Police Staffing Report.” November 8, 2016. 30 Maciag, Mike. “How Many Police Officers Does a City Need?” www.governing.com. October 20, 2016.

Sheriff’s Office Patrol Division Staffing Study
Page 33
6) Workload (Performance-Based Approach31) – Utilizes officer workload data to determine staffing needs.
Advantages – Data centered process that focuses on the jurisdiction in question and provides a specific
result. The approach considers a deputy’s actual workload, as well as how much time is allotted for
discretionary activities and other time commitments.32 Approach is endorsed by ICMA (International
City/County Managers Association).
Disadvantages – It is a labor intensive approach, which requires available data. Actual calculations vary and
are difficult to locate. Dakota County lacks sufficient data to pursue this approach.
7) Shift Relief Factor – Frequently partnered with a workload analysis, the Shift Relief Factor considers how many
FTEs are needed to cover a shift.
Advantages – Model is widely utilized and frequently found in law enforcement, corrections, and
manufacturing. Approach considers the impact of time off on the ability to cover shifts. Dakota County has
the minimum amount of data available to utilize this approach.
Disadvantages – Requires consideration of all types of time off patrol duties, including regular days off,
leave time, and training. Model only speaks to the ability to cover shifts and not to whether a shift structure
is appropriate. Model would require additional review of items such as geographic coverage and the timing
of shifts.
31 Maciag, Mike. “How Many Police Officers Does a City Need?” www.governing.com. October 20, 2016. 32 Center for Public Safety Management (CPSM). “Officers per thousand and other deployment myths.” www.cpsm.us. September 9, 2014.

Sheriff’s Office Patrol Division Staffing Study
Page 34
APPENDIX D: 2018 CALL ANALYSIS
Methodology In 2018, the Sheriff’s Office recorded 47,381 activities in the Computer Aided Dispatch program. The DCSO
provided OPA with each month’s report CAD report of activities, which was combined into one dataset for 2018.
Following conversations with the DCSO project team, they indicated that the CAD reports contained a variety of
activities that should be removed from the dataset as they are not performed by Patrol staff during the normal
course of their patrol work. As a result, OPA removed 17,749 responses from the dataset. Calls were then analyzed
to understand the number of responders per call, day and time, problem type, and location.
# of Responses
Removed
Removal Reason
13,028 Premise Checks – incorporated into Patrol workload when they are not otherwise busy.
3,096 Located at parks and responded to by Parks, Lakes and Trails staff.
685 Located at the four schools that DCSO has School Resource Officers and were responded to
by those SROs.
472 Toward Zero Deaths traffic stops performed by Patrol staff, who work shifts beyond their
standard schedule for overtime or comp time.
250 Probation Checks – performed by Community Corrections staff, not DCSO.
218 Performed by non-Patrol DCSO staff or missing date/time information.
17,749 Total Removed
Total Dakota County Responses Removed Number of DCSO Patrol Responses
47,381 17,749 29,632
2018 Calls by Month and Number of DCSO Patrol Staff who Responded
Number of Calls by the Number of Responding DCSO Patrol Staff
1 2 3 4 5 6+ Total
January 1,374 318 95 22 14 13 1,836
February 1,179 256 86 36 12 10 1,579
March 1,451 298 80 19 7 6 1,861
April 1,287 295 93 24 8 11 1,718
May 1,596 313 93 21 5 0 2,028
June 1,477 320 95 30 7 2 1,931
July 1,672 289 88 23 8 2 2,082
August 1,485 292 82 27 12 5 1,903
September 1,378 307 106 29 6 5 1,831
October 1,390 303 95 26 5 0 1,819
November 1,334 261 98 36 2 8 1,739
December 1,403 299 90 23 5 8 1,828
Total 17,026 3,551 1,101 316 91 70 22,155
Sheriff’s Office Patrol Division Staffing Study
Page 35
2018 Call Breakdown by Day and Time, as a Percentage of All Calls (n = 22,155)
Time of Day Sunday Monday Tuesday Wednesday Thursday Friday Saturday Grand Total
0:00 0.91% 0.63% 0.69% 0.64% 0.93% 0.62% 1.19% 5.61%
1:00 0.61% 0.49% 0.41% 0.41% 0.59% 0.48% 0.88% 3.88%
2:00 0.41% 0.34% 0.27% 0.28% 0.36% 0.41% 0.48% 2.54%
3:00 0.34% 0.25% 0.26% 0.25% 0.41% 0.35% 0.37% 2.23%
4:00 0.33% 0.42% 0.39% 0.30% 0.41% 0.43% 0.20% 2.48%
5:00 0.21% 0.30% 0.40% 0.29% 0.53% 0.41% 0.31% 2.44%
6:00 0.16% 0.39% 0.32% 0.37% 0.29% 0.24% 0.23% 2.00%
7:00 0.22% 0.33% 0.46% 0.40% 0.36% 0.29% 0.27% 2.33%
8:00 0.27% 0.41% 0.33% 0.38% 0.36% 0.38% 0.33% 2.46%
9:00 0.31% 0.49% 0.51% 0.56% 0.43% 0.50% 0.44% 3.24%
10:00 0.27% 0.52% 0.52% 0.51% 0.46% 0.46% 0.46% 3.20%
11:00 0.36% 0.45% 0.45% 0.50% 0.45% 0.37% 0.36% 2.95%
12:00 0.35% 0.51% 0.38% 0.41% 0.41% 0.45% 0.51% 3.02%
13:00 0.46% 0.54% 0.76% 0.62% 0.37% 0.44% 0.52% 3.71%
14:00 0.49% 0.60% 0.60% 0.65% 0.50% 0.56% 0.48% 3.88%
15:00 0.56% 0.65% 0.62% 0.61% 0.49% 0.50% 0.56% 3.99%
16:00 0.63% 0.74% 0.70% 0.84% 0.85% 0.85% 0.66% 5.27%
17:00 0.79% 0.82% 0.75% 1.18% 0.79% 0.98% 0.75% 6.06%
18:00 0.75% 0.77% 0.71% 1.03% 0.76% 0.87% 0.69% 5.58%
19:00 0.70% 0.84% 0.93% 1.06% 0.76% 0.74% 0.74% 5.78%
20:00 0.72% 0.78% 0.73% 0.90% 0.89% 0.97% 0.77% 5.77%
21:00 0.72% 0.85% 1.02% 1.37% 0.91% 1.13% 1.02% 7.02%
22:00 0.78% 0.99% 0.98% 1.44% 0.85% 1.38% 1.28% 7.70%
23:00 0.71% 0.79% 0.87% 1.20% 0.87% 1.27% 1.14% 6.83%
Grand Total 12.06% 13.88% 14.08% 16.19% 14.03% 15.09% 14.65% 100.00%

Sheriff’s Office Patrol Division Staffing Study
Page 36
2018 Call and Response Distribution by Problem Type
Call Problem
# of Calls (n =
22,155)
Percentage of All 2018
Calls (n=22,155)
# of Responses
(n = 29,632)
Percentage of All 2018
Responses (n=29,632)
Average # Responders per
Call
Traffic Stop 10,195 46.0% 11,720 39.6% 1.1
Extra Patrol 1,429 6.5% 1,467 5.0% 1.0
Suspicious Activity 1,116 5.0% 1,836 6.2% 1.6
Motorist Assist 1,004 4.5% 1,228 4.1% 1.2
Detail Traffic/Tobacco, etc. 800 3.6% 1,066 3.6% 1.3
Road and Driving Comp 656 3.0% 987 3.3% 1.5
Follow up 616 2.8% 714 2.4% 1.2
Warrant Check/Processing 516 2.3% 757 2.6% 1.5
Assist Other Jurisdiction 476 2.1% 800 2.7% 1.7
Medical 381 1.7% 681 2.3% 1.8
Alarm Burglary/Holdup/Panic 377 1.7% 750 2.5% 2.0
Animal Calls 357 1.6% 477 1.6% 1.3
Accident/No injury 341 1.5% 547 1.8% 1.6
911 Hangup 303 1.4% 550 1.9% 1.8
Admin Background/Permits 259 1.2% 327 1.1% 1.3
Community Policing 256 1.2% 278 0.9% 1.1
Disturbance/Disorderly 256 1.2% 624 2.1% 2.4
Misc./Uncategorized 231 1.0% 283 1.0% 1.2
Welfare Check 231 1.0% 509 1.7% 2.2
Civil Assist 218 1.0% 296 1.0% 1.4
Medical/Priority 201 0.9% 387 1.3% 1.9
Public Assist 158 0.7% 196 0.7% 1.2
Fire Related Call 152 0.7% 313 1.1% 2.1
Theft RPT 148 0.7% 217 0.7% 1.5
Crisis Mental Health 96 0.4% 229 0.8% 2.4
DNR/Hunting/Off Road/Fishing 96 0.4% 120 0.4% 1.3
Accident /Injuries 95 0.4% 239 0.8% 2.5
Vandalism/Property Damage 84 0.4% 104 0.4% 1.2
Domestic/Disputes in Progress 83 0.4% 258 0.9% 3.1
Parking Violation 81 0.4% 103 0.3% 1.3
Fraud Activity RPT 75 0.3% 96 0.3% 1.3
Dumping/Littering 64 0.3% 70 0.2% 1.1
Fire Alarm 60 0.3% 86 0.3% 1.4
Ordinance Violation 58 0.3% 74 0.2% 1.3
Juvenile Complaint 55 0.2% 83 0.3% 1.5
Property Lost/Found 49 0.2% 56 0.2% 1.1
Drunkenness 46 0.2% 114 0.4% 2.5

Sheriff’s Office Patrol Division Staffing Study
Page 37
Missing Person/Runaway 40 0.2% 74 0.2% 1.9
Paper Service/Civil 38 0.2% 48 0.2% 1.3
Threats/Stalking 37 0.2% 49 0.2% 1.3
Harassment 35 0.2% 46 0.2% 1.3
Trespass 31 0.1% 49 0.2% 1.6
OFP/DANCO Violation RPT 31 0.1% 54 0.2% 1.7
Assault RPT 30 0.1% 62 0.2% 2.1
Fireworks 23 0.1% 29 0.1% 1.3
Open Doors/Windows 22 0.1% 39 0.1% 1.8
Weapons 19 0.1% 44 0.1% 2.3
Recovered Prop/Person 19 0.1% 31 0.1% 1.6
Utility Callout 17 0.1% 22 0.1% 1.3
Burglary RPT 16 0.1% 41 0.1% 2.6
Recreational Fire 16 0.1% 25 0.1% 1.6
Fight 15 0.1% 26 0.1% 1.7
Drug Activity 15 0.1% 25 0.1% 1.7
Criminal Sexual Conduct 15 0.1% 37 0.1% 2.5
Child Protection 14 0.1% 26 0.1% 1.9
Suicide Threat/Attempt 14 0.1% 36 0.1% 2.6
Theft In Progress 13 0.1% 31 0.1% 2.4
Burglary In Progress 11 0.0% 29 0.1% 2.6
Assault In Progress 11 0.0% 33 0.1% 3.0
Pursuit 9 0.0% 22 0.1% 2.4
Weather Related 8 0.0% 9 0.0% 1.1
Accident Medic Request 8 0.0% 19 0.1% 2.4
OFP/DANCO Violation In Progress 7 0.0% 20 0.1% 2.9
Deceased 5 0.0% 20 0.1% 4.0
Accident/Injuries/Entrapped 4 0.0% 18 0.1% 4.5
Domestic/Disputes RPT 4 0.0% 10 0.0% 2.5
Void/Test Call 3 0.0% 3 0.0% 1.0
Robbery In Progress 2 0.0% 3 0.0% 1.5
Swat/MAAG Callout 1 0.0% 2 0.0% 2.0
Fraud Activity In Progress 1 0.0% 1 0.0% 1.0
Accident /Aircraft 1 0.0% 6 0.0% 6.0
Shoplifting 1 0.0% 1 0.0% 1.0
Grand Total 22,155 100.0% 29,632 100.0% 1.34
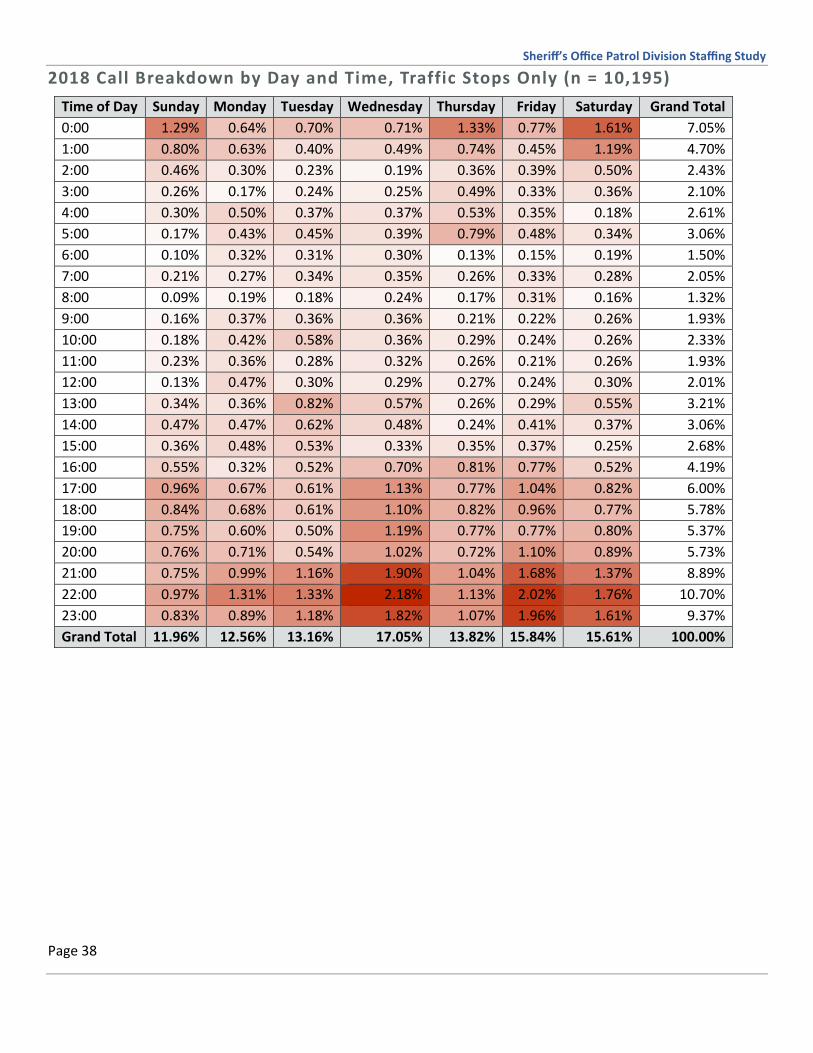
Sheriff’s Office Patrol Division Staffing Study
Page 38
2018 Call Breakdown by Day and Time, Traffic Stops Only (n = 10,195)
Time of Day Sunday Monday Tuesday Wednesday Thursday Friday Saturday Grand Total
0:00 1.29% 0.64% 0.70% 0.71% 1.33% 0.77% 1.61% 7.05%
1:00 0.80% 0.63% 0.40% 0.49% 0.74% 0.45% 1.19% 4.70%
2:00 0.46% 0.30% 0.23% 0.19% 0.36% 0.39% 0.50% 2.43%
3:00 0.26% 0.17% 0.24% 0.25% 0.49% 0.33% 0.36% 2.10%
4:00 0.30% 0.50% 0.37% 0.37% 0.53% 0.35% 0.18% 2.61%
5:00 0.17% 0.43% 0.45% 0.39% 0.79% 0.48% 0.34% 3.06%
6:00 0.10% 0.32% 0.31% 0.30% 0.13% 0.15% 0.19% 1.50%
7:00 0.21% 0.27% 0.34% 0.35% 0.26% 0.33% 0.28% 2.05%
8:00 0.09% 0.19% 0.18% 0.24% 0.17% 0.31% 0.16% 1.32%
9:00 0.16% 0.37% 0.36% 0.36% 0.21% 0.22% 0.26% 1.93%
10:00 0.18% 0.42% 0.58% 0.36% 0.29% 0.24% 0.26% 2.33%
11:00 0.23% 0.36% 0.28% 0.32% 0.26% 0.21% 0.26% 1.93%
12:00 0.13% 0.47% 0.30% 0.29% 0.27% 0.24% 0.30% 2.01%
13:00 0.34% 0.36% 0.82% 0.57% 0.26% 0.29% 0.55% 3.21%
14:00 0.47% 0.47% 0.62% 0.48% 0.24% 0.41% 0.37% 3.06%
15:00 0.36% 0.48% 0.53% 0.33% 0.35% 0.37% 0.25% 2.68%
16:00 0.55% 0.32% 0.52% 0.70% 0.81% 0.77% 0.52% 4.19%
17:00 0.96% 0.67% 0.61% 1.13% 0.77% 1.04% 0.82% 6.00%
18:00 0.84% 0.68% 0.61% 1.10% 0.82% 0.96% 0.77% 5.78%
19:00 0.75% 0.60% 0.50% 1.19% 0.77% 0.77% 0.80% 5.37%
20:00 0.76% 0.71% 0.54% 1.02% 0.72% 1.10% 0.89% 5.73%
21:00 0.75% 0.99% 1.16% 1.90% 1.04% 1.68% 1.37% 8.89%
22:00 0.97% 1.31% 1.33% 2.18% 1.13% 2.02% 1.76% 10.70%
23:00 0.83% 0.89% 1.18% 1.82% 1.07% 1.96% 1.61% 9.37%
Grand Total 11.96% 12.56% 13.16% 17.05% 13.82% 15.84% 15.61% 100.00%
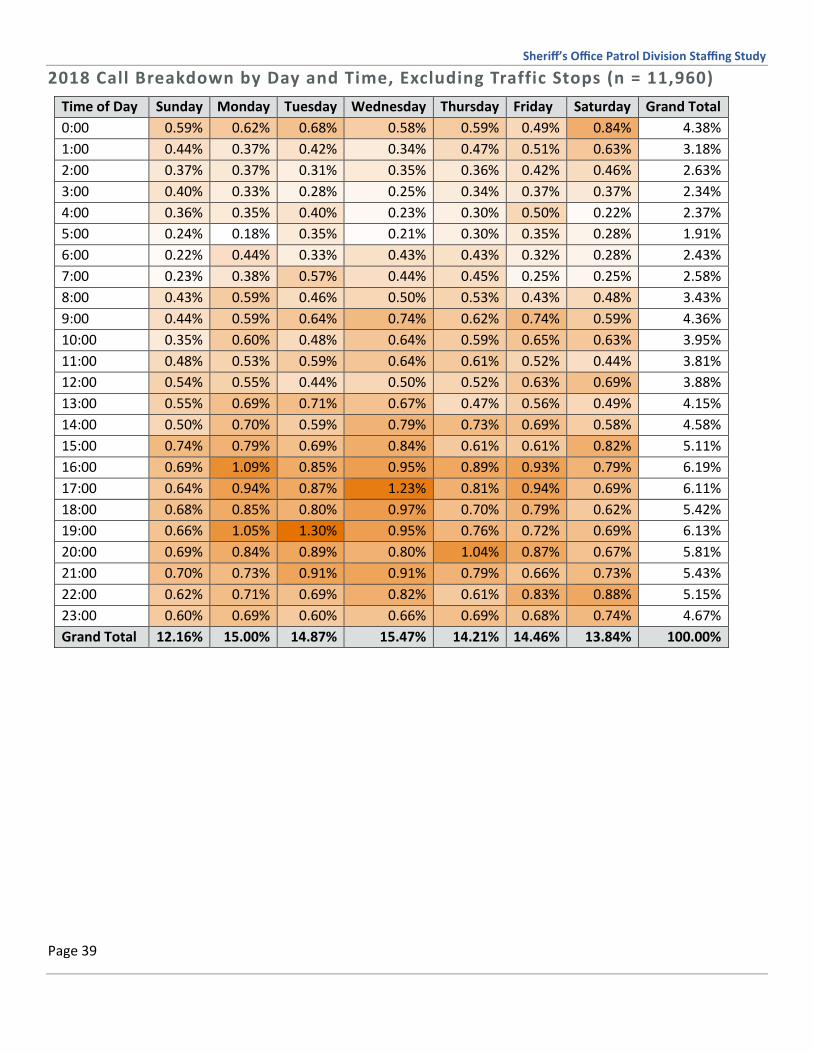
Sheriff’s Office Patrol Division Staffing Study
Page 39
2018 Call Breakdown by Day and Time, Excluding Traffic Stops (n = 11,960)
Time of Day Sunday Monday Tuesday Wednesday Thursday Friday Saturday Grand Total
0:00 0.59% 0.62% 0.68% 0.58% 0.59% 0.49% 0.84% 4.38%
1:00 0.44% 0.37% 0.42% 0.34% 0.47% 0.51% 0.63% 3.18%
2:00 0.37% 0.37% 0.31% 0.35% 0.36% 0.42% 0.46% 2.63%
3:00 0.40% 0.33% 0.28% 0.25% 0.34% 0.37% 0.37% 2.34%
4:00 0.36% 0.35% 0.40% 0.23% 0.30% 0.50% 0.22% 2.37%
5:00 0.24% 0.18% 0.35% 0.21% 0.30% 0.35% 0.28% 1.91%
6:00 0.22% 0.44% 0.33% 0.43% 0.43% 0.32% 0.28% 2.43%
7:00 0.23% 0.38% 0.57% 0.44% 0.45% 0.25% 0.25% 2.58%
8:00 0.43% 0.59% 0.46% 0.50% 0.53% 0.43% 0.48% 3.43%
9:00 0.44% 0.59% 0.64% 0.74% 0.62% 0.74% 0.59% 4.36%
10:00 0.35% 0.60% 0.48% 0.64% 0.59% 0.65% 0.63% 3.95%
11:00 0.48% 0.53% 0.59% 0.64% 0.61% 0.52% 0.44% 3.81%
12:00 0.54% 0.55% 0.44% 0.50% 0.52% 0.63% 0.69% 3.88%
13:00 0.55% 0.69% 0.71% 0.67% 0.47% 0.56% 0.49% 4.15%
14:00 0.50% 0.70% 0.59% 0.79% 0.73% 0.69% 0.58% 4.58%
15:00 0.74% 0.79% 0.69% 0.84% 0.61% 0.61% 0.82% 5.11%
16:00 0.69% 1.09% 0.85% 0.95% 0.89% 0.93% 0.79% 6.19%
17:00 0.64% 0.94% 0.87% 1.23% 0.81% 0.94% 0.69% 6.11%
18:00 0.68% 0.85% 0.80% 0.97% 0.70% 0.79% 0.62% 5.42%
19:00 0.66% 1.05% 1.30% 0.95% 0.76% 0.72% 0.69% 6.13%
20:00 0.69% 0.84% 0.89% 0.80% 1.04% 0.87% 0.67% 5.81%
21:00 0.70% 0.73% 0.91% 0.91% 0.79% 0.66% 0.73% 5.43%
22:00 0.62% 0.71% 0.69% 0.82% 0.61% 0.83% 0.88% 5.15%
23:00 0.60% 0.69% 0.60% 0.66% 0.69% 0.68% 0.74% 4.67%
Grand Total 12.16% 15.00% 14.87% 15.47% 14.21% 14.46% 13.84% 100.00%

Sheriff’s Office Patrol Division Staffing Study
Page 40
2018 Call Breakdown by Day and Time, Excluding Self -Initiated Calls (n = 8,647)
Time of Day Sunday Monday Tuesday Wednesday Thursday Friday Saturday Grand Total
0:00 0.51% 0.56% 0.64% 0.59% 0.61% 0.37% 0.84% 4.12%
1:00 0.49% 0.21% 0.35% 0.36% 0.35% 0.43% 0.53% 2.71%
2:00 0.38% 0.29% 0.35% 0.34% 0.30% 0.27% 0.43% 2.35%
3:00 0.45% 0.28% 0.34% 0.20% 0.30% 0.24% 0.31% 2.12%
4:00 0.27% 0.32% 0.42% 0.22% 0.24% 0.24% 0.19% 1.90%
5:00 0.25% 0.17% 0.40% 0.22% 0.34% 0.34% 0.28% 2.00%
6:00 0.17% 0.35% 0.28% 0.44% 0.45% 0.35% 0.23% 2.27%
7:00 0.20% 0.28% 0.56% 0.46% 0.47% 0.22% 0.28% 2.46%
8:00 0.42% 0.54% 0.50% 0.57% 0.53% 0.45% 0.46% 3.47%
9:00 0.46% 0.52% 0.59% 0.64% 0.54% 0.76% 0.58% 4.09%
10:00 0.35% 0.60% 0.49% 0.64% 0.64% 0.75% 0.62% 4.08%
11:00 0.47% 0.58% 0.59% 0.72% 0.61% 0.54% 0.37% 3.89%
12:00 0.61% 0.60% 0.50% 0.58% 0.58% 0.74% 0.80% 4.41%
13:00 0.60% 0.77% 0.80% 0.74% 0.49% 0.58% 0.56% 4.53%
14:00 0.52% 0.76% 0.64% 0.95% 0.65% 0.68% 0.61% 4.81%
15:00 0.74% 0.91% 0.69% 0.90% 0.65% 0.62% 0.82% 5.34%
16:00 0.65% 1.08% 0.84% 0.93% 0.84% 0.98% 0.83% 6.15%
17:00 0.67% 0.96% 0.84% 1.31% 0.87% 0.91% 0.71% 6.27%
18:00 0.73% 0.95% 0.97% 1.03% 0.74% 0.83% 0.65% 5.90%
19:00 0.65% 1.20% 1.47% 1.09% 0.79% 0.68% 0.73% 6.60%
20:00 0.72% 0.95% 1.06% 0.81% 1.02% 0.71% 0.64% 5.90%
21:00 0.62% 0.77% 0.89% 0.82% 0.79% 0.59% 0.77% 5.26%
22:00 0.64% 0.65% 0.62% 0.84% 0.60% 0.82% 0.87% 5.04%
23:00 0.52% 0.62% 0.56% 0.67% 0.61% 0.69% 0.66% 4.34%
Grand Total 12.09% 14.93% 15.37% 16.04% 14.00% 13.81% 13.76% 100.00%

Sheriff’s Office Patrol Division Staffing Study
Page 41
2018 Call Breakdown by Day and Time, Calls That Ended in Arrest (n = 520)
Note: the number of calls that ended in arrest (520) is different from the number of arrests (586) that occurred
during 2018. It is possible for more than one person to be arrested in the course of a call.
Time of Day Sunday Monday Tuesday Wednesday Thursday Friday Saturday Grand Total
0:00 1.35% 0.96% 2.31% 0.96% 1.15% 1.54% 2.50% 10.77%
1:00 1.35% 0.38% 0.77% 0.38% 0.96% 0.58% 1.54% 5.96%
2:00 1.15% 0.00% 0.58% 0.38% 0.58% 0.96% 0.96% 4.62%
3:00 0.38% 0.19% 0.19% 0.38% 0.58% 0.38% 1.15% 3.27%
4:00 0.38% 0.19% 0.19% 0.00% 0.58% 0.58% 0.38% 2.31%
5:00 0.00% 0.00% 0.38% 0.00% 0.00% 0.38% 0.00% 0.77%
7:00 0.00% 0.00% 0.00% 0.58% 0.19% 0.00% 0.00% 0.77%
8:00 0.19% 0.00% 0.38% 0.38% 0.00% 0.38% 0.19% 1.54%
9:00 0.38% 0.38% 0.38% 0.19% 0.19% 0.00% 0.00% 1.54%
10:00 0.19% 0.58% 0.58% 0.19% 0.00% 0.38% 0.58% 2.50%
11:00 0.19% 0.38% 0.19% 0.77% 0.00% 0.19% 0.19% 1.92%
12:00 0.19% 0.38% 0.19% 0.58% 0.77% 0.00% 0.00% 2.12%
13:00 0.00% 0.19% 0.19% 0.96% 0.19% 0.19% 0.00% 1.73%
14:00 0.19% 0.19% 0.00% 0.58% 0.38% 0.00% 0.00% 1.35%
15:00 0.19% 0.19% 0.96% 0.96% 0.19% 0.19% 0.38% 3.08%
16:00 0.38% 0.19% 0.77% 1.15% 0.77% 0.38% 1.15% 4.81%
17:00 0.96% 0.38% 0.58% 1.54% 0.96% 0.38% 0.38% 5.19%
18:00 0.77% 0.38% 1.35% 1.15% 0.38% 0.96% 1.15% 6.15%
19:00 0.38% 0.19% 0.58% 1.54% 1.15% 0.58% 0.38% 4.81%
20:00 1.15% 0.00% 0.77% 0.96% 1.73% 0.77% 0.19% 5.58%
21:00 0.96% 0.96% 0.38% 0.77% 0.96% 1.54% 1.35% 6.92%
22:00 1.54% 0.58% 1.35% 2.69% 2.50% 0.96% 2.12% 11.73%
23:00 0.96% 1.54% 2.12% 0.96% 2.50% 1.73% 0.77% 10.58%
Grand Total 13.27% 8.27% 15.19% 18.08% 16.73% 13.08% 15.38% 100.00%
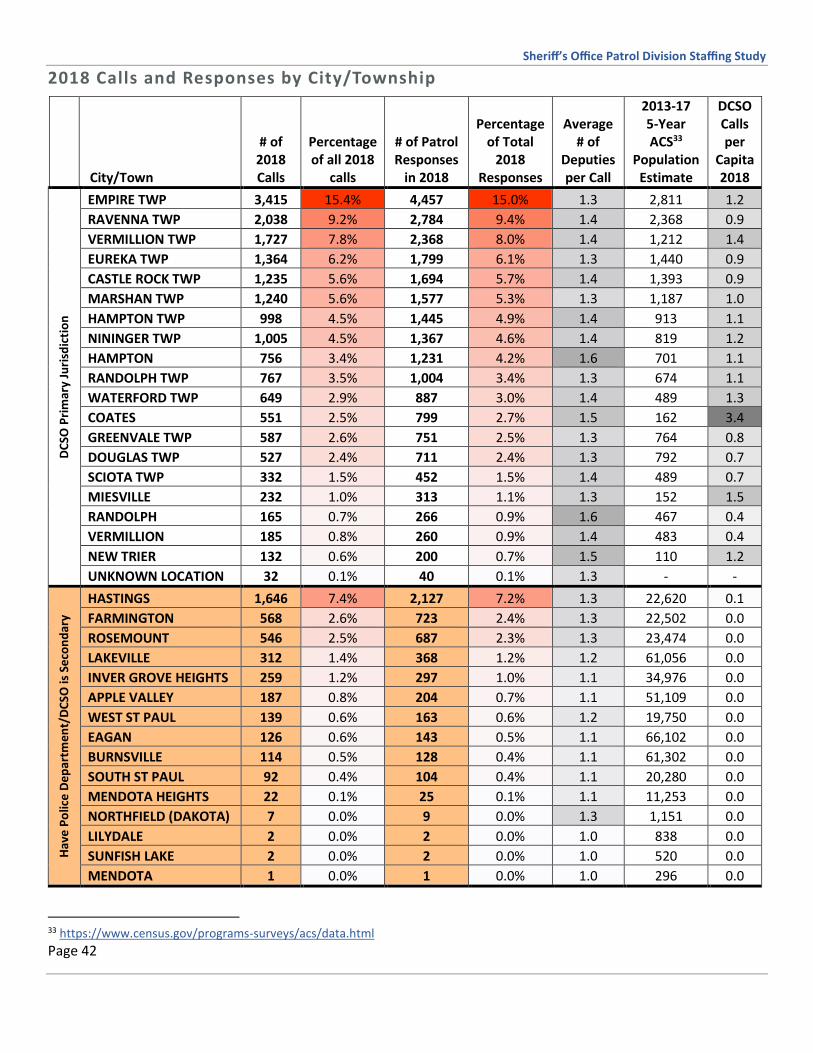
Sheriff’s Office Patrol Division Staffing Study
Page 42
2018 Calls and Responses by City/Township
City/Town
# of 2018 Calls
Percentage of all 2018
calls
# of Patrol Responses
in 2018
Percentage of Total
2018 Responses
Average # of
Deputies per Call
2013-17 5-Year ACS33
Population Estimate
DCSO Calls per
Capita 2018
DC
SO P
rim
ary
Juri
sdic
tio
n
EMPIRE TWP 3,415 15.4% 4,457 15.0% 1.3 2,811 1.2
RAVENNA TWP 2,038 9.2% 2,784 9.4% 1.4 2,368 0.9
VERMILLION TWP 1,727 7.8% 2,368 8.0% 1.4 1,212 1.4
EUREKA TWP 1,364 6.2% 1,799 6.1% 1.3 1,440 0.9
CASTLE ROCK TWP 1,235 5.6% 1,694 5.7% 1.4 1,393 0.9
MARSHAN TWP 1,240 5.6% 1,577 5.3% 1.3 1,187 1.0
HAMPTON TWP 998 4.5% 1,445 4.9% 1.4 913 1.1
NININGER TWP 1,005 4.5% 1,367 4.6% 1.4 819 1.2
HAMPTON 756 3.4% 1,231 4.2% 1.6 701 1.1
RANDOLPH TWP 767 3.5% 1,004 3.4% 1.3 674 1.1
WATERFORD TWP 649 2.9% 887 3.0% 1.4 489 1.3
COATES 551 2.5% 799 2.7% 1.5 162 3.4
GREENVALE TWP 587 2.6% 751 2.5% 1.3 764 0.8
DOUGLAS TWP 527 2.4% 711 2.4% 1.3 792 0.7
SCIOTA TWP 332 1.5% 452 1.5% 1.4 489 0.7
MIESVILLE 232 1.0% 313 1.1% 1.3 152 1.5
RANDOLPH 165 0.7% 266 0.9% 1.6 467 0.4
VERMILLION 185 0.8% 260 0.9% 1.4 483 0.4
NEW TRIER 132 0.6% 200 0.7% 1.5 110 1.2
UNKNOWN LOCATION 32 0.1% 40 0.1% 1.3 - -
Hav
e P
olic
e D
ep
artm
en
t/D
CSO
is S
eco
nd
ary
HASTINGS 1,646 7.4% 2,127 7.2% 1.3 22,620 0.1
FARMINGTON 568 2.6% 723 2.4% 1.3 22,502 0.0
ROSEMOUNT 546 2.5% 687 2.3% 1.3 23,474 0.0
LAKEVILLE 312 1.4% 368 1.2% 1.2 61,056 0.0
INVER GROVE HEIGHTS 259 1.2% 297 1.0% 1.1 34,976 0.0
APPLE VALLEY 187 0.8% 204 0.7% 1.1 51,109 0.0
WEST ST PAUL 139 0.6% 163 0.6% 1.2 19,750 0.0
EAGAN 126 0.6% 143 0.5% 1.1 66,102 0.0
BURNSVILLE 114 0.5% 128 0.4% 1.1 61,302 0.0
SOUTH ST PAUL 92 0.4% 104 0.4% 1.1 20,280 0.0
MENDOTA HEIGHTS 22 0.1% 25 0.1% 1.1 11,253 0.0
NORTHFIELD (DAKOTA) 7 0.0% 9 0.0% 1.3 1,151 0.0
LILYDALE 2 0.0% 2 0.0% 1.0 838 0.0
SUNFISH LAKE 2 0.0% 2 0.0% 1.0 520 0.0
MENDOTA 1 0.0% 1 0.0% 1.0 296 0.0
33 https://www.census.gov/programs-surveys/acs/data.html

Sheriff’s Office Patrol Division Staffing Study
Page 43
Ou
tsid
e D
ako
ta C
ou
nty
ST PAUL 44 0.2% 60 0.2% 1.4 CANNON FALLS 24 0.1% 32 0.1% 1.3 WELCH TWP 22 0.1% 28 0.1% 1.3 DENMARK TWP 17 0.1% 19 0.1% 1.1 NORTHFIELD (RICE) 21 0.1% 24 0.1% 1.1 NEW MARKET TWP 9 0.0% 12 0.0% 1.3 STANTON TWP 8 0.0% 9 0.0% 1.1 BRIDGEWATER TWP 7 0.0% 8 0.0% 1.1 MAPLEWOOD 5 0.0% 7 0.0% 1.4 MINNEAPOLIS 4 0.0% 6 0.0% 1.5 CANNON FALLS TWP 5 0.0% 5 0.0% 1.0 WEBSTER TWP 4 0.0% 5 0.0% 1.3 COTTAGE GROVE 4 0.0% 4 0.0% 1.0 SHAKOPEE 2 0.0% 4 0.0% 2.0 RED WING 3 0.0% 3 0.0% 1.0 SAINT PAUL 3 0.0% 3 0.0% 1.0 NORTHFIELD TWP 2 0.0% 4 0.0% 2.0 ELKO NEW MARKET 2 0.0% 2 0.0% 1.0 MEDINA 2 0.0% 2 0.0% 1.0 CANNON CITY TWP 1 0.0% 1 0.0% 1.0 CREDIT RIVER TWP 1 0.0% 1 0.0% 1.0 EDEN PRAIRIE 1 0.0% 1 0.0% 1.0 FORT SNELLING 1 0.0% 1 0.0% 1.0 LAKE CITY 1 0.0% 1 0.0% 1.0 OSSEO 1 0.0% 1 0.0% 1.0 WACOUTA TWP 1 0.0% 1 0.0% 1.0
Grand Total 22,155 100% 29,632 100% 1.3

Sheriff’s Office Patrol Division Staffing Study
Page 44
APPENDIX E: EMPLOYEE OPINION SURVEY RESULTS The chart shows the percentage of employees in agreement with each selected question. “Blue” figures represent
positive percentage changes from the previous opinion survey. In the “Change” column, “blue” figures represent
an overall positive percentage change from the first year the question was asked. “Red” figures represent
decreases.
Change 2013 2016 2019
2013-19
Q2 - At work, I have the opportunity to do what I do best.
All Sheriff 69% 71% 71%
2%
All County 72% 75% 76%
4%
Change
2013 2016 2019
2013-19
Q3 - I am satisfied with the level of challenge I'm offered.
All Sheriff 69% 78% 70%
1%
All County 69% 74% 76%
7%
Change
2013 2016 2019
2013-19
Q9 - I am satisfied with the physical working conditions in my area.
All Sheriff 69% 56% 61%
-8%
All County 70% 66% 66%
-4%
Change
2013 2016 2019
2013-19
Q12 - I believe the workload in my department is appropriately assigned.
All Sheriff 47% 46% 50%
3%
All County 46% 51% 54%
8%
Change
2013 2016 2019 2013-19
Q13 - I feel that the stress levels in my work unit are acceptable.
All Sheriff 31% 52% 53%
22%
All County 46% 53% 56% 10%
Change
2013 2016 2019 2013-19
Q51 - I am treated with respect at work. All Sheriff 69% 80% 75% 6%
All County 78% 84% 83% 5%

Sheriff’s Office Patrol Division Staffing Study
Page 45
APPENDIX F: CONTINUED DISCUSSION AND SERVICE ALTERNATIVES Review of this report’s draft took place during 2020 Budget discussions between the Sheriff’s Office and County
Administration. Those budget discussions included a conversation about how the proposed four additional
deputies and their corresponding supplies (i.e. patrol car, uniform, etc.) could be funded. As a follow-up, the
Sheriff’s Office expressed an interest in examining options for alternative taxing structures and contracting of
services, both of which are otherwise not addressed within this staffing needs report. The purpose of this appendix
is to provide a cursory description of the concepts introduced during the budget discussions, as well as initial
information gathering efforts.
Taxing Alternative
Research on taxing alternatives focused on locating examples where counties taxed rural municipalities utilizing
Sheriff’s Office services for their sole law enforcement coverage at a higher rate. In this instance, rural
municipalities using only the Sheriff’s Office would receive more services from the Sheriff’s Office than
municipalities that have their own police department and use the Sheriff’s Office services for secondary coverage.
The concept would enable raising additional funds for patrol deputies from the communities that benefit the most
from increased staffing.
Attempts were made by both the Sheriff’s Office and OPA staff to locate examples of Minnesota counties that
utilize this type of two-tier taxing structure. Currently, those efforts have not yielded a Minnesota example.34
Contracting Services 35
Another model used within Minnesota, which is in effect in Carver County, allows municipalities to contract for
specific services from the Sheriff’s Office. The intent of this approach is to provide another option for staffing, in
which the number of patrol deputies is dependent upon the revenue generated from services paid for by individual
municipalities.
In 2010, Carver County, the City of Chaska, and eight Carver County townships ended a series of legal disputes
dating back to 1987.36 The central dispute involved the calculations for municipal payments to receive Sheriff’s
Office services, as well as which contracted services are provided to specific municipalities.37
Under the 2010 agreement, individual townships are given the option of contracting their patrol services through
the Carver County Sheriff’s Office or paying an extra fee for specific services.38 This structure is intended to provide
34 An example was located in Deschutes County, Oregon, which utilizes a Rural tax, in addition to a Countywide tax. The rural tax provides funding for rural Patrol and Investigative services, whereas the countywide tax funds Countywide Sheriff’s Office Services including operation of the Adult Jail, Court Security, Emergency Services, and Civil Services. This information was described within Deschutes County’s Fiscal Year 2017 Adopted Budget. The question of whether a similar taxing structure would be permitted in a Minnesota county has not been researched. 35 Information detailing Carver County’s contracting of services was compiled from a variety of sources including the Carver County Sheriff’s Office, as well as online searches. 36 An agreement was previously reached in 2005 between Carver County and eleven municipalities. 37 Estrada, Heron Marquez. “Carver sheriff cutting back service to townships.” Minneapolis Star Tribune. June 8, 2010. 38 Ibid.
Sheriff’s Office Patrol Division Staffing Study
Page 46
municipalities with options for structuring their law enforcement through the selection of services from a menu
provided by the Carver County Sheriff’s Office.39
Carver County Sheriff’s Office services are separated into three categories: Countywide General Police and Patrol
Services, Overlapping Services, and Contract Police Services.40
Countywide General Police Services – These are services provided to the entire county, regardless of
whether a municipality has its own police department or contracts with the county for law enforcement.
Services include select Administrative Services, Jail Services, Support Services, Operations Services, and
Patrol Services. Examples include 9-1-1 dispatch, the countywide radio system, jail detention services,
prisoner transport, crime scene processing, and emergency call response.
Overlapping Services – These services are not clear as to whether they are a general countywide call or
contract call, until a deputy investigates the specific call. These calls are handled by countywide Sheriff’s
Office deputies on a priority basis. Examples include criminal investigations, alarm response calls, and
driving complaints.
Contract Police Services – These calls are only responded to if a municipality contracts for services through
the Carver County Sheriff’s Office or the on-duty supervisor determines that the call would create a public
safety risk if not handled. Typical examples of contract calls for service include the following:
• Found Bicycles
• Extra Patrol Request
• Found Property
• Skate Boarders
• Alcohol Compliance Checks
• Solicitor Complaints
• Discipline Issues at Home
• Kids Looking in Cars
• 4-Wheeler Complaints
• Abandoned Vehicles
• Snow Removal Ordinance
• Littering Complaints
• BB Gun Violations in City
• Community Expos
• Kids Loitering
• Lost Property
• Traffic Complaints
• Tobacco Violations
• Animals Running At Large
• Junk Autos
• House Checks
• Parking Complaints
• Snowmobile Complaints
• Noise/Loud Music Complaints
• Funeral Assists
• Building Left Open
• Crime Prevention Meeting
OPA examined the 2018 calls for service to understand the prevalence of these types of calls within Dakota County.
While many of the Carver County call types are the same as the categories Dakota County uses, there are a few
that are more granular than the call types used by the DCSO. As a result the numbers provided below might be
inflated because the Dakota County categories encompass more types of calls than the specific activities described
by Carver County.
39 Sheriff’s Contract Committee (SCC). “Vision 2005: Contract Policing in Carver County.” March 18, 2004. Modified June 8, 2010. 40 Ibid.

Sheriff’s Office Patrol Division Staffing Study
Page 47
*Dakota County categories may include other types of calls beyond the Carver County categories.
As a result, the numbers in these categories may be inflated.
OPA also examined these call types as a percentage of all 2018 calls. These are represented in the table below. As
the original call analysis excluded premise checks, per direction from the project team as they are conducted
during times when deputies are not otherwise busy, the numbers are expressed both with and without premise
checks below.
Without Premise Checks With Premise Checks
Calls that (roughly) match
Carver County categories 4,543 17,183
Total calls 22,155 34,795 20.5% 49.4%
Carver County Call Category Dakota County Call Category Number of Dakota County calls in 2018
House Checks Premise Checks 12,640
Extra Patrol Request Extra Patrol 1,429
Discipline Issues at Home Juvenile Complaints, Suspicious Activity, Disorderly Conduct*
1,427 Kids Looking in Cars
Kids Loitering
Skate Boarders
Alcohol Compliance Checks Detail Trfc/Tobacco 800
Tobacco Violations
Animals Running At Large Animal Calls 357
Crime Prevention Meeting Community Policing
256 Community Expos
Parking Complaints Parking Violation 81
Littering Complaints Dumping/Littering 64
Solicitor Complaints
Ordinance violation*
58
Abandoned Vehicles
Snow Removal Ordinance
BB Gun Violations in City
Junk Autos
Snowmobile Complaints
Noise/Loud Music Complaints
Found Property
Property Lost/Found 49 Lost Property
Found Bicycles
Building Left Open Open Doors/Windows 22
Traffic Complaints Driving Complaints
0 4-Wheeler Complaints
Funeral Assists No comparison 0


![HPD Staffing Presentation Autosaved (2) [Read-Only]...resources. There is no “correct” or accepted level of either patrol or investigativestaffing.” …staffing should be linked](https://img.pdfslide.net/doc/110x75/5f756d64d5cd9b07ee618191/hpd-staffing-presentation-autosaved-2-read-only-resources-there-is-no-aoecorrecta.jpg)