Embed Size (px)
Citation preview

0 Confidentiality level : 版本(日期):103/09 V1
Company Overview
September 2016
Shin Kong Financial Holding

1
Disclaimer
This presentation and the presentation materials distributed herewith include
forward-looking statements. All statements, other than statements of historical
facts, that address activities, events or developments that Shin Kong Financial
Holding Company (“Shin Kong FHC”) expect or anticipate will or may occur in the
future (including but not limited to projections, targets, estimates and business
plans) are forward-looking statements. Shin Kong FHC’s actual results or
developments may differ materially from those indicated by these forward-looking
statements as a result of various factors and uncertainties, including but not
limited to price fluctuations, actual demand, exchange rate fluctuations, market
shares, competition, changes in legal, financial and regulatory frameworks,
international economic and financial market conditions, political risks, cost
estimates and other risks and factors beyond our control. In addition, Shin Kong
FHC makes the forward-looking statements referred to herein as of today and
undertakes no obligation to update these statements.
Figures in this presentation and the presentation materials distributed herewith
are preliminary numbers.

2 Confidentiality level : 版本(日期):103/09 V1
I. SKFH
II. Life Insurance Business
III. Banking Business
IV. Appendix • Market opportunities
• SKL Premium
• EV & AV Result
• SKL China Development Strategy
Agenda
I. SKFH
II. Life Insurance Business
III. Banking Business
IV. Appendix • Market opportunities
• SKL Premium
• EV & AV Result
• Agents and Marketing Transformation Projects
• SKL China Development Strategy
• Capital Adequacy
Agenda

3
Who We Are
2015 Asset Mix
Life 70.5%
Bank 26.3%
Others 3.2%
Financial Overview
NT$bn 2015 2014 2013
Total Assets 2,535.2 2,793.8 2,963.1
Shareholders’ Equity 114.8 125.5 123.1
Market Value 96.1 88.6 73.1
Net Income (1) 10.0 6.8 5.8
ROA 0.43% 0.29% 0.24%
ROE 10.04% 6.53% 5.50%
Foreign Ownership 24.87% 24.44% 22.29%
Note:
(1) Excludes minority interest income
Major financial holding company in Taiwan
Subsidiaries including life insurance, bank, securities, asset management,
property insurance agency and venture capital
5th largest life insurer by first year premiums with 6.6% market share in 2015
10th largest domestic private bank by total assets with 106 branches
FHC with significant presence in both insurance and banking

4
Corporate Structure
Shin Kong Life
Shin Kong Bank
Shin Kong
Property
Insurance
Agency
Shin Kong Venture Capital
Shin Kong
Investment
Trust
Shin Kong Financial Holding
Integrated Financial Services Platform
Date of Incorporation 7/1963 1/1997 9/1992 1/2003 4/2011
Assets (NT$bn) 2,113.49 788.39 0.73 0.10 1.53
% of Group Assets 70.5% 26.3% <0.1% <0.1% <0.1%
Earnings (NT$mn) 150 5,033 16 46 17
Branches/Offices 324 106 3 1 1
Market Share 6.6% 1.8% 1.3% - -

5
Seasoned Management Team Vice Chairman & Spokesperson,
Shin Kong Financial Holding
Experiences:
First Vice President, Shin Kong Financial Holding
CFO, Shin Kong Life
Hsu,
Victor
President, Shin Kong Life
Experiences:
EVP, Shin Kong Life
SVP, Shin Kong Life
Tsai,
Jason
President, Shin Kong Financial Holding
Vice Chairperson, Shin Kong Life
Experiences:
Chairperson, Taiwan Financial Holdings & Bank of Taiwan
Chairperson, Bankers Association of the Republic of China
Vice Chairperson, Financial Supervisory Commission R.O.C. (Taiwan)
Chairperson, Chunghwa Post Co., Ltd.
Legislator, Legislative Yuan, R.O.C.
Professor, Department of Economics, National Chengchi University
Lee,
Jih-Chu
Chairman & President, Shin Kong Property
Insurance Agency
Experiences:
President, Shin Kong–HNA Life
SVP, Shin Kong Life
VP of Training & Education Dept., Shin Kong Life
VP of Overseas Affairs Dept., Shin Kong Life
Membership & others:
Director, Life Insurance Association of R.O.C.
Member, Financial Holding Business Committee
Membership & others:
Executive Director, Life Insurance Management Institute of the Republic of China
Fang,
Matthew
President, Shin Kong Bank
Experiences:
SEVP, Ta Chong Bank
SVP, Taishin International Bank
VP, JP Morgan Chase Bank, Taipei Branch
Hsieh,
Charles

6
Strong Track Record of Attracting and Integrating Outside Talent
Chief Information Officer, Shin Kong Financial Holding
Chief Information Officer, Shin Kong Bank
Experiences:
Chief Operation Officer, Cathay United Bank
Chief Information Officer, Cathay United Bank
Chang,
K.T.
Chu,
Grace
CRO, Shin Kong Financial Holding
CRO, Shin Kong Life
Experiences: Senior Vice President, Taiwan
International Securities Company Co-Chair, Risk Control Committee,
Taiwan Securities Association Executive Vice President, Taiwan
Ratings Corporation
Yuan,
James
CIO, Shin Kong Life Experiences: CIO, Everbright Pramerica Fund
Management CIO, ABN AMRO Securities Investment
Trust SVP, Equities, London Life CFA
Lin,
Han Wei
SVP, Actuarial Valuation & Reporting, ALM, Actuarial & Planning, and Product Development Department, Shin Kong Life Experiences: Assistant Actuary, New York Life (USA) Director and Actuary, Lincoln Financial
Group (USA) FSA MAAA CFA
VP, Wealth Management, Shin Kong Bank
Experiences:
SVP, Wealth Management, Fuhwa Bank
AVP, Int’l Private Client Group, Merrill Lynch (Taiwan)
AVP, Personal Banking Center, Citibank, N.A. (Taiwan)
Lin,
Sunny

7
Sound Policies and Practices to Ensure
Proper Corporate Governance
Board
Control
Diversified shareholding structure with about 20% foreign ownership and ~2%
employee ownership
3 independent non-executive Board directors appointed in 2014
‒ Mei-Hwa Lin: Professor of Department of Accounting, National Chengchi University
‒ Sheng-Yann Li: Honorary consultant of Center for Asian Studies, National Taipei
University
‒ Cheng-Yi Li: Former Director and President of Hua Nan Financial Holding Company
Legal
Compliance
Appointed Compliance Officer to further strengthen internal risk control and legal
compliance
Compliance officer is appointed by the Board and reports to the FHC President;
he submits a report to the Board on a half-yearly basis
Internal
Audit
Chief Auditor reports directly to the Board
One business audit every year
One finance, risk management and compliance audit every half year
Disclosure
Spokesperson and Deputy spokesperson appointed
Upload information to public information website regularly
Dedicated IR team established to respond to investor questions
Quarterly result meeting to update media / investors on operational performance

8
SKFH – 1H 2016 Overview SKFH recorded consolidated after-tax profit of NT$1.87bn for Q2 2016; for 1H 2016,
consolidated after-tax loss was NT$0.69bn, and consolidated comprehensive profit was NT$0.48bn. Shareholders’ equity increased 1.5% QoQ to NT$108.64bn, and book value per share was NT$10.83.
Subsidiaries’ core business remained solid.
– SKL:
FYP for 1H 2016 reached NT$58.04bn, 21.1% higher YoY, boosting market share to 8.9%. Annualized cost of liabilities decreased to 4.44%, 7 bps lower compared to 2015.
Interest income grew 16.6% YoY to NT$34.49bn, boosted by allocation to overseas fixed incomes. Recurring yield before hedging reached 3.69%, up 20 bps YoY.
– Shin Kong Bank:
Net interest income grew 3.2% YoY, reflecting prudently controlled funding cost. Driven by growth in wealth management fee income, net fee income increased 8.1% YoY. Consolidated after-tax profit reached NT$2.22bn.
BIS and Tier 1 ratio were 12.5% and 9.6% respectively, higher than 2015.
In order to enhance core business, including tied agent management, customer resources, and product marketing, SKL has partnered with international consulting firms, BCG and Oliver Wyman, to execute agents and marketing transformation projects:
– Increase agent productivity and optimize organization structure through comprehensive marketing planning and standardized activity management.
– Strengthen customer management strategy and big data analysis.

9
Net Income – 1H 2016
Net income contribution
NT$bn
Note:
(1) Includes other income of SKFH, income taxes, and profit from MasterLink Securities
Subsidiaries 1H 2015 1H 2016 YoY Growth
Shin Kong Life 3.51 -3.32 -194.5%
Shin Kong Bank 2.59 2.22 -14.3%
Shin Kong Investment Trust 0.01 0.01 49.0%
Shin Kong Venture Capital Int’l 0.02 0.01 -36.1%
Shin Kong Property Insurance Agency 0.02 0.03 17.6%
Others(1) 0.11 0.01 -90.9%
Net income 6.26 -1.04 -116.7%

10 Confidentiality level : 版本(日期):103/09 V1
I. SKFH
II. Life Insurance Business
III. Banking Business
IV. Appendix • Market opportunities
• SKL Premium
• EV & AV Result
• SKL China Development Strategy
Agenda
I. SKFH
II. Life Insurance Business
III. Banking Business
IV. Appendix • Market opportunities
• SKL Premium
• EV & AV Result
• Agents and Marketing Transformation Projects
• SKL China Development Strategy
• Capital Adequacy
Agenda

11
Total Premium 170.4 210.2 227.8
Net Income 6.53 1.63 0.15
Total Assets 1,804.6 1,972.0 2,113.5
Shareholders’ Equity 65.0 69.6 64.4
ROE 10.98% 2.34% 0.22%
ROA 0.38% 0.08% 0.01%
Traditional 78.9%
Investment-linked 2.4%
PA, Health &
Group 18.7%
Interest-sensitive 0.04%
Shin Kong Life
2015
2015 Total Premium Written Financial Overview
NT$bn 2014 2013
Total Premium Written: NT$227.8bn
5th largest life insurer by first year premiums in Taiwan with 6.6% market share
and 3.6 million customers in 2015
Strong distribution network around 9,000 agents, 324 sales offices and
bancassurance relationships with around 40 financial institutions
Offer a wide range of life insurance products, including traditional life, accident
and health, interest-sensitive and investment-linked products

12
Shin Kong Market Share
217.4
205.3
172.6
83.1
78.2
77.4
70.1
67.6
36.7
27.5
Cathay Life
Fubon Life
Nan Shan Life
China Life
Shin Kong Life
CTBC Life
Allianz Life
BNP Paribas Life
Mercuries Life
TCB Life
FYP of Top 10 Players – 2015 Shin Kong FYP Market Share Over Time
Source: Life Insurance Association of R.O.C.
NT$bn %
7.7%
5.8%
5.1%
7.7%
6.6%
2011 2012 2013 2014 2015
13
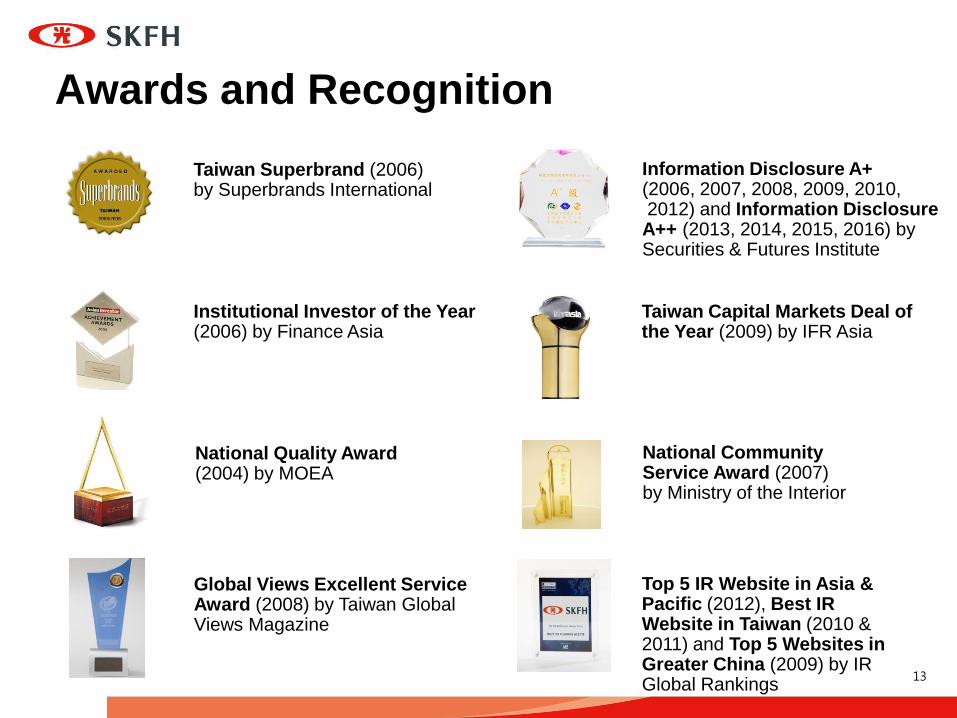
Awards and Recognition
National Quality Award (2004) by MOEA
Taiwan Capital Markets Deal of the Year (2009) by IFR Asia
Institutional Investor of the Year (2006) by Finance Asia
Information Disclosure A+ (2006, 2007, 2008, 2009, 2010, 2012) and Information Disclosure A++ (2013, 2014, 2015, 2016) by Securities & Futures Institute
Taiwan Superbrand (2006) by Superbrands International
National Community Service Award (2007) by Ministry of the Interior
Global Views Excellent Service Award (2008) by Taiwan Global Views Magazine
Top 5 IR Website in Asia & Pacific (2012), Best IR Website in Taiwan (2010 & 2011) and Top 5 Websites in Greater China (2009) by IR Global Rankings

14
FYP for Q2 2016 was NT$37.06bn, 76.6% higher QoQ. FYP for 1H
2016 reached NT$58.04bn, up 21.1% YoY, boosting market share to
8.9%.
Through promotion of whole life savings products, FYPE for 1H 2016
amounted to NT$27.62bn, up 81.3% YoY. Annualized cost of liabilities
decreased to 4.44%, 7 bps lower compared to 2015.
Focused on recurring yield, overseas fixed incomes increased
continuously, enabling interest income to grow NT$4.90bn YoY.
Recurring yield before hedging increased 20 bps YoY to 3.69%.
Consolidated after-tax profit for Q2 2016 was NT$0.35bn. For 1H
2016, consolidated after-tax loss was NT$3.32bn, and other
comprehensive income was NT$1.25bn.
Annualized investment return was 3.4% for 1H 2016. Domestic and
foreign cash dividend income expected to reach NT$7.6bn for 2016.
SKL – 1H 2016 Overview

15
First Year Premium – 1H 2016 NT$bn
Comments
FYP momentum has picked up, driven by policyholders’ demand for whole life savings triggered by persisting low interest rates. Market share increased from 6.6% in Q1 to 8.9% in 1H
FYP reached NT$58.04bn, 21.1% higher YoY; FYPE amounted to NT$27.62bn, up 81.3% YoY
Traditional products remained marketing focus and contributed 94.8% of total FYP, allowing annualized cost of liabilities to decline to 4.44%, 7 bps lower compared to 2015
FX policies and health insurance to be actively promoted in 2H 2016 for VNB growth
PA, Health and Group (1)
Investment-linked Interest-sensitive
Traditional
Note:
(1) Long-term disability Type A policies are classified as health insurance
47.9
58.0
1H 15 1H 16
21%
3.7
2.4
1H 15 1H 16
43.0
55.0
1H 15 1H 16
28% -34%
0.1 0.0
1H 15 1H 16
1.2
0.6
1H 15 1H 16
-52% -88%

16
Cost of Liabilities (annual)
%
Cost of Liabilities (quarterly)
%
Cost of Liabilities
4.99%
4.91%
4.78%
4.64%
4.51%
2011 2012 2013 2014 2015
4.58%
4.53%
4.51%
4.48%
4.44%
1H 15 9M 15 2015 Q1 16 1H 16

17
98.0 98.2 98.3
Q4 15 Q1 16 Q2 16
90.8 90.5 91.8
Q4 15 Q1 16 Q2 16
Persistency Ratio
25 Month Persistency
%
13 Month Persistency
%

18
1,552 1,677
1,805 1,968
2,113
2011 2012 2013 2014 2015
Investment Portfolio NT$bn
Total Investment
Foreign Fixed
Income
Real Estate
Domestic
Equities
Foreign Equities
Domestic
Fixed Income
Policy Loans
Mortgage &
Corp. Loans
Cash
Note:
(1) Due to rounding, asset allocation figures may not add up to 100%
(2) Includes capital gains and FX hedging cost
Investment
return 4.3% 4.6% 4.4% 4.4% 3.7%
Total Assets
(2)
(1) (1)
CAGR
8.0%
International
Bonds Listed in
Domestic OTC
1,986.3 2,074.5
2.3% 3.2%
8.1% 7.0%
13.5% 12.5%
11.7% 15.4%
42.7% 42.1%
4.4% 3.6% 5.6% 5.4%
4.4% 4.0%
7.1% 6.8%
2015 1H 2016

19
6.8% 3.2%
4.6% 2.0%
13.3%
15.5%
18.4% 27.0%
56.6% 52.3%
1H 2015 1H 2016
Overseas Fixed Income Overseas Fixed Income Portfolio
Corporate Bonds
US Agency
MBS/Bond
Government Bonds
Comments
Overseas fixed income grew 24.8% YoY,
mainly deployed in emerging market
USD-denominated government bonds
and international bonds listed in domestic
OTC
International bonds offer average yield
before hedging of 4.5%, which after
hedging is still significantly higher than
domestic bonds. As of end of 1H 2016,
SKL held international bonds of
NT$318.7bn
Driven by portfolio reallocation, interest
income for 1H 2016 increased
NT$4.90bn compared to 1H 2015, up
16.6%
As low interest rates persist, SKL will
invest in emerging market government
bonds and overseas corporate bonds to
stabilize recurring income
Non-US Agencies
NT$bn
Note:
(1) Due to rounding, asset allocation figures may not add up to 100%
24.8%
955.1 1,191.5
International Bonds
Listed in Domestic
OTC

20
7.5 8.6 8.3
7.6
2013 2014 2015 2016
Recurring Income
Recurring Yield
Before Hedging After Hedging Before Hedging After Hedging
NT$bn
Real Estate Rental Income
Domestic and Foreign Cash Dividend
NT$bn
4.3 4.2
2.1 2.0
2014 2015 1H 2015 1H 2016
3.49%
2.85%
3.69%
3.25%
1H 2015 1H 2015 1H 2016 1H 2016
(est.)

21
64.2% 15.0%
4.9%
15.8%
Mix of Hedging Strategies Used Comments
Annualized hedging cost for 1H 2016
was 0.73%; FX volatility reserve was
NT$5.44bn
Hedging ratio was 80.1%, including
CS, NDF, and naturally-hedged
foreign currency policies position.
Mid- to long-term target of hedging
ratio ranges from 65% to 90% under
stringent risk management
Among traditional hedges, CS and
NDF accounted for 71% and 29%,
respectively
AFS(1) position in foreign equities
accounted for 4.9% and was not
marked to market in income
statement
Hedging Strategy
Total=NT$1,291.7bn
Equity AFS
position (1)
CS and
NDF (2)
Note:
(1) Available for sale position
(2) Currency swaps and non-delivery forwards
Foreign currency
policies position
USD &
other
currencies

22
Investment Strategy
Strong ALM
Discipline
Well-diversified
Portfolio
Cost-effective
Currency Hedging
Enhance
Investment Risk
Management
Develop Strategic Asset Allocation based on liability profile and capital budget
Deploy funds from NTD policies in international bonds listed in domestic OTC
and funds from FX policies in foreign bonds to enhance recurring yield
Diversification by asset class (equity, credit, currency, commodity, real estate)
Achieve diversification and yield pick-up through overseas investments.
Continue to deploy in corporate bonds with rating of A- and above to increase
fixed interest income
Control exposure to assets with higher volatility
Consider current situations and characteristics of asset and liability to
effectively manage overall investment risks through stringent SAA and TAA
plans
Strictly manage market, credit and business risks to cope with impacts of low
interest rates on financial markets
Dynamically adjust FX hedging ratio. Mid- to long-term target of CS, NDF,
and naturally-hedged foreign currency policies position together ranges
from 65% to 90%
Target hedging cost at 100 bps or below in the mid- to long-term

23 Confidentiality level : 版本(日期):103/09 V1
I. SKFH
II. Life Insurance Business
III. Banking Business
IV. Appendix • Market opportunities
• SKL Premium
• EV & AV Result
• SKL China Development Strategy
Agenda
I. SKFH
II. Life Insurance Business
III. Banking Business
IV. Appendix • Market opportunities
• SKL Premium
• EV & AV Result
• Agents and Marketing Transformation Projects
• SKL China Development Strategy
• Capital Adequacy
Agenda

24
Shin Kong Bank
2015 Loan Breakdown Financial Overview
NT$bn 2015 2014 2013 Credit Cards 0.4%
Corporate
45.4% Mortgage
39.9%
Car Loans 0.9%
Other Consumer Loans 5.7%
Unsecured Loans 7.7%
Total Loan: NT$487.73bn Note:
(1) Includes credit cards revolving balance but excludes overdue receivables
(1)
10th largest domestic private bank by total assets in Taiwan
Over 2 million customers and 106 branches with 51 located in the Greater Taipei area and 1 in Hong Kong
Offer a wide range of banking products including credit cards, mortgages, car loans, deposits, other consumer finance and corporate products
Established a representative office in Ho Chi Minh City, Vietnam in 2007
Hong Kong branch was officially opened for operations in May, 2011
Set up a representative office in Yangon, Myanmar in September, 2015
Total Loans(1) 450.82 482.54 487.73
Total Deposits 614.52 643.68 679.59
Net Income 4.06 5.16 5.03
Total Assets 693.24 759.91 788.39
Shareholders’ Equity 36.63 41.34 45.78

25
SKB – 1H 2016 Overview Due to prudently controlled funding cost, net interest income increased
3.2% YoY to NT$5.21bn. Driven by growth in wealth management fee
income, net fee income grew 8.1% YoY to NT$1.63bn. Consolidated
after-tax profit for 1H 2016 was NT$2.22bn.
Deposit balance was NT$644.24bn; demand deposit ratio increased
from 38.90% to 41.14% in Q2 2016. Corporate loan started to grow in
Q2 2016; total loan balance reached NT$490.20bn, 2.8% higher QoQ.
NIM and NIS was 1.46% and 1.96% respectively as of end of Q2 2016.
SKB will continue to optimize deposit and loan structure and keep
interest spread stable.
Bancassurance fee income for Q2 2016 grew 50.5% QoQ to
NT$429mn, driving wealth management income for 1H 2016 to
NT$992mn, up 21.4% YoY.
NPL ratio and coverage ratio were 0.19% and 647.29% respectively,
better than industry average.

26
Comments YTD Growth NT$bn
Loan Mix
Note: Due to rounding, loan mix may not add up to 100%
Loan balance as of end of Q2
2016 was NT$490.20bn, up
0.5% YTD. Corporate and
consumer loans grew 3.7% and
2.0% QoQ respectively,
indicating recovery of loan
growth momentum
SKB will actively participate in
overseas syndicated loan to
increase loan-to-deposit ratio
and keep interest spread stable
Focused on risk control, SME
loans mainly with collaterals or
backed by Credit Guarantee
Fund
Total -Unsecured
-Car Loans
-Credit Cards
-Other
Consumer
Loans
-Mortgages
-Corporate 45.4% 43.7% 44.1%
39.9% 41.3% 40.9%
5.7% 5.7% 5.7% 0.4% 0.4% 0.4%
0.9% 1.0% 0.9% 7.7% 8.0% 8.0%
2015 Q1 2016 1H 2016
488 477 490 0.5%
4.3%
3.7%
-4.3%
1.3%
3.0%
-2.4%

27
Interest Income
Net Interest Spread
Net Interest Margin Comments
SKB will continue to optimize
deposit and loan structure to keep
interest spread stable
NIM and NIS was 1.46% and
1.96% respectively for Q2 2016.
NIS for 2016 expected to remain
at similar level of 2015
SKB will continue to:
– Strengthen cash management
business and lower cost of
funds, and
– Adjust deposit and loan
structure, as well as enhance
fund utilization, and
– Grow overseas syndicated
loan to facilitate international
business
1.47% 1.48% 1.48% 1.46%
Q3 2015 Q4 2015 Q1 2016 Q2 2016
1.93% 1.94% 1.98% 1.96%
Q3 2015 Q4 2015 Q1 2016 Q2 2016

28
560
793
1H 2015 1H 20161H 2015 1H 2016
Net Fee Income / Total Income
FYP
Fee Income
Bancassurance
Fee Income Breakdown
WM (incl.
Bancassurance)
Total =
Loan
Credit Card
NT$mn
FX, Trust &
Others
Note: Due to rounding, fee income breakdown may not add up to 100%
Fee Income
NT$mn
20.2%
25.0%
Q1 2016 Q2 2016
7,568
10,986
26.9% 24.9%
13.9% 12.1%
39.9% 44.3%
19.3% 18.7%
1H 2015 1H 2016
2,008 2,153

29
Wealth Management
AUM
WM Income
Note:
(1) Wealth management income includes income from structured deposits
(2) AUM does not include policy value reserve
Bancassurance fee income for Q2 2016 grew 50.5%
QoQ to NT$429mn, driving wealth management
income for 1H 2016 to NT$992mn, up 21.4% YoY
Marketing efforts to be refocused on insurance in
August and September to extend bancassurance
momentum
Besides insurance products, mutual funds actively
promoted in 2H 2016, driving number of orders
through regular saving plan significantly higher in
July
NT$bn
NT$mn
64.4 64.6 64.8 64.6
Q3 2015 Q4 2015 Q1 2016 Q2 2016
418 461 408
584
Q3 2015 Q4 2015 Q1 2016 Q2 2016
Wealth Management Center

30
Asset Quality
NPL Ratio New NPL Generation
NT$mn
Coverage Ratio New NPL generated in Q2 2016 was
NT$293mn, decreasing consecutively for 2
quarters since Q4 2015
NPL ratio was 0.19%, and coverage ratio was
647.29%, better than industry average
Q3 2015
0.19% 0.19% 0.19% 0.19%
Q3 2015 Q4 2015 Q1 2016 Q2 2016
712.03% 697.19% 681.13% 647.29%
Q3 2015 Q4 2015 Q1 2016 Q2 2016
377.4
292.7
Q1 2016 Q2 2016

31 Confidentiality level : 版本(日期):103/09 V1
I. SKFH
II. Life Insurance Business
III. Banking Business
IV. Appendix • Market opportunities
• SKL Premium
• EV & AV Result
• SKL China Development Strategy
Agenda
I. SKFH
II. Life Insurance Business
III. Banking Business
IV. Appendix • Market opportunities
• SKL Premium
• EV & AV Result
• Agents and Marketing Transformation Projects
• SKL China Development Strategy
• Capital Adequacy
Agenda

32
60 58
4 4
30 29
6 9
1,123.2 1,063.6 1,081.5 1,151.1 1,203.2
1,287.9
1,477.2 1,601.4 1,584.8
Source: Insurance Institute
Life FYP
NT$bn
Growth
Percent
Life renewal premium
NT$bn
10 2007 08 09 11 14
Growth
Percent
43.3
8.4 -1.0 8.1
New business breakdown
Percentage
New business channel mix
Percentage
6.3
2014 2015
Variable interest
rate linked
Investment linked
Accident and
health
Traditional life
2014 2015
Bancassurance
Traditional agents
13.8
-5.3
Insurance opportunity:
Changes in products and channels
1.7
12
8.2 25.6
13
6.4
-14.4
5.0
Others
19.6
7.0
2015 42 41
52 54
6 5
751.9 855.3
925.1
1,162.0
995.1
1,190.4 1,106.3 1,169.7
1,186.3
-7.1
14.7
5.7 1.4

33
Insurance opportunity:
High penetration but low density
7.5%
9.3%
9.7%
12.0%
13.3%
15.7%
UK
Japan
Finland
SouthAfrica
HongKong
Taiwan
Life Insurance Premiums/GDP, %
Source: Swiss Re, Sigma No.3/2016
Rank Rank
1
5
2
3
4
6
1
5
2
3
4
6 3,397
3,513
3,535
4,050
4,079
5,655
Taiwan
Denmark
Luxembourg
Finland
Switzerland
Hong Kong
Life insurance expense per capita, US$
34
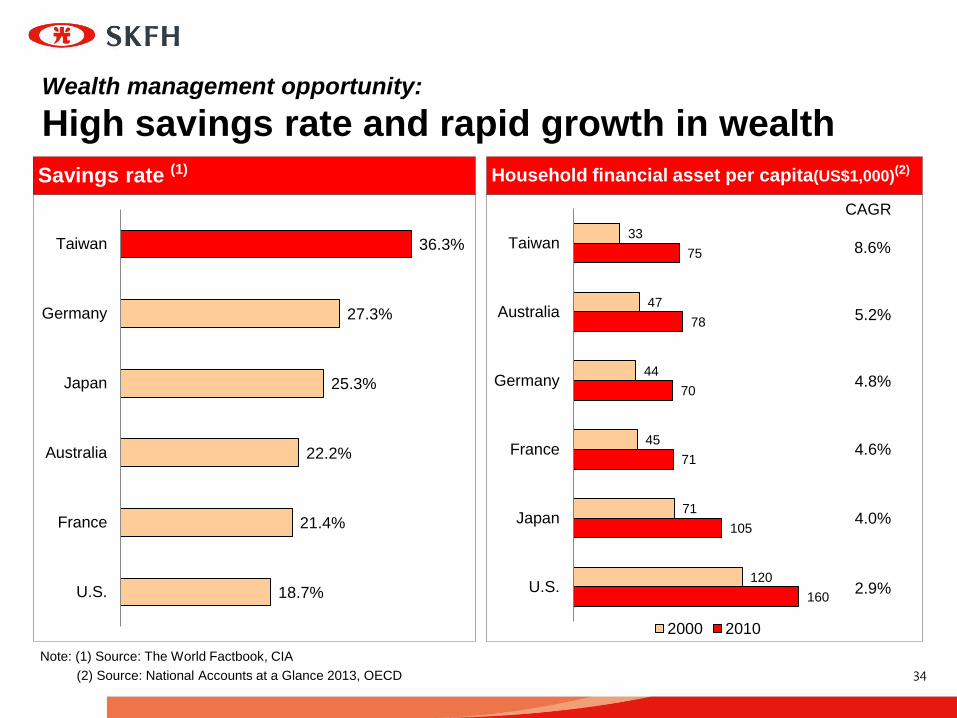
Wealth management opportunity:
High savings rate and rapid growth in wealth
Savings rate (1) Household financial asset per capita(US$1,000)(2)
Note: (1) Source: The World Factbook, CIA
(2) Source: National Accounts at a Glance 2013, OECD
18.7%
21.4%
22.2%
25.3%
27.3%
36.3%
U.S.
France
Australia
Japan
Germany
Taiwan
160
105
71
70
78
75
120
71
45
44
47
33
U.S.
Japan
France
Germany
Australia
Taiwan
2000 2010
CAGR
8.6%
5.2%
4.8%
4.6%
4.0%
2.9%

35 Confidentiality level : 版本(日期):103/09 V1
I. SKFH
II. Life Insurance Business
III. Banking Business
IV. Appendix • Market opportunities
• SKL Premium
• EV & AV Result
• SKL China Development Strategy
Agenda
I. SKFH
II. Life Insurance Business
III. Banking Business
IV. Appendix • Market opportunities
• SKL Premium
• EV & AV Result
• Agents and Marketing Transformation Projects
• SKL China Development Strategy
• Capital Adequacy
Agenda

36
SP / RP Breakdown NT$bn
1H 2016 FYP Single
Premium
Regular
Premium
Flexible
Payment Total
Traditional 31.58 23.46 55.04
Investment-linked
VUL 0.03 0.32 0.35
Structured note 0.23 0.23
Interest sensitive
Annuity 0.00 0.01 0.01
Life
PA, health and others(1)
2.41 2.41
Total 31.81 25.90 0.33 58.04
Share 54.8% 44.6% 0.6% 100.0%
Note:
(1) Long-term disability Type A policies are classified as health insurance

37
94.1 104.3
2.8
2.2 0.1
0.0 20.4
21.1
1H 15 1H 16
Growth
Total
Driven by FYP of traditional
products up 28.0% YoY, total
premium of traditional products
grew 10.8% YoY and overall
total premium increased 8.6%
YoY
Bancassurance channels
focused primarily on sales of
whole life savings products,
rather than interest-sensitive
annuities
PA, Health & Group products
grew steadily YoY
Total Premium – 1H 2016 NT$bn
PA, Health & Group (1) Interest Sensitive
Investment Linked
Traditional
Comments
127.6
117.5 3.2%
-87.5% -23.9%
10.8%
8.6%
Note:
(1) Long-term disability Type A policies are classified as health insurance
Market Share = 8.2%

38
Agent Number and Productivity by Tenure
1,189 490 715 471
611 424
4,604 8,504
Less than 6Months
6–12 Months
1–2 Years 2–3 Years 3–5 Years 5–7 Years Over 7Years
Total
0.97 1.63 1.99 2.44 2.38 3.08 3.95
Source: Shin Kong data
Average FYP Sold (NT$mn)
2015

39 Confidentiality level : 版本(日期):103/09 V1
I. SKFH
II. Life Insurance Business
III. Banking Business
IV. Appendix • Market opportunities
• SKL Premium
• EV & AV Result
• SKL China Development Strategy
Agenda
I. SKFH
II. Life Insurance Business
III. Banking Business
IV. Appendix • Market opportunities
• SKL Premium
• EV & AV Result
• Agents and Marketing Transformation Projects
• SKL China Development Strategy
• Capital Adequacy
Agenda

40
SKL - EV & AV Results Unit: NT$bn
2014.12 2015.12 YoY growth
In-force business investment yield
NTD 4.08%~5.10%
USD 4.64%~6.09%
Equivalent investment yield: 4.53%
(rolling over to 2015: 4.57%)
NTD 4.05%~5.10%
USD 4.32%~6.09%
Equivalent investment yield: 4.46%
--
Future one year’s new business
investment yield
NTD 4.13%~5.10%
USD 4.63%~6.02%
NTD 4.06%~5.10%
USD 4.25%~5.68% --
Adjusted NAV 185.4 164.8 -11%
VIF 111.7 121.4 9%
COC 58.7 70.6 20%
EV 238.4 215.7 -10%
EV / per share (SKL / SKFH) 41.1 / 24.3 37.2 / 21.1 --
V1NB 17.8 16.8 -6%
AV – 5 years NB 297.1 273.8 -8%
5-year AV / per share (SKL / SKFH) 51.2 / 30.2 47.2 / 26.8 --
AV – 20 years NB 383.1 349.8 -9%
20-year AV / per share (SKL / SKFH) 66.1 / 39.0 60.3 / 34.2 --
Note: Based on SKL’s outstanding shares of 5.80bn as of the end of 2015 (5.80bn as of the end of 2014)
Based on SKFH’s outstanding shares of 10.23bn as of the end of 2015 (9.83bn as of the end of 2014)

41
SKL - Estimate of Embedded / Appraisal Value
Note: Figures may not add up exactly due to rounding
Unit: NT$bn Valn Date: 31 Dec. 2015 Solvency Basis: 200% RBC
Base Case Scenario
All else equal except VIF
4.05%~5.10% (USD 4.32%~6.09%)
V1NB 4.06%~5.10%
(USD 4.25%~5.68%) RDR 10.5%
All else equal except
Inv Return -0.25%
Inv Return +0.25%
RDR -1.0%
RDR +1.0%
Adjusted NAV 164.8 164.8 164.8 164.8 164.8
VIF 78.3 161.4 121.4 139.9 106.8
Cost of Capital (COC) 72.8 68.2 70.6 66.0 74.2
EV after COC 170.3 258.0 215.7 238.7 197.4
V1NB after COC 15.5 18.1 16.8 19.4 14.6
AV (5 years NB) 223.8 320.6 273.8 307.5 246.6
AV (20 years NB) 293.8 402.8 349.8 405.6 305.9

42
69.5
64.3
-4.7
-0.6 +0.1
Changes between 31 Dec. 2014 and 31 Dec. 2015
broken down by components
SKL – Analysis of Change in Net Worth
Note: Figures may not add up exactly due to rounding
NT$bn
Unrealized Gains
on Available-for-Sale
Financial Assets
Statutory Net Worth
as of Dec. 31
2014
2015
Profits
Remeasurement of
Defined Benefit
Plans
Statutory Net Worth
as of Dec. 31
2015

43
64.3
72.6
21.2 6.7
-
164.8
Adjustments to Statutory Net Worth at 31 Dec. 2015
SKL – Adjusted NAV
Note:
(1) Included foreign exchange volatility reserve, and other items
(2) Figures may not add up exactly due to rounding
NT$bn
Unrealized
Gains
on Property
Adjusted NAV
as of Dec. 31
2015
Statutory Net Worth
as of Dec. 31
2015
Other
Adjustments (1)
Special Reserve
of Unrealized Gains
on Property

44
111.7
121.4
+0.1 +6.0 +2.7 -22.3 +23.2
Changes between 31 Dec. 2014 and 31 Dec. 2015
broken down by components
SKL – Analysis of Change in VIF
NT$bn
Portfolio
Changes
Model
Changes
Assumption
Changes
New
Business
VIF as of 31
Dec. 2015
Roll-forward
of Time
VIF as of 31
Dec. 2014
Note: Figures may not add up exactly due to rounding

45
17.8
16.8
-2.3
+0.9 +0.5
Changes between 31 Dec. 2014 and 31 Dec. 2015
broken down by components
Sales Volume Assumption
Changes
Product Mix
SKL – Analysis of Change in V1NB
NT$bn
V1NB as of 31
Dec. 2014
V1NB as of 31
Dec. 2015
Note: Figures may not add up exactly due to rounding

46 Confidentiality level : 版本(日期):103/09 V1
I. SKFH
II. Life Insurance Business
III. Banking Business
IV. Appendix • Market opportunities
• SKL Premium
• EV & AV Result
• SKL China Development Strategy
Agenda
I. SKFH
II. Life Insurance Business
III. Banking Business
IV. Appendix • Market opportunities
• SKL Premium
• EV & AV Result
• Agents and Marketing Transformation Projects
• SKL China Development Strategy
• Capital Adequacy
Agenda

47
Project objectives: core business enhancement,
including tied agent management, customer
resources, and product marketing Tied agent management (Agent+ Project):
1. Since January 2016, SKL has been working on Agent+ Project, cooperating with the Boston
Consulting Group (BCG) to drive agent force transformation. This project, coupled with a
three-year strategy, aims at increasing agent productivity and optimizing organization
structure through comprehensive marketing planning and standardized activity
management.
2. With enhancement on standardized activity management, tailored team-managing system,
younger recruits and practical training, FYPE per agent expected to grow at CAGR of over
15%, and young talent expected to account for 45% of the new recruits.
3. Pilot program started in July 2016. Formal implementation throughout nationwide branches
expected to start sequentially from Q4 2016.
Customer resources and product marketing (Inforce 2.0 Project):
1. SKL has partnered with Oliver Wyman to analyze in-force policies with big data based on
customer characteristics and identified segments. The deliberated action plan expected to
maintain customer stickiness and further create business leads and VNB.
2. SKL will integrate and strengthen the customer resource management (the "Turf"),
optimizing marketing effectiveness through systematic and transparent agent activity
management.

48
Optimize agent management: build standards → optimize organization → recruit young talent
Build standards and
thoroughly execute
(Mid 2016~)
Cut low performers and
optimize organization
(2017~)
Recruit young talent and
expand agent force
(Mid 2017~)
Key
Strategies Elevate productivity via
standardized process
Adjust role positioning
through solid system and
gradually cut low performers
After improvements,
actively recruit young
talent and help them build
careers
Differentiate management of
agents
Optimize resource allocation
mechanism
Encourage organization
development by managers
Optimize recruiting
propositions/channels
Standardize recruiting
methods
Standardize sales management
Elevate teaching methods
Optimize lecturer allocation
Management
System
Recruitment
Training

49
PM 4:45 Daily reports Record sales activities in Business Lead
Management System and list feedback and
difficulties
Supervisors review and counsel
Implement transparent, standardized and
mobile activity management
Activity management platforms have mostly been completed. The project focuses on implementation with discipline throughout all branches
Standardized activity management and follow-up with e-tools expected to fulfill procedures of planning, executing, and reporting
Record and analyze how tied agents use digitized sales tools, provide optimal training to enhance sales behavior and efficiency
Conclusion
AM 8:00 Daily preparation Check visiting schedules and customer
information on e-Mobile Secretary
View premium payment notification of
customers
AM 8:30 Morning briefing at branches Share new products’ highlights and sales
pitch in Multimedia Bookcase
Seek sales opportunities in Business Lead
Management System
AM 9:30 Joint-calls with different branches Share hot topics in Multimedia Bookcase
Discuss tips to make proposals to customers
AM 11:00 On the way to visits Conduct quick search for customer information in
Business Lead Management System
Make proposal drafts
AM 10:00 Weekly plans making Plan schedule of the next week in Business
Lead Management System and set concrete
goals
Look for high-potential customers in
Business Lead Management System
PM 1:00 Visit and sales activities View customers’ policy details in Life Talisman
and complete policy application in Mobile e-Policy
Application
Provide digital services by e-Platform (e-Mobile
Insurance Payments and e-Mobile Customer Calls)

50
Digitized customer resource management
5.2%
7.4%
0.0%
1.0%
2.0%
3.0%
4.0%
5.0%
6.0%
7.0%
8.0%
the Turf target customers
Indicates actions by agents
Indicates actions by headquarters
Analyze customer segments (the "Turf") through big data, exploring customer value and needs, as
well as generating target customer list (Business Lead Management System).
Integrate mobile marketing tools and internal resources, including products, services and activities
to boost business growth.
Identify service and protection
needs from customer records
Use target customer list &
mobile marketing tools
Customer visits and activity
management
Analyze visit results
Feedback
1 Data mining with
analytic tools
2
3 4
5
Including customer
characteristics, visit
reports, repurchase
analysis
Note: Data gathered in the first half of 2016
Business Lead Management System
facilitates precise marketing, enhancing
customer repurchase rate

51
2.2
3.3 2.7
2015 2018
37% 45%
2015 2018
Three-year target:
increase productivity per agent and strengthen
recruitment of young agents
New non-supervisory agents under age 30 (%)
Comment Enhance FYPE per agent
Strengthen recruitment of young agents
With FYPE per agent growing
at CAGR of over 15%, SKL
expected to catch up and lead
peers in agent productivity
within three years
The percentage of new recruits
under age 30 expected to
reach 45%, building more
youthful agent force
SKL Average of major peers
NT$mn CAGR
>15%

52 Confidentiality level : 版本(日期):103/09 V1
I. SKFH
II. Life Insurance Business
III. Banking Business
IV. Appendix • Market opportunities
• SKL Premium
• EV & AV Result
• SKL China Development Strategy
Agenda
I. SKFH
II. Life Insurance Business
III. Banking Business
IV. Appendix • Market opportunities
• SKL Premium
• EV & AV Result
• Agents and Marketing Transformation Projects
• SKL China Development Strategy
• Capital Adequacy
Agenda

53
China insurance market is growing
rapidly and ranked number 4 in the world
49.9
210.8
2006 2015
Total life premium
98
125
145
150
211
214
344
553
SouthKorea
Germany
Italy
France
China
U.K.
Japan
U.S.
Total life premium 2015
CAGR=
+17%
US$bn
Source: Swiss Re, Sigma No.3/2016

54 Confidentiality level : 版本(日期):103/09 V1
I. SKFH
II. Life Insurance Business
III. Banking Business
IV. Appendix • Market opportunities
• SKL Premium
• EV & AV Result
• SKL China Development Strategy
Agenda
I. SKFH
II. Life Insurance Business
III. Banking Business
IV. Appendix • Market opportunities
• SKL Premium
• EV & AV Result
• Agents and Marketing Transformation Projects
• SKL China Development Strategy
• Capital Adequacy
Agenda

55
Capital Adequacy
CAR of SKFH RBC of SKL
BIS of Shin Kong Bank
123.6%
135.0%
124.7%
109.8%
2013 2014 2015 1H 2016
285.1% 309.1%
267.8% 227.0%
2013 2014 2015 1H 2016
8.1% 8.5% 9.4% 9.6%
2.5% 2.4% 2.4% 2.9%
2013 2014 2015 1H 2016
Tier 2
Tier 1
BIS 10.6% 11.8%
10.9% 12.5%