Embed Size (px)
Citation preview

Shine Report 2018 1
Shine Literacy Project Report 2018
Background
In 2018 twenty five schools were part of the Shine network of schools working together to implement the Sounds Like Fun approach to raise literacy achievement. The focus was on Years 1 to 3 classrooms for most schools. In a small number of schools the focus was on Year 1 and 2 classrooms. Our goal was to lift achievement by ensuring the foundation skills for literacy are taught explicitly from school entry using a language to literacy approach, so that these are secure when students began to use them for independent reading, writing and spelling. This year we have also focused on identifying the key elements that have led to improved literacy outcomes for students in our Shine schools. In order to measure these literacy outcomes we asked all schools to use common standardized assessment tools and to use the beagle® assessment App to enter and analyse the data to assist teachers to understand what the data means and to help with targeted instructional planning. Detailed results of these assessments follow in this report.
Results and contributors to success
Results this year were measured by looking at the shift in achievement from the start to the end of the year for each year group of students. We used the Effect Size Shift measure to show the impact of instruction over the year. All schools taking part made significant improvements to students’ literacy outcomes with some remarkable Effect Size Shifts. What this means is that all schools in the project achieved greater success than would be expected in a ‘normal’ year’s learning. We have identified the following factors as being key contributors to the Shine schools’ success:
• Support from Principals and Lead Teachers to lead changes in teaching practice
• Increased skill and consistency in teachers’ implementation of the Sounds Like Fun approach across junior classes
• Innovation in practice – teachers are helping develop, shape and implement new teaching strategies and new assessment processes (assessments for oral language and writing) which are shared across the cluster
• Increased teacher knowledge and understanding of the acquisition of literacy skills and greater confidence with analysing literacy problems
• Increased teacher skill and understanding about assessing achievement, analysing and interpreting assessment data via beagle and using this to drive teaching

Shine Report 2018 2
The success of this project has been enhanced by significant donations from The Todd Foundation and The Wright Family Foundation which have allowed us to provide the following:
• Resources for all junior classrooms and Year 1-3 students.
• Lead Teacher PLD (6 meetings over the year) which provided support and leadership mentoring.
• Regular PLD for Year 1-3 teachers (13 sessions in total run over the year) focusing on key areas where there are gaps in teacher knowledge.
• Common, standardized assessment tools which allowed us to compare results across the cohort.
• beagle licenses for all schools which has supported teachers to securely store, analyse and interpret assessment data and link this to targeted instruction
• The employment of Mary Jones to help coordinate the project and to play a specific role in supporting Lead Teachers to manage change in their schools
• Production of videos of the key PLD sessions which are now freely available online to support in-school PLD (www.joyallcock.co.nz/sounds-like-fun-pld/)
Beyond 2018
Towards the end of Term 3 we asked schools to complete a survey about their involvement in this project and their needs for the future. Our goal is to ensure the success schools have achieved is self-sustaining and to continue to investigate ways to improve outcomes for all students. One outcome of this survey was that schools asked for their Year 4 to 8 teachers to receive PLD to support the literacy achievement in middle and senior classes. In 2019 we will provide the following:
• PLD for Year 4-7 teachers (release paid by schools but PLD provided by Joy Allcock at no cost)
• Introductory session for new Year 1-3 teachers in Shine schools (release paid by schools but PLD provided by Joy Allcock at no cost)
• PLD support online – the key videos to support Year 1-3 teachers using the Sounds Like Fun approach are available at no cost on www.joyallcock.co.nz/sounds-like-fun-pld/ Other videos to support teachers in Years 4-8 are also available on this site.
• Teacher and student resources for Year 4-8 classes
• beagle licenses and training for schools for 2019 with in-depth analysis of achievement data and links to instructional practice
• Lead Teacher PLD three times per year (release paid by schools) with Mary Jones and Joy Allcock

Shine Report 2018 3
Assessments Assessments give teachers a snapshot of their students’ achievement. They should also provide teachers with the opportunity to drill down to find out what skills and knowledge students have acquired, which students need support or extension, and how instruction should be tailored to meet these needs. Following is a description of the assessments used in 2018. School Entry Checklist This year Shine schools have been trialling a School Entry Checklist which is designed to identify students needing more assessment in the area of oral language, book knowledge and phonological and phonemic awareness skills. Phonological Awareness We used the Sutherland Phonological Awareness Test to assess and track students whose school entry results showed that phonemic awareness was an area of concern. This is an individually administered assessment. Code Knowledge We tracked students’ acquisition of knowledge of the alphabet and the alphabetic code using Sounds Like Fun assessments – Letter Name and Letter Sound Knowledge Assessment and Sound to Letter Knowledge. Reading and Spelling We used the Hodder Group Reading Test to measure reading progress and the Hodder Diagnostic Spelling Test to measure spelling. These are standardized and reliable tests that are administered to groups of children and they allow the results to be accurately compared. Writing We have been trialling a writing analysis App to measure and understand the acquisition of writing skills. Writing results are not available for this report because we are still building the data base for working out the norm for different age groups. A separate report on writing will be presented as soon as the data base is of a sufficient size.

Shine Report 2018 4
Achievement Data
Effect Size Effect Size Shifts are calculated using same student/same assessment data and are useful in measuring the rate of learning after a strategy or intervention has been implemented.
-0.15 - 0.15 Negligible impact Normal progress
0.15 - 0.45 Small/Medium Up to 2 times normal rate of learning
0.45 - 0.75 Medium/Large 2-3 times normal rate of learning
0.75+ Large/Very Large 3+ times normal rate of learning
REF: beagle
Year 1 Table 1: School Entry Checklist 198 students completed this
Book knowledge /6 Oral Language /13 Phonological and Phonemic Awareness /8
Less than 4 13.94% Less than 8 29.85% 0–3 57.22%
More than 4 86.06% More than 8 70.15% 3-6 26.86%
6-8 15.93%
Comment It was clear that most students had good knowledge of simple concepts about print (Book Knowledge) and 70% were able to complete the oral language questions successfully. The Phonological and Phonemic Awareness section was difficult for approximately 60% of students. The results provide us with information to tailor instruction and to share with the early childhood centres that feed into our schools.

Shine Report 2018 5
Table 2: Letter Name Knowledge
Assessment 1 Sounds Like Fun - Recognising and naming letters of the alphabet
Students First test Average /26
Second test Average /26
Effect Size shift
Year 1 585 results over 2018
18.21
N/A
137 students did the test twice
14.9 22.7 1.1
Year 2 211 results over 2018
19.55
N/A
62 students did the test twice
17.5 22.9 .8
Year 3 122 results over 2018
25.15
N/A
40 students did the test twice
24.9 25.8 .5
Comment Letter Name Knowledge should be secure by the end of Year 1 and it is for the majority of students. Students whose knowledge is not secure by the end of Year 1 need specific instruction and their progress tracked. The majority of students in Year 1 only completed the test once because they knew the names of most letters. Those with lower results repeated the test (137 students) and the diminishing number of students in Year 2 and 3 were students who had not made the expected progress in Year 1 who were being tracked over time. The effect size shifts reflect the increase in knowledge across the years – the more knowledge students have the less room there is to move and therefore the lower the Effect Size.
Shine Report 2018 6
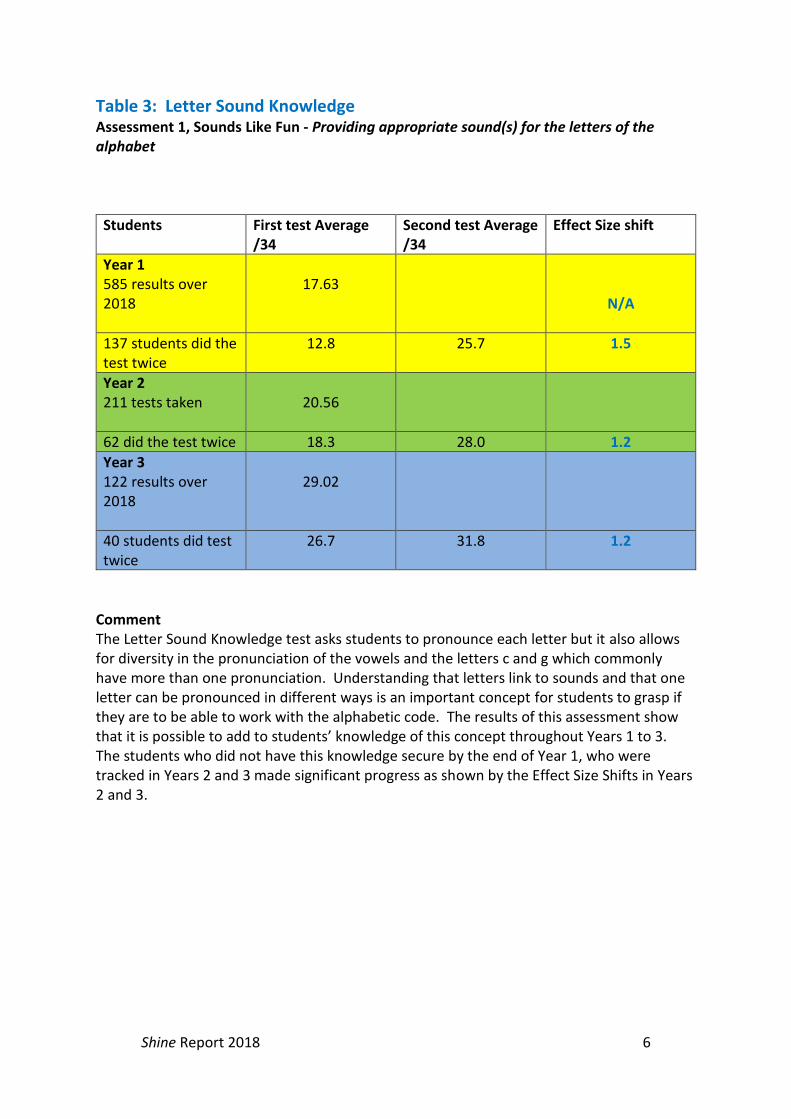
Table 3: Letter Sound Knowledge
Assessment 1, Sounds Like Fun - Providing appropriate sound(s) for the letters of the alphabet
Students First test Average /34
Second test Average /34
Effect Size shift
Year 1 585 results over 2018
17.63
N/A
137 students did the test twice
12.8 25.7 1.5
Year 2 211 tests taken
20.56
62 did the test twice 18.3 28.0 1.2
Year 3 122 results over 2018
29.02
40 students did test twice
26.7 31.8 1.2
Comment The Letter Sound Knowledge test asks students to pronounce each letter but it also allows for diversity in the pronunciation of the vowels and the letters c and g which commonly have more than one pronunciation. Understanding that letters link to sounds and that one letter can be pronounced in different ways is an important concept for students to grasp if they are to be able to work with the alphabetic code. The results of this assessment show that it is possible to add to students’ knowledge of this concept throughout Years 1 to 3. The students who did not have this knowledge secure by the end of Year 1, who were tracked in Years 2 and 3 made significant progress as shown by the Effect Size Shifts in Years 2 and 3.

Shine Report 2018 7
Table 4: Sound to Letter Knowledge Assessment 2 Sounds Like Fun - Writing the sounds of English
Students First test Average /45
Second test Average /45
Effect Size shift
Year 1 651 results over 2018
29.83
N/A
147 did the test twice
24.7 33 .8
Year 2 1342 results over 2018
32.8
N/A
501 students did the test twice
29 36.9 .8
Year 3 365 results over 2018
36.41
N/A
153 students did thetest twice
33.6 37.6 .5
Comment In order to encode and decode words students need knowledge of the relationships between sounds (phonemes) and letter patterns (graphemes). Teaching students to record the sounds of English builds a platform for the development of diverse alphabetic code knowledge. This knowledge accumulates across the years and the results show this gradual increase in knowledge between Years 1 and 3. The Effect Size Shift gains are all impressive but begin to taper off as the knowledge base increases – as there is less progress to be made.

Shine Report 2018 8
Hodder Group Reading Tests 1 and 2 Results are presented as stanines, showing Shine students’ achievement compared with the expected population norm. To achieve the same stanine at the start and end of a year, students need to make a good year’s progress. To improve a stanine level, students need to make more progress than would be expected in a year.
Figure 1: Year 1 – End of Year only Stanine Scores
Comment There were considerably more Shine students in the lower stanines than in the normal population at the end of Year 1. This profile is very similar to the profile of Year 2 students at the start of year 2.

Shine Report 2018 9
Figure 2: Year 2 – Start of Year Stanine Scores
Figure 3: End of Year
Comment Year 2 students made significant shifts over the year. The peak at the lower stanines from the start of the year is reduced and achievement raised in the middle and higher stanines.

Shine Report 2018 10
Figure 4: Year 3 - Start of Year Stanine scores
Figure 5: Year 3 - End of Year
Comment
The pattern of achievement for Year 3 students shows that many students who were achieving in the lower stanines have moved into higher stanine groups over the year. Achievement in the highest stanines has not changed much.

Shine Report 2018 11
Table 5: Hodder Group Reading Test 1
Stanine scores compared with population norms
Students % of students in Stanines 1-3 (Norm 23%)
% of students in Stanines 4-6 (Norm 54%)
% of students in Stanines 7-9 (Norm 23%)
Year 1 End of Year only 417 results
42.45
47.72
9.60
Year 2 Start of Year 668 results
44.61
39.07
16.01
Year 2 End of Year 795 results
33.08
37.60
26.42
Year 3 Start of Year 545 results
44.40
33.03
21.47
Year 3 End of Year 559 results
36.67
44.99
18.60
Comment The table of results above shows that there were considerably more students in Shine schools achieving in stanines 1-3 than in the normal population and fewer in the highest three stanines. However, over the year approximately 11% of Year 2 students who achieved in stanines 1-3 at the start of the year moved beyond this by the end of the year and the number of students achieving in the highest three stanines rose above the population norm. There was a similar reduction on the number of students achieving in the lowest stanines in Year 3 but not the same shift in achievement in the highest stanines.

Shine Report 2018 12
Table 6: Effect Size Shifts – Hodder Group Reading Tests
Hodder Group Reading Test 1 599 Year 2 students completed Hodder Group Reading Test 1 at the start and end of 2018
Effect Size Shift .8 Achievement Mean shift 14.1 – 22.4 Achievement Median shift 11-22 281 Year 3 students completed Hodder Group Reading Test 1 at the start and end of 2018
Effect Size Shift .8 Achievement Mean shift 15.6 – 22.9 Achievement Median shift 13-22 Hodder Group Reading Test 2 59 Year 3 students completed Hodder Group Reading Test 2 at the start and end of 2018
Effect Size Shift .4 Achievement Mean shift 15.9 – 20.6 Achievement Median shift 15-18 NOTE: Approximately 200 Year 3 students sat Hodder Group Reading Test 1 at the start of the year and Test 2 at the end of the year, so their results are not able to be included in the Effect Size Shift results.

Shine Report 2018 13
Hodder Diagnostic Spelling Test Results are presented as stanines, showing Shine students’ achievement compared with the expected population norm. To achieve the same stanine at the start and end of a year, students need to make a good year’s progress. To improve a stanine level, students need to make more progress than would be expected in a year. Note This assessment measures the ability to correctly spell common words. Many students made considerable progress over the year but their score remained the same because they still did not spell the word correctly. For example: At the start of the year a student may have written gl for girl – they were unable to write the /ur/ vowel sound - but at the end of the year they wrote gerl, choosing a correct pattern for the /ur/ vowel sound, but an incorrect pattern for spelling of this sound in girl. This test is diagnostic and teachers can use the results to discover the progress their students have made in acquiring spelling knowledge. The stanine scores do not however reflect this increase in spelling knowledge. Figure 6: Year 1 – End of Year only Stanine Scores
Comment There was a group of Year 1 students who found this test very challenging and the number of students achieving at Stanine 1 reflects this. The distribution of scores for other students closely resembles the population norms.

Shine Report 2018 14
Figure 7: Year 2 – Start of Year Stanine Scores
Figure 8: End of Year
Comment The number of students who achieved in Stanine 1 is similar from the start to the end of the year but there is a pattern of improved achievement beyond this.

Shine Report 2018 15
Figure 9: Year 3 - Start of Year Stanine scores
Figure 10: Year 3 - End of Year
Comment Although these graphs show that there are more Shine students achieving in stanine 1 than in the general population, this number has reduced over the year. The peak of the graph has moved from stanine 5 to stanine 6.

Shine Report 2018 16
Table 7: Stanine scores compared with population norms
Students % of students in Stanines 1-3 (Norm 23%)
% of students in Stanines 4-6 (Norm 54%)
% of students in Stanines 7-9 (Norm 23%)
Year 1 End of Year only 437 results
34.33
45.53
20.14
Year 2 Start of Year 652 results
51.07
32.21
16.72
Year 2 End of Year 702 results
43.59
30.49
25.93
Year 3 Start of Year 531 results
55.56
27.50
16.95
Year 3 End of Year 553 results
44.13
33.27
22.60
Comment Year 1 students show a different profile from Year 2 and 3 students. Although there are approximately 11% more students achieving in the lowest three stanines when compared with the population norm, the number achieving in the highest three stanines is close to the population norm. Over 50% of Year 2 and Year 3 students achieved in the lowest three stanines at the start of the year but this dropped by between 9 and 11% over the year. The number of students achieving in the highest three stanines rose to just above or just below the population norm. What these results show is that learning to spell words correctly was very difficult for a large number of students, particularly in Year 2 and 3. Correct spelling requires the student to access an accurate visual memory of a word. Many students cannot do this, particularly in the early years. Instead they spell words by recording the sounds they hear which means the word can sound right but look wrong. We have encouraged students to write words by sounding them out if they can’t recall the visual image, so that they gain confidence and increase the quantity of their writing. We need to look at the balance between writing words from memory, ‘sounding out’ words and providing strategies for correcting phonetic spellings in our instruction.

Shine Report 2018 17
Table 8: Effect Size Shifts
Hodder Diagnostic Spelling Test 1 539 Year 2 students completed the Hodder Diagnostic Spelling Test 1 at the start and end of 2018
Effect size shift: 1 Achievement Mean shift: 9.2 – 18.1 Achievement Median shift: 7 - 17
223 Year 3 students completed the Hodder Diagnostic Spelling Test 1 at the start and end of 2018
Effect size shift: .8 Achievement Mean shift: 10.5 – 18.2 Achievement Median shift: 8 – 15 Hodder Diagnostic Spelling Test 2 54 Year 3 students completed the Hodder Diagnostic Spelling Test 2 at the start and end of 2018
Effect size shift: .6 Achievement Mean shift: 11.2 – 18.1 Achievement Median shift: 9 - 20 NOTE: Approximately 250 Year 3 students sat Hodder Diagnostic Spelling 1 at the start of the year and Test 2 at the end of the year, so their results are not able to be included in the Effect Size Shift results.

Shine Report 2018 18
Investigation of results The concern with literacy achievement in New Zealand is the large gap that exists between those who do well in our education system and those who do not. It is clear from our results that this gap in achievement exists in the cohort of students taking part in the Shine Literacy Project. Our focus until now has been on changing teacher practice in the classroom. Using the Response to Intervention (RTI) framework, we have focused our efforts on Tier 1 (whole class) instruction. The achievement results from 2018 show that we have made significant progress in achievement, with every school achieving Effect Size Shifts that show considerably more than a normal year’s progress. This improvement in achievement is also evident when we look at the stanines in reading and spelling – moving up stanines from the start to the end of the year can only happen if students make more than a normal year’s progress. Teachers deserve to be proud of these results. However, we need to do more than measure progress globally. We need to find out what is happening to students at both ends of the achievement spectrum. What follows now is a closer analysis of the achievement gap in our schools. What it shows is that we need to focus our efforts on addressing the needs of students who need Tier 2 and Tier 3 (more intensive) instruction. Measuring Progress We used the online assessment App beagle to aggregate and analyse our data. beagle measures the mean (average), median (score at the mid-point of distribution) and achievement gap. When you have a mean and a median that are the same, you have achievement that is evenly spread across the group. If the median is less than the mean it shows that there are more students achieving in the lower ranges. If the median can be brought up close to the mean it shows that those in the lower ranges have improved. This is the pattern shown for Shine students in the Hodder Group Reading test results (see tables 9 and 10 below). Teachers using beagle can click on the student number for those whose progress improved, stayed the same or worsened and the list of students in their class in each group will appear. A link to Instructional Planning will then support the teacher to provide targeted instruction to meet the needs of these students. Table 9: Hodder Group Reading Test Year 2
Achievement Mean Raw scores /40
Achievement Median Raw scores /40
Achievement Gap Range between scores 0-40
Effect Size Shift
Number of students
Pre Post Change Pre Post Change Pre Post Change Improved No change
Worse
14.1 22.4 +8.3 11 22 +11 40 40 0 .8 518 14 67
Total – students with 2 or more results 599
Students with one result only (ignored) 213

Shine Report 2018 19
Table 10: Hodder Group Reading Test Year 3
Achievement Mean Raw scores /40
Achievement Median Raw scores /40
Achievement Gap Range between scores 0-40
Effect Size Shift
Number of students
Pre Post Change Pre Post Change Pre Post Change Improved No change
Worse
15.6 22.9 +7.3 13 22 +9 39 39 0 .8 242 10 29
Total – students with 2 or more results 281
Students with one result only (ignored) 217
Comment At the start of the year, the median scores for Year 2 and 3 students were somewhat lower than the means, indicating more students achieving in the lowest range. However, by the end of the year, the mean and median were very close, indicating that students in the lowest range had moved closer to the mean. The achievement gap (the range of scores from highest to lowest) did not change in Year 2 or 3 – there were still students achieving at both ends of the spectrum – 0/40 and 40/40. Table 11: Hodder Diagnostic Spelling Test Year 2
Achievement Mean Raw scores /40
Achievement Median Raw scores /40
Achievement Gap Range between scores 0-40
Effect Size Shift
Number of students
Pre Post Change Pre Post Change Pre Post Change Improved No change
Worse
9.2 18.1 +8.9 7 17 +10 37 40 +3 1.0 501 13 25
Total – students with 2 or more results 539
Students with one result only (ignored) 265
Table 12: Hodder Diagnostic Spelling Test Year 3
Achievement Mean Raw scores /40
Achievement Median Raw scores /40
Achievement Gap Range between scores 0-40
Effect Size Shift
Number of students
Pre Post Change Pre Post Change Pre Post Change Improved No change
Worse
10.5 18.2 +7.7 8 15 +7 36 40 +4 .8 204 9 10
Total – students with 2 or more results 223
Students with one result only (ignored) 268
Comment In Year 2 and 3, the medians were somewhat lower at the start of the year and this pattern remained unchanged over the year. For both groups there was a slight increase in the gap which means the gap between the highest and lowest scores widened slightly. These results suggest that for spelling, students in the higher achieving group did better than those in the lower achieving group.

Shine Report 2018 20
Sample Schools
After careful analysis of the results across the Shine schools, we found that some schools showed accelerated progress for their students when compared with other schools that had started the year in the same place. Below are the results from two schools (a Decile 1 and a Decile 10 school) that both made very similar significant shifts in achievement with their Year 2 students over 2018. What we found is that the decile ranking of these two schools made no difference to their achievement – both made similar, spectacular progress, which indicates that what happens in the classroom can have a significant impact on student achievement. Table 13: Hodder Group Reading Test 1 Year 2 Achievement
Mean Achievement Median
Achievement Gap Range between scores 0-40
Effect Size Shift
Pre Post Change Pre Post Change Pre Post Change
Decile 1 (19 students)
9.1 23.1 +14 8 22 +14 24 24 0 2.6
Decile 10 ( 33 students)
15.8 29.5 +13.7 15 32 +17 28 30 +2 1.8
Hodder Group Reading Test: Decile 1 Year 2 Figure 11: Start of Year Figure 12: End of Year
Hodder Group Reading Test: Decile 10 Year 2 Figure 13: Start of Year Figure 14: End of Year

Shine Report 2018 21
Comment Every student in these schools showed improved results over the year, which is a remarkable achievement. Although the mean and median scores were different between schools at the start of the year, both made the same rate of progress and both had no or a negligible change in the achievement gap, which indicates progress was evenly distributed across the groups. Both schools had significant Effect Size Shifts which is indicative of achievement that was well above what would normally be expected over a year. Table 14: Hodder Diagnostic Spelling Test 1 Year 2
Achievement
Mean Achievement Median Achievement Gap
Range between scores 0-40
Effect Size Shift
Pre Post Change Pre Post Change Pre Post Change
Decile 1 (18 students)
9.7 24.5 +14.8 8 23 +15 21 28 +7 2.1
Decile 10 (34 Students)
12.5 24.7 +12.2 12.5 25 +12.50 27 38 +11 1.5
Hodder Diagnostic Spelling Test: Decile 1 Year 2 Figure 15: Start of Year Figure 16: End of Year
Hodder Diagnostic Spelling Test : Decile 10 Year 2 Figure 17: Start of Year Figure 18: End of Year
Comment Measuring the gap (an increase in the gap in both schools) shows that improvements in progress for spelling were skewed more towards the higher achieving students in both schools. Both schools had significant Effect Size Shifts which is indicative of achievement that was well above what would normally be expected over a year.

Shine Report 2018 22
Summary In the 2016 PIRLS report, it was very clear that there is a significant gap between those who do well in our schools and those who do not. This has been an ongoing concern for New Zealand since PIRLS first began in 2001. In 2016, 27% of students taking part in PIRLS from New Zealand schools scored at the Low or Below the Low Benchmark and 41% scored in the High or Advanced Benchmark. Although this significant achievement gap still exists in our Shine population, many students moved up one or more stanines over the year. All schools in the Shine network achieved significant Effect Size Shifts showing that the progress their students made over 2018 was greater than would be expected in a normal year’s teaching. Despite this, there is a wide spread of results across schools. International research such as PIRLS use the mean, median and achievement gap to show the pattern of achievement within and between countries. We need to do the same in our classrooms if we are to make a difference and improve the outcomes for our lowest achieving students. Using beagle to identify students in need of more intensive instruction and tailoring this instruction to meet student needs will help to address this problem. Continuing to measure the achievement gap will show whether instruction is working to close the gap. We will continue to build on the achievements of the Shine Research Project (2014 – 2016), by working together to implement practice that has raised students’ literacy achievement across schools and across demographics. We know that we can accelerate students’ progress and we will continue to explore ways to increase this progress. We have received generous financial contributions from The Todd Foundation and The Wright Family Foundation and donations from other sources. The expert management of these funds and support from the Porirua Foundation has allowed us to provide beagle to all schools which supports teachers to accurately identify students’ needs and measure their progress. We have also been able to provide schools with a range of diagnostic assessment tools that will further investigate the learning needs of those students who have been identified as needing Tier 2 or 3 instruction. We will continue to work together as a committed group of professionals to make a difference to raising student achievement. Joy Allcock 21/02/2019