Embed Size (px)
Citation preview

Shipping Intelligence WeeklyIssue No. 1,303 21-Dec-2017 ISSN: 1358-8028
ClarkSea Index $12,166
Vessel Charter Rates This Week…1 Year VLCC TC Rate… | 1 Year Capesize TC Rate…
1 Year MR TC Rate… | 6-12m 2,750 TEU TC Rate…
Asset Prices This Week…VLCC N/B… $81.5m | Capesize N/B… $44.0m | 2,750 TEU N/B… $28.8m
VLCC 5yo… $64.0m | Capesize 5yo… $33.0m | 2,750 TEU 5yo… $13.8m
This Week's Analysis (see Back Page)
Taking The Temperature Of Shipping Heat - Still Chilly But A Little Bit Warmer All Around…
$24,750/day $18,500/day
$14,000/day $9,350/day
5
10
15
20
Dec
-11
May
-12
Oct
-12
Mar
-13
Aug
-13
Jan-
14
Jun-
14
Nov
-14
Apr
-15
Sep
-15
Feb
-16
Jul-1
6
Dec
-16
May
-17
Oct
-17
CONTENTS
Crude Tanker Spot Market p2 Product Tanker Spot Market p3
Large Bulk Carrier Market p4 Tripcharter Market, Freight Indices & Futures p5
Gas & Chemical Markets p6 Liner & Offshore Markets p7
Secondhand Prices p8 Sale & Purchase Market pi Recent Ship Sales by Vessel Type pii
Fleet Changes, Bunkers & Capital Market Activity piii Timecharter Fixture Record piv
The Timecharter Market p9 The Shipbuilding Market p10
The Recycling Market p11 Economic Indicators p12 Ship Demand Trends p13
World Fleets & Orderbooks p14-15 Analysis p16
Clarksons Research is respected worldwide as the most authoritative provider of intelligence for the global shipping industry. Clarksons Research is part of the Clarksons group, the world’s largest provider of shipbroking and integrated shipping services. For more detail about the Clarksons group visit www.clarksons.com.
The next edition of Shipping IntelligenceWeekly will be published on 5th January2018. Happy Christmas!
The leading online ship tracking systemTo find out more about the power of SeaNet, arrange a free trial or to subscribe, please visit www.clarksons.net/seanet
Roberts Bank
New YorkPhiladelphia
Hampton RoadsHouston New Orleans
LOOP
Selection of ports covered by the various market sectors in this report
St Eustatius
BonaireBolivar
Rio de JaneiroTubarao
Saldanha BayRichards Bay
Dar es Salaam
Lome
Bonny Offshore
Sullom Voe Primorsk
WilhelmshavenRotterdam
Lavera
ArzewEs Sider
Trieste
OdessaNovorossiysk
Augusta Agioi Theodoroi
Sidi Kerir
Ain SukhnaRas Tanura
Mumbai
Mundra Jamnagar
Gangavaram
Roberts Bank
New YorkPhiladelphia
Hampton RoadsHouston New Orleans
LOOP
Selection of ports covered by the various market sectors in this report
St Eustatius
BonaireBolivar
Rio de JaneiroTubarao
Mumbai
Mundra Jamnagar
GangavaramPipavav
Singapore
JakartaBanjarmasin
Dampier Hay Point
Sydney
Ningbo
Beilun OitaChiba
UlsanLongkou
Qingdao
Lice
nsed
to C
lark
sons
Res
earc
h S
ampl
e. D
istr
ibut
ion
is r
estr
icte
d; p
leas
e re
mem
ber
to a
ckno
wle
dge
the
sour
ce. S
hipp
ing
Inte
llige
nce
Wee
kly,
Issu
e 13
03Licensed to C
larksons Research S
ample. D
istribution is restricted; please remem
ber to acknowledge the source. S
hipping Intelligence Weekly, Issue 1303

Crude Tanker Spot MarketCrude Tanker Highlights
VLCC Single WS 2017 Average earnings $ per day VLCC Earnings
Voyage..... Dec 15 Dec 21 2017 2016 2017 Dec 15 Dec 21 This Week ....
23 280,000t Gulf - Europe 25 26 31 38,677 11,345 3,511 4,416 FIRMER!! 26%23 280,000t Gulf - US Gulf~ * 23 24 29 44,802 13,626 2,879 3,470 FIRM.... 21%23 265,000t Gulf - Japan * 53.5 52.5 58 41,455 20,821 15,140 13,580 WEAKER -10%23 265,000t Gulf - S.Korea * 51 47.5 55 38,527 17,503 12,562 9,212 WEAKER!! -27%23 270,000t Gulf - Sing 55 55 59 43,238 21,228 15,868 15,084 SOFTER -5%23 280,000t Gulf - Red Sea 57.5 57.5 62 48,742 24,734 19,133 18,352 SOFTER -4%23 260,000t WAF - China * 56.5 57 61 41,170 19,918 13,637 13,355 STEADY -2%23 260,000t WAF - US Gulf 55 55 65 54,070 27,976 16,756 16,621 STEADY -1%23 260,000t WAF - WC India^ 2.5 2.5 2.81 51,315 28,028 20,192 19,400 SOFTER -4%23 275,000t Caribs-Singapore^ 4 3.9 3.98 70,153 49,497 46,594 44,508 SOFTER -4%23 VLCC Ave. Earnings * 41,488 17,967 11,055 9,904 WEAKER -10%^ Lump sum in million dollars. ~VLCC earnings on the Gulf-US Gulf route are basis ballast to Bonaire.
Suezmax Single WS 2017 Average earnings $ per day Suezmax Earnings
Voyage..... Dec 15 Dec 21 2017 2016 2017 Dec 15 Dec 21 This Week ....
24 130,000t WAF - USAC 87.5 87.5 76 23,587 12,958 15,175 14,959 STEADY -1%24 130,000t WAF - Med* 87.5 87.5 78 25,209 14,054 15,842 15,559 STEADY -2%24 130,000t Med - Med * 87.5 82.5 82 30,073 17,656 18,188 15,478 WEAKER -15%24 140,000t Black Sea - Med* 90 90 86 33,485 20,615 20,893 20,674 STEADY -1%24 130,000t Gulf - WC India* 90 85 82 21,502 11,176 13,078 10,562 WEAKER -19%24 Suezmax Ave. Earnings * 27,567 15,875 17,000 15,568 WEAKER -8%
Aframax Single WS 2017 Average earnings $ per day Aframax Earnings
Voyage..... Dec 15 Dec 21 2017 2016 2017 Dec 15 Dec 21 This Week ....
25 100,000t Baltic - UKC * 70 75 82 27,143 15,796 7,082 9,080 FIRMER!! 28%25 80,000t Black Sea - Med * 120 120 110 22,227 16,258 18,282 18,102 STEADY -1%25 80,000t Sidi Kerir - Trieste * 105 107.5 107 22,135 15,174 12,797 13,349 FIRMER 4%25 80,000t Mellitah - Fos^ 105 110 109 15,866 9,058 5,701 7,215 FIRMER!! 27%25 80,000t Med - USAC 97.5 97.5 98 21,395 14,760 13,185 12,978 STEADY -2%25 80,000t UKC - UKC * 105 105 104 26,554 11,990 8,335 7,878 SOFTER -5%25 80,000t UKC - USAC 95 95 97 23,137 12,783 9,958 9,605 SOFTER -4%25 80,000t Gulf - East * 115 115 108 20,151 11,578 11,689 11,306 SOFTER -3%25 80,000t Indo - Japan * 100 107.5 103 21,991 12,280 10,177 11,746 FIRM.... 15%25 70,000t Caribs - US Gulf * 160 155 122 20,552 14,399 22,034 20,706 SOFTER -6%25 Aframax Ave. Earnings * 22,965 13,925 12,914 13,167 STEADY 2%
^Earnings and rate based on Es Sider - Fos before 20th February 2015.
Clarksons Research Page 2
36,90436,522
46,713
2015
44,99037,00336,53034,415
42,84050,292
40,205
37,977"Voyage Earnings" are estimated from spot freight rates (see footnote on page 4); */ # Indicates constituent routes of "Average Earnings".
21-Dec-17
32,43039,72932,12134,158
53,515
67,36676,40763,50876,16072,151
105,08564,846
2015
40,265
61,646
Crude Tanker Spot Earnings ($,000's/day)
2015
57,64968,36565,865
10
20
30
40
50
60
70
80
90
100
110
120
Dec'15
Feb'16
Apr'16
Jul'16
Sep'16
Nov'16
Jan'17
Mar'17
May'17
Jul'17
Sep'17
Nov'17
VLCC
Suezmax
Aframax
• VLCCs: Owners will generally feel disappointed with the overall stagnation in rates this week. Although there was a significant rush of cargoes from charterers eager to cover their business before Christmas from both the MEG and WAF at the start of the week, many owners were equally keen to employ their tonnage before the upcoming holiday break. As a result, rates have held relatively steady w-o-w.
• Suezmaxes: It was a slow week, with the expected Christmas rush not having materialised. Rates ex-WAF could fall, with the position list remaining long, leaving charterers in the driving seat. In the Med/Black Sea, ships being fixed away privately has led to rates holding steady w-o-w, with the rate on the Black Sea-Med route remaining at WS 90.
• Aframaxes: In the Med, positive sentiment from owners at the start of the week failed to fully materialise in rates. In the North Sea, a very active start to the week also failed to result in any significant improvement in rates, with the rate on the Baltic-UKC route now standing at WS 75.
Lice
nsed
to C
lark
sons
Res
earc
h S
ampl
e. D
istr
ibut
ion
is r
estr
icte
d; p
leas
e re
mem
ber
to a
ckno
wle
dge
the
sour
ce. S
hipp
ing
Inte
llige
nce
Wee
kly,
Issu
e 13
03Licensed to C
larksons Research S
ample. D
istribution is restricted; please remem
ber to acknowledge the source. S
hipping Intelligence Weekly, Issue 1303

Product Tanker Spot MarketProduct Tanker Highlights
Clean Product WS 2017 Average earnings $ per day Clean Earnings
Single Voyage... Dec 15 Dec 21 2017 2015 2016 2017 Dec 15 Dec 21 This Week ....
26 75,000t Gulf - Japan 110 100 105 16,533 10,139 9,864 7,272 WEAKER!! -26%27 55,000t Gulf - Japan 137.5 125 120 12,903 8,282 9,943 7,589 WEAKER -24%28 37,000t UKC - USAC * 160 165 140 10,659 8,938 10,551 10,902 FIRMER 3%28 37/38kt UKC-USAC-USG-UKC § 160/160 165/140 140/106 15,452 13,343 20,438 18,084 WEAKER -12%28 37,000t UKC- W. Africa * 180 185 159 13,483 9,687 11,116 11,377 STEADY 2%28 38,000t USG - ECSA * 215 205 167 14,757 12,467 17,237 15,918 SOFTER -8%28 35,000t Singapore-E Aus* 225 215 197 13,977 12,691 14,853 13,445 WEAKER -9%28 40,000t Korea-Singapore^ 0.39 0.36 0.36 18,509 17,300 19,057 16,436 WEAKER -14%28 35,000t WC India - Japan * 175 155 147 10,472 9,826 12,598 9,573 WEAKER -24%28 35,000t Gulf - E.Africa 212.5 205 182 12,081 10,533 12,802 11,733 WEAKER -8%28 40,000t Gulf - UKC * ^ 1.1 1.05 1.05 9,398 7,463 7,511 6,137 WEAKER -18%29 30,000t Med - Med # 195 215 157 8,243 6,513 11,143 14,278 FIRMER!! 28%29 30,000t Black Sea - Med # 210 230 170 9,682 7,935 12,289 14,693 FIRM.... 20%
Clean 'MR' Ave. Earnings * 12,124 10,199 12,311 11,225 WEAKER -9%Clean 'Hdy' Ave. Earnings # 8,962 7,224 11,716 14,486 FIRM.... 24%
^ Lump Sum in $million. § Earnings for a triangular voyage of UKC-USAC at WS 165, followed by USG-UKC at WS 140. See Sources & Methods.
Dirty Product WS 2017 Average earnings $ per day Dirty Earnings
Single Voyage... Dec 15 Dec 21 2017 2016 2017 Dec 15 Dec 21 This Week ....
31 55,000t Med - US Gulf * 120 130 119 14,875 9,607 8,419 10,086 FIRM.... 20%31 55,000t UKC - US Gulf * 120 130 119 15,727 10,430 8,900 10,590 FIRM.... 19%31 50,000t Caribs - US Gulf * 197.5 197.5 128 15,562 10,406 22,133 22,052 STEADY 0%33 30,000t Black Sea - Med 202.5 187.5 166 12,717 11,902 17,240 14,616 WEAKER -15%
Dirty Ave. Earnings * 15,388 10,148 13,151 14,243 FIRM.... 8%
VLCC Spot Monthly Fixture Record VLCC Spot Market
Market Activity... Average No. Number Last This Week ...
2015 2016 Jul '17 Sep '17 Oct '17 Nov '17 4 Wks
Fixtures: Gulf-West 19 21 12 6 13 14 11 DOWN BY..... -21%Gulf-East/Japan 90 91 94 99 97 74 59 DOWN BY..... -20%Gulf-Red Sea 5 3 1 1 1 0 0 #DIV/0! #DIV/0!Others 58 65 66 71 86 69 53 DOWN BY..... -23%
Total Number of Fixtures 173 179 173 177 197 157 123 DOWN BY..... -22%Vessels due to arrive in Gulf ~ 95 107 111 146 107 133 141 UP BY.... 6%VLCCs Spot in Gulf ~ No. 4 5 2 11 6 5 4 DOWN BY. -20%
000 Dwt 1,059 1,374 597 3,283 1,841 1,437 1,176 DOWN BY. -18%~ Source: Clarksons Platou brokers. As at the beginning of the month for historical data; for the next 4 weeks (vessels due) or this week (vessels spot) for current week's data.
Clarksons Research Page 3
144,144
26,85420,30026,548
Aug '17
11
21-Dec-17
064
153140
19,60422,191
78
24,46219,72621,44422,094
25,93826,852
2015
18,714
24,41621,47729,291
Product Tanker Spot Earnings ($,000's/day)
30,49724,84719,27626,87625,178
5
10
15
20
25
30
35
40
Dec'15
Feb'16
Apr'16
Jul'16
Sep'16
Nov'16
Jan'17
Mar'17
May'17
Jul'17
Sep'17
Nov'17
MR Clean Tanker Earnings
Handy Clean Earnings
Dirty Panamax Earnings
• Clean Products: West of Suez: LR1 rates dropped slightly this week, despite high activity on routes ex-UKC. The LR2 market was volatile, with the lump sum rate on the Med-Japan route fluctuating between $2.2m and $2.35m, and with limited tonnage in the Med/UKC, charterers are now looking at ballasters from the Red Sea/AG. Elsewhere, rates for MRs ex-UKC picked up slightly w-o-w. East of Suez: It was a busy start to the week, with charterers trying to cover their last few cargoes before the Christmas break, particularly in the MR sector. The LR1 market was also quiet, with all cargoes seemingly covered until next week. Meanwhile, the LR2 market was surprisingly busy, leaving the position list looking in owners’ favour. • Dirty Products: It was a very positive start to the week in the dirty Panamax market. However, this momentum stalled, with multiple fixtures failing and opening up the tonnage list. With the upcoming Christmas break, the market is starting to quieten down, with charterers already having sorted out their cargoes for early January.
Lice
nsed
to C
lark
sons
Res
earc
h S
ampl
e. D
istr
ibut
ion
is r
estr
icte
d; p
leas
e re
mem
ber
to a
ckno
wle
dge
the
sour
ce. S
hipp
ing
Inte
llige
nce
Wee
kly,
Issu
e 13
03Licensed to C
larksons Research S
ample. D
istribution is restricted; please remem
ber to acknowledge the source. S
hipping Intelligence Weekly, Issue 1303
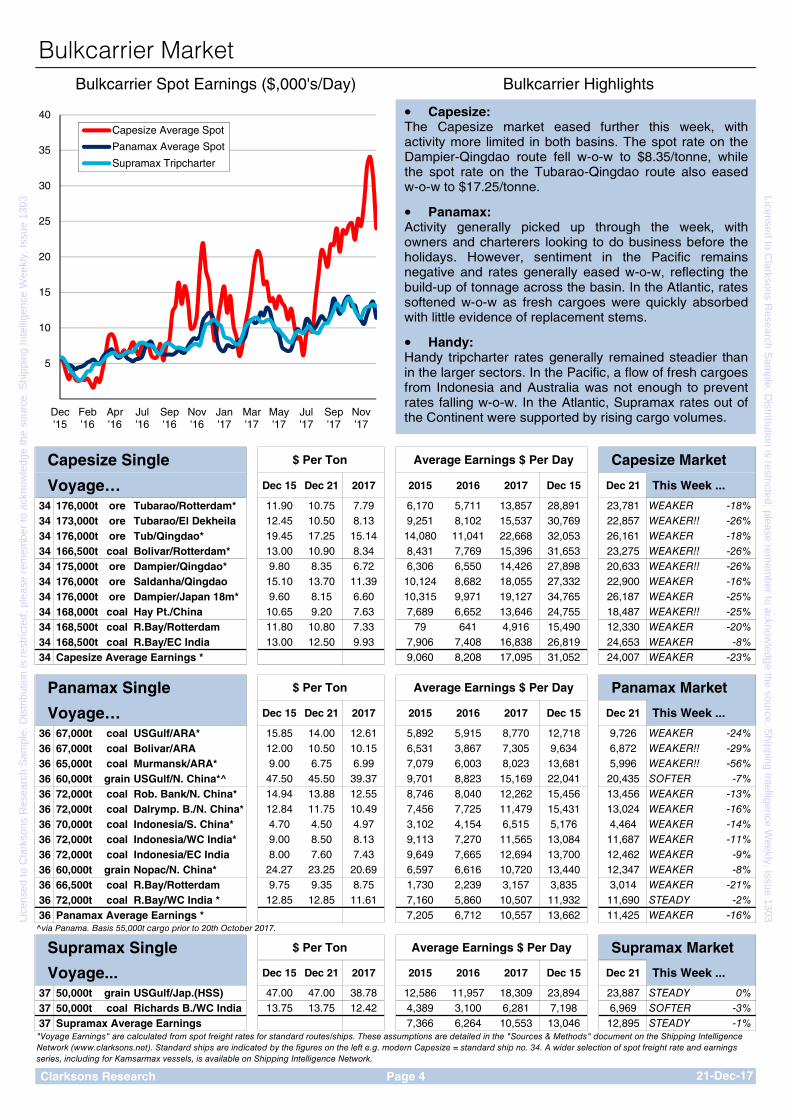
Bulkcarrier Spot Earnings ($,000's/Day) Bulkcarrier Highlights
Capesize Single $ Per Ton Average Earnings $ Per Day Capesize Market
Voyage… Dec 15 Dec 21 2017 2015 2016 2017 Dec 15 Dec 21 This Week ...
34 176,000t ore Tubarao/Rotterdam* 11.90 10.75 7.79 6,170 5,711 13,857 28,891 23,781 WEAKER -18%34 173,000t ore Tubarao/El Dekheila 12.45 10.50 8.13 9,251 8,102 15,537 30,769 22,857 WEAKER!! -26%34 176,000t ore Tub/Qingdao* 19.45 17.25 15.14 14,080 11,041 22,668 32,053 26,161 WEAKER -18%34 166,500t coal Bolivar/Rotterdam* 13.00 10.90 8.34 8,431 7,769 15,396 31,653 23,275 WEAKER!! -26%34 175,000t ore Dampier/Qingdao* 9.80 8.35 6.72 6,306 6,550 14,426 27,898 20,633 WEAKER!! -26%34 176,000t ore Saldanha/Qingdao 15.10 13.70 11.39 10,124 8,682 18,055 27,332 22,900 WEAKER -16%34 176,000t ore Dampier/Japan 18m* 9.60 8.15 6.60 10,315 9,971 19,127 34,765 26,187 WEAKER -25%34 168,000t coal Hay Pt./China 10.65 9.20 7.63 7,689 6,652 13,646 24,755 18,487 WEAKER!! -25%34 168,500t coal R.Bay/Rotterdam 11.80 10.80 7.33 79 641 4,916 15,490 12,330 WEAKER -20%34 168,500t coal R.Bay/EC India 13.00 12.50 9.93 7,906 7,408 16,838 26,819 24,653 WEAKER -8%34 Capesize Average Earnings * 9,060 8,208 17,095 31,052 24,007 WEAKER -23%
Panamax Single $ Per Ton Average Earnings $ Per Day Panamax Market
Voyage… Dec 15 Dec 21 2017 2015 2016 2017 Dec 15 Dec 21 This Week ...
36 67,000t coal USGulf/ARA* 15.85 14.00 12.61 5,892 5,915 8,770 12,718 9,726 WEAKER -24%36 67,000t coal Bolivar/ARA 12.00 10.50 10.15 6,531 3,867 7,305 9,634 6,872 WEAKER!! -29%36 65,000t coal Murmansk/ARA* 9.00 6.75 6.99 7,079 6,003 8,023 13,681 5,996 WEAKER!! -56%36 60,000t grain USGulf/N. China*^ 47.50 45.50 39.37 9,701 8,823 15,169 22,041 20,435 SOFTER -7%36 72,000t coal Rob. Bank/N. China* 14.94 13.88 12.55 8,746 8,040 12,262 15,456 13,456 WEAKER -13%36 72,000t coal Dalrymp. B./N. China* 12.84 11.75 10.49 7,456 7,725 11,479 15,431 13,024 WEAKER -16%36 70,000t coal Indonesia/S. China* 4.70 4.50 4.97 3,102 4,154 6,515 5,176 4,464 WEAKER -14%36 72,000t coal Indonesia/WC India* 9.00 8.50 8.13 9,113 7,270 11,565 13,084 11,687 WEAKER -11%36 72,000t coal Indonesia/EC India 8.00 7.60 7.43 9,649 7,665 12,694 13,700 12,462 WEAKER -9%36 60,000t grain Nopac/N. China* 24.27 23.25 20.69 6,597 6,616 10,720 13,440 12,347 WEAKER -8%36 66,500t coal R.Bay/Rotterdam 9.75 9.35 8.75 1,730 2,239 3,157 3,835 3,014 WEAKER -21%36 72,000t coal R.Bay/WC India * 12.85 12.85 11.61 7,160 5,860 10,507 11,932 11,690 STEADY -2%36 Panamax Average Earnings * 7,205 6,712 10,557 13,662 11,425 WEAKER -16%
Supramax Single $ Per Ton Average Earnings $ Per Day Supramax Market
Voyage... Dec 15 Dec 21 2017 2015 2016 2017 Dec 15 Dec 21 This Week ...
37 50,000t grain USGulf/Jap.(HSS) 47.00 47.00 38.78 12,586 11,957 18,309 23,894 23,887 STEADY 0%37 50,000t coal Richards B./WC India 13.75 13.75 12.42 4,389 3,100 6,281 7,198 6,969 SOFTER -3%37 Supramax Average Earnings 7,366 6,264 10,553 13,046 12,895 STEADY -1%
Clarksons Research Page 4
Bulkcarrier Market
^via Panama. Basis 55,000t cargo prior to 20th October 2017.
"Voyage Earnings" are calculated from spot freight rates for standard routes/ships. These assumptions are detailed in the "Sources & Methods" document on the Shipping Intelligence Network (www.clarksons.net). Standard ships are indicated by the figures on the left e.g. modern Capesize = standard ship no. 34. A wider selection of spot freight rate and earnings series, including for Kamsarmax vessels, is available on Shipping Intelligence Network.
21-Dec-17
5
10
15
20
25
30
35
40
Dec'15
Feb'16
Apr'16
Jul'16
Sep'16
Nov'16
Jan'17
Mar'17
May'17
Jul'17
Sep'17
Nov'17
Capesize Average Spot
Panamax Average Spot
Supramax Tripcharter
• Capesize: The Capesize market eased further this week, with activity more limited in both basins. The spot rate on the Dampier-Qingdao route fell w-o-w to $8.35/tonne, while the spot rate on the Tubarao-Qingdao route also eased w-o-w to $17.25/tonne.
• Panamax: Activity generally picked up through the week, with owners and charterers looking to do business before the holidays. However, sentiment in the Pacific remains negative and rates generally eased w-o-w, reflecting the build-up of tonnage across the basin. In the Atlantic, rates softened w-o-w as fresh cargoes were quickly absorbed with little evidence of replacement stems.
• Handy: Handy tripcharter rates generally remained steadier than in the larger sectors. In the Pacific, a flow of fresh cargoes from Indonesia and Australia was not enough to prevent rates falling w-o-w. In the Atlantic, Supramax rates out of the Continent were supported by rising cargo volumes.
Lice
nsed
to C
lark
sons
Res
earc
h S
ampl
e. D
istr
ibut
ion
is r
estr
icte
d; p
leas
e re
mem
ber
to a
ckno
wle
dge
the
sour
ce. S
hipp
ing
Inte
llige
nce
Wee
kly,
Issu
e 13
03Licensed to C
larksons Research S
ample. D
istribution is restricted; please remem
ber to acknowledge the source. S
hipping Intelligence Weekly, Issue 1303

Tripcharter Market, Freight Indices & Futures
Capesize Capesize Market
Tripcharter... 2015 2016 2017 Nov 24 Dec 01 Dec 08 Dec 15 Dec 21 This Week ....
Cont/Far East 16,257 13,958 26,071 33,750 39,500 44,500 35,650 29,000 WEAKER -19%Transpacific R/V 7,353 7,129 15,188 23,750 28,400 27,900 27,000 20,750 WEAKER -23%Far East/Cont -236 1,380 5,473 12,750 15,250 16,100 14,400 10,600 WEAKER!! -26%Transatlantic R/V 8,113 7,763 15,750 27,200 31,500 37,000 29,900 22,700 WEAKER -24%Average Capesize Earnings 7,872 7,557 15,620 24,363 28,663 31,375 26,738 20,763 WEAKER -22%
Panamax Panamax Market
Tripcharter... 2015 2016 2017 Nov 24 Dec 01 Dec 08 Dec 15 Dec 21 This Week ....
Cont/Far East 10,263 9,617 16,127 17,250 19,000 21,500 22,000 18,750 WEAKER -15%Transpacific R/V 5,063 5,153 9,309 9,100 10,250 11,200 12,000 10,500 WEAKER -13%Far East/Cont 559 1,138 3,739 4,500 4,500 4,900 5,200 4,700 WEAKER -10%Transatlantic R/V 5,925 6,151 9,979 10,800 14,000 16,500 17,000 12,000 WEAKER!! -29%Average Panamax Earnings 5,452 5,515 9,789 10,413 11,938 13,525 14,050 11,488 WEAKER -18%
Supramax Supramax Market
Tripcharter... 2015 2016 2017 Nov 24 Dec 01 Dec 08 Dec 15 Dec 21 This Week ....
Cont/Far East 10,555 10,420 15,887 18,750 17,500 19,000 19,000 20,000 FIRM....... 5%Transpacific R/V 6,370 5,592 8,108 8,500 9,000 8,500 8,250 8,000 SOFTER -3%Far East/WAF" 5,053 3,670 4,500 5,000 5,000 5,000 4,750 4,500 SOFTER -5%US Gulf/Cont 11,755 10,573 15,637 20,000 21,000 22,250 22,750 22,250 STEADY -2%ECSA/Cont* 6,620 5,357 9,049 10,000 10,250 10,500 11,750 12,000 STEADY 2%Indonesia - China~ 5,178 5,476 9,776 11,500 11,500 11,000 10,500 10,000 SOFTER -5%Average Supramax Earnings^ 7,481 6,750 10,643 12,500 12,938 13,063 13,313 13,063 STEADY -2%
Handysize Handysize Market
Tripcharter... 2015 2016 2017 Nov 24 Dec 01 Dec 08 Dec 15 Dec 21 This Week ....
Cont/ECSA 3,779 4,689 6,426 7,750 7,750 7,750 8,000 8,000 STEADY 0%Cont/USEC-USG 4,063 4,771 6,510 8,000 8,000 8,000 8,250 8,250 STEADY 0%ECSA/Cont 8,572 6,731 10,657 13,000 13,500 14,000 14,250 14,250 STEADY 0%USEC-USG/Cont 7,236 7,011 9,265 10,750 11,000 11,250 11,750 11,500 STEADY -2%SEAsia/Australia R/V 4,331 4,336 7,103 8,500 8,250 8,250 8,000 7,750 SOFTER -3%Transpacific R/V 4,933 4,689 6,897 8,250 8,000 8,000 7,750 7,500 SOFTER -3%Average Handysize Earnings 5,485 5,371 7,810 9,375 9,417 9,542 9,667 9,542 STEADY -1%
Baltic Freight Indices Baltic Dry Index TrendsDate BCI BSI BHSI BDI
11-Dec 4272 939 632 172712-Dec 4293 942 633 174313-Dec 4211 943 633 173014-Dec 3936 944 635 166815-Dec 3777 942 636 161918-Dec 3656 943 637 158819-Dec 3510 938 636 154720-Dec 3216 933 632 1476
Max Value 4293 944 637 1743Min Value 3216 933 632 1476Avg Value 3859 941 634 1637
FFA Indications*$/day 20-Dec Dec-17 Q1 18 Cal 18
BCI 7 Bolivar-Rott. 13.00 8.60 8.70BCI 4 R.Bay-Rott. 11.60 8.20 8.30BPI 2A USG/F.East 19,450 16,625BPI 3A T/P R/V 11,350 10,150Cape TC Avg. 26,750 13,950 15,475P'max TC Avg. 12,900 10,725 10,750S'max TC Avg. 10,575 9,675 9,900*FFA Indications basis closing mid-price. Supramax FFA data basis 6TC avg.
Clarksons Research Page 5
Average Rate $ Per Day
Average Rate $ Per Day
Average Rate $ Per Day
Series based on a 58,000 dwt vessel. ^Average excludes Cont/Far East and Far East/WAF. ~Delivery South China, redelivery South China. *Delivery WAF. "Far East/Cont prior to April 2017.
Average Rate $ Per Day
Note: Vessels based on Baltic standards where appropriate. Trip rates for 38,000 dwt Handysize are available on Shipping Intelligence Network at www.clarksons.net.
BPI16241672171817141677164315931546171815461648
12,38210,572
21-Dec-17
Index11.1610.9618,95510,81421,797
0
250
500
750
1,000
1,250
1,500
1,750
2,000
1 3 6 8 11 13 16 18 21 23 26 28 31 33 36 38 40 43 45 48 50
Week No.
2015
2016
2017
Lice
nsed
to C
lark
sons
Res
earc
h S
ampl
e. D
istr
ibut
ion
is r
estr
icte
d; p
leas
e re
mem
ber
to a
ckno
wle
dge
the
sour
ce. S
hipp
ing
Inte
llige
nce
Wee
kly,
Issu
e 13
03Licensed to C
larksons Research S
ample. D
istribution is restricted; please remem
ber to acknowledge the source. S
hipping Intelligence Weekly, Issue 1303

Gas & Chemical Markets
LPG Charter Rates, $'000/month
Markets…. 2015 2016 Oct Nov 21 Dec Trends…
LPG Voyage Rates, $/mt
46.2K mt Gulf/Jap 90.14 29.90 28.63 28.63 32.75 FIRMER... 14%LPG TCE, $/day 84,000m³ modern~ 88,508 22,646 15,732 14,285 18,872 FIRMER... 32%LPG 12 mths T/C, $/day 84,000m³ modern~ 63,096 24,655 18,535 18,494 19,398 FIRM... 5% 59,000m³ modern 62,040 24,550 16,767 17,754 17,918 STEADY... 1% 35,000m³ 36,418 23,579 14,014 14,507 14,795 STEADY... 2% 22,500m³ modern 28,335 21,147 10,521 11,589 12,987 FIRMER... 12% 20,500m³ Semi-Ref 31,559 22,468 11,548 12,740 13,809 FIRMER... 8% 17,000m³ Ethylene 26,609 22,537 20,220 20,220 20,220 STEADY... 0% 8,250m³ Ethylene 16,872 16,026 15,452 15,452 15,452 STEADY... 0% 3,500m³ Pressure (East) 5,798 5,651 7,397 7,480 7,891 FIRM... 5% 3,500m³ Pressure (West) 6,108 5,602 7,356 7,397 7,726 FIRM... 4%LNG Spot Rate, $/day^160,000m³ (TFDE) 36,038 33,528 50,250 67,250 82,000 FIRMER... 22%145,000m³ (ST) 26,000 20,151 33,000 42,000 45,000 FIRM... 7%~Based on 82K cbm ship until end 2015. ^Single voyage loading in the next 3 months.
Chemical Freight Rates, $/mt
Markets…. 2015 2016 Oct Nov 21 Dec Trends…
Voyage Rates ($/mt)10,000 Gulf/WC India 31.98 25.01 30.50 29.00 31.00 FIRM... 7%15,000 Gulf/Ulsan 45.60 38.30 37.75 40.00 47.00 FIRMER... 18%15,000 Gulf/Med 58.88 50.58 50.75 52.00 55.50 FIRM... 7%15,000 Gulf/Rott. 60.88 53.38 54.25 54.00 59.00 FIRMER... 9%5,000 Rott/Houston 44.70 35.31 31.00 27.25 35.00 FIRMER... 28%10,000 Rott/Houston 40.23 32.67 27.75 25.25 28.50 FIRMER... 13%5,000 Rott/Ulsan 84.93 80.40 84.00 82.00 85.00 FIRM... 4%5,000 Singapore/Rott 91.40 76.06 79.00 81.00 80.00 STEADY... -1%1,000~ Sing./Houston 161.90 142.79 136.00 139.50 140.00 STEADY... 0%12,000* Ulsan/Houston 56.19 39.47 35.50 44.00 47.00 FIRM... 7%5,000 Houston/Rott 58.25 56.28 48.00 47.00 45.00 SOFTER... -4%5,000 Houston/Ulsan 63.08 65.77 56.50 66.00 69.00 FIRM... 5%12 mths TC, $/day13,000 dwt IMO II 10,146 10,625 8,750 8,750 8,750 STEADY... 0%19,999 dwt S/S 15,200 15,496 12,750 12,750 12,750 STEADY... 0%Easychems except for: ~ Stainless Steel. *Based on 10,000mt cargo until end 2016.
Clarksons Research Page 6 21-Dec-17
Gas Carrier Average 2017 Gas Market
Chemicals Average 2017 Chem Market
0
500
1,000
1,500
2,000
2,500
Dec
-15
Feb
-16
Apr
-16
Jun-
16
Aug
-16
Sep
-16
Nov
-16
Jan-
17
Mar
-17
May
-17
Jul-1
7
Sep
-17
Oct
-17
Dec
-17
1 Yr t/c (84,000m3)
84,000m3 TCE, Gulf-Japan
40
50
60
70
80
90
100
Dec
-15
Feb
-16
Apr
-16
Jun-
16
Aug
-16
Sep
-16
Nov
-16
Jan-
17
Mar
-17
May
-17
Jul-1
7
Sep
-17
Oct
-17
Dec
-17
Rott/Far E.Houston/Far E.
basis 5,000mt Easychems
• 2017 was always expected to be a challenging year for the VLGC sector, and so it has proved. On the Ras Tanura-Chiba route, the average rate fell from $29.5/mt in 2016, to $27.5/mt so far in 2017, arguably not a big change. However, the highest rate of 2017, slightly above $36/mt, fell notably short of the 2016 high of $61/mt. • Bunker prices were also considerably higher throughout 2017,
affecting earnings levels. This was reflected in assessed timecharter levels which fell from an average of $750k pcm in 2016 to $552k pcm this year. • Leading up to the end of 2017, the spot market has continued to tick along in an unspectacular but steady fashion, with a slightly softer sentiment than last week, as owners and charterers attempted to tidy up their programmes for the start of 2018. Spot rates came
down closer to the low $30s/mt on the Ras Tanura-Chiba route, and around $60/mt on the Houston-Chiba route. A few more fixtures will likely be concluded over the holiday period, but this is unlikely to change sentiment too much going into 2018. • 2018 looks likely to be another challenging year, for owners and charterers alike, with increased volatility and risk.
• With Christmas firmly in sight, there have only been a handful of changes to report this week in the spe-cialised products market. • On the transatlantic eastbound trade lane, rates for 5,000mt parcels have softened by $1/mt, with activity generally slow and tonnage still availa-ble ahead of the festive period. Mean-while, heading west to Asia across the Pacific, rates for 10,000mt cargoes from
Houston to Ulsan have firmed by $3/mt with space still very tight as spot activity remains robust. • On the transatlantic westbound trade lane from Europe, the combination of an end-December rush and bullish expectations from owners has contribut-ed to a slight firming for 5,000mt par-cels, which are now assessed at $35/mt. • Elsewhere, the rate for a 12,000mt cargo from Ulsan to Houston has sof-
tened by $2/mt to $47/mt, as spot ac-tiveity slows ahead of Christmas. • Meanwhile, veg oil rates from South America to China have firmed by $2/mt w-o-w due to a lack of available tonnage, rather than an increase in en-quiries. The same increase has also been seen on the Argentina-Continent route, with several stems fixed, leading to an assessment of $48.5/mt for 18-19,000mt cargoes.
Lice
nsed
to C
lark
sons
Res
earc
h S
ampl
e. D
istr
ibut
ion
is r
estr
icte
d; p
leas
e re
mem
ber
to a
ckno
wle
dge
the
sour
ce. S
hipp
ing
Inte
llige
nce
Wee
kly,
Issu
e 13
03Licensed to C
larksons Research S
ample. D
istribution is restricted; please remem
ber to acknowledge the source. S
hipping Intelligence Weekly, Issue 1303

Liner & Offshore MarketsLiner Market Rates ($,000's/day) Liner Market News
Container / MPP / Average 2017 Liner Markets
Short Sea Markets 2013 2014 2015 2016 Sep Oct Nov Dec Trends*Containerships ($/Day, 6-12mth TC)Feeder, 1,000 teu grd. 6,321 6,396 7,250 6,550 6,150 6,000 6,300 6,350 STEADY... 2%Feeder, 1,700 teu grd. 7,096 7,313 8,842 6,804 7,600 8,100 8,300 8,500 FIRMER... 13%Feeder, 2,000 teu g'less 6,483 6,933 8,483 6,221 7,400 7,900 8,200 8,350 FIRMER... 11%Feeder, 2,750 teu g'less 6,829 7,425 9,563 6,000 9,350 9,350 9,350 9,350 STEADY... 2%Narrow Beam, 4,400 teu g'less 8,696 8,771 11,817 4,979 9,000 7,500 7,500 8,000 WEAKER... -8%Intermediate, 6,800 teu g'less (3yr TC) 27,542 24,667 22,750 13,208 17,000 17,000 16,500 16,500 FIRM....... 4%MPP Tonnage ($/Day)^17,000 dwt, grd. 1 yr. t/c (liner) 9,780 9,763 8,463 7,858 7,300 7,200 7,500 8,700 FIRM....... 6%12,000 dwt, grd. 1 yr. t/c (liner) 8,870 8,508 7,379 6,767 6,100 6,050 6,200 7,000 STEADY... 3%
European Short Sea 3,000dwt ($/t)ECUK/ARAG - N.Spain 22.85 25.02 22.24 16.59 17.30 19.38 21.50 23.00 FIRM....... 7%French Bay - ECUK 17.96 18.64 15.51 12.66 14.60 16.06 17.13 19.00 FIRMER... 11%Lower Baltic - ARAG 20.98 21.64 17.62 16.44 17.75 19.75 21.19 22.00 FIRM....... 4%UK/ARAG - W.Med 33.22 35.56 29.77 22.44 21.75 23.06 25.00 28.00 FIRMER... 12%3,500dwt g'less. 1 yr. t/c (€/day)~ 2,594 2,704 2,779 2,900 3,000 3,100 3,100 STEADY... 0%*3-month trend for Container/MPP; current month shows latest end month data. Change since previous month for Short Sea; see www.hcshipping.co.uk for market report. ~2014 avg basis May-Dec data. ^2013 average basis Aug-Dec data.
Offshore Offshore Market Offshore Vessel Charter Rates
Market 2015 2016 Latest Trends*North Sea OSV Market £/DayAHTS Spot, 20k+ BHP 16,895 20,041 10,660 WEAKER!! -65%AHTS Term, 20k+ BHP 18,000 16,000 16,000 STEADY... 0%
PSV Spot, >900m2 4,871 5,636 6,662 WEAKER!! -47%
PSV Term, >900m2 7,592 5,917 6,750 STEADY... 1%Regional OSV Market $/DaySE Asia, AHTS Term, 5k BHP 5,888 4,348 3,039 STEADY... 0%
W.Africa PSV Term, >900m2 16,196 11,292 9,000 SOFTER... -5%
Brazil, PSV Term, >900m2 29,153 21,208 15,000 SOFTER... -8%Drilling Rig Market, $000/Day**Jack-Up, SE Asia, High-Spec 80-100 60-100 50-95 SOFTER... -3%Floater, GoM, Ultra Deep 200-275 100-180 140-200 STEADY... 0%*3-month trend. ** Annual drilling rig dayrates on end year basis.
Offshore Fleet This Month
Trends 2015 2016 Obk % Fleet
Anchor Handling Tug/Supply 2,796 2,809 2,798 162 6%PSV/Supply 2,330 2,405 2,440 184 8%Mobile Drilling Units 1,021 997 968 147 15%Other Types 6,858 6,981 7,059 317 4%All Offshore Vessels 13,005 13,192 13,265 810 6%
Clarksons Research Page 7
Average
No. End
21-Dec-17
Nov-17
Offshore fleet includes all mobile units; for more detailed coverage of the full range of offshore sectors see Offshore Intelligence Monthly. See also Offshore Drilling Rig Monthly and Offshore Support Vessel Monthly.
5
10
15
20
Dec
-13
Mar
-14
Jun-
14
Sep
-14
Dec
-14
Mar
-15
Jun-
15
Sep
-15
Dec
-15
Mar
-16
Jun-
16
Sep
-16
Dec
-16
Mar
-17
Jun-
17
Sep
-17
Dec
-17
1,700 teu grd FCC, 6-12 mth TC2,750 teu gls FCC, 6-12 mth TC4,400 teu gls FCC, 6-12 mth TC
• This week, members of the Ocean Alliance haveannounced a selection of new services, which areintended to commence operations from April 2018. Thenew services are collectively named the “Ocean AllianceDay Two Product”, and will constitute 41 services operatedby around 340 boxships of c.3.6m TEU. The launch willreportedly include twenty Transpacific, ten Far East-Europe, four Transatlantic and seven Far East-Middle Eastservices. • Container throughput at the port of Long Beach wasup 15% y-o-y in November, standing at 0.61m TEU. Therehas been strong throughput growth at the port during mostof 2017, and volumes over the first 11 months of the yearstood at 6.8m TEU, up 10% y-o-y. Meanwhile, total boxthroughput at the port of Los Angeles increased 5% y-o-yin November, standing at 0.92m TEU, while totalthroughput at the port over the first 11 months of 2017 wasalso up y-o-y, increasing 6% to reach 8.6m TEU.
5
10
15
20
25
30
35
40
45
0
5
10
15
20
25
30
Nov
-13
Feb
-14
May
-14
Aug
-14
Nov
-14
Feb
-15
May
-15
Aug
-15
Nov
-15
Feb
-16
May
-16
Aug
-16
Nov
-16
Feb
-17
May
-17
Aug
-17
Nov
-17
$000/day£000/day
N.Sea Term, PSV, >900m2, £000/day (LHS)
W.Africa Term, PSV, >900m2, $000/day (RHS)
Lice
nsed
to C
lark
sons
Res
earc
h S
ampl
e. D
istr
ibut
ion
is r
estr
icte
d; p
leas
e re
mem
ber
to a
ckno
wle
dge
the
sour
ce. S
hipp
ing
Inte
llige
nce
Wee
kly,
Issu
e 13
03Licensed to C
larksons Research S
ample. D
istribution is restricted; please remem
ber to acknowledge the source. S
hipping Intelligence Weekly, Issue 1303

Secondhand Prices
Oil Tanker End Year, $m Three Month Asset Play in Focus
Prices… 2014 2015 2016 Dec Trend…310,000 dwt Resale 105.0 100.0 84.0 84.0 STEADY... 1%310,000 dwt 5 yrs 77.0 80.0 60.0 64.0 STEADY... 1%300,000 dwt 10 yrs 52.0 55.0 40.0 41.0 STEADY... 1%300,000 dwt 15 yrs 29.0 38.0 24.0 24.0 FIRM.... 5%160,000 dwt Resale 72.0 70.0 55.0 56.0 STEADY... 1%160,000 dwt 5 yrs 57.0 60.0 40.0 43.0 STEADY... 2%150,000 dwt 10 yrs 37.0 42.0 27.5 28.0 FIRM.... 3%105,000 dwt Resale 57.0 55.0 44.0 45.0 STEADY... -1%105,000 dwt 5 yrs 42.0 46.0 29.0 32.0 STEADY... 1%105,000 dwt 10 yrs 27.0 31.0 18.0 22.0 STEADY... 0%73,000 dwt Resale 45.0 48.0 40.0 40.0 STEADY... 1%73,000 dwt 5 yrs 33.5 35.0 28.0 28.0 STEADY... 2%70,000 dwt 10 yrs 23.5 24.0 17.0 19.0 FIRM.... 6%51,000 dwt Resale 37.0 38.5 32.5 35.0 STEADY... 2%47,000 dwt 5 yrs 25.0 29.0 22.0 25.0 STEADY... 2%45,000 dwt 10 yrs 16.0 19.5 15.5 17.5 FIRM.... 4%45,000 dwt 15 yrs 10.0 12.0 10.0 10.0 FIRM.... 4%37,000 dwt 5 yrs 23.0 25.0 19.0 22.0 STEADY... 2%37,000 dwt ^ 10 yrs 15.0 17.0 14.0 13.0 STEADY... 0%19,999 dwt Chem S/S 5 yrs 26.8 27.0 23.0 21.8 SOFTER... -4%5-y-o Tanker Index 131 144 105 116 STEADY... 2%12 month Change 1% 10% -27% 10%Tanker prices based on double hull vessels. ^Pre Jan-15 (dwt): 35k.
Bulkcarrier End Year, $m Three Month
Prices... 2014 2015 2016 Dec Trend…180,000 dwt Resale 54.0 39.0 36.5 46.5 STEADY... 2%180,000 dwt 5 yrs 39.0 25.0 24.0 33.0 STEADY... 2%180,000 dwt " 10 yrs 27.5 13.5 15.0 20.5 STEADY... -2%170,000 dwt 15 yrs 16.0 8.5 8.0 13.0 WEAKER.. -13%82,000 dwt Resale 31.0 25.0 24.5 28.5 STEADY... 0%82,000 dwt ^ 5 yrs 20.0 14.0 14.0 22.5 STEADY... 2%75,000 dwt 10 yrs 14.5 8.5 8.5 14.5 STEADY... 2%73,000 dwt 15 yrs 10.0 5.0 5.5 11.0 FIRM.... 7%61,000 dwt Resale 30.0 22.5 23.0 27.5 STEADY... 3%56,000 dwt 5 yrs 20.5 13.5 14.0 17.5 FIRM.... 5%55-56,000 dwt * 10 yrs 13.5 8.0 9.5 13.5 FIRM.... 5%52,000 dwt ~ 15 yrs 9.0 4.5 5.8 9.5 FIRMER... 11%42-45,000 dwt 20 yrs 6.0 3.5 2.8 6.5 FIRMER... 16%37,000 dwt Resale 24.0 19.0 18.5 23.0 FIRM.... 5%32,000 dwt 5 yrs 17.0 10.0 12.0 14.0 STEADY... -1%32,000 dwt 10 yrs 12.5 8.0 6.8 10.0 FIRMER... 10%28,000 dwt 15 yrs 8.0 4.5 4.0 6.0 FIRMER... 11%5-y-o Bulker Index 116 73 79 100 STEADY... 2%12 month Change -14% -37% 7% 27%Pre Jul-16 (dwt): *52k, ~45-48k. ^Pre Feb-17 (dwt): 76k. "Pre Oct-17 (dwt): 170k.
Container & End Year, $m Three Month
Ro-Ro Prices 2014 2015 2016 Dec Trend …4,500 teu^ 5 yrs 19.0 16.0 7.0 12.5 FIRMER... 8%2,750 teu 5 yrs 14.5 16.0 10.0 13.8 FIRM.... 7%1,700 teu 10 yrs 8.0 8.5 5.5 9.0 FIRMER... 8%Container Index 24.7 35.7 24.8 38.2 FIRMER... 11%Ro-Ro 4,000 lm* 10 yrs 18.0 27.0 35.0 35.5 STEADY... 0%Ro-Ro 2,500 lm* 10 yrs 17.0 21.0 26.0 26.5 STEADY... 0%*Ro-Ro prices in euros. ^Price basis a Narrow Beam ("Old Panamax") vessel.
Clarkson End Year, Index Three Month
Index … 2014 2015 2016 Dec Trend …ALL VESSELS 102 93 75 94 STEADY... 3%Resale prices basis prompt delivery. 3-month trend: avg last 3 months vs avg previous 3 months. See SIN for full details of standard ship size history.
Clarksons Research Page 8 21-Dec-17
50
100
150
200
250
Nov
'08
Nov
'09
Nov
'10
Nov
'11
Nov
'12
Nov
'13
Nov
'14
Nov
'15
Nov
'16
Nov
'17
Long Term Price Trends
BulkersTankers
5-year-old Index, Start 2000 = 100
-30%
-25%
-20%
-15%
-10%
-5%
0%
5%
10%
15%
20%
25%
Nov
'14
Feb
'15
May
'15
Aug
'15
Nov
'15
Feb
'16
May
'16
Aug
'16
Nov
'16
Feb
'17
May
'17
Aug
'17
Nov
'17
Short Term Tanker Trends% Year on Year
-40%
-30%
-20%
-10%
0%
10%
20%
30%
40%
50%
Nov
'14
Feb
'15
May
'15
Aug
'15
Nov
'15
Feb
'16
May
'16
Aug
'16
Nov
'16
Feb
'17
May
'17
Aug
'17
Nov
'17
Short Term Bulk Trends% Year on Year
5-year-old Tanker Price Index Percentage Change
Year-On-Year
5-year-old Bulker Price Index Percentage Change
Year-On-Year
Lice
nsed
to C
lark
sons
Res
earc
h S
ampl
e. D
istr
ibut
ion
is r
estr
icte
d; p
leas
e re
mem
ber
to a
ckno
wle
dge
the
sour
ce. S
hipp
ing
Inte
llige
nce
Wee
kly,
Issu
e 13
03Licensed to C
larksons Research S
ample. D
istribution is restricted; please remem
ber to acknowledge the source. S
hipping Intelligence Weekly, Issue 1303

Tanker Y-t-d Nov
Sales* .... 2016 2017 2017
Type: VLCC 22 44 4
Suezmax 17 29 4
Aframax 37 37 3
Handy/Pmax 142 171 11
Total No. Sales 218 281 22
Total DWT (,000) 18,394 28,237 2,566
Total Value ($ m) 3,992 5,606 214
Bulker Y-t-d Nov
Sales* .... 2016 2017 2017
Type: Capesize 94 84 4
Panamax 166 168 10
Handymax 198 235 17
Handysize 153 173 17
Total No. Sales 611 660 48
Total DWT (,000) 45,038 46,872 2,923
Total Value ($ m) 5,255 7,624 560
Other Y-t-d Nov
Sales .... 2016 2017 2017
Total No. Sales 447 718 66
Total dwt (,000s) 7,929 18,110 1,278
Total Value ($ m) 3,069 6,091 732
Total Y-t-d Nov
Sales ..... 2016 2017 2017
Buyers: Greece 203 250 24
Norway 23 116 6
Germany 30 86 14
China P.R. 179 220 18
UK 38 59 2
South Korea 32 53 4
Total No. Sales 1,276 1,659 136
Total Dwt (,000) 71,360 93,219 6,767
Total Value ($m.) 12,316 19,322 1,506
Average $/Dwt 173 207 223* Includes vessels over 10,000 dwt only. Sales of bulk vessels under 10,000 dwt and of non-bulk vessels are included in "Other Sales".
Clarksons Research i 21-Dec-17
Sale & Purchase Market
ALL DATA AND INFORMATION IN THIS REPORT ARE AS REPORTED UP TO NOON ON THE DATE OF PUBLICATION
0
20
40
60
80
100
120
140
160
180
0
500
1,000
1,500
2,000
2,500
3,000
3,500
4,000
4,500
Nov
-12
Mar
-13
Jul-1
3N
ov-1
3M
ar-1
4Ju
l-14
Nov
-14
Mar
-15
Jul-1
5N
ov-1
5M
ar-1
6Ju
l-16
Nov
-16
Mar
-17
Jul-1
7N
ov-1
7
No. $m.
Sales Volumes & Values
Volume (3mma, RHS)Value (3mma, LHS)
Tankers:
Following a quiet few weeks in the tanker sale and purchase market, it has been announced today that Euronav have reached an agreement for a stock-for-stock acquisition of Gener8 Maritime worth $504m, subject to shareholder approval. The combined entity will become the world’s largest publicly listed crude tanker operator controlling 77 crude tankers (including 52 VLCCs and 24 Suezmaxes) of a combined 19 million dwt. As a consequence of this transaction, New York listed International Seaways has entered into an agreement to acquire six modern VLCCs from the combined company, pending a successful acquisition of Gener8 Maritime. The vessels, which are currently trading under the names “GENER8 MILTIADES”, “GENER8 CHIOTIS”, “GENER8 ANDRIOTIS”, “GENER8 SUCCESS”, “GENER8 SUPREME” (all c.301,038 dwt, built 2016,Shanghai Waigaoqiao) and “GENER8 STRENGTH” (300,960 dwt, built 2015, Shanghai Waigaoqiao) will change hands for $434m enbloc. All going well, the ships are expected to be delivered into the International Seaways fleet in the second quarter of 2018. Elsewhere in the tanker space, activity has slowed heading into the holiday period, and as such there is no other activity to report. For vessels around 10 years of age and younger, we continue to see strong levels of enquiry (as the feeling that we are near the low point of the cycle remains), but finding willing sellers in line with this pricing remains tough and so single ship deals have been few and far between.
Dry Cargo:
Despite the fast approaching holiday season, activity remains high in the dry cargo sale and purchase sector, with a number of sales to report. In the Supramax sector, the Norwegian controlled ‘Tess 58’ design “CAROLINE VICTORY” (58,713 dwt, built 2008, Tsuneishi Cebu, C4x30T) has been committed to clients of Greek owner New Vision Shipping at a price of $13.9m. The price paid is in line with the sale of one year younger sister ship “KING FREIGHT” (58,163 dwt, built 2009, Tsuneishi Cebu, C4x30T) which was sold at the beginning of the month for $14.5m. Elsewhere, the “TOMINI DIGNITY” (53,570 dwt, built 2010, Ha Long Shipbuilding, C4x36T) has been sold by clients of Tomini Shipping at a price of $9.8m to undisclosed interests.
In the Panamax sector, the “AEOLIAN BREEZE” (74,255 dwt, built 2001, Sasebo HI) has been sold for $9.3m to Chinese buyers, while the “VARVARA” (75,323 dwt, built 2001, Hyundai Samho HI) was sold at $8.85m, also to Chinese interests. The difference in the price levels achieved underlines the relative premium that Japanese built units carry against their counterparts. Lastly, in the Handysize sector the “GLOBAL HORIZON” (33,633 dwt, built 2010, Shin Kurushima, C4x30T) has been sold to clients of Ocean Longevity at a price of $11.95m.
Baltic Sale & Purchase Assessments (weekly)
(Based on max. 5-year old vessels, as published by the Baltic Exchange) As of the 18th December 2017.
VLCC (305,000 DWT): $61.258m Aframax (105,000 DWT): $29.370m MR Product tanker (51,000 DWT): $23.494m Capesize (180,000 DWT): $32.819m Panamax (74,000 DWT): $20.497m Super Handy (56,000 DWT): $17.250m Note: Clarksons Platou brokers did not contribute to the above Baltic Sale & Purchase Assessment rates.
Lice
nsed
to C
lark
sons
Res
earc
h S
ampl
e. D
istr
ibut
ion
is r
estr
icte
d; p
leas
e re
mem
ber
to a
ckno
wle
dge
the
sour
ce. S
hipp
ing
Inte
llige
nce
Wee
kly,
Issu
e 13
03Licensed to C
larksons Research S
ample. D
istribution is restricted; please remem
ber to acknowledge the source. S
hipping Intelligence Weekly, Issue 1303

Recent Ship Sales by Vessel TypeVessel Type Vessel name Dwt/Unit Blt. Yard Date Price $m. Buyers
Tanker D/Hull Meandros 309,498 2000 Hyundai HI (Ulsan) 15-Dec 19.5 Greek interests
Tanker D/Hull Shige Maru 4,999 2007 Niigata SB (Niigata) 12-Dec undisclosed Undisclosed interests
Tanker D/Hull Arion 308,460 2001 Samsung HI 12-Dec 21.25 Undisclosed interests
Tanker D/Hull Flandre 305,688 2004 Daewoo (DSME) 05-Dec 45 Undisclosed interests
Tanker D/Hull High Presence 48,700 2005 Iwagi Zosen 05-Dec 6 years TCB 14.1 Chinese interests
TankChem IMO II/III Terry 15,441 1999 Aker MTW Werft 19-Dec undisclosed Clients of NT Bunkering
TankChem IMO II/III Fairchem Yuka 19,960 2010 Usuki Zosensho 19-Dec 18.5 Clients of Ace Tankers
TankChem IMO II Copenhagen 2,945 2003 Torlak Shipyard 13-Dec 3.2 Undisclosed interests
TankChem IMO II/III Nordport 13,127 2008 Sekwang Shipbuilding 12-Dec 8.5 Far Eastern interests
TankChem IMO II/III Chemstar Seven 19,870 2005 Fukuoka SB 12-Dec 12.25 South Korean interests
TankChem IMO III Pretty Scene 51,218 2006 STX SB (Jinhae) 05-Dec at auction 12 Chinese interests
Gas C'rier 6,556 cu.m. Odyn Gas 5,174 1995 Shin Kurushima 06-Dec 4.1 Clients of Siam Gas & Oil
Gas C'rier 125,568 cu.m. Echigo Maru 67,219 1983 MHI Nagasaki 05-Dec 15 Clients of Sinokor
Offshore PSV Jaya Victory* 3,659 2014 Guangzhou Hangtong 20-Dec undisclosed Clients of Maridive & Oil
Offshore PSV Jaya Valiant* 3,627 2014 Guangzhou Hangtong 20-Dec # Clients of Maridive & Oil
Offshore AHTS Stril Power 3,044 1997 Aukra Indust. 19-Dec undisclosed Clients of Sevnor
Offshore PSV Skandi Marstein 4,170 1996 Brattvaag Skips 15-Dec undisclosed Clients of A1 Offshore
Offshore AHTS Far Grip 2,418 1993 Ulstein Ulsteinvik 12-Dec undisclosed Clients of Seascape Meadow I
Offshore Maintenance DP Cirrus 3,250 1985 Liaaen 08-Dec undisclosed Russian interests
Tug 125 gt Sung An 1989 Kanto Kogyo KK 19-Dec undisclosed Clients of Chelsea Logistics
Tug 538 gt Ocean Pathfinder 1970 McDermott Shipyards 19-Dec undisclosed U.S. interests
Ro-Ro/Lo-Lo 791 teu. EIT Paloma 9,503 2010 Hegemann Rolandwerft 13-Dec 10 U.S. interests
Container 1,024 teu. Annika* 11,814 2008 Dae Sun Shipbuilding 20-Dec 16.1 Clients of MPC Container Ships
Container 1,024 teu. Antigoni* 12,879 2008 Dae Sun Shipbuilding 20-Dec # Clients of MPC Container Ships
Container 2,553 teu. Ryujin Nakira 33,632 2007 Naikai Zosen Setoda 13-Dec 10.75 Greek interests
Container 3,405 teu. Hedda Schulte 46,131 2013 Rongcheng Shenfei 12-Dec 13 Undisclosed interests
Container 2,700 teu. Passat Summer 39,008 2005 Stocznia Gdynia 12-Dec 9.2 Clients of Wan Hai Lines
Container 2,742 teu. Vilano* 37,800 2006 Aker Ostsee 12-Dec 31.9 Clients of MPC Container Ships
Container 2,741 teu. Cap Pasado* 37,800 2006 Aker Ostsee 12-Dec # Clients of MPC Container Ships
Container 2,742 teu. Cap Blanche* 37,567 2006 Aker Ostsee 12-Dec # Clients of MPC Container Ships
Container 1,138 teu. Kreta 12,238 1998 Sedef Gemi (Tuzla) 06-Dec 3.6 Clients of Lubeca Marine
Container 2,650 teu. Penelope 38,636 2008 Stocznia Gdansk 05-Dec high 10 German interests
Dry MPP 304 teu. Jin Hai Yue 6,045 2006 Jiangdu Jierui Shpg 14-Dec at auction RMB58.15 Chinese interests
Dry MPP 500 teu. Banga Barta 7,870 1983 Flensburger SB 07-Dec undisc./auction Undisclosed interests
Dry Genl Gearless Run De 6 5,025 2005 Yueqing Donggang 12-Dec at auction RMB63.3 Chinese interests
Bulk Str. Hvy. Varvara 75,323 2001 Hyundai Samho HI 20-Dec 8.85 Chinese interests
Bulk 4x30t cr. Global Horizon 33,633 2010 Shin Kurushima 20-Dec 11.95 Clients of Ocean Longevity
Bulk 4x36t cr. Tomini Dignity 53,570 2010 Ha Long Shipbuilding 19-Dec 9.8 Undisclosed interests
Bulk Str. Hvy. Aeolian Breeze 74,255 2001 Sasebo HI 19-Dec 9.3 Chinese interests
Bulk 4x30t cr. Caroline Victory 58,713 2008 Tsuneishi Cebu 19-Dec 13.9 Clients of New Vision Shipping
Bulk 4x30t cr. Canary K 58,223 2012 Shin Kurushima 15-Dec 16.7 Clients of Neptune Lines
Bulk 4x30.5t cr. Clipper Selo 32,389 2011 Jiangmen Nanyang 15-Dec 10.1 Hong Kong interests
Bulk 4x30.5t cr. Clipper Panorama 32,353 2011 Jiangmen Nanyang 15-Dec 10.1 Hong Kong interests
Bulk Gearless Poseidon 74,350 2002 Hyundai HI (Ulsan) 13-Dec 9.2 Undisclosed interests
Bulk Gearless Americana 91,941 2010 Sungdong SB 12-Dec at auction 15.8 Clients of Safe Bulkers
Bulk 4x30t cr. King Freight 58,163 2009 Tsuneishi Cebu 12-Dec 14.5 Clients of Empros Lines Shipping
Bulk 4x25t cr. CY Thunder 45,406 1995 Tsuneishi Zosen 12-Dec 4.5 Undisclosed interests
Bulk 4x30t cr. Patria 24,021 1998 Kanda Zosensho 12-Dec 4.2 Undisclosed interests
Bulk 4x30t cr. Santa Anna 56,042 2006 Mitsui SB (Tamano) 12-Dec 11.7 Undisclosed interests
Bulk 4x30t cr. Tong Xiang 47,240 1997 Oshima Shipbuilding 12-Dec 4.5 Chinese interests
Bulk 4x40t cr. Trumpet 50,619 2004 Sinopacific Zhejiang 12-Dec 5.9 Undisclosed interests
Bulk 4x30.5t cr. Diamond Sea* 39,300 2018 Jiangmen Nanyang 12-Dec 19.8 Clients of Louis-Dreyfus Armateurs
Bulk 4x30.5t cr. N/B RESALE HULL N153* 39,300 2018 Jiangmen Nanyang 12-Dec # Clients of Louis-Dreyfus Armateurs
Bulk Str. Hvy. Silver One 72,917 2000 Daedong S.B. 08-Dec 8 Undisclosed interests
Bulk 4x30t cr. Cielo Di Venezia 37,313 2008 Saiki Hvy. Ind. 08-Dec 10.9 Hong Kong interests
Bulk Str. Hvy. Friedrich Oldendorff 74,483 2006 Hudong Zhonghua 08-Dec 10.5 Hong Kong interests
Bulk 4x30.5t cr. Morning Orchid 28,310 2009 Shimanami Shipyard 06-Dec 8.1 Undisclosed interests
Bulk 4x30.5t cr. Lake Deer 28,225 2011 Imabari SB (Imabari) 06-Dec 9.2 Undisclosed interests
Bulk Gearless Afovos 74,306 2001 Hyundai HI (Ulsan) 06-Dec 8.8 Chinese interests
Bulk 4x25t cr. Theoxenia 42,648 1997 I.H.I. (Tokyo) 06-Dec at auction 2.5 Undisclosed interests
Bulk 4x30t cr. Orion Express 47,280 1998 Oshima Shipbuilding 05-Dec 5.3 U.A.E. interests
Bulk Gearless Evanthia 74,350 2001 Hyundai HI (Ulsan) 05-Dec 8.5 Chinese interests
Bulk 4x25t cr. Resounder 45,724 2000 Tsuneishi Zosen 05-Dec 7.4 Chinese interests
* En bloc Sales. #En Bloc price shown under first ship of bloc.
Clarksons Research ii 21-Dec-17
Lice
nsed
to C
lark
sons
Res
earc
h S
ampl
e. D
istr
ibut
ion
is r
estr
icte
d; p
leas
e re
mem
ber
to a
ckno
wle
dge
the
sour
ce. S
hipp
ing
Inte
llige
nce
Wee
kly,
Issu
e 13
03Licensed to C
larksons Research S
ample. D
istribution is restricted; please remem
ber to acknowledge the source. S
hipping Intelligence Weekly, Issue 1303

Fleet Changes, Bunkers & Capital Market Activity
Cargo Fleet Tanker Fleet Bulk Carrier Fleet Containership Fleet
Changes 2016 2017 to date 2016 2017 to date 2016 2017 to date
(No. Vessels , 000dwt/teu) No. 000 Dwt No. 000 Dwt No. 000 Dwt No. 000 Dwt No. 000 Teu No. 000 TeuFleet 1st January 6,080 523,838 6,374 555,200 10,727 776,734 10,876 793,867 5,229 19,776 5,160 20,023Changes: Deliveries 333 32,959 330 37,461 565 47,240 454 38,163 131 906 143 1,118
Sold For Scrap 40 2,502 98 10,683 408 29,248 212 14,196 194 654 140 397Misc. Additions 5 1,179 1 320 0 0 0 0 0 0.0 0 0Misc.Removals/Losses 4 274 3 521 8 859 2 324 6 5 2 3
Net Change During Year 294 31,362 230 26,578 149 17,134 240 23,643 -69 246 1 718Fleet End Yr/ Yr to Date 6,374 555,200 6,604 581,778 10,876 793,867 11,116 817,511 5,160 20,023 5,161 20,741% Change Since Start Year 4.8% 6.0% 3.6% 4.8% 1.4% 2.2% 2.2% 3.0% -1.3% 1.2% 0.0% 3.6%Tankers and bulkcarriers over 10,000 dwt only are included in the analysis in this table. Great Lakes Only vessels are excluded.
Deliveries to the World FleetType Date Vessel Name Flag Year Dwt Owner Shipyard & Yard No. Contracted
Built PriceAHTS Dec'17 Posh Oribi SG. 2017 2,450 POSH Deepwater PaxOcean Zhuhai PX1085 0
Bulk Dec'17 NC Sapphire JA. 2017 66,485 Taiyo Nippon Kisen Mitsui SB (Tamano) 1942 0
MSV Dec'17 MPV Everest BS. 2017 7,278 New Orient Marine Keppel Singmarine H389 $m 190.00Bulk Dec'17 Medi Zuoz LU. 2017 60,000 D'Amico Soc di Nav Oshima Shipbuilding 10813 0Ore Dec'17 FMG Matilda H.K. 2017 262,000 Fortescue Metals Grp GSI Nansha 14121003 0
Container Dec'17 Shigenobu JA. 2017 3,890 Imoto Shoun Yamanaka Zosen 1070 0
Chip Dec'17 Sun Plus JA. 2017 49,720 Galaxy Shipping Tadotsu Shipyard 1847 0
Pass/Car F. Dec'17 Harmony Yungang PA. 2017 7,495 C-K Ferry Shandong Huanghai SBK32 0
Bulk Dec'17 Xing De Hai PA. 2017 82,204 Unknown Japanese Oshima Shipbuilding 10829 0
PCC Dec'17 An Ji 24 PRC 2017 11,631 Anji Automotive CSC Jinling Shipyard JLZ9150405 0
Open Hatch Dec'17 Tczew LI. 2017 38,520 Polish Steamship Co. Zhejiang Yangfan BC38K-PZ05 $m 22.50
Pass/Car F. Dec'17 Eidesfjord NO. 2017 881 Fjord1 AS Tersan Shipyard 1074 0
Pass/Car F. Dec'17 Gloppefjord NO. 2017 859 Fjord1 AS Tersan Shipyard 1073 0
L.N.G. Dec'17 Eduard Toll BS. 2017 85,000 Teekay Corp/CLNG JV Daewoo (DSME) 2423 $m 350.00
Chem & Oil Dec'17 Golden Sky LI. 2017 16,297 Dorval Kaiun K.K. Usuki Zosensho 1760 0Container Dec'17 MSC Madhu B MD. 2017 134,007 Seaspan Corporation HHIC-Phil (Subic SY) P0147
Pass/Car F. Dec'17 Protoporos X GR. 2017 879 Evoikos VI Maritime Kyriakos Sarantis 148 0
Chem & Oil Dec'17 Kokako N.Z 2017 48,929 Silver Fern Shipping Hyundai Mipo 2561 0
Bulk Dec'17 United Eternity PA. 2017 182,000 NS United KK Namura Shipbuilding 432 0
Tanker Dec'17 Karekare MA. 2017 159,638 Cardiff Marine Shanghai Waigaoqiao1392 0
PCC Dec'17 Golden Ray M.I. 2017 20,995 Hyundai Glovis Hyundai Mipo 8151 $m 77.75
Tanker Dec'17 Ithaki Warrior GR. 2017 159,962 Polembros Shipping Shanghai Waigaoqiao1304 0
Chem & Oil Dec'17 Tiger Glory H.K. 2017 25,273 Greathorse Chemical Fukuoka SB 2077 0
Open Hatch Dec'17 Top Confidence PRC 2017 48,500 TSL Group Jiangsu Zhenjiang SYYC057 0
Regional Prices This
Bunker Prices 2015 2016 2017 Dec 15 Dec 21 2015 2016 2017 Dec 15 Dec 21 Week (380 cst)Rotterdam 481 383 472 541 556 265 213 304 336 349 UP... 4.0%Hamburg 512 403 492 559 568 273 222 315 356 360 UP... 1.1%Genoa 549 445 540 618 623 289 231 327 362 368 UP... 1.7%Gibraltar 534 427 523 596 598 286 227 323 358 365 UP... 1.8%Philadelphia 558 421 514 598 603 303 236 328 373 378 UP... 1.3%Houston 546 430 509 573 580 272 209 301 349 350 UP... 0.4%Cristobal 581 452 531 585 590 286 223 315 358 358 STEADY... 0.0%Los Angeles 566 472 554 618 623 289 234 337 370 387 UP... 4.6%Tokyo - - - 632 625 340 264 362 397 406 UP... 2.4%Singapore 499 401 492 558 563 293 233 328 367 377 UP... 2.7%Fujairah 693 492 565 613 613 293 233 323 355 367 UP... 3.4%
Capital Market Trends
Activity 2013 2014 2015 2016 2017 2013 2014 2015 2016 2017 This YearShipping IPOs 15 15 10 4 8 2,969 1,637 828 296 823 UP... 183%Shipping Follow Ons 60 58 40 40 41 6,168 8,466 4,548 2,875 3,776 UP... 34%Shipping Bonds 58 52 34 28 41 11,174 9,467 7,495 6,556 8,568 UP... 33%Total Shipping 133 125 84 72 90 20,311 19,571 12,870 9,728 13,166 UP... 38%Total Offshore^ 99 78 41 28 29 19,740 15,577 19,884 7,600 4,727 DOWN... -37%Total Shipyard^ 14 27 14 12 5 2,140 6,751 1,820 4,358 4,258 STEADY... 0%
Clarksons Research iii
Average MGO Price, $/tonne Average 380 cst Price, $/tonne
Data includes companies whose core activity is owning merchant vessels, offshore units, or shipbuilding. ^Totals for Offshore and Shipyard activity include IPOs, follow ons, and bonds. Trends this year based on annualised figures for this year against last year. For further information see Shipping Intelligence Network and Capital Market Monthly.
Number $ Million
21-Dec-17
Lice
nsed
to C
lark
sons
Res
earc
h S
ampl
e. D
istr
ibut
ion
is r
estr
icte
d; p
leas
e re
mem
ber
to a
ckno
wle
dge
the
sour
ce. S
hipp
ing
Inte
llige
nce
Wee
kly,
Issu
e 13
03Licensed to C
larksons Research S
ample. D
istribution is restricted; please remem
ber to acknowledge the source. S
hipping Intelligence Weekly, Issue 1303

Latest Tanker Timecharter Fixtures...Reported Charterer Vessel Name D / Year Dwt Ice LR Ext. Period Rate Delivery
C Built equiv. $ per Day Date Place
21-Dec Shell Maran Gemini D 1999 310,139 30-60 days $15,000 Dec 17 Fujairah
08-Dec Norden Sea Horizon C 2003 47,147 9-12 Mths $13,500 Dec 17 ARA
05-Dec Shell Pyxis Delta C 2006 46,616 Ext 6 Mths $14,500 Dec 17 D/C
28-Nov Scorpio Zefyros C 2013 50,000 Ext 6 Mths $13,250 Dec 17 D/C
17-Nov CCI Turmoil C 2011 50,000 1 Yr $13,850 Nov 17 USAC
15-Nov ST Shipping Kudos D 2007 109,672 1 Yr $15,000 Nov 17 Fujairah
10-Nov CCI Luctor C 2011 50,000 1 Yr $13,850 Nov 17 New York
06-Nov Koch Trikwong Venture D 2012 297,136 1 Yr $27,500 Nov 17 China
30-Oct Clearlake NS Captain D 2006 105,914 1 Yr/1 Yr $15,500 Nov 17 Trieste
30-Oct Clearlake NS Columbus D 2007 105,703 1 Yr/1 Yr $15,500 Oct 17 C. Mediterranean
26-Oct Trafigura Cielo Bianco C 2017 74,999 6 Mths/6 Mths $13,750/$14,750 Nov 17 Ex Yard Hyundai Vinashin
20-Oct Navig8 Mare Nostrum C 2009 110,295 6 Mths/6 Mths $15,650/$16,650 Oct 17 Korea
19-Oct ST Shipping SN Olivia D 2010 109,266 Ext 1 Yr/Option $15,500 Oct 17 D/C
19-Oct ST Shipping SN Claudia D 2009 109,266 Ext 1 Yr/Option $15,500 Oct 17 D/C
12-Oct ST Shipping Nord Sustainable C 2015 50,800 1 Yr/1 Yr $14,750/$16,250 Oct 17 Singapore
05-Oct Trafigura Alqadisia D 2008 115,567 3 Mths/3 Mths $14,500/$15,000 Oct 17 India
05-Oct ST Shipping Butterfly C 2005 47,326 1 Yr $13,500 Oct 17 USG
05-Oct ST Shipping Maersk Petrel C 2007 109,672 1 Yr $15,250 Oct 17 Singapore
05-Oct Cargill Champion Prosperity C 2009 114,500 3 Mths/3 Mths/3 Mths/3 Mths $14,400 for firm period Oct 17 Korea
04-Oct Norden Omodos C 2009 50,100 1 Yr/1 Yr $13,500/$14,500 Oct 17 USG
04-Oct Trafigura Bai Lu Zuo D 2011 75,594 1D 1 Yr/1 Yr $13,500/$15,500 Oct 17 Korea
28-Sep Shell Fidelity C 2004 46,803 Ext 6 Mths/3 Mths $12,750/$13,500 Nov 17 Atlantic Basin
26-Sep Stena Weco Miss Marina C 2011 47,999 6 Mths/6 Mths $13,400/$14,250 Sep 17 Mediterranean
18-Sep Unipec Radiant Star D 2005 105,996 1 Yr $14,000 Oct 17 Far East
18-Sep PBF Energy Americas Spirit D 2009 111,920 1 Yr $15,000 Sep 17 USG
29-Aug Maersk Stealth Norvic D 2010 115,873 1 Yr/1 Yr $13,000/$14,000 + pshare Aug 17 West
29-Aug Clearlake Maersk Cancun C 2017 49,919 1 Yr $14,750 Sep 17 Ex Samsung SY, Ningbo
25-Aug Shell Spottail C 2008 74,998 3 Mths $13,250 Aug 17 C. Mediterranean
Latest Dry Bulk Timecharter Fixtures...Reported Charterer Vessel Name Year Dwt Cbm Gear Period Rate Delivery
Built $ per Day Date Place20-Dec Jiangsu Steamship Win Win 2001 170,094 186,675 12-14 Months $16,000 30Dec-31Dec Lanshan
19-Dec Centurion Mia S 2010 56,835 71,634 4C x 36T 3-5 Months $14,750 Prompt EC Mexico
19-Dec Meadway Shipping KM Weipa 2017 63,377 80,498 4C x 30T 3-5 Months $18,250 25Dec-30Dec Colombia
15-Dec CNR Aeolos 2001 31,651 40,141 4C x 30T 3-5 Months $9,500 Prompt East Med
15-Dec CNR JOSCO Hangzhou 2012 58,669 73,679 4C x 30T 3-5 Months $10,250 17Dec Nagoya
15-Dec CNR GH Sky Beauty 2017 63,398 78,703 4C x 36T 3-5 Months $11,250 13Dec-14Dec Krishnapatnam
15-Dec CNR Darya Uma 2005 76,520 91,357 11-13 Months $12,500 25Jan-30Jan Dalian
15-Dec Bergebulk Sonia 2009 177,974 194,179 4-6 Months $21,750 19Dec-21Dec Qingdao
14-Dec Norden Jag Aarati 2011 80,677 95,172 4-7 Months $13,500 Prompt Haldia
13-Dec CNR Soroco 2008 78,888 91,188 12-15 Months $11,500 01Jan-15Jan CJK
13-Dec Norden Athanasia C 2012 80,988 97,091 5-7 Months $13,000 Prompt Vizag
13-Dec Norden Sasebo Green 2014 77,880 92,983 3-5 Months $13,250 Prompt Haldia
13-Dec CNR Danae 2001 75,106 90,124 15-18 Months $10,250 17Dec-29Dec Oita
13-Dec CNR Lady Maria Ocean 2007 76,662 90,740 5-7 Months $11,500 24Dec Nanao
13-Dec Pacific Bulk Aeolian Fortune 2011 82,099 97,233 4-7 Months $13,000 12Dec-14Dec CJK
12-Dec Phaethon Stahla 2012 76,059 90,500 4-7 Months $11,500 10Dec-15Dec Taichung
11-Dec EGPN Medi Hong Kong 2006 82,790 97,233 10-12 Months $12,400 15Dec-21Dec Paradip
08-Dec Bilgent Pacific Century 2011 180,467 201,953 11-13 Months $17,750 15Dec CJK
08-Dec Louis Dreyfus Istria 2013 81,761 98,091 3-5 Months $11,250 11Dec Dalian
08-Dec CNR Egret Oasis 2014 76,028 90,540 3-5 Months $11,450 12Dec-13Dec Lianyungang
08-Dec Solebay Ocean Gem 2011 75,618 90,068 4-6 Months $12,000 18Dec-19Dec Tanjung Bin
08-Dec CNR Argentina 2010 177,897 194,486 11-13 Months $16,750 01Feb-01Mar Singapore-Japan
07-Dec EGPN Boston 2007 177,828 193,247 16-19 Months $17,000 06Dec Liuheng
07-Dec Oldendorff Avalon 2011 81,565 95,700 4-7 Months $12,000 16Dec-17Dec Cai Lan
07-Dec CNR Te Ho 2004 77,834 92,151 1 Years $11,100 13Dec Donghae
07-Dec JSSSC Quorn 2010 178,005 194,179 11-13 Months $16,500 08Dec Zhoushan
05-Dec Tianhui Leonidas 2017 63,459 78,860 4C x 30T 4-6 Months $15,750 09Dec-16Dec Houston
Clarksons Research iv 21-Dec-17
Timecharter Fixture RecordLi
cens
ed to
Cla
rkso
ns R
esea
rch
Sam
ple.
Dis
trib
utio
n is
res
tric
ted;
ple
ase
rem
embe
r to
ack
now
ledg
e th
e so
urce
. Shi
ppin
g In
telli
genc
e W
eekl
y, Is
sue
1303
Licensed to Clarksons R
esearch Sam
ple. Distribution is restricted; please rem
ember to acknow
ledge the source. Shipping Intelligence W
eekly, Issue 1303
The Timecharter Market Tanker Timecharter Market
Timecharter Rates Average Rate $/day To Date Dec T/C Activity & The Freight Market2014 2015 2016 2017 21 VLCC (Modern)
One Year Timecharter310,000 Dwt Modern 28,115 48,433 36,585 27,130 24,750150,000 Dwt Modern 22,712 35,875 27,302 18,515 17,500110,000 Dwt Modern 17,538 26,712 21,488 15,495 15,25074,000 Dwt Modern 15,880 23,567 18,116 13,076 13,12547-48,000 Dwt Modern 14,630 17,769 15,092 13,203 14,00037,000 Dwt Modern 13,774 15,880 13,998 11,409 12,500
Three Year Timecharter310,000 Dwt Modern 30,183 42,707 33,019 28,799 29,000150,000 Dwt Modern 24,413 33,038 26,285 22,507 22,250110,000 Dwt Modern 19,029 24,587 20,601 16,863 16,75074,000 Dwt Modern 16,466 20,510 17,715 14,875 14,87547-48,000 Dwt Modern 15,399 16,409 15,212 14,000 14,00037,000 Dwt Modern 14,678 15,250 14,264 12,843 12,750
Five Year Timecharter310,000 Dwt Modern 32,154 40,933 31,792 28,824 30,000110,000 Dwt Modern 20,317 23,173 19,406 17,250 17,25047-48,000 Dwt Modern 16,063 16,091 14,965 14,174 14,125
T/C Activity… To Date
...over 1 year 2013 2014 2015 2016 2017
VLCC 200,000 + 12 29 68 25 23Suezmax 125-200,000 14 25 36 11 15Aframax 85-125,000 41 60 62 29 30Panamax 55-85,000 27 28 31 21 13Handy 10-55,000 139 101 100 83 63
Total No. Fixtures 233 243 297 169 144
Total in m. dwt 18.8 26.1 40.2 18.0 16.6Estimated owners' rates prior to start 2016. Modern=no more than 10 years old.
Bulk Carrier Timecharter Market
Timecharter Rates Average Rate $/day To Date Dec T/C Activity & The Freight Market(Average Pac/Atl Delivery) 2014 2015 2016 2017 21 Capesize (Modern)One Year Timecharter…Capesize Modern 21,751 11,175 8,236 15,084 18,500Panamax Modern 12,035 7,492 6,263 10,643 11,850Supramax Modern 11,385 8,106 6,495 9,804 10,750Handysize Modern 9,012 6,692 5,264 8,069 9,000Three Year Timecharter…Capesize Modern 20,889 12,104 9,727 14,623 15,750Panamax Modern 13,050 8,373 6,843 10,909 11,800Supramax Modern 11,385 8,462 6,972 9,961 10,500Handysize Modern 9,346 7,077 5,736 8,176 8,750Five Year Timecharter…Capesize Modern 21,038 13,270 10,623 15,531 16,425
Panamax Modern 13,935 9,519 7,841 10,996 11,650Supramax Modern 11,428 8,712 7,660 10,235 10,500Handysize Modern 9,519 7,293 6,373 8,387 8,750
T/C Activity… To Date
...over 1 year 2013 2014 2015 2016 2017
Capesize 100,000 + 33 61 36 40 69Panamax 65-100,000 78 70 45 35 71Handymax 40-65,000 11 9 4 13 8Handysize 10-40,000 1 3 0 0 1
Total No. Fixtures 123 143 85 88 149
Total in m. dwt 12.7 16.8 10.3 10.8 18.6
Clarksons Research Page 9 21-Dec-17
Total Fixtures
Total Fixtures
Tanker and bulk carrier T/C activity size ranges reflect existing Clarksons Research ship type definitions. Modern is taken to mean no more than 10 years old. A wider selection of bulkcarrier T/C rates are available on Shipping Intelligence Network at www.clarksons.net.
Capesize rates based on 180,000 dwt vessel from start 2015 and 172,000 dwt previously. Supramax rates based on 58,000 dwt vessel from start 2015 and 52,000 dwt previously. Handysize rates based on 32,000 dwt vessel from 18 Nov 2016 and 30,000 dwt previously.
0
20
40
60
80
100
120
0
2
4
6
8
10
12
Nov
-15
Jan-
16
Mar
-16
May
-16
Jul-1
6
Sep
-16
Nov
-16
Jan-
17
Mar
-17
May
-17
Jul-1
7
Sep
-17
Nov
-17
Spot $/day
1 Year t/c
No. fixtures $,000/day
0
5
10
15
20
25
0
5
10
15
20
25
Nov
-15
Jan-
16
Mar
-16
May
-16
Jul-1
6
Sep
-16
Nov
-16
Jan-
17
Mar
-17
May
-17
Jul-1
7
Sep
-17
Nov
-17
1 Year t/c
Spot $/day
No. fixtures $,000/day
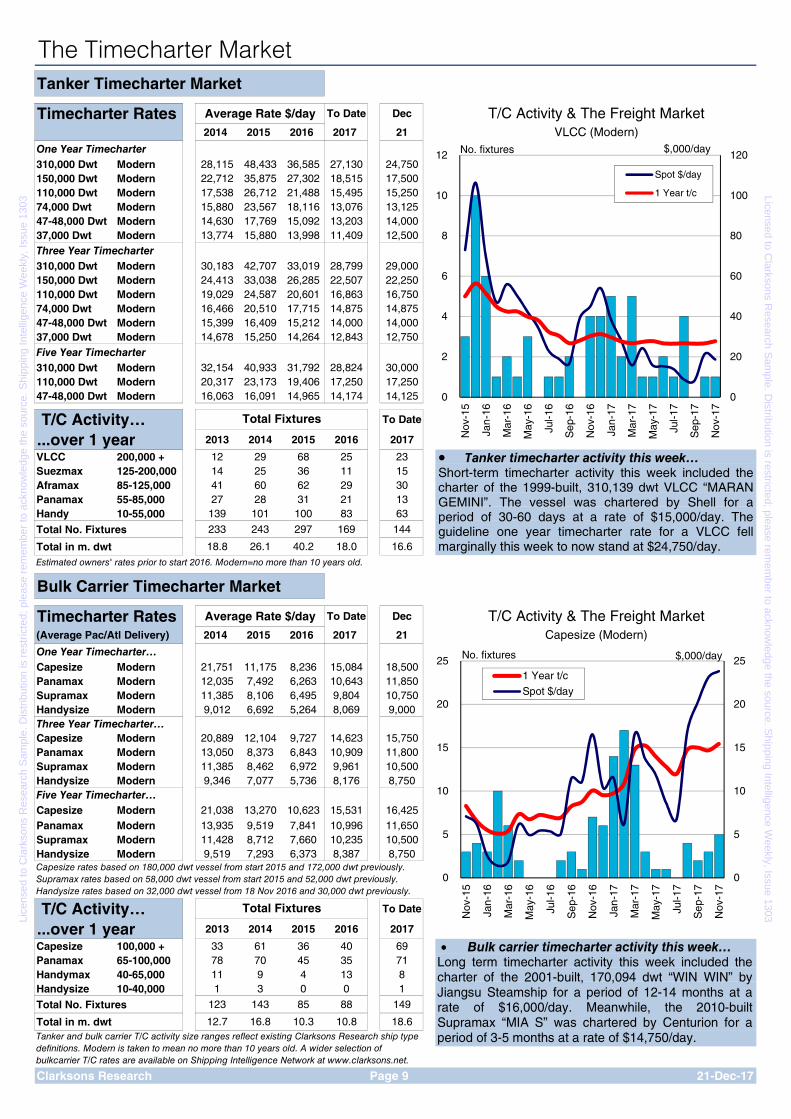
• Bulk carrier timecharter activity this week… Long term timecharter activity this week included the charter of the 2001-built, 170,094 dwt “WIN WIN” by Jiangsu Steamship for a period of 12-14 months at a rate of $16,000/day. Meanwhile, the 2010-built Supramax “MIA S” was chartered by Centurion for a period of 3-5 months at a rate of $14,750/day.
• Tanker timecharter activity this week… Short-term timecharter activity this week included the charter of the 1999-built, 310,139 dwt VLCC “MARAN GEMINI”. The vessel was chartered by Shell for a period of 30-60 days at a rate of $15,000/day. The guideline one year timecharter rate for a VLCC fell marginally this week to now stand at $24,750/day.
Lice
nsed
to C
lark
sons
Res
earc
h S
ampl
e. D
istr
ibut
ion
is r
estr
icte
d; p
leas
e re
mem
ber
to a
ckno
wle
dge
the
sour
ce. S
hipp
ing
Inte
llige
nce
Wee
kly,
Issu
e 13
03Licensed to C
larksons Research S
ample. D
istribution is restricted; please remem
ber to acknowledge the source. S
hipping Intelligence Weekly, Issue 1303

The Shipbuilding Market What's Been Ordered...
S Type Date Dwt/Unit Delivery Builder Price Owner/Manager*5 Open Hatch Dec-17 62,000 Jul 2019 COSCO Dalian SY RMB m 222.00 COSCO Shpg Spec
5 Bulk Dec-17 208,000 Dec 2019 New Times SB $m 44.70 2020 Bulkers
5 Bulk Dec-17 208,000 Jan 2020 New Times SB $m 44.70 2020 Bulkers5 Pass/Car F. Dec-17 700 2019 Tianjin Xingang HI COSCO Qingdao5 L.P.G. Dec-17 50,000 79,500 2020 Unknown Exmar
5 L.P.G. Dec-17 50,000 79,500 2020 Unknown Exmar
5 L.P.G. Dec-17 54,000 82,000 Dec 2019 Kawasaki HI Sakaide Phoenix Tankers5 Bulk Dec-17 208,000 2020 Shanghai Waigaoqiao Foremost Maritime5 Bulk Dec-17 208,000 2020 Shanghai Waigaoqiao Foremost Maritime
5 Cruise Dec-17 270 May 2021 VARD Soeviknes Ponant S.A.
5 Cruise Dec-17 3,640 930 2022 Fincantieri Ancona Viking Ocean Cruises
5 Cruise Dec-17 3,640 930 2023 Fincantieri Ancona Viking Ocean Cruises
5 Container Dec-17 25,000 2,200 Nov 2019 Jiangsu New YZJ CMA CGM
5 Container Dec-17 25,000 2,200 2020 Jiangsu New YZJ CMA CGM
5 Container Dec-17 25,000 2,200 2020 Jiangsu New YZJ CMA CGM
5 Chem & Oil Dec-17 14,000 Nov 2019 Wuchang SB Group Marnavi
5 Chem & Oil Dec-17 14,000 2020 Wuchang SB Group Marnavi
5 Tanker Dec-17 64,900 Feb 2020 GSI Nansha COSCO Shpg Energy
5 Tanker Dec-17 64,900 May 2020 GSI Nansha COSCO Shpg Energy
5 Products Dec-17 109,900 Oct 2020 GSI Nansha COSCO Shpg Energy
5 Products Dec-17 109,900 Jan 2021 GSI Nansha COSCO Shpg Energy
5 Tanker Dec-17 114,000 Nov 2019 GSI Nansha COSCO Shpg Energy5 Tanker Dec-17 114,000 Apr 2020 GSI Nansha COSCO Shpg EnergyS=Status, where: 5=confirmed order, 16=unconfirmed order, 17=option. Other units are: teu for containerships, cbm for gas vessels, numbers of cars, passengers or berths.* The Primary Reference Company, as used in the Clarkson Fleet Database i.e. the company with the main commercial responsibility for the ship.
Newbuilding Year End, $m. Three Month Shipbuilding News
2014 2015 2016 Dec
TankersVLCC 320,000 dwt 97.0 93.5 84.5 81.5 FIRM....... 0.2%Suezmax 157,000 dwt 65.0 63.0 54.5 55.0 FIRM....... 0.9%Aframax 115,000 dwt 54.0 52.0 44.5 44.0 FIRM....... 1.6%'MR' Tanker 51,000 dwt 36.8 35.5 32.5 33.8 FIRM....... 0.2%Bulk CarriersCapesize 180,000 dwt 54.0 46.0 42.0 44.0 FIRM....... 2.7%Panamax 81,000 dwt 30.0 26.5 24.5 25.5 FIRM....... 3.5%Handymax 62,000 dwt 27.0 24.3 22.3 24.0 FIRM....... 3.6%Handysize 38,000 dwt 23.0 20.5 19.5 22.0 FIRM....... 3.6%Gas VesselsLPG 82,000m³ 79.0 77.0 71.0 70.0 SAME.......LNG 174,000m³ 205.0 204.0 197.0 182.0 WEAKER... -0.2%Dry CargoContainer 13,000 teu 116.0 116.0 109.0 107.0 WEAKER... -0.9%Container 2,750 teu 32.5 29.5 27.0 28.8 FIRM....... 2.7%Pure Car Carrier 6,000 ceu 64.0 59.5 60.0 61.0 FIRM....... 0.3%
Clarkson Index 138 131 123 125 FIRM....... 0.5%
Newbuilding Vessels Contracted Year-on-Year Newbuilding Price Index
2014 2015 2016 2017
Oil Tankers 223 424 129 198 FIRMER... 58%Chemical & Spec. Tankers 159 139 59 52 WEAKER!! -9%LPG Carriers 111 74 17 22 FIRMER... 33%LNG Carriers 69 37 9 17 FIRMER... 94%Bulk Carriers 756 353 55 248 FIRMER... 364%Containerships 168 267 96 104 FIRMER... 11%General Cargo Vessels 101 111 29 37 FIRMER... 31%Ro-Ro Vessels 35 58 22 13 WEAK…. -39%Refrigerated Vessels 13 6 3 WEAK…. -100%Offshore Vessels 501 179 58 31 WEAK…. -45%FPSO/FSU 5 2 6 #DIV/0! #DIV/0!Passenger & Cruise Ships 61 52 101 71 WEAK…. -28%Other Misc. Vessels 39 41 23 28 FIRMER... 25%TOTAL CONTRACTING 2,241 1,743 601 827 FIRMER... 41%
Clarksons Research Page 10 21-Dec-17
Prices .... Trend ...
Activity .... Trend ...
Newbuilding prices vary as to country of build, delivery and ship specification. Prices here are end year/latest and from Jun-08 assume a "European spec", 20/20/20/20/20% payments and "first class competitive yards" quotations, and relate to market contracts where these have taken place and to brokers' best estimates when no contracts have occurred. 3-month trend basis last 3 vs previous 3 months.
100
110
120
130
140
150
160
170
180
190
200
Nov
-07
Nov
-08
Nov
-09
Nov
-10
Nov
-11
Nov
-12
Nov
-13
Nov
-14
Nov
-15
Nov
-16
Nov
-17
Ten year trend innewbuilding prices
Index, Jan'88 = 100
• In the tanker sector, GSI Nansha has won a number of orders from COSCO Shipping Energy: 3 x 114,000 dwt Aframaxes, 2 x 109,900 dwt LR2s and 2 x 64,900 dwt crude Panamaxes. In the bulkcarrier sector, Shanghai Waigaoqiao won orders for 2 x 208,000 dwt Newcastlemax units from Foremost Maritime, while 2020 Bulkers declared options for 2 x 208,000 dwt vessels at New Times. COSCO Shipping Specialised has declared an option for one 62,000 dwt open hatch bulker at COSCO Dalian.
• Phoenix Tankers (MOL) has placed an order for an 82,000 cu.m. VLGC at Kawasaki HI. Exmar has announced an order for 2 x 79,500 cu.m. VLGCs, due for delivery in 2020, reportedly backed by long-term charter to Statoil. In the boxship sector, owner Quanzhou Ansheng announced orders for 12 x 640 TEU units, split across Fujian Southeast, Fujian Mawei and Nantong Xiangyu.
• In the passenger markets, Viking Ocean has declared options for 2 x 930 pax/47,800 GT cruise ships at Fincantieri. Elsewhere, VARD announced an order from Ponant for a 30,000 GT ‘Polar Class 2’ cruise ship, due for delivery in Q2 2021. Finally, Tianjin Xingang has won an order for a 700 pax/14,000 GT ferry from COSCO Qingdao.
Lice
nsed
to C
lark
sons
Res
earc
h S
ampl
e. D
istr
ibut
ion
is r
estr
icte
d; p
leas
e re
mem
ber
to a
ckno
wle
dge
the
sour
ce. S
hipp
ing
Inte
llige
nce
Wee
kly,
Issu
e 13
03Licensed to C
larksons Research S
ample. D
istribution is restricted; please remem
ber to acknowledge the source. S
hipping Intelligence Weekly, Issue 1303

The Ship Recycling Market What's Been Scrapped...
Type Date Vessel Name Flag Blt Dwt Ldt Owner Buyer $/ldt $ m.Bulk Dec '17 Krakow 1982 70,838 15,099 SMT Shipping India 425.0 6.42
L.P.G. Dec '17 Skarpov 1979 55,173 Riverstone Services India
AHTS Dec '17 Brodospas Sun 1986 1,230 Brodospas d.o.o. Turkey
Seis. Survey Dec '17 Northern Explorer 1987 1,000 2,106 SeaBird Exploration India 510.0 1.07
O. Salv. Tug Dec '17 Red Eagle 1976 942 ATA Salvage India
AHTS Dec '17 Hurricane-I 1988 2,499 Hermes Maritime Bangladesh
RoPax Dec '17 Star 1978 5,455 Med Ferry Turkey
Reefer Dec '17 Blue Ice 1980 4,014 Afk Universal Consul India
PCC Dec '17 Yong Chang 1988 12,762 Partagas Maritime India
Container Dec '17 Al Abdali 1998 49,844 Hapag-Lloyd Cont Turkey
Chem & Oil Dec '17 Aurelia 1993 4,571 1,490 Sea Link Shipping LL India
AHTS Dec '17 Seacor Venture 2000 2,093 Seacor Marine Unknown
Supply Dec '17 Seacor Spirit 1998 1,758 Mantenimiento Unknown
AHTS Dec '17 Demo II 1980 1,200 SBOS Unknown
TSH Dredger Dec '17 Xin Hai Jing 1981 13,679 7,654 CHEC Dredging Co Ltd China P.R.
AHTS Dec '17 BNI Acamar 1975 1,116 Bahtera Niaga Indonesia
Container Dec '17 Asir 1998 49,856 Hapag-Lloyd Cont Turkey
Tanker Dec '17 Sendora 1996 68,790 12,964 Hanan Shipping India
Tanker Dec '17 Moscow Stars 1999 106,450 16,321 Sovcomflot JSC As is S'pore 415.0 6.77
Tanker Dec '17 Plata Glory 1999 300,144 38,361 Sinokor Merchant Indian Sub cont 438.0 16.80
Tanker Dec '17 Britannia 1998 99,222 16,567 Unknown India
Chem & Oil Dec '17 Cassendra 1996 40,584 9,597 Oyster Cargo & Shpg As is Bandar Abbas 375.0 3.60
Chem & Oil Dec '17 Nireas 1995 29,667 10,203 UMDE Ship Mgmt As is Bandar Abbas 375.0 3.83
Scrap Year End ($/ldt) This Year Scrapping Price Trends
Prices... 2014 2015 2016 Latest %
Tankers 450 290 290 415 43%
Dry Cargo 420 282 290 430 48%
Buyer Year (m dwt) This Year
Activity... 2014 2015 2016 2017 %
China 8.5 6.8 5.1 5.4 8%
India 8.7 8.1 12.8 8.6 -31%
Bangladesh 7.2 14.3 15.3 9.9 -34%
Pakistan 7.5 8.4 9.7 5.7 -41%
Other 1.8 1.5 1.6 4.7 210%
TOTAL 33.7 39.0 44.5 34.3 -21%
Size & Year (m dwt) This Year
Type... 2014 2015 2016 2017 % Ship Recycling Market News
Tankers VLCC 2.4 0.5 0.6 3.9 584%
Suezmax 1.1 0.1 1.7 1026%
Aframax 2.1 0.3 0.6 3.4 446%
Handy 2.1 1.5 1.1 1.7 59%
< 10,000 dwt 0.1 0.1 0.0 0.0 43%
Total Tankers 7.7 2.4 2.5 10.7 335%
Bulkcarriers
Capesize 4.2 15.4 13.3 6.1 -53%
Panamax 4.8 6.9 8.4 3.5 -57%
Handymax 3.2 3.1 4.3 3.0 -28%
Handysize 4.2 5.2 3.2 1.5 -52%
Total Bulkers 16.4 30.7 29.2 14.2 -51%
Containerships 5.3 2.8 8.7 5.3 -38%
Gas Vessels 0.3 0.3 0.4 0.4 0%
Other Dry 3.9 2.9 3.6 3.7 4%
TOTAL 33.7 39.0 44.5 34.3 -21%* The % change is based on annualised figures for this year against last year.
Clarksons Research Page 11 21-Dec-17
LI.
M.I.
PAL
PA.
PA.
Note: The scrap prices ($/ldt) are based on Indian prices for VLCC tankers and a Handy dry bulk carrier of around 8,000 ldt.
ME.
PA.
PRC
IA.
LI.
S.L
CY.
CS.
KN.
LI.
TZ.
AM.
BS.
KN.
MA.
PA.
MO.
KN.
200
250
300
350
400
450
Dec'15
Feb'16
Apr'16
Jun'16
Aug'16
Oct'16
Dec'16
Feb'17
Apr'17
Jun'17
Aug'17
Oct'17
Dec'17
US$ per ldt
Tankers - IndiaHandy Bulk - IndiaTankers - Bangladesh
• With the freight markets improving in the dry and containersectors this year, the supply of tonnage to the recycling markets hasdecreased year-on-year by 21% on an annualised basis. However, thesaving grace has been the tanker sector, with 10.7m dwt of tankertonnage scrapped this year, more than four times as much as last yearand accounting for 31% of total tonnage scrapped in the year to date.
• With Pakistan unable to import tankers all year, recyclers had tobe aggressive in purchasing other units such as bulkers and boxships,producing some of the highest prices seen for several years. The mainimporters of tanker units have been Bangladeshi recyclers, acquiring alarge share of available wet tonnage and being especially active in theVLCC/FPSO sector. India continues to improve the standards of theirrecycling yards, with more yards being HKC ratified as the governmentfocusses on implementing green recycling in Alang. It has been animpressive year in Turkey, with yards purchasing a large volume oftonnage across all sectors and prices breaking through the $300/ldtceiling. With most yards in Aliaga fully ratified by the HKC, it will likelyremain an attractive option for owners. China has remained quiet thisyear, with several yards closing. The government scrapping subsidy iscoming to an end this year and it will be interesting to see whetherrecyclers will now start to compete with the Indian Sub-Continent.
Lice
nsed
to C
lark
sons
Res
earc
h S
ampl
e. D
istr
ibut
ion
is r
estr
icte
d; p
leas
e re
mem
ber
to a
ckno
wle
dge
the
sour
ce. S
hipp
ing
Inte
llige
nce
Wee
kly,
Issu
e 13
03Licensed to C
larksons Research S
ample. D
istribution is restricted; please remem
ber to acknowledge the source. S
hipping Intelligence Weekly, Issue 1303
Economic IndicatorsGDP Growth & Forecasts*
China Japan USA Germany Euro Area World2014 7.3% 0.3% 2.6% 1.9% 1.3% 3.6%2015 6.9% 1.1% 2.9% 1.5% 2.0% 3.4%2016 6.7% 1.0% 1.5% 1.9% 1.8% 3.2%1Q17 6.9% 1.3% 2.0% 2.1% 2.1% 0.0%2Q17 6.9% 1.7% 2.2% 2.3% 2.4% 0.0%3Q17 6.8% 2.1% 2.3% 2.8% 2.6% 0.0%
2017 (f) 6.8% 1.5% 2.2% 2.0% 2.1% 3.6%2018 (f) 6.5% 0.7% 2.3% 1.8% 1.9% 3.7%
Industrial Production*: OECDavg: Germany U.K. USA Japan Europe OECD2014 1.2% 1.9% 4.1% 2.1% 0.5% 2.0%2015 0.5% 1.1% 1.2% -0.9% 1.0% 0.8%2016 0.8% 1.0% -0.9% -0.2% 1.2% 0.2%
Oct '17 2.7% 3.5% 2.9% 5.9% 3.9% 3.9%Nov '17 0.0% 0.0% 3.4% 0.0% 0.0% 0.0%
Industrial Production*: Asia
avg: R.o K. China Taiwan Thailand Malaysia India2014 0.0% 8.3% 6.2% -4.6% 5.1% 1.2%2015 -0.7% 6.1% -1.4% -3.4% 4.6% 3.3%2016 0.9% 6.0% 1.4% 0.4% 4.0% 0.3%
Sep '17 8.4% 6.6% 5.2% 4.2% 4.7% 3.8%Oct '17 -5.9% 6.2% 2.5% -0.1% 3.4% 2.2%Nov '17 0.0% 6.1% 0.0% 0.0% 0.0% 0.0%
Ind. Production*: E.Europe & S. Americaavg: Russia Czech. Hungary Poland Chile Brazil2014 1.7% 5.1% 7.1% 3.5% 0.1% -3.1%2015 -3.2% 4.2% 7.0% 4.8% -0.7% -8.5%2016 0.5% 2.8% 0.9% 3.0% -1.6% -6.7%
Sep '17 0.8% 4.4% 8.2% 4.3% 1.0% 2.5%Oct '17 -0.1% 10.4% 7.5% 12.3% 5.0% 5.2%Nov '17 -3.8% 0.0% 0.0% 9.0% 0.0% 0.0%
Currency Trends Spot ~ & Forward# ... Exchange Rate Trendsavg: Euro U.K. Japan Switz. Norway China2014 1.33 1.65 105.77 0.91 6.30 6.162015 1.11 1.53 121.07 0.96 8.05 6.282016 1.11 1.36 108.94 0.99 8.40 6.64Sep 1.19 1.33 110.64 0.96 7.84 6.57Oct 1.18 1.32 112.87 0.98 7.98 6.62Nov 1.17 1.32 112.95 0.99 8.16 6.62
21-Dec 1.19 1.34 113.31 0.98 8.38 6.583mo.# 1.20 1.34 112.86
12mo.# 1.22 1.36 110.89
avg: R.o K. H.Kong Singapore SDR India Australia2014 1,052.3 7.75 1.27 1.49 61.04 1.112015 1,131.7 7.75 1.37 1.40 64.10 1.332016 1,159.8 7.76 1.38 1.39 67.17 1.35Sep 1,131.8 7.81 1.35 1.42 64.41 1.25Oct 1,133.9 7.80 1.36 1.41 65.00 1.28Nov 1,104.2 7.81 1.36 1.41 64.87 1.31
21-Dec 1,081.0 7.82 1.35 1.42 64.09 1.30 *% change year-on-year. Source: IMF, OECD, The Economist. ~Currency units per US$ except £, Euro and SDR. # Forward Rates: The FT.
Interest Rate Trends ... Inflation & Prices … Prices in $/bbl or $/tPrime Lending Rates: Consumer Prices Crude Grain Steel
$ Libor Oil Wheat Ship Plate
avg: 6 mths. avg: Brent USG Japan
2014 0.16% 1.50% 5.95% 1.48% 3.25% 0.33% 2014 1.1% 1.6% 2.7% 1.7% 98.34 302 5922015 0.05% 1.50% 4.98% 1.48% 3.25% 0.48% 2015 0.6% 0.1% 0.8% 0.6% 52.98 228 4942016 0.02% 1.40% 4.35% 1.48% 3.51% 1.05% 2016 0.9% 1.3% -0.1% 1.1% 45.43 196 384Sep 0.00% 1.25% 4.35% 1.48% 4.25% 1.47% Sep 2.6% 2.2% 0.7% 2.3% 57.55 220 530Oct 0.00% 1.25% 4.35% 1.48% 4.25% 1.54% Oct 2.5% 2.0% 0.2% 2.2% 59.25 212 580Nov 0.00% 1.50% 4.35% 1.48% 4.25% 1.61% Nov 0.0% 2.2% 0.0% 0.0% 63.76 220 580
21-Dec 0.00% 1.50% 4.35% 1.48% 4.50% 1.79% Latest 0.0% 0.0% 0.0% 0.0% 64.35 222 580
Clarksons Research Page 12
Sep '17 3.5% 2.6% 1.6% 2.6% 3.1%
#Forward Rates as of: 21-Dec
Euro U.K. China Japan U.S.A. USA Japan OECD
21-Dec-17
2.5%Industrial Production
Eur
• This week, the US Senate ruled by 51 to 48 votes to pass sweeping tax cuts worth $1.5tn, fulfilling one of President Trump’s flagship campaign promises and kickstarting the most significant overhaul of US tax codes since 1986. As part of the new tax bill, corporations will see their headline tax rate permanently cut from 35% to 21%, while citizens’ tax rates will also be cut, albeit temporarily. US companies are expecting notably increased earnings in 2018 as a result, with airlines, banks, railroads and oil refiners reportedly expected to be amongst the biggest winners. The cuts are expected to support growth in US corporations, with stock markets already having risen to record highs in recent weeks at the prospect of the bill being passed. However, there also concerns from some analysts regarding potential negative long-term impacts of the bill on the stability of the US economy.
-25
-20
-15
-10
-5
0
5
10
15
20
25
30
Jan
'00
Jan
'01
Jan
'02
Jan
'03
Jan
'04
Jan
'05
Jan
'06
Jan
'07
Jan
'08
Jan
'09
Jan
'10
Jan
'11
Jan
'12
Jan
'13
Jan
'14
Jan
'15
Jan
'16
Jan
'17
% change
Atlantic
Pacific
70
80
90
100
110
120
130
140
Dec
'15
Feb
'16
Apr
'16
Jun
'16
Aug
'16
Sep
'16
Nov
'16
Jan
'17
Mar
'17
May
'17
Jul '
17
Sep
'17
Oct
'17
Dec
'17
$/Sterling$/Yen$/Euro
Index Jan'00=100
Lice
nsed
to C
lark
sons
Res
earc
h S
ampl
e. D
istr
ibut
ion
is r
estr
icte
d; p
leas
e re
mem
ber
to a
ckno
wle
dge
the
sour
ce. S
hipp
ing
Inte
llige
nce
Wee
kly,
Issu
e 13
03Licensed to C
larksons Research S
ample. D
istribution is restricted; please remem
ber to acknowledge the source. S
hipping Intelligence Weekly, Issue 1303

Ship Demand Trends
Oil Tanker million barrels per day % Chg
Demand .... 2014 2015 2016 2017* 2017/16
Oil ProductionWorld 93.4 96.0 96.2 96.0 0%USA 11.8 12.8 12.4 12.7 3%Middle East/ISC 29.1 30.2 31.9 31.2 -2%West Africa 5.2 5.1 4.6 4.7 2%South & Central America 7.6 7.8 7.4 7.4 0%North Africa 3.0 3.0 2.9 3.2 10%
VLCC DemandAG Exports to China 3.3 3.4 3.7 3.8 2%
to Japan 2.7 2.6 2.7 2.6 -5%to Korea 2.0 2.2 2.4 2.4 1%to USA/UKC 2.4 2.2 2.4 2.5 5%
Total Gulf Crude Exports 17.0 17.1 18.8 18.4 -2%
Crude Oil TradeImports: USA (seaborne) 4.5 4.2 4.6 4.6 0%
EU-5 5.5 5.9 5.8 6.1 4%China 5.6 6.1 7.1 7.9 11%
Total Seaborne Imports 36.2 37.6 39.1 40.2 3%
Products TradeImports: USA 1.4 1.5 1.6 1.6 -4%
EU-5 2.5 2.6 2.7 2.7 -1%Latin America 1.8 1.7 1.8 2.1 13%Asia 7.8 8.4 8.6 9.0 4%
Total Seaborne Imports 20.7 22.1 23.1 23.7 3%*2017 data are projections. Oil production data shows total supply including crude oil, lease condensates and NGLs; world supply includes refinery gains, other liquids.
Dry Bulk million tonnes % Chg
Demand .... 2014 2015 2016 2017* 2017/16
Steel ProductionChina 822.3 798.8 808.4 852.8 6%Japan 110.7 105.2 104.7 105.2 1%EU-28 169.3 166.2 162.2 168.6 4%Total Steel Prod. (listed) 1102.3 1070.2 1075.3 1126.7 5%
Iron Ore TradeImports: China 913.8 939.7 1007.9 1073.5 6%
Japan 136.4 131.0 130.0 124.8 -4%South Korea 73.5 73.3 71.7 73.0 2%
Total Seaborne Imports 1339.9 1363.6 1418.0 1492.5 5%Exports: Australia 717.0 766.8 808.0 830.7 3%
Coal TradeImports: ** China 239.0 163.6 200.6 220.2 10%
India 216.0 214.2 192.2 177.7 -8%Japan 183.2 184.7 183.8 185.8 1%South Korea 122.7 126.1 125.4 146.3 17%
Exports: ** Australia 375.1 378.2 381.2 377.8 -1%Indonesia 408.2 365.7 369.5 384.2 4%
Total Seaborne Coal Trade 1218.1 1144.0 1140.5 1199.7 5% *2017 data are projections. ** Steam coal, lignite & coking coal.
World Seaborne million tonnes % Chg
Trade… 2014 2015 2016 2017* 2017/16
Crude Oil 1,803 1,872 1,949 2,003 3%Oil Products 957 1,022 1,067 1,096 3%Dry Bulk 4,834 4,835 4,903 5,118 4%Containers 1,622 1,661 1,730 1,821 5%Other 1,392 1,435 1,488 1,566 5%World Seaborne Trade 10,608 10,825 11,136 11,604 4%y-o-y growth 3.4% 2.0% 2.9% 4.2%Data based on latest available information at start Dec-17. For more detail see Seaborne Trade Monitor on Shipping Intelligence Network.
Clarksons Research Page 13 21-Dec-17
0
10
20
30
40
50
60
200
240
280
320
360
400
440
Nov
-13
Feb
-14
May
-14
Aug
-14
Nov
-14
Feb
-15
May
-15
Aug
-15
Nov
-15
Feb
-16
May
-16
Aug
-16
Nov
-16
Feb
-17
May
-17
Aug
-17
Nov
-17
$,000/dayIndex
Steel Production Index
Capesize Earnings
Steel Production and Capesize Earnings
Major Oil Trades News: • US crude stocks fell last week to their lowest level since October 2015, with inventories declining by 6.5m bbls to stand at 436m bbls (excluding the US Strategic Petroleum Reserve). The fall was notably greater than analysts’ expectations that 3.8m bbls of crude would be drawn from inventories, contributing to a rise in crude oil prices in response to the news. Meanwhile, gasoline stocks rose by 1.2m bbls, although this was also below market expectations of an inventory gain of 1.9m bbls.
0
20
40
60
80
100
120
140
28
29
30
31
32
33
34
35
Nov
-13
Feb
-14
May
-14
Aug
-14
Nov
-14
Feb
-15
May
-15
Aug
-15
Nov
-15
Feb
-16
May
-16
Aug
-16
Nov
-16
Feb
-17
May
-17
Aug
-17
Nov
-17
$,000/daym. bpd
OPEC Production & VLCC Earnings
OPEC Oil Production
VLCC Earnings
Major Bulk Trades News: • Stockpiles of imported iron ore at major Chinese ports rose 4% m-o-m to reach 143.6mt in mid-December, the highest level on record. Stockpiles at these ports have risen by around a quarter, or almost 30mt, since the start of the year. • Meanwhile, European steel production continues to show signs of recovery, following declines in production in 2015 and 2016. Total crude steel production in Europeincreased 4% y-o-y to 17mt in November, with total steel production on the continent increasing 5% y-o-y to 192mt in January-November 2017. As a result, Europe’s total seaborne iron ore and coking coal imports are both expected to have grown in full year 2017, aftercontracting in both 2015 and 2016.
Lice
nsed
to C
lark
sons
Res
earc
h S
ampl
e. D
istr
ibut
ion
is r
estr
icte
d; p
leas
e re
mem
ber
to a
ckno
wle
dge
the
sour
ce. S
hipp
ing
Inte
llige
nce
Wee
kly,
Issu
e 13
03Licensed to C
larksons Research S
ample. D
istribution is restricted; please remem
ber to acknowledge the source. S
hipping Intelligence Weekly, Issue 1303

World Fleets & Orderbooks
Total Cargo Year End Orderbook & Delivery Schedule
Fleet, m. Dwt 2013 2014 2015 2016 No. m.Dwt No. m.Dwt % Fleet 2017 2018 2019+
CRUDE TANKERS 340.7 341.5 348.5 368.9 2,022 388.0 241 47.9 12.3% 0.8 28.3 18.8PRODUCTS TANKERS 144.5 149.8 157.7 167.0 8,404 173.5 293 14.7 8.5% 1.0 7.4 6.4CHEMICAL TANKERS 37.6 38.2 40.0 42.0 3,683 43.7 203 3.8 8.7% 0.2 2.2 1.3OTHER TANKERS 0.9 0.9 0.9 0.9 405 0.9 2 0.0 0.7% 0.0 0.0 0.0BULKERS 726.9 758.9 776.7 793.9 11,108 816.7 654 68.8 8.4% 4.1 31.1 33.5COMBOS 4.2 3.9 2.8 2.0 12 1.4 0 0.0 0.0% 0.0 0.0 0.0LPG CARRIERS 16.3 17.1 19.5 22.4 1,452 24.3 71 2.3 9.5% 0.0 1.1 1.2LNG CARRIERS 30.0 32.7 35.1 37.7 502 39.9 119 9.8 24.6% 0.2 5.7 3.9CONTAINERSHIPS 216.3 228.6 244.4 245.8 5,158 252.3 373 30.7 12.2% 0.8 18.6 11.3MULTI-PURPOSE 29.8 29.7 29.7 29.7 3,189 29.3 81 1.0 3.5% 0.1 0.7 0.2GENERAL CARGO 37.6 37.7 37.6 37.5 15,065 37.5 78 0.8 2.1% 0.0 0.6 0.2RO-RO 7.7 7.5 7.7 7.7 1,355 7.7 33 0.5 6.5% 0.1 0.2 0.3CAR CARRIERS 11.9 12.1 12.4 12.3 781 12.4 35 0.7 5.4% 0.1 0.5 0.1REEFERS 5.2 5.0 5.0 5.0 1,461 4.8 13 0.1 2.3% 0.0 0.1 0.0OFFSHORE (AHTS/PSV) 8.3 9.1 9.7 10.0 5,237 10.1 346 0.9 9.2% 0.1 0.7 0.1WORLD CARGO FLEET 1,618.0 1,672.6 1,727.7 1,782.5 59,834 1,842.4 2,542 182.0 9.9% 7.5 97.2 77.3TOTAL WORLD FLEET 1,690.9 1,747.5 1,805.8 1,862.6 94,500 1,923.5 3,577 186.9 9.7% 7.6 100.3 79.0TOTAL WORLD FLEET ($bn)* 958.7 979.2 943.1 869.4 94500 919.8 3,577 230.7 25.1% 7.1 114.1 109.5
Tanker Year End Orderbook & Delivery ScheduleFleet, m. Dwt 2013 2014 2015 2016 No. m.Dwt No. m.Dwt % Fleet 2017 2018 2019+
VLCC 200,000+ 190.4 193.9 199.9 214.7 735 226.0 92 28.7 12.7% 0.3 15.9 12.5Suezmax 125-200,000 74.5 74.4 75.9 80.0 557 87.0 62 9.6 11.1% 0.2 6.6 2.8Aframax 85-125,000 97.5 96.9 99.6 104.9 999 108.7 127 14.4 13.3% 0.6 7.8 6.1Panamax 55-85,000 31.5 30.9 30.5 31.9 453 32.9 35 2.6 7.9% 0.3 1.7 0.6Small 10-55,000 107.2 111.3 117.9 123.8 3,864 127.6 302 10.3 8.1% 0.5 5.3 4.4
30.1 30.5 32.2 34.0 1,630 35.4 146 3.4 9.7% 0.2 2.0 1.3<10,000 22.7 23.0 23.3 23.6 7,906 23.9 121 0.7 3.1% 0.1 0.5 0.1
TOTAL FLEET >10,000 501.1 507.4 523.8 555.2 6,608 582.2 618 65.6 11.3% 1.8 37.4 26.4of which: Single Hull 10.2 6.6 4.4 3.1 125 2.9
Double Hull 490.9 500.8 519.4 551.7 6,483 579.3Combos in Oil 2.4 2.7 2.0 0.8 4 0.4 Increase in size of Tanker Fleet:Laid-up 7.9 5.8 1.8 1.1 19 1.1 2016/2015 6.0%Storage 2.4 2.3 8.1 8.4 27 6.3 2017*/2016 4.9% * year to dateACTIVE FLT. >10,000 493.3 502.0 516.0 546.5 6,566 575.2
Bulk Carrier Year End Orderbook & Delivery ScheduleFleet, m. Dwt 2013 2014 2015 2016 No. m.Dwt No. m.Dwt % Fleet 2017 2018 2019+
Capesize 100,000+ 293.6 308.1 309.2 315.2 1,691 323.5 151 39.4 12.2% 0.9 16.4 22.1Panamax 65-100,000 184.3 192.4 195.2 196.2 2,506 201.5 162 13.4 6.7% 1.4 5.5 6.5Handymax 40-65,000 158.6 166.8 179.5 188.4 3,548 195.7 165 10.0 5.1% 1.2 5.7 3.1Handysize 10-40,000 90.4 91.6 92.8 94.2 3,363 95.9 176 6.0 6.2% 0.6 3.6 1.8TOTAL FLEET 726.9 758.9 776.7 793.9 11,108 816.7 654 68.8 8.4% 4.1 31.1 33.5Combos in Dry 0.4 0.6 0.3 0.6 5 0.5 Increase in size of Bulkcarrier Fleet:Laid-up 0.6 0.7 2.5 2.9 25 1.0 2016/2015 2.2%Storage 0.2 0.2 0.5 0.7 12 0.8 2017*/2016 2.9% * year to dateACTIVE FLEET 726.6 758.5 773.9 791.0 11,076 815.3Note: Panamax fleet includes vessels 60-64,999 dwt built prior to 2000. Handymax fleet includes vessels 65-69,999 built from 2000 onwards.
LPG Carrier Year End Orderbook & Delivery ScheduleFleet ,000m³ 2013 2014 2015 2016 No. ,000m³ No. ,000m³ % Fleet 2017 2018 2019+
<5,000 cbm 1,507 1,526 1,526 1,521 628 1,505 6 7 0.4% 0 5 25-20,000 cbm 2,574 2,622 2,789 2,859 353 2,917 13 135 4.6% 0 117 1820-45,000 cbm 3,552 3,797 4,040 4,657 181 5,388 22 642 11.9% 0 416 22645-65,000 cbm 1,184 1,184 1,365 1,428 24 1,428 0 0 0.0% 0 0 0>65,000 cbm 12,560 13,229 16,164 19,866 266 21,784 30 2,500 11.5% 0 998 1,502TOTAL FLEET 21,301 22,359 25,884 30,331 1,452 33,022 71 3,283 9.9% 0 1,536 1,747TOTAL M. DWT 16.3 17.1 19.5 22.4 24.3 2.31 9.5% 0.00 1.12 1.19
Clarksons Research Page 14 21-Dec-17
01-Dec-17
01-Dec-17
of which: Specialised >10,000
01-Dec-17
01-Dec-17
"Oil Tankers" includes vessels in the crude oil & oil products sectors, including all IMO 3 tankers and specified IMO 2 tankers (see Oil & Tanker Trades Outlook for detailed definition). "Chemical" includes IMO 1 tankers and specified IMO 2 tankers. "Specialised" includes chemical tankers and other tankers designed for the carriage of specialist liquids. "Laid-up" includes vessels reported and confirmed to be in lay-up, remaining out of service for an extended period.
Lice
nsed
to C
lark
sons
Res
earc
h S
ampl
e. D
istr
ibut
ion
is r
estr
icte
d; p
leas
e re
mem
ber
to a
ckno
wle
dge
the
sour
ce. S
hipp
ing
Inte
llige
nce
Wee
kly,
Issu
e 13
03Licensed to C
larksons Research S
ample. D
istribution is restricted; please remem
ber to acknowledge the source. S
hipping Intelligence Weekly, Issue 1303

World Fleets & Orderbooks
LNG Carrier Year End Orderbook & Delivery ScheduleFleet ,000m³ 2013 2014 2015 2016 No. ,000m³ No. ,000m³ % Fleet 2017 2018 2019+
<40,000 cbm 231 231 345 414 37 514 9 116 22.5% 58 28 3040-100,000 cbm 982 839 684 684 9 684 1 45 6.6% 0 45 0100-150,000 cbm 31,217 31,112 30,987 30,730 218 30,346 0 0 0.0% 0 0 0150-180,000 cbm 12,460 17,627 22,227 27,365 191 31,280 99 17,002 54.4% 173 10,229 6,599180-220,000 cbm 6,608 6,608 6,608 6,608 32 6,788 10 1,802 26.5% 182 720 900>220,000 cbm 3,727 3,727 3,727 3,727 15 3,990 0 0 0.0% 0 0 0TOTAL FLEET 55,225 60,144 64,577 69,528 502 73,601 119 18,964 25.8% 413 11,022 7,529TOTAL M. DWT 30.0 32.7 35.1 37.7 39.9 9.8 24.6% 0.2 5.7 3.9
Containership Year End Orderbook & Delivery ScheduleFleet ,000 Teu 2013 2014 2015 2016 No. ,000teu No. ,000teu % Fleet 2017 2018 2019+
100-2,999 teu (Feeder) 4,086.3 4,013.0 4,016.5 3,944.2 2,887 3,934.4 203 365.0 9.3% 13.1 215.8 136.13-5,999 teu (Intermediate) 5,561.6 5,542.8 5,532.5 5,113.1 1,092 4,886.7 28 106.1 2.2% 0.0 98.9 7.26-7,999 teu (Intermediate) 1,882.2 1,915.0 1,935.5 1,871.4 278 1,859.2 0 0.0 0.0% 0.0 0.0 0.08-11,999 teu (Neo-P'max) 3,576.0 4,117.8 4,818.8 5,146.6 593 5,408.5 28 309.9 5.7% 20.4 265.9 23.612-14,999 teu (Neo-P'max) 1,814.5 2,180.0 2,448.4 2,676.6 216 2,931.7 45 628.1 21.4% 14.5 389.4 224.215,000 &+ teu (Post-P'max) 256.9 547.1 1,021.5 1,267.0 92 1,692.9 69 1,383.1 81.7% 20.6 684.6 678.0TOTAL FLEET 17,177.5 18,315.6 19,773.2 20,018.8 5,158 20,713.5 373 2,792.3 13.5% 68.6 1,654.5 1,069.1TOTAL M. DWT 216.3 228.6 244.4 245.8 252.3 30.7 12.2% 0.8 18.6 11.312-14,999 TEU 'Neo-Panamax' includes some ships which are too large to transit the expanded locks of the Panama Canal based on current official dimension restrictions.
Multipurpose Year End Orderbook & Delivery ScheduleFleet ,000 Teu 2013 2014 2015 2016 No. ,000teu No. ,000teu % Fleet 2017 2018 2019+
100 - 499 teu 558.6 549.8 542.0 534.3 2,090 525.2 18 5.1 1.0% 0.0 5.1 0.0500 - 999 teu 574.3 553.7 550.6 544.9 778 536.2 44 33.8 6.3% 3.2 24.3 6.41000 &+ teu 397.9 431.7 451.5 459.9 321 459.0 19 20.9 4.6% 2.1 11.5 7.3TOTAL FLEET 1,530.8 1,535.3 1,544.0 1,539.1 3,189 1,520.3 81 59.8 3.9% 5.3 40.8 13.7MPP FLEET M. DWT 29.8 29.7 29.7 29.7 29.3 1.0 3.5% 0.1 0.7 0.2GC FLEET M. DWT 37.6 37.7 37.6 37.5 15,065 37.5 78 0.8 2.1% 0.0 0.6 0.2
Ro-Ro Vessel Year End Orderbook & Delivery ScheduleFleet, m. Dwt 2013 2014 2015 2016 No. m.Dwt No. m.Dwt % Fleet 2017 2018 2019+
<5,000 dwt 1.1 1.1 1.1 1.1 804 1.1 1 0.0 0.3% 0.0 0.0 0.05,000-10,000 dwt 2.3 2.3 2.3 2.3 319 2.3 12 0.1 3.3% 0.0 0.0 0.010,000 &+ dwt 4.2 4.1 4.4 4.3 232 4.3 20 0.4 9.7% 0.1 0.1 0.2TOTAL FLEET 7.7 7.5 7.7 7.7 1,355 7.7 33 0.5 6.5% 0.1 0.2 0.3CAR CARRIERS 11.9 12.1 12.4 12.3 781 12.4 35 0.7 5.4% 0.1 0.5 0.1
Reefer Vessel Year End Orderbook & Delivery ScheduleFleet m. ft³. 2013 2014 2015 2016 No. m.ft³ No. m.ft³ % Fleet 2017 2018 2019+
< 200,000 cu ft 48.2 46.9 47.2 46.7 1,045 45.9 1 0.2 0.3% 0.2 0.0 0.0200-449,999 cu ft 74.9 73.9 74.2 73.2 244 72.6 10 2.8 3.9% 0.6 2.3 0.0> 450,000 cu ft 109.7 105.5 103.8 102.6 172 96.0 2 1.5 1.6% 0.8 0.8 0.0
232.7 226.3 225.2 222.5 1,461 214.5 13 4.5 2.1% 1.5 3.0 0.0TOTAL M. DWT 5.2 5.0 5.0 5.0 4.8 0.1 2.3% 0.0 0.1 0.0
Owner Fleets by Year End Orderbook & Delivery ScheduleNationality, m. GT 2013 2014 2015 2016 No. m. GT No. m. GT % Fleet 2017 2018 2019+
Greece 164.1 180.1 192.4 203.3 5,476 215.7 242 14.6 6.8% 0.5 8.5 5.6Japan 161.2 163.4 163.6 163.1 8,606 165.8 407 25.6 15.4% 1.4 13.2 11.0China P.R. 119.7 122.4 130.5 140.5 7,378 151.5 460 23.5 15.5% 0.6 15.6 7.2Germany 92.6 91.5 88.9 82.8 3,423 81.5 120 2.3 2.9% 0.2 1.5 0.7United States 53.0 58.5 59.8 63.8 5,264 66.0 200 8.4 12.7% 0.1 2.7 5.6
Clarksons Research Page 15
Note: All fleet figures are from the Clarksons Research Ship and Orderbook Databases, expressed in the units indicated. All dwt figures are metric. Annual data are as atyear end, monthly data at the beginning of the month. The databases comprise vessels of 100gt and above. For access to more detailed fleet data visit World Fleet Registerat www.clarksons.net/wfr. * Value of the world fleet based on estimates of the value of each vessel based on type, size and age. For specialised and non-cargo vessels,coverage may not be complete. Value of the orderbook based on reported newbuilding contract prices wherever possible and estimated contract prices adjusted for vesseltype, size and the date of the contract elsewhere. For more detail see World Fleet Monitor.
A "Sources & Methods" document which describes the methodology by which Clarksons Research gathers and processes the data set out in thisreport, including the calculation of voyage earnings for tankers and bulk carriers, is available on our website at www.clarksons.net. Further enquiriesmay be made to the addresses set out on the back page.
21-Dec-17
01-Dec-17
01-Dec-17
01-Dec-17
01-Dec-17
01-Dec-17
01-Dec-17
Lice
nsed
to C
lark
sons
Res
earc
h S
ampl
e. D
istr
ibut
ion
is r
estr
icte
d; p
leas
e re
mem
ber
to a
ckno
wle
dge
the
sour
ce. S
hipp
ing
Inte
llige
nce
Wee
kly,
Issu
e 13
03Licensed to C
larksons Research S
ample. D
istribution is restricted; please remem
ber to acknowledge the source. S
hipping Intelligence Weekly, Issue 1303

Analysis
At this time of year, icy conditions are not uncommon, but the warmth of the festive season is usually enough to melt even the coldest of hearts. Going into this year, shipping market activity might have still felt pretty iced up for many, but increased activity in a number of core areas in 2017 has seen the ship-ping market temperature rise a little...
Checking The Thermometer In general, our ClarkSea Index provides a helpful way to take the temperature of industry earnings, measuring the perfor-mance of the key ‘volume’ market sectors (tankers, bulkers, boxships and gas carri-ers). Since the start of Q4 2008 it has averaged $11,816/day, compared to $23,667/day between the start of 2000 and the end of Q3 2008. However, earn-ings aren’t the only thing that can provide ‘heat’ in shipping. Investor appetite for vessel acquisition has often added ‘heat’ to the market in the form of investment in newbuild or secondhand tonnage, even at times when earnings have remained challenged. To examine this, we revisit the quarterly ‘Shipping Heat Index’, which reflects not only vessel earnings but also investment activity, to see how much hot-ter or colder 2017 has really been. Not Quite So Cold Now? This year, the Shipping Heat Index (see graph description) shows us that things, though still chilly, have been warming up a little. In 2016 the quarterly index aver-aged 37.4. This year it has averaged 49.4, an increase of 32% on 2016, and in Q4 stands at 46.1, up 25% year-on-year. Q3 2016 saw the lowest reading in the featured period. This year’s peak at 55.0 in Q2 was still some way below ‘hotter’ levels seen sporadically since the finan-cial crisis, with newbuild investment in particular still limited, but was much clos-er to the average since Q4 2008 of 59.6. Thaw Goodness Sake One factor behind this has been that, on a broad basis, earnings have started to
improve this year. The ClarkSea Index has averaged $10,718/day, up 14% on its average level in 2016 (the lowest since the 1980s); there have been marked im-provements away from the bottom of the cycle in the bulker and boxship markets. Hot Money? Meanwhile, the investment side has seen an even more positive, if still mixed, pic-ture. Contracting, although more than 40% up on full year 2016 in value terms, remained limited at $53bn in the first eleven months of 2017. S&P investment meanwhile has seen an active year. Around $19bn so far is an improvement
of nearly 55% on 2016 (and the fourth highest annual level since 2008), reflect-ing that, albeit with many distressed as-sets out there, investors perhaps harbour warmer feelings towards the markets. Still Wintry, But Warmer So, the shipping markets still look like a chilly environment. However, although earnings alone suggest a slight thawing in conditions, a wider view of the temper-ature of the shipping markets points to-wards a greater degree of heat, with S&P investors in particular helping to bring back some much-needed warmth. Have a nice holiday season.
Graph of the Week It’s The Festive Season - Heading Into The Warm?
The ‘Earnings Index’ represents the quarterly average ClarkSea Index (basis average Jan-00 to Q3-08=100). The ‘Shipping Heat Index’ is derived by creating a quarterly index of newbuild and reported secondhand transaction value (on the same basis), and then taking the (geometric) aver-age of that index and the ‘Earnings Index’. Q4 2017 earn-ings data up to and including 15th December, Q4 2017 new-build investment data basis Octo-ber and November run-rate, secondhand sales data basis Q4 run-rate up to 15th December 2017.
Source : Clarksons Research
Shipping Heat Index: Time For A Winter Warmer?
Shipping Intelligence Weekly, 21 December 2017 Published by: Clarkson Research Services Limited Commodity Quay, St Katharine Docks London E1W 1BF, England. Tel: + (44) (0) 20 7334 3134 E-mail: [email protected] On-line Shop: www.crsl.com Website: www.clarksons.com/services/research Shipping Intelligence Network: www.clarksons.net World Fleet Register: www.clarksons.net/wfr Shipping Intelligence Weekly is published 50 times a year. It is available on subscription at a price of £975/£1,040 a year (within Europe/outside Europe) including postage.
Editorial Board: Managing Director Stephen Gordon Research Director Trevor Crowe Market Research Sarah Holden Publisher Rob Benson Editor Camilla Miles Clarksons Platou Contacts: S&P J. Brynteson Tankers R. Knight Specialised R. Whittet Gas T. Baggio Dry Cargo M. Goodall Containers S. Goodrich Freight Derivatives A. Gray Offshore P. Middleton
The material and the information contained herein are provided for general information purposes, and may not be reproduced without the written permission of Clarksons Research. To the maximum extent permitted by law, Clark-sons Research shall not be liable to the recipient or any third party for any loss, liability or damage, cost or expense including without limitation, direct, indirect, consequential loss or damage, any loss of profit, loss of use, loss of or interruption in business, loss of goodwill, loss of data aris-ing out of, or in connection with, the use of and the reliance on the information whether in contract, tort, negligence, bailment, breach of statutory duty or otherwise, even if foreseeable. This disclaimer shall be governed by and construed in accordance with English law.
0
20
40
60
80
100
Q4
2008
Q2
2009
Q4
2009
Q2
2010
Q4
2010
Q2
2011
Q4
2011
Q2
2012
Q4
2012
Q2
2013
Q4
2013
Q2
2014
Q4
2014
Q2
2015
Q4
2015
Q2
2016
Q4
2016
Q2
2017
Q4
2017
Index
'Earnings Index'
'Shipping Heat' Index
Lice
nsed
to C
lark
sons
Res
earc
h S
ampl
e. D
istr
ibut
ion
is r
estr
icte
d; p
leas
e re
mem
ber
to a
ckno
wle
dge
the
sour
ce. S
hipp
ing
Inte
llige
nce
Wee
kly,
Issu
e 13
03Licensed to C
larksons Research S
ample. D
istribution is restricted; please remem
ber to acknowledge the source. S
hipping Intelligence Weekly, Issue 1303