Embed Size (px)
Citation preview

1
SHOCK MONITORING TECHNOLOGY FOR
RECIPROCATING MACHINERY
Introducing the Reciprocating Machinery Protector
the Next Generation of Impact Transmitter Technology
Dr. George Zusman David A. Corelli
IMI Sensors
2
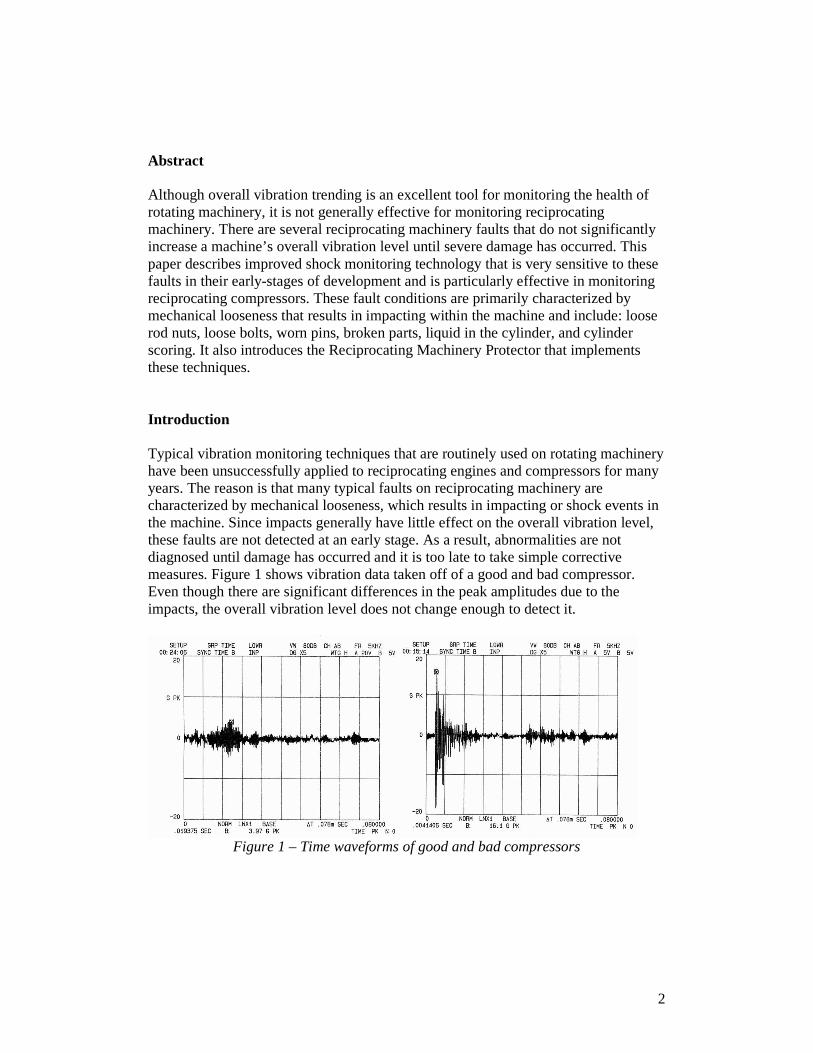
Abstract Although overall vibration trending is an excellent tool for monitoring the health of rotating machinery, it is not generally effective for monitoring reciprocating machinery. There are several reciprocating machinery faults that do not significantly increase a machine’s overall vibration level until severe damage has occurred. This paper describes improved shock monitoring technology that is very sensitive to these faults in their early-stages of development and is particularly effective in monitoring reciprocating compressors. These fault conditions are primarily characterized by mechanical looseness that results in impacting within the machine and include: loose rod nuts, loose bolts, worn pins, broken parts, liquid in the cylinder, and cylinder scoring. It also introduces the Reciprocating Machinery Protector that implements these techniques. Introduction Typical vibration monitoring techniques that are routinely used on rotating machinery have been unsuccessfully applied to reciprocating engines and compressors for many years. The reason is that many typical faults on reciprocating machinery are characterized by mechanical looseness, which results in impacting or shock events in the machine. Since impacts generally have little effect on the overall vibration level, these faults are not detected at an early stage. As a result, abnormalities are not diagnosed until damage has occurred and it is too late to take simple corrective measures. Figure 1 shows vibration data taken off of a good and bad compressor. Even though there are significant differences in the peak amplitudes due to the impacts, the overall vibration level does not change enough to detect it.
Figure 1 – Time waveforms of good and bad compressors
3
The monitoring technology presented here is based upon the detection of mechanical shock events that occur in or near the machine’s cylinder assembly. This technology is not new and has been successfully used on reciprocating compressors for many years; however, the techniques presented here improve upon the existing methods. The amplitude of each shock event that occurs within a preset sample time is measured and is then compared with two preset shock threshold levels. Based on improved exceedance criteria, a Reciprocating Fault Index (RFI) is calculated that indicates the health of the machine. This index provides a better indication of machine health than is provided by conventional impact transmitters. The main purpose of any monitoring system is to protect machinery. It also provides critical data that operators and engineers can use to asses equipment condition, determine machinery availability, and make informed run/no run decisions. In some cases, this data may also be used to maximize operating efficiency. It should be noted that shock monitoring will not replace the need for compressor performance analysis. An increasing trend in the RFI could provide the basis for performing an analysis. The techniques presented are very effective in detecting faults involving mechanical looseness or other impact mechanisms at an early stage of their development. These faults include the following.
• Loose or broken bolts • Loose or cracked rod nuts • Cracked connecting or piston rod • Excessive crosshead/slipper clearance • Excessive clearance in connecting pins • Liquid or debris in the cylinder • Scoring in the cylinder • Other broken parts
It should be noted that while overall vibration level is still a concern, mechanical looseness detected using this method is of greater importance due to the significant damage potential if the faults go undetected. The vibration data reviewed in this paper compares conventional vibration trending with shock or impact measurements made on a reciprocating gas compressor. The results clearly illustrate the advantages of shock monitoring in reciprocating machinery.
4
Shock Monitoring As stated above, shock monitoring utilizing empirically determined criteria has been successfully used to detect mechanical faults on large reciprocating compressors for many years. This paper describes shock monitoring technology that is incorporated into the Reciprocating Machinery Protector (RMP) that improves upon existing methods in the following ways.
1. The peak amplitude of routine data that does not exceed a shock threshold level is measured and can be trended.
2. Peaks are evaluated relative to two shock threshold levels rather than one. This allows more flexibility in setting thresholds resulting in earlier warning of faults.
3. The peak counts are weighted based on their levels to help better quantify vibration severity.
4. A “dead time” is used to eliminate false peak counts due to mechanical ringing of lightly damped structures that are caused by the impacts.
5. The monitoring parameters are programmable so the process can be optimized for particular machines.
6. The monitor has a higher frequency response than existing units.
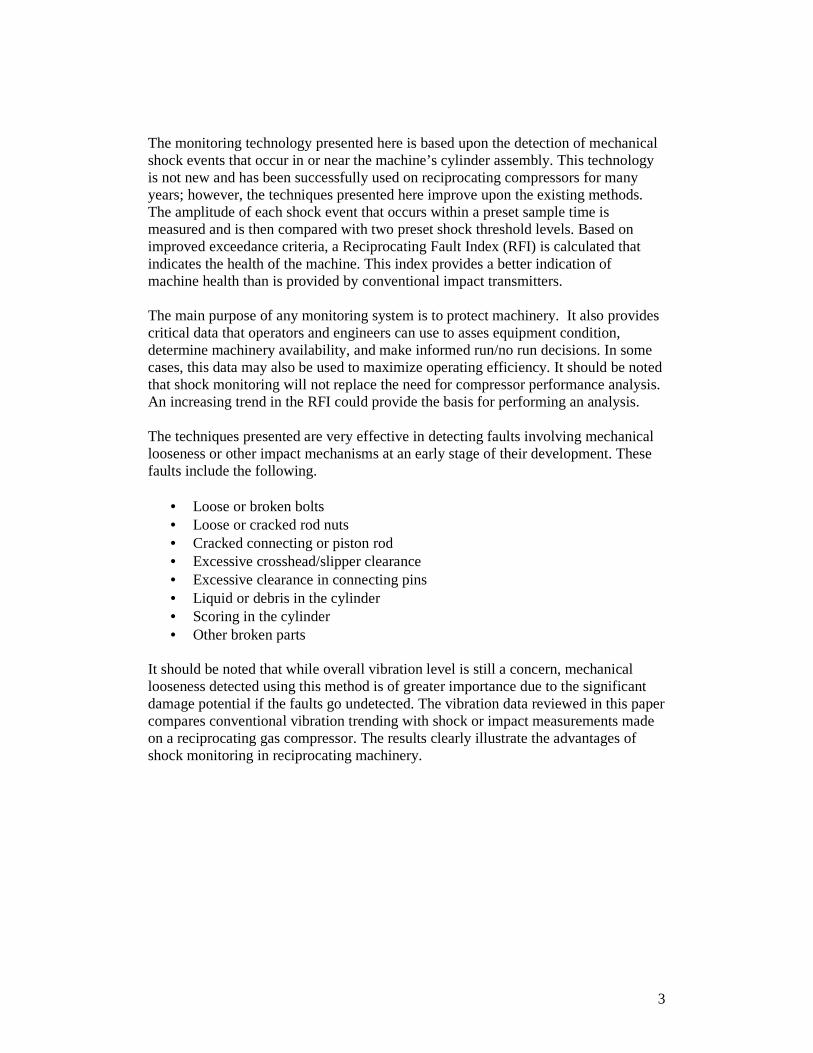
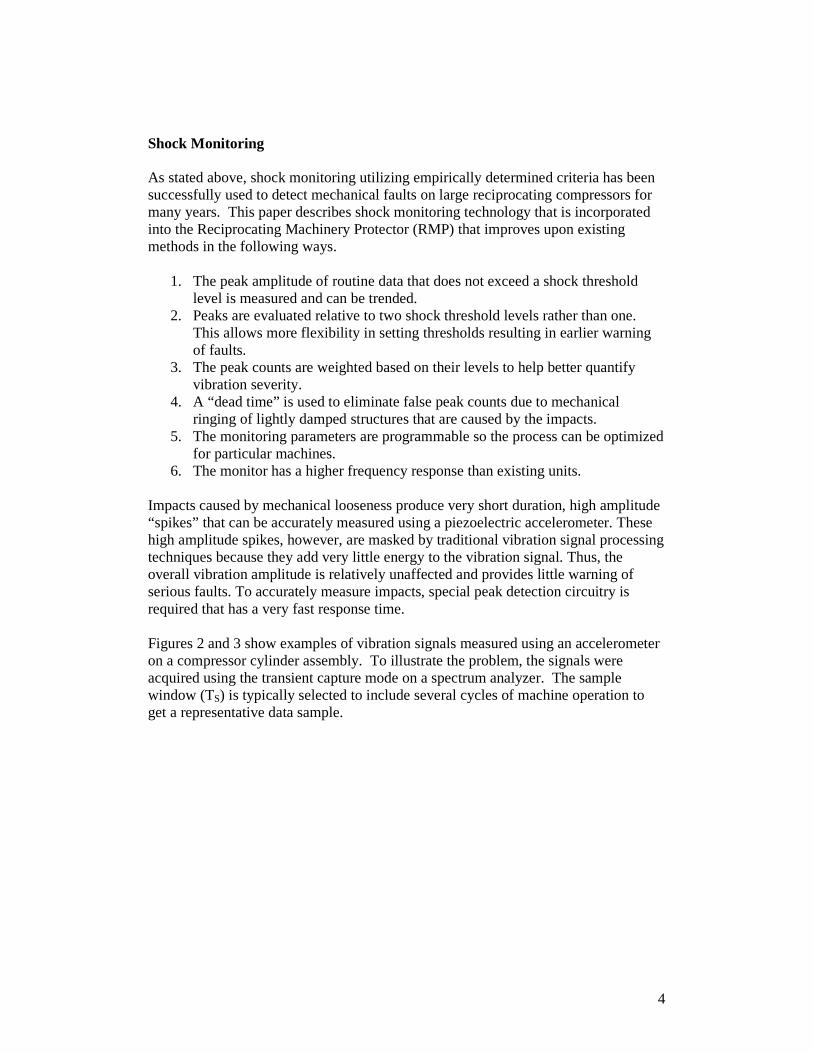
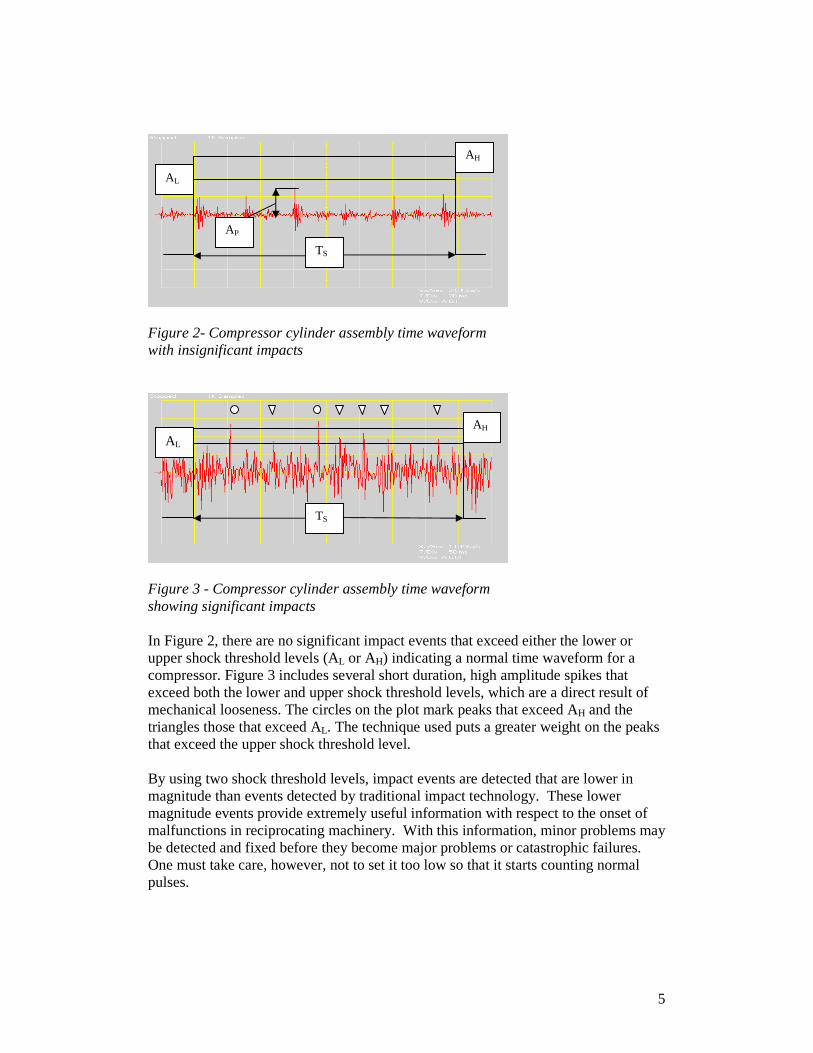
Impacts caused by mechanical looseness produce very short duration, high amplitude “spikes” that can be accurately measured using a piezoelectric accelerometer. These high amplitude spikes, however, are masked by traditional vibration signal processing techniques because they add very little energy to the vibration signal. Thus, the overall vibration amplitude is relatively unaffected and provides little warning of serious faults. To accurately measure impacts, special peak detection circuitry is required that has a very fast response time. Figures 2 and 3 show examples of vibration signals measured using an accelerometer on a compressor cylinder assembly. To illustrate the problem, the signals were acquired using the transient capture mode on a spectrum analyzer. The sample window (TS) is typically selected to include several cycles of machine operation to get a representative data sample.
5
Figure 2- Compressor cylinder assembly time waveform with insignificant impacts
Figure 3 - Compressor cylinder assembly time waveform showing significant impacts In Figure 2, there are no significant impact events that exceed either the lower or upper shock threshold levels (AL or AH) indicating a normal time waveform for a compressor. Figure 3 includes several short duration, high amplitude spikes that exceed both the lower and upper shock threshold levels, which are a direct result of mechanical looseness. The circles on the plot mark peaks that exceed AH and the triangles those that exceed AL. The technique used puts a greater weight on the peaks that exceed the upper shock threshold level. By using two shock threshold levels, impact events are detected that are lower in magnitude than events detected by traditional impact technology. These lower magnitude events provide extremely useful information with respect to the onset of malfunctions in reciprocating machinery. With this information, minor problems may be detected and fixed before they become major problems or catastrophic failures. One must take care, however, not to set it too low so that it starts counting normal pulses.
AH
AH
AL
AL
TS
TS
AP
6
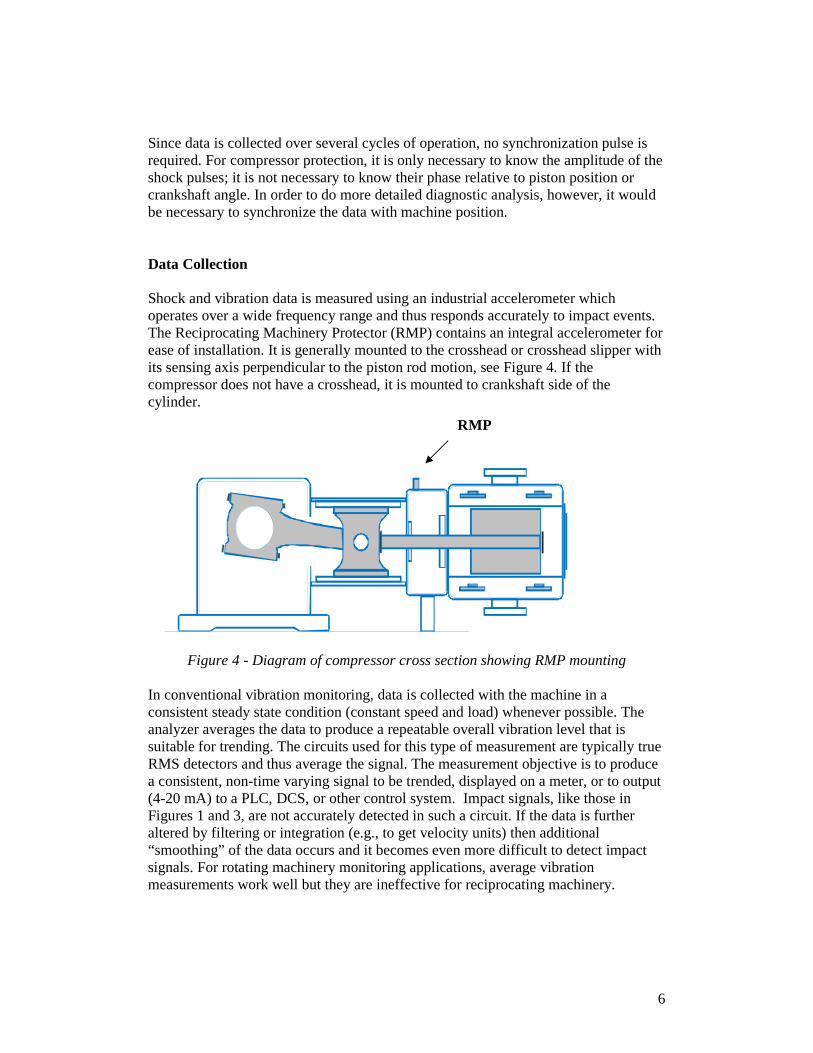
Since data is collected over several cycles of operation, no synchronization pulse is required. For compressor protection, it is only necessary to know the amplitude of the shock pulses; it is not necessary to know their phase relative to piston position or crankshaft angle. In order to do more detailed diagnostic analysis, however, it would be necessary to synchronize the data with machine position. Data Collection Shock and vibration data is measured using an industrial accelerometer which operates over a wide frequency range and thus responds accurately to impact events. The Reciprocating Machinery Protector (RMP) contains an integral accelerometer for ease of installation. It is generally mounted to the crosshead or crosshead slipper with its sensing axis perpendicular to the piston rod motion, see Figure 4. If the compressor does not have a crosshead, it is mounted to crankshaft side of the cylinder.
Figure 4 - Diagram of compressor cross section showing RMP mounting
In conventional vibration monitoring, data is collected with the machine in a consistent steady state condition (constant speed and load) whenever possible. The analyzer averages the data to produce a repeatable overall vibration level that is suitable for trending. The circuits used for this type of measurement are typically true RMS detectors and thus average the signal. The measurement objective is to produce a consistent, non-time varying signal to be trended, displayed on a meter, or to output (4-20 mA) to a PLC, DCS, or other control system. Impact signals, like those in Figures 1 and 3, are not accurately detected in such a circuit. If the data is further altered by filtering or integration (e.g., to get velocity units) then additional “smoothing” of the data occurs and it becomes even more difficult to detect impact signals. For rotating machinery monitoring applications, average vibration measurements work well but they are ineffective for reciprocating machinery.
RMP
7
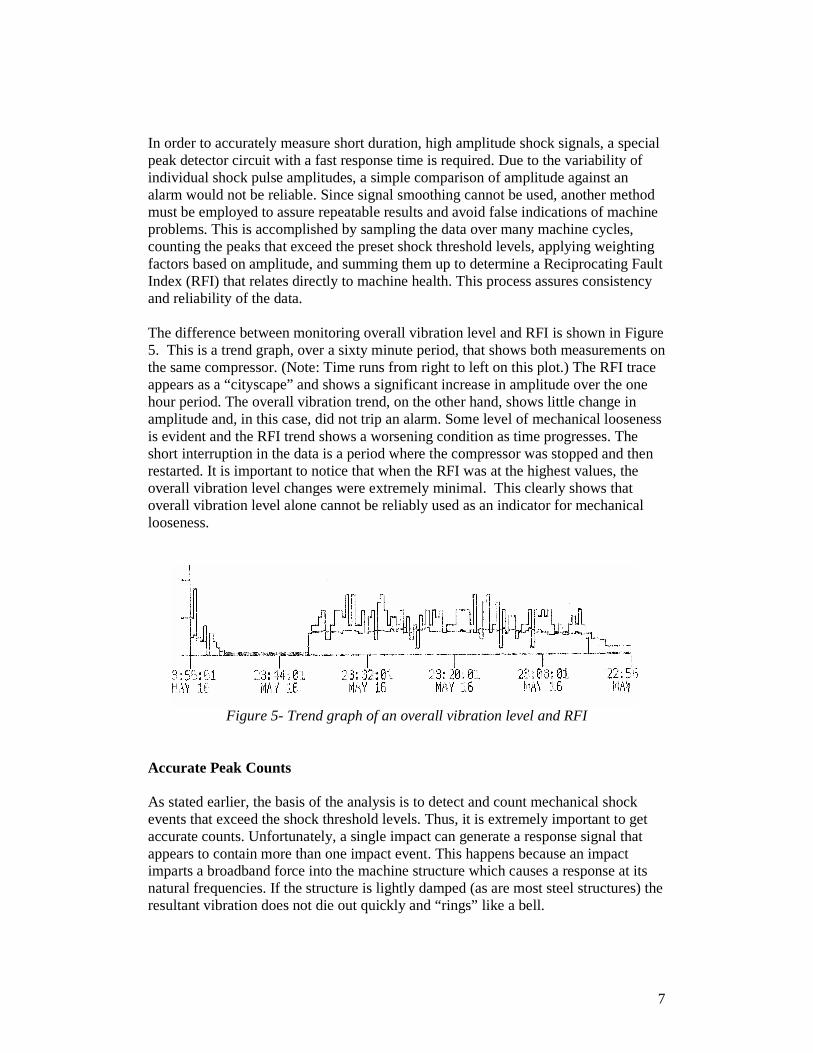
In order to accurately measure short duration, high amplitude shock signals, a special peak detector circuit with a fast response time is required. Due to the variability of individual shock pulse amplitudes, a simple comparison of amplitude against an alarm would not be reliable. Since signal smoothing cannot be used, another method must be employed to assure repeatable results and avoid false indications of machine problems. This is accomplished by sampling the data over many machine cycles, counting the peaks that exceed the preset shock threshold levels, applying weighting factors based on amplitude, and summing them up to determine a Reciprocating Fault Index (RFI) that relates directly to machine health. This process assures consistency and reliability of the data. The difference between monitoring overall vibration level and RFI is shown in Figure 5. This is a trend graph, over a sixty minute period, that shows both measurements on the same compressor. (Note: Time runs from right to left on this plot.) The RFI trace appears as a “cityscape” and shows a significant increase in amplitude over the one hour period. The overall vibration trend, on the other hand, shows little change in amplitude and, in this case, did not trip an alarm. Some level of mechanical looseness is evident and the RFI trend shows a worsening condition as time progresses. The short interruption in the data is a period where the compressor was stopped and then restarted. It is important to notice that when the RFI was at the highest values, the overall vibration level changes were extremely minimal. This clearly shows that overall vibration level alone cannot be reliably used as an indicator for mechanical looseness.
Figure 5- Trend graph of an overall vibration level and RFI Accurate Peak Counts As stated earlier, the basis of the analysis is to detect and count mechanical shock events that exceed the shock threshold levels. Thus, it is extremely important to get accurate counts. Unfortunately, a single impact can generate a response signal that appears to contain more than one impact event. This happens because an impact imparts a broadband force into the machine structure which causes a response at its natural frequencies. If the structure is lightly damped (as are most steel structures) the resultant vibration does not die out quickly and “rings” like a bell.
8
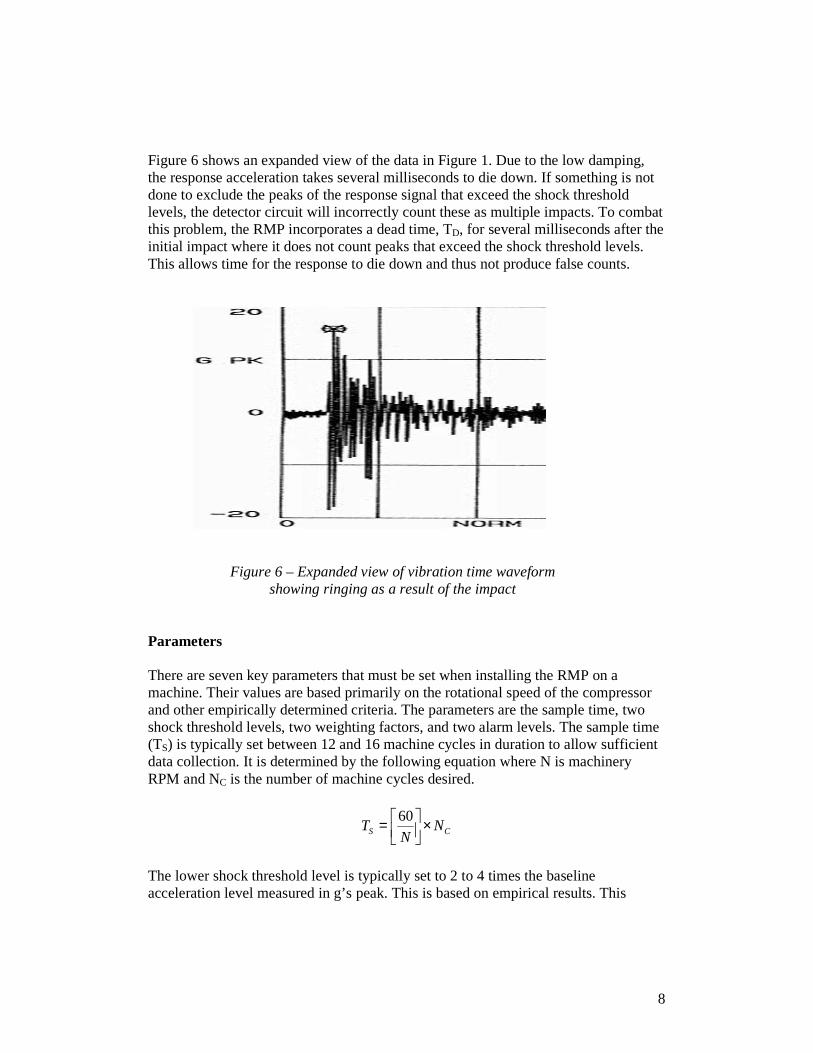
Figure 6 shows an expanded view of the data in Figure 1. Due to the low damping, the response acceleration takes several milliseconds to die down. If something is not done to exclude the peaks of the response signal that exceed the shock threshold levels, the detector circuit will incorrectly count these as multiple impacts. To combat this problem, the RMP incorporates a dead time, TD, for several milliseconds after the initial impact where it does not count peaks that exceed the shock threshold levels. This allows time for the response to die down and thus not produce false counts.
Figure 6 – Expanded view of vibration time waveform showing ringing as a result of the impact
Parameters There are seven key parameters that must be set when installing the RMP on a machine. Their values are based primarily on the rotational speed of the compressor and other empirically determined criteria. The parameters are the sample time, two shock threshold levels, two weighting factors, and two alarm levels. The sample time (TS) is typically set between 12 and 16 machine cycles in duration to allow sufficient data collection. It is determined by the following equation where N is machinery RPM and NC is the number of machine cycles desired.
60S CT N
N = ×
The lower shock threshold level is typically set to 2 to 4 times the baseline acceleration level measured in g’s peak. This is based on empirical results. This
9
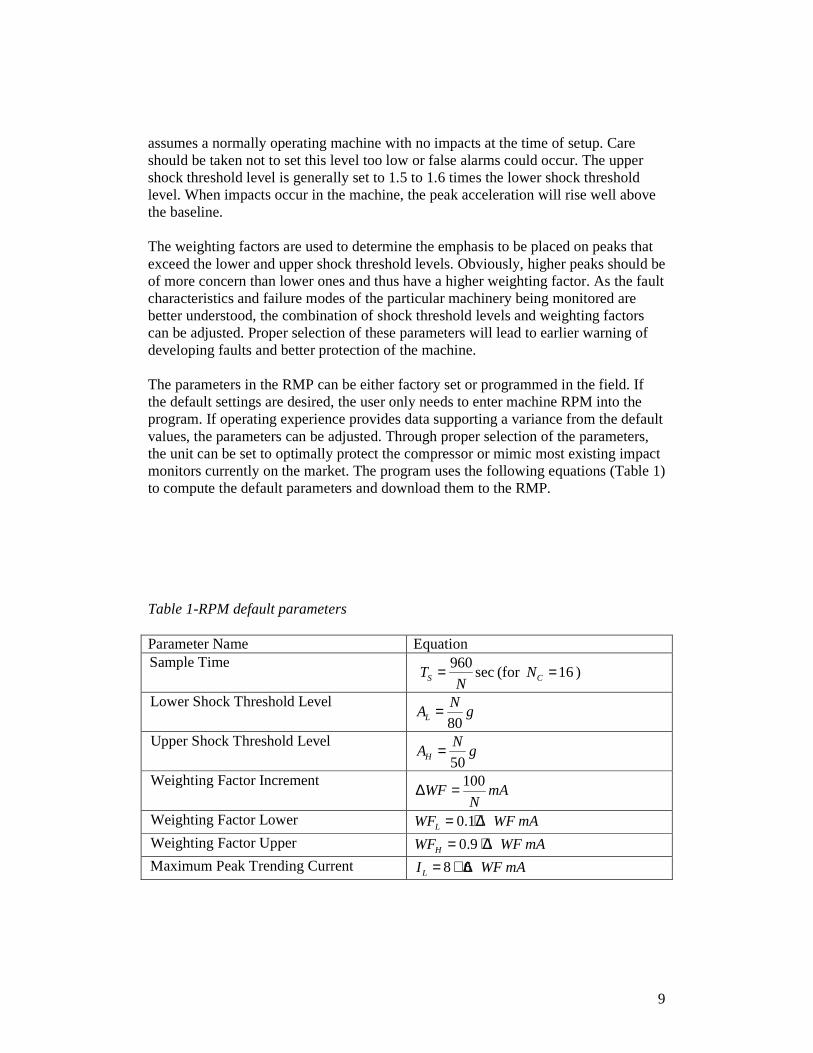
assumes a normally operating machine with no impacts at the time of setup. Care should be taken not to set this level too low or false alarms could occur. The upper shock threshold level is generally set to 1.5 to 1.6 times the lower shock threshold level. When impacts occur in the machine, the peak acceleration will rise well above the baseline. The weighting factors are used to determine the emphasis to be placed on peaks that exceed the lower and upper shock threshold levels. Obviously, higher peaks should be of more concern than lower ones and thus have a higher weighting factor. As the fault characteristics and failure modes of the particular machinery being monitored are better understood, the combination of shock threshold levels and weighting factors can be adjusted. Proper selection of these parameters will lead to earlier warning of developing faults and better protection of the machine. The parameters in the RMP can be either factory set or programmed in the field. If the default settings are desired, the user only needs to enter machine RPM into the program. If operating experience provides data supporting a variance from the default values, the parameters can be adjusted. Through proper selection of the parameters, the unit can be set to optimally protect the compressor or mimic most existing impact monitors currently on the market. The program uses the following equations (Table 1) to compute the default parameters and download them to the RMP. Table 1-RPM default parameters Parameter Name Equation Sample Time 960
secSTN
= (for 16CN = )
Lower Shock Threshold Level
80L
NA g=
Upper Shock Threshold Level
50H
NA g=
Weighting Factor Increment 100WF mA
N∆ =
Weighting Factor Lower 0.1LWF WF mA= + ∆
Weighting Factor Upper 0.9HWF WF mA= + ∆
Maximum Peak Trending Current 8 6LI WF mA= + ∆
10
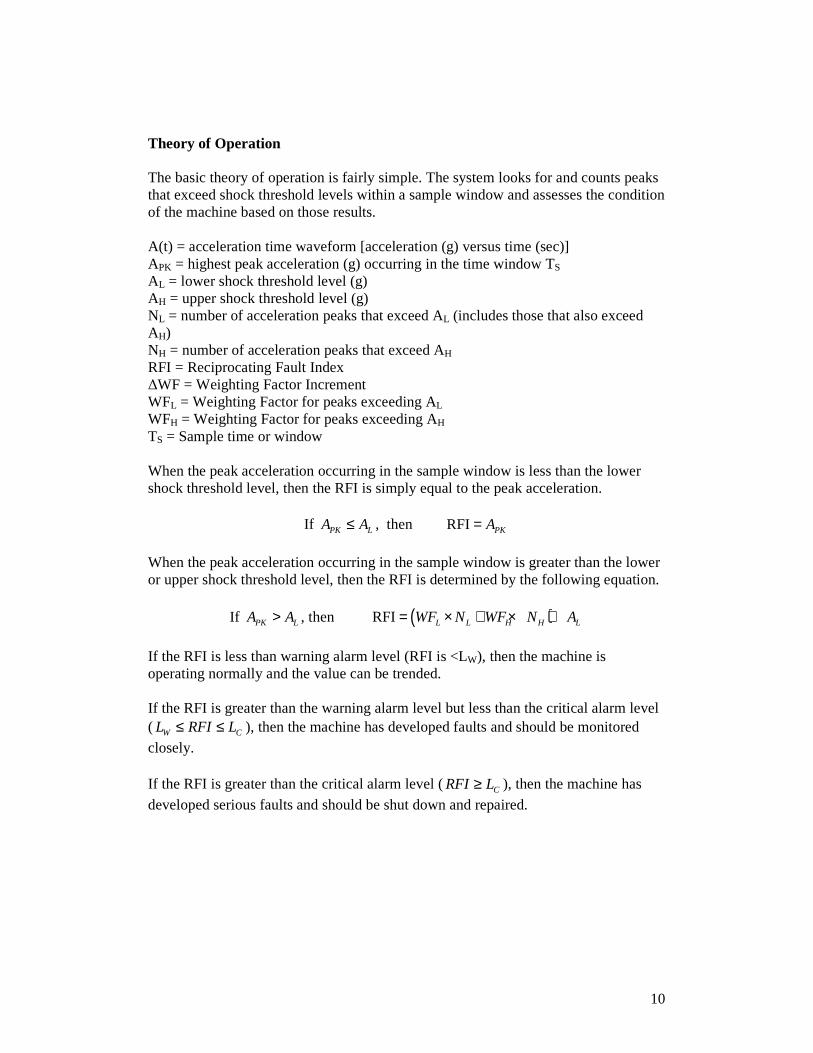
Theory of Operation The basic theory of operation is fairly simple. The system looks for and counts peaks that exceed shock threshold levels within a sample window and assesses the condition of the machine based on those results. A(t) = acceleration time waveform [acceleration (g) versus time (sec)] APK = highest peak acceleration (g) occurring in the time window TS AL = lower shock threshold level (g) AH = upper shock threshold level (g) NL = number of acceleration peaks that exceed AL (includes those that also exceed AH) NH = number of acceleration peaks that exceed AH RFI = Reciprocating Fault Index ∆WF = Weighting Factor Increment WFL = Weighting Factor for peaks exceeding AL WFH = Weighting Factor for peaks exceeding AH TS = Sample time or window
When the peak acceleration occurring in the sample window is less than the lower shock threshold level, then the RFI is simply equal to the peak acceleration.
If PK LA A≤ , then RFI PKA=
When the peak acceleration occurring in the sample window is greater than the lower or upper shock threshold level, then the RFI is determined by the following equation.
If PK LA A> , then ( )RFI L L H H LWF N WF N A= × + × +
If the RFI is less than warning alarm level (RFI is <LW), then the machine is operating normally and the value can be trended. If the RFI is greater than the warning alarm level but less than the critical alarm level ( W CL RFI L≤ ≤ ), then the machine has developed faults and should be monitored
closely. If the RFI is greater than the critical alarm level ( CRFI L≥ ), then the machine has
developed serious faults and should be shut down and repaired.
11
Actual Operation The Reciprocating Machine Protector operation is described below. Since the actual unit works in voltages and currents, the parameters are redefined in those terms. V(t) = analog voltage output from the accelerometer VPK = highest peak voltage occurring in the time window TS VL = lower shock threshold reference voltage VH = upper shock threshold reference voltage NL = number of acceleration peaks exceeding VL (includes those that also exceed VH) NH = number of acceleration peaks exceeding VH RFI = Reciprocating Fault Index WFL = Weighting Factor for peaks exceeding VL WFH = Weighting Factor for peaks exceeding VH IW = Warning Alarm Level (mA) IC = Critical Alarm Level (mA) IOUT = 4-20 mA current output proportion to the RFI IL = Maximum Peak Trending Current (mA) is an arbitrarily selected maximum current for trending peak acceleration, APK
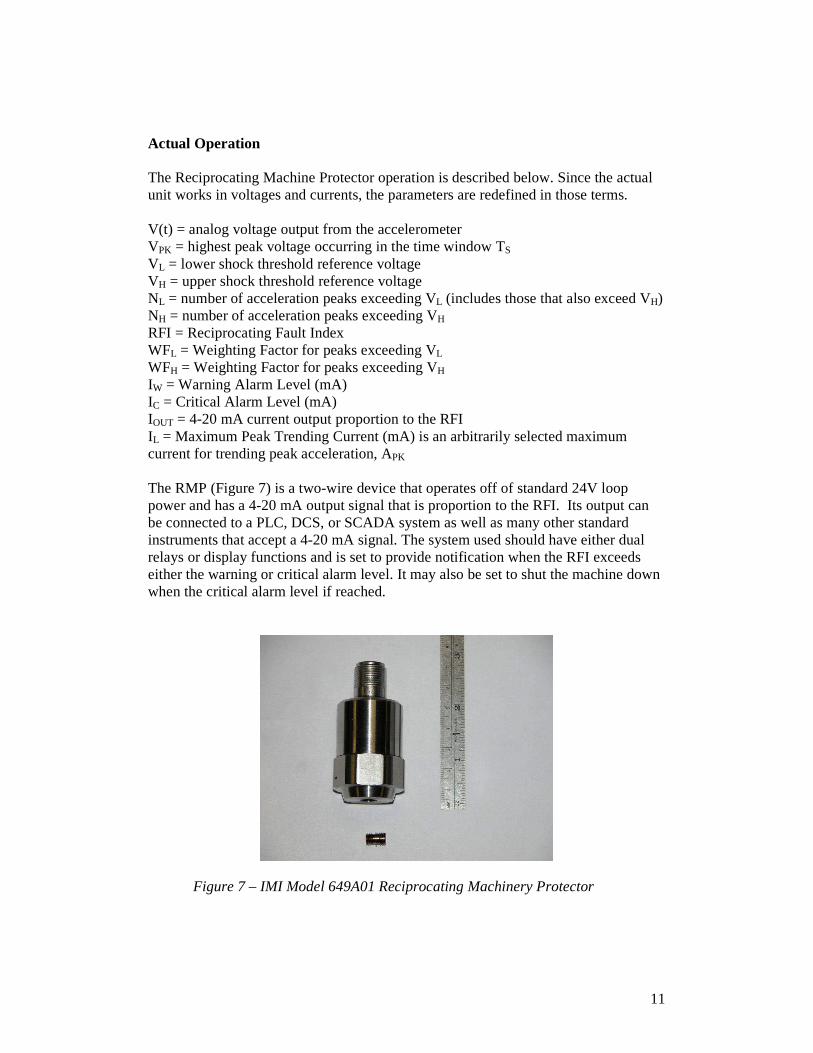
The RMP (Figure 7) is a two-wire device that operates off of standard 24V loop power and has a 4-20 mA output signal that is proportion to the RFI. Its output can be connected to a PLC, DCS, or SCADA system as well as many other standard instruments that accept a 4-20 mA signal. The system used should have either dual relays or display functions and is set to provide notification when the RFI exceeds either the warning or critical alarm level. It may also be set to shut the machine down when the critical alarm level if reached.
Figure 7 – IMI Model 649A01 Reciprocating Machinery Protector
12
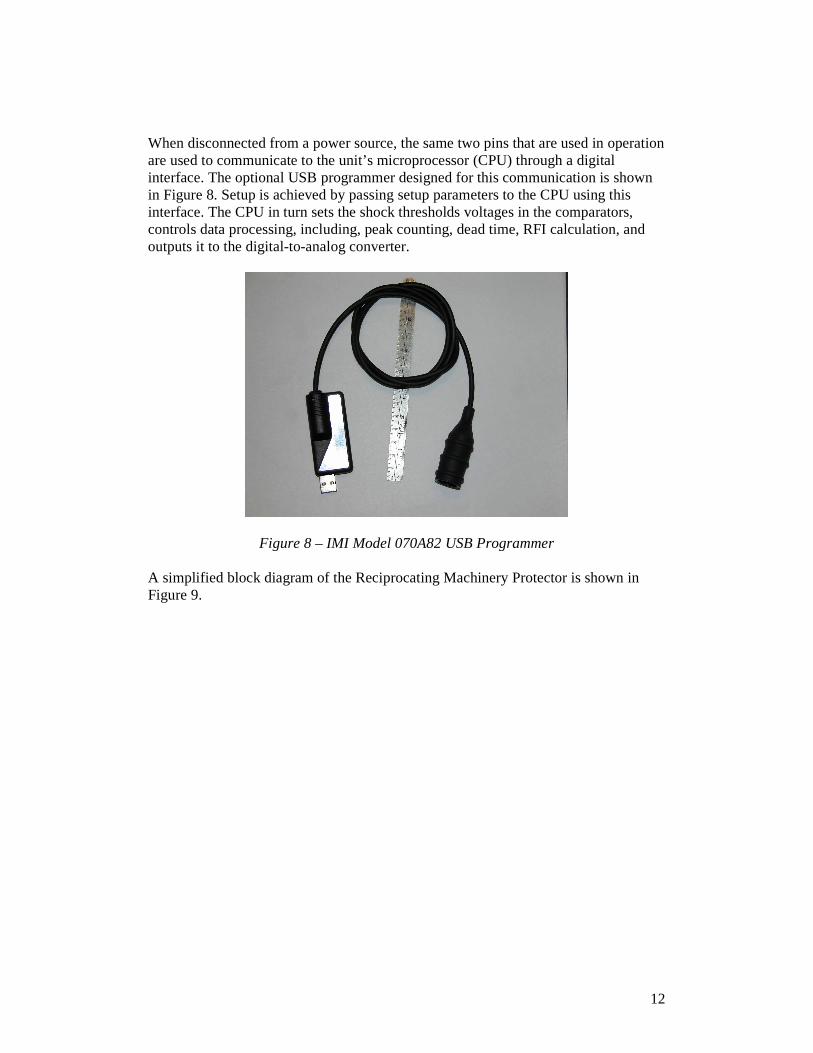
When disconnected from a power source, the same two pins that are used in operation are used to communicate to the unit’s microprocessor (CPU) through a digital interface. The optional USB programmer designed for this communication is shown in Figure 8. Setup is achieved by passing setup parameters to the CPU using this interface. The CPU in turn sets the shock thresholds voltages in the comparators, controls data processing, including, peak counting, dead time, RFI calculation, and outputs it to the digital-to-analog converter.
Figure 8 – IMI Model 070A82 USB Programmer
A simplified block diagram of the Reciprocating Machinery Protector is shown in Figure 9.
13
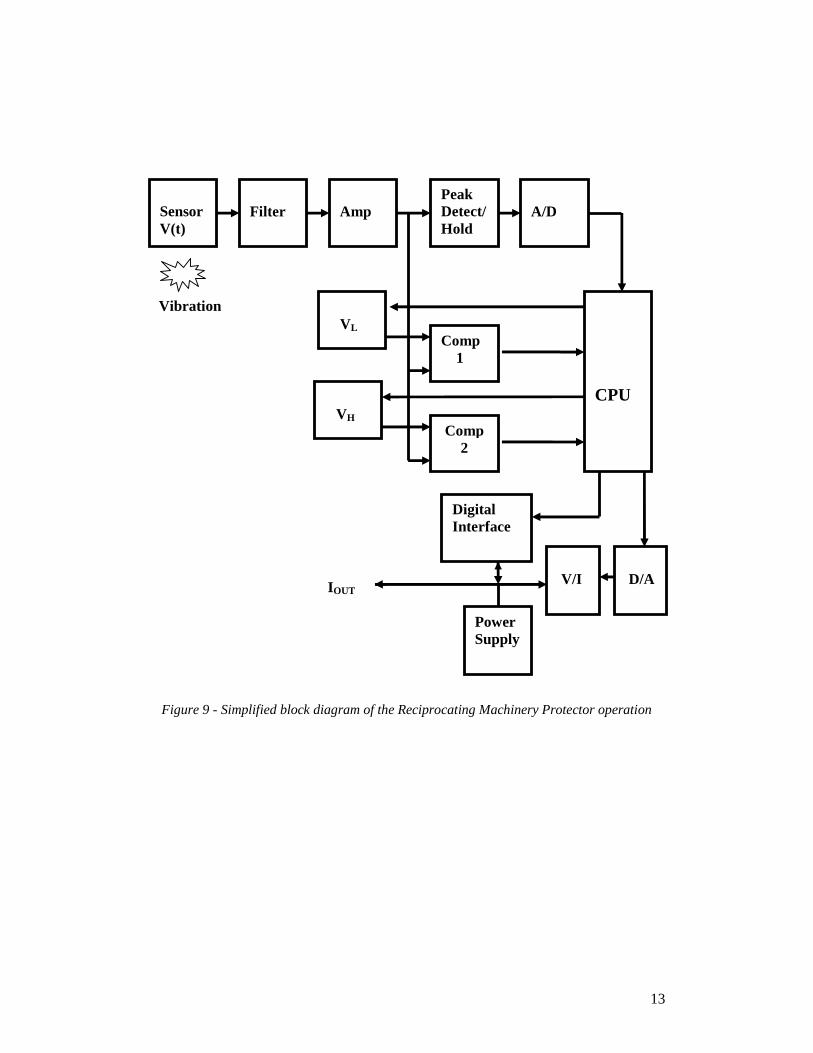
Figure 9 - Simplified block diagram of the Reciprocating Machinery Protector operation
Sensor V(t)
Filter
Amp
Peak Detect/Hold
A/D
CPU
Comp 1
Comp 2
VL
VH
D/A
Power Supply
Digital Interface
V/I
Vibration
IOUT
14
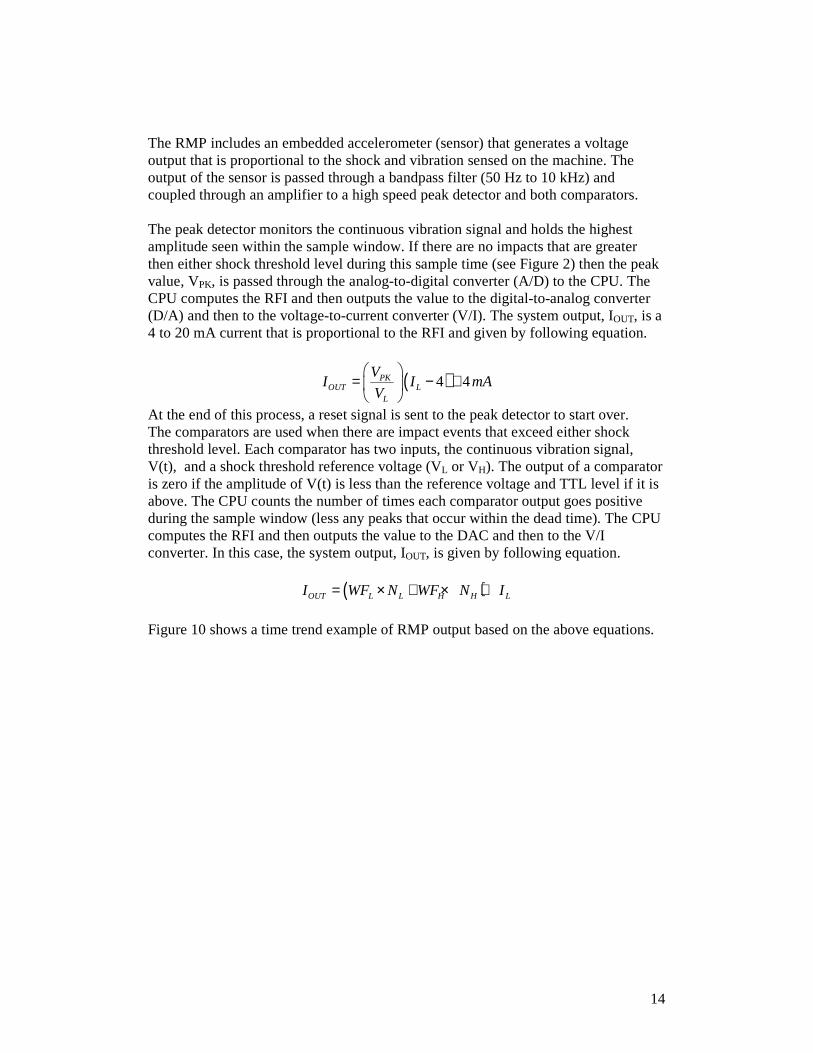
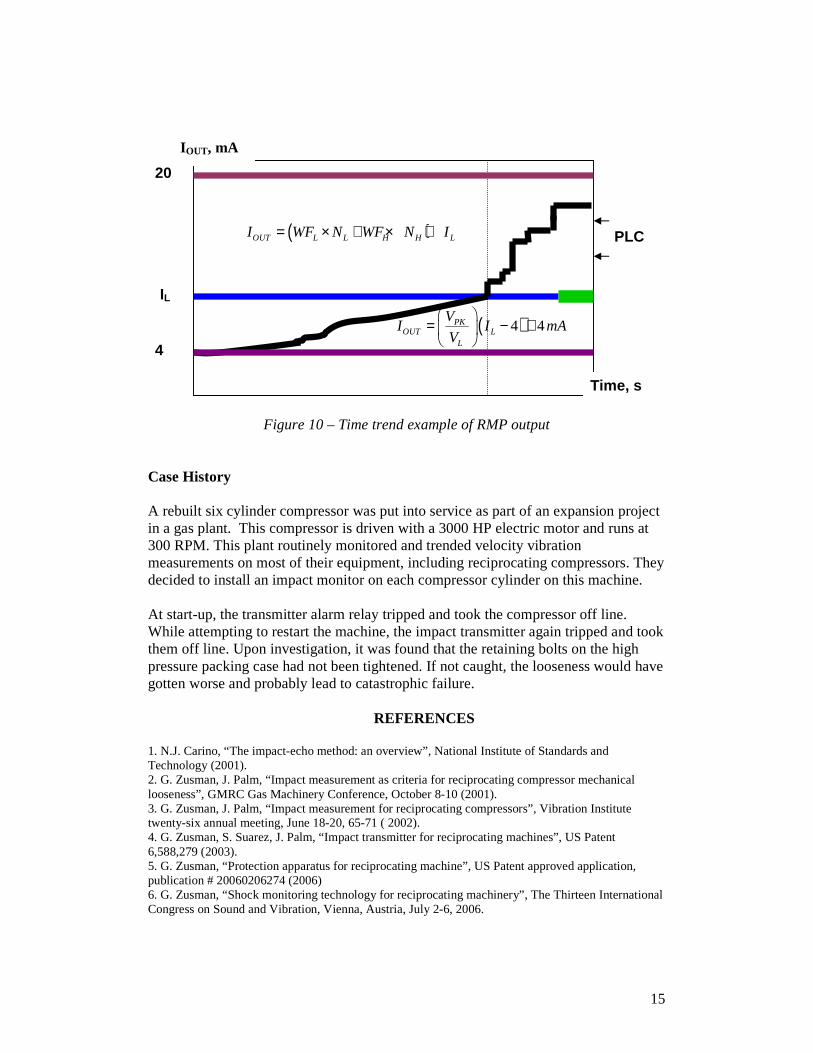
The RMP includes an embedded accelerometer (sensor) that generates a voltage output that is proportional to the shock and vibration sensed on the machine. The output of the sensor is passed through a bandpass filter (50 Hz to 10 kHz) and coupled through an amplifier to a high speed peak detector and both comparators. The peak detector monitors the continuous vibration signal and holds the highest amplitude seen within the sample window. If there are no impacts that are greater then either shock threshold level during this sample time (see Figure 2) then the peak value, VPK, is passed through the analog-to-digital converter (A/D) to the CPU. The CPU computes the RFI and then outputs the value to the digital-to-analog converter (D/A) and then to the voltage-to-current converter (V/I). The system output, IOUT, is a 4 to 20 mA current that is proportional to the RFI and given by following equation.
( )4 4PKOUT L
L
VI I mA
V
= − +
At the end of this process, a reset signal is sent to the peak detector to start over. The comparators are used when there are impact events that exceed either shock threshold level. Each comparator has two inputs, the continuous vibration signal, V(t), and a shock threshold reference voltage (VL or VH). The output of a comparator is zero if the amplitude of V(t) is less than the reference voltage and TTL level if it is above. The CPU counts the number of times each comparator output goes positive during the sample window (less any peaks that occur within the dead time). The CPU computes the RFI and then outputs the value to the DAC and then to the V/I converter. In this case, the system output, IOUT, is given by following equation.
( )OUT L L H H LI WF N WF N I= × + × +
Figure 10 shows a time trend example of RMP output based on the above equations.
15
Figure 10 – Time trend example of RMP output
Case History A rebuilt six cylinder compressor was put into service as part of an expansion project in a gas plant. This compressor is driven with a 3000 HP electric motor and runs at 300 RPM. This plant routinely monitored and trended velocity vibration measurements on most of their equipment, including reciprocating compressors. They decided to install an impact monitor on each compressor cylinder on this machine. At start-up, the transmitter alarm relay tripped and took the compressor off line. While attempting to restart the machine, the impact transmitter again tripped and took them off line. Upon investigation, it was found that the retaining bolts on the high pressure packing case had not been tightened. If not caught, the looseness would have gotten worse and probably lead to catastrophic failure.
REFERENCES
1. N.J. Carino, “The impact-echo method: an overview”, National Institute of Standards and Technology (2001). 2. G. Zusman, J. Palm, “Impact measurement as criteria for reciprocating compressor mechanical looseness”, GMRC Gas Machinery Conference, October 8-10 (2001). 3. G. Zusman, J. Palm, “Impact measurement for reciprocating compressors”, Vibration Institute twenty-six annual meeting, June 18-20, 65-71 ( 2002). 4. G. Zusman, S. Suarez, J. Palm, “Impact transmitter for reciprocating machines”, US Patent 6,588,279 (2003). 5. G. Zusman, “Protection apparatus for reciprocating machine”, US Patent approved application, publication # 20060206274 (2006) 6. G. Zusman, “Shock monitoring technology for reciprocating machinery”, The Thirteen International Congress on Sound and Vibration, Vienna, Austria, July 2-6, 2006.
20
IL
4
IOUT, mA
Time, s
PLC
( )4 4PKOUT L
L
VI I mA
V
= − +
( )OUT L L H H LI WF N WF N I= × + × +