Embed Size (px)
DESCRIPTION
Â
Citation preview

SHOPPES AT HAR-BER LAKESSPRINGDALE, AR
SHOPPES AT HAR-BER LAKES
FINA
NC
IAL A
NA
LYSIS
MA
RK
ET
OV
ER
VIE
WP
RO
PE
RT
Y D
ESC
RIP
TIO
N
2This information has been secured from sources we believe to be reliable, but we make no representations or warranties, expressed or implied, as to the accuracy of the information. References to square footage or age are approximate. Buyer must verify the information and bears all risk for any inaccuracies. Any projections, opinions, assumptions or estimates used herein are for example purposes only and do not represent the current or future performance of the property. © 2015 Vitorino Group
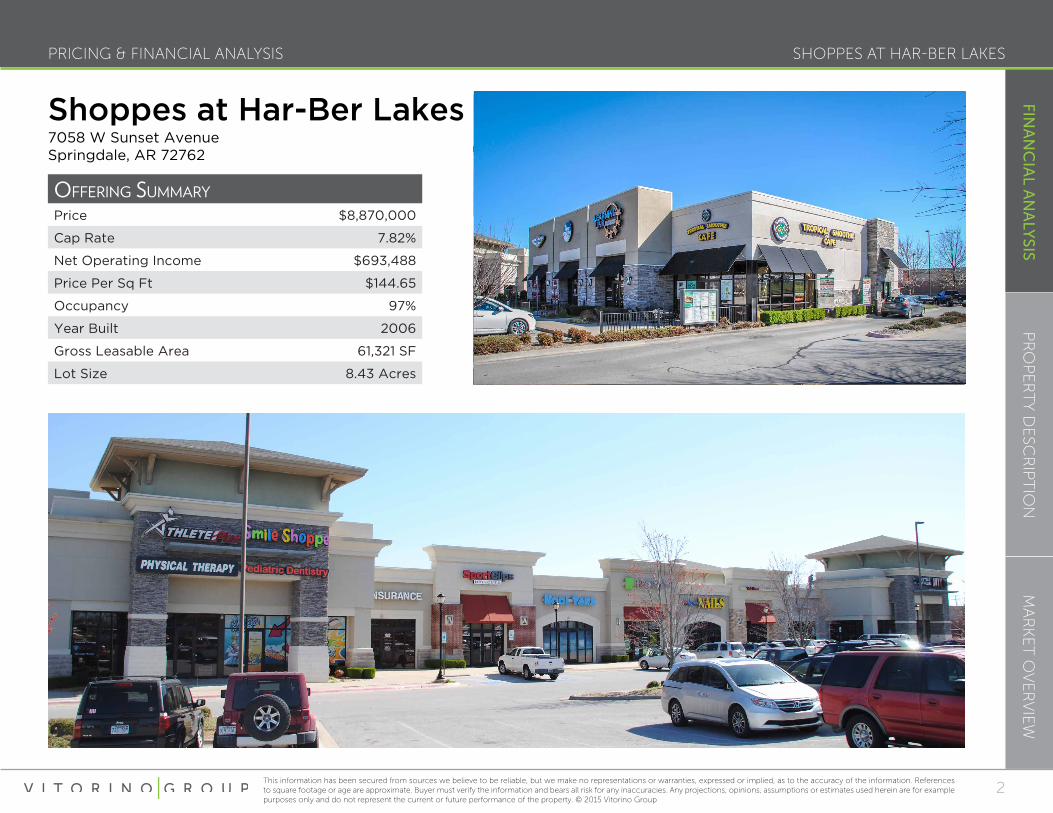
PRICING & FINANCIAL ANALYSIS
Offering Summary
Price $8,870,000
Cap Rate 7.82%
Net Operating Income $693,488
Price Per Sq Ft $144.65
Occupancy 97%
Year Built 2006
Gross Leasable Area 61,321 SF
Lot Size 8.43 Acres
Shoppes at Har-Ber Lakes7058 W Sunset Avenue Springdale, AR 72762

SHOPPES AT HAR-BER LAKES
FINA
NC
IAL A
NA
LYSIS
MA
RK
ET
OV
ER
VIE
WP
RO
PE
RT
Y D
ESC
RIP
TIO
N
3This information has been secured from sources we believe to be reliable, but we make no representations or warranties, expressed or implied, as to the accuracy of the information. References to square footage or age are approximate. Buyer must verify the information and bears all risk for any inaccuracies. Any projections, opinions, assumptions or estimates used herein are for example purposes only and do not represent the current or future performance of the property. © 2015 Vitorino Group
PRICING & FINANCIAL ANALYSIS
incOme & expenSeS current pSf
Base Rent - Occupied Space (96.9%) $721,224 $11.76
Base Rent - Vacant Space $0 $0.00
GROSS POTENTAL RENT $721,224 $11.76
Exp. Reimb.
Real Estate Taxes $34,305 $0.56
Insurance $4,935 $0.08
CAM $64,798 $1.06
Mgmt. Fee $17,639 $0.29
Total Exp. Reimb. $121,677 $1.98
GROSS POTENTIAL INCOME $842,901 $13.75
Vacancy Factor (economic) 0.00% $0 $0.00
EFFECTIVE GROSS INCOME $842,901 $13.75
Expenses
Real Estate Taxes ($32,264) ($0.53)
Insurance ($5,016) ($0.08)
CAM ($82,631) ($1.35)
Mgmt. Fee (% of GPI) 3.50% ($29,502) ($0.48)
Total Expenses ($149,413) ($2.44)
NET OPERATING INCOME $693,488
expenSeS current pSf"In-Line Retail" Real Estate Taxes $32,264 $0.53
Harp's Real Estate Taxes $28,188 $0.46
"In-Line Retail" Insurance $5,016 $0.08
Harp's Insurance $1,274 $0.02
CAM
Retail CAM $66,002 $1.08
Harp's CAM $16,629 $0.27
Total CAM $82,631 $1.35
Management Fee (% of GPI) 3.50% $29,502 $0.48
TOTAL EXPENSES $178,875 $2.92
SHOPPES AT HAR-BER LAKES
FINA
NC
IAL A
NA
LYSIS
MA
RK
ET
OV
ER
VIE
WP
RO
PE
RT
Y D
ESC
RIP
TIO
N
4This information has been secured from sources we believe to be reliable, but we make no representations or warranties, expressed or implied, as to the accuracy of the information. References to square footage or age are approximate. Buyer must verify the information and bears all risk for any inaccuracies. Any projections, opinions, assumptions or estimates used herein are for example purposes only and do not represent the current or future performance of the property. © 2015 Vitorino Group
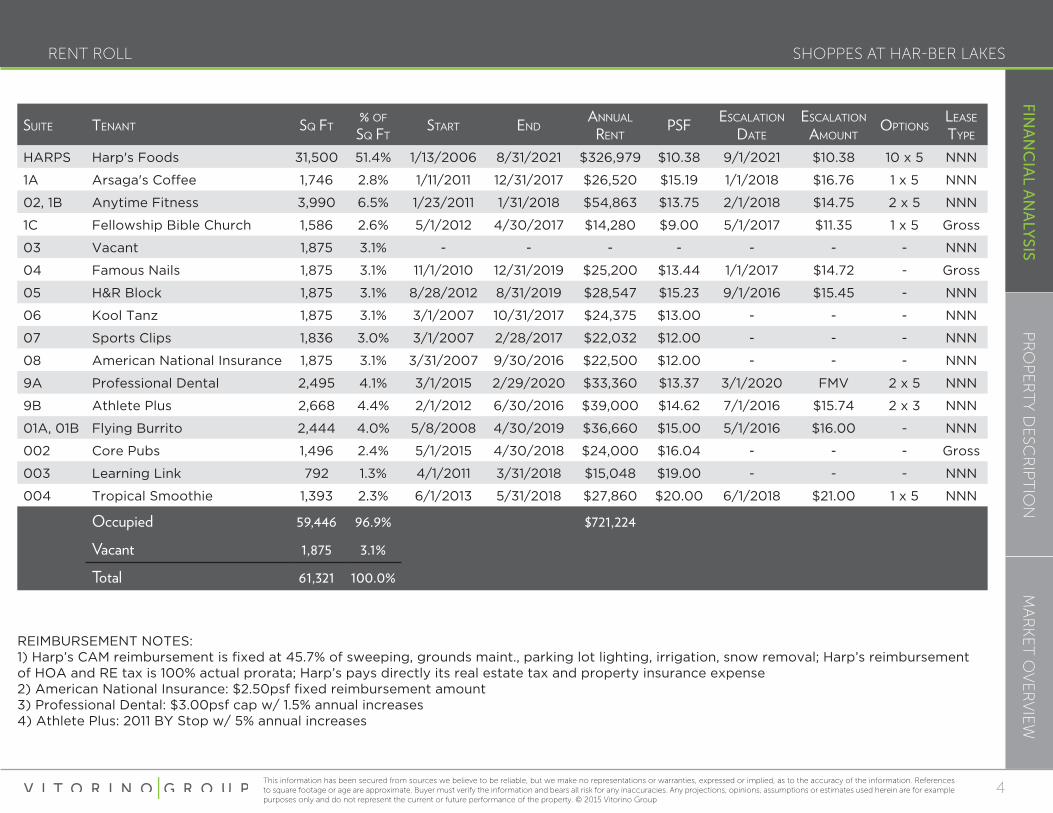
RENT ROLL
Suite tenant Sq ft% Of Sq ft
Start endannual
rentpSf
eScalatiOn date
eScalatiOn amOunt
OptiOnSleaSe
type
HARPS Harp's Foods 31,500 51.4% 1/13/2006 8/31/2021 $326,979 $10.38 9/1/2021 $10.38 10 x 5 NNN
1A Arsaga's Coffee 1,746 2.8% 1/11/2011 12/31/2017 $26,520 $15.19 1/1/2018 $16.76 1 x 5 NNN
02, 1B Anytime Fitness 3,990 6.5% 1/23/2011 1/31/2018 $54,863 $13.75 2/1/2018 $14.75 2 x 5 NNN
1C Fellowship Bible Church 1,586 2.6% 5/1/2012 4/30/2017 $14,280 $9.00 5/1/2017 $11.35 1 x 5 Gross
03 Vacant 1,875 3.1% - - - - - - - NNN
04 Famous Nails 1,875 3.1% 11/1/2010 12/31/2019 $25,200 $13.44 1/1/2017 $14.72 - Gross
05 H&R Block 1,875 3.1% 8/28/2012 8/31/2019 $28,547 $15.23 9/1/2016 $15.45 - NNN
06 Kool Tanz 1,875 3.1% 3/1/2007 10/31/2017 $24,375 $13.00 - - - NNN
07 Sports Clips 1,836 3.0% 3/1/2007 2/28/2017 $22,032 $12.00 - - - NNN
08 American National Insurance 1,875 3.1% 3/31/2007 9/30/2016 $22,500 $12.00 - - - NNN
9A Professional Dental 2,495 4.1% 3/1/2015 2/29/2020 $33,360 $13.37 3/1/2020 FMV 2 x 5 NNN
9B Athlete Plus 2,668 4.4% 2/1/2012 6/30/2016 $39,000 $14.62 7/1/2016 $15.74 2 x 3 NNN
01A, 01B Flying Burrito 2,444 4.0% 5/8/2008 4/30/2019 $36,660 $15.00 5/1/2016 $16.00 - NNN
002 Core Pubs 1,496 2.4% 5/1/2015 4/30/2018 $24,000 $16.04 - - - Gross
003 Learning Link 792 1.3% 4/1/2011 3/31/2018 $15,048 $19.00 - - - NNN
004 Tropical Smoothie 1,393 2.3% 6/1/2013 5/31/2018 $27,860 $20.00 6/1/2018 $21.00 1 x 5 NNN
Occupied 59,446 96.9% $721,224
Vacant 1,875 3.1%
Total 61,321 100.0%
REIMBURSEMENT NOTES: 1) Harp’s CAM reimbursement is fixed at 45.7% of sweeping, grounds maint., parking lot lighting, irrigation, snow removal; Harp’s reimbursement of HOA and RE tax is 100% actual prorata; Harp’s pays directly its real estate tax and property insurance expense2) American National Insurance: $2.50psf fixed reimbursement amount3) Professional Dental: $3.00psf cap w/ 1.5% annual increases4) Athlete Plus: 2011 BY Stop w/ 5% annual increases
SHOPPES AT HAR-BER LAKES
FINA
NC
IAL A
NA
LYSIS
MA
RK
ET
OV
ER
VIE
WP
RO
PE
RT
Y D
ESC
RIP
TIO
N
5This information has been secured from sources we believe to be reliable, but we make no representations or warranties, expressed or implied, as to the accuracy of the information. References to square footage or age are approximate. Buyer must verify the information and bears all risk for any inaccuracies. Any projections, opinions, assumptions or estimates used herein are for example purposes only and do not represent the current or future performance of the property. © 2015 Vitorino Group
TENANT INFORMATION
Harvard and Floy Harp founded Harps in 1930. By the mid 1960’s, Don’s brothers, Gerald and Reland, were also involved in managing the Company. In 2001, the Company did a leveraged buy-out with the Employee Stock Ownership Plan (ESOP) purchasing outstanding stock from the family and management. Since becoming employee-owned, employees have seen amazing growth in their stock. The stock price increased from $28 per share in 2001 to $277 per share at the end of fiscal 2014, a nearly ten-fold increase. Employees who have been with Harps since 2001 have built significant values in Harps for retirement. Harps is the largest employee-owned company headquartered in Arkansas.
With 80 stores in Arkansas, Oklahoma and Missouri, Harps has aggressive growth plans. The Company’s strategy has been to differentiate itself from the competition based on quality, service, and freshness at competitive prices. The Company promotes no solution/no sodium added fresh beef, pork and chicken. With customized cakes, Martha Harp fried chicken, donuts and rolls, the Harps name signifies quality. Combining that image with employee-owned service, Harps has become one of the grocery industry’s most recognized independent chains and is a national success story for grocery companies competing against Wal-Mart.
tenant Overview
Tenant Harps Food
Ownership Private
Years In Business 85 Years
Number of Locations 80
Headquarters Springdale, AR
Website www.harpsfood.com

SHOPPES AT HAR-BER LAKES
FINA
NC
IAL A
NA
LYSIS
MA
RK
ET
OV
ER
VIE
WP
RO
PE
RT
Y D
ESC
RIP
TIO
N
6This information has been secured from sources we believe to be reliable, but we make no representations or warranties, expressed or implied, as to the accuracy of the information. References to square footage or age are approximate. Buyer must verify the information and bears all risk for any inaccuracies. Any projections, opinions, assumptions or estimates used herein are for example purposes only and do not represent the current or future performance of the property. © 2015 Vitorino Group
INVESTMENT HIGHLIGHTS
• Grocery Anchored Retail Center Anchored by Harp’s Foods.
• 100-Year Life Cycle Building
• Under Market Average Rents ($12.13 per Foot)
• 97% Occupied with Staggered Lease Turnover
• One-Half Mile From Har Ber High School and Hellstern Middle School (Over 2,700 Students)
• Located in Front of the 425-Acre Har-Ber Meadows Master Planned Community
• High Growth Area - Population has Increased by Over 43% Since 2000
• Average Household Income Within a 1-Mile Radius is 1.4x the National Average
• Traffic Counts Along the Highway 412 Exceed 31,000 Vehicls Per Day


SHOPPES AT HAR-BER LAKES
FINA
NC
IAL A
NA
LYSIS
MA
RK
ET
OV
ER
VIE
WP
RO
PE
RT
Y D
ESC
RIP
TIO
N
8This information has been secured from sources we believe to be reliable, but we make no representations or warranties, expressed or implied, as to the accuracy of the information. References to square footage or age are approximate. Buyer must verify the information and bears all risk for any inaccuracies. Any projections, opinions, assumptions or estimates used herein are for example purposes only and do not represent the current or future performance of the property. © 2015 Vitorino Group
SITE PLAN

SHOPPES AT HAR-BER LAKES
FINA
NC
IAL A
NA
LYSIS
MA
RK
ET
OV
ER
VIE
WP
RO
PE
RT
Y D
ESC
RIP
TIO
N
9This information has been secured from sources we believe to be reliable, but we make no representations or warranties, expressed or implied, as to the accuracy of the information. References to square footage or age are approximate. Buyer must verify the information and bears all risk for any inaccuracies. Any projections, opinions, assumptions or estimates used herein are for example purposes only and do not represent the current or future performance of the property. © 2015 Vitorino Group
AERIAL MAP
Har-BerHigh
School
Bernice Young
Elementary

SHOPPES AT HAR-BER LAKES
FINA
NC
IAL A
NA
LYSIS
MA
RK
ET
OV
ER
VIE
WP
RO
PE
RT
Y D
ESC
RIP
TIO
N
10This information has been secured from sources we believe to be reliable, but we make no representations or warranties, expressed or implied, as to the accuracy of the information. References to square footage or age are approximate. Buyer must verify the information and bears all risk for any inaccuracies. Any projections, opinions, assumptions or estimates used herein are for example purposes only and do not represent the current or future performance of the property. © 2015 Vitorino Group
LOCAL MAP

SHOPPES AT HAR-BER LAKES
FINA
NC
IAL A
NA
LYSIS
MA
RK
ET
OV
ER
VIE
WP
RO
PE
RT
Y D
ESC
RIP
TIO
N
11This information has been secured from sources we believe to be reliable, but we make no representations or warranties, expressed or implied, as to the accuracy of the information. References to square footage or age are approximate. Buyer must verify the information and bears all risk for any inaccuracies. Any projections, opinions, assumptions or estimates used herein are for example purposes only and do not represent the current or future performance of the property. © 2015 Vitorino Group
REGIONAL MAP

SHOPPES AT HAR-BER LAKES
FINA
NC
IAL A
NA
LYSIS
MA
RK
ET
OV
ER
VIE
WP
RO
PE
RT
Y D
ESC
RIP
TIO
N
12This information has been secured from sources we believe to be reliable, but we make no representations or warranties, expressed or implied, as to the accuracy of the information. References to square footage or age are approximate. Buyer must verify the information and bears all risk for any inaccuracies. Any projections, opinions, assumptions or estimates used herein are for example purposes only and do not represent the current or future performance of the property. © 2015 Vitorino Group
MARKET SUMMARY
Fayetteville is the third-largest city in Arkansas and county seat of Washington County. Fayetteville is on the outskirts of the Boston Mountains, deep within the Ozarks. Known as Washington until 1829, the city was named after Fayetteville, Tennessee, where many of the settlers were from. The four-county Northwest Arkansas Metropolitan Statistical Area is ranked 105th in terms of population in the United States with 463,204 in 2010 according to the United States Census Bureau. The city had a population of 73,580 at the 2010 Census.
Fayetteville is home to the University of Arkansas, the state’s largest university. When classes are in session, thousands of students on campus dramatically change the city’s demographics. As a Southeastern Conference institution, thousands of Arkansas Razorbacks
alumni and fans travel to Fayetteville to attend home football, basketball, and baseball games.
Springdale is the fourth-largest city in Arkansas, and is located in both Washington and Benton counties in Northwest Arkansas. Located on the Springfield Plateau deep in the Ozark Mountains, Springdale has long been an important industrial city for the region.[3] In addition to several trucking companies, the city is home to the world headquarters of Tyson Foods, the world’s largest meat producing company.
Forbes magazine ranked the Fayetteville–Springdale–Rogers area as the 2nd-best area in the United States for recovery from the current United States recession. Reasons cited were the presence of Walmart (one of the top Fortune 500 corporations in the area).
FAYATTEVILLE-SPRINGDALE-ROGERS, AR

SHOPPES AT HAR-BER LAKES
FINA
NC
IAL A
NA
LYSIS
MA
RK
ET
OV
ER
VIE
WP
RO
PE
RT
Y D
ESC
RIP
TIO
N
13This information has been secured from sources we believe to be reliable, but we make no representations or warranties, expressed or implied, as to the accuracy of the information. References to square footage or age are approximate. Buyer must verify the information and bears all risk for any inaccuracies. Any projections, opinions, assumptions or estimates used herein are for example purposes only and do not represent the current or future performance of the property. © 2015 Vitorino Group
DEMOGRAPHIC SUMMARY
PoPulation
HouseHolds
income
Race and etHnicity
Housing
emPloyment
Geography: 5 miles
In the identified area, the current year population is 67,238. The rate of change since 2000 was 43.8%. The five-year projection for the population in the area is 72,906 representing a change of 8.4% from 2015 to 2020. Currently, the population is 49.2% male and 50.8% female. The median age in this area is 32.5, compared to the U.S. median age of 37.9.
There are currently 23,287 households in your selected georgraphy. The number of households has changed by 38.1% since 2000. It is estimated that the number of households in your area will be 25,157 five years from now, which represents a change of 8.0% from the current year. The average household size in your area is 2.86 persons.
In 2015, the median household income for your selected georgraphy is $45,820, compare this to the Entire U.S. average, which is currently $53,217. It is estimated that the median household income in your area will be $52,440 five years from now, which represents a change of 14.4% from the current year.
The current year per capita income in your area is $22,264, compare this to the Entire U.S. average, which is $28,597. The current year average household income in your area is $64,103, compare this to the Entire U.S. average, which is $74,699.
The current year racial makeup of your selected area is as follows: 70.1% White, 1.8% Black, 1.0% Native American and 6.5% Asian/Pacific Islander. Compare these to the Entire U.S. Averages which are: 71.60% White, 12.70% Black, 0.18% Native American and 5.02% Asian/Pacific Islander.
People of Hispanic origin are counted independently of race. People of Hispanic origin make up 28.7% of the current year population in your selected area. Compare this to the Entire U.S. average of 17.6%.
In 2015, there were 13,196 owner occupied housing units in your area and there were 10,091 renter occupied housing units in your area. Median home value in the area is $182,837, compared to a median home value of $200,006 for the U.S.
In 2015, there are 30,437 employees in your selected area, this is also known as the daytime population. Currently, 54.0% of employees are employed in white-collar occupations in this geography, and 28.1% are employed in blue-collar occupations. In 2015, unemployment in this area is 6.4%.
Demographic data © 2016 esri
SHOPPES AT HAR-BER LAKES
FINA
NC
IAL A
NA
LYSIS
MA
RK
ET
OV
ER
VIE
WP
RO
PE
RT
Y D
ESC
RIP
TIO
N
14This information has been secured from sources we believe to be reliable, but we make no representations or warranties, expressed or implied, as to the accuracy of the information. References to square footage or age are approximate. Buyer must verify the information and bears all risk for any inaccuracies. Any projections, opinions, assumptions or estimates used herein are for example purposes only and do not represent the current or future performance of the property. © 2015 Vitorino Group
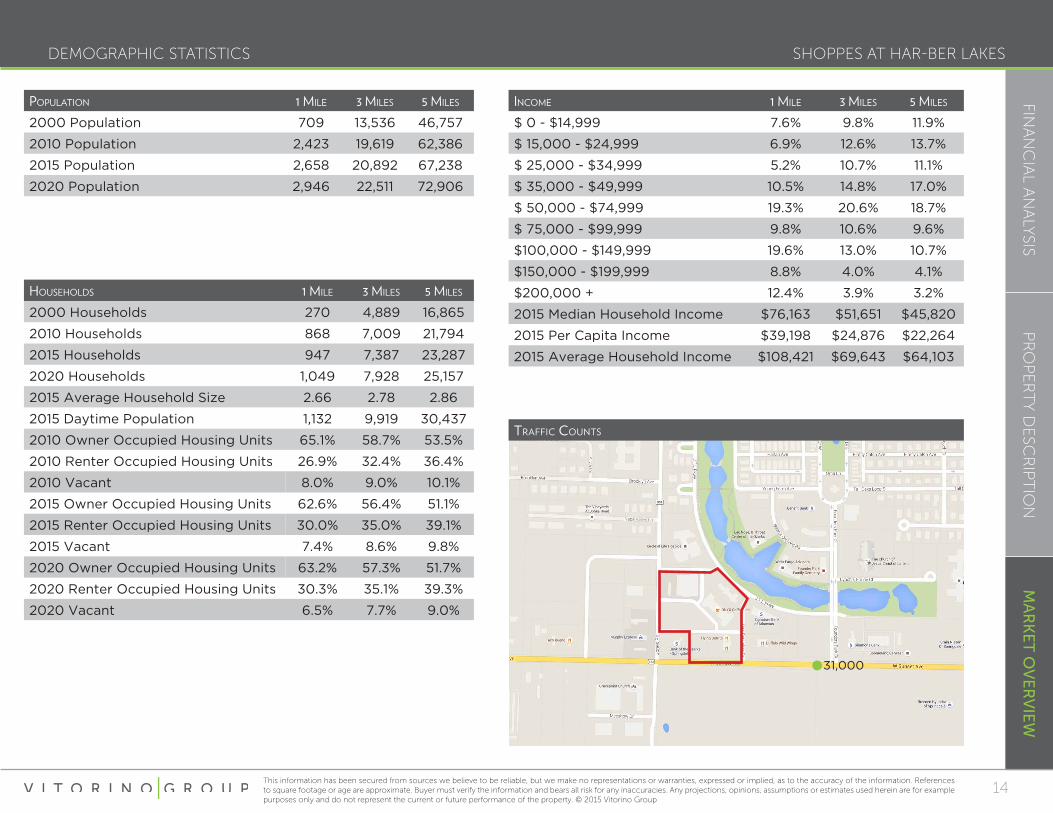
DEMOGRAPHIC STATISTICS
traffic cOuntS
incOme 1 mile 3 mileS 5 mileS
$ 0 - $14,999 7.6% 9.8% 11.9%
$ 15,000 - $24,999 6.9% 12.6% 13.7%
$ 25,000 - $34,999 5.2% 10.7% 11.1%
$ 35,000 - $49,999 10.5% 14.8% 17.0%
$ 50,000 - $74,999 19.3% 20.6% 18.7%
$ 75,000 - $99,999 9.8% 10.6% 9.6%
$100,000 - $149,999 19.6% 13.0% 10.7%
$150,000 - $199,999 8.8% 4.0% 4.1%
$200,000 + 12.4% 3.9% 3.2%
2015 Median Household Income $76,163 $51,651 $45,820
2015 Per Capita Income $39,198 $24,876 $22,264
2015 Average Household Income $108,421 $69,643 $64,103
pOpulatiOn 1 mile 3 mileS 5 mileS
2000 Population 709 13,536 46,757
2010 Population 2,423 19,619 62,386
2015 Population 2,658 20,892 67,238
2020 Population 2,946 22,511 72,906
HOuSeHOldS 1 mile 3 mileS 5 mileS
2000 Households 270 4,889 16,865
2010 Households 868 7,009 21,794
2015 Households 947 7,387 23,287
2020 Households 1,049 7,928 25,157
2015 Average Household Size 2.66 2.78 2.86
2015 Daytime Population 1,132 9,919 30,437
2010 Owner Occupied Housing Units 65.1% 58.7% 53.5%
2010 Renter Occupied Housing Units 26.9% 32.4% 36.4%
2010 Vacant 8.0% 9.0% 10.1%
2015 Owner Occupied Housing Units 62.6% 56.4% 51.1%
2015 Renter Occupied Housing Units 30.0% 35.0% 39.1%
2015 Vacant 7.4% 8.6% 9.8%
2020 Owner Occupied Housing Units 63.2% 57.3% 51.7%
2020 Renter Occupied Housing Units 30.3% 35.1% 39.3%
2020 Vacant 6.5% 7.7% 9.0%
31,000

The information contained in the following offering memorandum is proprietary and strictly confidential. It is intended to be reviewed only by the party receiving it from Vitorino Group and it should not be made available to any other person or entity without the written consent of Vitorino Group. By taking possession of and reviewing the information contained herein the recipient agrees to hold and treat all such information in the strictest confidence. The recipient further agrees that recipient will not photocopy or duplicate any part of the offering memorandum. If you have no interest in the subject property at this time, please return this offering memorandum to Vitorino Group.
This offering memorandum has been prepared to provide summary, unverified financial and physical information to prospective purchasers, and to establish only a preliminary level of interest in the subject property. The information contained herein is not a substitute for a thorough due diligence investigation. Vitorino Group has not made any investigation, and makes no warranty or representation with respect to the income or expenses for the subject property, the future projected financial performance of the property, the size and square footage of the property and improvements, the presence or absence of contaminating substances, PCBs or asbestos, the compliance with local, state and federal regulations, the physical condition of the improvements thereon, or the financial condition or business prospects of any tenant, or any tenant’s plans or intentions to continue its occupancy of the subject property. The information contained in this offering memorandum has been obtained from sources we believe to be reliable; however, Vitorino Group has not verified, and will not verify, any of the information contained herein, nor has Vitorino Group conducted any investigation regarding these matters and makes no warranty or representation whatsoever regarding the accuracy or completeness of the information provided. All potential buyers must take appropriate measures to verify all of the information set forth herein. Prospective buyers shall be responsible for their costs and expenses of investigating the subject property.
ALL PROPERTY SHOWINGS ARE BY APPOINTMENT ONLY. PLEASE CONTACT THE VITORINO GROUP AGENT FOR MORE DETAILS.
CONFIDENTIALITY AGREEMENT

Vitorino Group hereby advises all prospective purchasers of Net Leased property as follows:
The information contained in this Marketing Brochure has been obtained from sources we believe to be reliable. However, the Vitorino Group has not and will not verify any of this information, nor has the Vitorino Group conducted any investigation regarding these matters. The Vitorino Group makes no guarantee, warranty or representation whatsoever about the accuracy or completeness of any information provided.
As the Buyer of a net leased property, it is the Buyer’s responsibility to independently confirm the accuracy and completeness of all material information before completing any purchase. This Marketing Brochure is not a substitute for your thorough due diligence investigation of this investment opportunity. The Vitorino Group expressly denies any obligation to conduct a due diligence examination of this Property for Buyer.
Any projections, opinions, assumptions or estimates used in this Marketing Brochure are for example only and do not represent the current or future performance of this property. The value of a net leased property to you depends on factors that should be evaluated by you and your tax, financial and legal advisors. Buyer and Buyer’s tax, financial, legal, and construction advisors should conduct a careful, independent investigation of any net leased property to determine to your satisfaction with the suitability of the property for your needs.
Like all real estate investments, this investment carries significant risks. Buyer and Buyer’s legal and financial advisors must request and carefully review all legal and financial documents related to the property and tenant. While the tenant’s past performance at this or other locations is an important consideration, it is not a guarantee of future success. Similarly, the lease rate for some properties, including newly-constructed facilities or newly-acquired locations, may be set based on a tenant’s projected sales with little or no record of actual performance, or comparable rents for the area. Returns are not guaranteed; the tenant and any guarantors may fail to pay the lease rent or property taxes, or may fail to comply with other material terms of the lease; cash flow may be interrupted in part or in whole due to market, economic, environmental or other conditions. Regardless of tenant history and lease guarantees, Buyer is responsible for conducting his/her own investigation of all matters affecting the intrinsic value of the property and the value of any long-term lease, including the likelihood of locating a replacement tenant if the current tenant should default or abandon the property, and the lease terms that Buyer may be able to negotiate with a potential replacement tenant considering the location of the property, and Buyer’s legal ability to make alternate use of the property.
By accepting this Marketing Brochure you agree to release The Vitorino Group and hold it harmless from any kind of claim, cost, expense, or liability arising out of your investigation and/or purchase of this net leased property.
Net Lease Disclaimer

Before working with a real estate broker, you should know that the duties of a broker depend on whom the broker represents. If you are a prospective seller or landlord (owner) or a prospective buyer or tenant (buyer), you should know that the broker who lists the property for sale or lease is the owner’s agent. A broker who acts as a subagent represents the owner in cooperation with the listing broker. A broker
who acts as a buyer’s agent represents the buyer. A broker may act as an intermediary between the parties if the parties consent in writing. A broker can assist you in locating a property, preparing a contract or lease, or obtaining financing without representing you. A broker is obligated by law to treat you honestly.
IF THE BROKER REPRESENTS THE OWNER:The broker becomes the owner’s agent by entering into an agreement with the owner, usually through a written - listing agreement, or by agreeing to act as a subagent by accepting an offer of subagency from the listing broker. A subagent may work in a different real estate office. A listing broker or subagent can assist the buyer but does not represent the buyer and must place the interests of the owner first. The buyer should not tell the owner’s agent anything the buyer would not want the owner to know because an owner’s agent must disclose to the owner any material information known to the agent.
IF THE BROKER REPRESENTS THE BUYER:The broker becomes the buyer’s agent by entering into an agreement to represent the buyer, usually through a written buyer representation agreement. A buyer’s agent can assist the owner but does not represent the owner and must place the interests of the buyer first. The owner should not tell a buyer’s agent anything the owner would not want the buyer to know because a buyer’s agent must disclose to the buyer any material information known to the agent.
IF THE BROKER ACTS AS AN INTERMEDIARY:A broker may act as an intermediary between the parties if the broker complies with The Texas Real Estate License Act. The broker must obtain the written consent of each party to the transaction to act as an
Approved by the Texas Real Estate Commission for Voluntary Use Texas law requires all real estate licensees to give the following information about brokerage services to prospective buyers, tenants, sellers and landlords.
Real estate licensee asks that you acknowledge receipt of this information about brokerage services for the licensee’s records.
Information About Brokerage Services
intermediary. The written consent must state who will pay the broker and, in conspicuous bold or underlined print, set forth the broker’s obligations as an intermediary. The broker is required to treat each party honestly and fairly and to comply with The Texas Real Estate License Act. A broker who acts as an intermediary in a transaction:
With the parties’ consent, a broker acting as an intermediary between the parties may appoint a person who is licensed under The Texas Real Estate License Act and associated with the broker to communicate with and carry out instructions of one party and another person who is licensed under that Act and associated with the broker to communicate with and carry out instructions of the other party.
If you choose to have a broker represent you, you should enter into a written agreement with the broker that clearly establishes the broker’s obligations and your obligations. The agreement should state how and by whom the broker will be paid. You have the right to choose the type of representation, if any, you wish to receive. Your payment of a fee to a broker does not necessarily establish that the broker represents you. If you have any questions regarding the duties and responsibilities of the broker, you should resolve those questions before proceeding.
(1) shall treat all parties honestly;(2) may not disclose that the owner will accept a price less than the asking price unless authorized in writing to do so by the owner;(3) may not disclose that the buyer will pay a price greater than the price submitted in a written offer unless authorized in writing to do so by the buyer; and(4) may not disclose any confidential information or any information that a party specifically instructs the broker in writing not to disclose unless authorized in writing to disclose the information or required to do so by The Texas Real Estate License Act or a court order or if the information materially relates to the condition of the property.

exclusively listed
469.844.8880 | VITORINOGROUP.COM
Exclusively listed by:
Vice PresidentLISTING BROKERTel: (499) 844-8889 [email protected] License: TX #609364
Michael AustrySage Partners, LLCPRINCIPAL BROKERTel: (479) 443-9990 [email protected] License: #PB00050746
Brian R. Shaw