Embed Size (px)
Citation preview
International Conference on Management and Information Systems September 21-22, 2018
ISBN 978-1-943295-12-8 189
Shopping Mall and Its Impact in the City Life a Study With Reference to
Bengaluru City
Princy R
Auxilium College
Kezline Dharshini
Azim Premji University This research paper analyzes the impact of shopping malls on the Bengaluru city. The influence of shopping
mall is measured in the form of different attributes evaluated with respect to belief and actual impact. The
attributes were real estate (rent) and traffic. The attributes were studied through surveys and observation.
Overall, the effect of shopping mall on the city structure are analyzed based on the belief and actual. This
research also tried to trace out the preference of people while renting a house in a city. Statistical tools were
used to analyze and bring out the inferences. The goal of this research is to help people understand how their
choices and attraction towards malls had affected their daily life and their city. Some of the inferences were
quite shocking and amusing. I hope this research paper helps people fathom how malls have changed their city
without them realizing it.
Keywords: Shopping mall, Bengaluru City, Rent, Traffic, Real Estate. People’s Preference
1. Introduction India has witnessed rapid growth in the organized retail sector over the last decade due to increase in population,
pay rise, and increase in standard of living. This resulted in the development of shopping malls. According to
the Global Retail Development Index 2012, India ranks 5th among the top 30 emerging markets for retail.
Shopping malls have provided a unique and amusing shopping experience for the Indian consumers. The
changing consumption pattern, in turn primarily remains driven by higher standard of living, growing middle-
class population, greater proportion of working women, increase in penetration levels of organized retail, etc.
(Credit Analysis and Research Limited, 2012). Mall culture is viewed as a significant change in the life style of
Indians, as shopping is no longer an activity of buying things but also viewed as a status symbol and a one-stop
retail solution. Shopping malls are the most happening places these days where people spend their weekends to
relax and shop. With the changing tastes and preferences of customers, shopping malls extend a global impact
across metros, cities and towns. Tier one cities like Delhi, Mumbai and Chennai and Bengaluru have received
greater economic and social contributions from malls. Spencer Plaza, Chennai, is the first mall to be opened up
in Indian history. Spencer Plaza started its operation in the year 1863.
According to Wikipedia, a shopping mall is one or more buildings forming a complex of shops representing
merchandisers, with interconnecting walkways enabling visitors to easily walk from unit to unit, along with a
parking area—a modern, indoor version of the traditional marketplace
(http://en.wikipedia.org/wiki/Shopping_mall). Shopping malls are usually built in an area of 80,000 to 350,000
sq. ft., and consist of around 200 shops in India, and more than 200 in many parts of the world. With the advent
of players like Future Group, Pantaloons, Lifestyle, Crossword, etc. the organized retail is creating a new image
for itself. The organized retail sector has been expanding at a faster pace since 2002 with the establishment of
many malls even in two-tier cities. India offers an immense market opportunity because of increased income and
changed lifestyle of middle class families. In 2001 there were just three malls in India. The number grew to 343
by 2007. As of May 2013, India had a total of 570 operational malls. As per the data from Bangalore-based
Asipac Consulting, number of malls in 2013 has doubled since 2008 and the number is expected to reach 1,000
by 2020.
The shopping malls in Bengaluru city are the sum of the effects of the quality of life, lifestyle pattern,
standard of living, the work of city transportation system and architectural and urban perception of the city. The
malls in the city attract with entertainment, food court, multi-brand portfolio, convenience, infrastructure, safety,
parking and eliteness.
Most of us would have heard this statement when you go looking for houses to rent – ‘the rent in this area is
little high because nearby you have big mall’. So, does it really affect the rent? Do malls affect the area’s
traffic? Therefore, the question on focus - How malls affect the city and its people?
2. Review of Literature A review of literature revealed why people are attracted to malls and how this affects the city on which they
depend for their living.
International Conference on Management and Information Systems September 21-22, 2018
ISBN 978-1-943295-12-8 190
Prathamesh Muzumdar (2014) this study deals with the twin cities of Bloomington-Normal (henceforth
referred to as ‘city’) located in the Mclean county in the central Illinois region. Normal is a small town with a
population of 70,000. The major employer of the city is State Farm Insurance; the city is densely populated with
middle-class and lower upper-class income segments. The shopping malls have played a major role in the
growth of the city. The first shopping mall was started in the year 1982, and by 2011, it had 8 shopping malls.
The main reason for the increase in the number of the shopping malls was the increase in the population of the
city which was the result of the change in the environment of the city which took place due to the growth of
certain factors. As a result, many issues evolved addressing the factors of environmental changes, changes in
architectural and urban perception, changes in communication and transportation and changes in the economic
aspect of necessity of a city. A city with limited population but with multiple shopping malls posed a question to
the town planners to think about.
Rajagopal (1999) this study pointed out that the ambience of shopping malls, assortment of stores, sales
promotions and comparative economic gains in malls attract higher customer traffic.
Srivastava (2008) this study clearly shows the changing retail scene in India. Food, groceries and apparel
purchase by customers contributed to 52% of sales in malls. On an average, 75% of customers spend about 1-3
hours in the mall. Malls with multiplexes such as cinema theaters, food courts, and play areas for children are
becoming the centers for family outings.
Mehta (2009) state that large malls have brought about huge growth potential for the city and changes in the
consumer buying behavior.
Dobbin (2011) this study states that shopping behavior has changed and malls have become the landmark of
urban shopping and the city. In India, malls have transformed shopping from a need-driven activity to a leisure
time entertainment. The quality mall space, which was just one million sq. ft. in 2002, had accomplished new
milestones of 40 million sq. ft. and 60 million sq. ft. in 2007 and 2008 respectively. There is a paradigm shift in
the mall scenario from just three malls in 2000 to 220 malls in 2006.
Ammani. P (2013) in his study explains that shopping malls are gaining importance as places of recreation,
apart from the experience of shopping, for many in metros and cities. According to the Global Retail
Development Index 2012, India ranks 5th among the top 30 emerging markets for retail.
2.1 Objectives of the Study
The main objectives of this research paper are
• To learn how shopping malls affect the real estate rents in the surrounding area.
• To understand people’s preferences when renting a house with respect to their ages.
• To identify the effect of shopping malls on the traffic in the surrounding area.
• To help people understand how their choices and attraction towards shopping malls have affect their
daily life and their city.
2.2 Hypothesis
• Real estate rent value around shopping malls in high.
• Youth (17-29) in the urban cities will prefer to live next to shopping malls than any other place.
• Adults (30 and above) prefer to live near their workplace or educational institutions than shopping
malls.
• Peak hours of shopping malls are same as the peak traffic time in the area.
2.3 Research Methodology
• The research design is exploratory.
• Both primary and secondary data were utilized. ➢Survey and observation method was employed.
• The sampling method adopted was convenience sampling.
• The study was carried out in the city of Bengaluru.
• Sample size is 85, Out of these 85 responses – 24 were from teaching and non- teaching staff (adults)
and 61 from students (youth).
• Sample area: Azim Premji University Undergraduate Campus.
3. Data Sources 3.1 Primary data Survey done in Azim Premji University Undergraduate Campus.
Real Estate Rent
• 99acres.com
• Magicbricks.com
International Conference on Management and Information Systems September 21-22, 2018
ISBN 978-1-943295-12-8 191
• Nobroker.com
(Note: in all the above three websites the data was collected for a standard threebedroom, 2000 sq. ft.,
independent house.)
Traffic
• Google Search Engine, Google Maps
3.2 Secondary Data - Shopping mall name and size –from their official website and Wikipedia
4. Descriptive Analysis A survey was sent out to the students and staff in Azim Premji University Undergraduate Campus. The survey
contained two questions about their current house location and their preferred location for their house. There
were responses from 89 responses from which 85 was randomly picked.
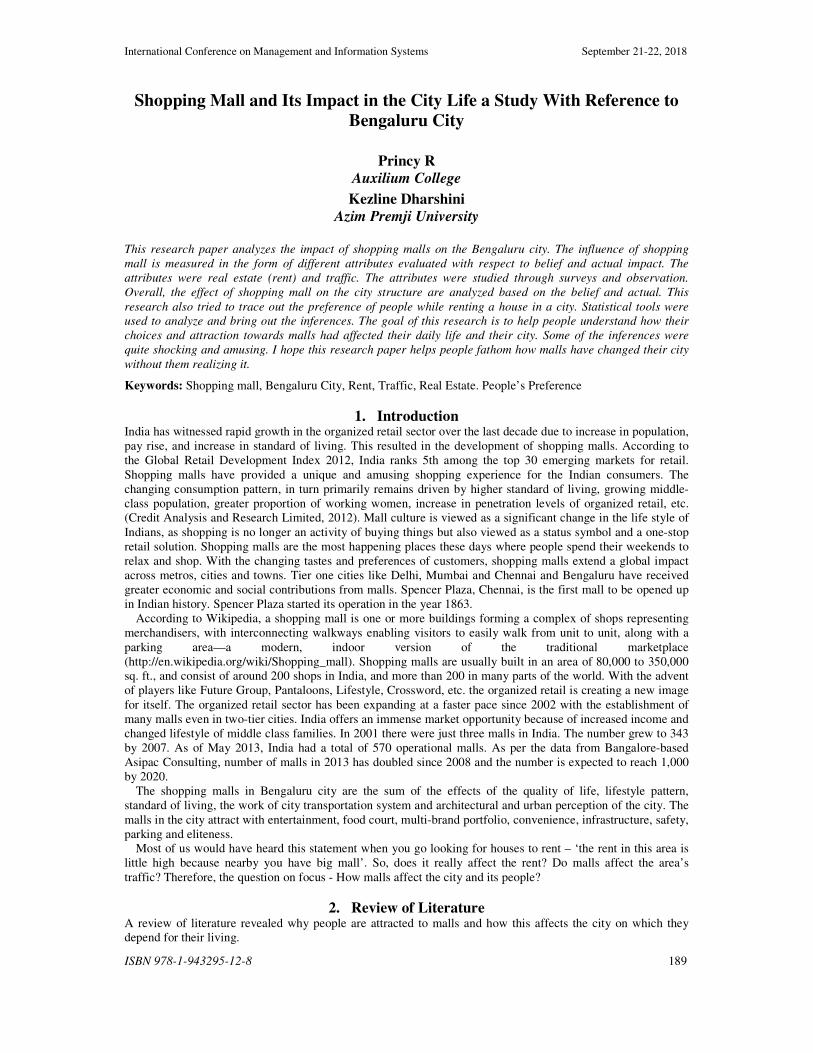
Table No. 1 Current House Location
CURRENT HOUSE LOCATION NO. OF HOUSES
Near Educational Institutions 27
Near Shopping Malls 21
Near Companies 7
Near Industries 5
Near Workplace 10
Others 15
Total 85
Source: Primary Data
Graph No.1: Current house Location
4.1 Interpretation The above pie-chart shows that most of the students and staffs currently live near educational institutions than
compared to shopping malls. This can be interpreted as most parents wanted to live near their children’s schools
or colleges. The ‘others’ included parks, hospitals, banks etc.
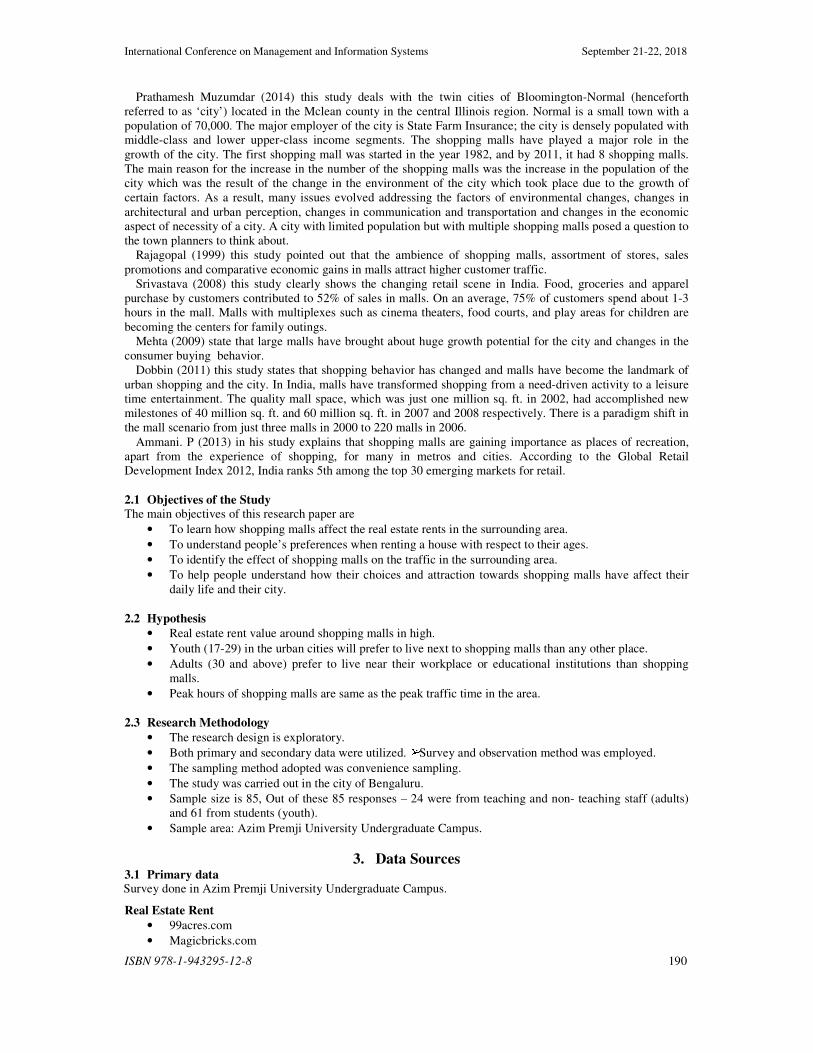
Table No. 2 Preferred House Location
Preferred House Location No. Of Houses
Near Educational Institutions 23
Near Shopping Malls 26
Near Companies 2
Near nature 16
Near Workplace 7
others 11
Total 85
Source: Primary Data
Educational Institutions
34 %
Malls 26 %
Companies 6 %
Industries 5 %
Workplace 10 %
others 19 %
CURRENT HOUSES LOCATION
International Conference on Management and Information Systems September 21-22, 2018
ISBN 978-1-943295-12-8 192
Graph No.2: Preferred House Location
4.2 Interpretation
The above pie chart showed a mixed response from people in Azim Premji University. It showed that mostly
people preferred shopping malls due to large number of student responses. The second and third place was taken
by educational institutions and nature respectively. Surprising, many people wrote nature as their preference
which conveyed that people are tired of urban lifestyle.
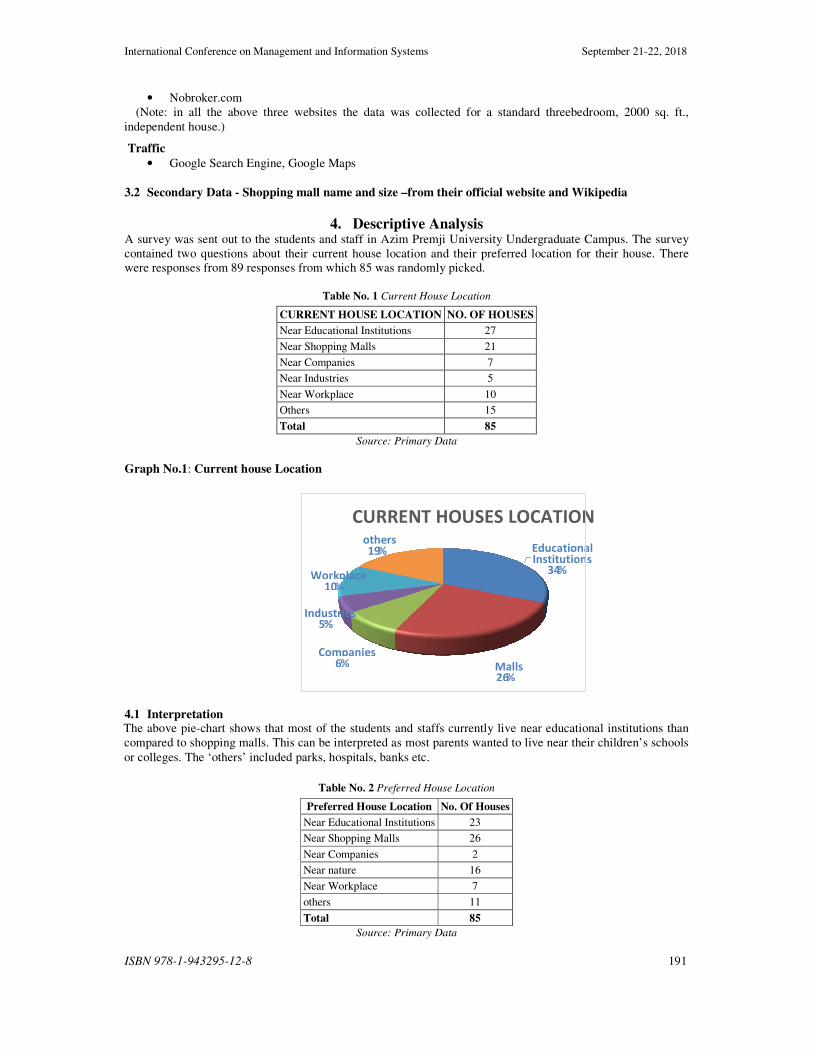
Table No.3 Staff Preference in their House Location
Staff No. of Houses
Educational Institutions 7
Shopping Malls 7
Nature 4
Workplace 6
Total 24
Source: Primary Data
Graph No.3: Staff preference in their House Location
4.3 Interpretation This pie chart shows that the staffs of APU prefer both shopping malls and educational institutions equally
which contradicts the hypothesis. Secondly, they prefer staying near workplace and then nature.
2 %
2 %
1 %
2%
Staff's
Educational Mall natur workplac
Educational Institutions
27 %
Malls % 31
Companies %
nature % 19
Workplace 8 %
others 13 %
PREFERRED HOUSE LOCATION
International Conference on Management and Information Systems September 21-22, 2018
ISBN 978-1-943295-12-8 193
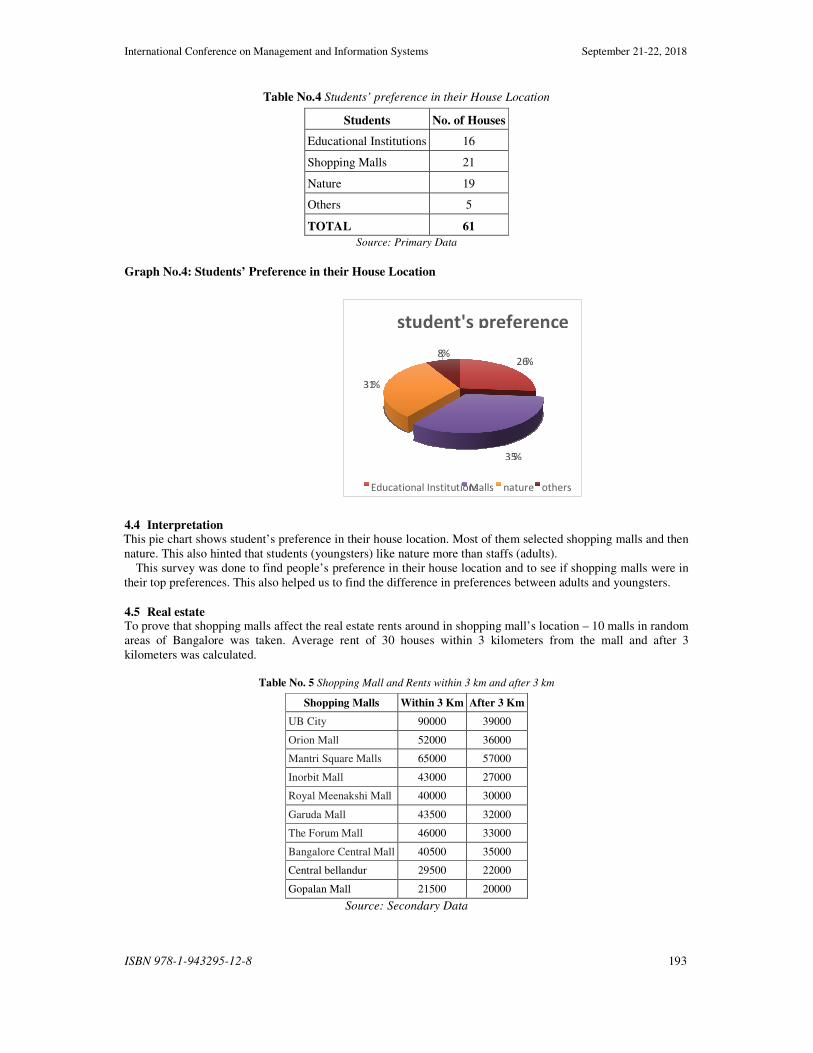
Table No.4 Students’ preference in their House Location
Students No. of Houses
Educational Institutions 16
Shopping Malls 21
Nature 19
Others 5
TOTAL 61
Source: Primary Data
Graph No.4: Students’ Preference in their House Location
4.4 Interpretation
This pie chart shows student’s preference in their house location. Most of them selected shopping malls and then
nature. This also hinted that students (youngsters) like nature more than staffs (adults).
This survey was done to find people’s preference in their house location and to see if shopping malls were in
their top preferences. This also helped us to find the difference in preferences between adults and youngsters.
4.5 Real estate To prove that shopping malls affect the real estate rents around in shopping mall’s location – 10 malls in random
areas of Bangalore was taken. Average rent of 30 houses within 3 kilometers from the mall and after 3
kilometers was calculated.
Table No. 5 Shopping Mall and Rents within 3 km and after 3 km
Shopping Malls Within 3 Km After 3 Km
UB City 90000 39000
Orion Mall 52000 36000
Mantri Square Malls 65000 57000
Inorbit Mall 43000 27000
Royal Meenakshi Mall 40000 30000
Garuda Mall 43500 32000
The Forum Mall 46000 33000
Bangalore Central Mall 40500 35000
Central bellandur 29500 22000
Gopalan Mall 21500 20000
Source: Secondary Data
26 %
35 %
31 %
8%
student's preference
Educational Institutions Malls nature others
International Conference on Management and Information Systems September 21-22, 2018
ISBN 978-1-943295-12-8 194
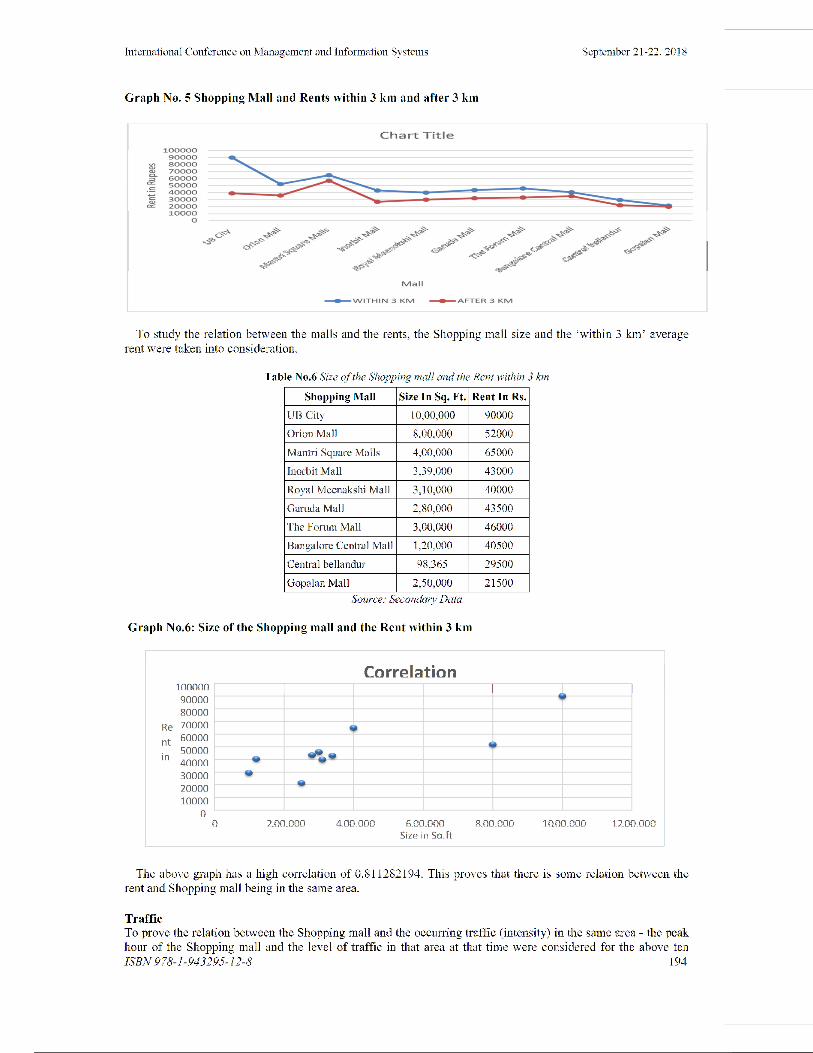
Graph No. 5 Shopping Mall and Rents within 3 km and after 3 km
To study the relation between the malls and the rents, the Shopping mall size and the ‘within 3 km’ average
rent were taken into consideration.
Table No.6 Size of the Shopping mall and the Rent within 3 km
Shopping Mall Size In Sq. Ft. Rent In Rs.
UB City 10,00,000 90000
Orion Mall 8,00,000 52000
Mantri Square Malls 4,00,000 65000
Inorbit Mall 3,39,000 43000
Royal Meenakshi Mall 3,10,000 40000
Garuda Mall 2,80,000 43500
The Forum Mall 3,00,000 46000
Bangalore Central Mall 1,20,000 40500
Central bellandur 98,365 29500
Gopalan Mall 2,50,000 21500
Source: Secondary Data
Graph No.6: Size of the Shopping mall and the Rent within 3 km
The above graph has a high correlation of 0.811282194. This proves that there is some relation between the
rent and Shopping mall being in the same area.
Traffic To prove the relation between the Shopping mall and the occurring traffic (intensity) in the same area - the peak
hour of the Shopping mall and the level of traffic in that area at that time were considered for the above ten
International Conference on Management and Information Systems September 21-22, 2018
ISBN 978-1-943295-12-8 195
Shopping malls. The level of traffic was calculated with the help of a three-liter scale.
1 – Low 2 - Moderate 3 – High
This was calculated for a whole week and correlation between the above two attributes was found for every
single day hoping to find some trend.
(NOTE: The Shopping mall names will not be given and the time, traffic is already sorted in ascending order)
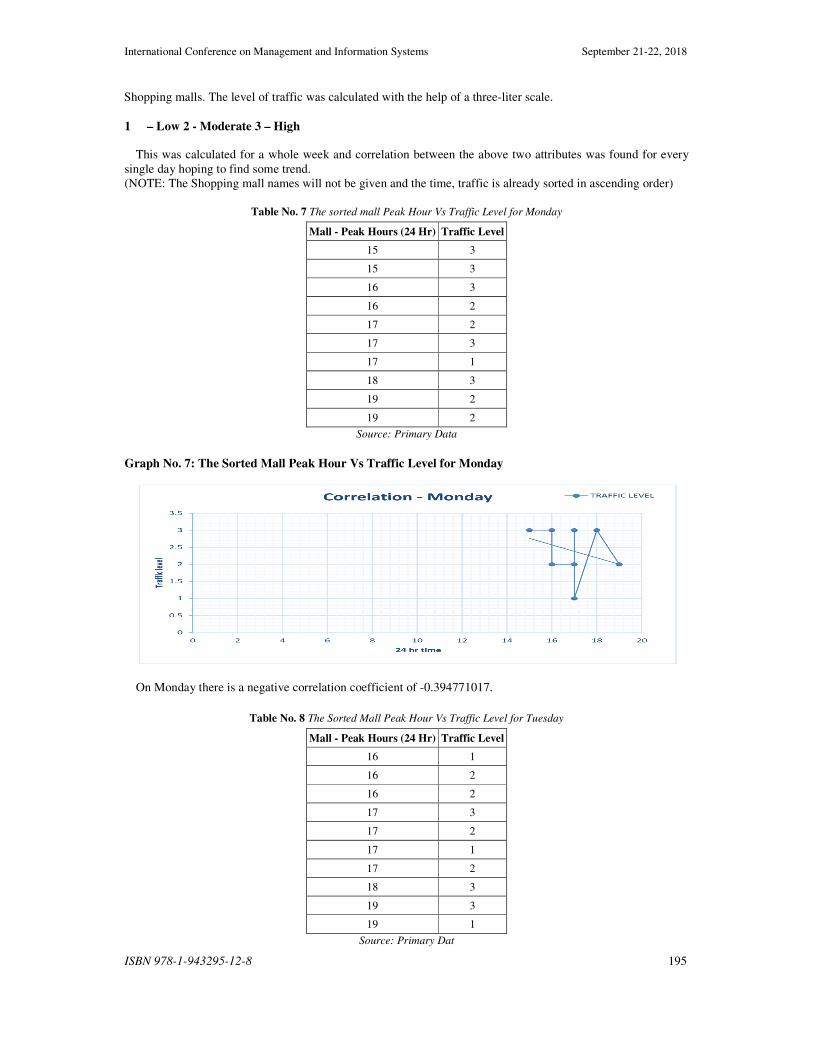
Table No. 7 The sorted mall Peak Hour Vs Traffic Level for Monday
Mall - Peak Hours (24 Hr) Traffic Level
15 3
15 3
16 3
16 2
17 2
17 3
17 1
18 3
19 2
19 2
Source: Primary Data
Graph No. 7: The Sorted Mall Peak Hour Vs Traffic Level for Monday
On Monday there is a negative correlation coefficient of -0.394771017.
Table No. 8 The Sorted Mall Peak Hour Vs Traffic Level for Tuesday
Mall - Peak Hours (24 Hr) Traffic Level
16 1
16 2
16 2
17 3
17 2
17 1
17 2
18 3
19 3
19 1
Source: Primary Dat
International Conference on Management and Information Systems September 21-22, 2018
ISBN 978-1-943295-12-8 196
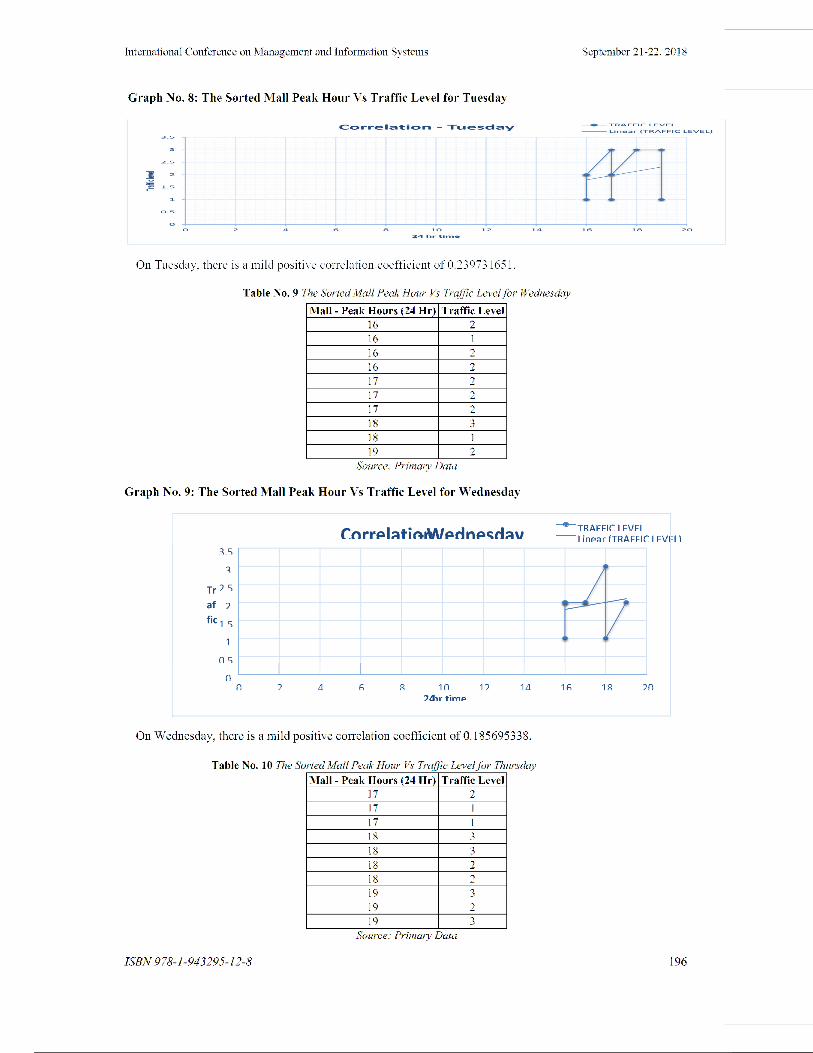
Graph No. 8: The Sorted Mall Peak Hour Vs Traffic Level for Tuesday
On Tuesday, there is a mild positive correlation coefficient of 0.239731651.
Table No. 9 The Sorted Mall Peak Hour Vs Traffic Level for Wednesday
Mall - Peak Hours (24 Hr) Traffic Level
16 2
16 1
16 2
16 2
17 2
17 2
17 2
18 3
18 1
19 2
Source: Primary Data
Graph No. 9: The Sorted Mall Peak Hour Vs Traffic Level for Wednesday
On Wednesday, there is a mild positive correlation coefficient of 0.185695338.
Table No. 10 The Sorted Mall Peak Hour Vs Traffic Level for Thursday
Mall - Peak Hours (24 Hr) Traffic Level
17 2
17 1
17 1
18 3
18 3
18 2
18 2
19 3
19 2
19 3
Source: Primary Data
International Conference on Management and Information Systems September 21-22, 2018
ISBN 978-1-943295-12-8 197
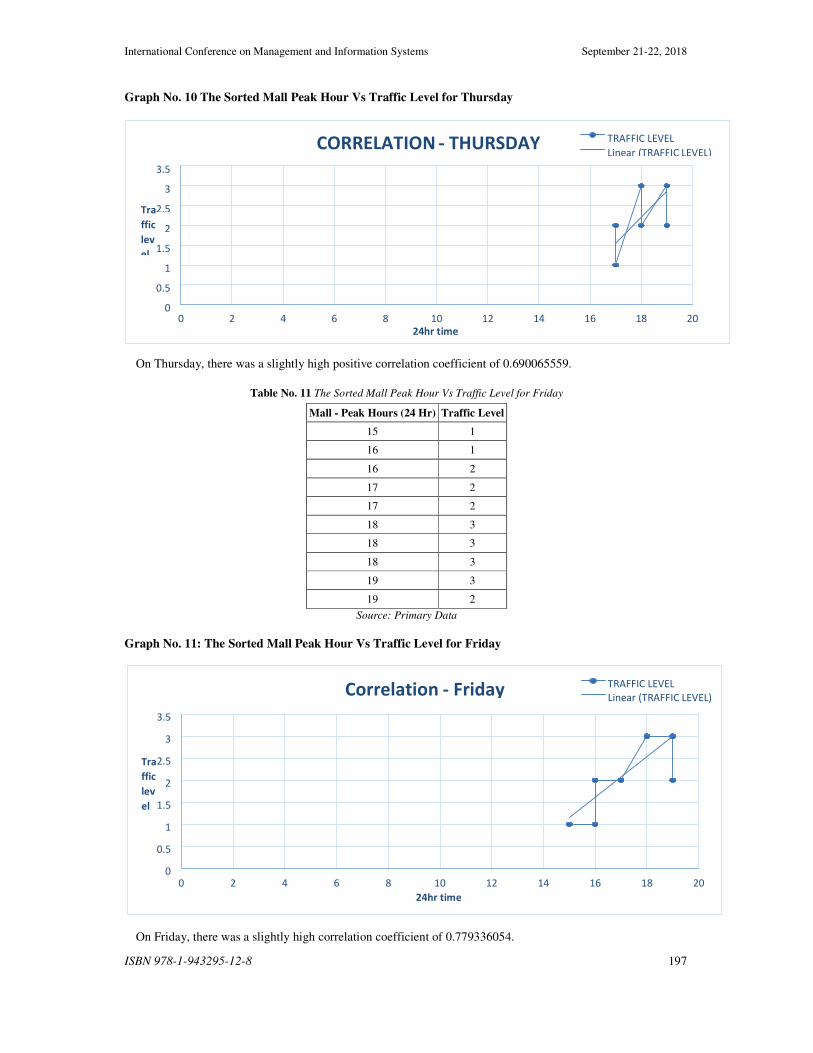
Graph No. 10 The Sorted Mall Peak Hour Vs Traffic Level for Thursday
On Thursday, there was a slightly high positive correlation coefficient of 0.690065559.
Table No. 11 The Sorted Mall Peak Hour Vs Traffic Level for Friday
Mall - Peak Hours (24 Hr) Traffic Level
15 1
16 1
16 2
17 2
17 2
18 3
18 3
18 3
19 3
19 2
Source: Primary Data
Graph No. 11: The Sorted Mall Peak Hour Vs Traffic Level for Friday
On Friday, there was a slightly high correlation coefficient of 0.779336054.
0
0.5
1
1.5
2
2.5
3
3.5
0 2 4 6 8 10 12 14 16 18 20
Tra
ffic
lev
el
24 hr time
Correlation - Friday TRAFFIC LEVEL Linear (TRAFFIC LEVEL)
0
0.5
1
1.5
2
2.5
3
3.5
0 2 4 6 8 10 12 14 16 18 20
Tra
ffic
lev
el
24 hr time
CORRELATION - THURSDAY TRAFFIC LEVEL Linear (TRAFFIC LEVEL)
International Conference on Management and Information Systems September 21-22, 2018
ISBN 978-1-943295-12-8 198
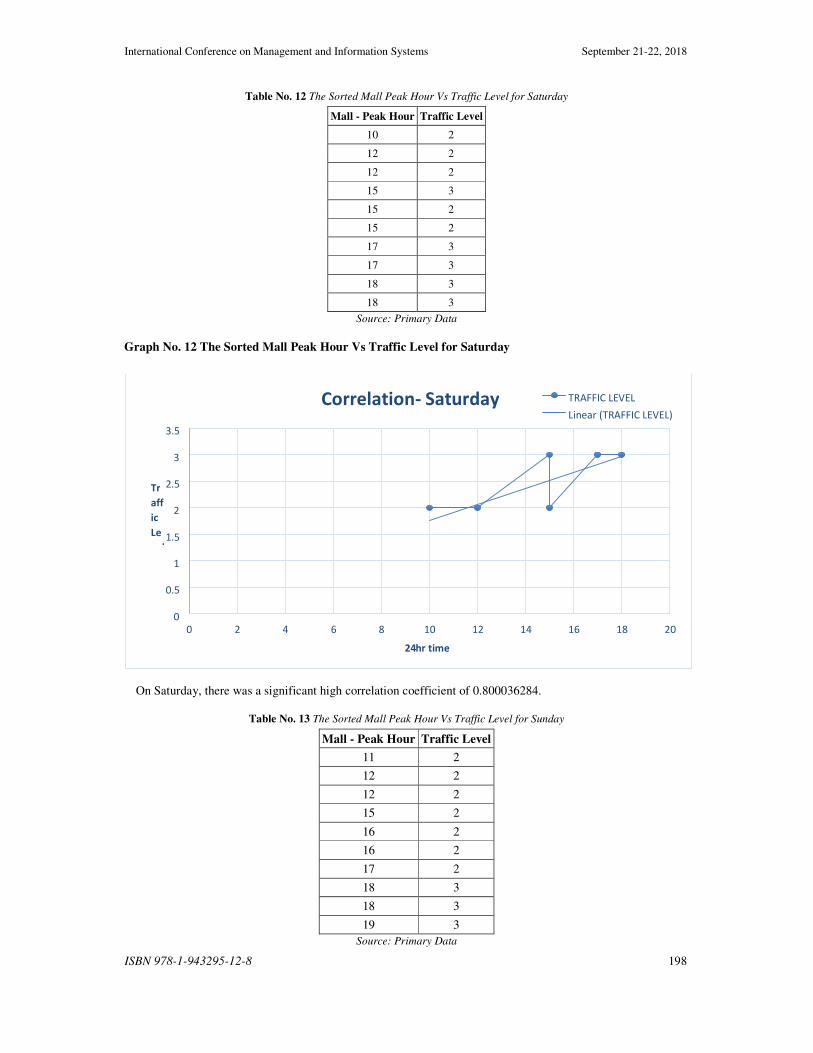
Table No. 12 The Sorted Mall Peak Hour Vs Traffic Level for Saturday
Mall - Peak Hour Traffic Level
10 2
12 2
12 2
15 3
15 2
15 2
17 3
17 3
18 3
18 3
Source: Primary Data
Graph No. 12 The Sorted Mall Peak Hour Vs Traffic Level for Saturday
On Saturday, there was a significant high correlation coefficient of 0.800036284.
Table No. 13 The Sorted Mall Peak Hour Vs Traffic Level for Sunday
Mall - Peak Hour Traffic Level
11 2
12 2
12 2
15 2
16 2
16 2
17 2
18 3
18 3
19 3
Source: Primary Data
0
0.5
1
1.5
2
2.5
3
3.5
0 2 4 6 8 10 12 14 16 18 20
Tr
aff
ic
Le
vel
24 hr time
Correlation - Saturday TRAFFIC LEVEL
Linear (TRAFFIC LEVEL)
International Conference on Management and Information Systems September 21-22, 2018
ISBN 978-1-943295-12-8 199
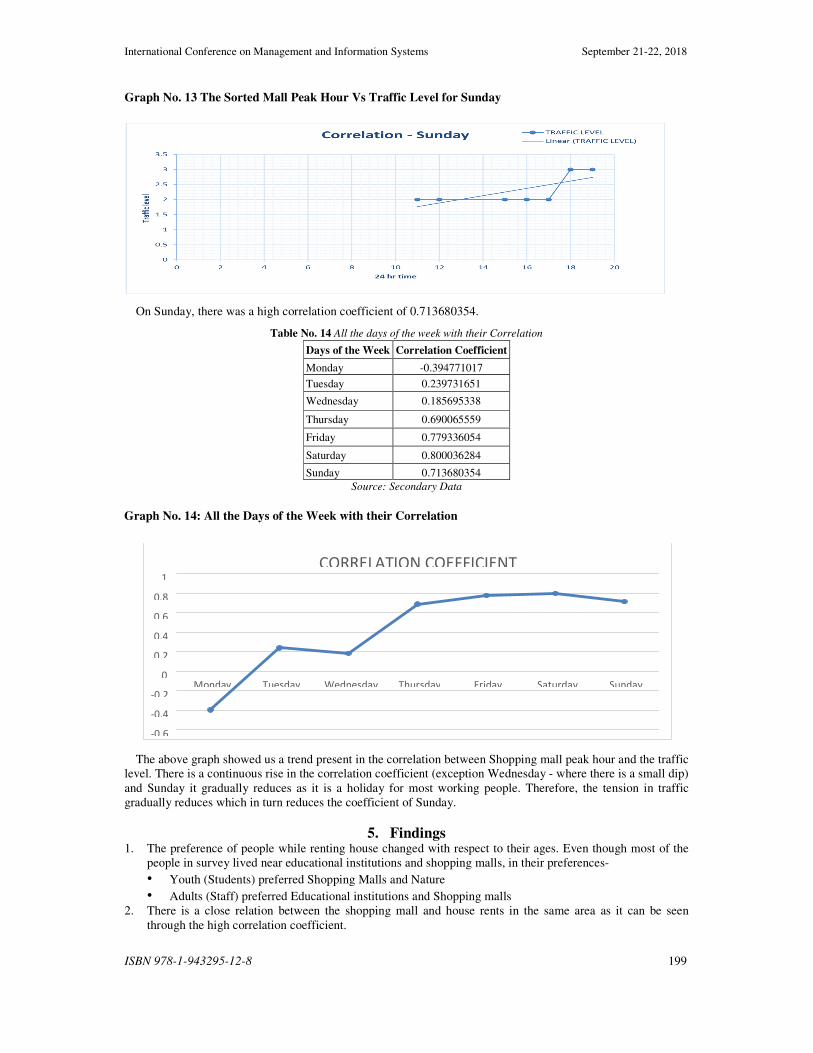
Graph No. 13 The Sorted Mall Peak Hour Vs Traffic Level for Sunday
On Sunday, there was a high correlation coefficient of 0.713680354.
Table No. 14 All the days of the week with their Correlation
Days of the Week Correlation Coefficient
Monday -0.394771017
Tuesday 0.239731651
Wednesday 0.185695338
Thursday 0.690065559
Friday 0.779336054
Saturday 0.800036284
Sunday 0.713680354
Source: Secondary Data
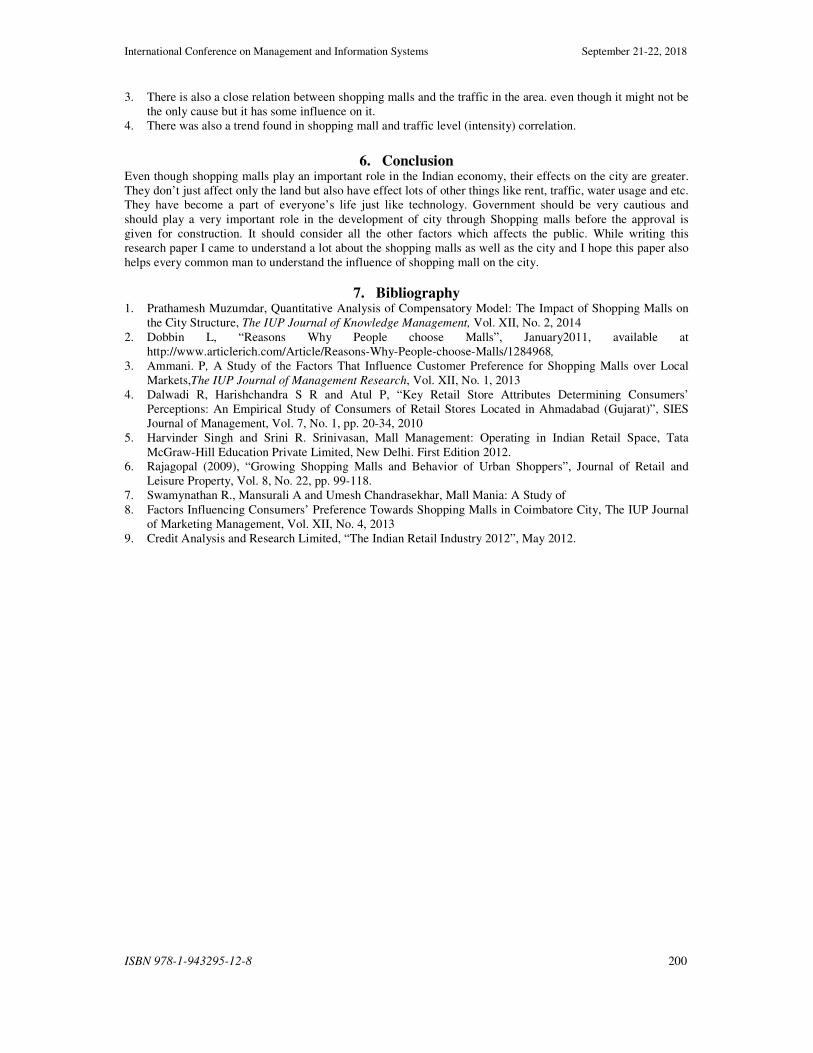
Graph No. 14: All the Days of the Week with their Correlation
The above graph showed us a trend present in the correlation between Shopping mall peak hour and the traffic
level. There is a continuous rise in the correlation coefficient (exception Wednesday - where there is a small dip)
and Sunday it gradually reduces as it is a holiday for most working people. Therefore, the tension in traffic
gradually reduces which in turn reduces the coefficient of Sunday.
5. Findings 1. The preference of people while renting house changed with respect to their ages. Even though most of the
people in survey lived near educational institutions and shopping malls, in their preferences-
• Youth (Students) preferred Shopping Malls and Nature
• Adults (Staff) preferred Educational institutions and Shopping malls
2. There is a close relation between the shopping mall and house rents in the same area as it can be seen
through the high correlation coefficient.
-0.6
-0.4
-0.2
0
0.2
0.4
0.6
0.8
1
Monday Tuesday Wednesday Thursday Friday Saturday Sunday
CORRELATION COEFFICIENT
International Conference on Management and Information Systems September 21-22, 2018
ISBN 978-1-943295-12-8 200
3. There is also a close relation between shopping malls and the traffic in the area. even though it might not be
the only cause but it has some influence on it.
4. There was also a trend found in shopping mall and traffic level (intensity) correlation.
6. Conclusion
Even though shopping malls play an important role in the Indian economy, their effects on the city are greater.
They don’t just affect only the land but also have effect lots of other things like rent, traffic, water usage and etc.
They have become a part of everyone’s life just like technology. Government should be very cautious and
should play a very important role in the development of city through Shopping malls before the approval is
given for construction. It should consider all the other factors which affects the public. While writing this
research paper I came to understand a lot about the shopping malls as well as the city and I hope this paper also
helps every common man to understand the influence of shopping mall on the city.
7. Bibliography 1. Prathamesh Muzumdar, Quantitative Analysis of Compensatory Model: The Impact of Shopping Malls on
the City Structure, The IUP Journal of Knowledge Management, Vol. XII, No. 2, 2014
2. Dobbin L, “Reasons Why People choose Malls”, January2011, available at
http://www.articlerich.com/Article/Reasons-Why-People-choose-Malls/1284968,
3. Ammani. P, A Study of the Factors That Influence Customer Preference for Shopping Malls over Local
Markets,The IUP Journal of Management Research, Vol. XII, No. 1, 2013
4. Dalwadi R, Harishchandra S R and Atul P, “Key Retail Store Attributes Determining Consumers’
Perceptions: An Empirical Study of Consumers of Retail Stores Located in Ahmadabad (Gujarat)”, SIES
Journal of Management, Vol. 7, No. 1, pp. 20-34, 2010
5. Harvinder Singh and Srini R. Srinivasan, Mall Management: Operating in Indian Retail Space, Tata
McGraw-Hill Education Private Limited, New Delhi. First Edition 2012.
6. Rajagopal (2009), “Growing Shopping Malls and Behavior of Urban Shoppers”, Journal of Retail and
Leisure Property, Vol. 8, No. 22, pp. 99-118.
7. Swamynathan R., Mansurali A and Umesh Chandrasekhar, Mall Mania: A Study of
8. Factors Influencing Consumers’ Preference Towards Shopping Malls in Coimbatore City, The IUP Journal
of Marketing Management, Vol. XII, No. 4, 2013
9. Credit Analysis and Research Limited, “The Indian Retail Industry 2012”, May 2012.