Embed Size (px)
Citation preview

SHORELINE ALTERATIONS IN HOOD CANAL AND THE EASTERN STRAIT OF JUAN DE FUCA
Point No Point Treaty Council Technical Report 03-1

Copies of this report may be downloaded at the Point No Point Treaty Council website:
www.pnptc.org

PNPTC Technical Report 03-1
Shoreline Alterations in Hood Canal and the Eastern Strait of Juan de Fuca
Prepared by
Ron Hirschi, Consultant Ted Labbe, Port Gamble S’Klallam Tribe
Alan Carter-Mortimer, Point No Point Treaty Council
March 2003
Point No Point Treaty Council 7999 N.E. Salish Lane
Kingston, Washington 98346
Project funded by Bureau of Indian Affairs “Watershed Restoration Program”
Contract No. GTP00X90310


SUMMARY This report describes the results of an inventory of marine shoreline development throughout Hood Canal and the eastern Strait of Juan de Fuca. It also interprets the results on a large scale and for selected smaller areas. Shoreline features were field mapped by boat employing a Global Positioning System to mark positions. Information collected included shoreline features as points (e.g. docks, jetties, launch ramps, etc.) and as lines (bulkheads and backshore landforms) along the shoreline. Data summaries were generated by attaching point and line features to shoreline Geographic Information System layers and grouping these results by drift cells within sub-regions that were, in turn, grouped within larger regions. A total of 595 km of shoreline was mapped, extending from the Union River near Belfair in Lower Hood Canal to Dungeness Spit near Sequim in eastern Strait of Juan de Fuca. Bulkheads were found to cover approximately 18 % of the total mapped shoreline. Also, a total of 486 docks, 408 stairs, 118 rail launches, 128 launch ramps and 30 jetties/groins were identified. The rate and pattern of shoreline modifications were highly variable across the study area, whether evaluated at the scale of sub-regions or individual drift cells. However, Lower Hood Canal (“the Hook”) exhibited the highest rates of bulkhead armoring (e.g. north shore at 66 % and south shore at 70%) and was among the highest in number and density of non-bulkhead shoreline alteration features. Backshore landforms (such as high bluff, low bluff, barrier beach, saltmarsh) were identified where possible to provide context for the analysis of the shoreline modification patterns along contrasting shore types. However, at some locations, development was so extensive as to preclude the identification of backshore landforms; this situation was most pronounced in Lower Hood Canal and portions of southwest Hood Canal and the Port Townsend area. Accuracy of shoreline feature mapping was evaluated by performing an onshore survey and comparing it with the boat survey at two locations within the study area. The onshore survey was considered to be accurate and therefore the benchmark for assessing the accuracy of the boat-based survey. We estimated a 19% error of omission (i.e., feature identified by onshore but not boat survey) for bulkheads and a 41% omission error for point features (e.g. docks, jetties, etc.), indicating that the estimates of shoreline development in this report are conservative. Eight case studies, distributed throughout the study area are presented to illustrate how anthropogenic modifications can impact natural shoreline functions within zones of a drift cell (i.e. erosion zone, transport zone and deposition/accretion zone). The case studies specifically address the following locations: Lower Hood Canal, South Port Ludlow Bay, Southpoint, Point Julia, John Wayne Marina, Rat Island, Salsbury Point and Twin Spits.

ii

iii
TABLE OF CONTENTS
Summary……………………………………………………………………………… i Table of Contents…………………………………………………………………….. iii List of Figures………………………………………………………………………... iv List of Tables…………………………………………………………………………. vi
INTRODUCTION…………………………………………………………………….. 1
BACKGROUND……………………………………………………………………… 2
How a Drift Cell Functions………………………………………………………... 2 Effects of Shoreline Armoring…………………………………………………….. 4
METHODS…………………………………………………………………………… 6
RESULTS AND DISCUSSION……………………………………………………… 8 Shoreline Armoring………………………………………………………………... 12 Other Shoreline Alterations………………………………………………………... 14 Backshore Landforms……………………………………………………………... 18 Accuracy Assessment……………………………………………………………… 19
CASE STUDIES……………………………………………………………………… 19 Lower Hood Canal………………………………………………………………… 20 South Port Ludlow Bay……………………………………………………………. 25 Southpoint…………………………………………………………………………. 28 Point Julia…………………………………………………………………………. 32 John Wayne Marina……………………………………………………………….. 35 Rat Island………………………………………………………………………….. 38 Salsbury Point and Twin Spits…………………………………………………….. 41
REFERENCES……………………………………………………………………….. 44
APPENDICES………………………………………………………………………... 47

iv
LIST OF FIGURES Figure 1. South shore of Port Ludlow Bay. Illustration of how a drift cell Functions…………………………………………………………………
3
Figure 2. Regions and sub-regions of study area……………………………….….
9
Figure 3. Shoreline modifications by sub-region…………………………………..
10
Figure 4. Distribution of bulkheads throughout study area…….………………….
13
Figure 5. Distribution of docks throughout study area……………..……………...
15
Figure 6. Distribution of launch ramps and jetties throughout study area……..…..
16
Figure 7. Distribution of stairs and rail launches throughout study area. Only stairs independent of other structures are shown………………………..
17
Figure 8. Lower Hood Canal case study. Distribution of bulkheads……………...
22
Figure 9. Lower Hood Canal case study. Distribution of docks, stairs, rail launches, and jetties………………………………………………………
23
Figure 10. Lower Hood Canal case study. High/low bluffs and sandlance spawning areas……………………………………………………………….……...
24
Figure 11. Lower Hood Canal case study. Bulkheading in drift cell MA 9-1….……
25
Figure 12. Lower Hood Canal case study. Historic changes projected along a Lower Hood Canal shoreline segment near the town of Union…………………...
27
Figure 13. South Port Ludlow case study. Shoreline features within drift cell JE 6…
28
Figure 14. Southpoint case study. Accretionary backshore landforms, bulkheads and sandlance spawning grounds for drift cells JE 12 (north of Bridgehaven jetty) and JE 13 (south of Bridgehaven jetty)……………...
30
Figure 15. Southpoint case study. Illustration of changes to the Southpoint spit over time……….………………………………………………………………..
32
Figure 16. Point Julia case study. Backshore landforms, shoreline features and sandlance spawning grounds for drift cell KS 2-2…………………………
34

v
LIST OF FIGURES (Continued)
Figure 17. John Wayne Marina case study. Backshore landforms and marina within drift cells JF 17-2 and JF 17-3…………………………….………..
37
Figure 18. John Wayne Marina case study. Docks, stairs and launch ramps within drift cells JF 17-2 and JF 17-3…………………………………………….
38
Figure 19. Rat Island case study. United States and Geodetic Survey map T-582, 1865………………………………………………………………...
40
Figure 20. Rat Island case study. Launch ramp and backshore landforms within drift cell JEF 5…………………………………………………………………...
41
Figure 21. Salsbury Point case study. United States Coast and Geodetic Survey map T-585, 1856…………………………………………………………...
43
Figure 22. Twin Spits case study. United States Coast and Geodetic Survey map T-669, 1857…………………………………………………………...
44

vi
LIST OF TABLES
Table 1. Summary results for majority of shoreline structures by region and sub-region within Hood Canal and Strait of Juan de Fuca …………………
11
Table 2. Typical shoreline modification impacts by drift cell zone…………………..
20
Table 3. Relative degree of impacts to drift cell zones in Lower Hood Canal…...…..
23
Table 4. Relative degree of impacts to drift cell zone in South Port Ludlow Bay…..
29
Table 5. Relative degree of impacts to drift cell zone at Southpoint………………...
31
Table 6. Relative degree of impacts to drift cell zones at Point Julia………………..
33
Table 7. Relative degree of impacts to drift cell zones at Pitship Point……………...
36
Table 8. Relative degree of impacts to drift cell zone at Rat Island………………….
39

“There is no final ecological truth. All knowledge is a current approximation, and each addition to that knowledge is but a small, incremental step toward understanding. Not only are ecosystems more complex than we think, they are more complex than we can think.”
Jack Ward Thomas, 1992 INTRODUCTION The shallow nearshore of Hood Canal and the eastern Strait of Juan de Fuca provides significant habitat for a variety of fish and shellfish, notably juvenile salmon, sandlance, herring, clams, oysters, and many prey species that sustain both marine and terrestrial food webs. This habitat is naturally dynamic, changing in response to shoreline processes that link adjacent watersheds and backshore uplands with marine shores. Interrelated pieces of this ecosystem create a staggering complexity that defies simple characterizations and understanding as the above quotation from Jack Ward Thomas suggests. In spite of the importance of the nearshore habitat to regional fish and wildlife populations, there is little information on habitat status and condition for Hood Canal and the eastern Strait of Juan de Fuca. Numerous habitat assessments have been completed for watersheds in this region. Thom et al (1994) summarize biological impacts due to armoring and MacDonald et al (1994) discuss impacts of shoreline armoring on geological processes and physical features. But there are no large-scale inventories of modifications to habitats in Hood Canal and the eastern Strait. The impacts of bulkheads and other forms of armoring can reduce or eliminate productive, shallow water habitats through filling or alteration of sediment sources, sediment transport, and accretion of these sediments along the nearshore. Also, as the shoreline becomes armored with these structures, increased wave energy can erode and coarsen beach substrates, preventing the establishment of eelgrass that is adapted to finer sediments. These changes, along with shading from piers or docks and removal of riparian vegetation can alter habitat structure, reducing or interrupting eelgrass beds while degrading habitat conditions for juvenile salmon. The magnitude, distribution and cumulative effects of shoreline modification have not been quantified at either a landscape scale or at appropriate finer scale resolution (i.e., the scales of habitat to which juvenile salmon respond), and thus we lack an understanding of how significant these changes have been for salmon. This project is part of a larger program sponsored by the Point No Point Treaty Council to map and inventory nearshore habitat resources of Hood Canal and the eastern Strait of Juan de Fuca. Under this project, shoreline modifications and the natural backshore environment were mapped by boat using a global positioning system (GPS). A parallel project of this same program is using hyperspectral remote sensing to map eelgrass patch structure and contiguity (Garono et al. 2000). Ultimately, the data sets of these two projects will be combined to assess the relationship between shoreline modifications and eelgrass habitat.

2
This report describes results from the shoreline modification mapping effort and provides data summaries useful to resource managers and individuals interested in the condition of nearshore habitat in Hood Canal and the eastern Strait. The report includes a Background section in which we outline important natural processes that shape the nearshore marine environment and dependent biological resources. The Methods section follows in which we describe our approach to mapping and quantifying shoreline modifications and the natural backshore environment in the study area. Also in the Methods section, we discuss error quantification and alternative survey techniques that were evaluated. The Results and Discussion section summarizes the study results, noting patterns of shoreline developments. The Case Studies section discusses shoreline examples within the study area to illustrate complexities of the nearshore ecosystem and how specific locations have responded to human impacts. BACKGROUND Nearshore ecological processes are intimately tied to the transport of water, sediment, and wood into and along the shoreline. Geologists recognize “drift cells” as discrete zones of shoreline sediment recruitment, transport, and deposition. The cells function much like a watershed, moving sediment that falls from bluffs and depositing it on beaches. Much like a river transporting and depositing sediment along its channel, this movement of beach sediment and associated organic debris shapes shoreline features while creating and maintaining the long-term integrity of nearshore habitats. Sandy beaches, spits, and points are all examples of the formations created by the transport and deposition process. In general, a beach with finer sand and gravel is a site of deposition also known as an accretion beach. Source sediments for these beaches are often found far “updrift” where eroding bluffs contribute the initial materials for the eventual accretion. Spits and similar hooks or points represent areas of accretion, but they often form at the terminus or starting point of a drift cell. Cuspate spits are those familiar, pointed shoreforms created where two drift cells converge, colliding where the forces of wind and water often attract high concentrations of marine life, including adult salmon and those who fish for them. How A Drift Cell Functions In an idealized drift cell, there are three zones where specific processes predominate. In the EROSION ZONE sediment is recruited to intertidal areas; sediment is moved along the beach in the TRANSPORT ZONE; and sediment settles onto the beach to create accretion features in the DEPOSITION ZONE (Tanner 1974). Johannessen (1999) and Hirschi (1999) provide a textbook example of each zone along a drift cell mapped along the south and east shore of Port Ludlow Bay as shown in Figure (1). In the Erosion Zone (at A in Figure 1), sediments fall from bluffs at Tala Point and enter the nearshore. High, unvegetated “feeder bluffs” near the tip of the point are highly erosive, while lower, partially vegetated “contributing bluffs” at the southeast entrance to the bay (at B in Figure 1) supply woody debris and smaller volumes of sediment to the beach.

3
Figure 1. South shore of Port Ludlow Bay: Illustration of how a drift cell functions.

4
Both standing trees and woody debris are recognized as critical elements in shoreline ecology. Woody debris on beaches and standing trees and other vegetation on the backshore offer shade and cover for juvenile fish and their prey. They also help stabilize the supply and movement of sediment to and along the shoreline. Much of the woody debris in the nearshore originates from bluffs that serve as important supply points for sediment and wood along shore segments. In the Transport Zone (general vicinity of C in Figure 1), sediments are carried along the beach by wind driven waves. Eelgrass lines this sediment pathway, partially holding the substrate in place with its roots. Eelgrass beds typically form in rather narrow bands concentrated in tidal elevations between approximately +1m and -2m, relative to mean lower low water, where it persists in mud to sand-gravel substrates. The presence of eelgrass is inhibited when the substrate coarsens (Phillips 1984) through the elimination of sediment recruitment updrift or where shading from structures such as docks occurs (Simenstad et al. 1998). In the Deposition Zones, sediments settle to form a sand accretion beach (at C in Figure 1) and a long sand spit (at D) that is favored by sandlance for spawning (Hirschi 1999). While homes line the spit, it is notable for its lack of bulkheading. A tidal channel at the tip of the spit marks the terminus of the drift cell. This channel links the bay with a tidal lagoon formed behind the spit, a lagoon notable for its use as rearing and refuge habitat by juvenile salmonids. Effects Of Shoreline Armoring Human modification due to shoreline clearing can increase erosion rates, adding more sediment to the transport zone, which can ultimately increase the accretion of spits and other beaches. At times, artificial nourishment of the beach is employed to increase sediment supplies to impacted accretion beaches. Jetties, groins, launch ramps, and bulkheads can hinder or stop sediment flow, causing spits to erode rather than accrete. Historic loss of accretion habitat can be seen most clearly at Southpoint in eastern Jefferson County, a site described in more detail below as a case study that exhibits this form of habitat loss. Stream ecologists caution that “we all live downstream” when talking about the wisdom of considering impacts to the entire watershed due to alteration at a single site. Likewise, it is important to view the nearshore environment in a drift cell context. Shoreline property owners all “live downdrift” of others and impacts to surprisingly small segments of shoreline, bluff, or other nearshore habitat can also have significant impacts along the path of the drift cell. Obvious interest along the drift cell includes the need to protect beaches from unplanned erosion. Homes and other waterfront property may be threatened in some areas due to human modifications many miles updrift. Likewise, homes and other property are often threatened when built on highly erosive feeder bluffs, which, by definition slump and contribute essential sediments to the beaches below. Far more often, fish and wildlife habitat has been lost or altered as historic logging and land clearing have stripped essentially all the original old growth and much of the younger growth of trees along contributing bluffs and other backshore habitat.

5
Additionally, the placement of fill atop low-lying nearshore areas such as spits and saltmarsh has resulted in habitat loss that is extensive, but difficult to measure. Bortelson et al (1980) reported that of 91 sq km of original saltmarsh, 55 sq km remained intact in their study of 11 major Puget Sound river mouths. Simenstad (1998) described losses of substantial amounts of habitats within subestuary deltas of Hood Canal. These subestuaries form at the mouth of rivers and streams and consist of marsh, lagoon, tidal slough, spit, and other land and shoreforms that comprise the transition zone between fresh and salt water. Each of the subestuaries along the length of Hood Canal and the eastern Strait serves as a stepping-stone along the migratory pathway of juvenile salmonids. Other nearshore habitats, especially eelgrass beds, offer a kind of linked highway system that connects the streams and subestuaries, providing food and a refuge habitat as well. As many authors have pointed out, disruption of sediment transport and deposition along drift cells can result in loss or alteration of critical eelgrass habitat and dependent species (MacDonald et al 1994; Canning and Shipman 1995). One of the species highly dependent on fine sediments deposited along accretion beaches is the sandlance. Also known as candlefish, they spawn in the upper intertidal (from about +5 feet in tidal elevation to approximately the mean high water line) in sediments that range in size from sand particles to a mixture of sand and gravel up to 3cm in diameter (Pentilla 1995). Bulkheads can block fine sediments from entering the transport zone along spawning beaches or increase wave energy, coarsening the sediments fronting them. For example, sandy beaches can change to areas with substrates of cobble and gravels above the 3cm size needed for successful sandlance spawning. Additionally, many bulkheads extend seaward, well beyond the mean high water mark, effectively eliminating former and/or potential sandlance spawning habitat. These physical impacts of bulkheads on the nearshore affect many other species as well (Thom et al. 1994). Recent research suggests that fine sediments further offshore may be critical for sandlance over wintering habitat and need to be monitored as well (Hoines and Bergstad 2000). Sandlance are an important forage fish of salmon, seabirds, and marine mammals (Hart 1973) and the loss of spawning or other critical habitats will have indirect impacts on other species. Human modification to the nearshore also eliminates or alters salmon habitat more directly. As juvenile salmon migrate from the streams of their birth to more distant marine waters, all species appear to use a range of subestuarine rearing and feeding habitats within stream mouths as well as tidal lagoons with no appreciable freshwater input (Doty and Hirschi 2001). Juvenile Chinook, chum, pink, and coho are known to move up and into saltmarsh lined lagoons formed in the backwaters of accretion beaches (Lichatowich 1993; Doty and Hirschi 2001). Juvenile chum and pink are especially dependent on shallow nearshore waters, using eelgrass beds as a kind of highway as they migrate to the Pacific (Simenstad 1998). Eelgrass also forms the base of many marine food webs (Albright et al 1980) and may be the most important source of organic matter in the nearshore (Simenstad and Wissmar 1985). The cumulative impacts from loss of eelgrass, accretion beaches, lagoons, overhanging trees, and other natural features of the complex nearshore ecosystem contribute to the declines in salmon habitat in Hood Canal and the eastern Strait. Our

6
study is an attempt to understand the extent of human modifications in this area and to begin a discussion of the impacts and potentials for restoration and protection of the nearshore components. METHODS
Shoreline features were mapped by boat employing a Global Positioning System (GPS) to mark positions. These positions were then manually snapped to the shoreline in a Geographic Information System (GIS) to locate the positions of the features along the shoreline. At the project initiation, we evaluated several shoreline mapping approaches and alternatives. Oblique aerial photographs, available from the Washington Department of Ecology web site (http://apps.ecy.wa.gov/shorephotos/), proved useful for pre-survey screenings and post-survey validation checks, but could not be used for precisely mapping features due to lack of geo-referencing and the frequency of obscuring vegetation along the shoreline. Shore-based GPS mapping proved infeasible due to limitations of landowner permission, physical access, and extensive survey distances. Another alternative, employing a combination of high-precision GPS and laser rangefinder capabilities to map shoreline features from fixed offshore positions, was also evaluated and rejected due to equipment cost and manpower constraints. However, this approach would have markedly improved precision and reduced overall data processing time and, though we could not pursue this approach, we recommend future surveys of this nature thoroughly evaluate and consider this technique. In the end, we selected a less precise, boat-based, handheld GPS survey approach that generally provided the surveyor a clear view of all shoreline structures and backshore landform types, and could be implemented by one person under most conditions.
Field surveys were performed employing a handheld GPS unit (Trimble GeoExplorer II), mounted to the center console of a small outboard boat. The senior author navigated along the shoreline at or near high tide and approximately 30 to 100 m offshore, logging features as points (e.g. docks, jetties, launch ramps, stairs, changes to natural backshore landforms) or as lines (e.g. bulkheads) along a survey route and attributing these features according to the following data dictionary:
• Bulkhead (line), noting angle (vertical, sloped), material (concrete, rock, wood, other), and lowest position relative to ordinary high water (at, above, below)
• Dock (point) • Rail Launch (point) • Launch Ramp (point) • Jetty or Groin (point) • Stairs (point), only mapped where they occurred as isolated features, not when
they occurred in association with a dock, bulkhead or other more intrusive large structure.
• Marina (line) • Fill (line) • Other (point or line, miscellaneous features not described above) • High Bluff (>30 feet in height, point), noting vegetation category: vegetated
(covering >70% of bluff face, by area), partially vegetated (30-70%), and unvegetated (<30%)

7
• Low Bluff (<30 feet in height, point), noting same vegetation categories as above • No Bluff (point), noting dominant backshore landform: upland, saltmarsh,
accretion type beach (e.g., spits, barrier beaches, and berms following the definitions of Johannessen (1999))
The latter three shoreline landform types were recorded as points where there was a change in the backshore geomorphology along the survey route; during subsequent data processing these points were then used to break the shoreline into segments representing discrete backshore landform types. We mapped backshore landform types to characterize the geomorphic context for shoreline modifications across the study area; armoring of high and low bluffs can eliminate sites of critical sediment and wood recruitment to the nearshore environment, and the significance of this modification is often obscured by simply reporting overall shoreline armoring rates. In the results section, we provide overall shoreline armoring rates as well as rates for high and low bluff-backed shore segments. We acknowledge this treatment of all bluff-backed shore segments as erosion shoreforms is a crude simplification; not all bluffs in Puget Sound are sites of natural erosion even in an unmodified state. Nonetheless, this treatment provides a rough gauge of shoreline armoring rates along eroding shore segments, which provides additional context on impacts from human modification to the nearshore estuarine environment.
Our approach was designed to characterize points and events along a linear shoreline, but was poorly suited for mapping fill or estuarine marsh habitat types which are better defined as areas or polygons in a GIS. In practice, it was very difficult to unequivocally identify areas of fill from the perspective of a boat offshore, and thus we caution that our measures of the linear extent of fill .underestimate the true extent of this alteration type by a considerable margin. Similarly, extensive shoreline development in certain areas (such as Lower Hood Canal) obscured the natural backshore landform type rendering our estimates of different landform types in heavily developed segments of questionable validity (see Shoreline Armoring in Results and Discussion section for more discussion of this problem).
At the conclusion of each sampling day, GPS files were downloaded and e-mailed to the Point No Point Treaty Council’s GIS technician for geo-correction and processing. The first step in processing the data was to perform differential correction using Trimble’s Pathfinder software and correction files from the Thurston County Roads and Transportation Department. The data were then exported into ESRI ArcView Shapefiles using Pathfinder’s export utility. All data was projected into the Universal Transverse Mercator (UTM) coordinate system, zone 10 North, datum WGS 84, units meters using the same Pathfinder export utility. This coordinate system was chosen to match datasets used in the hyperspectral data acquisition efforts run in concert with this study (see Introduction).
Since the data collection had been performed offshore of the actual features it was determined that the features needed to be connected to the actual shoreline. This was accomplished by snapping all features to the Washington Department of Natural Resources’ shoreline coverage, which is a subset of the hydrographic layer. The snapped datasets were then visually checked to ensure a reasonable alteration of the original GPS data. Several sources of error reduce the overall precision of mapped features including distance of the survey boat from shore, the snapping procedure used to “fit” features to

8
the digital shoreline layer, as well as sources of error inherent to DOE’s drift cell and DNR’s shoreline GIS coverages to which we attached our data.
To evaluate the accuracy of our approach relative to shore-based GPS mapping, we compared our boat-based, “snapped” data to features mapped on foot employing a high-resolution Trimble PathFinder Pro-XL GPS over two shoreline segments, a 6.3 km segment near Lofall, WA and a 3.3 km segment near Shine, WA. By this comparison, we estimated percent omissions (e.g. “missed” features) and horizontal accuracy errors (e.g. in the length and position of features in meters).
Data summaries were generated by attaching point and line features to the shoreline GIS layers and grouping these results by drift cells within sub-regions that were, in turn, grouped within larger regions. Regions are convenient geographical groupings within the entire project area; for example, Strait, Port Townsend, Northwest Hood Canal, etc. A sub-region is a “cluster” of drift cells that are contiguous and generally feed a common depositional landform such as a spit, embayment or point. Regions and sub-regions are depicted in Figure 2. RESULTS AND DISCUSSION
From August 1999 through December 2000, 595 km of shoreline were mapped along Hood Canal and the eastern Strait of Juan de Fuca, extending from the mouth of the Union River near Belfair to Dungeness Spit near Sequim. The rate and pattern of shoreline modifications were highly variable across the study area, whether evaluated at the scale of sub-regions or individual drift cells. Table 1 provides information on drift cell sub-regions including: total length, length and percentage of armored shoreline, and the number and density (number/km) of docks, launch ramps, jetties, rail launches, and stairs. (The same information for individual drift cells is provided in Appendix 1.) Sub-regions exhibited shoreline-armoring rates that ranged from 0-70% (percent of shoreline length armored), and overall the densities of docks/jetties/ramps/rail launches/stairs were also highly variable, ranging from 0.2 to 8.2 per km (Table 1). At this broad scale, shoreline armoring rates did not correlate well with density of other human-origin features such as docks, jetties, ramps, rail launches, or stairs (Figure 3); that is, highly armored sub-regions did not necessarily exhibit a high density of other human-origin features. At a finer scale, there was also significant variation in development rates and patterns on a per drift cell basis across the study area (Appendix 1) which is discussed in more detail below. Figures 4 through 7 depict the distribution of bulkheads and other human built features across the study area.

9
Foulweat her
Driftwoo d Key
Gamble Bay
Lofall
SeabeckStavis
Anderson
Holly
De watto
Ta huya
North Shore
Union
South Shore
Skokomish
Lilliwaup
Ayock
Hamma Hamma
Triton
Pleasant Harbor
Dosewallips
Jackson CovePt Wh itney
Quilcene
Tarboo
Ha zel Pt
Thorndyke
Shine
Whiskey Spit
Pt Ludlow
Mats MatsOlele Pt
Oak Bay
E Mar ro wstone
Flagler
Mystery Bay
Kilsut West
Hadlock
Gov Cut
Pt T ownsend
North Beach
Disco very
Rocky Pt
Seq uim Bay
Gibson Spit
Jamestown
Duckabush
Strait of Juan De Fuca Region
Port Townsend Region
Northwest Hood CanalRegion
Northeast Hood Canal Region
Southwest Hood Canal Region
Southeast Hood CanalRegion
Lower Hood Canal Region
Dabob BayRegion
Dabob BayRegion Region name-
Region division point-
Sub-region division point-
Dosewallips Sub-region name-
Figure 2. Regions and sub-regions of study area.
N
EW
S
5 0 5 10 Miles
5 0 5 10 Kilometers

10
Figure 3. Shoreline modifications by sub-region
0
15
30
45
60
75
Foul
wea
ther
Drif
twoo
d K
eyG
ambl
e B
ayN
ukes
Sea
beck
Sta
vis
And
erso
nH
olly
Dew
atto
Tah
uya
Nor
th S
hore
Uni
onS
outh
Sho
re
Sko
kom
ish
Lilli
wau
pA
yock
Ham
ma
Ham
ma
Trit
onD
ucka
bush
Ple
asan
t Har
bor
Dos
ewal
lips
Jack
son
Cov
eP
t Whi
tney
Qui
lcen
eTa
rboo
Haz
el P
tT
horn
dyke
Squ
amis
h H
arbo
rW
hisk
ey S
pit
Pt L
udlo
wM
ats
Mat
sO
lele
Pt
Oak
Bay
E M
arro
wst
one
Flag
ler
Mys
tery
Bay
Kils
ut W
est
Had
lock
Gov
Cut
Pt T
owns
end
Nor
th B
each
Dis
cove
ryR
ocky
Pt
Seq
uim
Bay
Gib
son
Spi
tJa
mes
tow
n
Sub-region
% o
f Sho
relin
e A
rmor
ed
0
1
2
3
4
5
6
7
8
9
Doc
k/je
tty/
ram
p/la
unch
/sta
ir d
ensi
ty
(#/k
m)
% of Shorel ine Armored Dock/jetty/ramp/launch/stair Density

11
Table 1. Summary results for majority of shoreline structures by region and sub-region within Hood Canal and eastern Strait of Juan de Fuca. Also shown are the lengths of high and low bluff- backed shoreline and associated amounts of bulkheading (see text under Shoreline Armoring).
Regions & Total
Sub-regions Lgth. (m) Lgth.(m) % No. Density2
No. Density2
No. Density2
No. Density2
No. Density2
TotalNortheast Hood Canal Region Lgth. Lgth. %Foulweather 4,207 284 6.8 1 0.2 0 0.0 0 0.0 1 0.2 3 0.6 2,079 105 5.0Driftwood Key 7,504 2,646 35.3 44 5.9 0 0.0 1 0.1 0 0.0 8 1.0 3,860 405 10.5Gamble Bay 16,380 2,045 12.5 9 0.5 1 0.1 3 0.2 0 0.0 14 0.9 9,433 1,075 11.4Lofall 27,951 6,661 23.8 17 0.6 0 0.0 7 0.2 10 0.3 52 1.8 21,291 4,472 21.0Seabeck 13,340 5,231 39.2 4 0.3 0 0.0 3 0.2 18 1.3 8 0.6 8,655 3,715 42.9
Totals 69,381 16,868 24.2 75 1.1 1 0.0 14 0.2 28 0.4 83 1.2 45,319 9,771 21.6Southeast Hood Canal RegionStavis 8,376 1,056 12.6 0 0.0 0 0.0 1 0.1 0 0.0 8 1.0 5,239 608 11.6Anderson 12,085 1,927 16.0 1 0.1 0 0.0 0 0.0 0 0.0 1 0.1 9,684 1,382 14.3Holly 16,842 843 5.0 2 0.1 0 0.0 2 0.1 0 0.0 6 0.3 13,658 187 1.4Dewatto 15,473 2,482 16.0 5 0.3 0 0.0 2 0.1 2 0.1 5 0.3 7,298 391 5.4
Totals 52,776 6,309 12.0 8 0.2 0 0.0 5 0.1 2 0.0 19 0.4 35,879 2,568 7.2Lower Hood Canal RegionTahuya 9,557 3,278 34.3 7 0.7 0 0.0 8 0.8 4 0.4 0 0.0 82 81 99.4North Shore 16,454 10,786 65.6 21 1.2 8 0.5 21 1.2 18 1.1 0 0.0 0 0 0.0Union 13,788 2,911 21.1 11 0.8 1 0.0 3 0.2 0 0.0 0 0.0 0 0 0.0South Shore 22,885 16,033 70.1 146 6.4 1 0.0 12 0.5 3 0.1 1 0.0 0 0 0.0
Totals 62,684 33,008 52.7 183 2.9 9 0.1 43 0.7 25 0.4 1 0.0 82 81 99.4Southwest Hood Canal RegionSkokomish 15,710 3,130 19.9 12 0.7 2 0.1 3 0.2 23 1.5 0 0.0 435 8 1.8Lilliwaup 10,619 4,917 46.3 17 1.6 3 0.3 1 0.1 11 1.0 0 0.0 1,445 8 0.6Ayock 7,448 2,934 39.4 1 0.1 1 0.1 4 0.5 6 0.8 3 0.4 4,775 1,774 37.2Hamma Hamma 9,254 1,114 12.0 2 0.2 1 0.1 4 0.4 0 0.0 8 0.9 4,115 510 12.4Triton 9,373 1,962 20.9 7 0.7 1 0.1 5 0.5 13 1.4 15 1.6 7,219 930 12.9Duckabush 11,529 1,007 8.7 6 0.5 1 0.1 4 0.3 2 0.2 25 2.2 7,091 539 7.6
Totals 63,934 15,064 23.6 44 0.7 9 0.1 21 0.3 55 0.9 51 0.8 25,079 3,770 15.0Dabob RegionPleasant Harbor 5,512 455 8.3 17 3.1 0 0.0 0 0.0 0 0.0 29 5.3 4,642 455 9.8Dosewallips 9,477 1,467 15.5 1 0.1 0 0.0 2 0.2 0 0.0 20 2.1 3,369 215 6.4Jackson Cove 5,642 794 14.1 4 0.7 0 0.0 2 0.4 3 0.5 7 1.2 3,906 194 5.0Pt Whitney 4,579 170 3.7 2 0.4 0 0.0 1 0.2 0 0.0 1 0.2 3,083 48 1.6Quilcene 15,282 1,373 9.0 0 0.0 0 0.0 0 0.0 0 0.0 4 0.3 7,685 372 4.8Tarboo 36,285 1,913 5.3 3 0.1 2 0.1 1 0.0 0 0.0 11 0.3 23,070 454 2.0
Totals 76,777 6,172 8.0 27 0.4 2 0.0 6 0.1 3 0.0 72 0.9 45,754 1,739 3.8Northwest Hood Canal RegionHazel Pt 10,838 188 1.7 4 0.4 0 0.0 2 0.2 0 0.0 5 0.5 9,479 31 0.3Thorndyke 20,993 1,703 8.1 2 0.1 0 0.0 0 0.0 0 0.0 9 0.4 13,522 323 2.4Shine 8,996 2,429 27.0 26 2.9 1 0.1 4 0.4 0 0.0 14 1.6 4,620 1,160 25.1Whiskey Spit 17,000 1,196 7.0 0 0.0 0 0.0 2 0.1 0 0.0 23 1.4 11,875 1,037 8.7
Totals 57,826 5,517 9.5 32 0.6 1 0.0 8 0.1 0 0.0 51.0 0.9 39,496 2,551 6.5Port Townsend RegionPt Ludlow 13,130 1,315 10.0 15 1.1 1 0.1 0 0.0 1 0.1 5 0.4 9,680 1,186 12.2Mats Mats 7,731 590 7.6 22 2.8 1 0.1 1 0.1 0 0.0 10 1.3 4,954 213 4.3Olele Pt 2,772 125 4.5 2 0.5 0 0.0 5 1.6 0 0.0 16 5.6 2,089 85 4.1Oak Bay 11,069 1,730 15.6 1 0.0 0 0.0 3 0.2 0 0.0 8 0.7 6,964 347 5.0E Marrowstone 12,130 254 2.1 1 0.1 0 0.0 0 0.0 0 0.0 17 1.4 10,751 72 0.7Flagler 5,436 224 4.1 1 0.2 0 0.0 2 0.4 0 0.0 0 0.0 3,404 55 1.6Mystery Bay 4,771 1,076 22.5 7 1.4 0 0.0 1 0.2 0 0.0 8 1.6 2,648 716 27.1Kilsut West 15,735 790 5.0 3 0.2 1 0.1 1 0.1 1 0.1 12 0.7 10,933 671 6.1Hadlock 19,484 2,121 10.9 11 0.5 2 0.1 6 0.3 1 0.1 1 0.1 6,611 118 1.8Gov Cut 4,416 0 0.0 0 0.0 1 0.2 0 0.0 0 0.0 1 0.2 1,471 0 0.0Pt Townsend 13,965 3,112 22.3 13 0.9 1 0.0 2 0.1 0 0.0 1 0.1 3,209 172 5.4
Totals 110,639 11,336 10.2 74 0.7 7 0.1 20 0.2 3 0.0 77 0.7 62,712 3,635 5.8Strait RegionNorth Beach 9,508 582 6.1 1 0.1 1 0.1 2 0.2 0 0.0 3 0.3 8,141 267 3.3Discovery 43,200 7,419 17.2 13 0.3 0 0.0 7 0.2 2 0.0 31 0.7 26,163 1,766 6.7Rocky Pt 8,685 0 0.0 0 0.0 0 0.0 1 0.1 0 0.0 1 0.1 6,314 0 0.0Sequim Bay 25,367 2,774 10.9 29 1.1 0 0.0 2 0.1 0 0.0 19 0.7 11,834 1,728 14.6Gibson Spit 5,036 80 1.6 0 0.0 1 0.1 2 0.3 0 0.0 0 0.0 2,026 0 0.0Jamestown 8,540 596 7.0 1 0.1 1 0.1 1 0.1 1 0.1 0 0.0 207 0 0.0
Totals 100,336 11,450 11.4 44 0.4 2 0.0 13 0.1 3 0.0 54 0.5 54,685 3,760 6.9
Grand Totals 594,354 105,722 17.8 486 0.8 30 0.1 129 0.2 118 0.2 408 0.7 309,007 27,876 9.0
1 Includes only stairs observed independent of other structures.
2 Density is measured as no. per km.
High and Low Bluff
Bulkheaded
Bulkheads Docks Jetties Launch Ramps Rail Launches Stairs1
12
Following is a detailed description of the results considering in order: shoreline armoring, other shoreline alterations, and backshore landforms. Shoreline Armoring A total of 105.7 km of bulkheads covering approximately 17.8% of the total surveyed shoreline length were mapped in the study area (Table 1). Percent armoring along individual sub-regions ranged from 0% at Rocky Point (within the Strait region) to over 70% at South Shore in Lower Hood Canal. Armoring rates of high and low bluff-backed shore segments (sites of presumed active material recruitment to the nearshore environment) ranged from 0% at seven sub-regions clustered largely along the Strait and in Lower Hood Canal, to 37% and 43% at Ayock and Seabeck, respectively (see right side of Table 1). At one sub-region, Tahuya, 99% of the high and low bluff-backed shoreline was armored.
Our efforts to estimate shoreline armoring along high and low bluff-backed shore segments were confounded in certain areas of Hood Canal where extensive development obscured the natural shoreline geomorphology. As a result, our reported armoring rates for high and low bluff-backed shoreline are likely conservative and underestimate the true rate of armoring along eroding shore segments for heavily-developed areas (e.g. Lower Hood Canal); in these areas the built environment and intertidal fill frequently obscured views of natural backshore landform types to such an extent that determining their pre-modified state was impossible using our approach. One indicator of this effect was the percentage of shoreline that could not be classified (identified generically as “upland”). This statistic was estimated at less than 30% for all sub-regions outside of Lower Hood Canal with the exceptions of Lilliwaup (86%), Port Townsend (55%), Hadlock (37%) and Government Cut (31%) (Appendix 2). However, for the entire Lower Hood Canal region, 72% of the shoreline was identified as no bluff upland, indicating that considerable shoreline lengths could not be classified in a specific backshore landform class as a result of human alteration.
Though bulkheads were widely distributed throughout the study area (Figure 4) several regional patterns and individual areas are worthy of mention. Lower Hood Canal region exhibited the highest rates of armoring in all Hood Canal and the eastern Strait; rates of armoring were particularly heavy in the North Shore (66%), South Shore (70%), and Tahuya (34%) sub-regions (Table 1). But extensive armoring was also observed in the Southwest region at the sub-regions of Lilliwaup (46%) and Ayock Point (39%). Also of note in Lower Hood Canal was the frequency and extent of bulkhead and home construction on fill seaward of the ordinary high water line, effectively isolating the backshore environment from the adjacent nearshore environment (see Figure 8 presented below in the Lower Hood Canal case study). Other areas of high shoreline armoring rates included sub-regions at Seabeck (39%), Driftwood Key (35%), Shine (27%), Lofall (24%), Mystery Bay (22%), and Port Townsend (22%). In Southwest Hood Canal, long continuous sections of loosely placed, sloped rockery were observed at the foot of low bluffs just below Highway 101. A similar condition was observed at the head of Discovery Bay where an abandoned railroad grade, constructed at the base of high forested bluffs, blocks material recruitment to the nearshore environment.

13
Por t Townsend
Sequim
Por t Lud lo w
Quilcene
Brinnon
Lofall
Sea beck
Union
Belfair
Lil liwaup
Bulkheads
N
EW
S
5 0 5 10 Miles
5 0 5 10 15 20 Kilometers
Figure 4. Distribution of bulkheads throughout study area.

14
Areas especially notable for lack of armoring included sub-regions in the vicinity of Rocky Point (0%), Gibson Spit (1.6%), Hazel Point (east shore of Toandos Peninsula, 1.7%), East Marrowstone Island (2.1%), Point Whitney (3.7%), Fort Flagler (4.1%), Olele Point (4.5%), Holly (5%), and the west shore of Kilsut Harbor (east Indian Island, 5%) (Table 1 and Figure 3). These sub-regions were among the most pristine and ecologically dynamic across the study area, with intact, forested bluffs and abundant large woody debris, owing largely to their undeveloped state.
Patterns of shoreline armoring at the scale of individual drift cells generally paralleled those noted above for the sub-regions in which they occurred (Appendix 1), with a few exceptions. In several instances, the clustering of drift cells into sub-regions for purposes of data summarization obscured important finer-scale patterns, “averaging out” areas of particularly heavy development as well as small, relatively pristine drift cells. For example, rates of shoreline armoring along select drift cells of the North Shore sub-region in Lower Hood Canal (with an overall armoring rate of 65%) ranged from 57 to 100% within individual component drift cells. Similarly, along the Triton shore sub-region, overall armoring rates of nearly 21% were observed, though one component drift cell (MA-1-2) measuring only 590 m in length exhibited armoring rates of just 4.6%. Thus our data summaries hide potentially important variation and users of the data are encouraged to refer to Appendix 1, for specific drift cell-level information. Other Shoreline Alterations A total of 486 docks, 408 stairs, 118 rail launches, 129 launch ramps, and 30 jetties/groins were mapped in Hood Canal and the eastern Strait of Juan de Fuca (Table 1). The distribution of docks, launch ramps, jetties, rail launches and stairs is depicted in Figures 5 - 7, and summaries of the number and density (no. per km of shoreline) of these features by sub-region are included in Table 1. For additional drift cell-level detail the reader is referred to Appendix 1. At the scale of sub-regions, those of Lower Hood Canal possessed among the highest number and density of non-bulkhead shoreline alteration features observed in all of Hood Canal and the eastern Strait. Of the 486 docks mapped, 146 (30%) occurred along the South Shore of Lower Hood Canal. This high concentration of docks coincided with areas of continuous armoring at and seaward of ordinary high tide, where homes have been built on fill and there is no shared community dock space. High concentrations were also observed at Driftwood Key, Sequim Bay, Shine, and Mats Mats sub-regions (Table 1).
Stairs and stair towers were the dominant shoreline alterations along steep banked shoreline segments, though it is important to remember that only stairs that were not associated with larger, more intrusive shoreline modifications (such as docks or bulkheads) were mapped. Sub-regions with high densities of stairs included Olele Point, Pleasant Harbor, Dosewallips, Duckabush, Lofall, Whiskey Spit, Discovery Bay, and East Marrowstone (Table 1). Vegetation removal from the top and face of natural bluffs was common in areas with stair construction. The effects of this vegetation removal and stair construction on natural bluff function are unknown and such an analysis was beyond the scope of this study. However, we suggest that stair number and density along high and low bluffs may serve as a useful indicator or barometer of shoreline alteration; assessment of this situation is needed, given the potential importance of sediment and wood recruitment from areas where stairs are commonly constructed.

15
#
#
#
#
#
###############
######################
##
#######
#
##
#
################
#######
######
#
#
##
###
###
##
##
##
######################################### ###################################################
########
########
######################################
####################
######
########
###
###
#######
####
###
#########
####
##
########
#####
#
#
##
#
###
#########################
####
#
##
#
#
#
######
#
#
##
#
##
##
##
#
##
#
#
#
####
######
#
####
#
#
#
####
############################################
##########################
Port Townsend
Sequim
Port Ludlow
Quilcene
Br innon
Lof all
Seabeck
Union
Belfair
Lilliwaup
N
EW
S
5 0 5 10 Miles
# Dock
5 0 5 10 15 20 Kilometers
Figure 5. Distribution of docks throughout study area.

16
%
%
%%
%%
%
%
%
%
%%
%
%%%%%%
%
%
%
%
%%%
%%
%
%%
$$$
$$
$
$
$
$
$$$$$
$$$$
$
$
$$
$$
$
$
$
$$
$$
$
$$
$
$
$$$ $$$$$$$$$$$$$$$ $
$$
$$$$
$$$$$
$$$
$$$$$$$$$
$
$$
$$
$
$
$$$$
$$
$
$$$$$
$$$$
$$$
$$
$
$$$ $
$
$$$
$$
$
$
$
$
$$$ $
$
$$
$
$
Port Townsend
Sequim
Port Ludlow
Quilcene
Br innon
Lof all
Seabeck
Union
Belfair
Lilliwaup
N
EW
S
5 0 5 10 Miles
% Jetty$ Launch Ramp
5 0 5 10 15 20 Kilometers
Figure 6. Distribution of launch ramps and jetties throughout study area.

17
Ñ
Ñ
Ñ
Ñ
Ñ
Ñ
ÑÑ ÑÑÑÑÑÑÑÑÑÑÑÑÑÑÑÑÑÑÑ
ÑÑ
Ñ
Ñ
ÑÑÑ
ÑÑÑÑ
ÑÑÑÑÑÑÑÑÑÑÑ
ÑÑ
ÑÑÑÑ
ÑÑ
ÑÑÑÑÑÑ
ÑÑÑÑÑ
ÑÑÑÑÑÑÑÑÑÑÑÑÑÑÑÑÑÑÑÑÑ
ÑÑÑÑ
ÑÑ
ÑÑ
Ñ
ÑÑÑÑÑÑÑ
Ñ
ÑÑ ÑÑÑÑÑ
ÑÑÑÑ
Ñ
rrrrrrrrrrrrrr
rrr
rr
r
rrrrrr
rrrrrrrrr
rrrrrrrrrrrrrr
rrrrrrrrrrrrrrrrrrrrrrrrr
rrrrrrrrrrrrrrr
r
rrr
rrr
rrr
r
r
rr
rr
rr
rrrrrrrrrrrrrrr
rr
r r
r
rrrrrrrrrrrrrrrrrrrrrrrrr
r
rrrr
rrr
r
r
r
rrrrrrr
r
rrrrrrr
r
rrrrrrrrrrrrrrrrrrrrrr
r
rrrrrrrrrrrrrrrrrrr
rr
rrrrrrrrrrr
rrrrrrrrrrrrrrrr
rrrrrrrrrrrrr
rrrrrrrrrrrr
rr
rrrrrrr
rr
r
rrrrrrrr
rrrrrrrr
rrrrrrr
rrrrrrrrr
rrr
rrrrrrrrrrrrr
rrrrrrrrrrr
r
rrr
rrrrrrrrrrr
rrrrrrr
rrrrrrrr
rrr
rrrrrrrrrrr
rrrrrrrr
rrrrrrrrrr
Port Townsend
Sequim
Port Ludlow
Quilcene
Br innon
Lof all
Seabeck
Union
Belfair
Lilliwaup
N
EW
S
5 0 5 10 Miles
Ñ Rail Launchr Stair
5 0 5 10 15 20 Kilometers
Figure 7. Distribution of stairs and rail launches throughout study area. Only stairs independent of other structures are shown.

18
Stairs often fall and many were observed that had been destroyed during recent slides along steep bluffs. This was far easier to observe along steep faces of unvegetated bluffs such as those along the east side of Marrowstone Island. Dangling remains of these modifications were also seen in other places and an initial attempt was made to record their presence. Since we did not accurately survey the entire study area, no mapped result is presented. It is interesting to note that these stairways continue to be built in the same highly erosive locations.
In contrast to stairs, rail launches, launch ramps, and jetties were typically mapped in association with a larger structure, such as a bulkhead. Most rail launches lay partially above the beach substrate and posed a lesser impact to alongshore drift, as compared to poured boat ramps or jetties. Of 118 rail launches, approximately 70% occurred in the Seabeck, North Shore, Skokomish, and Triton sub-regions (Table 1). Launch ramps were typically constructed of concrete or other hard materials lying on or in the intertidal beach, intercepting nearshore drift much like a jetty or groin. Like docks, launch ramps were frequently mapped in association with bulkheads, and were particularly dense in the Lower Hood Canal region; of the 129 mapped launch ramps, 43 (33%) occurred in Lower Hood Canal (Table 1). Similarly, jetties or groins, though few in number (n=30) were concentrated in the Lower and Southwest Hood Canal regions. All communities up and down Hood Canal and the eastern Strait have access to public and commercially owned launch ramps at Salsbury Point, Triton Cove, Quilcene Bay, Shine, Gardiner, and other locations. Yet, individuals have placed 129 additional, private use concrete ramps and 118 rail launches into the nearshore throughout the study area. Community docks and marinas also exist in many areas, including Quilcene, Seabeck, and Pleasant Harbor. Yet shorelines are dotted with private docks, many of which extend out from bulkheads that cover or modify the nearshore spawning habitat of herring, smelt, and sandlance. Backshore Landforms Our chief aim was to map human shoreline modifications, but we also mapped natural shoreline geomorphology to provide context for the analysis of modification patterns along contrasting shore types. A particularly onerous challenge was determining original landform types along heavily developed shorelines (as discussed above). Nonetheless, though preliminary, our backshore landform mapping is useful for finding and comparing shore segments with similar natural geomorphic settings. Appendix 2 presents total lengths and percentages of backshore landform types by sub-region. Appendix 3 describes in more detail the breakdown of backshore landforms by drift cell; this appendix contains information on total drift cell length, length of high and low bluffs; combined length of all “no bluff” shore types; and within the “no bluff” category, lengths of accretion type landforms, combined barrier beaches/spits/berms, saltmarshes, and other areas generically classified as “upland”. Though outside conventional shoreline geomorphic categories, we were compelled to include the latter category due to the difficulty of accurately mapping natural backshore types along highly modified, low-lying shore segments. This shore type was generally applied where the extent of roadways, residential development, fill, or other human structures was so dense that the natural shoreline landform was obscured. Though untidy, the preponderance of “upland” shore segments (particularly in Lower Hood Canal) underscores a significant

19
finding of this study: along certain shore segments of Hood Canal the extent and degree of shoreline modification is so pronounced that determining the original natural shoreline geomorphology through contemporary field investigation is extremely difficult, if not impossible. Some understanding of what has been lost in these areas can likely be inferred from other areas of Hood Canal. For example, though 309 km of high/low bluffs were mapped throughout study area (comprising 52% of the surveyed shoreline length), no high/low bluffs were mapped in the Union, North Shore, and South Shore sub-regions of Lower Hood Canal where the no bluff-upland shoreline landform type predominated (Appendix 2). Accuracy Assessment
Our estimates of accuracy, based on comparisons between the boat-based survey and the onshore survey, included numbers of features inadvertently omitted during the survey and errors in horizontal placement; that is, in location and attributed length of features. We considered the onshore measurements to be accurate and therefore the benchmarks for estimating amounts of error for the boat survey. Results of the accuracy assessment are summarized in the following description. Detailed results are provided in Appendix 4.
The estimated overall error of omission for bulkhead features was 19.4%. Corresponding bulkheads between surveys had an average difference in center point position along the shore of 17.1 meters (standard deviation = 12.06 meters, standard error = 1.64 meters). A comparison of the boat-based survey bulkhead lengths to onshore survey bulkhead lengths showed an average difference of 22.8% (n = 54). The average percent error when the boat survey length was greater than the onshore survey length was 11.6% (n = 17), while the average percent error when the boat survey length was less than the onshore survey length was 28.0% (n = 37). Error analysis for description of bulkhead attributes indicates that 27.2% of the features have complete correspondence in material (concrete, rock, wood or other), angle (vertical or sloped) and position (above, at, or below ordinary high water) while an additional 58.6% agree in material and angle. The greatest error occurred with respect to identifying position of the bulkhead relative to ordinary high water.
For point features (including docks, jetties, launch ramps, and rail launches, but excluding stairs), the error of omission was 41.0%. There was also a 4.2% error of commission (i.e., features identified by boat survey but not by onshore survey). For point features, the average error in position along the shore was 15.97 meters (standard deviation = 13.43 meters, standard error = 2.80 meters). CASE STUDIES Our original intent was to walk the reader along the entire shoreline of Hood Canal and the eastern Strait of Juan de Fuca, providing a drift cell by drift cell account of habitat and modifications to the nearshore. Due to the large number of drift cells, length of shoreline, and exhaustive amount of modifications, we opted for the following set of case studies. These examples were chosen to offer a broad range of geographical and ecological conditions while illustrating the many kinds of modifications and their impacts along the shore. The case studies were chosen for their illustration of how modifications
20
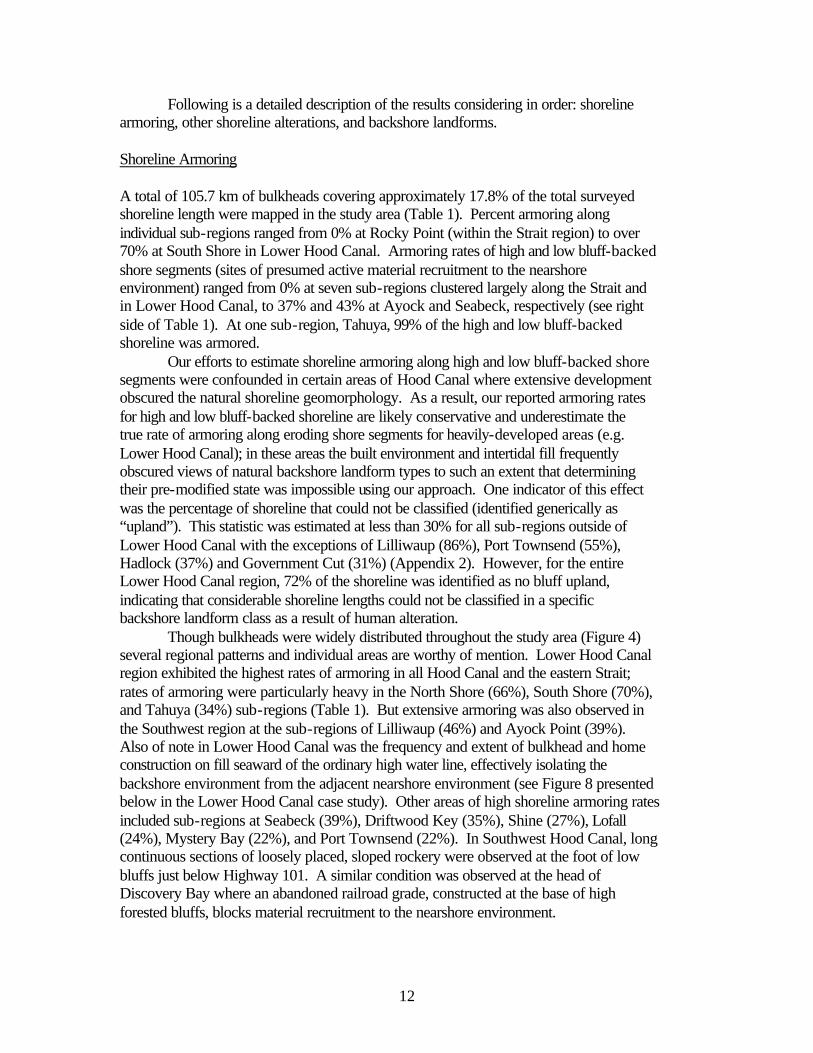
impact each zone within a drift cell. It is important to remember that each shoreline area is unique and must be evaluated with its own special features in mind if and when any modification is proposed. But, general principles apply to all drift cells and modifications in each zone can be viewed as shown in Table 2:
Table 2. Typical shoreline modification impacts by drift cell zone
Zone Type Zone Function Impacts on zone Erosion Zone Initial supply of sediment
to drift cell. Woody debris supply.
Sediment supply blocked, woody debris recruitment altered or eliminated, shade eliminated
Transport Zone Eelgrass beds form. Sediment supply contributed with some accretion. Nearshore feeding and migration by juvenile salmonids. Large wood contributed.
Sediment supply reduced, woody debris altered, shade reduced, erosion of spits and beaches, loss of spawning and rearing habitats
Deposition/Accretion Zone Accretion features established. Saltmarsh, tidal lagoons, estuarine habitats formed. Significant juvenile salmonid habitat.
Sediment deposition reduced, erosion of spits/beaches, loss of spawning and rearing habitats
Lower Hood Canal
No portion of Hood Canal or the eastern Strait has been more radically altered
than the Lower Hood Canal region. Essentially no natural eroding bluffs remain in this region, which comprises the “hook” of south Hood Canal. Road and residential construction lying behind continuous armoring has isolated the shoreline from natural bluffs, denying the beach its natural sources of sediment and large woody debris recruitment.
As a result of this nearly complete modification to the shoreline in this area, it is impossible to accurately map natural shoreforms or successfully characterize contemporary shoreline patterns. We can predict where natural beaches may have occurred in the past based on drift cell zonation, but such extensive modifications obliterate their historic location and potential features. This is especially true for sandy shorelines which would have formed along transport zones and at the tail end of drift cells within the deposition or accretion zones as described earlier in our “textbook” example in Port Ludlow Bay (see “How a Drift Cell Functions” in above Background section).
Graphic evidence of the extent of bulkheading in the lower Hood Canal region is shown in Figure 8. Figure 9 paints an equally graphic picture of the saturation of other modifications in this area, including docks that alter overwater nearshore habitat. Table 3 provides the relative measure of impact to each drift cell zone in Lower Hood Canal.

21
Dewatto
Union
Belfair
Tahuya
Lilliwaup
N
EW
S
2 0 2 4 Miles
2 0 2 4 6 Kilometers
Bulkhead
below ordinaryhigh water line
above or at ordinary high water line
Figure 8. Lower Hood Canal case study. Distribution of bulkheads.
Sisters Point

22
%%
%
%%%%
%
%
$
$
$ $$
$$$$$$$$
$$$$$$$
$$
$
$
$
$
$
$$
$$
$
$
$$
$$$$$
$
$
$
Ñ
Ñ Ñ Ñ
ÑÑÑ
ÑÑÑÑÑÑÑÑÑ ÑÑÑÑ Ñ
Ñ
Ñ
Ñ
Ñ
r
# # ################
######## ########### ##########
########
#######
#################
###########
##
#
### #
#
#
# # ###
##
## ######
#####################
####### # #
#
##
###############
#
###
####
##
####
#
#
#
###
Dewatto
Union
Belfair
Tahuya
Lilliwaup
N
EW
S
2 0 2 4 Mil es
2 0 2 4 6 Kilometers
# Dock
% Jetty
$ Launch RampÑ Rail Launchr Stair
Figure 9. Lower Hood Canal case study. Distribution of docks, stairs, rail launches, launch ramps, and jetties.
SistersPoint

23
Table 3. Relative degree of impacts to drift cell zones in Lower Hood Canal
Severe Moderate Minimal Erosion Zone
+
Transport Zone +
Accretion Zone +
Figure 10 gives an indication of the extent of impacts on populations of nearshore
habitat species. Historically, sandlance would have found extensive spawning in the transport and accretion zones of unimpaired Lower Hood Canal drift cells. The four remaining spawning sites shown on the map are tiny pockets of sand isolated between the near continuous mass of cement and rock walls lining the shoreline.
The single bluff remnant mapped in Figure 10 is a stark reminder of conditions that severely impact nearshore habitat and several species. Bluffs once formed the backshore of most beaches in Lower Hood Canal. Roads, homes, bulkheads, and other structural changes have been carved between them and today’s nearshore, isolating the sources of sandy sediments that once provided sandlance the substrate needed for spawning. Bulkheads placed on top of the intertidal also covered former spawning sites. We refer to these combined impacts as cumulative effects – sand sources are blocked and sand deposition sites are eliminated.
We know sandlance have suffered severe declines due to alterations in the Lower Hood Canal region, simply by measuring the modification of their spawning habitat. Losses to their population are reflected in the minimal occurrence of spawning sites left intact. Unfortunately, we do not have as extensive information on salmon habitat changes. This is due in part to the need for more information on how juvenile salmon use the nearshore environment of Hood Canal and on the need for more accurate maps of eelgrass beds on which they depend. We can assume that impacts on the salmon’s food supply have begun to express similar cumulative effects. That is, sandlance are salmon food and natural shores are salmon habitat. With impacts to both, salmon populations suffer the cumulative impacts resulting from loss of shoreline in areas such as Lower Hood Canal.
Bulkhead construction in the Sisters Point vicinity provides a more detailed example of shoreline conditions in the Lower Hood Canal region. As can be seen in Figure 11, bulkheads line much of drift cell MA 9-1. The drift cell originates west of Sisters Point where the cell extends for 2.2 km to the east, terminating at the convergence with another drift cell west of Sisters Point. Some 1.8 km (83%) of the length of this drift cell has been armored (Appendix 1), and much of the bulkhead construction has occurred below the ordinary high water line (Figure 11), obscuring original beach conditions and eliminating productive intertidal habitat.

24
Dewatto
Union
Belfair
Tahuya
Lilliwaup
N
EW
S
2 0 2 4 Miles
3 0 3 6 Kilometers
Backshore landformshigh / low bluffs
sandlance spawning grounds
Figure 10. Lower Hood Canal case study. High/low bluffs and Sandlance spawning areas.
SistersPoint

25
N
EW
S
Bulkheadsabove or at ordinaryhigh water linebelow ordinaryhigh water line
drift cell MA 9-1
Sisters Point
0.1 0 0.1 0.2 Miles
0.1 0 0.1 0.2 Kilometers
Figure 11. Lower Hood Canal case study. Bulkheading in drift cell MA 9-1.
MA 9-1

26
In spite of these impacts from shoreline armoring, remnant overhanging natural
vegetation is present in the Sister’s Point area. This is in stark contrast to other south Hood Canal beaches where extensive, and in some cases, complete vegetation removal is the rule. Natural vegetation remains near Sister’s Point primarily where armoring occurs along roadbeds with no adjacent housing. A more typical Lower Hood Canal pattern of modification can be seen along much of the armored shores where little or no vegetation is associated with homes or other buildings built on fill supported by bulkheads. These often extend out onto the intertidal to further impact shoreline habitat.
It is difficult to fully integrate and explain the consequences of such intensive alterations on nearshore marine habitat, especially where human development has obliterated important natural backshore landforms. But we do know armoring and development at and below the historical water line has resulted in the filling and permanent removal of productive intertidal habitat, while overwater shading from docks and piers has likely diminished the productive capacity of remaining areas.
One approach to understanding impacts due to these changes is to provide illustrations of a particular area over time. Figure 12 portrays historic changes along one Lower Hood Canal shoreline segment near Union. Usually, a geologist uses local landforms to identify shoreline features, but in their description of this drift cell, Swartz and Blankenship (1982) could only point to evidence of shoreline dynamics with reference to human modifications. For example, they state there is “evidence of northeasterly drift seen at the ends of dozens of bulkheads and groins where sediment accumulations occur on the southwest and beach erosion on the northeast.”
As can be seen in the historical changes at Union (Figure 12), bluffs were gradually isolated from the shoreline. Sediment sources were isolated as well and the beach substrate coarsened. As homes were built shoreward of the road, fill covered upper intertidal habitat where sandlance once spawned, clams lived, and juvenile salmon migrated in the shade of overhanging trees.
Today, we live and recreate along these shores. But it is important to remember how the shoreline once existed in harmony with the bluffs, trees, and drift cell dynamic. The Union shores lack natural features, making it difficult to impossible for us to measure natural resource changes and potential habitat value.
South Port Ludlow Bay
The south side of Port Ludlow Bay has been largely residential for many
centuries, occupied by S’Klallam Tribal members for many years and several waterfront homes today. Except for the ribs of a single decaying schooner, no industrial or commercial modifications appear to have impacted the shoreline. A single, relatively unaltered drift cell (JE-6) extends from Tala Point along this shoreline, terminating with a long sandy spit that encloses a tidal lagoon (Figure 13). This drift cell has been described in the introduction of this report but is briefly mentioned again here to allow comparison with Southpoint, a site with similar structure but with far greater impacts due to human modifications.

27
Figure 12. Lower Hood Canal Case Study. Historic changes projected along a shoreline segment near the town of Union.

28
#
#
#
###
#
###
####
Tala Point
N
EW
S
0.4 0 0.4 Miles
Backshore landforms
no bluff / uplandlow bluff / vegetated orpartially vegetatedhigh bluff / vegetatedhigh bluff / partially vegetated
no bluff / spit - barrier beach
bulkheadsandlance spawning grounds
# dock
0.3 0 0.3 0.6 0.9 Kilometers
Figure 13. South Port Ludlow case study. Shoreline features within drift cell JE 6.
JE-6Port Ludlow
Bay

29
As can be seen in Figure 13, the long, sandy spit enclosing the lagoon at the terminus of this drift cell is relatively undisturbed. A few bulkheads have been constructed updrift of the spit, but they do not greatly impair movement of fine sediments due to their location high in the intertidal and low number. Additionally, sediment sources from Tala Point feeder bluffs and contributing bluffs along the transport zone of the drift cell both remain relatively natural. Large wood and sediment fall freely to the beach. Impacts on the shore zones of the drift cell are moderate to minimal as shown in the following table.
Table 4. Relative degree of impacts to drift cell zone in South Port Ludlow Bay
Severe Moderate Minimal Erosion Zone
+
Transport Zone +
Accretion Zone +
The resulting spit and subestuary complex formed at the JE-6 drift cell terminus
provides significant rearing habitat for coho and cutthroat throughout the complex’s length and for chum in the lower reaches of the tidal slough and shallow nearshore near the tip of the spit (Hirschi and Doty 2002). In comparison, this kind of complexity has been lost in much of the Southpoint area at the terminus of drift cell JE-13 as seen in the following case study.
Southpoint
Southpoint is the former site of a Washington State Ferry terminal and is in view of the Hood Canal Bridge on the west side of Hood Canal at the southern shoulder of Squamish Harbor. It is also the site of Bridgehaven, a housing development and small marina, and is the terminus of one of the longest drift cells on Hood Canal.
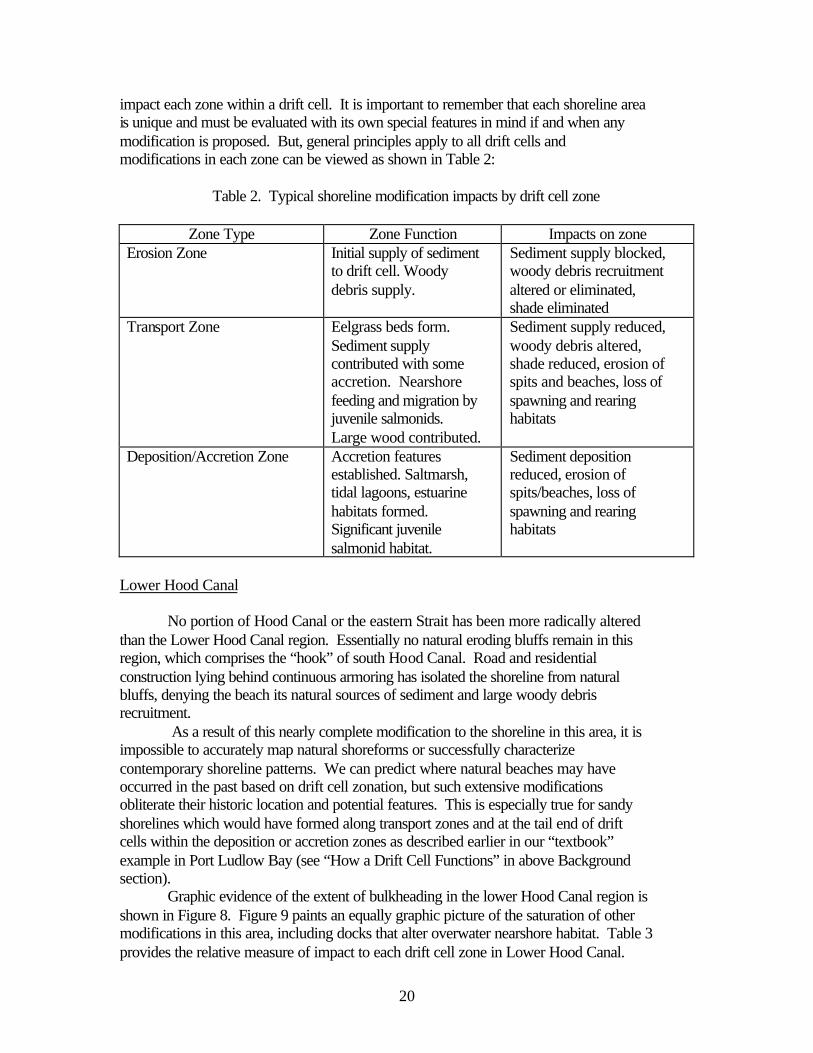
Drift cell JE-13 originates just north of Hazel Point and extends north for just over 20km in the Northwest Hood Canal sub-regions (Figure 14). Net shore drift is northward along the Toandos Peninsula and Thorndyke Bay until terminating artificially at the jetty on the north side of the Bridgehaven marina near Southpoint. Most southern reaches of this shoreline are unarmored and only 8.4% of the entire length has been modified with bulkheads. The erosion and transport zones are predominantly natural vegetation on high and low bluffs that account for 78% of the entire drift cell length.
Extensive U.S. Navy and Olympic Resource Management timberland properties have protected the nearshore from alteration near Thorndyke Bay and along much of the bluff habitat on the east side of the Toandos Peninsula. Natural accretion occurs along just over 6.7 km of the drift cell, including prominent shoreforms such as the spit at Brown Point.
Diverse nearshore habitats in this drift cell include a stream mouth lagoon and broad delta formation at the head of Thorndyke Bay. A long sandy spit partially encloses the large tidal lagoon with significant coho and chum rearing habitat. High, unstable
30
South Point
Thorndyke Bay
Brown Point
N
EW
S
1 0 1 2 Miles
bulkhead
sandlance spawning grounds
accretionary backshore landforms
$ Bridgehaven marina and jetty
$
JE 13
JE 12
Figure 14. Southpoint case study. Accretionary backshore landforms, bulkheads and sandlance spawning grounds for drift cells JE12 (north of Bridgehaven jetty) and JE13 (south of Bridgehaven jetty).
Toandos Peninsula
1 0 1 2 Kilometers

31
bluffs to the east and north of the bay contribute large volumes of sediment as soil and vegetation slip off the top of clay banks not far from Southpoint. Some of this sediment is directed updrift to build and maintain the Thorndyke spit, but net drift remains northward, continuing along the transport path of the cell until natural conditions abruptly change at Southpoint. The presence of extensive north and south fetch at this point along Hood Canal may indicate the development of sub-cells within the larger drift cell (Thorndyke Bay vicinity) or the segmentation of this long drift cell (Hugh Shipman, personal communication).
A clear indication of the alteration of drift cell dynamics can be seen most clearly in the Southpoint/Bridgehaven complex. Historically, a natural spit and an associated subestuary habitat formed at the terminus of this drift cell, just as exists today in South Port Ludlow Bay at the terminus of JE-6. Though much longer and far more complicated along its shoreline route, the historic Southpoint spit and subestuary habitat was once much more extensive and complex with significantly more salmon habitat and very likely, a spawning stream as well (Figure 15).
Historic losses are not easy to quantify and fully understand due to their severity, but much of the change over time can be linked to modifications clearly evident today, primarily within the drift cell accretion zone as indicated in Table 5.
Table 5. Relative degree of impacts to drift cell zone at Southpoint
Severe Moderate Minimal Erosion Zone
+
Transport Zone
+
Accretion Zone
+
These accretion zone impacts are likely a cumulative and confusing result of the
following: 1) Dredge and fill of the tidal channel, saltmarsh, and lagoon from Soutpoint to
the marina. 2) Jetty construction at the marina. 3) Bulkheading and wing wall construction from Southpoint, northward along
the Bridgehaven spit. The dredging and filling of the marsh and shallow intertidal habitat has resulted in
severe loss of salmon habitat. Hirschi and Doty (2002) have reported a lack of juvenile salmon in samples within the tidal areas behind the built spit at Bridgehaven. They have also reported adult chum salmon nosing into the impassable culvert that separates the remnant marsh and tidal channel south of the dredged area. In sharp contrast, their samples taken in tidal channels behind the protective natural spit (Figure 15) include large numbers of both pink and chum salmon during spring outmigration.
A new drift cell (JE-12) originates at the jetty associated with the Bridgehaven marina (Figure 14). Historically, the drift cell JE-13, continued into Squamish Harbor,

32
Figure 15. Southpoint case study. Illustration of changes to the Southpoint spit over time.

33
depositing sediment along the entire length of the contiguous, historic spit complex. Stated another way, this former accretion zone has been split by the new erosion zone at the starting point of drift cell JE-12.
Fine sediments once deposited along the natural drift cell terminus of JE-13 are now (artificially) washed away and transported to the north and into Squamish Harbor as the northern half of the spit disappears. Likewise, property owners along the built segment of the southern half of the spit have been seeing their beachfront erode and sediments coarsen in front of their bulkheads as immigration of new sediments is blocked by updrift structures.
This erosion/accretion balance is further complicated by the extensive bulkheading, filling, and wing wall structures between Southpoint and the Bridgehaven jetty. Sediment volume may have been reduced in the eroded gap between the two, now separated spits, due to accretion of material near Southpoint where sediments are diverted out into Hood Canal by armoring and the former ferry structures (Johannessen 1992). The proliferation of seawalls near Southpoint and Bridgehaven, the installation of the jetty, or cumulative impacts from all the above may also be at play.
One might hope that the relatively natural spit complex at Port Ludlow will be regarded as a model of how people have been able to enjoy a waterfront residential area while maintaining the integrity of the dynamics of each segment of the drift cell and its resultant habitat values. At the same time, a comparison of the two sites may give property owners and shoreline managers ideas of how to restore functions and values in the highly altered Southpoint/Bridgehaven complex. Juvenile salmon habitat needs suggest that restoration may need to proceed quickly since the erosion and destruction of the remaining intact spit and subestuary habitat now rests within an unnatural erosion zone. Point Julia
In strong contrast to the Southpoint example, Point Julia also has extensive human
use of a spit complex, but essentially no impact to nearshore habitat. Also known as Boston Point, Point Julia is at the northeastern entrance to Port Gamble Bay on the Port Gamble S’Klallam Reservation (Figure 16). It forms at the terminus of a north directed drift cell, KS-2-2. As seen in the map of the cell, and as reflected in Table 6, very little modification has occurred along this nearshore with the exception of armoring along the transport zone midway up the eastern shore of the bay.
Table 6. Relative degree of impacts to drift cell zone at Point Julia
Severe Moderate Minimal Erosion Zone
+
Transport Zone
+
Accretion Zone
+

34
#
$
N
EW
S
sandlance spawning groundsbulkhead
Backshore landformsno bluff / spit-barrier beachhigh bluff / vegetatedhigh bluff / partially vegetated
# dock$ launch ramp
Point Julia
0.1 0 0.1 0.2 Miles
KS 2-2
Figure 16. Point Julia case study. Backshore landforms, shoreline features and sandlance spawning grounds for drift cell KS 2-2.
Port Gamble S'Klallam Reservation
Port GambleMill
0.1 0 0.1 0.2 Kilometers

35
Shorelines in the reservation section of the drift cell are little changed with significant wooded bluffs contributing sediment supply to the spit at Point Julia as well as overhanging shade for outmigrating salmon and large wood structure in the nearshore. As can be seen in Figure 16, a single dock and launch ramp are located on the Point. No bulkheads rim its shores. Yet, this site is one of the most heavily used, if not the most heavily used shorelines in Hood Canal and the eastern Strait. The cultural use of the site may be a good starting point for discussions of how we all view and all use the nearshore. Differing significantly from most other residential areas up and down the study area, Point Julia is the focal point for a community that has valued the nearshore environment for many centuries.
Port Gamble S’Klallam Tribal members likely used the spit earlier, but first moved to the site for long-term occupancy in 1853. At that time, the Port Gamble Mill Company arrived and chose a mill and town site on the opposite shore at a sandy spit known as Teekalet (Jerry Gorsline, unpublished). The mill owners offered jobs in the mill, wood for homes, or other promises to tribal members if they would move from their ancestral village site at Teekalet to the Point Julia side of the bay (Rose Purser, personal communication).
The mill at Port Gamble was built atop Teekalet spit, obscuring all vestiges of the former spit. At Point Julia, homes were built, but all tribal members now live above the accretion beach area, well away from the nearshore and Point Julia. One dock serves the entire community. A launch ramp has also been built. These two shoreline modifications serve the S’Klallams, many of whom make their living fishing, clamming, or harvesting other resources from Hood Canal and surrounding marine waters. Like others, tribal members also make use of public boat launches and docks in the study area.
Phil Dorn, a planner for the tribe, estimates that as many as two to three hundred people visit Point Julia each day for work on the beach or access to Hood Canal, or to otherwise enjoy the entire length of beach along the reservation shorelines. Despite what may well be the most frequently used and most heavily accessed spit complex on Hood Canal, Point Julia maintains natural functions and values. This is evident in the significant spawning along the beach by sandlance (Figure 16). Point Julia is also a known surf smelt spawning site (Pentilla 1999) and the Port Gamble herring stock which spawns in adjacent intertidal and shallow subtidal habitats is the second largest in Washington State (Pentilla 2000).
This example suggests that it is far easier and less expensive to promote ongoing protection of existing nearshore functions than to restore altered sites such as Southpoint/Bridgehaven. A single dock and launch ramp certainly alter the point to a degree and any future developments along this shoreline need to take drift cell dynamics into consideration. But existing conditions suggest that true community access can focus large numbers of people onto modifying structures that impact the nearshore minimally. At other locations, when docks, launches, and other access structures were constructed in the past, drift cell dynamics appear to have been disregarded. This is evident for example at two sites, John Wayne Marina and Rat Island, at which an attempt was made to satisfy the need of nearshore access while adjacent habitats were altered. The following descriptions of these two examples point to both the impacts and to potentials for restoration, and also to the need to address habitat issues and drift cell dynamics prior to construction of similar facilities in the future.

36
John Wayne Marina The marina, dock, fill, parking lots, and launch ramp at John Wayne Marina obscure the nearshore and subestuary habitats once present at Pitship Point in northeastern Sequim Bay. The site, like Point Julia, had a long history of occupancy by S’Klallam Tribal members up until the time of non-Indian settlement (Kennedy and Thomas 1977). Also like Point Julia, the intent of the marina is to allow public access to nearby waters. But the impacts of John Wayne Marina on nearshore habitats have been far greater. A more thorough comparison with community and cultural values may help explain some of the differences between the two sites. As can be seen in Table 7, impacts are severe in the erosion zones for two drift cells that diverge at the marina complex (Figure 17). This drift cell divergence shaped Pitship Point as sediments were transported to the south and north, away from the present day marina location. Johnson Creek, a stream with a severely abbreviated subestuary due to fill and armoring at its mouth, is also located within this drift cell divergence area. It is difficult to determine natural shoreline functions in the area, but an extensive marsh to the south and the tip of the historic delta of Johnson Creek suggests significant subestuarine habitat values once existed.
Table 7. Relative degree of impacts to drift cell zones at Pitship Point
SEVERE MODERATE MINIMAL Erosion Zone
+
Transport Zone
+
Accretion Zone
+
Regardless of history, the marina appears to be permanently established. Thus it would seem little can be done to remove the substantial amounts of fill and alteration at the immediate marina site. However, the marsh habitat partially isolated by road fill to the south of the marina is of interest for restoration and likely supports or can support juvenile salmon (Byron Rot, personal communication). As can be seen in Figure 18, substantial numbers of docks and other shoreline modifications have occurred along the shores of Sequim Bay, despite the presence of the facilities at John Wayne Marina. This is also in contrast to Point Julia and Port Gamble Bay where community access to the water occurs primarily at single facilities, a cultural concept that may be needed to foster greater protection and restoration efforts in the future. However, even a single modification can sometimes have severe impacts if placed inappropriately, as can be seen in the following example near Rat Island.

37
sandlance spawning groundsmarina
Backshore landformsno bluff / spit - barrier beachno bluff / uplandbluff / vegetated, partially vegetated, or no vegetation
ÊÚ mouth of Johnson Creek
N
EW
S
Schoolhouse Point
Klapot Point
Pitship Point /John Wayne Marina
ÊÚ
0.4 0 0.4 0.8 Miles
Figure 17. John Wayne Marina case study. Backshore landforms and marina within drift cells JF 17-2 and JF 17-3.
JF 17-2
JF 17-3
0.6 0 0.6 1.2 Kilometers
Sequim Bay

38
#
#
#
#
#
#
#
#
#
#
#
#
#
##
#
##
#
#
#
#
#
###
#
#
#
$
$
r
r
r
rr
r
r
r
rrrrr
rr
r
r
r
r
N
EW
S
Schoolhouse Point
Klapot Point
Pitship Point /John Wayne Marina
0.4 0 0.4 0.8 Miles
Figure 18. John Wayne Marina case study. Docks, stairs and launch ramps within Sequim Bay.
JF 17-2
JF 17-3# Dock
$ Launch Rampr Stairs
0.6 0 0.6 1.2 Kilometers
Sequim Bay

39
Rat Island Rat Island has not always been an island as can be seen in the historical coast survey map shown in Figure 19. The island is a popular beach site often visited by boaters. It is an accretion shoreform once connected to Marrowstone Island as part of a long spit at the southwestern edge of Fort Flagler State Park. According to Ray Lowrie (personal communication), the spit was separated from the mainland approximately 60 years ago when military maneuvers included beaching and dragging boats across the spit. The narrow, sandy spit was breached by this activity and strong tidal currents flushing Kilisut Harbor have helped keep the opening from filling in since that time. The disconnection of Rat Island from its historic spit also appears due to effects of a launch ramp located updrift. Sediment supplies once delivered to the spit have been substantially blocked by this single human modification. The public launch ramp on Marrowstone Island that extends into Port Townsend Bay at Fort Flagler State Park (Figure 20) is an example of how a small modification has altered the shoreline in an otherwise pristine setting. The ramp is located near the terminus of drift cell JEF-5. No bulkheads and no other modifications occur along this drift cell’s entire length. High feeder bluffs with no residential or commercial structures line the erosion and transport zones of the cell until sediments are virtually stopped at the ramp site. The ramp juts out into the intertidal from a low upland area along the accretion beach just before the start of the historic spit (Figure 20). Natural beach grassland habitat backs the sandy gravel beach, but an abrupt change in the beach and backshore begins downdrift of the ramp. The land mass updrift of the ramp is approximately 12 meters seaward of the downdrift side of the ramp. This suggests long-term blocking of sediments that once continued along the beach to the spit, including the breached portion (Rat Island connection). Sediment does move past the ramp as noted by park personnel who maintain it with constant removal of sand, rocks, and large woody debris. Boat owners typically use another ramp located on the inner, more protected side of Kilisut Harbor. Ironically, large woody debris that would normally provide the structure around which the spit might restore itself is now dragged off the beach into place upland to define parking places for boat owners and other park visitors. Relative impact on the drift cell zones is shown in Table 8.
Table 8. Relative degree of impacts to drift cell zone at Rat Island.
SEVERE MODERATE MINIMAL Erosion Zone
+
Transport Zone
+
Accretion Zone
+

40
Figure 19. Rat Island case study. United States Coast and Geodetic Survey map T-582, 1856.

41
$
no bluff / spit - barrier beachlow bluff / vegetatedhigh bluff / partially vegetatedhigh bluff / no vegetation
$ launch ramp
Backshore landforms
N
EW
S
0.2 0 0.2 0.4 Miles
Rat Island
Fort Flagler State Park
Kilsut Harbor
JEF 5
Figure 20. Rat Island case study. Launch ramp and backshore landforms within drift cell JEF 5.
IndianIsland
MarrowstoneIsland
Port TownsendBay
0.3 0 0.3 0.6 Kilometers

42
Salsbury Point And Twin Spits Salsbury Point and Twin Spits are included to help in understanding modifications that mask natural functions and values at highly significant subestuary and intertidal habitats. Present day visitors to Salsbury Point County Park would likely be surprised to learn that the launch ramp and parking lot area were once a tidal lagoon as can be seen in Figure 21. The spit and lagoon were formed as sediments were transported along a drift cell originating to the south. Much of the sediment’s movement is interrupted by the Hood Canal Bridge, but fill placed at the site in the 1950s or 1960s is responsible for most of the alteration. Like John Wayne Marina, the changes have been severe and values to fish have been greatly diminished. Though larger, the northernmost spit of the Twin Spits (Figure 22) is a good approximation of what Salsbury Point once looked like and it is also a valuable reference for how Salsbury Point and other altered spits once functioned. Like the historic Salsbury Point, Twin Spits is formed by sediments that have created a spit with a tidal lagoon. A narrow channel flushes the lagoon with each tide and separates the tip of the spit from the mainland at high tides.
No appreciable freshwater enters the Twin Spits lagoon. However, significant numbers of juvenile chum and pink salmon enter the lagoon as they migrate from other streams along Hood Canal’s nearshore and on to the Pacific Ocean (Hirschi and Doty 2002). Schools of young salmon are not easy to see due to the small size of individual fish (30-60mm in length) and many casual observers walk past them in the tidal shallows. Local residents and owners of the spit say they have never seen fish in the channel or lagoon. Perhaps this is why no alarms were raised when Salsbury Point’s tidal lagoon was filled, eliminating significant salmon rearing and refuge habitat. Regardless, it is hoped that future plans at other similar sites take great care in protecting these sites – seemingly small and insignificant, but valuable for juvenile salmon.

43
Figure 21. Salsbury Point case study. United States Coast and Geodetic Survey map T-585, 1856.

44
Figure 22. Twin Spits case study. United States Coast and Geodetic Survey map T-669, 1857.
45
REFERENCES Albright, R., R. Hirschi, R. Vanbianchi, and C. Vita. 1980. Coastal Zone Atlas of
Washington Land Cover/Land Use Narratives. Wash. Dept. Ecology. Bortleson, G.C, M.J. Chrzastowski, and A.K. Helgerson. 1980. Historical changes of
shoreline and wetland at eleven major deltas in the Puget Sound region, Washington. USGS Hydrologic Investigation Atlas (HA-617) in cooperation with US Dept Justice and BIA.
Canning, D.J. and H. Shipman. 1995. Coastal eroson management studies in Puget
Sound, Washington. Executive summary. Coastal Erosion Mgmt. Studies, Vol. 1, Rep. 94-74, Water Shorelands Res. Prog., Wash. Dept. Ecology. 100p.
Doty, T. and R. Hirschi. 2001. Unpublished data on juvenile salmonid use of stream
mouth and small estuary habitats in Hood Canal. Dunagan, C. 2001. Lofall couple pleased with softer method of protecting their beach.
West Sound Sun: July 1, 2001. p.1. Garono, R.J., C. A. Simenstad and R.R. Robinson 2000. Using high spatial resolution
hyperspectral imagery to describe eelgrass (Zostera marina) landscape structure in Hood Canal, WA. Coasts at the Millennium. Proceedings of the 17th Annual Conference of the Coastal Society, Portland OR. pp. 582-591.
Gorsline, J. Unpublished research notes from Shadows of Our Ancestors. Empty Bowl,
Pt. Townsend. Courtesy of the author. Hart, J.L. 1973. Pacific Fishes of Canada. Fish. Res. Bd. Canada. Bulletin 180. 740p. Hirschi, R. 1999. Critical nearshore habitats, Tala Point to Kala Point, Jefferson County.
Report to Jefferson Cty. Planning Dept. NOAA Grant No. G9900057. 34p. Hirschi, R. and T. Doty. 2002. Unpublished data on juvenile salmonid use of stream
mouth and small estuary habitats in Hood Canal. Hoines, A.S.and O.A. Bergstad 2000. Density of winntering sand eel in the sand
recorded by grab catches. Fisheries Research. 49(2001): 295-301. Johannessen, J.W. 1992. Net shore-drift in San Juan County and arts of Jefferson, Island,
and Snohomish counties, Washington: final report. Western Washington University, for Shorelands and Coastal Zone Management Program, Washington Dept Ecology. 58pp., 25 maps.

46
Johannessen, J.W. 1999. Critical shoreline areas relative to critical nearshore habitats at Tala Point to Kala Point, Eastern Jefferson County, Washington. Report to Jefferson Cty., Washington.
Kennedy and Thomas. 1977. Archaeological testing of a disturbed site on Sequim Bay,
Clallam County, Washington. Office of Public Archaeology, Institute of Environmental Studies, University of Washington. January 1997. 53 p.
Lichatowich, J. 1993. The status of anadromous fish stocks in the streams of eastern
Jefferson County. Prepared for Dungeness-Quilcene Pilot Project, Jamestown S’Klallam Tribe. 95p.
McDonald, K., D. Simpson, B. Paulsen, J. Cox, and J. Gendron. 1994. Shoreline
armoring effects on physical coastal processes in Puget Sound, Washington. Coastal Erosion Mgmt. Studies, Vol 5, Shorelands Program, Wash. Dept. of Ecology. DOE Rot 94-78.
Pentilla, D.E. 1995. Investigations of the spawning habitat of the Pacific sand lance in
Puget Sound. Puget Sound Research Proceedings. PSWQA, Olympia, Wa. Vol 2. p. 855.
Pentilla, D.E. 1999. Documented spawning beaches of the surf smelt and the Pacific
sand lance in Hood Canal, Washington. Ms. Rpt., WDFW Baitfish Unit, Intertidal Baitfish Spawning Beach Survey Project.
Pentilla, D.E. 2000. Documented spawning areas of the Pacific herring, surf smelt, and
sand lance in E. Jefferson County, Washington Ms Rpt., WDFW Marine Resources Division.
Phillips, R.C. 1984. The ecology of eelgrass meadows in the Pacific Northwest: A
community profile. FWS/OBS-84/24, USFWS, Wash. DC. 85p. Schwartz, M.L. and D.G. Blankenship. 1982. Mason County, Washington, net shore drift.
Report to Wash. Dept. of Ecology. In: Net shore drift in Washington State: Vol 4, Hood Canal Region. DOE Shorelands and CZM Program, Olympia, Wash.
Simenstad, C.A. 1998. Intertidal wetlands and salmon. Speech to Wash. Shorelines
Planning group. Coupeville, Wa. July, 1998. Simenstad, C.A. and R.C. Wissmar. 1985. Evidence of the origins and fates of organic
carbon in estuarine and nearshore marine food webs. Mar. Ecol. Prog. Ser. 22: 141-152.
Simenstad, C. A., R.M. Thom, and A.M. Olson (eds). 1998. Mitigating potential
impacts of ferry terminal siting and design on eelgrass habitat. WSG 98-05, Wash. Sea Grant, Univ of Wash. 103pp.

47
Tanner, W. 1974. Sediment transport in the nearshore zone. Proc. Sym. Florida St
Univeristy Coastal Res. Notes. FSU. Thom, R.M., D.Shreffler, and K. MacDonald. 1994. Shoreline armoring effects on
coastal ecology and biological resources in Puget Sound, Washington. Coastal Erosion Mgmt. Studies, Vol 7, Wash. Dept. of Ecology Shorelands and Water Res. Program Report 94-80.

48

49
Appendix 1. Summary results for shoreline structures by drift cell.
Regions & Drift Total No. No. No. No. No.Sub-regions Cells1 Lgth. (m) Lgth.(m) % Docks Jetties Launch Ramps Rail Launches Stairs2
Northeast Hood Canal RegionFoulweather KS-1-3 669 0 0.0 0 0 0 0 0
KS-1-3/KS-1-4 217 0 0.0 0 0 0 0 0KS-1-4 3,116 284 9.1 1 0 0 1 2
Foulw / DKey KS-1-4/KS-1-5 409 0 0.0 0 0 0 0 1Driftwood Key KS-1-5 997 141 14.2 0 0 1 0 1
KS-1-5/KS-1-6 2,798 1,992 71.2 44 0 0 0 0KS-1-6 3,239 512 15.8 0 0 0 0 6
DKey / GBay KS-1-6/KS-1-7 530 0 0.0 0 0 0 0 0Gamble Bay KS-1-7 2,451 93 3.8 0 0 2 0 1
KS-1-7/KS-2-2 100 0 0.0 1 0 0 0 0KS-2-2 2,584 110 4.3 0 0 0 0 2KS-2-2/KS-2-3 564 3 0.6 0 0 0 0 4KS-2-3 3,018 1,096 36.3 6 0 0 0 5KS-2-3/KS-2-4 1,625 25 1.5 0 0 0 0 0KS-2-4 1,699 318 18.7 0 0 1 0 2KS-2-4/KS-2-5 4,074 310 7.6 2 1 0 0 0
Lofall KS-2-5 27,885 6,393 22.9 17 0 7 9 51Lofall / Sbeck KS-2-5/KS-5-2 748 536 71.6 17 0 0 1 1Seabeck KS-5-2 9,467 4,329 45.7 4 0 2 15 3
KS-5-2/KS-6-2 576 8 1.4 0 0 0 0 0KS-6-2 2,826 623 22.0 0 0 1 2 4
Sbeck / Stavis KS-6-2/KS-6-3 193 7 3.8 0 0 0 0 0Southeast Hood Canal Region 0Stavis KS-6-3 5,292 991 18.7 0 0 1 0 8
KS-6-3/KS-6-4 2,620 0 0.0 0 0 0 0 0KS-6-4 202 45 22.3 0 0 0 0 0
Stavis / Anders KS-6-4/KS-6-5 331 34 10.4 0 0 0 0 0Anderson KS-6-5 3,428 516 15.1 0 0 0 0 1
KS-6-5/KS-7-2 103 0 0.0 0 0 0 0 0KS-7-2 3,836 708 18.5 0 0 0 0 0KS-8-1 3,060 355 11.6 0 0 0 0 0KS-7-2/KS-8-2 51 0 0.0 0 0 0 0 0KS-8-2 1,303 309 23.7 1 0 0 0 0
Anders / Holly KS-8-2/KS-8-3 275 43 15.7 0 0 0 0 0Holly KS-8-3 422 72 17.2 1 0 0 0 1
KS-8-3/KS-8-4 860 0 0.0 0 0 0 0 0KS-8-4 3,373 698 20.7 1 0 2 0 0KS-8-4/KS-9-2 998 0 0.0 0 0 0 0 0KS-9-2 1,753 0 0.0 0 0 0 0 0KS-9-2/KS-9-3 92 0 0.0 0 0 0 0 0KS-9-3 9,037 51 0.6 0 0 0 0 4
Holly / Dewatt MA-4-5/MA-4-6 337 0 0.0 0 0 0 0 1Dewatto MA-4-5 459 49 10.7 0 0 0 0 1
MA-4-4/MA-4-5 3,394 332 9.8 3 0 0 0 0MA-7-1 10,640 1,546 14.5 2 0 2 0 3MA-7-1 377 369 97.8 0 0 0 1 0
Dewatt / Tahuy MA-7-1/MA-7-2 870 372 42.8 0 0 0 1 0Lower Hood Canal RegionTahuya MA-8-1 4,379 2,388 54.5 5 0 2 2 0
MA-8-1/MA-8-2 3,900 39 1.0 1 0 0 0 0MA-8-2 612 435 71.0 0 0 2 0 0
Tahuy / NShore MA-8-2/MA-8-3 461 461 100.0 1 0 7 2 0North Shore MA-9-1 2,159 1,786 82.7 5 1 7 15 0
MA-9-2 311 0 0.0 0 0 0 0 0MA-9-2/MA-9-3 514 205 39.8 2 0 0 0 0MA-9-3 513 365 71.0 0 0 0 0 0MA-9-4 354 282 79.8 0 0 0 1 0MA-9-4/MA-9-5 703 596 84.8 1 0 0 0 0MA-10-1 2,491 1,424 57.1 1 0 1 0 0MA-10-2 329 329 100.0 3 0 0 0 0
Bulkheads

50
Appendix 1 (Continued)
Regions & Drift Total No. No. No. No. No.Sub-regions Cells1 Lgth. (m) Lgth.(m) % Docks Jetties Launch Ramps Rail Launches Stairs2
MA-10-3 1,472 1,016 69.0 3 0 0 0 0MA-10-4 309 226 72.9 0 0 0 0 0MA-10-4/MA-10-5 483 204 42.2 0 0 0 1 0MA-11-1 4,907 3,423 69.8 0 6 8 0 0MA-11-2 1,268 746 58.8 4 0 1 0 0
NShore / Union MA-11-2/MA-11-3 819 269 32.9 2 1 0 0 0Union MA-11-3/MA-11-6 9,629 172 1.8 0 0 1 0 0
MA-11-6 3,520 2,375 67.5 7 0 2 0 0MA-11/5/MA-11-6 459 459 100.0 5 0 0 0 0
South Shore MA-11-5 433 307 71.0 5 0 1 0 0MA-10-8 6,993 5,520 78.9 39 0 7 2 0MA-10-7/MA-10-8 411 204 49.6 2 0 0 0 0MA-10-7 673 181 26.9 1 0 1 0 1MA-8-6 8,439 5,933 70.3 63 1 1 1 0MA-8-5/MA-8-6 457 412 90.1 3 0 0 0 0MA-8-5 353 99 27.9 2 0 0 0 0MA-7-4 4,398 2,804 63.8 28 0 2 0 0
SShore / Skok MA-7-3/MA-7-4 996 688 69.0 0 0 0 0 0Southwest Hood Canal RegionSkokomish MA-7-3 456 105 23.1 0 0 0 0 0
MA-6-2/MA-7-3 10,752 596 5.5 3 0 3 1 0MA-6-2 3,062 1,401 45.7 6 2 0 20 0MA-6-1/MA-6-2 1,885 1,367 72.5 5 0 0 4 0
Lilliwaup MA-5-2 3,444 2,241 65.1 11 2 1 7 0MA-5-1/MA-5-2 862 70 8.2 0 0 0 0 0MA-4-3 3,065 1,914 62.4 3 1 0 2 0MA-4-2/MA-4-3 1,495 0 0.0 0 0 0 0 0MA-4-2 619 8 1.3 0 0 0 0 0
Ayock MA-4-1/MA-4-2 384 0 0.0 0 0 0 0 0MA-3-3 6,395 2,658 41.6 0 1 3 6 3MA-3-2 482 186 38.6 1 0 1 0 0
Hamma Hamma MA-3-1/MA-3-2 758 180 23.8 0 0 0 0 0MA-2-3 3,120 796 25.5 1 0 1 0 0MA-2-2/MA-2-3 3,020 8 0.3 1 1 0 0 2MA-2-2 444 13 2.9 0 0 0 0 5MA-2-1/MA-2-2 399 0 0.0 0 0 0 0 0MA-2-1 1,035 3 0.3 0 0 0 0 0MA-1-5/MA-2-1 509 8 1.5 0 0 2 0 1MA-1-5 235 84 35.8 0 0 1 0 0
Triton MA-1-5/MA-1-5 229 225 98.5 0 0 0 0 0MA-1-4 518 179 34.5 1 0 1 0 1MA-1-3/MA-1-4 1,048 0 0.0 0 0 0 0 0MA-1-3 3,238 1,105 34.1 1 0 1 7 2MA-1-2/MA-1-3 482 38 7.9 0 1 0 1 0MA-1-2 590 27 4.6 0 0 0 3 4MA-1-1 632 117 18.6 5 0 1 0 4JE-30 1,999 383 19.1 0 0 2 0 2
Duckabush JE-29/JE-30 751 0 0.0 0 0 0 2 2JE-29 1,097 41 3.7 1 1 1 0 2JE-28/JE-29 4,041 420 10.4 4 0 1 2 12JE-28 3,745 229 6.1 1 0 0 0 0JE-27 2,127 294 13.8 0 0 1 0 9JE-26/JE-27 519 23 4.4 0 0 1 0 2
Dabob RegionPleasant Harbor JE-26 717 27 3.7 1 0 0 0 11
JE-25/JE-26 2,017 0 0.0 7 0 0 0 2JE-25 2,019 429 21.2 9 0 0 0 13
PHarbor / Dose JE-24/JE-25 1,519 0 0.0 0 0 0 0 6Dosewallips JE-24 8,050 1,376 17.1 0 0 0 0 16
JE-23 668 91 13.6 1 0 2 0 1Jackson Cove JE-22/JE-23 638 0 0.0 2 0 0 2 2
JE-22 905 181 20.0 1 0 1 1 1JE-21/JE-22 4,100 612 14.9 1 0 1 0 4
Pt Whitney JE-21 3,072 131 4.3 2 0 1 0 1
Bulkheads

51
Appendix 1 (Continued)
Regions & Drift Total No. No. No. No. No.Sub-regions Cells1 Lgth. (m) Lgth.(m) % Docks Jetties Launch Ramps Rail Launches Stairs2
JE-20 1,151 38 3.3 0 0 0 0 0PWhitney / Quil JE-19/JE-20 711 0 0.0 0 0 0 0 0Quilcene JE-19 3,180 53 1.7 0 0 0 0 0
JE18/JE19 7,093 740 10.4 0 0 0 0 1JE-18 4,170 579 13.9 0 0 0 0 3
Quil / Tarboo JE-17/JE-18 965 0 0.0 0 0 0 0 0Tarboo JE-17 9,849 636 6.5 0 0 1 0 4
JE-16/JE-17 5,881 109 1.8 2 0 0 0 0JE-16 19,326 1,168 6.0 1 2 0 0 7
Tarboo / HazelP JE-15/JE-16 1,494 0 0.0 0 0 0 0 0Northwest Hood Canal RegionHazel Pt JE-15 6,506 0 0.0 4 0 0 0 1
JE-14 2,966 188 6.3 0 0 2 0 4HazelP / Thorn JE-13/JE-14 1,238 0 0.0 0 0 0 0 0Thorndyke JE-13 20,374 1,703 8.4 2 0 0 0 9Shine JE-12/JE-13 1,896 1,163 61.3 26 0 1 0 0
JE-12 3,022 307 10.1 0 0 0 0 8JE-11 3,706 959 25.9 0 1 3 0 6JE10-/JE11 743 0 0.0 0 0 0 0 0
Whiskey Spit JE-10 3,467 279 8.1 0 0 1 0 4JE-9/JE-10 2,616 0 0.0 0 0 0 0 0JE-9 1,263 203 16.1 0 0 0 0 4JE-8/JE-9 277 0 0.0 0 0 0 0 0JE8 1,302 0 0.0 0 0 0 0 0JE-7/JE-8 41 0 0.0 0 0 0 0 0JE-7 7,468 714 9.6 0 0 1 0 15
WhisSpt / PLud JE-6/JE-7 386 0 0.0 0 0 0 0 0Port Townsend RegionPt Ludlow JE-6 3,024 466 15.4 6 0 0 1 0
JE-5/JE-6 5,468 0 0.0 9 0 0 0 0JE-5 4,445 849 19.1 0 1 0 0 5
Mats Mats JE-4/JE-5 7,731 590 7.6 22 1 1 0 10Olele Pt JE-4 894 85 9.5 0 0 2 0 2
JE-3/JE-4 237 0 0.0 0 0 1 0 1JE-3 227 40 17.6 1 0 0 0 0JE-2 1,003 0 0.0 0 0 1 0 11
OleleP / OakBay JE-1/JE-2 823 0 0.0 1 0 1 0 3Oak Bay JEF-1 5,085 767 15.1 0 0 1 0 6
JEF-2 4,697 932 19.8 0 0 1 0 0Oakbay / EMarr JEF-2/JEFF-3 1,753 63 3.6 0 0 0 0 0E Marrowstone JEF-3 10,037 40 0.4 1 0 0 0 17
JEF-3/JEF-4 173 0 0.0 0 0 0 0 0JEF-4 620 181 29.3 0 0 0 0 0
EMarr / Flagler JEF-4/JEF-5 848 0 0.0 0 0 0 0 0Flagler JEF-5 1,640 0 0.0 0 0 1 0 0
JEF-5/JEF-6 288 0 0.0 0 0 0 0 0JEF-6 2,342 182 7.8 1 0 1 0 0
Flagler / MystB JEF-6/JEF-7 1,484 84 5.6 0 0 0 0 0Mystery Bay JEF-7 1,750 568 32.5 1 0 1 0 1
JEF-7/JEF-8 1,904 430 22.6 5 0 0 0 6MystB / KilisutW JEF-8 750 72 9.7 1 0 0 0 1Kilisut West JEF-9 4,003 645 16.1 2 1 1 1 11
JEF-9/JEF-10 1,901 0 0.0 0 0 0 0 0JEF-10 3,864 0 0.0 0 0 0 0 0JEF-10/JEF-11 1,263 0 0.0 0 0 0 0 0JEF-11 3,008 5 0.2 0 0 0 0 0JEF-11/JEF-12 87 0 0.0 0 0 0 0 0JEF-12 546 104 19.0 0 0 0 0 0
KilisutW / Hlock JEF-13 1,374 0 0.0 1 0 0 0 0Hadlock JEF13/JEF-14 2,236 0 0.0 1 0 0 0 0Hadlock JEF-14 1,175 66 5.6 0 0 0 0 0Hadlock JEF-15 3,250 1,104 34.0 1 1 2 0 0Gov Cut JEF-2/JEF-15 1,310 0 0.0 0 0 0 0 0Gov Cut JEF-1/JEF-16 3,106 0 0.0 0 1 0 0 1
Bulkheads

52
Appendix 1 (Continued)
Regions & Drift Total No. No. No. No. No.Sub-regions Cells
1Lgth. (m) Lgth.(m) % Docks Jetties Launch Ramps Rail Launches Stairs
2
Hadlock JEF-16 1,048 177 16.9 0 0 2 0 1Hadlock JEF-16/JEF-17 1,566 0 0.0 0 0 0 0 0Hadlock JEF-17 982 305 31.0 7 1 1 1 0Hadlock JEF-18 1,794 469 26.2 0 0 0 0 0Hadlock JEF-19 2,460 0 0.0 0 0 0 0 0Hadlock JEF-19/JEF-20 243 0 0.0 0 0 0 0 0Hadlock JEF-20 1,752 0 0.0 0 0 0 0 0Hadlock JEF-20/JEF-21 670 0 0.0 0 0 1 0 0Hadlock JEF-21 888 0 0.0 1 0 0 0 0Hlock / PtTowns JEF-21/JEF-22 1,469 0 0.0 0 0 0 0 0Pt Townsend JEF-22 12,326 2,946 23.9 12 0 1 0 1PtTowns / NBch JEF-22/JEF-23 1,808 332 18.4 1 1 1 0 0Strait RegionNorth Beach JEF-23 7,856 415 5.3 0 0 1 0 3NBch / Disco JEF-23/JEF-24 1,495 0 0.0 0 0 0 0 0Discovery JEF-24 5,525 537 9.7 0 0 1 0 2
JEF-24/JEF-25 651 280 43.1 0 0 0 0 0JEF-25 6,457 662 10.3 2 0 0 0 10JEF-25/JEF-26 2,412 153 6.4 0 0 0 1 9JEF-26 2,620 854 32.6 1 0 0 0 3JEF-26/JEF-27 7,732 2,349 30.4 4 0 0 0 0JEF-27 3,086 632 20.5 3 0 0 1 4JEF-27/JEF-28 1,644 0 0.0 0 0 0 0 0JEF-28 1,452 51 3.5 1 0 0 0 0JEF-28/JEF-29 1,450 347 24.0 1 0 0 0 0JEF-29 4,468 369 8.3 0 0 2 0 1JEF-29/JF-18-5 1,142 0 0.0 0 0 0 0 0JF-18-5 2,329 351 15.1 1 0 1 0 1JF-18-4 1,256 884 70.4 0 0 2 0 1
Disco / RockyP JF-18-3/JF-18-4 459 0 0.0 0 0 1 0 0Rocky Pt JF-18-3 675 0 0.0 0 0 0 0 0
JF-18-2/JF-18-3 126 0 0.0 0 0 0 0 0JF-18-2 1,619 0 0.0 0 0 0 0 0JF-18-1/JF-18-2 978 0 0.0 0 0 0 0 0JF-18-1 4,941 0 0.0 0 0 0 0 1
RockyP / SeqB JF-17-5/JF-18-1 234 0 0.0 0 0 0 0 0Sequim Bay JF-17-5 1,298 0 0.0 0 0 0 0 0
JF-17-5/JF-17-6 966 0 0.0 0 0 0 0 0JF-17-6 1,429 93 6.5 0 0 0 0 0JF-17-6/JF-17-7 1,424 160 11.3 3 0 0 0 2JF-17-7 4,532 582 12.8 11 0 1 0 11JF-17-3/JF-17-7 3,232 0 0.0 0 0 0 0 0JF-17-3 4,877 581 11.9 12 0 1 0 6JF-17-2/JF-17-3 2,683 879 32.8 1 0 0 0 0JF-17-2 1,681 479 28.5 2 0 0 0 0JF-17-1/JF-17-2 3,126 0 0.0 0 0 0 0 0
Gibson Spit JF-17-1 3,345 56 1.7 0 0 1 0 0JF-16-6/JF-17-1 3,382 48 1.4 0 1 1 0 0
Jamestown JF-16-6 6,849 572 8.3 1 0 0 1 0
1 Drift cells are identified by alphanumeric code; e.g.,KS-1-3. Some drift cells have combination codes that indicate a single drift cell;
e.g., KS-1-3/KS-1-4. In many cases, a drift cell may overlap two subregions (or regions). Such cases are indicated by a combination of abbreviated subregion names; e.g., the name Foulw / DKey, indicates the drift cell KS-1-4/KS-1-5 overlaps into the subregions Foulweather and Driftwood Key.2 Includes only stairs observed independent of other structures.
Bulkheads

53
Appendix 2. Backshore landform lengths and percentages by region and sub-region within Hood Canal and eastern Strait of Juan de Fuca.
Regions & TotalSub-regions Lgth. (m)
Lgth. (m) % Lgth. (m) % Lgth. (m) %Northeast Hood Canal RegionFoulweather 4,207 2,079 49.4 1,987 47.2 142 3.4Driftwood Key 7,504 3,860 51.4 1,482 19.7 2,162 28.8Gamble Bay 16,380 9,433 57.6 2,504 15.3 4,442 27.1Lofall 27,951 21,291 76.2 4,005 14.3 2,655 9.5Seabeck 13,340 8,655 64.9 2,584 19.4 2,101 15.8
Totals 69,381 45,319 65.3 12,561 18.1 11,502 16.6Southeast Hood Canal RegionStavis 8,376 5,239 62.6 1,999 23.9 1,137 13.6Anderson 12,085 9,684 80.1 1,585 13.1 815 6.7Holly 16,842 13,658 81.1 1,510 9.0 1,674 9.9Dewatto 15,473 7,298 47.2 3,825 24.7 4,351 28.1
Totals 52,776 35,879 68.0 8,920 16.9 7,977 15.1Lower Hood Canal RegionTahuya 9,557 82 0.9 2,052 21.5 7,424 77.7North Shore 16,454 0 0.0 3,859 23.5 12,595 76.5Union 13,788 0 0.0 10,637 77.2 3,150 22.8South Shore 22,885 0 0.0 918 4.0 21,967 96.0
Totals 62,684 82 0.1 17,466 27.9 45,136 72.0Southwest Hood Canal RegionSkokomish 15,710 435 2.8 10,815 68.8 4,461 28.4Lilliwaup 10,619 1,445 13.6 31 0.3 9,144 86.1Ayock 7,448 4,775 64.1 1,447 19.4 1,226 16.5Hamma Hamma 9,254 4,115 44.5 4,130 44.6 1,009 10.9Triton 9,373 7,219 77.0 849 9.1 1,305 13.9Duckabush 11,529 7,091 61.5 3,652 31.7 786 6.8
Totals 63,934 25,079 39.2 20,924 32.7 17,931 28.0Dabob RegionPleasant Harbor 5,512 4,642 84.2 789 14.3 81 1.5Dosewallips 9,477 3,369 35.5 3,895 41.1 2,214 23.4Jackson Cove 5,642 3,906 69.2 1,089 19.3 647 11.5Pt Whitney 4,579 3,083 67.3 627 13.7 869 19.0Quilcene 15,282 7,685 50.3 6,347 41.5 1,249 8.2Tarboo 36,285 23,070 63.6 9,218 25.4 3,998 11.0
Totals 76,777 45,754 59.6 21,965 28.6 9,058 11.8Northwest Hood Canal RegionHazel Pt 10,838 9,479 87.5 696 6.4 663 6.1Thorndyke 20,993 13,522 64.4 6,737 32.1 734 3.5Shine 8,996 4,620 51.4 2,467 27.4 1,909 21.2Whiskey Spit 17,000 11,875 69.9 4,443 26.1 682 4.0
Totals 57,826 39,496 68.3 14,342 24.8 3,988 6.9Port Townsend RegionPt Ludlow 13,130 9,680 73.7 1,775 13.5 1,675 12.8Mats Mats 7,731 4,954 64.1 517 6.7 2,259 29.2Olele Pt 2,772 2,089 75.3 684 24.7 0 0.0Oak Bay 11,069 6,964 62.9 2,851 25.8 1,255 11.3E Marrowstone 12,130 10,751 88.6 818 6.7 561 4.6Flagler 5,436 3,404 62.6 1,920 35.3 112 2.1Mystery Bay 4,771 2,648 55.5 921 19.3 1,202 25.2Kilsut West 15,735 10,933 69.5 3,894 24.8 907 5.8Hadlock 19,484 6,611 33.9 5,625 28.9 7,248 37.2Gov Cu t 4,416 1,471 33.3 1,570 35.5 1,375 31.1Pt Townsend 13,965 3,209 23.0 3,127 22.4 7,629 54.6
Totals 110,639 62,712 56.7 23,702 21.4 24,225 21.9Strait RegionNorth Beach 9,508 8,141 85.6 987 10.4 380 4.0Discovery 43,200 26,163 60.6 10,318 23.9 6,719 15.6Rocky Pt 8,685 6,314 72.7 2,335 26.9 36 0.4Sequim Bay 25,367 11,834 46.7 9,709 38.3 3,824 15.1Gibson Spit 5,036 2,026 40.2 2,799 55.6 210 4.2Jamestown 8,540 207 2.4 8,212 96.2 121 1.4
Totals 100,336 54,685 54.5 34,360 34.2 11,291 11.3
Grand Totals 594,354 309,007 52.0 154,240 26.0 131,107 22.1
and SaltmarshesHigh and Low Bluff Barrier Beaches / Spits / Berms Upland

54

55
Appendix 3. Summary results for backshore landform length estimates by drift cell.
Regions & Drift Total High Bluff Low BluffSub-regions Cells1 Lgth. Lgth. Lgth. Total Accretion Type Barrier Beaches/ Saltmarsh Upland3
(m) (m) (m) (m) Landforms2Spits/Berms
Northeast Hood Canal RegionFoulweather KS-1-3 669 339 0 330 330 330 0 0
KS-1-3/KS-1-4 217 0 0 217 217 217 0 0KS-1-4 3,116 1,256 279 1,581 1,440 1,440 0 142
Foulw / DKey KS-1-4/KS-1-5 409 409 0 0 0 0 0 0Driftwood Key KS-1-5 997 153 460 384 384 384 0 0
KS-1-5/KS-1-6 2,798 0 0 2,798 636 636 0 2,162KS-1-6 3,239 2,017 761 461 461 461 0 0
DKey / GBay KS-1-6/KS-1-7 530 530 0 0 0 0 0 0Gamble Bay KS-1-7 2,451 1,713 0 738 738 738 0 0
KS-1-7/KS-2-2 100 0 0 100 100 100 0 0KS-2-2 2,584 2,222 0 362 362 362 0 0KS-2-2/KS-2-3 564 448 117 0 0 0 0 0KS-2-3 3,018 0 1403 1,614 133 133 0 1,481KS-2-3/KS-2-4 1,625 0 0 1,625 512 512 0 1,113KS-2-4 1,699 852 0 848 546 546 0 301KS-2-4/KS-2-5 4,074 2,414 0 1,660 113 113 0 1,547
Lofall KS-2-5 27,885 14,954 5963 6,660 4,005 3,953 52 2,655Lofall / Sbeck KS-2-5/KS-5-2 748 141 607 0 0 0 0 0Seabeck KS-5-2 9,467 992 5791 2,684 738 592 146 1,946
KS-5-2/KS-6-2 576 0 0 576 576 0 576 0KS-6-2 2,826 10 1392 1,425 1,270 364 905 155
Sbeck / Stavis KS-6-2/KS-6-3 193 193 0 0 0 0 0 0Southeast Hood Canal RegionStavis KS-6-3 5,292 1,403 2030 1,860 723 723 0 1,137
KS-6-3/KS-6-4 2,620 0 1403 1,217 1,217 856 361 0KS-6-4 202 0 142 59 59 59 0 0
Stavis / Anders KS-6-4/KS-6-5 331 245 85 0 0 0 0 0Anderson KS-6-5 3,428 2,704 0 724 572 572 0 152
KS-6-5/KS-7-2 103 0 0 103 103 103 0 0KS-7-2 3,836 2,674 447 716 546 546 0 170KS-8-1 3,060 2,304 397 359 242 242 0 118KS-7-2/KS-8-2 51 0 0 51 51 51 0 0KS-8-2 1,303 628 228 447 71 71 0 376
Anders / Holly KS-8-2/KS-8-3 275 158 118 0 0 0 0 0Holly KS-8-3 422 0 408 14 14 0 14 0
KS-8-3/KS-8-4 860 0 112 748 748 0 748 0KS-8-4 3,373 1,607 431 1,336 77 0 77 1,259KS-8-4/KS-9-2 998 998 0 0 0 0 0 0KS-9-2 1,753 1,258 0 496 195 195 0 300KS-9-2/KS-9-3 92 0 0 92 92 92 0 0KS-9-3 9,037 8,156 384 498 384 384 0 114
Holly / Dewatt MA-4-5/MA-4-6 337 337 0 0 0 0 0 0Dewatto MA-4-5 459 72 277 110 49 0 49 61
MA-4-4/MA-4-5 3,394 0 384 3,010 1,573 0 1,573 1,436MA-7-1 10,640 5,206 1190 4,244 2,203 1,288 915 2,041MA-7-1 377 0 0 377 0 0 0 377
Dewatt / Tahuy MA-7-1/MA-7-2 870 0 0 870 0 0 0 870Lower Hood Canal RegionTahuya MA-8-1 4,379 0 0 4,379 1,456 847 610 2,923
MA-8-1/MA-8-2 3,900 0 0 3,900 499 148 351 3,402MA-8-2 612 0 82 531 97 97 0 434
Tahuy / NShore MA-8-2/MA-8-3 461 0 0 461 0 0 0 461North Shore MA-9-1 2,159 0 0 2,159 0 0 0 2,159
MA-9-2 311 0 0 311 133 133 0 178MA-9-2/MA-9-3 514 0 0 514 0 0 0 514MA-9-3 513 0 0 513 236 236 0 277MA-9-4 354 0 0 354 20 20 0 334MA-9-4/MA-9-5 703 0 0 703 0 0 0 703MA-10-1 2,491 0 0 2,491 287 0 287 2,204
No Bluff Lgths. (m)

56
Appendix 3. (Continued)
Regions & Drift Total High Bluff Low Bluff
Sub-regions Cells1
Lgth. Lgth. Lgth. Total Accretion Type Barrier Beaches/ Saltmarsh Upland3
(m) (m) (m) (m) Landforms2
Spits/BermsMA-10-2 329 0 0 329 11 0 11 318MA-10-3 1,472 0 0 1,472 271 226 45 1,202MA-10-4 309 0 0 309 228 228 0 81MA-10-4/MA-10-5 483 0 0 483 0 0 0 483MA-11-1 4,907 0 0 4,907 1,275 0 1,275 3,633MA-11-2 1,268 0 0 1,268 989 0 989 278
NShore / Union MA-11-2/MA-11-3 819 0 0 819 819 0 819 0Union MA-11-3/MA-11-6 9,629 0 0 9,629 8,964 0 8,964 665
MA-11-6 3,520 0 0 3,520 1,264 0 1,264 2,256MA-11/5/MA-11-6 459 0 0 459 0 0 0 459
South Shore MA-11-5 433 0 0 433 77 77 0 356MA-10-8 6,993 0 0 6,993 152 139 13 6,841MA-10-7/MA-10-8 411 0 0 411 0 0 0 411MA-10-7 673 0 0 673 182 182 0 491MA-8-6 8,439 0 0 8,439 29 29 0 8,410MA-8-5/MA-8-6 457 0 0 457 0 0 0 457MA-8-5 353 0 0 353 0 0 0 353MA-7-4 4,398 0 0 4,398 0 0 0 4,398
SShore / Skok MA-7-3/MA-7-4 996 0 0 996 956 0 956 41Southwest Hood Canal RegionSkokomish MA-7-3 456 0 0 456 456 0 456 0
MA-6-2/MA-7-3 10,752 0 0 10,752 9,150 249 8,902 1,601MA-6-2 3,062 0 435 2,628 720 720 0 1,908MA-6-1/MA-6-2 1,885 0 0 1,885 23 0 23 1,862
Lilliwaup MA-5-2 3,444 0 87 3,357 0 0 0 3,357MA-5-1/MA-5-2 862 0 491 370 0 0 0 370MA-4-3 3,065 0 189 2,876 19 0 19 2,857MA-4-2/MA-4-3 1,495 0 0 1,495 0 0 0 1,495MA-4-2 619 0 486 133 0 0 0 133
Ayock MA-4-1/MA-4-2 384 0 384 0 0 0 0 0MA-3-3 6,395 907 3282 2,207 981 645 336 1,226MA-3-2 482 0 16 466 466 466 0 0
Hamma Hamma MA-3-1/MA-3-2 758 0 758 0 0 0 0 0MA-2-3 3,120 0 2023 1,097 556 313 243 541MA-2-2/MA-2-3 3,020 61 0 2,959 2,959 0 2,959 0MA-2-2 444 63 382 0 0 0 0 0MA-2-1/MA-2-2 399 0 389 11 11 0 11 0MA-2-1 1,035 0 431 604 604 0 604 0MA-1-5/MA-2-1 509 0 325 184 0 0 0 184MA-1-5 235 0 65 170 0 0 0 170
Triton MA-1-5/MA-1-5 229 0 0 229 0 0 0 229MA-1-4 518 0 182 337 0 0 0 337MA-1-3/MA-1-4 1,048 0 1048 0 0 0 0 0MA-1-3 3,238 0 1991 1,247 661 661 0 586MA-1-2/MA-1-3 482 0 482 0 0 0 0 0MA-1-2 590 0 590 0 0 0 0 0MA-1-1 632 0 509 123 0 0 0 123JE-30 1,999 0 1667 333 188 110 79 144
Duckabush JE-29/JE-30 751 0 751 0 0 0 0 0JE-29 1,097 0 932 165 165 0 165 0JE-28/JE-29 4,041 0 3181 860 860 0 860 0JE-28 3,745 1,556 0 2,189 1,874 145 1,729 316JE-27 2,127 380 673 1,074 754 754 0 320JE-26/JE-27 519 0 368 151 0 0 0 151
Dabob RegionPleasant Harbor JE-26 717 0 636 81 0 0 0 81
JE-25/JE-26 2,017 0 1988 28 28 28 0 0JE-25 2,019 541 1337 141 141 141 0 0
PHarbor / Dose JE-24/JE-25 1,519 0 280 1,239 1,239 0 1,239 0Dosewallips JE-24 8,050 0 2726 5,324 3,113 187 2,926 2,211
JE-23 668 0 503 165 163 163 0 2Jackson Cove JE-22/JE-23 638 0 285 353 0 0 0 353
No Bluff Lgths. (m)

57
Appendix 3. (Continued)
Regions & Drift Total High Bluff Low Bluff
Sub-regions Cells1
Lgth. Lgth. Lgth. Total Accretion Type Barrier Beaches/ Saltmarsh Upland3
(m) (m) (m) (m) Landforms2
Spits/BermsJE-22 905 0 376 528 238 0 238 290JE-21/JE-22 4,100 0 3245 855 851 660 191 3
Pt Whitney JE-21 3,072 814 1034 1,223 387 387 0 836JE-20 1,151 374 405 272 240 240 0 33
PWhitney / Quil JE-19/JE-20 711 711 0 0 0 0 0 0Quilcene JE-19 3,180 2,752 127 301 186 186 0 116
JE18/JE19 7,093 742 0 6,351 5,464 45 5,419 887JE-18 4,170 3,075 152 944 698 698 0 247
Quil / Tarboo JE-17/JE-18 965 965 0 0 0 0 0 0Tarboo JE-17 9,849 0 525 3,286 2,982 2,982 0 304
JE-16/JE-17 5,881 0 881 5,000 2,383 2,383 0 2,617JE-16 19,326 11,385 3113 4,828 3,768 3,768 0 1,060
Tarboo / HazelP JE-15/JE-16 1,494 1,227 63 204 172 172 0 32Northwest Hood Canal RegionHazel Pt JE-15 6,506 3,391 2678 437 383 383 0 54
JE-14 2,966 27 238 810 227 227 0 583HazelP / Thorn JE-13/JE-14 1,238 1,217 0 21 0 0 0 21Thorndyke JE-13 20,374 10,198 2716 7,460 6,737 4,728 2,009 723Shine JE-12/JE-13 1,896 0 0 1,896 314 314 0 1,583
JE-12 3,022 0 1811 1,211 1,142 1,059 84 69JE-11 3,706 34 2403 1,269 1,011 339 672 258JE10-/JE11 743 453 291 0 0 0 0 0
Whiskey Spit JE-10 3,467 1,419 694 1,354 852 852 0 502JE-9/JE-10 2,616 0 1231 1,385 1,385 1,385 0 0JE-9 1,263 241 716 307 307 307 0 0JE-8/JE-9 277 277 0 0 0 0 0 0JE8 1,302 824 190 288 288 288 0 0JE-7/JE-8 41 0 0 41 41 41 0 0JE-7 7,468 5,159 559 1,750 1,570 1,570 0 180
WhisSpt / PLud JE-6/JE-7 386 386 0 0 0 0 0 0Port Townsend RegionPt Ludlow JE-6 3,024 975 858 1,191 1,132 1,132 0 59
JE-5/JE-6 5,468 0 4540 928 136 136 0 792JE-5 4,445 1,613 1501 1,331 507 507 0 824
Mats Mats JE-4/JE-5 7,731 0 4954 2,777 517 0 517 2,259Olele Pt JE-4 894 0 456 438 438 438 0 0
JE-3/JE-4 237 0 216 20 20 20 0 0JE-3 227 0 147 80 80 80 0 0JE-2 1,003 0 858 145 145 145 0 0
OleleP / OakBay JE-1/JE-2 823 378 445 0 0 0 0 0Oak Bay JEF-1 5,085 3,052 447 1,586 1,355 1,355 0 231
JEF-2 4,697 778 1399 2,520 1,496 1,496 0 1,024Oakbay / EMarr JEF-2/JEFF-3 1,753 1,081 672 0 0 0 0 0E Marrowstone JEF-3 10,037 8,599 509 928 368 368 0 561
JEF-3/JEF-4 173 0 0 173 173 173 0 0JEF-4 620 342 0 278 278 278 0 0
EMarr / Flagler JEF-4/JEF-5 848 848 0 0 0 0 0 0Flagler JEF-5 1,640 767 147 726 726 726 0 0
JEF-5/JEF-6 288 0 0 288 288 288 0 0JEF-6 2,342 1,331 133 878 766 766 0 112
Flagler / MystB JEF-6/JEF-7 1,484 790 414 280 280 280 0 0Mystery Bay JEF-7 1,750 221 703 825 545 401 144 280
JEF-7/JEF-8 1,904 0 770 1,134 236 0 236 898MystB / KilisutW JEF-8 750 0 702 48 0 0 0 48Kilisut West JEF-9 4,003 1,428 2164 412 28 0 28 383
JEF-9/JEF-10 1,901 0 0 1,901 1,901 0 1,901 0JEF-10 3,864 420 2691 753 460 417 43 293JEF-10/JEF-11 1,263 961 303 0 0 0 0 0JEF-11 3,008 469 1305 1,233 1,026 1,026 0 207JEF-11/JEF-12 87 0 0 87 87 87 0 0JEF-12 546 0 300 246 246 246 0 0
KilisutW / Hlock JEF-13 1,374 1,072 12 290 290 290 0 0
No Bluff Lgths. (m)

58
Appendix 3. (Continued)
Regions & Drift Total High Bluff Low Bluff
Sub-regions Cells1
Lgth. Lgth. Lgth. Total Accretion Type Barrier Beaches/ Saltmarsh Upland3
(m) (m) (m) (m) Landforms2
Spits/BermsHadlock JEF13/JEF-14 2,236 97 0 2,139 1,871 1,871 0 268Hadlock JEF-14 1,175 863 0 312 186 186 0 126Hadlock JEF-15 3,250 364 926 1,960 281 281 0 1,679Gov Cut JEF-2/JEF-15 1,310 0 805 506 433 433 0 72Gov Cut JEF-1/JEF-16 3,106 0 666 2,440 1,137 1,137 0 1,303Hadlock JEF-16 1,048 0 667 381 175 175 0 206Hadlock JEF-16/JEF-17 1,566 0 0 1,566 322 322 0 1,244Hadlock JEF-17 982 0 56 926 371 371 0 555Hadlock JEF-18 1,794 597 196 1,000 0 0 0 1,000Hadlock JEF-19 2,460 207 0 2,252 82 0 82 2,170Hadlock JEF-19/JEF-20 243 243 0 0 0 0 0 0Hadlock JEF-20 1,752 61 614 1,077 1,077 1,077 0 0Hadlock JEF-20/JEF-21 670 0 0 670 670 670 0 0Hadlock JEF-21 888 444 0 444 444 444 0 0Hlock / PtTowns JEF-21/JEF-22 1,469 1,469 0 0 0 0 0 0Pt Townsend JEF-22 12,326 2,260 215 9,852 2,223 2,223 0 7,629PtTowns / NBch JEF-22/JEF-23 1,808 0 0 1,808 1,808 1,808 0 0Strait RegionNorth Beach JEF-23 7,856 7,070 324 463 83 83 0 380NBch / Disco JEF-23/JEF-24 1,495 1,495 0 0 0 0 0 0Discovery JEF-24 5,525 3,599 380 1,546 1,037 1,037 0 510
JEF-24/JEF-25 651 0 0 651 651 651 0 0JEF-25 6,457 4,117 1488 852 852 852 0 0JEF-25/JEF-26 2,412 2,277 134 0 0 0 0 0JEF-26 2,620 245 594 1,781 651 651 0 1,130JEF-26/JEF-27 7,732 199 1285 6,248 2,233 167 2,067 4,015JEF-27 3,086 1,826 662 599 372 372 0 226JEF-27/JEF-28 1,644 1,644 0 0 0 0 0 0JEF-28 1,452 692 342 417 417 417 0 0JEF-28/JEF-29 1,450 62 28 1,359 817 817 0 542JEF-29 4,468 1,993 767 1,707 1,559 674 885 148JEF-29/JF-18-5 1,142 1,058 0 84 84 84 0 0JF-18-5 2,329 1,531 0 798 798 798 0 0JF-18-4 1,256 276 0 979 847 847 0 132
Disco / RockyP JF-18-3/JF-18-4 459 425 0 34 0 0 34Rocky Pt JF-18-3 675 295 0 380 380 0 0
JF-18-2/JF-18-3 126 0 0 126 126 126 0 0JF-18-2 1,619 1,429 0 190 171 171 0 19JF-18-1/JF-18-2 978 978 0 0 0 0 0 0JF-18-1 4,941 3,305 96 1,541 1,541 1,541 0 0
RockyP / SeqB JF-17-5/JF-18-1 234 0 0 234 234 234 0 0Sequim Bay JF-17-5 1,298 0 123 1,175 1,175 1,175 0 0
JF-17-5/JF-17-6 966 0 517 449 449 449 0 0JF-17-6 1,429 852 40 538 485 485 0 53JF-17-6/JF-17-7 1,424 1,175 82 168 0 0 0 168JF-17-7 4,532 1,054 2031 1,447 1,379 1,379 0 67JF-17-3/JF-17-7 3,232 0 0 3,232 2,094 550 1,543 1,138JF-17-3 4,877 1,359 3109 409 274 274 0 135JF-17-2/JF-17-3 2,683 0 420 2,263 0 0 0 2,263JF-17-2 1,681 773 300 608 608 608 0 0JF-17-1/JF-17-2 3,126 0 0 3,126 3,126 433 2,694 0
Gibson Spit JF-17-1 3,345 1,875 0 1,470 1,380 1,380 0 90JF-16-6/JF-17-1 3,382 253 49 3,080 2,839 2,839 0 241
Jamestown JF-16-6 6,849 56 0 6,793 6,793 4,325 2,468 0
1 Drift cells are identified by alphanumeric code; e.g.,KS-1-3. Some drift cells have combination codes that indicate a single
drift cell; e.g., KS-1-3/KS-1-4. In many cases, a drift cell may overlap two subregions (and regions). Such cases are indicated by a combination of abbreviated subregion names; e.g., the name Foulw / DKey, indicates the drift cell KS-1-4/KS-1-5 overlaps into the subregions Foulweather and Driftwood Key.2 Accretion type landforms include barrier beaches, spits and berms (compiled together as one grouping) and saltmarshes.
Total lengths for accretion type landforms, for combined beaches, spits and berms, and for saltmarshes are shown.
3 The upland category generally applies where the extent of roadways, residential development, fill, or other human structures is
so dense that the natural landform is obscured. See also discussion in Backshore Landforms section under Results and Discussion in main body of report.
No Bluff Lgths. (m)

59
Appendix 4. Error analysis
To evaluate the accuracy of our approach relative to onshore based GPS mapping, we compared our boat-based, “snapped” data to features mapped on foot employing a high-resolution Trimble PathFinder Pro-XL GPS over two shoreline segments, a 6.3 km segment near Lofall, WA and a 3.3 km segment near Shine, WA. By this comparison, we estimated percent omissions (e.g. “missed” features) and horizontal accuracy errors (e.g. in the length and position of features in meters). Bulkhead omission/commission analysis:
For the bulkhead error analyses the onshore survey was considered to be accurate and the degree of error for the boat survey was established using this benchmark.
The first analysis measured errors of omission and commission. The onshore
survey recorded 67 bulkheads of which 13 were not observed in the boat-based survey. This yielded an omission error rate of 19.40% (Table 1). There were no errors of commission. The average length for missed bulkheads was 17.56 meters (standard deviation = 9.32 meters, standard error = 2.59 meters). The average length for corresponding bulkheads was 72.52 meters (standard deviation = 53.15 meters, standard error = 7.23 meters). Table 1: Omission/Commission errors Boat Survey bulkheads observed bulkheads not observed percent omission error Onshore bulkheads observed 54 13 19.40Survey bulkheads not observed 0 percent commission error 0 Bulkhead length analysis:
The second bulkhead error analysis focused on a comparison of the bulkhead lengths for the 54 features observed in both the onshore and boat surveys. The length of the onshore survey bulkhead (Ls) was subtracted from the length of its corresponding boat survey bulkhead (Lb). The absolute value of this number was then divided by the onshore survey bulkhead length and multiplied by 100.
(|Lb-Ls| / Ls)*100
This calculation yields the percentage of error in the measure of the boat survey bulkhead when the onshore survey bulkhead length is considered accurate. These percentages were then averaged for all 54 features and yielded a 22.84% length error rate. The sample was then split into two subsamples, one in which the boat survey lengths were greater than the corresponding onshore survey lengths and one in which the boat

60
survey lengths were less than the corresponding onshore survey lengths. For the subsample of longer boat survey lengths there were 17 features with a length error rate of 11.65%. For shorter boat survey lengths there were 37 features with a length error rate of 27.98%. These statistics show a bias towards more frequently underreporting bulkhead lengths and doing it with a higher margin of error (Table 2). Table 2: Length errors
Percentage Number of bulkheads Overall average percent error 22.8 54
Average percent error when boat survey length was greater than onshore survey length 11.6 17Average percent error when boat survey length was less than onshore survey length 28.0 37 Bulkhead position analysis:
Positional differences along the shoreline for corresponding bulkheads in both surveys were analyzed using the center points for these features. The average distance between the location of a boat survey center point and a corresponding onshore survey center point was 17.08 meters (standard deviation = 12.06 meters, standard error = 1.64 meters). Bulkhead attribute analysis:
The final bulkhead error analysis involves the accuracy of bulkhead attributes (i.e., construction material, angle[vertical or sloped], and position [above, at or below ordinary high water]). The following analysis compares 70 features between the onshore and boat surveys. This number of features is higher than for the above omission/commission, length and center point analyses because of instances where it was felt that the boat survey had identified a bulkhead correctly in relation to its existence and size, but had not correctly identified all the attribute changes that had occurred along its length as identified by the onshore survey. This analysis takes into account these missed changes in the bulkhead attributes.
Table 3 describes the number of features and percent of total features where the attribute classification of the boat survey matched that of the onshore survey. The results of the table show that while for only 19 of the features (27%) did all three attributes match, the angle and material attributes together matched for 60 of the 70 features (19 + 41=60) or 86% of the time. The position attribute matched for only 23 of the 70 features (19+2+1+1=23) or 33% of the time. The material and angle attributes matched for 62 (19+41+1+1=62) and 66 (19+41+2+4=66) of the 70 features respectively, or 87% and

61
94% of the time. Thus it can be seen that the largest attribute error occurred in describing the bulkhead position as above, at or below ordinary high water. Table 3: Attribute errors type of attribute match number of features percent of total match of all attributes 19 27.2match of angle and material attributes only 41 58.6
match of angle and position attributes only 2 2.9match of material and position attributes only 1 1.4
match of angle attribute only 4 5.7match of material attribute only 1 1.4match of position attribute only 1 1.4match of no attributes 1 1.4
Totals 70 100.0 Omission/commission analysis for other shoreline features: This analysis addresses errors of omission and commission for features other than bulkheads, including docks, jetties, launch ramps and rail launches. Stairs were not included in these analyses because the onshore survey did not use the same criterion to identify stairs as the boat survey.1 Again, for the point error analysis the onshore survey was considered to be accurate and the degree of error for the boat survey was established using this benchmark.
The onshore survey recorded 39 features of which 16 were not observed in the boat-based survey. This yielded an omission error rate of 41%. One feature out of 24 observed in the boat-based survey was not recorded in the onshore survey yielding a commission error rate of about 4% (Table 4). Table 4: Omission/Commission errors
Boat Survey points observed points not observed percent omission error Onshore points observed 23 16 41.0Survey points not observed 1 percent commission error 4.2
1 The boat survey only identified stairs that were separate from other more intrusive features such as bulkheads. The onshore survey identified all stair features.

62
Position analysis for other shoreline features:
Positional differences along the shoreline for corresponding non-bulkhead features were also analyzed. The average distance between the location of a boat survey point and a corresponding onshore survey point was 15.97 meters (standard deviation = 13.43 meters, standard error = 2.80 meters).