Embed Size (px)
Citation preview

VOL. 11, NO. 9, MAY 2016 ISSN 1819-6608
ARPN Journal of Engineering and Applied Sciences ©2006-2016 Asian Research Publishing Network (ARPN). All rights reserved.
www.arpnjournals.com
5812
SHORT-TERM AND LONG-TERM LAND SUBSIDENCE CALCULATION USING ANALYTICAL RELATIONS AND NUMERICAL MODELING BY FLAC3D SOFTWARE FOR SOUTHERN PART OF LINE THREE OF TEHRAN SUBWAY UNDER RAIL LINES AND INVESTIGATION OF
INFLUENCING PARAMETERS
Hossein Soltani-Jigheh1, Parviz Enany2, Manouchehr Tajrostami2 and Ahmad Yaghoubi2 1Department of Civil Engineering, Azarbaijan Shahid Madani University, Tabriz, Iran
2Department of Geotechnical Engineering, East Azarbaijan Science and Research Branch, Islamic Azad University, Tabriz, Iran E-Mail: [email protected]
ABSTRACT
Earth response to excavation an underground tunnel appears as changing stress field and displacements around
excavation zone and the changes depend on various factors, such as geological conditions, geotechnical characteristics, the drilling process and the implementation of final and temporary maintenance. There also should be a separation between these items: 1) subsidence due to drilling methods in tunnelling, 2) conditions on the ground in terms of construction, 3) loads available for subsidence in cutting face and subsidence that occurs on the backside of cutting face. However, due to the progress on the construction of automated drilling machines, such as the tunnel boring machines (TBM) and Roadheader, paying attention to benefits of each of these devices is important to reduce occurrence of subsidence. Among all a device like TBM can change stress and displacement in the lands around the tunnel via simultaneously putting pressure on cutting face and walls of tunnels using filler injection, and this change should be so that amount of subsidence reach the minimum in short-term and long-term period comparing to the traditional methods of excavation of underground tunnels. In this research, calculation of land subsidence due to a tunnel passing under rail lines and investigation of influencing parameters on subsidence using theoretical relations and modelling by FLAC3D software are implemented. In order to have a real sample, one of the lifelines in Tehran subway was selected and influencing parameters including amount and place of dynamic forces caused by passing trains from the ground, underground tunnel boring method, and in the case of drilling with TBM, pressure changes on cutting face and tunnel walls simultaneous with digging the tunnel were considered. According to local observations and carried out analyses, subsidence of land in short-term using mapping camera readings in long-term using analytical relations and computer modelling is determined, so in the case of subsidence being situated in dangerous range, injuries and irreparable damage be avoided through providing suitable solutions. Keywords: subsidence, tunnel, dynamic force, TBM, FLAC3D. 1. INTRODUCTION
Due to increasing urbanization and lack of space on the ground in metropolis and the need to develop the public transport system, construction of underground subway lines in these cities has become inevitable. Subway tunnels in these areas have faced various problems, such as the lack of adequate space for equipping the ingot workshop, shaft construction, local traffic guidance and passing urban utilities. The other issues which plays a significant role in changing the stress condition in the drilling of an underground tunnel is the travelling loads on the ground surface like cars and trains. Therefore, determination of subsidence due to underground drillings and comparing with allowable values is a significant and considerable point. Housi et al. have studied about subsidence of tunnel under dynamic loads and presented a report on Seattle tunnel with 39 ft diameter and 123 ft depth in clays. Terzaghi’s report in 1942 was among the first reports that with high precision in detail investigated subsidence in Chicago tunnel [1]. In 1964, Hartmark presented two reports on land subsidence due to tunnel excavating in clays with silty layers. In 1969, Peck reviewed all researches on subsidence due to
tunnel digging up to that time and provided a relation for estimation of longitudinal land subsidence [2].
Digging shallow tunnels is more worrying when it is encountered with underground water. In these cases, groundwater level must be lowered temporarily or permanently by constructing drainage network. If the drawdown in water level be local, it causes problems such as the formation and rearranging seeds clay as a result of rising underground water level and creates problems for surface structures. In cases that the tunnels dug close to the ground and maintained insufficiently, occurrence of primary type of subsidence is possible. In this condition, a rigid block is formed in the ground, with stretched boundaries to the surface by two or more grinding wheel. Occurred displacement at the ground surface at the top of the drilled area has similar size to the size of the displacement in tunnel [3]. Kim and Tonon estimated cutting face maintenance pressure via finite element numerical analysis and with assumption of Mohr-Coulomb; failure criterion derived some equations [4]. Liu and Wang examined gap parameter based on three-dimensional elastoplastic finite element analysis. They presented needed relations for subsidence analysis [5].
VOL. 11, NO. 9, MAY 2016 ISSN 1819-6608
ARPN Journal of Engineering and Applied Sciences ©2006-2016 Asian Research Publishing Network (ARPN). All rights reserved.
www.arpnjournals.com
5813
2. SOLUTION Using numerical methods with modelling actual
conditions of a project, we can obtain a careful analysis to investigate the behavior of underground structures [6-7]. In order to get suitable output from analytical and numerical methods to predict of land subsidence due to tunnel digging, detailed information of the project is required. This information include geological and engineering properties of soil, tunnel construction method and equipment, engineering preservatives properties and how they are enforced after drilling, the conditions on the ground like the type and amount of loads on the surface of normal variations caused by the passage of time on the ground surface etc.
The main objective of this research is prediction of ground subsidence due to tunnelling in the vicinity Tehran railway lines. By gathering required data and using experimental and analytical relations, the amount of ground surface subsidence was calculated. In addition, to have more comprehensive and to consider other non-
included parameters in mentioned relations, a line of the project was modelled by FLAC 3D software [8] and the resulted subsidence was compared with local observations and experimental and analytical relations. 3. GEOMETRICAL AND TECHNICAL SPECIFICATIONS OF STUDIED TUNNEL
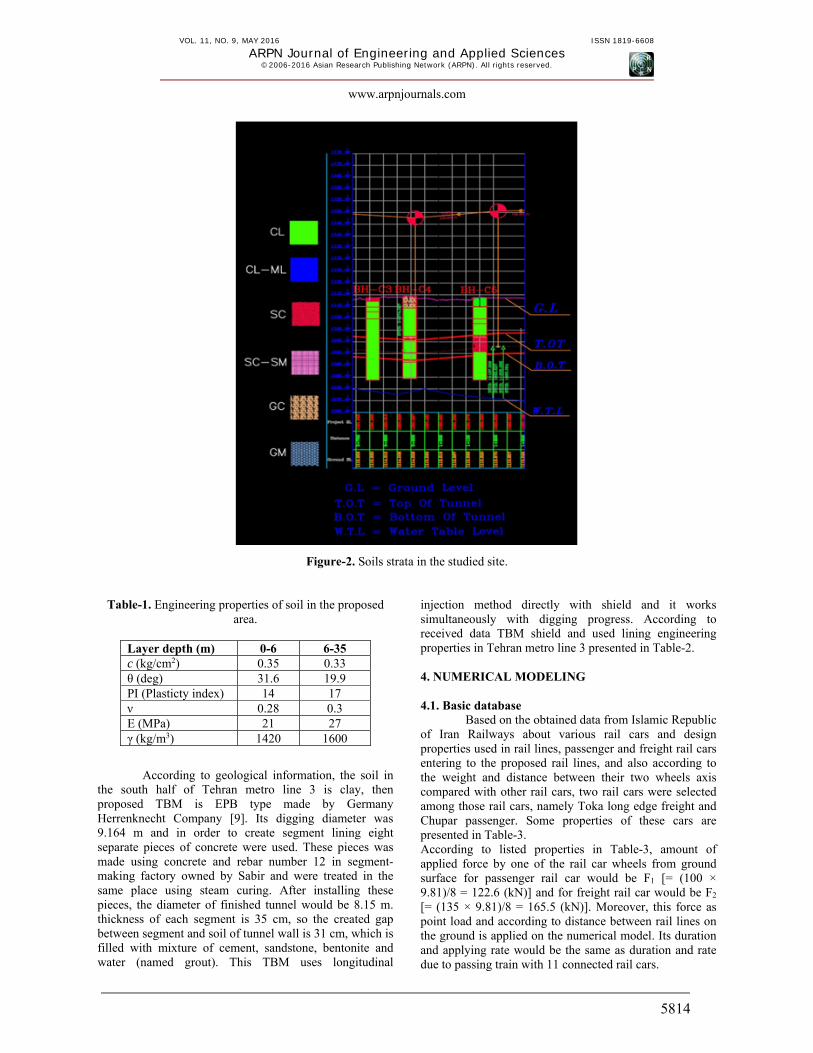
Tehran metro line 3 with 35 km length and two separate directions, is the longest metro line in Middle-east, which is started from Azadegan highway in southwest of Tehran passes through old regions such as Rahahan square, Moniriyeh, and Valiyeasr and gets to northeast of Tehran. It has 28 stations. Selected section of the tunnel to study on is in south part of this line and situated between Javadiyeh Bridge and Robatkarim Square with length of 100 m on which one of the most important rail lines of Iran (Tehran-Ghazvin & Tehran-Ghom railway) passes. Placement of rail lines and tunnel path and borehole logs is shown in Figures 1 and 2.
Figure-1. Tehran metro lines and the project location.
VOL. 11, NO. 9, MAY 2016 ISSN 1819-6608
ARPN Journal of Engineering and Applied Sciences ©2006-2016 Asian Research Publishing Network (ARPN). All rights reserved.
www.arpnjournals.com
5814
Figure-2. Soils strata in the studied site.
Table-1. Engineering properties of soil in the proposed
area.
Layer depth (m) 0-6 6-35 c (kg/cm2) 0.35 0.33 θ (deg) 31.6 19.9 PI (Plasticty index) 14 17 ν 0.28 0.3 E (MPa) 21 27 γ (kg/m3) 1420 1600
According to geological information, the soil in the south half of Tehran metro line 3 is clay, then proposed TBM is EPB type made by Germany Herrenknecht Company [9]. Its digging diameter was 9.164 m and in order to create segment lining eight separate pieces of concrete were used. These pieces was made using concrete and rebar number 12 in segment-making factory owned by Sabir and were treated in the same place using steam curing. After installing these pieces, the diameter of finished tunnel would be 8.15 m. thickness of each segment is 35 cm, so the created gap between segment and soil of tunnel wall is 31 cm, which is filled with mixture of cement, sandstone, bentonite and water (named grout). This TBM uses longitudinal
injection method directly with shield and it works simultaneously with digging progress. According to received data TBM shield and used lining engineering properties in Tehran metro line 3 presented in Table-2. 4. NUMERICAL MODELING 4.1. Basic database
Based on the obtained data from Islamic Republic of Iran Railways about various rail cars and design properties used in rail lines, passenger and freight rail cars entering to the proposed rail lines, and also according to the weight and distance between their two wheels axis compared with other rail cars, two rail cars were selected among those rail cars, namely Toka long edge freight and Chupar passenger. Some properties of these cars are presented in Table-3. According to listed properties in Table-3, amount of applied force by one of the rail car wheels from ground surface for passenger rail car would be F1 [= (100 × 9.81)/8 = 122.6 (kN)] and for freight rail car would be F2 [= (135 × 9.81)/8 = 165.5 (kN)]. Moreover, this force as point load and according to distance between rail lines on the ground is applied on the numerical model. Its duration and applying rate would be the same as duration and rate due to passing train with 11 connected rail cars.
VOL. 11, NO. 9, MAY 2016 ISSN 1819-6608
ARPN Journal of Engineering and Applied Sciences ©2006-2016 Asian Research Publishing Network (ARPN). All rights reserved.
www.arpnjournals.com
5815
Table-2. TBM shield and tunnel lining properties.
Part name
Parameter Shield
Lining (segment)
Thickness (m) 0.1 0.35
Density (kg/m3) 7800 2500 Elasticity Module(GPa) 200 22.5 Poisson's Ratio 0.25 0.2 Length (m) 10.5 1.5 Outer Diameter 9.126 8.85
Table-3. Properties of two types of railway rail cars.
Rail car type Long edge
fright Chupar
passenger
Length of rail car(m) 19.2 22 Moving speed(km/h) 60 60 Distance between two cabins (m)
0.8 0.6
Distance between two axis(m)
1.2 1
Rail car weight(ton) 135 100
4.2. Model dynamic damping Oscillating natural dynamic systems gradually
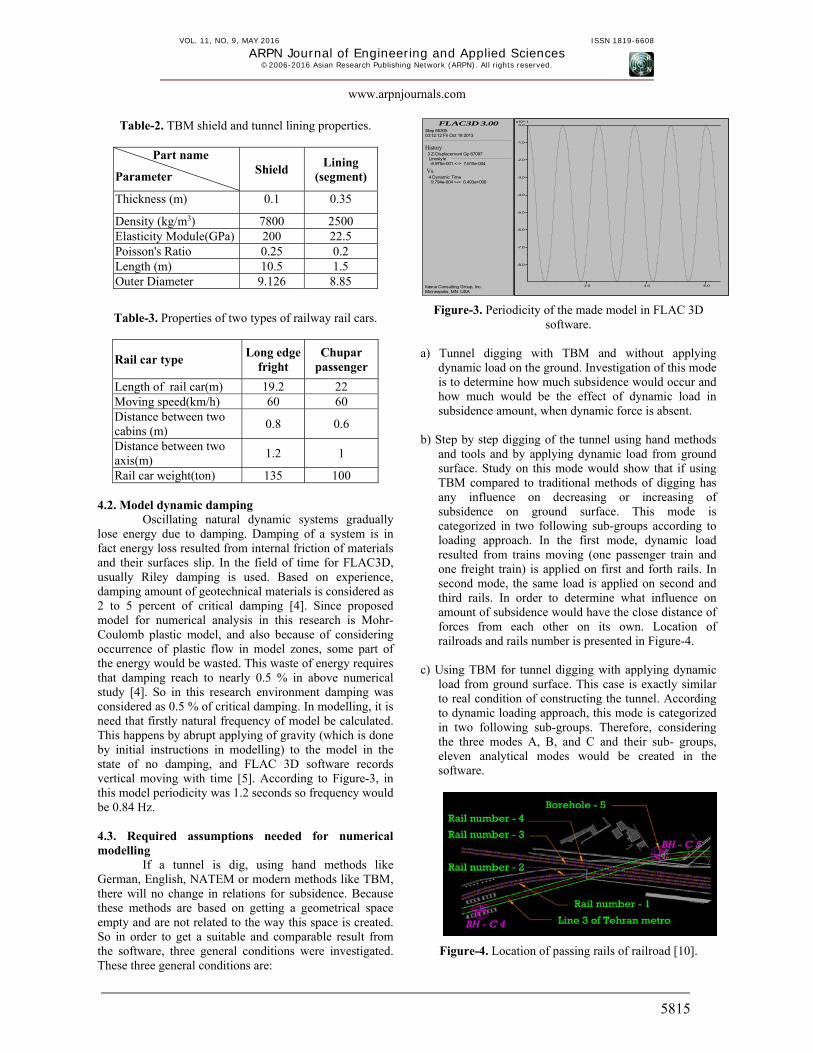
lose energy due to damping. Damping of a system is in fact energy loss resulted from internal friction of materials and their surfaces slip. In the field of time for FLAC3D, usually Riley damping is used. Based on experience, damping amount of geotechnical materials is considered as 2 to 5 percent of critical damping [4]. Since proposed model for numerical analysis in this research is Mohr-Coulomb plastic model, and also because of considering occurrence of plastic flow in model zones, some part of the energy would be wasted. This waste of energy requires that damping reach to nearly 0.5 % in above numerical study [4]. So in this research environment damping was considered as 0.5 % of critical damping. In modelling, it is need that firstly natural frequency of model be calculated. This happens by abrupt applying of gravity (which is done by initial instructions in modelling) to the model in the state of no damping, and FLAC 3D software records vertical moving with time [5]. According to Figure-3, in this model periodicity was 1.2 seconds so frequency would be 0.84 Hz. 4.3. Required assumptions needed for numerical modelling
If a tunnel is dig, using hand methods like German, English, NATEM or modern methods like TBM, there will no change in relations for subsidence. Because these methods are based on getting a geometrical space empty and are not related to the way this space is created. So in order to get a suitable and comparable result from the software, three general conditions were investigated. These three general conditions are:
Figure-3. Periodicity of the made model in FLAC 3D software.
a) Tunnel digging with TBM and without applying
dynamic load on the ground. Investigation of this mode is to determine how much subsidence would occur and how much would be the effect of dynamic load in subsidence amount, when dynamic force is absent.
b) Step by step digging of the tunnel using hand methods
and tools and by applying dynamic load from ground surface. Study on this mode would show that if using TBM compared to traditional methods of digging has any influence on decreasing or increasing of subsidence on ground surface. This mode is categorized in two following sub-groups according to loading approach. In the first mode, dynamic load resulted from trains moving (one passenger train and one freight train) is applied on first and forth rails. In second mode, the same load is applied on second and third rails. In order to determine what influence on amount of subsidence would have the close distance of forces from each other on its own. Location of railroads and rails number is presented in Figure-4.
c) Using TBM for tunnel digging with applying dynamic
load from ground surface. This case is exactly similar to real condition of constructing the tunnel. According to dynamic loading approach, this mode is categorized in two following sub-groups. Therefore, considering the three modes A, B, and C and their sub- groups, eleven analytical modes would be created in the software.
Figure-4. Location of passing rails of railroad [10].
FLAC3D 3.00
Itasca Consulting Group, Inc.Minneapolis, MN USA
Step 6630503:12:12 Fri Oct 18 2013
History
2.0 4.0 6.0
-8.0
-7.0
-6.0
-5.0
-4.0
-3.0
-2.0
-1.0
0.0x10^-1
3 Z-Displacement Gp 67097 Linestyle -8.975e-001 <-> 7.615e-004
Vs. 4 Dynamic Time 9.794e-004 <-> 6.493e+000
VOL. 11, NO. 9, MAY 2016 ISSN 1819-6608
ARPN Journal of Engineering and Applied Sciences ©2006-2016 Asian Research Publishing Network (ARPN). All rights reserved.
www.arpnjournals.com
5816
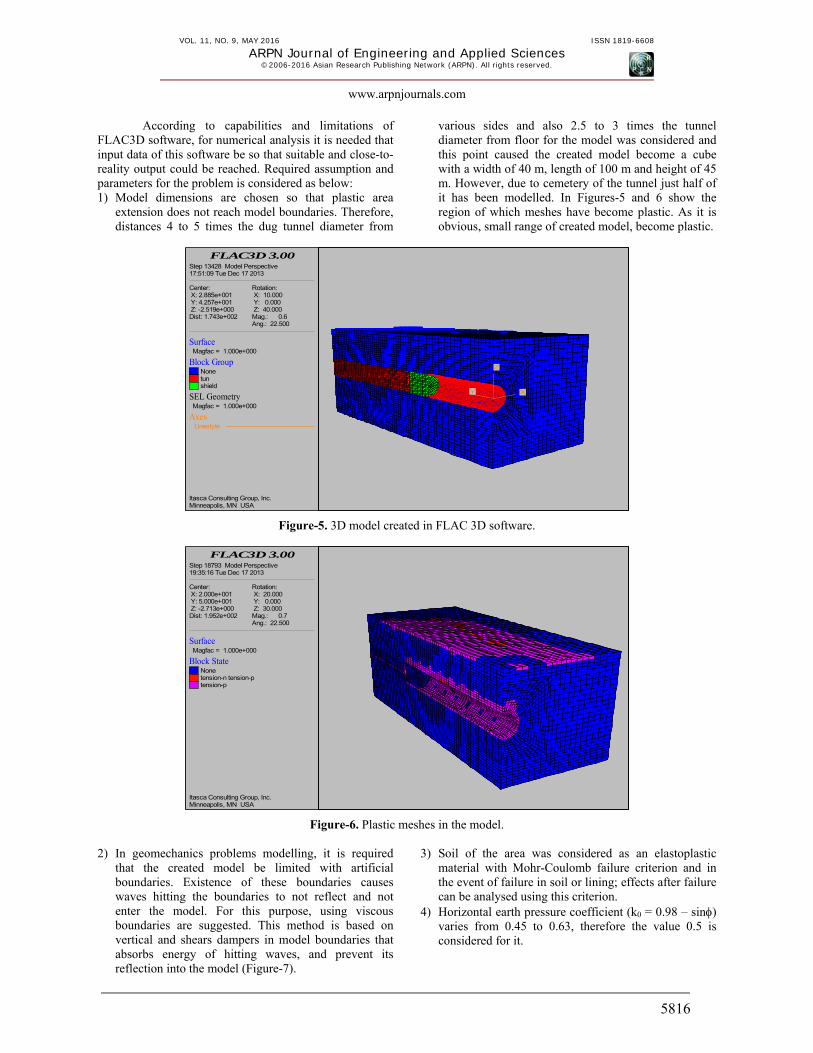
According to capabilities and limitations of FLAC3D software, for numerical analysis it is needed that input data of this software be so that suitable and close-to-reality output could be reached. Required assumption and parameters for the problem is considered as below: 1) Model dimensions are chosen so that plastic area
extension does not reach model boundaries. Therefore, distances 4 to 5 times the dug tunnel diameter from
various sides and also 2.5 to 3 times the tunnel diameter from floor for the model was considered and this point caused the created model become a cube with a width of 40 m, length of 100 m and height of 45 m. However, due to cemetery of the tunnel just half of it has been modelled. In Figures-5 and 6 show the region of which meshes have become plastic. As it is obvious, small range of created model, become plastic.
Figure-5. 3D model created in FLAC 3D software.
Figure-6. Plastic meshes in the model. 2) In geomechanics problems modelling, it is required
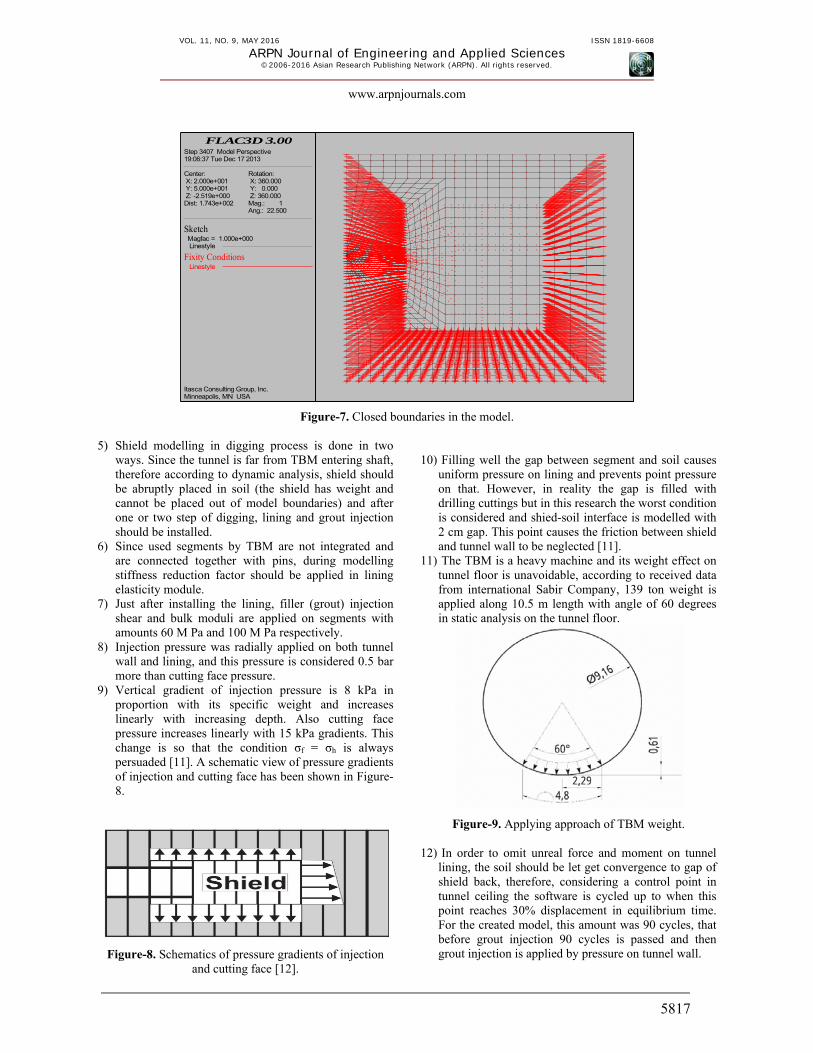
that the created model be limited with artificial boundaries. Existence of these boundaries causes waves hitting the boundaries to not reflect and not enter the model. For this purpose, using viscous boundaries are suggested. This method is based on vertical and shears dampers in model boundaries that absorbs energy of hitting waves, and prevent its reflection into the model (Figure-7).
3) Soil of the area was considered as an elastoplastic material with Mohr-Coulomb failure criterion and in the event of failure in soil or lining; effects after failure can be analysed using this criterion.
4) Horizontal earth pressure coefficient (k0 = 0.98 – sin) varies from 0.45 to 0.63, therefore the value 0.5 is considered for it.
FLAC3D 3.00
Itasca Consulting Group, Inc.Minneapolis, MN USA
Step 13428 Model Perspective17:51:09 Tue Dec 17 2013
Center: X: 2.885e+001 Y: 4.257e+001 Z: -2.519e+000
Rotation: X: 10.000 Y: 0.000 Z: 40.000
Dist: 1.743e+002 Mag.: 0.6Ang.: 22.500
Surface Magfac = 1.000e+000
Block GroupNonetunshield
SEL Geometry Magfac = 1.000e+000
Axes Linestyle
XY
Z
FLAC3D 3.00
Itasca Consulting Group, Inc.Minneapolis, MN USA
Step 18793 Model Perspective19:35:16 Tue Dec 17 2013
Center: X: 2.000e+001 Y: 5.000e+001 Z: -2.713e+000
Rotation: X: 20.000 Y: 0.000 Z: 30.000
Dist: 1.952e+002 Mag.: 0.7Ang.: 22.500
Surface Magfac = 1.000e+000
Block StateNonetension-n tension-ptension-p
VOL. 11, NO. 9, MAY 2016 ISSN 1819-6608
ARPN Journal of Engineering and Applied Sciences ©2006-2016 Asian Research Publishing Network (ARPN). All rights reserved.
www.arpnjournals.com
5817
Figure-7. Closed boundaries in the model. 5) Shield modelling in digging process is done in two
ways. Since the tunnel is far from TBM entering shaft, therefore according to dynamic analysis, shield should be abruptly placed in soil (the shield has weight and cannot be placed out of model boundaries) and after one or two step of digging, lining and grout injection should be installed.
6) Since used segments by TBM are not integrated and are connected together with pins, during modelling stiffness reduction factor should be applied in lining elasticity module.
7) Just after installing the lining, filler (grout) injection shear and bulk moduli are applied on segments with amounts 60 M Pa and 100 M Pa respectively.
8) Injection pressure was radially applied on both tunnel wall and lining, and this pressure is considered 0.5 bar more than cutting face pressure.
9) Vertical gradient of injection pressure is 8 kPa in proportion with its specific weight and increases linearly with increasing depth. Also cutting face pressure increases linearly with 15 kPa gradients. This change is so that the condition σf = σh is always persuaded [11]. A schematic view of pressure gradients of injection and cutting face has been shown in Figure-8.
Figure-8. Schematics of pressure gradients of injection and cutting face [12].
10) Filling well the gap between segment and soil causes
uniform pressure on lining and prevents point pressure on that. However, in reality the gap is filled with drilling cuttings but in this research the worst condition is considered and shied-soil interface is modelled with 2 cm gap. This point causes the friction between shield and tunnel wall to be neglected [11].
11) The TBM is a heavy machine and its weight effect on tunnel floor is unavoidable, according to received data from international Sabir Company, 139 ton weight is applied along 10.5 m length with angle of 60 degrees in static analysis on the tunnel floor.
Figure-9. Applying approach of TBM weight. 12) In order to omit unreal force and moment on tunnel
lining, the soil should be let get convergence to gap of shield back, therefore, considering a control point in tunnel ceiling the software is cycled up to when this point reaches 30% displacement in equilibrium time. For the created model, this amount was 90 cycles, that before grout injection 90 cycles is passed and then grout injection is applied by pressure on tunnel wall.
FLAC3D 3.00
Itasca Consulting Group, Inc.Minneapolis, MN USA
Step 3407 Model Perspective19:06:37 Tue Dec 17 2013
Center: X: 2.000e+001 Y: 5.000e+001 Z: -2.519e+000
Rotation: X: 360.000 Y: 0.000 Z: 360.000
Dist: 1.743e+002 Mag.: 1Ang.: 22.500
Sketch Magfac = 1.000e+000 Linestyle
Fixity Conditions Linestyle
VOL. 11, NO. 9, MAY 2016 ISSN 1819-6608
ARPN Journal of Engineering and Applied Sciences ©2006-2016 Asian Research Publishing Network (ARPN). All rights reserved.
www.arpnjournals.com
5818
4.4. Model validation (static analysis of the model) Always before any analysing with FLAC3D
software, validation of created model must be investigated. It can be said that the created model has static equilibrium when un-equilibrium-making forces approach to zero and at the end of the process speed at a control point with respect to the number of passed computational cycles, reach 0.01 % of its primary speed (speed approach to zero). If one of the above cases does not occur, it shows
not getting plastic and not reaching equilibrium of the model. In order to prevent doubt about the model, c and of the soil should be increased and after finishing the primary static analysis, its real value should be given to the software. Figures-10 and 11 show convergence of unequilibrium-making force and approach of speed to zero for the point in ceiling of the tunnel.
Figure-10. Convergence of unequilibrium-making force to zero for the point in the tunnel ceiling.
Figure-11. Convergence of speed to zero fir the point in the tunnel ceiling.
In manual excavation, maintaining the cutting face by applying additional pressure on it or by pressure due to grout injection of tunnel wall is not necessary. In TBM digging, this point is significant and above cases can change the amount of subsidence on the ground surface and effect of those forces must be considered in software modelling. In order to determine the effect of cutting face pressure and injection pressure, simultaneously with digging and dynamic loading type, these pressures should be applied in software in four modes. In each step, 10 kPa is added to injection and cutting face pressure compared to previous step, up to when pressure reach 57 kPa for cutting face and 107 for injection. A different mode of analysis and acronym suitable with modelling condition is presented in Table-3.
With respect to the railroad lines on the ground, for covering well an area where the subsidence occurs, required length for modelling should be considered 100 m. For modelling, one point should be considered as reference point. The starting point of consideration is zero point of coordinate axis (0, 0, 0), and end of the model would be placed at (0, 100, 0). First rail to forth one; would be placed at (0, 27, 19.9) and (0, 41.5, 19.9) and (0, 61.5, 19.9) and (0, 73, 19.9) respectively (the coordinate is in meter) that dynamic force due to on-ground passing trains are applied on the model in the same coordinates. Therefore, it is obvious that necessary length for modelling should be more than 70 meters because the forth rail is situated at (0, 73, 19.9). In subsidence analysis, both longitudinal (parallel to tunnel drilling direction) and transverse subsidence should be investigated
FLAC3D 3.00
Itasca Consulting Group, Inc.Minneapolis, MN USA
Step 340718:58:57 Tue Dec 17 2013
History
1.0 2.0 3.0
x10^3
0.2
0.4
0.6
0.8
1.0
1.2
1.4
1.6
1.8
2.0
2.2
2.4
x10^5
1 Max. Unbalanced Force Linestyle 1.551e+002 <-> 2.447e+005
Vs. Step 1.000e+001 <-> 3.400e+003
FLAC3D 3.00
Itasca Consulting Group, Inc.Minneapolis, MN USA
Step 340719:00:25 Tue Dec 17 2013
History
1.0 2.0 3.0
x10^3
-6.0
-4.0
-2.0
0.0
2.0
4.0
6.0x10^-6
6 Y-Velocity Gp 67097 Linestyle -7.186e-006 <-> 6.071e-006
Vs. Step 1.000e+001 <-> 3.400e+003
VOL. 11, NO. 9, MAY 2016 ISSN 1819-6608
ARPN Journal of Engineering and Applied Sciences ©2006-2016 Asian Research Publishing Network (ARPN). All rights reserved.
www.arpnjournals.com
5819
simultaneously, since the area where subsidence occurs is 3D and simultaneous integration of these two subsidence can determine the subsidence-effected region. In order to map longitudinal and transverse subsidence profile, the software adjusted to pick up the points in longitudinal
direction starting from zero point of coordinate with 1 m distance to the next point and in transverse direction (from X=0 to X=10) with 2 m.
Table-3. Types of created modes for software analysis.
Type of tunnel
excavation Dynamic load
applying locationCutting face
pressure (kPa) Injection
pressure (kPa)Mode name
manual On rails 1 and 4 0 0 H-14-00-00 manual On rails 2 and 3 0 0 H-23-00-00 TBM Without loading 27 77 T-00-27-77 TBM On rails 1 and 4 27 77 T-14-27-77 TBM On rails 1 and 4 37 87 T-14-37-87 TBM On rails 1 and 4 47 97 T-14-47-97 TBM On rails 1 and 4 57 107 T-14-57-107 TBM On rails 2 and 3 27 77 T-23-27-77 TBM On rails 2 and 3 37 87 T-23-37-77 TBM On rails 2 and 3 47 97 T-23-47-97 TBM On rails 2 and 3 57 107 T-23-57-107
5. RESULTS 5.1. Effect of location of dynamic load
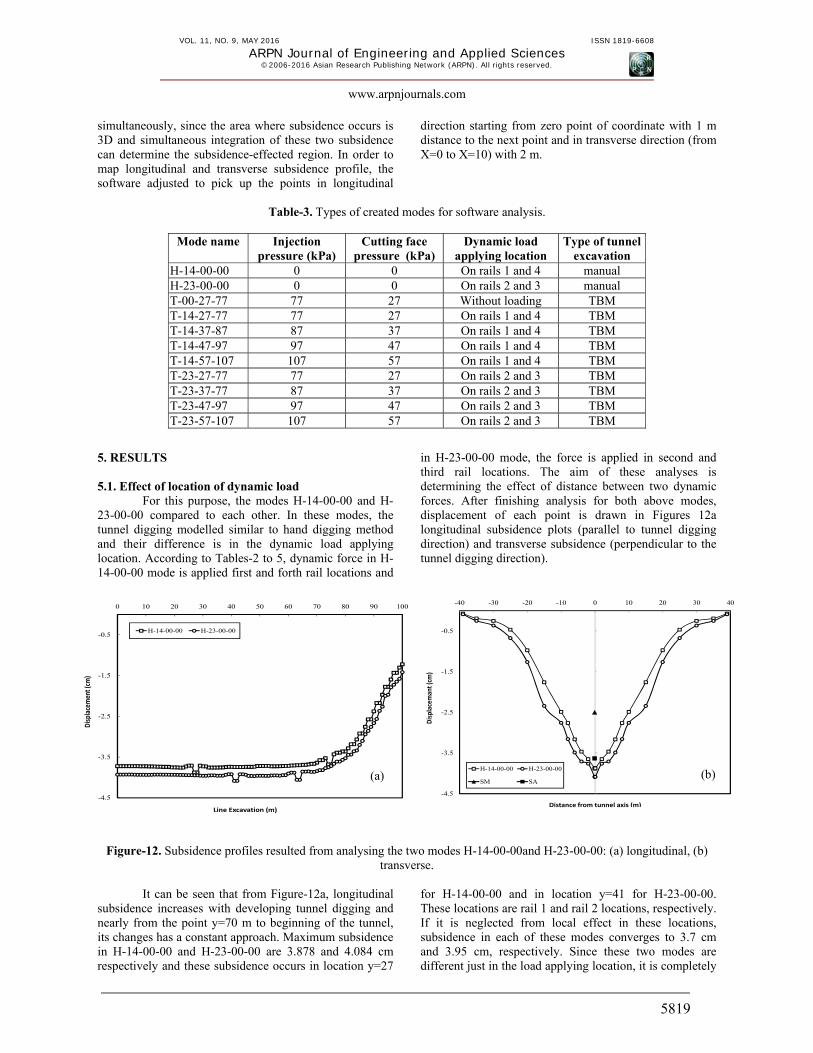
For this purpose, the modes H-14-00-00 and H-23-00-00 compared to each other. In these modes, the tunnel digging modelled similar to hand digging method and their difference is in the dynamic load applying location. According to Tables-2 to 5, dynamic force in H-14-00-00 mode is applied first and forth rail locations and
in H-23-00-00 mode, the force is applied in second and third rail locations. The aim of these analyses is determining the effect of distance between two dynamic forces. After finishing analysis for both above modes, displacement of each point is drawn in Figures 12a longitudinal subsidence plots (parallel to tunnel digging direction) and transverse subsidence (perpendicular to the tunnel digging direction).
Figure-12. Subsidence profiles resulted from analysing the two modes H-14-00-00and H-23-00-00: (a) longitudinal, (b) transverse.
It can be seen that from Figure-12a, longitudinal
subsidence increases with developing tunnel digging and nearly from the point y=70 m to beginning of the tunnel, its changes has a constant approach. Maximum subsidence in H-14-00-00 and H-23-00-00 are 3.878 and 4.084 cm respectively and these subsidence occurs in location y=27
for H-14-00-00 and in location y=41 for H-23-00-00. These locations are rail 1 and rail 2 locations, respectively. If it is neglected from local effect in these locations, subsidence in each of these modes converges to 3.7 cm and 3.95 cm, respectively. Since these two modes are different just in the load applying location, it is completely
-4.5
-3.5
-2.5
-1.5
-0.5
0 10 20 30 40 50 60 70 80 90 100
Displacem
ent (cm
)
Line Excavation (m)
H-14-00-00 H-23-00-00
-4.5
-3.5
-2.5
-1.5
-0.5
-40 -30 -20 -10 0 10 20 30 40
Displacem
ant (cm
)
Distance from tunnel axis (m)
H-14-00-00 H-23-00-00
SM SA(a) (b)
VOL. 11, NO. 9, MAY 2016 ISSN 1819-6608
ARPN Journal of Engineering and Applied Sciences ©2006-2016 Asian Research Publishing Network (ARPN). All rights reserved.
www.arpnjournals.com
5820
obvious that subsidence in H-23-00-00 mode from beginning of the tunnel to its end (y=100) is more than subsidence in H-14-00-00 mode and this can be due to dynamic loads getting closer to each other.
Figure-12b shows that maximum transverse subsidence occurs in tunnel axis and with getting far from that, the subsidence decreases too. In fact, at the vertical distance of 40 meter to tunnel axis, subsidence gets close to zero. Therefore, this plot shows vastness of subsidence-involved area. Transverse subsidence curve for H-23-00-00 mode compared to H-14-00-00 mode has more instantaneous changes and does not have as the same approach as H-14-00-00 mode. These instantaneous changes usually occur adjacent to the central line of the tunnel and at a far distance from the axis of the tunnel, the two graphs have almost similar trend. The reason for this may be due to dynamic forces getting closer to each other, which the dynamic forces acting on the Earth's surface are directly above the tunnel centreline. Subsidence resulted from numerical analysis is more than measured values on the earth surface (MS point) and the average obtained from analytical relations (As point). It is more than the
measured values because FLAC3D software shows displacement of a point after equilibrating the model, therefore with passing more time since metro tunnel digging, the amount of subsidence in tunnel axis direction would be more than 2.5 cm. Nevertheless, being more than analytical relations average is due to existence of dynamic load on ground surface because in analytical conditions for applying, a surface dynamic force is not considered and effect of dynamic load on increase in subsidence is completely obvious.
5.2. Dynamic load effect and its applying location
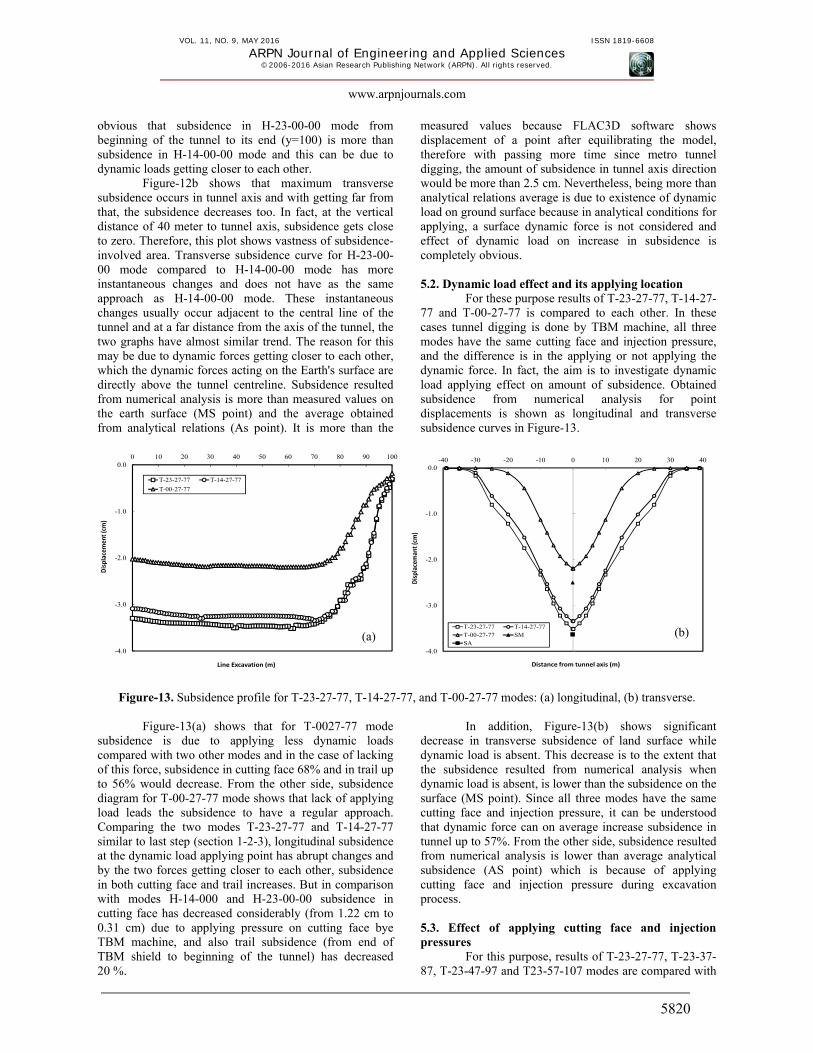
For these purpose results of T-23-27-77, T-14-27-77 and T-00-27-77 is compared to each other. In these cases tunnel digging is done by TBM machine, all three modes have the same cutting face and injection pressure, and the difference is in the applying or not applying the dynamic force. In fact, the aim is to investigate dynamic load applying effect on amount of subsidence. Obtained subsidence from numerical analysis for point displacements is shown as longitudinal and transverse subsidence curves in Figure-13.
Figure-13. Subsidence profile for T-23-27-77, T-14-27-77, and T-00-27-77 modes: (a) longitudinal, (b) transverse.
Figure-13(a) shows that for T-0027-77 mode subsidence is due to applying less dynamic loads compared with two other modes and in the case of lacking of this force, subsidence in cutting face 68% and in trail up to 56% would decrease. From the other side, subsidence diagram for T-00-27-77 mode shows that lack of applying load leads the subsidence to have a regular approach. Comparing the two modes T-23-27-77 and T-14-27-77 similar to last step (section 1-2-3), longitudinal subsidence at the dynamic load applying point has abrupt changes and by the two forces getting closer to each other, subsidence in both cutting face and trail increases. But in comparison with modes H-14-000 and H-23-00-00 subsidence in cutting face has decreased considerably (from 1.22 cm to 0.31 cm) due to applying pressure on cutting face bye TBM machine, and also trail subsidence (from end of TBM shield to beginning of the tunnel) has decreased 20 %.
In addition, Figure-13(b) shows significant decrease in transverse subsidence of land surface while dynamic load is absent. This decrease is to the extent that the subsidence resulted from numerical analysis when dynamic load is absent, is lower than the subsidence on the surface (MS point). Since all three modes have the same cutting face and injection pressure, it can be understood that dynamic force can on average increase subsidence in tunnel up to 57%. From the other side, subsidence resulted from numerical analysis is lower than average analytical subsidence (AS point) which is because of applying cutting face and injection pressure during excavation process.
5.3. Effect of applying cutting face and injection pressures
For this purpose, results of T-23-27-77, T-23-37-87, T-23-47-97 and T23-57-107 modes are compared with
-4.0
-3.0
-2.0
-1.0
0.00 10 20 30 40 50 60 70 80 90 100
Displacemen
t (cm)
Line Excavation (m)
T-23-27-77 T-14-27-77
T-00-27-77
-4.0
-3.0
-2.0
-1.0
0.0-40 -30 -20 -10 0 10 20 30 40
Displacem
ant (cm)
Distance from tunnel axis (m)
T-23-27-77 T-14-27-77T-00-27-77 SMSA
(a) (b)
VOL. 11, NO. 9, MAY 2016 ISSN 1819-6608
ARPN Journal of Engineering and Applied Sciences ©2006-2016 Asian Research Publishing Network (ARPN). All rights reserved.
www.arpnjournals.com
5821
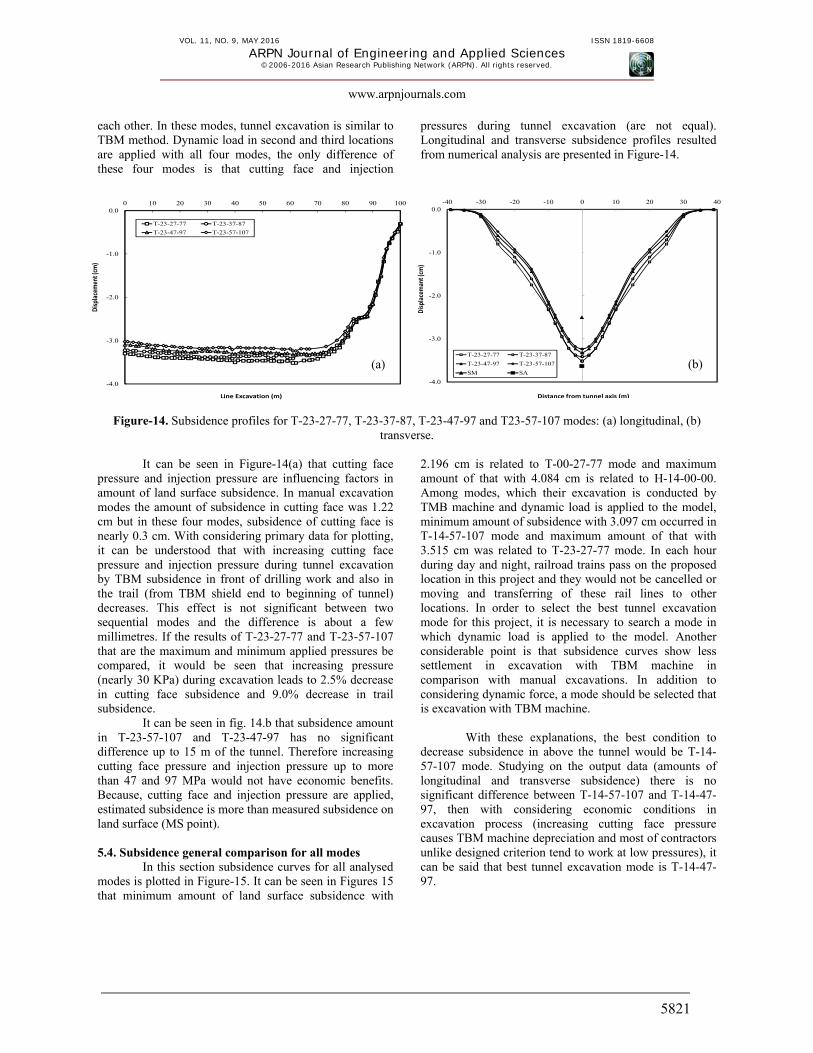
each other. In these modes, tunnel excavation is similar to TBM method. Dynamic load in second and third locations are applied with all four modes, the only difference of these four modes is that cutting face and injection
pressures during tunnel excavation (are not equal). Longitudinal and transverse subsidence profiles resulted from numerical analysis are presented in Figure-14.
Figure-14. Subsidence profiles for T-23-27-77, T-23-37-87, T-23-47-97 and T23-57-107 modes: (a) longitudinal, (b)
transverse.
It can be seen in Figure-14(a) that cutting face pressure and injection pressure are influencing factors in amount of land surface subsidence. In manual excavation modes the amount of subsidence in cutting face was 1.22 cm but in these four modes, subsidence of cutting face is nearly 0.3 cm. With considering primary data for plotting, it can be understood that with increasing cutting face pressure and injection pressure during tunnel excavation by TBM subsidence in front of drilling work and also in the trail (from TBM shield end to beginning of tunnel) decreases. This effect is not significant between two sequential modes and the difference is about a few millimetres. If the results of T-23-27-77 and T-23-57-107 that are the maximum and minimum applied pressures be compared, it would be seen that increasing pressure (nearly 30 KPa) during excavation leads to 2.5% decrease in cutting face subsidence and 9.0% decrease in trail subsidence.
It can be seen in fig. 14.b that subsidence amount in T-23-57-107 and T-23-47-97 has no significant difference up to 15 m of the tunnel. Therefore increasing cutting face pressure and injection pressure up to more than 47 and 97 MPa would not have economic benefits. Because, cutting face and injection pressure are applied, estimated subsidence is more than measured subsidence on land surface (MS point). 5.4. Subsidence general comparison for all modes
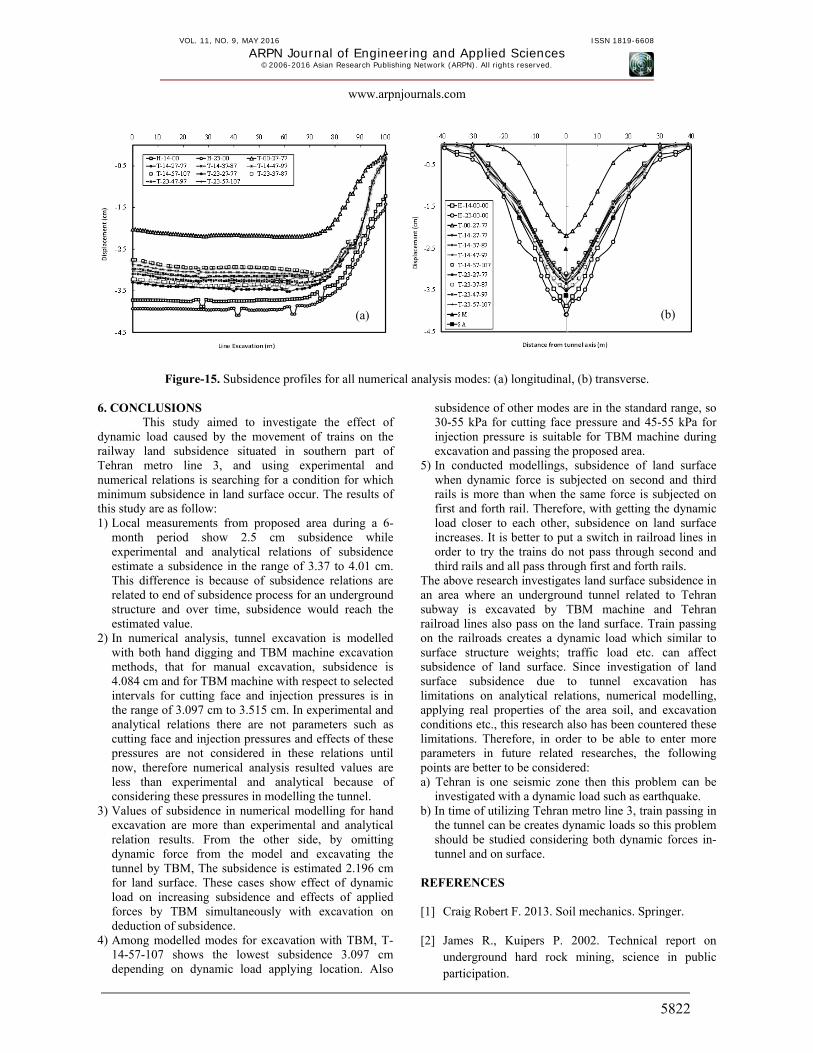
In this section subsidence curves for all analysed modes is plotted in Figure-15. It can be seen in Figures 15 that minimum amount of land surface subsidence with
2.196 cm is related to T-00-27-77 mode and maximum amount of that with 4.084 cm is related to H-14-00-00. Among modes, which their excavation is conducted by TMB machine and dynamic load is applied to the model, minimum amount of subsidence with 3.097 cm occurred in T-14-57-107 mode and maximum amount of that with 3.515 cm was related to T-23-27-77 mode. In each hour during day and night, railroad trains pass on the proposed location in this project and they would not be cancelled or moving and transferring of these rail lines to other locations. In order to select the best tunnel excavation mode for this project, it is necessary to search a mode in which dynamic load is applied to the model. Another considerable point is that subsidence curves show less settlement in excavation with TBM machine in comparison with manual excavations. In addition to considering dynamic force, a mode should be selected that is excavation with TBM machine.
With these explanations, the best condition to
decrease subsidence in above the tunnel would be T-14-57-107 mode. Studying on the output data (amounts of longitudinal and transverse subsidence) there is no significant difference between T-14-57-107 and T-14-47-97, then with considering economic conditions in excavation process (increasing cutting face pressure causes TBM machine depreciation and most of contractors unlike designed criterion tend to work at low pressures), it can be said that best tunnel excavation mode is T-14-47-97.
-4.0
-3.0
-2.0
-1.0
0.00 10 20 30 40 50 60 70 80 90 100
Displacem
ent (cm
)
Line Excavation (m)
T-23-27-77 T-23-37-87
T-23-47-97 T-23-57-107
(a) -4.0
-3.0
-2.0
-1.0
0.0-40 -30 -20 -10 0 10 20 30 40
Displacem
ant (cm
)
Distance from tunnel axis (m)
T-23-27-77 T-23-37-87
T-23-47-97 T-23-57-107
SM SA(b)
VOL. 11, NO. 9, MAY 2016 ISSN 1819-6608
ARPN Journal of Engineering and Applied Sciences ©2006-2016 Asian Research Publishing Network (ARPN). All rights reserved.
www.arpnjournals.com
5822
Figure-15. Subsidence profiles for all numerical analysis modes: (a) longitudinal, (b) transverse.
6. CONCLUSIONS This study aimed to investigate the effect of dynamic load caused by the movement of trains on the railway land subsidence situated in southern part of Tehran metro line 3, and using experimental and numerical relations is searching for a condition for which minimum subsidence in land surface occur. The results of this study are as follow: 1) Local measurements from proposed area during a 6-
month period show 2.5 cm subsidence while experimental and analytical relations of subsidence estimate a subsidence in the range of 3.37 to 4.01 cm. This difference is because of subsidence relations are related to end of subsidence process for an underground structure and over time, subsidence would reach the estimated value.
2) In numerical analysis, tunnel excavation is modelled with both hand digging and TBM machine excavation methods, that for manual excavation, subsidence is 4.084 cm and for TBM machine with respect to selected intervals for cutting face and injection pressures is in the range of 3.097 cm to 3.515 cm. In experimental and analytical relations there are not parameters such as cutting face and injection pressures and effects of these pressures are not considered in these relations until now, therefore numerical analysis resulted values are less than experimental and analytical because of considering these pressures in modelling the tunnel.
3) Values of subsidence in numerical modelling for hand excavation are more than experimental and analytical relation results. From the other side, by omitting dynamic force from the model and excavating the tunnel by TBM, The subsidence is estimated 2.196 cm for land surface. These cases show effect of dynamic load on increasing subsidence and effects of applied forces by TBM simultaneously with excavation on deduction of subsidence.
4) Among modelled modes for excavation with TBM, T-14-57-107 shows the lowest subsidence 3.097 cm depending on dynamic load applying location. Also
subsidence of other modes are in the standard range, so 30-55 kPa for cutting face pressure and 45-55 kPa for injection pressure is suitable for TBM machine during excavation and passing the proposed area.
5) In conducted modellings, subsidence of land surface when dynamic force is subjected on second and third rails is more than when the same force is subjected on first and forth rail. Therefore, with getting the dynamic load closer to each other, subsidence on land surface increases. It is better to put a switch in railroad lines in order to try the trains do not pass through second and third rails and all pass through first and forth rails.
The above research investigates land surface subsidence in an area where an underground tunnel related to Tehran subway is excavated by TBM machine and Tehran railroad lines also pass on the land surface. Train passing on the railroads creates a dynamic load which similar to surface structure weights; traffic load etc. can affect subsidence of land surface. Since investigation of land surface subsidence due to tunnel excavation has limitations on analytical relations, numerical modelling, applying real properties of the area soil, and excavation conditions etc., this research also has been countered these limitations. Therefore, in order to be able to enter more parameters in future related researches, the following points are better to be considered: a) Tehran is one seismic zone then this problem can be
investigated with a dynamic load such as earthquake. b) In time of utilizing Tehran metro line 3, train passing in
the tunnel can be creates dynamic loads so this problem should be studied considering both dynamic forces in-tunnel and on surface.
REFERENCES [1] Craig Robert F. 2013. Soil mechanics. Springer.
[2] James R., Kuipers P. 2002. Technical report on underground hard rock mining, science in public participation.
(a) (b)
VOL. 11, NO. 9, MAY 2016 ISSN 1819-6608
ARPN Journal of Engineering and Applied Sciences ©2006-2016 Asian Research Publishing Network (ARPN). All rights reserved.
www.arpnjournals.com
5823
[3] Leca E. 2007. Settlements induced by tunnelling in soft ground, Tunnelling and Underground Space Technology. 22: 119-149.
[4] Kim S., Tonon F. 2010. Face stability and required support pressure for TBM driven tunnels with ideal face membrane-drained case, Tunnelling and Underground Space Technology. 25: 526-542.
[5] Liu Q., Wang R. 2012. Dynamic response of twin closely-spaced circular tunnels to harmonic plane waves in a full space, Tunnelling and Underground Space Technology. 32: 212-220.
[6] Shirlaw N., Richard D.P., Ramond P., Longchamp P. 2004. Recent experience in automatic tail void grouting with soft ground tunnel boring machines, Proceedings of the 30th Ita-Aites World Tunnel Congress Singapore, 22-27.
[7] Nuhl B., Copur H., Balaci C. 2013. Mechanical Excavation in Mining and Civil Industries, CRC Press.
[8] Itasca consulting group, Inc., 2005, Flac 3D fast Lagrangian analysis of continua in 3 dimensions, User’s manual.
[9] Pellegrini L., Perruzza P. 2009. Sao Paulo Metro Project - Control Of Settlements In Variable Soil Conditions Through EPB Pressure And Bicomponent Backfill Grout, RETC June, 14-17, Las Vegas, Nevada.
[10] Sahel Consulting Engineers. 2014. Report of injection to back of segment in Abuzar channel and Tehran metro line 7.
[11] Franzius J.N., Potts D., Burland, J.B. 2006. The response of surface structures to tunnel construction. Proceedings of the ICE-Geotechnical Engineering. 159(1): 3-17.
[12] Muller, S. 2006. Tunnel induced settlement and
structural force in linings, Doctoral thesis, Stuttgart
University.
VOL. 11, NO. 9, MAY 2016 ISSN 1819-6608
ARPN Journal of Engineering and Applied Sciences ©2006-2016 Asian Research Publishing Network (ARPN). All rights reserved.
www.arpnjournals.com
5824
VOL. 11, NO. 9, MAY 2016 ISSN 1819-6608
ARPN Journal of Engineering and Applied Sciences ©2006-2016 Asian Research Publishing Network (ARPN). All rights reserved.
www.arpnjournals.com
5825